Embed Size (px)
Citation preview

Report No. 1769-GH
Ghana FILEAgricultural Sector Review(In Three Volumes)
Volume III (Annexes VI-XI)
April 12, 1978Western Africa Country Programs I
FOR OFFICIAL USE ONLY
Document of the World Bank
This document has a restricted distribution and may be used by iecipientsonly in the performance of their official duties. Its contents may nototherwise be disclosed without World Bank authorization.
Pub
lic D
iscl
osur
e A
utho
rized
Pub
lic D
iscl
osur
e A
utho
rized
Pub
lic D
iscl
osur
e A
utho
rized
Pub
lic D
iscl
osur
e A
utho
rized

CURRENCY EQUIVALENTS
US$1 = ¢1.15
¢1 = US$0.87
ABBREVIATIONS
ADB Agricultural Development BankCDB Cotton Development BoardCMB Cocoa Marketing BoardCPD Cocoa'Production Division.CRI Crop Research InstituteCRIG Cocoa Research Institute of GhanaCSIR Council for Scientific and Industrial
ResearchFDC Food Distribution CorporationFLO Farm Loan OfficeFPC Food Production CorporationGDB Grains and Legumes Development BoardGFC Ghana Fertilizer CompanyGGADP Ghanaian-German Agricultural Development
ProjectGHA Ghana Highway AuthorityGHOC Ghana Industrial Holding CompanyGNPA Ghana National Procurement AgencyGWC Grains Warehousing CompanyICCO International Cocoa OrganizationMCA Ministry of Cocoa AffairsMOA Ministry of AgricultureNIB National Investment BankRMU Rice Mills UnitSFC State Farms CorporationSRI Soil Research Institute
This report is based on the findings of a mission which visitedGhana in February/March 1977. The mission comprised Messrs. Hendrik T.Koppen, Paul S. Zuckerman, Walter Kock (RMWA), Thakoor Persaud andMrs. Bruna Vitagliano of the Bank and Messrs. Peter Calkin and LawrenceCockcroft (consultants).

?
FOR OFFICIAL USE ONLY
LIST OF ANNEXES
ANNEX VI: AGRICULTURAL CREDIT
'\NNEX VII: PRICE AND SUBSIDY POLICIES
ANNI.X VIII: ROLE OF LARGE-SCALE FARMING
ANNEX IX: MANPOWER AND THE AGRICULTURAL LABOR FORCE
ANNEX X: AGRICULTURAL RESEARCH
ANNEX XI: AGRICULTURAL PROCESSING
This document has a restricted distribution and may be used by recipients only in the performanceof their official duties. Its contents may not otherwise be disclosed without World Bank authorization.

I
I

ANNEX VIPage 1
AGRICULTURAL CREDIT
SUMMARY AND CONCLUSIONS
General
(i) Government's agricultural credit policy pursued so far reflects astrategy which emphasizes mechanization of large farms as a means of increas-ing agricultural production more rapidly, while tending to neglect the smallfarmer sector. As a result, the number of large farms has increased con-sistently in the last years. These farms have contributed little to growthof production, however, due to inefficient operation. To overcome the acutefood shortage the country is currently experiencing, additional output hasmainly to come from small farmers, who account for 80 percent of the nationalproduction of foodcrops.
(ii) Increasing small farmer output requires purchase of improved inputsand adoption of new technologies. Increased flows of production credit willtherefore be needed by the small farmers. It is, however, crucial that creditis integrated with other development services. Credit is only part of a pack-
age of inputs and services necessary to improve farmer productivity. Timelyprovision of inputs such as seeds, fertilizers, availability of storage facil-ities, market outlets, extension services, and a realistic price policy areall important prerequisites to credit operation.
Institutional Coverage
(iii) Agricultural credit is provided in Ghana by the Agricultural Devel-opment B.nk (ADB), the three major commercial banks, and the National In-vestment Bank. Total credit to agriculture outstanding in 1975 amounted to0112,799. Less than 10 percent of the estimated 850,000 farmers in Ghanareceive institutional credit. Around 700,000 farmers have farms of 10 acresor less. Only 20 percent of the available institutional credit goes to them.ADB, which is virtually the only institution currently providing credit to thesmall farmers, has 14 branches and 8 Farmers Loan Offices (FLO) spread aroundthe country to service them. A farmer must sometimes travel up to 100 milesto file a loan application with ADB. Limited outreach in rural areas, inade-quacy of services offered, shortage of trained staff and limited resourcesare the main constraints of the current institutional set-up.
(iv) The local authorities are aware of the need to provide betteraccess to credit for small farmers and are beginning to experiment with newways to tackle the situation (enlargement of ADB's network and streamliningof its operations, rural banks, etc.). While experimentation is welcome,the importance of close coordination between the various institutions con-cerned in planning and implementing the various programs cannot be over-emphasized. It appears, instead, that little coordination exists in theeffort currently undertaken to expand the existing institutional networkand there is a risk of overlapping of activities in the field of credit andinput supply. A clear strategy for the development of agricultural creditthat takes into account the needs, potentials of its beneficiaries, and thelimitations of the available resources in terms of funds, staff, etc., is

ANNEX VIPage 2
an essential prerequisite for the success of any credit policy. Because ofits active involvement in the promotion of credit to agriculture and its
more qualified staff, Bank of Ghana appears to be today the institutionwhich could best perform this task, in coordination with Government depart-ments and credit agencies.
Staff
(v) An expansion of the credit institutions will increase the demandfor qualified and trained staff, thus making more acute the existing short-age in this field. Solving the staff problem is first priority in Ghana.Some arrangements are being made to overcome the problem -- ADB's trainingschool set up at the Tema branch, BOG's training to commercial banks staffenvisaged under the Fondo Scheme -- but there is still need for more train-ing programs. The Bank has provided technical assistance to ADB under sev-eral agricultural projects. Strengthening of ADB regional branches throughthe provision of an experienced loan officer is also included in the UpperRegion Agricultural Development Project and in the preparation report forthe Volta Region Agricultural Development Project. The Bank should intensifyits efforts to strengthen ADB for the following reasons: (a) ADB is the mostimportant source of institutional credit to agriculture in Ghana; (b) theGovernment is fully committed to the concept of an Agricultural DevelopmentBank. This is evident from Government financial support and from ADB's in-volvement in several large development schemes. Loan processing and train-ing of project staff are the areas in which the Bank could provide a valuableassistance to ADB.
Funds
(vi) Limited availability of funds is another constraint to the exten-sion of credit institutions. ADB depends greatly on the capital made avail-able by the Government. Given the present stringent monetary situation, ADBcannot count on substantial increases in the provision of government funds.The Bank might consider establishing a line of credit with ADB for on lendingto farmers. Besides alleviating the institution's financial constraints itwould help strengthen its credit management practices. Before consideringthe provision of an agricultural credit to ADB the Bank would, however, needto make sure that arrears have been reduced to an acceptable level. Therecently established rural banks could play an important role in the mobil-ization of savings and capital formation in the rural areas.
Interest Rate
(vii) Interest rates in agriculture range from 8.5 percent to 12.5 percentaccording to the type of credit (Table 15). 1/ ADB's loans for food andindustrial crops (except sugarcane), as well as livestock and commercial banksloans under the credit guarantee scheme bear a mandatory interest rate of 8.5
1/ 12.5 percent is the ceiling for general lending in Ghana.

ANNEX VIPage 3
percent. Both these types of loans represent the bulk of lending to the
agriculture sector. The low interest rate, originally set to help the smallfarmers, in practice benefits mostly the larger ones who have easier accessto credit facilities and receive larger loans. It also encourages capitalintensive investment. The low interest rate policy contrasts with the higheradministrative cost of lending to small farmers. In addition, repaymentperformance of Ghanaian farmers (large and small) is typically poor and this
adds to the cost of lending.
(viii) The fact that non-institutional money lenders, who still representa substantial source of small farmer financing,are able to charge interestrates as high as 50 percent and in some cases even 100 percent, indicates thatthe borrowers are willing to pay higher interest rates in exchange of promptavailability of credit. Another consideration in favor of the increaseof interest rate is that it represents in any case a small proportion offarm expenditures. There are, however, several problems related to an in-crease of lending rates in agriculture. Lending conditions as a whole arequite unrealistic in the high inflationary situation currently prevailing inGhana (with inflation running higher than 60 percent, on a yearly basis). Acorrection of the interest rate for agriculture alone can have distortingeffects on the economy. The problem for agriculture has, therefore, to besolved in the context of a policy aimed at restructuring total lending condi-tions.

ANNEX VIPage 4
INTRODUCTION
Financial Environment
1. Ghana's Banking System is dominated by the Central Bank (Bank ofGhana) and three major commercial banks -- the state-owned Ghana CommercialBank and two private banks, Barclay's Bank of Ghana and Standard Bank ofGhana. In addition, the following operate in Ghana, some of which openedin the last few years: The National Finance and Merchant Bank, the Bankfor Housing and Reconstruction, the Post Office Savings Bank, the GhanaCooperative Bank, and the Social Security Bank. These banks so far haveoperated on a small scale but they have provided substantial demand depositservices. Non-bank financial institutions include the Agriculture DevelopmentBank (ADB), the National Investment Bank (NIB), the State Insurance Corpora-tion, the First Ghana Building Society and a new institution in the UpperRegion -- Farmers Services Company Ltd. (FSC).
Bank of Ghana (BOG)
2. The BOG acts as a banker to the Government and to the commercialbanks, in addition to its functions as a currency - issuing bank and cus-todian of foreign reserves. It was established in 1957 with an authorizedcapital of ¢2 million, which was later increased to ¢20 million (of which ¢1Omillion is paid up). Its Board of Directors is appointed by the Government.To regulate the volume and distribution of credit extended by the commercialbanks, BOG relies primarily on the following instruments: reserve require-ment, credit guidelines, advance import deposit requirement, and interestrates. Credit guidelines are currently BOG's main instrument for controllingcredit. As an anti-inflationary measure a new set of guidelines was issuedin mid-1975 which provides for a ceiling on credit expansion for most sectorsof the economy. The agriculture and export sectors continue to occupy prior-ity positions and banks were requested to expand credit to these sectorsby 50 percent and 25 percent respectively over the June 1975 level. Inpractice, however, credit development through January 1976 in these twosectors was far below the recommended guidelines. Credit to agriculturedeclined by 3.2 percent and credit to export increased by only 2.6 percent.Credit to other sectors, on the contrary, far exceeded the ceiling set forthem.
3. Interest Rate Structure: Interest rates were last increased inJuly 1975. The ceiling on general lending rose from 10 percent to 12.5percent, while the interest rate on export credit remained unchanged at 9percent. ADB's loans for food and industrial crops (except sugarcane), aswell as livestock to agriculture and commercial banks lending under the creditguarantee scheme (para. 11) bear an interest rate of 8.5 percent. Interestpaid on deposits was raised from 6 percent to 7.5 percent. BOG's discountrate increased from 6 percent to 8 percent.

ANNEX VIPage 5
Agricultural Credit
4. Availability of Institutional Credit -- Institutional credit foragriculture is currently provided by ADB, the three major commercial banksand the National Investment Bank (NIB). Together they provided in 1975about 98 percent of the institutional credit to agriculture (Table 1).Farmers' actual access to credit is still very limited. Less than 10 percentof the estimated 850,000 farmers in Ghana receive institutional credit.Around 80 percent of institutional credit for agriculture goes at present tothe medium and large farmers, while the small farmers (those with farms of 10acres or less) who represent 82 percent of farmers in Ghana and produce thebulk of domestic food still largely depend on non-institutional mdney lenders.The limited access of small farmers to credit is partly due to loan securityrequirements but also to lack of an adequate credit organization geared tothese farmers' needs. ADB provides about 47 percent of the institutionalcredit to agriculture and is today the only institution extending credit tosmall farmers, thrcugh a group lending program (para. 19). Although ADB'sinvolvement in sma.l farmers credit has steadily increased since the programwas introduced in 1969, only about 7 percent of the estimated 700,000 smallfarmers have access to ADB's group lending program. More than 50 percent ofthe Bank's financing goes to larger farmers.
5. Commercial Banks' involvement in agricultural credit is very lim-ited and is directed only to the larger, mostly mechanized farmers. Thesubsidized interest rate of 8.5 percent imposed by the government on mostagricultural lending has, in fact, led the commercial banks to focus theirinvestment in the less risky and more remunerative sectors of industry andtrade. Commercial banks provide about 40 percent of the institutional creditfor agriculture. NIB's contribution to the agricultural development islimited, as it finances only projects with a minimum capital requirement of010,000. NIB's share in total credit to agriculture is around 13.0 percent.Additional credit will be provided to farmers under the Upper Region Agricul-tural project approved by the Bank in June 1976 and become effective on April11, 1977. US$2.2 million will be onlent to ADB for on-lending to farmers andranchers for medium and long-term loans at 12 percent, while a new companyestablished under the project, the Farmers Service Company Ltd, will providefarm input supplies on deferred payment (up to 1 year) at a 12 percent interestrate.
Credit Policy
6. The Five-Year Development Plan for the period 1975/76 - 1979/80acknowledges the fact that most small farmers in Ghana are denied credit andfosters policies aimed at extending to them the services of modern creditinstitutions. However, the government has not as yet elaborated a clearstrategy to develop agricultural credit, encompassing all those concernedin the use and supply of credit. As can be seen from the following descrip-tion, the government is currently taking a fragmentary approach, creatingnew institutions to compensate for the inability of the existing ones to

ANNEX VIPage 6
cope satisfactorily with the situation. To allow credit to reach a largernumber of small farmers, the BOG is now experimenting with a system of ruralbanks, after a Filipino experience (para. 27). Five rural banks have so farbeen opened and seem to have a certain success in mobilizing rural savings.The BOG also plans to set up an Agricultural Trust Fund (FONDO) to providerediscount facilities to banks for loans made to the agricultural sector(para. 13). BOG is furthermore reorganizing the Cooperative Bank which hasresumed its operations in 1974 (para. 26). This institution is also intendedto provide a further credit channel for small farmers.
7. The Government, on its part, is negotiating with USAID a US$30 mil-lion loan (to be disbursed in three different stages) for the MIDAS project(Managed Inputs and Delivery of Agricultural Services). Credit expansion,specifically to small farmers, is one of the project's main components.Funds will be channelled through ADB, which plans to establish in six yearsa total number of 59 new Farm Loan Offices (FLO), in addition to the existing14 branches and 8 FLOs.
8. At this stage, it is difficult to assess the best way to reach alarge number of small farmers; perhaps it would be useful to experiment withdifferent approaches to find out which system best suits the social and eco-nomic conditions of the country and is capable to service, at reasonablecosts, the productive small farmers. Because of its centralized organiza-tion and its limited outreach in rural areas, ADB is better suited for cater-ing to the needs of large farmers. To maintain an adequate service to allfarmers ADB should have branches within their easy reach. Even after fullimplementation of the MIDAS project only around 20 percent of the small farmerswill be serviced by ADB. Ghana has a relatively large network of coopera-tives and a cooperative bank. However, their performance is very poor. Thisis partly due to the serious setback the cooperative movement suffered duringthe Nkrumah period. Cooperatives need to be strengthened and reorganized.Financially, they are too weak to provide an adequate credit channel to smallfarmers. Rural banks which are in Ghana still at the experimental stage,might provide an effective channel for reaching a large number of smallholders.Introduced by BOG in late 1976, rural banks are private commercial institutionswith Government support. Their function is to meet current local creditrequirements using savings mobilized in the rural areas. Rural banks have theadvantage of close contact with farmers and ability to adjust to local require-ments. Direct knowledge of the farmers lessens supervisory need. Defaultrisk is reduced by group responsibility for repayment and equity participation.Five rural banks are currently operating in Ghana. Judging from the experi-ence of the first two opened in 1976, these banks seem quite effective inmobilizing rural savings. If the rural bank experiment proves successful, aclose collaboration of ADB with a rural bank network providing a link with thevillages, might provide an effective way of reaching large numbers of farmers.Rural banks could operate as ADB agents for short and medium term credit.
9. A different approach for the provision of credit to small farmersis used by the Bank under the Upper Region Agricultural Development Project.Here, credit is channelled to the farmers directly by the project through

ANNEX VIPage 7
the Farmers Services Company. This approach was justified by the unsuitabil-ity of the existing local credit agencies of handling credit under the proj-ect. Because it is combined with technical assistance to ADB's branch inBolga,anga, it has the advantage of making project implementation possible,
while improving the operation on an existing institution. This approachcan therefore be effectively used in other agricultural development proj-ects, provided that emphasis be placed on ADB's strengthening.
Bank of Ghana (BOG)
10. The BOG's involvement in agricultural credit has expanded inrecent years. In addition to lending considerable amounts of money in theform of long-term loans to ADB, NIB (in which it also holds equityinvestment portfolio 1/) for their agricultural operations and onlending tofarmers, BOG has participated either jointly or on its own in various agri-cultural projects involving production of food and industrial crops, live-stock, etc. To stimulate flows of additional funds from the local commercialbanks, to the agricultural sector, BOG has introduced a Credit GuaranteeScheme for Small Borrowers and a Special Credit Facility for AgriculturalProduce Marketing.
I1. The Credit Guarantee Scheme was introduced in November 1969 andcovers commercial banks lending to small enterprises. Small enterprisesare defined as: agricultural operations not exceeding 200 acres per crop;manufacturing and servicing enterprises with original investments not ex-ceeding ¢100,000 and trade operations with annual sales volumes not exceed-ing ¢300,000. The guarantee covers 2/3 of the loan. The commercial banksare charged a 1 percent guarantee fee. Commercial bank lending to agriculturehas increased since the implementation of the scheme in late 1969, from 6million to 42 million cedis. The scheme, however, is not very popular withcommercial banks because of BOG's considerable delay in processing recov-ery claims.
12. The Credit Facility for Agricultural Produce Marketing operateson similar lines as the Cocoa Bill Discounting. It provides financing forthe marketing of agricultural commodities, particularly rice and maize, topublic and private agencies which are responsible for the purchase and stor-age of these goods. Since the introduction of the scheme in 1974 untilDecember 31, 1975, BOG had underwritten bills totalling approximately ¢25million. The breakdown is as follows:
1/ BOG holds also equity participation in the Upper Region's FSC.

ANNEX VIPage 8
July 1974 - December 1975(¢ million)
Rice 12.37
Maize 5.53
Other Agri. Produce 7.18
Total 25.18
13. Other measures recently planned by the BOG to stimulate growth inthe agricultural sect are: (a) the setting up of a special fund to assistRegional Development Corporations to meet the cost of preparing feasibilitystudies; (b) the opening of rural banks; (c) the establishment of an Agri-cultural Trust Fund (FONDO). The FONDO scheme, modelled on the Mexicanexperience, is aimed at tapping idle funds from the commercial banks anddirecting them to the agricultural sector. Resources of the FONDO will bemade up of:
(a) Shortfalls under the credit guidelines - Under thecredit control regulations commercial banks arerequired to lend to agriculture an amount equiv-alent to a variable percentage of their depositsregulated by the BOG credit control policy (cur-rently 10 percent). If within a specified period acommercial bank invests in agriculture less than therequired share, the balance will have to be depositedwith the Bank of Ghana, which will pay no intereston this amount;
(b) Mandatory cash contribution (currently 5 percent of bank'sdeposits) - The BOG will pay a small interest rateon this amount.
The resources would be made available to a trust institution to be set upby the BOG to provide rediscount facilities to banks for loans made to theagricultural sector. By providing a combination of credit and technicalassistance to the banks (orientation courses are planned for banks staffin methods of project appraisal and supervisions), BOG hopes that the FONDOwill contribute significantly to growth in the volume of credit to agricul-ture and to its qualitative improvement in terms of better appraisal andsupervision practices. Furthermore, the participation of bank staff in theFONDO training courses will help establish a link of communication and co-operation between the FONDO and the banks, especially at the regional anddistrict level. Partly also because of MOA's deficiencies, BOG is currentlyplaying a major role in agricultural development. It appears to be todaythe best institution to coordinate the various institutions concerned inplanning and implementing the various credit programs and design a strategyfor the development of agricultural credit that takes into account thecountry's needs and resource constraints (in terms of funds, staff, etc.).

ANNEX VIPage 9
Agricultural Development Ba nk (ADB)
14. This Bank is the main channel of credit to agriculture in Ghanaand today virtually the only source of lending to the small farmers. ADBwas founded in August 1965, when it took over the assets of the Bank ofGhana's rural credit department. As of December 31, 1975 ADB's authorizedcapital was 030 million. The paid up capital was 019,9 million, of which014.5 million was subscribed by the Government and 05.4 million by the Bankof Ghana. In addition, the Bank of Ghana has made available to ADB, from1970 to 1976, 048.5 million in the form of long-term lending on concessionaryterms. The ADB is administered by a Board of seven members, representing theMinistries of Finance and Agriculture, the Bank of Ghana and the Departmentof Cooperatives, all named by the Government. The central office is locatedin Accra. In addition, there are 13 branches and 8 Farm Loan Offices (FLOs)located around the country. FLOs don't provide credit. Their services con-sist mostly of assisting the farmers in completing their loan applications,inspecting the farms, preparing field reports, supervising loans and pro-viding technical advice in cooperation with the Ministry of Agriculture'sextension officers. ADB staff on December 31, 1975 totalled 581, out ofwhich 237 were located at the head office in Accra. Although many of theprofessionals have graduated in agriculture, they generally lack adequatepractical experience and, consequently, the technical appraisal of loanapplications has not been entirely satisfactory. Senior staff have beentrained in the USA under the sponsorship of USAID or have received degreeseither in UK, USSR, USA, Germany, or Italy. The World Bank has providedtechnical assistance to ADB under several projects (Sugar I, Upper RegionAgricultural Development and Oil Palm). Under the Sugar Project, consultantswere appointed to review and improve credit management and financial control.Their recommendations (mechanization of loan accounts, establishment of adebt recovery division, and setting up of a training school) were imple-mented in 1974, resulting in increased efficiency of the lending operationand improved loan recovery performance.
Lending Operation
15. ADB's function is to assist in the development of agriculture andagricultural industries by making loans to farmers, cooperative societies,private companies and public bodies. Furthermore, the Bank undertakes largescale agricultural projects, either jointly with other organizations or byitself. Since 1970 ADB has participated in almost twenty such large projectsthroughout the country. ADB has increased more than ten times its lendingactivity in the years 1969-1976. The breakdown of loans by sector is detailedin Table 6. ADB has a variety of lending programs to both the small and thelarge-scale farm sectors. About 58 percent of the amount of loans made in 1976went to larger farmers, agro-industries and special large projects and 33percent to the small farmers under a "group loan" scheme (para. 19). ADB'scentralized organization and locational limitation makes it more suitable forcatering to the needs of large farmers. The recent growth in lending forfarm machinery and the increase in the average size of individual loans madefor food crops and livestock, as indicated in the following tables, reflectthe current trend in favor of large scale farmers supported by Government.

ANNEX VIPage 10
ADB Lending for Farm Machinery
1974 1975 1976-----------(in Cedis)-------
Amount 333,400 2,527,036 2,669,692 1/
% of TotalLending 2.3 12.0 8.3 1/
Average Size of ADB's Individual Loans
1971 1972 1973 1974 1975 1976…-----__-…---- (d 'OOO)…
Food Crops 4.79 5.08 5.74 3.61 6.23 7.23
Livestock 4.46 2.67 4.01 5.08 7.60 10.50
Industrial Crops 16.79 8.84 2.38 2.16 6.46 10.21
Fishing 20.70 19.24 17.70 14.30 15.43 13.48
Agrobusiness 9.38 8.74 5.98 4.z4 4.39 6.76
1/ Unavailability of import licenses for farm machinery and equipmenthas slowed down ADB's lending for mechanization.
16. ADB's financial position has been and still is precarious. Theunsatisfactory repayment performance and the low interest charges in rela-tion to the high level of inflation are to a great extent responsible forthis situation, which so far has been covered by consistent inflows ofequity funds from Government and the Bank of Ghana. Since 1972, Govern-ment and Bank of Ghana contributions to ADB have been mainly in the formsof loans, mostly long-term. Only by consistently improving its recoveryperformance will ADB be able to repay these loans. As shown in the follow-ing table private savings mobilization, although steadily increasing sinceits introduction in 1968, does not represent a sufficient source of fundsfor ADB.
1968 1969 1970 1971 1972 1973 1974 1975…( ------------- ~--- (i million)---------------------
Savings depositsand currentaccounts 0.06 0.19 0.37 0.46 3.10 4.48 7.99 13.62
For 1977 ADB has projected to lend ¢31.2 million. 019 million are expectedto come from loan repayment, ¢10 million from equity subscription and 2.2million from USAID/Ghana Government funds.

ANNEX VI
Page 11
17. 40.8 percent of ADB staff is located at the Accra office. This highconcentration at the headoffice underlines the centralization of lending oper-ations. Only limited autonomy is now given to the branch managers and variesaccordingly to branch performance. The most efficient branches are allowedto grant credit up to ¢5,000 without headoffice approval. A loan applicationmust otherwise be approved on all three organizational levels - the FLO, theBranch Office and the Headoffice - a process which may take well over threemonths. Under the MIDAS project, ADB plans to establish in six years 59 newFLOs. ADB's target is to reach in the ninth year of the program operation118,000 small 'armers in addition Lo the approximately 44,000 currentlyserviced. A little over 20 percent of all small farmers would thus be reachedby ADB. Lending procedures will be streamlined and decentralized. FLOs,under the project, would be authorized to make over-the-counter loans.
18. Terms of loans are based on the type of activity and vary between6 months (for maize, cotton, groundnuts) to 7 years for livestock and up to15 years for tree crops such as palm oil. Credit is secured, except forgroup loans, by land or through mortgages on farm equipment and machinery.The following breakdown of loans by terms of maturity shows a growing emphasison short-term loans (partly due to increased lending to small farmers).
1973 1974 1975
Short-term loans 38.0 40.0 58.2
Medium-term loans 47.0 46.0 28.7
Long-term loans 15.0 14.0 13.1
Total 100.0 100.0 100.0
Interest rates range between 8.5 percent and 12.5 percent (Table 15). PerGovernment degree, ADB food crop, livestock and industrial crop (exceptsugarcane) loans are charged an interest rate of 8.5 percent. The rate was 6percent until August 1975.
19. Group Loans - ADB lends to small farmers under a group loan scheme(also called Commodity Credit Scheme), a special credit program to providecredit to small farmers without collateral. Loans under this scheme aremade for a particular crop on a group basis. Groups are formed with theassistance of MOA's extension officers who help ADB in selecting reliableparticipants using their direct knowledge of the farmer and the nature ofhis operation. Once formed, the group selects a leader and a few executivemembers who will represent them. Credit is provided by either advancing thefarmer cash (to finance labor) or providing a voucher or chits with whichto purchase required items. Experience has shown that group loans, besidesreducing the cost of loan servicing by raising the average size of the loan,insure that credit is properly used. Furthermore, group joint responsibilityfor the repayment of members' loans has an important influence in ensuring

ANNEX VIPage 12
repayment. Loan recovery under the group scheme reaches in fact 80-90 percentof the outstanding loan. In 1975, 43,878 small farmers were reached byADB under the scheme (94 percent of all farmers reached by the institution),they represent an increase of 25 percent over the number of small farmersreached in 1974 (32,951). Each farmer received in 1975 an average loan of0187.5. Loans are seasonal (from the time of land preparation to harvesting).ADB increases gradually each year the acreage financed according to thefarmer's performance, up to a maximum of 15 - 20 acres. Tables 9 and 10provide a breakdown by sector and Regions of the group loans. In spite of thesteady expansion in the group lending program, only a relatively small frac-tion of small farmers is actually benefitting from it. The small farmersreached in 1975 by the scheme represent only 6.6 percent of the total numberof small farmers in the country. Insufficient capital resources, inadequatecoverage of branches serving the rural area, lack of trained staff and cumber-some bureaucratic procedures (most of the loans have to be approved by Accraoffice) limit ADB's servicing of small-scale farmers.
Performance
20. ADB's operational efficiency has not been satisfactory as evidencedby debt recovery. At the end of September 1975, the amount in arrears ofthe loans for which accounts had been mechanized (76 percent of the total) was43.5 percent of the total of these loans. The absolute amount of arrears was012.2 million. Some of the reasons for poor debt collection record are beyondADB's control and stem from the social and legal structure of Ghanaian society.They include the absence of formal land ownership and the consequent impossi-bility of securing loans with land titles. Legislation on debt default iscomplicated and difficult to enforce. But to a large extent the arrearsproblem is attributable to inadequate loan appraisal and supervision on thepart of ADB's project officers. In an environment where borrowers histori-cally have been poor repayers to government financial institutions, ADB'sofficers have to display a special effort in pursuing defaulters. This firm-ness had seldom been forthcoming in the past. The situation has recentlyimproved following the establishment in 1974 of a Loan Recoveries Division.As of December 31, 1976 of total principal due 62.2 percent was repaid (Table11). This reduces the level of arrears to 37.8 percent against 43.5 percentas of September 30, 1975. Of the total amount of arrears almost 50 percentwas more than 1 year overdue (Table 12). Some branches still perform verybadly, the worst results being recorded in Hohoe (Volta Region with a recoveryrate of only 32.4 percent, Wa(Upper Region) with 35.6 percent, and Tema(Greater Accra) with 38.1 percent. Staffed only with three officers, theRecovery Division is very active; legal proceedings have been instituted inmany cases and, as a last resort, the army has been used in certain areas,with some success. The customers are beginning to realize that ADB intendsto use all the means at its disposal to recover the money and a small butsteadily growing number of defaulters are repaying. A limiting factor isstaff. Recovery, as well as legal staff, is currently overloaded and theirnumbers should be increased.
21. Staff quality, especially at the branches, still needs much im-provement. The training program recommended by the consultants Berenschot-Moret-Bosboom has now started and should be of great help to ADB in solving

ANNEX VIPage 13
the staff problem. There is a danger that the present food shortage mightcompel ADB to finance projects which are financially as well as economicallynot viable making it thus very difficult for it to operate as an efficientlending institution in spite of its willingness to do so.
Commercial Banks
22. Commercial banks provide almost 40 percent of the institutionalcredit to agricultural production. In January 1977, loans outstanding toagriculture totalled ¢51.6 million. This amount represents only a modestshare of total commercial bank lending. A breakdown of lending by end-use(Table 3) shows that more than 50 percent of commercial bank credit goes tothe manufacturing and trade sectors and only 10 percent to agriculture,forestry and fishing. However, lending to this sector has increased recently.While total bank lending shows an increase of 19.2 percent in January 1977 ascompared to January 1976, lending to agriculture increased 34.3 percent. Thisrise is a result of BOG's efforts to increase commercial banks' involvement inagriculture, by pre3cribing quotas for lending to the sector and partiallyguaranteeing loans to smaller farmers. In 1975 the three major commercialbanks approved agricultural loans for an estimated amount of ¢33 million.Almost 60 percent of these loans went into food and industrial crops with thebalance taken by cocoa production, logging, poultry, fishing, forestry, etc.Commercial banks finance predominantly large farmers. In the Northern Region,where commercial Lenders are mostly involved as far as agricultural credit isconcerned, 1/ the three major commercial banks lent in 1976 an estimatedamount of ¢12-13 million to about 450 farmers, whose farms have average sizeof about 200-250 acres. These farmers are predominantly involved in ricecultivation. Forty percent of the credit they received in 1976 financed thepurchase of agricultural machinery (tractors, combine harvesters, etc.).
23. Loans to farmers whose farms do not exceed 200 acres in size percrop are covered by the BOG credit guarantee scheme. The interest rate forthe loans under the scheme is 8.5 percent. On all other loans the interestcharged is 12.5 percent. Loans under the credit guarantee scheme representmore than half the commercial banks lending to agriculture. Recovery rates onagricultural loans are currently very low. The three leading commercial bankscomplain that in 1975 and 1976 less than 40 percent of the loans made in theNorthern Regions were repaid. This result is to a large extent attributed tothe drought that considerably reduced the
1/ Ninety percent of Barclay's Bank lending to agriculture in 1976 wentto the Northern Region, which also absorbed more than 50 percent ofStandard Bank's agricultural lending. Ghana Commercial Bank, althoughsubstantially involved in agricultural credit in the Northern Region,lends ample amounts in other Regions to finance livestock and poultryfarming (Volta, Brong Ahafo, Ashanti Regions) as well as forestry andlogging in the Western Region. In the Northern Region the Ghana Commer-cial Bank established its own wholly owned subsidiary, the DevelopmentLeasing Company. This Company provides mechanized services includingland clearing to large farmers.

ANNEX VIPage 14
expected crop yields. In 1974, when the harvest was good, the banks inthe Northern Region obtained recovery rates of 75-80 percent. Out of StandardBank's total bad debt of nearly ¢500,000 for the 1975-76 season, 86 percentwas agricultural. The bank estimated provision for agricultural bad debt for1976/77 in the Northern and Upper Region is close to ¢400,000. Because of therisks and the management costs involved in lending to agriculture and thesmall margin left to the banks due to the concessionary rate of interest fora large part of the agricultural loans (the ceiling on deposits is 7 percent),commercial banks are not eager to engage in agricultural lending programs,in spite of their excess liquidity position (Table 4). No major shift cantherefore be expected in their lending in the coming years.
24. In early 1975 Ghana Commercial Bank (GCB), the largest of the threecommercial banks 1/ introduced a special credit scheme for small farmers(whose farms do not exceed 5 acres in size). To be eligible, farmers haveto become member of the Ghana Commercial Bank Farmers' Association (CFA).Registration takes place through the Ministry of Agriculture extensionoffices. The basis for selecting the farmers is the direct knowledge theextension officer has on the individual farmer's productive capacity. Underthe credit scheme, the country has been divided in 11 zones. Loan applica-tions are examined at each branch by a visiting Area Manager. Loans aremade in small amounts to the individual farmers 2/ and no collateral isrequired. Once granted, the loan is credited to a farmer's CFA depositaccount. Withdrawals from this account are allowed onlv in accordance witha loan disbursement plan. Farmers are charged an interest rate of 10 percent.Loan supervision is performed by the branch staff. In addition to financialassistance, the GCB plans to provide the small farmers with supplies of otherinputs such as seedlings, fertilizers and farm equipment as well as transportand storage facilities. Through its scheme the Bank is planning to reach4,000 farmers in 1977 and 40,000 in the next 2-3 years. Emphasis is cur-rently given to the production of rice, maize, cotton, groundnuts and vege-tables.
National Investment Bank (NIB)
25. NIB, a public development finance company established in 1963 forfinancing and promoting public enterprises in all piroductive sectors, is themain Ghanaian institution for the term financing of industry. NIB's author-ized capital is ¢40.0 million. The paid up capital at December 31, 1976 was¢19 million. By the end of 1977 it is expected to go up to 025 million fol-lowing an additional contribution of ¢5 million from the Government and a
1/ In 1975 its deposits represented 79 percent of total commercial bank'sdeposits. The GCB operates a network of 128 between branches and sub-branches, the largest of any financial institution in Ghana.
2/ Loans are granted on the basis of 0125 per acre with the following break-down: ¢50 for land preparation, ¢5 for planting, 020 for first weeding,020 for second weeding, ¢20 for fertilizers, ¢10 for harvesting.

ANNEX VIPage 15
take up of 01.0 million of share capital by the DEG (Deutsche EntwicklungsGesellschaft) of Germany. In 1976 loans and equity investment amounted toO27 million, distributed as follows:
- Industry 017.2 million (of which 010.7 million in for-eign exchange);
- Agriculture 06.4 million (of which 01.8 million in for-eign exchange);
- Equity 03.4 million.
NIB lending to agriculture has expanded in recent years, partly in responseto the Government desire to expand domestic food production. In 1974 loansto agriculture totalled cedis 3.0 million (20.3 percent of total loans). In1975 and 1976 these loans amounted to cedis 8.1 and 6.4 million respectively(32 percent and 27 percent of total loans). Since 1970 BOG has made availableto NIB long term loans for a total amount of 018.7 million for its own agri-cultural operations and other lending to private farmers. Some agriculturaloperations are also being financed under the Bank first NIB Loan (Loan 1180-GH).Agricultural lending is the responsibility of the Agricultural Project Divi-sion, one of the three divisions of NIB's Development Service Institute (theother two being the Industrial Projects and the Investment Development Divi-sions). NIB's contribution to agriculture is limited to projects wiLh aminimum capital requirement of 010,000. Its financing goes therefore only tolarge-scale farmers in the form of medium and long term loans. Financingcovers land clearing, purchase of machinery and other farm equipment, purchaseof fertilizers, chemicals, processing equipment. Interest rate of agriculturalloans is 10.5 percent. In addition, NIB charges a 1 percent service charge.A commitment fee of 1 percent is due on undrawn balances. NIB has fiveoffices outside Accra, at Tamale, Kumasi, Takarady, Koforidua and Ha. Thearea offices are responsible for the appraisal of loans of less than 050,000,for projects supervision and recovery of arrears. Loan approvals are vir-tually centralized at the headoffice. This procedure causes delays in loanissuing that go from 6 up to 12 months. NIB is highly involved in financinglarge-scale rice farms in the Northern Region. In 1974 loans to that Regionrepresented 62 percent of total NIB lending to agriculture. The rate ofrecovery of agricultural loans is currently very low: 20-25 percent of theloan portfolio. Reasons for this include: poor project appraisals, deficientrecovery procedures, and difficulties experienced by clients (drought, short-age of raw materials and spare parts due to import restriction). Table 13provides a breakdown by sector of NIB's agricultural loeans.
The Cooperative Bank
26. This Bank was originally established in 1946 by the colonial govern-ment when cooperatives (especially cocoa marketing cooperatives) were flour-ishing throughout the country. The Bank provided funds to member societies,enabling them to extend less expensive credit to farmers. The cooperativemovement in Ghana was first promoted by the Department of Agriculture whichencouraged the formation of cooperatives by granting loans for scales and

ANNEX VIPage 16
other equipment. In 1956 the cooperatives came under the responsibility ofthe Department of Cooperatives. In 1961, the cooperative movement suffereda setback as a result of a change in cooperative policies followed by theNkrumah regime and the Cooperative Bank ceased its functions; it reappeared in1974. Since its reopening the Bank has encountered many difficulties becauseof poor management, inadequate funds and very poor repayment performance. 1/At the beginning of 1977 BOG took over the management of the Cooperative Bankwith the aim of correcting this situation. BOG has seconded staff to theBank, will provide training to its staff and will attempt to improve itsadministration, especially its financial management. The Bank's resourcescome from equity participation of the societies (which is very low: in 1976it totalled only 096,000); savings and current account from members, andlong-term loans by the Government. In 1975 the Bank received from the Govern-ment ¢1 million. A 02 million loan has been recently negotiated. The inter-est rate on this loan is 2.5 percent. In 1975 and 1976 the Cooperative Bankprovided loans and advances for a total amount of 02.3 mil lion, mostlyshort-term. Loans are made to groups or individuals who apply through theircooperative. No collateral is required because cooperatives are jointlyresponsible for the repayment of members' loans. Interest rate on all loansis 12.5%. The Cooperative Bank also provides an outlet for societies' fundsand members' savings. In 1976 deposits (demand, time, savings accounts)totalled 06.0 million. In 1975 the amount of deposits was ¢1.4 million. Thenumber of agricultural cooperatives is currently estimated at 1,600. At June1976 loans to the agriculture, forestry and fishing sectors amounted to0708,234 of which 0476,284 were for food crops. Loans to agricultural coopera-tives have so far been given in cash. The Cooperative Bank has 50 branchesthroughout the country and because of its closer contact with small farmers itcould play a significant role in the development of agricultural credit.However, is performance is currently too poor to play a significant impact onthe agricultural scene. The future of the Cooperative Bank is linked to thedevelopment of the cooperative movement.
Rural Banks
27. Rural banks were established by the Bank of Ghana in November 1976.Based on the Filipino experience, rural banks are private banks organizedin rural communities for the purpose of specializing in the extension ofcredit to small farmers and other rural entrepreneurs using savings mobilizedin the rural areas. 2/ At the time of their establishment, the Bank of Ghanaassists rural banks by subscribing in the form of non-voting preferred stocksup to 50 percent of the paid-in capital, with the aim of gradually decreasingits participation. The Bank of Ghana provides free technical assistance, staff
1/ The Cooperative Bank's Manager was unable to provide information onloan recovery rate. He could only state that it is very low.
2/ "A Rural Banking System in Ghana," Bank of Ghana, Accra.

ANNEX VIPage 17
training facilities and funds through rediscounting facilities to guaranteethe liquidity of rural banks. It also supervises their operations. Individ-uals of Ghanaian citizenship or groups of persons, cooperatives and creditunions can establish a rural bank, provided that the subscribers are resi-dents of the community where the Bank is to be established. To this end,an application has to be sent to the Bank of Ghana, which will thereuponundertake an economic appraisal of the locality. No individual can own morethan 35 percent of the voting shares. Rural banks have an initial authorizedcapital of at least 0100,000 of which 50 percent in the form of ordinary sharesof 01 per share, and 50 percent in the form of preferred stocks. They aremanaged by a Board of Directors elected from among the stockholders withvoting power. The resources of the rural banks consist of their own capital,deposits from the public and borrowing from the central bank through re-discounting of notes. Eligible borrowers of rural banks are: (a) farmersowing or cultivating no more than 100 acres; (b) merchants whose capitalinvestment does not exceed 0100,000; (c) rural industries whose investmentin machinery and equipment does not exceed 0100,000; and (d) cooperatives ofsmall farmers, producers of livestock and poultry, fishermen and fishpondowners. The need for collateral is eliminated since, in their borrowing, therural banks rely heavily on their knowledge of local conditions and borrower'sreputation.
28. At the time the mission visited Ghana two rural banks were operating,both located in the central Region: one in Nyakrom started its operationsin November 1976, the second in Birwa, a fishing village, has been operatingsince February 1977. They seem rather effective in mobilizing local savings:the Bank of Nyakrom from November 1976, when it began operation, to February1977 collected 090,000 in savings and 040,000 in deposits; the Birwa Bankin one month of operation collected 070,000 in current and savings accounts.The bank in Nyakrom has already started lending to rice, maize, and sugarcane farmers, with the assistance of a MOA agricultural extension officerseconded to the bank. Credit is given to farmer groups (collectively respon-sible for repayment) in cash, for the time being, but in the future it willbe both in cash and kind (with the Ministry of Agriculture supplying therequired inputs). Loans, which currently average 0200 - 300 per individualfarmer, are seasonal (5-6 months for rice and maize, 11 months for sugarcane). Interest rate is 12 percent. No information was available at the timethat mission took place on repayment performance. Since then three morerural banks were opened: at Worawora (Volta Region), Esiama (Western Re-gion), and Nampong (Eastern Region). Rural bank's managers are mostly BOG'sretired officers. BOG's main objective behind the promotion of rural banksis to encourage that savings mobilized in rural areas are invested in thoseareas, instead of being transferred, as it is currently the case, to urbancenters and the cities for profitable investment in trading and other sec-tors.
29. The Bank of Ghana has not yet set a target for the number of ruralbanks to be established throughout the country in the coming years. Requestsfor the opening of these banks are coming from all regions and a survey iscurrently being undertaken by BOG in order to establish the most suitable

ANNEX VIPage 18
communities. However, BOG is proceeding very carefully with this experi-ment. Furthermore, BOG has no sufficient training and supervision staffto embark in a program of rapid expansion of rural banks. Advantages of arural bank system would be:
(a) easier access to credit and savings for small farmersbecause of their closer contact with them;
(b) simpified procedures as loan administration, super-vision and collection take place at the local level;greater familiarity with local conditions and thecharacteristics of individual farmers can, furthermore,be crucial for reducing administrative costs and delin-quency rate;
(c) use of rural savings for loans could encourage a moreresponsible use of borrowed funds as these come fromindividuals within the same community and not fromgovernment.
On the other hand, rural banks can be financially more vulnerable insti-tutions than development banks. They cannot afford weak recovery procedureswithout undermining their stability.
Farmers Services Company Ltd. (FSC)
30. The Company, established under the Upper Region AgriculturalDevelopment Project, was registered in June 1977. It has an authorizedcapital of ¢12.0 million. Initial shareholders are the Government, BOG,NIB and GCB. With a financial equity of ¢5.0 million, the Government isthe majority shareholder, followed by BOG (03.0 million); NIB and GCB havea financial equity of respectively ¢0.75 million and ¢0.25 million. Farmerswill obtain equity in the Company through a compulsory 2.5 percent mark-upon the C.I.F. store price of the goods purchased which will be credited totheir share accounts. It is intended that farmers should gradually takeover FSC's control. The FSC provides input supplies and mechanical hireservices to the Region's farmers through a network of 90 service centers.It also provides credit facilities by allowing farmers to purchase farminputs and other goods on a deferred payment basis, with a 12 percentmark-up on the price of the purchased good (which can be reduced in caseof early repayments). Farmers associations assist the FSC in identifyingcredit receipients. They are also collectively responsible for repayment.
Small Farmer Credit Channels
31. Various small farmers credit channels are currently being developedin Ghana. In addition to ADB's Commodity Credit Scheme, which started in1968, three more small farmer credit programs have been introduced in recentyears: GCB's Special Credit for Small Farmers (1975), BOG's Rural Bankexperiment (late 1976), and the Farmers Services Company, under the UpperRegion Agricultural Development Project (July 1977).

ANNEX VIPage 19
32. Under the four programs, all farmers have to be member either of acrop association (ADB's scheme) or a farmers' association (under the threeother schemes). With the exception of GCB's scheme, the association is alsoresponsible for the individual farmer's borrowing. This approach has proven tobe the most effective in ensuring loan repayment because of the strong senseof community in most rural areas. Group responsibility also reduces admini-strative costs as the group itself administers, supervises and collects theloan.
33. The Upper Region Project stimulates farmers' associations byproviding special incentives to them (a bulk discount system).
34. With the exception of the rural banks, for which BOG has not yetset a predetermined number for establishment in the coming years, the targetsof all other programs are known:
Institution Farmers Targeted to be Reached By Year
GCB 40,000 1980ADB/MIDAS 118,000 1/ 1986 2/Upper Region Project 125,000 1982-83
1/ In addition to the approx. 44, 000 small farmers currentlyserviced by ADB.
2/ If the USAID loan is signed in 1977.
Under the proposed Volta Region Agricultural Development Project 170,000farmers (most of which are small) should receive credit facilities. Ofcourse, all these credit channels will not be geographically exclusive.Farmers in certain areas will be able to choose among competing channels.However, if all the programs are implemented, by year 1985-86 more than50 percent of the small farmers (as opposed to the current 6.7 percent)will be reached by some form of institutional credit.

CREDIT OUTSTANDING TO AGRICULTURE 1970-1975(END OF YEAR)
(Cedis)
Other Financial
Commercial Banks ADB NIB Institutions a% of % of % of % of Total
Year Amount Total Credit Amount Total Credit Amount Total Credit Amount Total Credit Amount
1970 11,565 6.6 6,160 100 17,725
1971 14,327 5.6 11,031 100 25,358
1972 16,048 6.3 24,276 100 40,324
1973 21,673 7.6 35,881 100 7,534 24.8 2,488 35.7 67,576
1974 37,946 9.6 49,831 100 9,572 21.6 2,178 15.0 99,527
1975 42,244 10.5 53,283 100 15,065 25.0 2,207 16.5 112,799
Source: BOG
H t~
( M

ADVANCES GUARANTEED BY THE BANK OF GHANA TO COMMERCIALBANKS SINCE THE IMPLEMENTATION OF THE CREDIT GUARANTEE
SCHEME IN 1969, BY SECTOR
('000 cedis)
Nov. 1969 -
Sectors Dec. 1970 % 1971 % 1972 % 1973 % 1976 % 1975 %
Agricul-ture 170.4 2.8 254.8 2.3 ¢ 485.8 5.2. 1,353.3 8.2 2,795.2 9.7 4,909.1 11.7
Traiding 4,550.2 74.7 8,511.1 75.6 7,072.5 75.6 11,279.0 7.9 16,348.5 56.6 23,492.6 55.6
Others 1,370.7 22.5 2,493.2 22.1 1,796.8 19.2 3,968.7 23.9 9,743.9 33.7 13,829.2 32.7
TOTAL 6,091.3 100.0 11,259.1 100.0 9,353.1 100.0 16,601.0 100.0 28,887.6 100.0 42,230.9 100.0
SOURCE: Bank of Ghana. August 1976
N3Dlb Fd
(D !2:ti
r H

APPENDIXTable 3
COMMERCIAL BANKS' LCANS AND ADVANCES BY END-USE(IN M.ILLIONS OF CEDIS; END OF PERIOD)
June June June Dec. Jan. Feb. March June Sept. Dec. Jan.Sectors 1973 1974 1975 1976 1976 1976 1976 1976 1976 1976 1977
Agriculture, ForestryFishing 16.6 25.6 40.6 42.2 39.4 36.4 37.9 38.7 45.3 50.2 51.6
Mining, Quarrying 3.5 2.1 4.1 6.0 7.8 8.7 9.2 13.6 18.4 19.4 25.3
Mfanufacturing 80.5 91.7 119.1 101.5 109.5 111.0 110.5 118.8 120.1 128.6 123.7
Construction 27.7 34.2 34.9 44.5 46.2 47.6 47.9 48.3 55.8 58.2 60.1
Electricity, Gas,:.ater 1.5 0.9 1.2 1.5 1.5 1.5 1.4 1.8 1.8 1.8 2.0
Trace 80.7 124.7 112.4 128.1 133.2 138.8 143.1 137.0 149.1 146.5 147.2
Transport, StorageCommunications 17.8 33.2 45.7 42.9 42.4 42.4 42.2 43.1 51.8 50.2 49.6
Services 22.8 29.2 33.1 27.2 29.0 28.6 29.8 30.6 32.9 37.6 35.7
C.:er t1 ~ ~6.5 7.7 8.0 9.2 8.1 8.4 9.3 11.2 14.8 16.6 17.3
Tctals 257.6 349.3 399.1 403.1 417.1 423.4 431.3 443.1 490.0 509.1 512.50f which:
~.Irrde Sector 178.0 219.6 275.2 297.4 308.7 316.0 318.4 329.7 363.3 3.0.5 389.4
F'!"'c Sector 79.6 129.7 123.9 105.7 108.4 107.4 112.9 113.4 126.7 128.6 123.1Excladfns Cocoa'--ar ket fn g
'gricuiture in a
of total 6.4 7.3 10.2 10.5 9.4 8.6 8.8 8.7 9.2 9.9 10.1

ASSETS ANr} LIABILITIES OF COMMERCIAL BANKS
19/ 19/21 19 /3 19/49/5-Dr. !1 [1 m; j D Mardli June Srtpl. Dec.
ASSETS
1. Cash and aklance at the BRank of Glhana 79.0 113.9 1 /1.1 2 14.9 183.7 292.2 313.5 375.3
2. Foreign Currency Assets 0.1 0.1 0.1 0.1 0.1 0.1 0.2 0.2
3. Balance (lue by other Bainiks, 1 2.9 9.1 20 4 19 3 1 0.9 13.0 16.6 12.9
4. Treasury Bills 26.0 6'i 0 42.8 40.8 43.3 43.3 42.8 42.8
5. Commercial Bills 60.7 37.5 56.4 61.4 18.3 26 7 13.0 104.6
6. Loans & Advances 253 4 255.2 283.6 396.8 408.8 399.4 391.5 403 5
7. Securities 27.5 49.4 65.6 7. 88.0 109.2 111.5 111.5
B. RCal Estates 1 9.4 21.0 21.2 23.1 23.9 22.8 23.8 26.3
9. Othier Assets 35.9 147.2 123.4 164.7 156.8 201.1 141.0 158.4
7'0 7 A 1. 514 9 - 699.0 /84.6 1,000.1 993.8 1,101.8 1,053.9 1,235.5
LIABILITIf S
1. Paidi up Capital 24.4 2A.4 32 2 35.0 34.1 35.5 36.2 39.9
2. Balance duLe to other Banks 5.8 15.3 4.1 19.8 14.0 10.8 5.6 8.7
3. Total Deposits: 399.9 414.8 563. 7 704.8 739.1 839.8 802.2 933.5
of which (a) DemanidJ Deposits 246.3 269.7 327.3 39/.1 400.7 48/.3 446.9 555.8
(b) Savings Deposits 89.6 123.0 158.5 194.3 212.7 230.4 237.9 263.6
(c) Time Deposits 64.( 62.1 77.9 113.4 125.7 122.0 117.4 114.1
4. Other Liabilities 84.9 16 0.3 184.6 240.5 206.5 221.7 209.9 253.4
_____. .__ ___I_ __ _ .. _.I- t71() 1 .4 1 5149 699.0 1B4.6 1,000.1 993.8 1,107.8 1,053.9 1,235.5
Source: &3nk of Ghana Qtia7rterly EcCnomic 3tillerin

AGRICULTURAL D)EVELOPMENT BANK
Balance Sheet(e '000)
ASSETS 1970 1971 1972 1973 1974 1975
Cash at bank and on hand 763.8 978.1 2,033.6 2,943.3 6,367.2 8,509.6Short term investment 1,321.5 4,765.7 8,038.4 4,832.1 1,857.5 4,000.0Loans and advances 5,888.3 10,650.9 23,662.3 37,507.0 52,837.8 59,302.7
(a) Private Sector 5,514.9 9,307.8 n.a. 21,126.6 26,921.6 41,475.8(b) Public Sector 373.4 1,343.1 n.a. 16,380.4 25,916.2 17,826.9
Other accounts 364.6 384.7 658.1 1,628.7 1,453.8 1,372.9Medium and long-term investments 5,282.0 922.0 652.0 990,0 3,628.5 4,017.4
Fixed assets (net of depreciation) 125.6 144.0 265.3 534.8 842.8 910.6Customers' liability on guarantees 9,129.1 9,154.8 7,393.0 25.0 69.5 231.8
Total Assets 22,874.9 27,000.2 42,702.7 48,460.9 67,057.1 78,345.0
LIABILITIES
Paid in capital 10,554.0 13,254.0 18,451.0 19,151.0 19,951.0 19,951.0General reserve fund 37.3 48.6 64.0 78.5 91.6 102,2Deposit and other accounts 3,154.5 4,542.8 16,794.6 29,206.4 46,945.0 58,060.0Liability on guarantees 9,129.1 9,154.8 7,393.1 25.0 69.5 231.8
Total Liabilities 22,874.9 27,000.2 42,702.7 48,460.9 67,057.1 78,345.0
Source: ADB Annual Reports |r

ADB: TOTAL LOANS TO AGRICULTURE APPROVED 1971-1976AND 1977 PROJECTIONS, BY SECTOR
Sector.s .====1971 1972 1973 1974 1975 1976 1977Amount No. Amount No. Amount No. Amount No. Amount No. Amount No. -Amount
Food Crops 1,351.0 282 2,591.8 510 2,999.0 522 1,876.8 519 4,475.7 712 6,410.3 886 4,251.0Livestock 558.1 125 502.3 188 577.3 144 584.2 115 828.0 109 1,488.5 142 2,055.0Industrial Crops 4,030.5 240 1,945.6 220 1,317.1 442 1,611.4 746 1,763.2 273 2,715.6 266 3,923.0Fishing 455.5 22 1,039.2 54 1,168.4 66 671.9 47 1,080.3 70 1,119.0 83 1,285.0Agrobusiness 703.8 75 1,197.5 137 1,352.1 226 1,272.3 300 1,272.8 255 3,449.6 510 2,612.0Cocoa Rehabilitation - - 606.7 3 1,191.9 7 1,104.5 1 1,468.5 1 1,965.7 1 -
Pineapple Project - - 312.0 50 _ _ - - - - -
9pecial Projects _ - 4,299.8 9 765.0 5 1,301.4 6 1,952.5 4 4,440.8 11 5,549.0"Groups" Scheme 1,523.5 8* 1,715.8 285 3,890.5 507 6,138.5 288 8,228.7 992 10,653.6 1208 11,325.0Corporations/O0Y Loans * _ _ 14,570.0 4 4,250.0 2 100.0 1 - - - - _TOTAL 8,622.4 752 28,.468.7 1310 17,823.4 1921 14,661.1 1504 21,069.7 2416 32,242.5 3107 31,000.0
1971=100 100 100 330 174 207 255 170 200 244 321 374 413 359
* 382 groups involved under the maize scheme, but each branch wasconsidered as one echeme.
** OFY = Operation Feed Yourselves

ADB: TOTAL AGRICULTURAL LOANS APPROVED 1970-1975, BY SIZE
(Cedis)
1970 1971 1972 1973 1974 1975Loan Size No. Amount No. Amount No. Amount No. Amount No. Amount No. Amount
Up to 500 20 6,52-. 49 16,033 158 48,480 347X x 173,743 108 38,570 121 62,252
501-1,000 22 17,574 102 77,897 141 94,719 117 107,660 511 350,933 152 134,135
1,001 - 2,000 108 186,683 155 244,128 154 220,084 343 561,831 363 687,458 274 474,590
2,001 - 3,000 - - - - 194 494,806 322 852,100 250 645,658 341 773,488
3,001 - 4,000 _ _ _ - 118 428,348 191 700,000 157 607,595 180 682,384
4,001 - 5,000 3 1X 117,872X 1 52 X 475,059 144 655,485 233 1,076,522 303 1,409,402 204 865,723
5,001 - 10,000 63 517,913 127 945,187 202 1,364,184 220 1,623,160 145 1,071,790 603 3,987,585
10,001 - 20,000 73 1,039,510 113 1,479,309 144 1,965,791 131 2,800,589 115 1,602,582 330 4,282,476
20,001 - 30,000 27 665,240 27 613,420 26 542,422 23 572,650 36 880,502 147 2,256,016
30,001 - 40,000 12 414,410 7 240,001 15 550,220 9 336,277 11 375,798 27 935,152
40,001 - 50,000 4 174,500 10 853,729 4 169,893 3 137,870 5 224,370 11 484,212
-50,0001 and above 8 1,389,499 10 3,677,6781 35 5,364,281 32 8,880,879 19 6,766,464 26 6,131,810
TOTAL 368 4,529,725 752 8,622,441 1,335x 11,898,713 1,971 17,823,281 2,023 14,661,122 2,416 21,069,824
x = Loan size 2,001-5,000xx = Excludes a loan of J16,570,000 approved for the State Corporations
xxxx = Mainly for cotton farmers in the Northern Region.
Source: ADB Annual Reports.
(D4
ADB: TOTAL LOANS APPROVED 1970-1975, BY REGIONS
…__________________________________________________(¢0 o o )…--------------------------------------------------------- --- _
Regions 1970 1971 1972 1973 1974 1975No. Amount No. Amount No. Amount No. Amount No.. Amount No. Amount Z
Ashantl 76 456,860 201 969,342 277 1,081,650 281 2,125,469 195 2,580.960 327 2,759,422 13.1Eastern 32 103,443 103 476,157 122 430,920 108 737,920 281 1,874,169 251 1,283,218 6.1Volta 29 433,230 40 138,627 128 581,824 222 975,565 69 805,884 30 250,620 1.2Brong Alhafo - - - - 190 803,822 273 1,425,383 372 2,545,450 471 4,893,863 23.2Western _ - _ 21 95,980 166 779,700 119 536,695 85 555,225 2.6Nortlhern 106 873,742 164 1,050,793 274 1,922,410 480 1,865,474 606 1,129,300 626 3,535,454 16.8Upper - - - _ 70 516,664 159 915,005 113 639,105 137 1,122,988 5.3Central - - - - - - 130 1,306,074 176 1,635,633 361 1,797,809 8.6Creater Accra 125 2,662,450 244 5,987,522 258 23,035,443 152 7,692,691 92 3,413,926 128 4,872,225 23.1
TOTAL 368 4,529,725 752 8,622,441 1340 28,468,713 1971 17,823,281 2023 14,661,122 2416 21,069,824 100.0
19-nO = ]100 100 100 204 190 364 628 535 393 550 324 656 465
* Includes loans totalling ¢14,570,000 for State Corporations and OFY program.
Source: ADB Annual Reports.
Fl e
(D ZwziCo H

ADB: SMALL FARMERS' GROUP LOANS APPROVED 1969-1976AND 1977 PROJECTIONS, BY SECTOR
(in Cedis)
Years Maize Yam Rice Cassav Cotton Shallo Ground Tomatoe Ginger Mixed Fiber TotalNuts Crops
1969 230,000 _ _ - _ _ _ _ _ _ _ 230,000
1970 373,350 - _ 45,000 _ _ _ _ _ _ - 418,350
1971 1,249,375 240,596 - 33,520 _- - - - - 1,523,4911972 939,642 630,700 31,500 47,360 21,780 9,990 - - 34,875 - - 1,715,847
1973 1,617,084 1,332,568 498,170 135,270 36,692 30,823 7,100 1,325 229,900 - 1,635 3,890,5671974 3,085,244 2,048,943 - 20,020 209,145 15,300 - 9,222 662,244 - - 6,05Q,118
1975 4,683,474 2,578,490 241,405 251,516 300,000 21,200 110,790 - - 41,820 - 8,228,6951976 4,535,614 3,909,786 435,395 147,625 800,000 118,450 476,680 20,000 64,030 145,060 - 10,653,6401977** 5,033,000 4,590,000 450,000 284,000 - * 220,000 440,000 100,000 120,000 88,000 - 11,325,000
TOTAL 21,746,743 15,331,083 1,656,470 964,311 1,367,617 415,763 1,034,570 130,547 ,112,04' 274,880 1,635 44,035,680
% 49.4 34.8 3.8 2.2 3.1 0.9 2.3 0.3 2.5 0.6 100.0
* Since 1976 funds are given to the Cotton Development Board for on lending to cotton farmers.
** 1977 ADB's projections.
Source: ADB's Annual Reports.
wzt?

ADB: SMALL FARMERS' GROUP LOANS APPROVED 1971-1976AND 1977 PROJECTIONS, BY REGIONS
.~~~~~~~~~~~~~
1971 1972 1973 1974 1975 1976 1977
Ashanti 530,315 493,050 1,432,575 1,884,500 1,890,822 2,789,999 2,563,000
Eastern 199,355 7,860 400,000 908,232 539,905 217,529 500,000
Volta 59,347 323,003 552,265 99,044 131,260 258,070 220,000
Brong Ahafo - 564,773 1,272,753 2,069,471 4,581,443 5,148,542 6,120,000
Western - - - 1,155 9,425 20,000 60,000
Northern - - 3,240 - 154,930 959,500 580,000
Upper - - - - - 75,000 175,000
Central - - 189,734 1,087,716 920,910 1,185,000 1,107,000
Greater Accra 734,474 327,161 40,000 - ** - ** - ** **
TOTAL 1,523,491 1,715,847 3,890,567 6,050,118 8,228,695 10,653,640 11,325,000
Source: ADB Annual Reports
* - ADB's projections
** - Following the opening of new branches no more small farmers loans wereprocessed by the head office.
I-. tI
cr Fd
o H

APPENDIXTable ll
ADB: RECOVERY RATE OF PRINCIPAL DUEAS OF DECEMBER 31, 1976
Principal Principal RecoveryBranch Due Repaid Rate
¢ ¢
Accra 9,883,068 4,845,262 49.0
Swedru 1,565,523 1,182,179 75.5
Koforidua 959,381 427,094 44.5
Hohoe 992,508 321,120 32.3
Tema 2,103,680 802.280 38.1
Somanya 3,821,800 1,768,872 46.3
Cape Coast 2,261,531 1,153,214 51.0
Takoradi 1,597,848 691,428 43.3
Kumasi 9,330,727 * 7,066,306 75.7
Sunyani 14,486,737 * 11,028,376 76.0
Bonla 1,920,633 * 1,077,033 56.0
Atebubu 1,609,341 * 1,307,703 81.3
Wa 283,184 * 100,761 35.6
Kwahu Tafo 349,939 * 32,325 9.2 **
Total: 51,165,900 31,803,953 62.2
* Branche A/c not mechanizedEstimated from Loans Outstanding
** Branch Office opened in latter part of the year. LoansOutstanding transferred from old Branch Office (Koforidua)to the new Office. This showed the least recovery rate.
Source: ADB

APPENDIXTable 12
ADB: ARREARS POSITIONAS OF DECEMBER 31, 1976
3 Months 6 Months 1 YearBranch Overdue Overdue Overdue Total
Accra 27,591 374,765 1,308,944 1,711,299
Swedru - 45,535 89,257 131,792
Takoradi 39,935 62,610 220,840 323,384
Hohoe - 27,910 552,653 580,563
Somanya 28,674 91,318 1,748,013 1,868,005
Tema 55,105 8,875 546,983 610,963
Cape Coast 177,977 119,924 215,140 513,041
Koforidua 31,080 11,126 522,238 564,444
Kumasi 51,477 102,954 720,675 875,105
Sunyani 90,723 181,445 1,270,118 1,542,287
Tamale 99,085 198,170 1,387,188 1,684,443
Bolga 33,291 66,582 466,074 565,947
Atebubu 20,921 41,843 292,900 355,664
Wa 9,203 18,407 128,848 156,459
Kwahu Tafo 7,582 -15,164 106,148 128,894
Total 672,644 1,366,628 9,576,018 11,612,290
Source: ADB

APPENDIXTable 13
NIB LOANS TO AGRICULTURE ANDAGROBASED INDUSTRIES
1974 1975 1976----- …-----(cedis)-----------
Agriculture
Livestock 135,550 239,780 63,080
Poultry - 88,966 30,000
Foodcrcps 714,730 1,688,229 1,730,043
Industrial rawmaterials 2,126,377 5,629,900 972,176
Fishing - - 2,422,570
Agricultural services - 89,390 1,139,420
Other agriculture - 370,440 -
Total 2,976,657 8,106,705 6,357,289
AgrobasedIndustries 3,24,0775 1,199 363 802,370
NIB Equity Partici-pation-Agriculture- 180,000 262,810 250,000
AgrobasedIndustries 477.530 287,230 -
Total 657,530 550,040 250,000
Total financialassistance to theagricultural 6,874_962 9,856,108 7,409,659sector
Source: NIB
APPENDIXTableT14
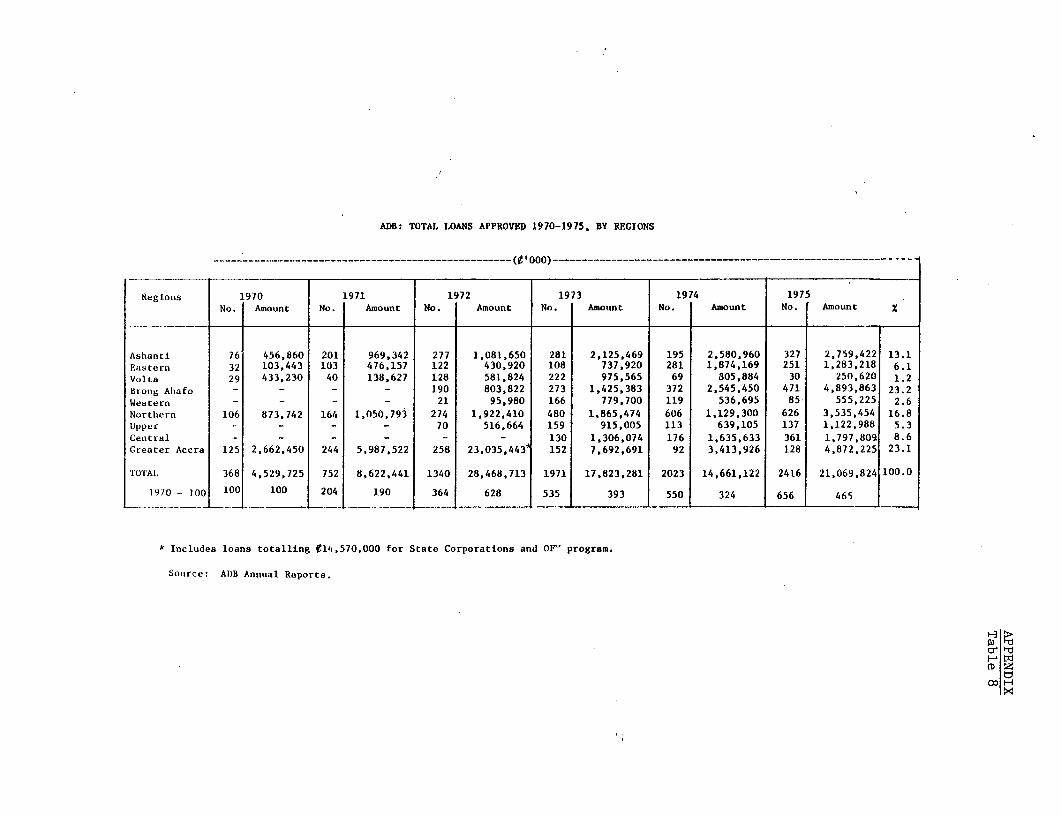
AGRICULTURAL CREDIT
Farm Size Type of Credit Source of Finance
A. Large and Medium Long-term development ADB, NIBScale Farms
Medium-term develop-ment ADB, NIB, Commer-
cial Banks
Working capital andseasonal inputs Commercial Banks,
Cooperative Bank,ADB
B. Small Scale Farms Seasonal credit ADB, Cooperative Bank,
Commercial Banks, 1-Rural Banks, FarmersService Company
1/ Ghana Commercial Bank's special credit scheme for small farmers.

APPENDIXTable 15
INTEREST RATES ON AGRICULTURAL CREDIT - MARCH 1977
Lending Institutions Lending Terms Interest Rate
Commercial banks Mostly short and 8.5 - 12.5%!'medium
Ghana Commercial Bank'sSpecial Credit Scheme for
small farmers seasonal 10%
Agriculture Development Short, mediumBank (ADB) and long
Agriculture (food andindustrial crops) 8.5%
Sugar 9.0%Agro-business 10 - 12.5%Fishing 8.5 - 9%Livestock 8.5%
National InvestmentBank (NIB) Medium and long 10.5%
Cooperatives Seasonal 12%Medium 12%
Rural Banks Seasonal 12.5%
Farmers Service Co. Seasonal 12%
1/ Same for short and medium, 8.5% interest rate on loans underthe credit guarantee scheme.

ANNEX VIIPage 1
PRICE AN'D SUBSIDY POLICIES
l. Successive governmen-s have set producer and retail prices, andsubsidized interest rates and inputs, to encourage agricultural production,to keep down food prices, in particular for the increasing urban population:,
or, in the case of cocoa, to raise fiscal revenue. Such nolicies have hadlimited effect, Retail prices have continued to rise rapidly, with theurban food index rising by 38 percent per annum 1970-1975, and more sharply
latterly (150 percent in 1976). Cocoa production is declining, largelybecause the price which the goverrment agency (CMB) pays for cocoa has beenheld down in real terms and consequently has successively reduced the attrac-tiveness of cocoa to the farmer. Subsidization of inputs has, in the absenceof an efficient distribution system, benefited larger and richer farmers withaccess tc Ministry officials, and there is little evidence that it has encour-aged smaller farmers, facing a riskier outlook, to adopt new technologies.Subsidized credit has also primarily benefited the larger farmer who hasgreater creditworthiness and ability to deal with official and commercialinstitutions. Further, the high level of subsidization has increased corrup-tion and contributed to the smuggling of inputs and produce across nationalboundaries. Except for cotton and bast fibres, where the Cotton DevelopmentBoard (CDB) and the Bast Fibres Development Board respectively are the solepurchasers, Government's intervention in the primary commodities market haslargely been ineffective, among other reasons because of lack of marketcoverage.
2. Cotton production was encouraged by the relatively high producerprice offered by CDB, which was increased in 1974 from ¢0.lO to ¢0.35 per lbseed cotton. It has been suggested that cotton expanded initially in certainareas at the expense of foodcrops, particularly yam, but this is difficultto substantiate. It is more likely that, where a proper rotation is used,cereals following cotton will benefit from the carry-over effect of the fer-tilizer applied to the cotton, and cereal production will increase.
Maximum Retail Consumer Prices
3. While efforts to dampen retail price rises help to lessen thedirect impact of inflation on the urban consumer, they tend to increase gov-ernment's budgetary deficit, distort demand levels and substitution betweendifferent commodities, encourage black marketing, and create expectationsthat cannot in the long run be satisfied. Where maximum price levels areset for commodities domestically produced, such as rice, and processingagencies are restricted or forced to sell at a financial loss, such pricesshould be recognized as support prices and the processing unit concernedshould receive a compensating subvention to allow it to operate on a finan-cially viable basis to encourage proper financial management. This is notthe case for the Rice Mills Unit which is forced to operate at a loss (seeAnnex XI). In most markets, but particularly those for oils, maize, beef,mutton and goat meat, official maximum prices are not effective in the faceof strong demand, shortages of supply and government's inability to eitherpolice markets or provide the necessary supplies from hold-over stocks tosatisfy demand.

ANNEX VIIPage 2
Interest Rates
4. In view of the high level of internal inflation (in excess of 60percent per annum) agricultural credit at 8.5 percent is very cheap and ratesshould be increased substantially if the present level of lending is to bemaintained as well as brought into line with lending rates to other sectors ofthe economy.
Minimum Producer Prices
5. During the 1976 season Government attempted to offer a minimumprice for cocoa, maize, rice, groundnuts, soyabeans, yam, sugar cane, plan-tain, cotton and kenaf, to guarantee producers a positive return to theirinvestment and to hold down retail prices. Apart from cocoa, cotton andkenaf where the respective government agency is the only buyer, governmentintervention, through the Food Distribution Corporation, was ineffectivein the other commodity markets. In the face of high and rising market pricesreturns to producers exceeded the minimum prices set, and government interven-tion was not required. However, apparently in an effort to halt the unpre-cedented maize price increases, Government entered the market, revising itsintervention price sharply upwards with the intention of reselling on theretail market. This temporarily exerted further upward pressure on prices.It is clear that government policy was not well formulated and that marketintelligence was poor.
6. Until there is adequate government or privately owned storagecapacity and Government has sufficient financial resources, there can beno long-term buffer stock of primary commodities, nor can Government holdshort-term stocks to even out seasonal fluctuations. When adequate financeand storage capacity does exist a far more sophisticated market intelligencesystem will be required to allow Government to operate in the market knowl-edgably (see proposals in Annex V), preferably without a minimum price schemewhich limits the flexibility of the intervening agency. Until such time Gov-ernment should limit its intervention to the cocoa, kenaf and cotton markets.
7. The minimum price at which the Rice Mills Unit is empowered to pur-chase rice is also the maximum price. During 1976, while prices rose drama-tically, the unit was not authorized to alter its maximum price, and wastherefore unable to buy sufficient rice for its needs. In order to protectits investment in milling capacity, the Rice Mills Unit should be allowed tocompete in the market, acting in a rational and financially prudent manner,using its storage capacity to buy cheaply at times of surplus. It should notbe constrained by a fixed price stipulation.
8. The present price of seed cotton was increased in 1974 to ¢.77/kg,from ¢.25/kg, an increase that made cotton more attractive than competingcrops as evidenced by the very considerable increase in area and productionsince 1974 (see Annex I). However, dramatic increases in the price of com-peting crops since 1974 have led to a decline in the relative attractivenessof cotton, on average by a factor of four:-

ANNEX VIIPage 3
Table 1: COTTON PRICE RATIOS WITH COMPETING CROPS (PER TON)
1974 1975 1976 1977 1/
Cotton: maize 3.9 3.1 1.5 .8Cotton: yam 4.1 2.9 2.1 .9Cotton: millet 2.8 2.7 1.2 .6
Source: Mrinistry of Agriculture.
1/ March 1.977 wholesale price.
9. The farm gate price for seed cotton is marginally higher than theimport substitution price calculated at the official rate of exchange, andconsiderably less (up to 60 percent) than that calculated at more realisticexchange rates.
Table 2: IMPORT SUBSTITUTION PRICE FOR COTTON
Official Price Import Substitution Prices
US$1 - ¢1.15 US$1 - 01.73 US$1 - 031977 1980 1977 1980 1977 1980
M/kg .77 .77 .66 1.13 1.05 1.97 1.81
10. A comparison of the Ghanaian producer price with that of her neigh-bors reveals that at the official rate of exchange their producers receivebetween 24 percent and 46 percent of the Ghanaian price. At an exchange rateof V3 to the dollar the Ivorian cotton farmer receives more than his Ghanaiancounterpart, as follows:-
Table 3: COTTON SEED PRICES
Comparison with Ghanaian Price 1/
Official Price US$1 - ¢1.15 US$1 - 03 US$1 - ¢5
Upper Volta CFA 38.6/kg 24% 61% 102%Togo CFA 52/kg 32% 83% 138%Ivory Coast CFA 75/kg 46% 119% 198%
1/ CFA 100 - ¢.4694.
11. Clearly the cotton price is no longer as attractive as it was whenfirst introduced in 1974. In comparison with competing crops and costs ofimportation at a realistic exchange rate, there is scope for raising the

ANNEX VIIPage 4
current price. However, hazards of setting a minimum producer price for acommodity, so that production patterns are not unduly disturbed while produc-tion of the relevant commodity increases at a reasonable rate, are manifest.There can be no substitute for good farm level and market intelligence topredict farmer behavior. Bearing in mind the cost at which cotton couldbe imported, the need to retain farmers' interest in cotton production, aswell as protecting government's investment in ginning capacity, it is recom-mended that as subsidies are removed on cotton inputs (see below), theproducer price of seed cotton is adjusted upwards marginally (by a maximum of
perhaps 10 percent per year in current terms). The intelligence systemshould indicate whether this is sufficient to retain a reasonable growth incotton production.
12. Cocoa Pricing. Farmers' interest in cocoa continues to declinewith no improvement in the availability of insecticides and the decliningprofitability of cocoa relative to alternative crops. The sector as a wholesuffers from the changes taking place in the availability of labor (see AnnexIX), with caretakers and hired labor difficult to obtain, and sons of cocoafarmers less willing to take on cocoa farming than were their forebears. Fol-lowing independence Ghana has modernized, on a superficial plane, at a fastrate. Cocoa, in its hey-day, was virtually the only means for the progressiveentrepreneur farmer to obtain a cash income. This is no longer so, and cocoafarmers no longer feel that Government has the same commitment to the cocoasector or gives it the same prominence. This has a demoralizing effect andhas resulted in cocoa losing much of its 'mysticism.' It consequently hasto be treated as any other sector when setting an economic incentive levelfor a participating farmer.
13. Cocoa exports account for about 60 percent of Ghanaian foreignexchange earnings, and the levy on cocoa provides almost one-third of Govern-ment fiscal revenues. The optimum producer price is that price which makescocoa marginally more attractive to the farmer than alternative crops, suchas plantain and cassava, and which provides Government with as large a levyas possible. However, the primary consideration in setting a producer pricemust be to ensure cocoa's attractiveness to the farmer so that he continuesto cultivate it. At present, it is manifestly evident that cocoa productionis no longer a financially attractive occupation for farmers and that thepresent price of 040 per load of 30 kg. has to be revised. The FAG CountryPerspective Study suggests an upward revision of the producer price; otherexperts knowledgeable of the Ghanaian cocoa farmers' behavior suggest that aproducer price in the range 035 - 040 per head load is now needed to rekindlefarmers' interest. 1/
1/ Equivalent to 039 to 044 per 30 kg. These estimates are based on thesituation in early 1977.

ANNEX VIIPage 5
14. The development of cocoa since the beginning of the century hasbeen relatively well documented and provides a basis for comparing the attrac-tiveness of the producer price in the present poor situation, with the situa-tion when falmers were attracted into cocoa and were actively planting largeacreages. The last such period was 1945-1959, with the early 1950s the periodof most intensive planting. Since this period the cocoa producer price hasrisen by 250 percent in current terms while the price of other commodities hasskyrocketed. Historical producer prices in current terms are given belowtogether with prices for the more common alternative crops to cocoa.
Table 4: TRENDS IN PRODUCER PRICES OF COCOA AND COMPETITIVE CROPS
Cocoa¢/head Load Maize Cassava Plantain(60 lbs.) ¢/220 lbs.- 0/200 lbs.- 0/bunch -
1950/5i-59/60 7.2 - - -1960/61-64/65 5.4 8.6 (63/64) 2.5 (63/64) 0.41965/66-69/70 7.0 8.3 3.7 0.51970/71-71/72 8.0 14.6 4.5 0.8
1972/73 9.2 18.4 6.0 1.11973/74 10.5/12.00 20.0 7.2 1.11974/75 15.0 24.9 11.0 1.51975/76 16.0 53.1 20.7 2.81976/77 20.0 2/ 99.0 2/ 65.0 2/ 5.0 2/
% increase60/65-75/76 200% 520% 730% 600%60/65-76/77 270% 1050% 2500% 1150%
1/ National average wholesale commodity price.
2/ March 31, 1977 price. The price was raised to ¢ 30 per kg in May, 1977, andfurther to ¢ 40 in October, 1977.
These price series indicate that the competitiveness of cocoa relative toother crops the traditional cocoa farmer can plant on his farm, has declinedby a factor of between 3 and 9 since the last period of extensive cocoa plant-ing. Such figures bear out the experience of the Bank financed cocoa replant-ing projects, particularly with respect to the relative attractiveness ofcassava in the Ashanti Region. Many farmers now insist on intercroppingyoung cocoa seedlings with cassava which is extremely detrimental to thegrowth of the young cocoa seedlings.
15. Equally, the producer price of cocoa has declined dramatically inreal terms. Estimates in early 1975 were that the real price of cocoa tothe farmer in the first half of the 1970s was, on average, three quartersof the 1960s level and only one-third of the 1950s level. The rural consumerprice index increased by 623 percent between 1963 and 1976. To compensate forthis level of inflation the producer price of cocoa would have had to haveincreased from ¢5.4 paid for the head load in 1963 to ¢33.6 in 1976. In fact,the producer price was an average ¢18.0 in 1976, 54 percent of what it shouldhave been to have maintained its real value.

ANNEX VIIPage 6
16. The Ghanaian price, even at the official rate of exchange, is lessthan the price paid in Ivory Coast and Nigeria, its two main competitors. 1/At the black market rate of ¢5 to the dollar, the Nigerian price is 550 percenthigher and the Ivorian price 400 percent higher, as follows:-
Table 5: COCOA PRODUCER PRICES IN NEIGHBORING COUNTRIES
Comparison with Ghanaian PriceOfficial Price US$1 = ¢1.15 _3 ¢_
Ivory Coast CFA 175/kg 112% 294% 489%
Togo CFA 120/kg 77% 201% 335%
Nigeria $ 0.66/kg 2/ 160% 417% 695%
17. It is clear therefore that relative to both the consumer price indexand prices of competitive crops the producer price for cocoa compares poorlywith its level in the last period of major planting. If a strategy is adoptedto halt the decline of and even increase cocoa production it is recommendedthat the producer price be increased to a level of around 050 per 30 kg (¢45.5per 60 lbs). At the same time subsidies on inputs should be removed (seebelow), their availability increased, and an effective extension serviceintroduced.
18. The effect of increasing the price and removing subsidies shouldbe reviewed with its implications for the budget and the balance of paymentswithin the context of the Government's undertaking under Loan 1181-GH toreview the cocoa producer price policy and undertake necessary studies.Such a price revision should lead to both a short term increase in supply, asit becomes more profitable to undertake better husbandry and protect yieldsthrough spraying, and in the long run through a spontaneous replanting
program (see Annex II).
19. In setting a competitive price level, it should be recalled thatthe 1976/77 season's increase of 25 percent from ¢16 to ¢20 per head load isnot considered to have had much impact on farmers' behavior. The increasewas insufficient to make cocoa competitive and the only direct result wasto reduce government's levy. What is now required is a substantial rise,which should give cocoa farmers a major psychological boost and bring cocoa'sattractiveness back into line with that of other crops.
1/ At the current price of ¢40 per 30 kg the Ghanaian price is above theIvorian and below the Nigerian producer price, though far below both ata more realistic exchange rate.
2/ The Nigerian producer price was recently raised by 56 percent to $1,030per metric ton or 054.5 per 30 kg load (at the official exchange rate).

ANNEX VIIPage 7
Input Subsidies
20. Seed and Seedling Prices. MOA presently distributes certified seed,produced by its Seed Multiplication Unit and registered growers, to farmersat subsidized prices to encourage the adoption of improved varieties. Inthe last few years attempts have been made by the National Seed Committeeto apparently phase out such subsidies on rice and groundnut seed while mairn-taining a subsidy on maize in order to overcome farmers' continued resistanceto maize varieties selected by MOA. Announced prices in 1976 were as follows,compared to costs of production calculated in this report:-
Table 6: PRODUCTION COST AND SELLING PRICES OF SEED
Official SellingPrice/Bag Production Cost/Bag under Improved/Advanced Conditions
Mechanized Hand Cultivation
Rice 017.65 016.34 019.38Groundnut 020.00 - 035.60Maize 015.00 019.16 021.53Cotton 0 0 0.55/kg 0 0.56/kg
When taking MOA assumptions on costs of production, which vary from ourassumptions, the picture looks different, with groundnuts most highly sub-sidized. It is difficult to determine the absolute cost of production onwhich to base a marked-up selling cost.
21. Seed prices are the smallest cost element in farmers' productioncosts and, except where a new crop is being introduced, should not be sub-sidized. Seeds should carry a premium over and above the market price ofthe order of 20 percent, to ensure that such seed, even though it may betreated, is not onsold at a profit or used for consumption. This calls forthe sort of flexible selling policy which does not exist in Ghana. Theinflexibility of the present policy is illustrated by the Rice Mills Unit'sselling of paddy seed during 1976. As paddy prices increased so the price ofdressed paddy seed was increased from 017.05 to about 045/bag. However, asmarket prices for paddy were nearly double this level very little dressed seedwas bought directly for planting, most was used for consumption and forre-selling at a profit. Similarly MOA continued to offer 055 per bag toregistered maize growers while the market price was about 080 and consequentlyMOA was not able to buy any certified seed. Government should drop theirpolicy of selling selected seeds at cost plus a mark up factor (or mark downfactor in the case of an intended subsidy), and sell at a premium above themarket price. This calls for informed market intelligence.
22. Cotton seed is distributed free through CDB. While the justifica-tion for this existed when CDB began its operations in earnest in 1969/70,farmers' interest in cotton production has been proved and there is no longerany justification for distribution of free cotton inputs. As seed cotton has

ANNEX VIIPage 8
a fixed market, treated cotton seed should be sold at cost of production plusmarkup, i.e. in the region of 00.70/kg.
23. Similarly cocoa seeds should no longer be distributed free and thecocoa seed gardens unit should be encouraged to estimate real costs of pro-duction and the farmer be charged accordingly. The same policy should beadopted for OPRI which distributes oil palm seeds free to all but largerconcerns.
24. Fertilizer Subsidies. Prices of tertilizer have been subsidizedto encourage its use. Appendix Table 1 shows that since 1970 the subsidyelement has varied from 49 percent to 86 percent of cost delivered farm gate.Government outlays on fertilizer subsidies have been rising and have increasedfrom 00.4 million in 1970 to 09.2 million in 1976 and a budgeted 014.5 millionin 1977 (Appendix Table 2). Imports have been increasing rapidly in line withsales, which suggests an unsatisfied demand for fertilizer at present prices(Appendix Table 3). With sales of fertilizer rising rapidly from 10,000 tonsin 1971 to 58,000 tons in 1975, use of fertilizer is firmly established inGhana. Government has now therefore begun to remove subsidies on fertilizers,phasing them out gradually over the five year period 1976-1980, and in March1977 announced more than a doubling of farm gate prices. The subsidy elementsremaining for the principal fertilizers used in Ghana vary from an averageof 60 percent to 82 percent under different exchange rate assumptions, asfollows (for details see Annex VIH, Table 13):-
Table 7: FERTILIZER SUBSIDIES
Fertilizer Official Price Subsidy Element¢/ton US$1 = 01.15 01.73 03
15:15:15 130.0 58% 68% 81%Ammonium Sulphate 100.0 66% 75% 85%C.A.N. 110.0 65% 74% 84%Single Super Phosphate 110.0 54% 65% 79%Triple Super Phosphate 140.0 57% 68% 81%
Average 60% 70% 82%
25. With wholesale prices of domestically produced crops rising rapidly,it is extremely difficult to predict the effect of an increase in fertilizerprices on farmers' behavior, resource allocation, demand for fertilizer andincomes. The IBRD Review of Fertilizer Prices in early 1976 concluded thatrice farm profitability is more sensitive to changes in farmgate prices andyields than to the level of fertilizer subsidy. Furthermore, labor avail-ability has since become a major concern and labor costs for the mechanizedrice farmer have increased dramatically. One indicator of the likely impactof raising farm gate prices for fertilizer on demand for fertilizer is theincrease in the total costs incurred by the cultivator. For the mechanizedfarmer, who now receives the bulk of the distributed fertilizer, the cost offertilizer would increase as a proportion of his total cost from 3 percent to8 percent. This is unlikely to cause any reduction in demand.

ANNEX VIIPage 9
Table 8: FERTILIZER AS PERCENTAGE OF TOTAL PRODUCTION COSTS
Average Farmer Improved Farmer
Subsidized Unsubsidized Subsidized Unsubsidized
Mechanized Rice 3% 8% 5% 10%Cotton 0 7% 0 8%Maize 4% 8% 4% 9%
Naturally the effect on net returns would be larger for the average than forthe improved farmer. However, such calculations are mathematical nicetiesand are no substitute for an intelligence system that monitors farmer reac-tions to increasing fertilizer prices.
26. Two overriding issues favor the complete removal of fertilizersubsidies at the present exchange rate. First, government outlays on fer-tilizer subsidies have become a significant budgetary burden in a periodin which Government continually runs a budget deficit. For 1976/77, thesubsidy represents 25 percent of the current budget for all agriculturaldevelopment, excluding cocoa. Secondly, the present highly subsidized priceleads to misallocation of fertilizer. Untii prices begin to reflect the realvalue of fertilizer, there will continue to be a big temptation to smugglefertilizer across national boundaries. This traffic results in Ghana alloca-ting its scarce foreign exchange (the foreign exchange element of fertilizerdelivered farm gate is in the order of 65 percent) to stimulate agriculturalproduction in neighboring countries which are often competing for the samecommodity market. It also leads to a healthy internal black market withfinal users often paying unsubsidized prices. Equally, because fertilizer isprincipally bought by those who have easy access to distribution points andMOA officials responsible for distribution, i.e. the larger mechanized farmer,fertilizer is being allocated to support an activity that, in the case ofrice and maize, has been shown to be uneconomic at both the official andat realistic exchange rates.
27. It is recommended that Government continue to reduce the subsidyelement to at least reflect the true financial cost for the 1979/80 season.Furthermore, the present subsidized prices for different fertilizer typesignore plant food percentages in the fertilizer. The price, for example,for all compounds (20-20-20, 15-15-15, 6-30-21 or 15-30-9) is the same.This should be corrected for the 1978/79 season.
28. Inputs for the Cocoa Sector - Insecticides and Sprayers. To com-pensate for the low producer price for cocoa (see above) prices of insec-ticide and sprayers have remained constant in current terms at highly sub-sidized levels for more than seven years. The present subsidy rates arebetween 81 percent and 95 percent, at the official exchange rate.

ANNEX VIIPage 10
Table 9: SUBSIDIES ON SPRAYERS AND INSECTICIDES
Unsubsidized Prices (Subsidy Rate)
Official Price¢ US$1 = 01.15 US$1 = 01.73 US$1 = 03.00
Insecticide
Gamm Gammalin 2.0/gal 14.6 (86%) 21.4 (91%) 36.4 (95%)Undane 2.0/gal 38.5 (95%) 57.2 (97%) 155.7 (99%)Sprayers 30.0/unit 158 (81%) 237 (87%) 412 (93%)
These low prices discourage government from increasing supplies, firstlybecause it increases the subvention carried by CMB which already operatesat a loss, and secondly because of the fear that the price differentialwill lead to smuggling. In the face of significant unsatisfied demand onecan expect demand to be inelastic. It is recommended that, in compensationfor an increase in the producer price to around 050 per 30 kg head load,all subsidies on insecticides and sprayers should be removed in one step.No reduction in effective demand is expected. Indeed with the renewed in-terest in cocoa that such an increase in the producer price should induce,a considerably larger effective demand for insecticides and sprayers couldbe expected.
29. In the absence of published data for the CMB, which is responsiblefor purchasing insecticides and sprayers and carries the subsidy as part ofits operating deficit, costs of the subsidy program are not available.However, with the subsidy levels shown above, at 1976 import levels, thesubsidy program should amount to some 02.4 million for sprayers and 015.9million for insecticide.
30. Mechanized Services. Mechanized Services for land clearing, prep-aration, and harvesting of rice are offered by the MOA's Mechanization andTransport Department, CDB, such Government assisted projects as GGADP, andby Regional Development Corporations. Costs are subsidized at present asfollows:-

ANNEX VIIPage 11
Table 10: SUBSIDIES ON MECHANIZED SERVICES
% SubsidizedUS$1 = ¢1.15 US$1 = 03.00
Land Clearing - Savannah 0% 0%- transitional and
coastal savannah 17% 61%Ploughing 50% 76%Discing 74% 87%Sowing/Fertilizing 3% 52%
Combining 55% 78%
Source: Appendix Table 4.
CDB provides land preparation services at no charge. Such calculations arebased on estimates of machine time per land area, maintenance requirements,life, down-time, etc. and can always be disputed. However, it is clear thatall mechanized services are highly subsidized except that of clearing truesavannah areas, where the mission's estimates of time required are two-thirdsof MOA estimates. A standing committee on Guaranteed Minimum Prices for Agri-cultural Produce reviews cost estimates and recommends charges to MOA thatinclude a 25 percent overhead in order not to set charges that would undercutprivate operations. However, there is little danger of this. In the absenceof records on the mechanization fleet owned by private individuals, manyof whom rent out their services when they have spare capacity, it is notknown what proportion of the mechanized fleet is operated by para-governmentalagencies. A reasonable estimate, however, is that about 20 percent of thewheeled tractor fleet and rice combines are operated by MOA, and about 90percent of the crawler tractors used for clearing. Therefore, only in theclearing operation do subsidies have a significant impact on encouragingmechanization.
31. In a situation where mechanized production is uneconomic from thenational point of view (except for cotton under improved conditions), asmechanization draws heavily on scarce management capability and foreign ex-change in an economy with severe balance of payments problems, there is nojustification for subsidizing mechanical services. Furthermore, except forrice, a luxury commodity, there is no absolute necessity for mechanization.It is therefore recommended that MOA transfer their clearing equipment andworkshops to CDB, Regional Development Corporations and efficient well man-aged project units or farmer services companies (as established under theUpper Region Project). Wheeled tractors and combines should be sold offto private concerns.
32. Finally, given the present value of the Cedi imports of agricul-tural equipment will continue to be comparatively cheap. The governmentshould therefore carefully control the level and composition of theseimports. Imports of agricultural machinery and equipment are presentlyrunning at over ¢10 million per year (See Appendix table 5).

CALCULATION OF SUBSIDY COMPONENT ON FERTILIZER
Compound Frttilizer jeumonmuM Sulplhate
1970 1971 1972 1973 1974 1975 1976 19775/ 1970 1971 1972 1973 1914 1975 1976 1977
Cedis (C) per metric ton _ Cedis ($) per metric ton
Average F.O.B. price 57.60 65.30 98.- 106.- 254.75 290.- 155.- - 28.40 29.- 44.- 78.- 194.20 157.- 85.- -
Freight, insu.rance 15.- 17.- 24.- 30.- 47.- 55.- 60.- - 15.- 17.'- 24.- 30.- 471- 55.- 60.- -
;I.t-,. price Tema!, 72.60 82.30 122.- 136.- 301.75 345.- 215.- 162.- 43.40 46.50 68.80 108.- 241.20 212.- 145.- 154.-
lHandling, port charges 2.55 2.65 2.85 3.75 5.65 7.90 9.- 12.- 2.55 2.65 2.85 3.75 5.65 7.90 9.- 12.-
i.and,-d price TEFA 75.15 84.95 124.85 139.75 307.40 352.90 224.- 174.- 45.95 49.15 71.65 111.75 246.85 219.90 154.- 166.-
Transport to Tamale-/ 25.80 27.70 28.90 32.25 34.50 43.05 60.90 81.- 25.80 27.70 28.90 32.25 34.50 43.05 60.90 81.-
Storage, financial charges 9.65 9.65 10.15 11.25 11.75 12.60 12.60 51.- 9.65 9.65 10.15 11.25 11.75 12.60 12.60 49.-
Ex-de`,oT price 'Tamale 110.60 122.30 163.90 183.25 353.65 408.55 297.50 306.- 81.40 86.50 110.70 155.25 293.10 275.55 227.50 296.-
4/Subldized sales price- 56.- 56.- 56.- 56.- 56.- 56.- 56.- 130.- 40.- 40.- 40.- 40.- 40.- 40.- 40.- 100.-
-S b -s' - r ton_ 54.60 66.30 107.90 127.25 297.65 352.55 241.50 206.- 41.40 46.50 70.70 115.25 253.10 235.55 187.50 196.-
Subsidy in % of depot on 49.4 54.2 65.8 69.5 84.2 86.3 81.2 58.- 50.9 53.8 63.9 74.2 85.4 85.5 82.4 66.-
price
I/ Average price at delivery time, weighted for quantities of various types of fertilizer purchased. Estimates for 1976
based only oni deliveries made by February 1976.
2/ Include hari,our duea, stevedoring, cargo handling, liner' agency charges and Ghana Supply Colasiasion fee.
3/ Based oni truck tranaport charges. The alterrnative use of river barges on the Volta lake would be cheaper
((41.50 per ton from Tema to Tamale in 1970, including lake transport coats of t26.50 per ton).
4/ t 2.80 per bag of 50 kg for any compound fertilizer; t 2.- per bag of 50 kg for ammonium sulphate.
Source: IRD Review of Fertilizer Subsidies.
iSI
(nzi- t-i

APPENDIXTable 2
GOVERNMENT OUTLAYS ON FERTILIZER SUBSIDIES
1970 1971 1972 1973 1974 1975 1976 1977
Compound Fertilizer
Total imports (tons) 5,100 5,000 13,280 19,630 7,300 18,050 51,655Minus: Imports Under
Grant Terms1 (tons) 1,500 2,500 3,500 4,500 4,500 6,000 18,460 /
Governt' SubsidizedImports (tons) 3,600 2,500 9,780 15,130 2,800 12,050 33,195-
Average subsidy-/(in 4 per ton) 54.60 66.30 107.90 127.25 297.65 352.55 241.50
Subsidy Cost toGovernt' ('000 ¢) 196.6 165.8 1 055.2 1.925.3 833.4 4,248.2 8,505.80k'
Straight Fertilizer(tons)
Total Imports 4,080 4,980 2,610 10,100 5,170 5,330 13,400Hiinus Imports ynder
Grant Terms-l - - 400 - 1,100 1,000 11,400
Governt' SubsidizedImports 4,080 4,980 2,210 10,100 4,070 4,330 2,000
Average Subsidy!/(in 4 per ton) 41.40 46.50 70.70 115.25 253.10 235.55 187.50
Subsidy Cost toGovernt' ('000 ¢) 168.9 231.0 150.2 1,164.0 1,030.1 1,019.9 677.1
Total subsidy cost 7/ 3/('000 ) 365.5 397.4 1 211.4 =3089.3 1863.5 5.268.1 2. 1 .a±2= L4 5o&-
1/ GGADP imports are financed under a grant from German bilateral aid. Other importsfinanced through World Fertilizer Program (W.F.P.).
2/ Including distribution costs up to Tamale. This is considered as an adequateaverage for the country as higher costs for areas north of Tamale should be com-pensated by lower costs for distribution of fertilizer closer to the coast.
3/ Budgeted , of which 4 13.2 million is for foreign exchange costs.4/ 14,460 tons 15-15-15 W.F.P. 4,000 tons GGADP.5/ 8,000 tons financed by loan from U.S.A.I.D.6/ Includes transport and handling costs of 426.5/ton on grant fertilizer.7/ 1976-77 budget allowance was 412.0 million for importation and distribution costs.
APPENDIXTable 3
IMPORTS OF AGRICULTURAL MACHINERY & IMPLEMENTSI'
1975 1974 1973 1972------------ - '000…
Agricultural machinery &appliances for soil preparation 1,215 1,017 1,209 875
Agricultural machinery forharvesting,threshing & sorting 834 1,636 1,295 256
Tracked>tractors 40 B.H.P. - 21 152 (33) 250 (33) 221 (381Tracked<tractors 40 B.H.P. 4,163(113T 4,425(181) 929 (58) 2,293 (43)WheeledAtractors 40.B.H.P. 987 (72) 1,018(226) 80 (11)Wheeled4tractors 40 B.H.P. 3,604(338) 4,881(599) 2,795(510) 1,377(186)
Agricultural machinery &appliances - general 506 816 512 255
Total 10,322 13,098 7,496 5,357
1/ Does not include road tractors for tractor-trailer combinations.
2/ Figures in parenthesis are numbers of units.
Source: External Trade Statistics.

MECHANIZATION SERVICES - SUBSIDIES, FINANCIAL AND ECONOMIC COSTS-
EconomicFinancial Charges/ha U',$1 = US$1
OperatIon lirs/Ha Cost/hr Subsidized Financed t 1.75 ¢ 3 Subsidy Elementof Financial of 5/
Land Clearing Cost Economic
Savannah lands 1.65 (4.44) 54.23 (44.60) 198.0- 89.5 118.8 191.4 0X 0%
Transitional and 4.94 (5.54) 54.23 (44.60) 222.3 267.9 355.8 573.0 17% 61%Coastal Savannah(Inc. rice lands)
Ploughing 5.00 (3.70) 16.86 / (8.81) 42.0 84.3 109.5 172.5 50% 76%
Discing 2.50 (1.23) 22.92 (8.72) 15.0 57.3 75.3 118.7 74% 87%
Sowing/Fertilizing 1.00 (1.65 22.57 (10.38) 22.00 22.6 29.3 45.6 3% 52%
2/Combine (Rice) 1.70 (30 bags/hr) 40.67 (39.88) 2/bag 4.4/bag 6.1/bag 9.1/bag 55% 78%
1/ All figures in parenthesis taken from Report of the Committee on Guaranteed Minimum Prices for Agricultural Produce.Part cne - Cost of Farm Mechanized Services. Accra, Ghana, February 1976. They therefore reflect 1976 priceswlhereas new figures are in 1977 prices
2/ Assuminig a yield of 1250 kilo/ha. MOA estimates assumes higher yield. Since combining time dependent on areanot yle]d this results in higher IBRD estimate of per bag cost. '
3/ GGAI)P ch-larges ¢ 148/ha to Government agencies such as C.D.B.
4/ Difference principally due to life expectancy assumptions: MoA takes 5 years or 8000 hrs,IBRD 3 years or 3000 hrs. X
5/ US $1 - 3
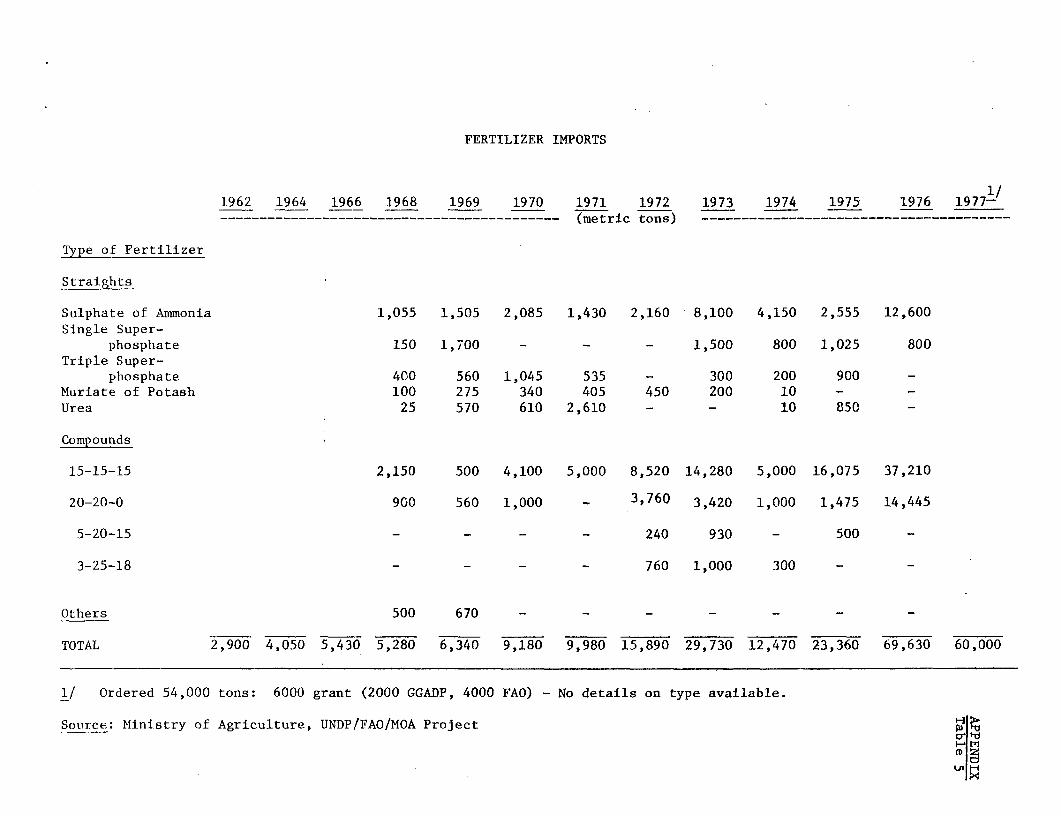
FERTILIZER IMPORTS
1962 1964 1966 1968 1969 1970 1971 1972 1973 1974 1975 1976 1977-------------------------------------------- (metric tons) ---------------------------------------
Type of Fertilizer
Straights
Sulphate of Ammonia 1,055 1,505 2,085 1,430 2,160 8,100 4,150 2,555 12,600Single Super-
phosphate 150 1,700 - - - 1,500 800 1,025 800
Triple Super-phosphate 400 560 1,045 535 - 300 200 900 -
Muriate of Potash 100 275 340 405 450 200 10 -Urea 25 570 610 2,610 - - 10 850 -
Compounds
15-15-15 2,150 500 4,100 5,000 8,520 14,280 5,000 16,075 37,210
20-20-0 900 560 1,000 - 3,760 3,420 1,000 1,475 14,445
5-20-15 - - - - 240 930 - 500 -
3-25-18 - - - - 760 1,000 300 -
Others 500 670 - - - - - - -
TOTAL 2,900 4,050 5,430 5,280 6,340 9,180 9,980 15,890 29,730 12,470 23,360 69,630 60,000
1/ Ordered 54,000 tons: 6000 grant (2000 GGADP, 4000 FAO) - No details on type available.
Source: Ministry of Agriculture, UNDP/FAO/MOA Projectt 1
(DIy
kAfr
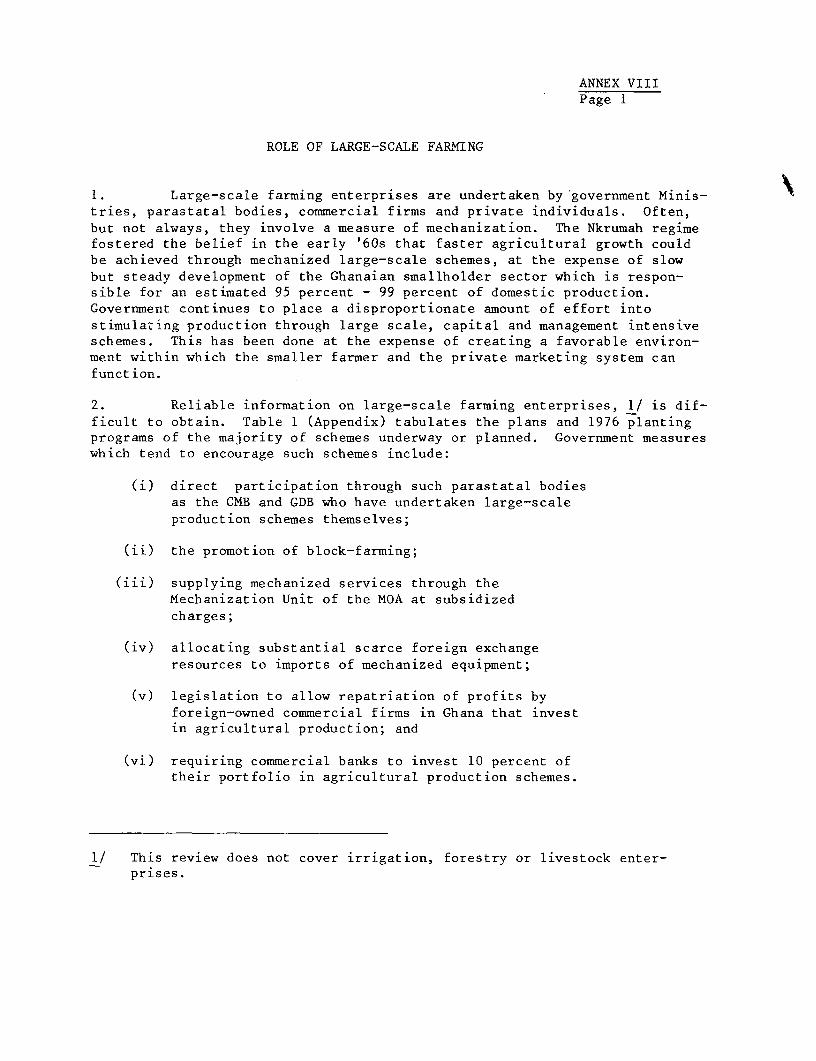
ANNEX VIIIPage 1
ROLE OF LARGE-SCALE FARMING
1. Large-scale farming enterprises are undertaken by government Minis-tries, parastatal bodies, commercial firms and private individuals. Often,but not always, they involve a measure of mechanization. The Nkrumah regimefostered the belief in the early '60s that faster agricultural growth couldbe achieved through mechanized large-scale schemes, at the expense of slowbut steady development of the Ghanaian smallholder sector which is respon-sible for an estimated 95 percent - 99 percent of domestic production.Government continues to place a disproportionate amount of effort intostimulating production through large scale, capital and management intensiveschemes. This has been done at the expense of creating a favorable environ-ment within which the smaller farmer and the private marketing system canfunction.
2. Reliable information on large-scale farming enterprises, 1/ is dif-ficult to obtain. Table 1 (Appendix) tabulates the plans and 1976 plantingprograms of the majority of schemes underway or planned. Government measureswhich tend to encourage such schemes include:
(i) direct participation through such parastatal bodiesas the CMB and GDB who have undertaken large-scaleproduction schemes themselves;
(ii) the promotion of block-farming;
(iii) supplying mechanized services through theMechanization Unit of the MOA at subsidizedcharges;
(iv) allocating substantial scarce foreign exchangeresources to imports of mechanized equipment;
(v) legislation to allow repatriation of profits byforeign-owned commercial firms in Ghana that investin agricultural production; and
(vi) requiring commercial banks to invest 10 percent oftheir portfolio in agricultural production schemes.
1/ This review does not cover irrigation, forestry or livestock enter-prises.

ANNEX VIIIPage 2
3. Government's support for large-scale farming enterprises is basedon three premises. First, the belief that agricultural output can be mostrapidly raised through large-scale mechanized schemes. Secondly, mechaniza-tion is considered necessary to overcome the growing labor shortage and in-crease labor proauctivity, thereby helping to slow down the movement o'rural youth to the towns. Thirdly, by setting up large-scale governmentmanaged schemes manned by large numbers of urban unemployed it is thought thaturban unemployment and rural labor shortage could be attacked at the sametime.
4. The belief that commodity shortages can be most quickly overcomeby large-scale, mechanized, often government managed schemes, undoubtedlynow reflects in part government's political need to demonstrate visuallythat they are coping with the present serious shortages in staples. Esti-mates of the proportion of domestic production produced under mechanizedand large-scale schemes vary widely. However, production from such schemesis a very small proportion of total production, insufficient, except forrice, a luxury commadity, and oil palm, to make much impact on overall sup-plies. 1/ And while there is undoubtedly a limited role for efficient large-scale production, concentrating efforts in this sub-sector will not alleviateeither short-term deficits or lay the foundation for the medium and long-termdevelopment of the agricultural sector as a whole.
5. The total area cultivated in 1976 by the agencies listed in Table 1(Appendix) is less than 3 percent of the total (non-cocoa) cultivated areain Ghana; this includes the large scale mechanized rice farmers in the North-ern and Upper Regions. Estimates of the number of serviceable wheeled trac-tors in the country in 1976 provide a cross check on the order of magnitudeof the mechanization program and are given in Table 2 (Appendix). Theseindicate that, assuming all tractors imported for agricultural purposesare used for land preparation and not in the more lucrative employment ofroad haulage, there existed in 1976 a land preparation capacity for a maximumof 80,000 hectares per year. This is based on the assumption that a tractorwill work 1000 hours per season on average, taking 7.5 hours to plough anddisc one hectare. 80,000 ha is 7 percent of the total cultivated area inGhana, excluding cocoa land. While such an estimate is extremely crude, itdoes indicate the relative insignificance of the mechanization program whenviewed against the whole sector.
1/ Best estimates are that apart from rice (perhaps as much as 40 percent)and oil palm (about 6 percent), the proportion of total productionproduced on large-scale schemes is less than 1 percent-2 percent oftotal. The situation in the cocoa sector where a significant proportionof production comes from large holdings employing the same technology andcultural practices as small producers should not be confused with large-scale schemes as referred to in this Annex. In the context of large-scalefarming discussed here the employment of a higher level of management ortechnology is implied.

ANNEX VIIIPage 3
6. Government-run mechanized schemes take up a disproportionate amountof MOA's skilled managerial capacity which is in critically short supply andneeded to tackle the most urgent and fundamental problems facing the sector.Furthermore, experience with the operations of the large State Farms in the'60s and evidence thereafter clearly demonstrates that Government-run schemesare poorly managed and should not be encouraged.
7. Recent experience in the private sector indicates that the finan-cial viability of mechanized rice, maize and cotton production is question-able, even under existing subsidy rates (see Annex VII for a discussion onsubsidies). The oldest private commercial concern established in 1969, amechanized maize farm at Ejura in the Ashanti Region run by expatriate man-agement, has yet to make a profit. A recently begun mechanized cotton farmat Ejura, supported by the African Development Bank, is reported to be run-ning into severe difficulties in its first year of operation due to poorlabor availability and lack of storage. In the North, two poor seasonswith average yields of 3-5 bags of paddy/hectare appears to have prickedthe bubble of the extensive rice mechanization schemes that began in 1974,supported by the commercial and State banks. Debts are now being resched-uled and the Banks are reexamining their programs.
8. Most importantly a detailed review of the economics of such schemesindicates that, from the country's point of view, mechanization of part orall of the cultivation of rice, maize, and cotton is uneconomic under aver-age conditions. Per hectare returns have been calculated using the officialrate of exchange, a shadow rate of exchange adjusting the value of foreignexchange in terms of cedis by 50 percent, and a shadow rate of 03 to thedollar. Details are in the Appendix at Table 3-5, assumptions on cotton seedprices Table 6, mechanization costs Table 7, commodity prices Table 8-12,fertilizer prices Table 13 and the insecticide price at Table 14. Theresults are as follows:-

ANNEX VIIIPage 4
Table 1: NET RETURN PER HECTARE UNDER MECHANIZED CULTIVATION(Cedis)
Average Yield YieldPrices Farmer Level Improved Fa.-mer Level
US$1 = 01.15 01.73 03 kg/ha 01.15 01.73 03 kg/ha
Rice 1977 (318) (348) (458) 1250 (269) (225) (195) 2250(Import substitute) 1980 (275) (283) (348) 1250 (190) (108) 3 2250
Maize 1977 (197) (158) (132) 1500 (187) ( 86) 48 2500(Import substitute) 1980 (188) (147) (110) 1500 (172) ( 66) 85 2500
Cotton 1977 ( 89) 33 172 500 167 397 807 1000(Import substitute) 1980 (113) ( 67) 38 500 1i3 310 650 1000
Rice 1977 (341) (373) (491) 1250 (310) (270) (254) 2250(Export parity) 1980 (302) (311) (381) 1250 (234) (158) ( 56) 2250
Maize 1977 (261) (232) (226) 1500 (292) (209) (107) 2500(Export parity) 1980 (251) (221) (203) 1500 (276) (191) ( 70) 2500
9. The results indicate that cotton production under the CDB mechanizedblock farming approach has a positive return at yields over 500 kg/ha, whena proper value of the Cedi is taken into account. There is very little in-formation on yields under mechanized schemes but indications are that averagecotton yields were in the region of 550 kg/ha in 1975 and 650 kg/ha in 1976.In one instance, however, yields of over 2000 kg/ha were reported on a 100hectare farm. Under improved conditions, and assuming realistic values forthe Cedi, mechanized cotton production becomes economically more attractive,though less attractive than ox or hand cultivated cotton (see AppendixTable 15).
10. For rice and maize, mechanized production is not economicallyviable to the country except under improved conditions, assuming the cropis for import substitution, and assuming a value of the Cedi at 03 to onedollar. Under these conditions mechanized production yields a marginalpositive return to the country. Under export parity conditions mechanizationof rice and maize is economically costly to the economy except when yieldlevels are in excess of 2.25 tons of paddy/ha and 2.5 tons of maize/ha.A yield sample of large-scale rice farmers conducted by GGADP in 1974 indi-cates large variations in yields, from 200-4300 kg/ha. Indications arethat average yields from mechanized rice farms were of the order of 1600kg/ha in 1974, 600 kg/ha in 1975 and 400/kg in 1976. Technical and cli-matic reasons for this decline are discussed in Annex I. In other words,the average mechanized rice and maize farmer has been a considerable drainon the economy even where his operation was financially viable to him.From a country perspective, mechanization of the cultivation of rice andmaize is uneconomical except on certain soils under exceptional management,favorable climatic conditions, and timely availability of inputs. By removing

ANNEX VIIIPage 5
all input subsidies the Government would force inefficient farmers to im-prove their operations or give up.
II. The Government announced plans in March 1977 to set up .ie NationalReconstruction Corps which would hire 20,000 people, largely from urban areas,to work on special schemes in agriculture as well as other sectors. Mean-while, the CMB has started a series of cocoa and coffee plantations, withoutproper feasibility studies, and has hired some 2,000 permanent laborers.Similar actions were taken in the past, and the Food Production Corporationwas set up with the objective of employment creation in mind. While suchprograms may produce a limited, but visual, impact, they do not address thecauses of the labor shortage in agriculture, namely:
- the low productivity of labor in agriculture,
- laborers' high expectations of employment and highincome levels in the urban and service sectors,
- Government's own policy of guaranteeing employmentto large numbers of permanent laborers, and
the poor economic performance of the economy whichis making employment in the agricultural sectors ofneighboring countries with stronger economies moreattractive to Ghanaian labor. This is further exa-cerbated by the overvaluation of the cedi, reflectedin a thriving black market for foreign currency.
12. Another argument for encouraging large-scale farming enterprisesis that it is easier to guarantee a given level of production through largesingle enterprises than by coordinating the efforts of many individual smallfarmers. This is a justified policy for tree crop production and is thebasis for the nucleus plantation-with-outgrower approach being used in thethree oil palm development projects in which there is a disproportionatelylarge fixed investment in the processing unit requiring constant throughputof a guaranteed quality. This is also the argument put forward by the live-stock production industry for large-scale mechanized maize schemes. However,there is less justification in this sub-sector where quality of produce isnot a prime consideration and where the fixed cost element is relativelysmall.
Recommendations
13. In the light of what appears to be an abortive attempt to stimulateagricultural production through large-scale, often mechanized, schemes, it isrecommended that the following steps be taken:

ANNEX VIIIPage 6
(1) a moratorium be put on the hiring of any furtherpermanent agricultural laborers by governmentagencies, and that Government seek ways to reducethe numbers of agricultural laborers on its per-manent pay roll;
(2) cessation of any further expansion of para-statalagencies in direct production activities.
(3) a drastic reduction of imports of agriculturalmachinery combined with more liberal imports ofessential spare parts and training programs foroperators and mechanics. In conjunction withrecommendations on subsidies and the future ofthe Mechanization Unit of MOA (see Annex VII) thisshould lead to a weeding out of the inefficientmechanized farmer;
(4) permit a certain level of rice and maize imports;
(5) an evaluation of the experience with block farms;
(6) careful operation of the special scheme for invest-ment in agriculture with a view to avoiding theestablishment of uneconomic large-scale farms.

LARGE SCALE FARMING ENTERPRISES
Organization. Crop Develcnt__Period Project Hecterage 1976 actual hecteraSe
Ghana Tchacco Co. Tobacco N/A 3575 2950
Crain DEveloprnent Board Soyabean 1976-1980 10120 810
Cocoa Marketing Board Cocoa 1976-1980 16200Cofee 1976-1980 10120
State Farms Corp. Food Crop/ Oil Palm 1977 1700/1200 2280/14050
RJce Mills Unit Rice 1975-1977 560 90 (160 in '75)
Food Productioni Corporation Maize/Yam/Cotton/CassavaRice/Plantain/Oil Paim 1977-1981 16200 1770
Ejura Ferm3 Itd Maize 1969 1340 1340
Nasiv Ri.ce Co. Rice 1975-1980 2000 3400
Cottorn Developr1 ent Board Cotton 1968-1969 2400 1/
Cotton Production Co. Cotton 1976-1980 1600 160
Glhana Textil]e Manufacturing Co. Cotton N/K N/K 500
Agricultural Development Corporat Cotton/Rice 1974- 1600/90 500/90Anoszubo
CFAO/Shell Farm Rice, Maize, Soya1hean, Chickens 1978-1982 2500 -
Kade Oil Palm Project Oil Palm 1976-1980 6000 -
Twi.o Oil PalmA Project Co. Oil Palmn 1977-1981 6000 -
Oil Palm IProjeeL Oil Palm 1976-1980 6000 -
West Coast Textiles Cotton N/K N/K 80
OX - not krnowa N/A - not applicable 1/ Estlmated 10 of 24,100 ha in block farms

APPENDIXTable 2
ESTIMATED NO. OF SERVICEABLE TRACTORS
Total inImported 1971 1972 1973 1974 1975 1976
Tracked > 40 B.H.P - 38 33 33 -Tracked < 40 B.H.P - 43 58 181 113Wheeled > 4O B-H.P - 11 226 72 -Wheeled < 40 B.H.P 450 186 510 599 338
Servicable in 1976 1/Tracked > 4o B.H.P - 4 7 10 - 21Tracked e 4o B.H.P - 4 12 54 79 149 5/Wheeled > 4o B.H.P - 1 45 22 - 68Wheeled < 4O B.H.P 22 19 102 178 237 558 4/
1/ Calculated on the basis of the following replacement rate:-Year 1 2 3 4 5 6 7
10% 30% .70% 80% 90% 95% 100%2/ Assuming all tractors over seven years old. are, on average, unservicable.3/ Imports prior to 1977 from FAO Perspective Study Farm Mechanization. Assumed
to be all tracked < 40 B.H.P.4/ In 1976 sufficient wheeled tractors working at 1000 hrs/season 7.50 hrs/ha
to plough and disc 80,000 ha or. 3% of cultivated area (c.f. with G.D.B.Situation Report on Rice January 1975 estimate of 46,000 ha in 1974)
5/ In 1976 sufficient crawler tractors working at 833 hrs/yr at 4.1.2hrs/ha(75% Transitional bush, 25% Savanah) to clear 34,000 ha per year.

APPENDIXTable 3
Per Hectare Rice Budget - Mechanized - Northern Region
____________- -Average Farmer - --- Improved Farmer- - - - -C o 5 t - - - - - - - - Co S t - - - - - -
Physical Input Financial / Economic 4/ Physical Input Financial Economic((I) (2) (1) (2)
COSTS1/
Land Clearing 4.94 br 89.30 118.59 191.00 4.94 hr 26.79 35.58 57.30
Plowing 5.0 hr 84.30 109.50 172.50 5.0 hr 84.30 109.50 172.50Discing 1.25 hr 28.65 37.66 59.37 2.50 hr 57.30 75.32 113.75Soving/fertilizing 1.00 hr 22.57 29.30 45.62 1.00 hr 22.57 29.30 -5.62CombinIng 1.70 br 69.14 94.74 142.77 1.70 hr 69.14 94.74 142.77Weeding 20 ad 60.00 5/ 80.00 60.00 30 md 90.00 90.00 50.00Top dressing
application - 1 md 3.00 3.00 3.00
TransportFertilizer .05 hr .07 hrLabor 1.33 hr 2.03 hrRice bags 0.2 hr 0.35 hr
Sub total 1.58 hr 19.81 25.11 31 2.45 hr 30372 3S.93 60.69
S-PeUeTds 90 kg 7.29 13.86 26.10 90 kg 7.29 13.86 2S.10Fertilizer 15:15:15 100 kg 30.60 40.90 68.20 100 kg 30.60 40.90 63.20
CaM - 50 kg 15.65 20.95 35.00Bags 16 2/ 8.00 11.20 16.00 28 14.00 19.60 23.00
TOTAL COST 419.66 540.86 820.70 4R1.36 571.668 .4: 52
BEliEF ITS
port ubstitution Yield Yield11250 kg 191.25 192.50 362.50 2250 kg 182.25 346.50 652.50
(1980) 145.00 257.50 472.50 261.00 463.50 85D.50
Expor rity(1977) 78.75 167.50 330.00 141.75 301.50 9 .00(1980) 117.50 230.00 440.00 211.50 414.00 792.00
1/ Assuming cost sprcad over 3 years for average farmer, 10 years for improved farmer.2/ Used twice at t 1/bag.
3/ Excluding subsidies. Rate of exchange: tl.l5 - US$1.4/ Economic (1) Rate of Exchange ¢1.73 z USS I
(2) t3 a US$ 1.All labor assumed hired, at ¢ 3/day.

APPENDIXTable 4
Per Hectare Cotton Budget - 1Mechanized - Northern 6 Brong Aha60 Areas
Average Yield -- Higher Yield -- -C o a t - C o s t
Physical Input .ilnlncial 3/ 1Qooomis4f Phsvical lnput =nancial_ C) (2) CI) (2)
COSTS
Land Clearing 1.65 br 2/ 8.95 11.88 19.13 1.65 br 8,95 11.88 19.13
Primary Till-geFlowing 5.00 *Ar 84.30 109.50 172.50 5.00 hr 84.30 109.50 172.50Discing 2.50 hr 57.30 75.32 118.75 2.50 hr 57.30 73.30 118.75Sowing 10 Md 10 mdFertilizer
Application I ud 3 mdWeeding 20 md 30 sdSpraying 6 md 8 adEarvesting 35 zd 40 ndGrading 10 md 12 sdUprooting 10 zad 10 Md
Subtotal 93 nd 223.00 279.0U 279.00 113 ed 271.20 339.00 339.CO
InputsSeeds 45 kg 3.33 6.80 12.33 45 kg 3.33 6.80 12.33Fertilizer 15:15:15 100 kg 30.60 40.90 68.20 100 kg 30.60 40.90 68.20
CAN - - - - 50 kg 15.65 20.95 35.00lInecticide 8 liters 38.16 65.68 200.00 16 liters 76.32 131.36 400.00
TrTAL COST 445.64 589.58 869.91 547.65 735.69 1164.91
Yield Yield
(1977) 500 kg 357.00 566.50 986.00 800 kg 571.20 906.40 1577.60(1980) 333.00 523.00 907.50 528.80 836.80 1452.00
(1977) lo0kg 714.00 1133.00 1972.00(1980) 661.00 1046.00 1815.00
1/ Assur.Lng 80% hired labor 20% family labor. Labor hired at ¢ 3/day.2/ Cost spread over 10 years under CDB management3/ Excluding subsidies. Rate of exchange: 0 1.15 - US $1V/ Economic (1) Rate of Exchange 0 1.73 - US $1
(2) 03 - US $1.

APPENDIXTable 5
Ter Hectare Maize Budget - Mechanized - Atibubu Area
Average Farmer -- Improved Farmer
-Coat - - - - C o s t- - - -
Physical Input Financial E/ Economic PhvscSal Inout Financlal Economic
COSTS () (2) (1) (2)
Land Clearing 1.65 hr 29.83 39.61 63.79 1.65 hr 8.95 11.88 19.13
Plo-.ing 5.00 hr 84.30 109.50 172.50 5.00 hr 84.30 109.50 172.50Discing 1.25 hr 28.65 37.66 59.37 2.50 hr 57.30 75.32 118.75Soving/Fertilizing 1.00 hr 22.57 29.30 45.62 1.00 hr 22.57 29.30 43.62Weeding 20 MD 30 MDTop dressing
application - 1 MDHarvesting 14 MD 20 MD
Bagging/Selling 9 MD 12 MD
TOTAL HD 43 HD 1 0 129.00 129.00 63 MD 189.00 189.00 189.00
Transport 1/Fertilizer .05 hr .07 brLabor 2.86 hr / 4.13 hrMaize bags .19 hr .31 hr
Subtotal 3.10 br 38.87 49.26 76.79 4.51 hr 56.56 71.66 111.71
InputsSeed 14 kg 5t 1.64 2.70 4.69 14 kg 1.64 2.70 4.59Fertilizer 15:15:15 100 kg 30.60 40.90 68.20 100 kg 30.60 40.90 68.20
CAN - - - - 50 kg 15.65 20.95 35.00Bags 15 f/ 7.50 10.50 15.00 25 12.50 17.50 25.00
TOTAL COST 372.96 448.43 634.96 479.7 568.71 789.60
BENEFIT Yield Yield
1500 kg 2500 kgImport Substituticn
(1977) 175.50 289.50- 502.50 292.50 432.50 837.50
Export Parity(1977) 112.50 216.00 409.50 187.50 360.00 682.50
j 4 tons per trailor load. Average distance of farm At 16 km/hour
2t 30persons per trailer load. Average labor gang size 15.g/ All labor hired at 0 3/dayb Sandy soils in Savannah area. Cost spread over 3 years for average farmer: 1'? years for improved farmer
5/ 20% mark up on farm gate pricet/ Used twice at 0 l/bag.
7/ Eycludingsubsidies. Rate of exchange: t 1.15 - US $ 1/ Economic C.) Rate of exchange: ; 1.73 - US $ 1
(2) L t3 - US $ 1

APPENDIXTable 6
FORECAST COTTON SEED PRICES (EXPORT PARITY)(Constant 1977 ¢ per 1000 kg)
Financial Economic
US$1 - 01.15 US$1 - 01.73 US$1 - 03.001977 1980 1977 1980 1977 1980
CIF Europe 214 187
Freight 35 35
FOB Accra 179 152
¢ equivalent 206 175 310 263 537 456
Port handling 20 20 20 20 20 20
Transportationfrom Gin 2/ 37 37 38 38 61 61
Value of 1000 kgcotton seed 149 118 252 205 456 375
Value of yieldfrom 1000 kgseed cotton 74 59 1511/ 123 274 225
1/ 600 kg per 1000 kg seed cotton for economic costing includes 100 kg forreplanting.
2/ 300 km Accra to Kumasi at 0.125 tonne/km. F.E. 53%, L.C. 26%, taxes andduties 21%.
Basis: World Bank forecast prices c.i.f. Europe for saleable seed.

- Financial & Economic Costs per hour of Tractor, Implements, Combine, Crawler Tractor & Truck
Unit Tractor Disc Disc Seed-drill Combine Trailer Crawler Tractor CAT D7 TruckPlough Harrow with Front-mounted '777n
clearing Rake(65 hp) (4 fur- (7' (with (12')
row) offset) fertilizer)
I'rice 1/ e 14,300 5,650 5,650 4,600 45,000 3,500 11/ 121,300 2 4000 /Economic Life yeara (hrslyear) 3(1,000)1 3(4C0) 3(200) 10(80) 5(400) 10(500) 5,000 hrc 4(50,000 km)Depreciation 16/ 0 4.29 4.23 8.46 5.17 20.25 .63 21.83 .10800Interest (12%) 10/ e .31 .31 .61 0.38 1.48 .05 1.60 .00792Insureanc 12)1 9/ 0 .1.11 .22 .13 .51 .02 0.55 .00270
Total CapitaL (FE 75%) 4.71 4.65 9.30 5.68 22.24 .70 23.98 (907. F.E.) .11862 (60% F.E.)
Operating:
Fuel 3/ 8/ 3.0 - - _ 2.50 - 8.00 .0625 /Engine, Transmission oil 6Crease 14/ e .30 - - - .25 - 0.80 .0060
Maiatenance. Repair Spareparts 6/ e 1.85 1.41 2.82 5.75 14.6 .70 19.65 .718 15/
Operator Wages 7/(FEO%) 1.08 - .*34 1.08 .34 1.80 .0540Total Operating 6.09 1.41 2.82 6.09 18.43 1.04 30.25 .19430
Financial Costs per llour ¢ 10.80 6.06 12.12 11.77 40.67 1.74 54.23 0.31292 0/kmEconomic cost per homir (¢ 1.73 - $1.00) 0 13.68 8.22 16.45 15.62 53.73 2.21 72.02 0.33116 0 kmEconomic cost per hour (4 3 - $1) 21.51 12.99 25.99 24.11 83.98 3.26 115.99 0.51337 ¢ kD
1/ an of Farch,1977, shop floor Accra.
2/ 2.57. of depreciation.3/ 3 gal/ hr at l.-gal for tractor: 2.5 gal/hr for combine: 8 gals/hr D74/ 1 engine oil change per 100 hours of work at 2 gal at 0 S-35/gal6/ 137. of tractor 6 trailer purchase price per year; 107. of implement purchase price per year7/ 0 90. -/monthf/ FE 75%. Taxes & duties 25%791 FE 60%10/ original cost & scrap value x 12% H3
2 x usage
I1/ FE - 50% F.12/ Incl. 40% duty/ M 6
i3/ 16 kiln/zal v14/ 10% of ue costs, FE 75% taxes 6 duties 25%7
1,/ Includes .0562/kilometers for tyres.16/ Assumiag 10% scrap value

APPENDIXTable 8
FORECAST FARMKATE PRICE - HUSK/RICE - IMPORT SUBSTITUTION
(CONSTANT 1977 0 PER 1000 Kg)
FINANCIAL ECONOMIC
US$1- ¢ 1.15 US$1 - ¢ 1.73 US$1- ¢ 31977 1980 1977 1980 1977 1980
FOB 231 271Freight 60 60CIF Temna US $ 291 331M equivalent 335 381 503 573 873 993Landing Port charges 12 12 12 12 12 12Value landed 347 393 515 585 885 1005Transport from Port 2/8/ 81 81 85 85 133 133Value Ex mill 266 312 430 500 752 872Cost of Rice bags 3/ 20 20 28 -28 40 40Paddy equivalent 41 160 190 261 307 463 541Milling Costs 55 50 77 70 126 114Handling & transport 10 10 10 10 13 13Paddy Bags 12 12 17 17 28 28Losses 6/ 2 2 3 4 6 8Value farmgate 81 116 154 206 290 378
1/ Basis: IBRD forecast price for milled Thai rice(25%- 30% broken)2/ Tema to Tamale 650 kms at ¢ .125 tonne/km.31 Cost of Rice bag ¢ 1.00 each : 85% F.E.4/ Basis: White rice recovery rate 65%5/ 85% F.E.61 Basis 20% infield harvested weight71 80% F.E. 20% L.C.8/ F.E. 53%, L.C. 26%, taxes & duties 21%.
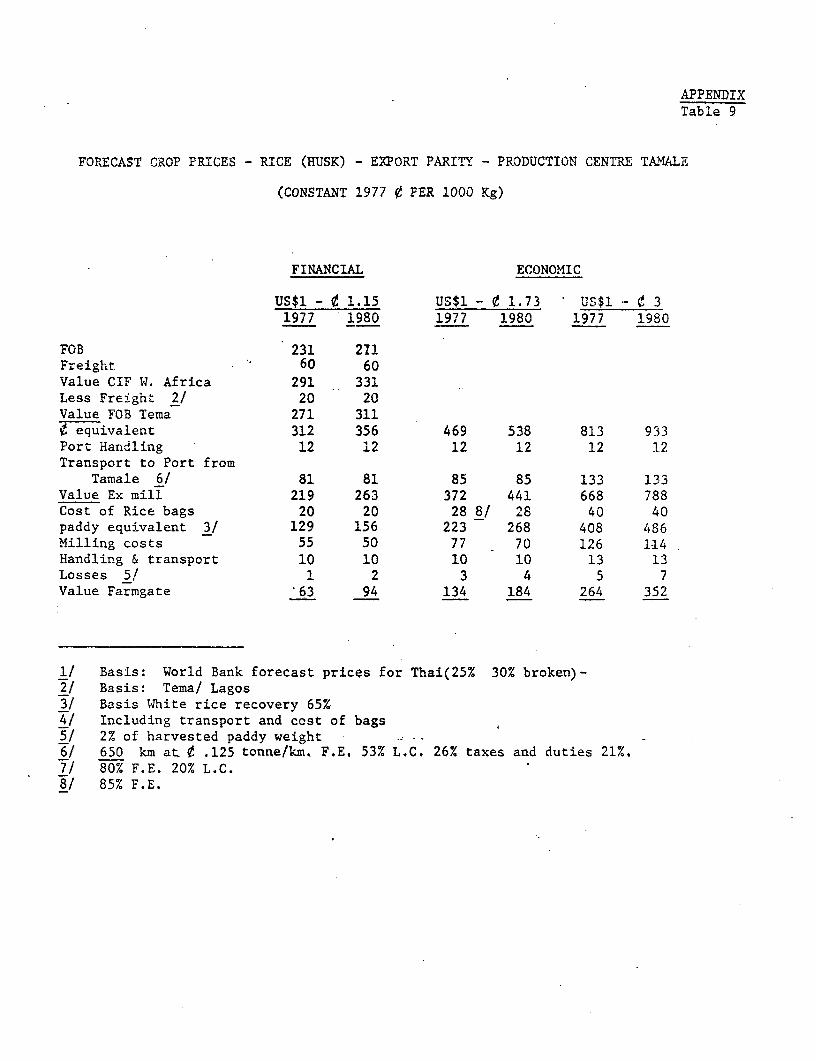
APPENDIXTable 9
FORECAST CROP PRICES - RICE (HUSK) - EXPORT PARITY - PRODUCTION CENTRE TAMALE
(CONSTANT 1977 ¢ PER 1000 Kg)
FINANCIAL ECONOMIC
US$1 - 1.15 US$1- 1.73 *US$1- 31977 1980 1977 1980 1977 1980
FOB 231 271Freight 60 60Value CIF W. Africa 291 331Less Freight 2/ 20 20Value FOB Tema 271 3110 equivalent 312 356 469 538 813 933Port Handling 12 12 12 12 12 12Transport to Port from
Tamale 6/ 81 81 85 85 133 13.3Value Ex mill 219 263 372 441 668 788Cost of Rice bags 20 20 28 8/ 28 40 40paddy equivalent 3/ 129 156 223 268 408 486Milling costs 55 50 77 70 126 1-14Handling & transport 10 10 10 10 13 13Losses 5! 1 2 3 4 5 7Value Farmgate 63 94 134 184 264 352
1/ Basis: World Bank forecast prices for Thai(25% 30% broken)-21 Basis: Tema/ Lagos31 Basis White rice recovery 65%4/ Including transport and cost of bags5/ 2% of harvested paddy weight 6/ 650 km at, ¢ .125 tonne/km. F.E, 53% L.C. 26% taxes and duties 21%,7/ 80% F.E. 20% L.C.81 85% F.E.

APPENDIXTable 10
FORECAST FARMGATE PRICES - MAIZE - (IMPORTSUBSTITUTION) - MECHANIZED PRODUCTION AT EJURA
(CONSTANT 1977 ¢ PER 1000 Kg)
FINANCIAL ECONOMIC
US$1 - 1.15 USS1 - ¢1.73 US$1 - 0 31977 1980 1977 1980 1977 1980
FOB U.S. Gulf U.S. $ 1/ 120 126Freight, Insurance 2/ 35 35CIF Tema US $ 155 1610 equivalent 178 185 268 279 465 483Landing, Port charges 27 27 27 27 27 27Value Landed 205 212 295 306 492 510Transport from Tema. to Accra .2 2 2 2 3 3
Value Wholesale 203 210 294 304 489 507Transport from Ejura
main producing centre 4/ 44 44 46 46 72 72Primary Marketing 5/ 18 18 18 18 18 18Transport 3 3 3 3 5 5Losses 6/ 21 22 34 36 59 62
Value Farmgate 117 123 193 201 335 350
1/ Basis World Bank forecast prices (Nov. 1976) for No2 U.S. Yellow Cover. FoB Gulf Ports2f Basis:Liner terms - data Ghana Supply Commission
4/ Basis: 350 Km at d 0.125 per tonne/km
5/ Includes intermediarv margiins and assembly, cost of bags (¢ / bag)6/ Handling and storage losses at 15% of infield--harvested weight (at 1L% of moisture content)7/ F.E. Cost 53% Local Cost 26%, taxes & duties 21%

APPE N-D TTable il
FORECAST Fi.&RGATE PRICES - MATZE - E_PORT PAR'1Y = - MCGHANIEED PRODUCTION
(Costant 19;/'7 er 100C kgt,)
FINANCIAL ECONOMIC
US$1 -! 1.73 US$1 - ¢31977 1980 1977 1980 1977 19SO
FCOB U.S. Gulf (US$) 1/ 120 126Fi eight & Insuranice 2/ 35 35C.L-, Lagos (US$) 155 16'
Freight to Lagos (TJSU) 10 100 equivalent 167 174 251 261 435 453Stevedoring & port-dues 12 12 12 12 12 12
FOB value Temna 155 162 239 249 4;23 4417rcansporL from Ejura 2/ 144 144 46 6/ 46 72 72P-.iinary marketing 18 18 18 18 18 18rosses at assembly 4/ 2 3 4 7 7Trans?orc to Ejura 3 3 3 3 5 5Farm losses 5/ 13 14 25 27 48 51Value Farmgate 75 81 144 151 273 288
1/ Basis. World Bank forecast prices (Nov. 76) for No 2 U.S. Yellow Corn FOB Gulf ports2/ Basis: Liner terms - data Ghana Supply Commission3/ 350 km at ¢ .125 tonne/km.41 2% of wholesale value5/ Handling and storage losses at 15% of in field harvested weight (at 14, moisture content)6/ F.E. Cost - 53% L.C. - 26% of taxes & duties 21%

APPENDIXTable 12
FORECAST FARMGATE PRICES - COTTON - (IMPORT SUBSTITUTION)
(Constant 1977 0 per 1000 kg)
FINANCIAL ECONOMIC
US$1 1.15 US$1 1.73 US$1 - 31977 1980 1977 1980 1977 1980
CIF Accra U.S. $ 1/ 1695 1545¢ equivalent 1949 1777 2932 2673 5085 4635Port Handling 20 20 20 20 20 20Transport to Mill 2 2 2 3 3Price at Mill 1971 i ,9 2954 2695 5062 4612Transport from Gin 6/ 37 37 38 38 61 -61Ginning Cost 2/ 193 120 270 168 441 274per ton Seed Cotton 3/ 662. 624 1005 946 1734 1625
Transport & handling 4/ 22 22 23 23 35 35Value of Seed 5/ 74 59 151 123 274 225Value of Seed Cotton at
Farmgate 714 661 1133 1046 1972 1815
1/ Basis lWorld Bank forecast prices for Mexican strict middling 1-1/16" Cif Liverpool.freight (US $ 25)
2/ Basis: 1975-1976 Season Cost (estimated) reducingwith introduction ofimproved ginning. FE - 80% LC - 20%
3/ 38% recovery rate.4/ 150 Kms at ¢ .143 tonne/kns & ¢ 1. handling.5/ See Table 6.6/ 300 km. Accra to Kumasi at ¢ .125 tonne(km , FE. 53% L,C, 26% Taxes and duties 21%

APPENDIXTable. 13
ESTIMATED FERTILIZER PRICES/NORTHERN REGION
(Constant 1977 e per 1000 '.g)
IUW IA,L ECONOMIC
_.JS$E- e 1.1_ 31'I - £ 1.73 US$1 - i 3
l977 198 1977 1980 19?7 1980
.-_:L5:15
CI)' 7.'.& US $ 1t4l 148t Eg_ivalent 162 170 244 256 423 444Landing chaiges 12 12 12 12 12 12Transpott 2,' 81 81 85 85 133 133Value at "tore 255 263 341 353 568 589Distribctloa Cost 3/ 5l 53 68 71 114 118Farf.mAte Price 306 316 409 424 682 707
Officisl Ilrice 130
.marnium Sulphate
CIF Tema US $ 134 146. aquI.,a7.ent 154 168 232 253 402 438Landing charges 12 12 12 3.2 12 12Transport 2/ 81 81 85 85 13 133Value at Store 247 261 329 350 547 383Distribution Cost 3/ 49 264 66 70 109 1.17Farmgate Price - 296 313 395 420 656 700
Official Price 100
ChN
CIF Tema US S 146 153¢ equivalent 168 176 252 265 438 459Landing Charges 12 12 12 12 12 12Transport 81 81 85 85 133 133Value at Store 261 269 349 362 583 604Distribution Cost 52 54 70 72 117 121Faragate Price 313 323 419 434 700 725
Official Price 110
TSP
C2F Tema US$ - 157 184 --
$ equivalent 181 212 272 318 471 552Landing charges 12 12 ±2 12 ±2 12Transport 81 81 85 85 133 133Value at Store 274 305 369 415 616 697Distribution Cost 55 61 74 83 123 139Farmgate Price 329 336 443 498 739 836
Official Price 140
SSP
CIF Tema USs 94 110( equivalent 108 126 163 190 282 330Landing charges 12 12 12 12 12 12Transport 81 81 85 85 133 133Value at Store 201 219 260 287 427 475Distribution Cost 40 44 52 57 85 95Farrogate Price 241 263 312 344 512 570
Official Price 110
1/ Basis 1977 actual contracts (bagged). 2980 prices adjusted in accordance with Bank projections./ Tera to Tam.le 650 km. at 0 .125 tonne/km. F.E. 53Z L.C. 261 Taxes and duties 211.
20" of wholesale price.
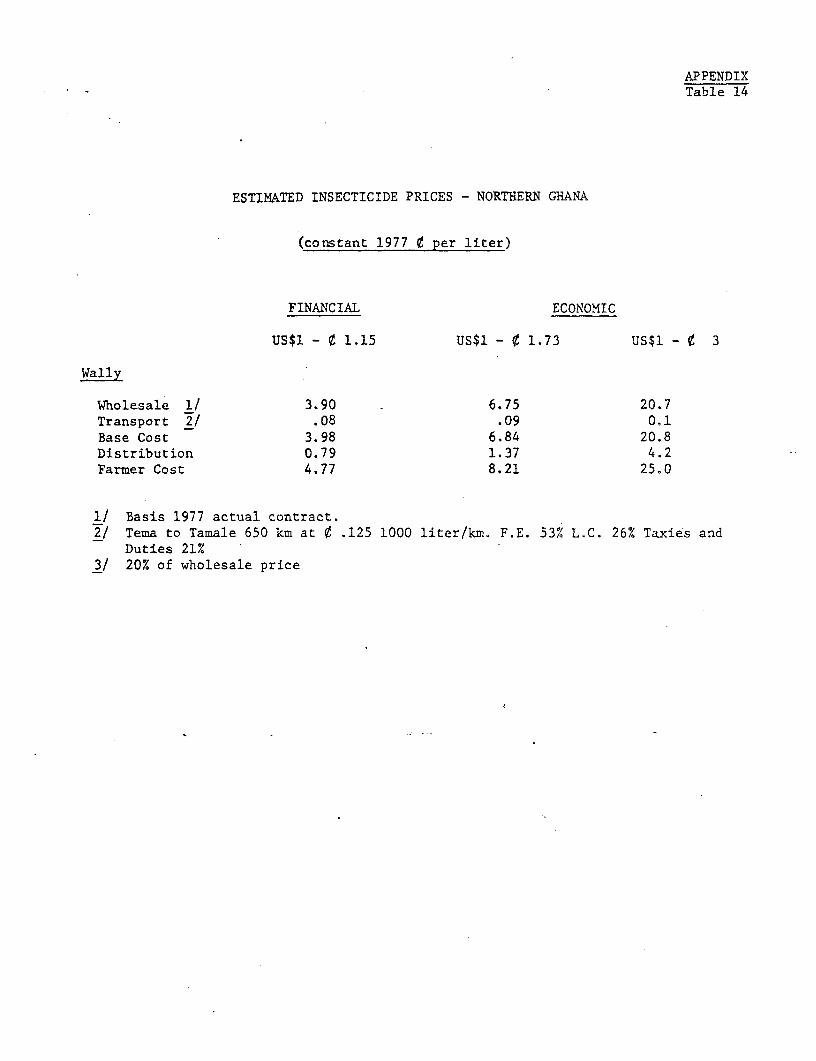
APPENDIXTable 14
ESTIMATED INSECTICIDE PRICES - NORTHERN GHANA
(constant 1977 ¢ per liter)
FINANCIAL ECONOMIC
US$1 - ¢ 1.15 US$1 - ¢ 1.73 US$1 - e 3
Wally
Wholesale 1/ 3.90 6.75 20.7Transport 2/ .08 .09 0.1Base Cost 3.98 6.84 20.8Distribution 0.79 1.37 4.2Farmer Cost 4.77 8.21 25.0
1/ Basis 1977 actual contract.2/ Tema to Tamale 650 km at ¢ .125 1000 liter/km. F.E. 53% L.C. 26% Taxies and
Duties 21%3/ 20% of wholesale price

CO110AtR7vv OF IFCINCLCL .9
lA1ZE (Ip.re -bst-tuto-) COTTMN I GROU3DdTSN PICE llepont substitution,
Area rEadCuIltVLti Od nechamcal REvd r,,tuvu),nv On Nrrha,trnrl |lla tultrnaLrtn o Nerd Cultivation OY Oethanr-al
No-the-n h.,a Tradititn I improved Advancdd C 1C tite Cultivation T-adttion-l plred Aavar.ed C,lt-t tCnU Cu7 ivilion t Tri, Impro.ved Adv2nred Crliv. Tradit. Inr--ed Advaned Ii. CuLI .vti t
:~~~ I.M, A,-g~~~~~~~verr no-e-v A-. YI Y- Ipr Ard 2Av7eerre0 I4e62n9rveL drleattta 1¢ 18i.1NIJNN.001
Net lecomelha 1/ 90.1 100.8 140.8 138.3 1197.51 186.61 174.5 2718. '31.2 4131 qp.6) 23.5 157,1 177.1 257.3 219.8 94.7 107.4 162.9 155.4 318.4) 1269.17
Nat eetvreleaRm day fartly labce 1.2 I.1 1.3 1.9 Iag veg 1.7 2.1 -. 3.7 teA 1.O I 1.6 1.7 2.0 2.6 0.9 0.9 1.2 l.t flo teg
Neonreeto llh 1. 147N.2 17h.0 264.0 256.5 O ]58.9o fft.Z 2;,. 46..1 713.6 703,1 ;2.7 z38, 223.8 273.8 400.0 392.5 168.1 210.2 311.3 303.6 (748.4) (225.2)
let leeree/ha 1/ 167.7 iotA dOuR 156.5 259.9) (ANlI 27e.1 stuN 713.6 756.0 12.7 238.5 223.I786 2 3 4.
Net ceeter/ncmt day fa-ita lenb. 2.n v .G 1.4 3.5 ret erg 2.8 0.4 4.7 6.2 l.t 16.6 2.5 2.1 5.2 I.C 1.6 1.7 2.2 3.1 neg neg
Net. tnenetr 15S1 256.5 314.3 468.7 476.2 132.5) 47.9 479.2 80923 L,245,8 1,238.3 171.9 480.5 N 156.5 473.8 693.1 685.6 308.5 395.8 67. 663.8 138.27 7195.4)
N.e rerteree day family Iabre 3.4 3.0 4.2 6.5 teA ot / .. 8 N,N t.3 11.17 8.2 Z1.3 5.0 4.N N.N 7. 2.9 3.3 4.8 6.t net nee
2! Evoltdtor fan, ly labor.27 Erport pterity assimpelot: net intone/h 7>747 .9i: net re4ten!fentmly mNO day oogae,nr.


ANNEX IXPage 1
MANPOWER AND THE AGRICULTURAL LABOR FORCE
Manpower
1. The present staffing position of the Ministry of Agriculture is asfollows:-
Table 1: STAFFING OF MINISTRY OF AGRICULTURE
Level
Senior Staff 330Intermediate 704Lower 2,749
Total 3,783
Source: Appendix Table 1.
MOA has the considerable difficulty, as distinct from the Boards and Corpora-tions operating under its aegis, in attracting qualified, competent and highcalibre staff. The Public Service Commission (PSC) advertise and recruit MOAstaff, as for other Government Ministries. Wage rates are lower than offeredby parastatal Boards and Corporations and by the private sector which, unlikePSC, offer employees a housing allowance of 15-20 percent of base income. Nopost allowance is given to posting to out-of-the-way locations which puts MOAat a disadvantage, even with other Ministries. If MOA is to play a centralservice and planning function then its ability to recruit staff has to be onan equal basis with other parastatal agencies serving agriculture.
2. Ministry of Cocoa Affairs central staff number only 31. Its CocoaProduction Department Staff (OPD) is as follows:-
Table 2: STAFFING OF COCOA PRODUCTION DIVISION
Approved At Post 1977 %
Senior & Middle level staff 320 291 91%Lower level permanent staff 8,230 3,786 46%Daily rated staff includingcasual labor 28,728 1/ 31,777 111%
Total 37,228 35,858 96%
1/ Casual laborers hired for four months prorated on annual basis.

ANNEX IXPage 2
Since the Department until recently was under the control of the CMB, itoffers posting allowances and is able to attract large numbers of staff.However, the quality of staff is poor: many appointments are of a poli-tical nature, made during the Nkrumah regime in the early 1960s; they arenow being steadily phased out. Out of a total staff force of nearly 36,000,MCA is reported to have less than 10 university graduates.
Agricultural Hired Labor
3. The availability of agricultural hired labor is extremely diffi-cult to assess due to a dearth of recent data or relevant studies. Thereare indications that, in many areas, particularly in cocoa, and on some ofthe partially mechanized schemes in the Brong Ahafo and Northern Regions,labor is critically scarce. This is one justification for Government'sdirect involvement and encouragement of large-scale farm enterprises employ-ing permanent laborers. (See Annex VIII.)
4. There are four kinds of hired laborer and market conditions foreach are different. They are:-
(i) Caretaker or share crop laborers who are employed incocoa sector as farm managers who receive normallyone third of the farms' revenue and some fallow landfor food crop production in return for their ser-
vices.
(ii) Migrants who are employed full time but are notcaretakers or share croppers.
(iii) Seasonal labor who are employed on a seasonalbasis and paid at the end of their contract.Commonly laborers from the North move South tofell and clear bush before returning home aroundApril to cultivate their own farms.
(iv) Casual laborers who are hired per day or on apiece rate basis.
5. Estimates of the total and agricultural labor force are givenin Table 2 (Appendix), with assumptions in an attached note, indicating anagricultural labor force in 1975 of 2.7 million increasing by 2 percent perannum, at a lower rate that the total labor force is expected to grow. Thereare no estimates of the proportion of the agricultural labor force that arehired laborers of one type or another. However, the Agricultural SampleCensus found that 63 percent of farmers hire labor, which suggests that theuse of hired labor is common. The proportion hiring laborers increases withfarm size and specialization in cash crop production (see Appendix Table 3).

ANNEX IXPage 3
5. The type of labor varies by crop and region. A study on the sea-sonality of employment for agricultural labor 1/ enquired into the occupa-tion and origin of laborers in four locations. In the Northern Region over50 percent were local housewives and petty traders helping with rice harvesting,while in the two cocoa areas surveyed there were no laborers of this type.Instead 30 percent were caretakers, 20 percent were full time migrants, 20percent were seasonal migrants and 10 percent were local full time laborers.In these areas arduous farm operations, such as felling and clearing virgin orthick secondary forests, are reserved for full time migrant laborers who arereported to work hard and are willing to undertake difficult tasks. Full timelocal laborers tend to be young people, "school leavers," who are alwayslooking for an opportunity to move out of agriculture into the urban sector.These are found in more populated areas and are reported to work less hardthan full time migrant laborers and to object to undertaking certain farmoperations. This is reflected in the high voluntary unemployment rate (73percent) of the 15-24 age group. 2/
6. The cocoa sector employs the largest proportion of hired laborers.From the outset, at the end of the nineteenth century, the sector has reliedon hired labor, much of it coming from Northern Ghana and neighboring coun-tries, such as Upper Volta, Togo and Mali. Most of these have little school-ing and over time the youth in Southern Ghana, who has been relatively welleducated for the past twenty years, has come to regard work in the cocoasector as contemptible and beneath him. This has contributed to the sec-tor's present problems (see Annex II) and ensure a continued reliance onmigrant labor in the cocoa sector. Estimates of the number of persons em-ployed in the cocoa sector in 1970 were in the region of 300,000 3/ of whom45 percent were aliens. However, parallel with Ghana's continuing economicdecline relative to Ivory Coast and Nigeria, aliens, and increasingly Ghanaianlaborers, have been seeking and obtaining employment outside Ghana. TheAliens Compliance Order of November 1969 exacerbated this situation by ineffect expelling a large number of aliens resident in Ghana. There areindications that Ghanaian labor, principally from the North, had filled 65percent of the 84,000 vacancies created by the order within one year. Thisshows a fair degree of spontaneous labor mobility.
1/ Rourke B.E. & F.A. Obeng. Seasonality in the Employment of Casual Agri-cultural Labor in Ghana. Research Report No. 1. Dept. of Agric. Econ.& Farm Management University of Ghana, Legon. 1973.
2/ Addo N.O. Employment and Labor Supply on Ghana's Cocoa Farms in thePre- and Post-Aliens Compliance Order Era. The Economic Bulletin.1972.
3/ Ew usi, Kodwo. The Size of the Labor Force and the Structure of Employ-ment in Ghana, I.S.S.E.R., 1975.

ANNEX IXPage 4
7. The ability of the cocoa farmer to offer sufficient inducement to
attract labor from other parts of the country has been eroded by his decliningreal income from cocoa (see Annex VII) and the development of the rice sectorin the Northern Region in an area of relatively low population density. Indi-cations are that the cocoa farmer is having considerable difficulty in findingreplacements for caretakers; that the supply of full time migrants, with devel-opments in the North, is drying up; and that casual labor now demands ¢3 for
a three or four hour work day plus two meals and occasionally even transportto the farm. 1/ This is equivalent to ¢l/hour. The caretaker, meanwhile,continues to receive a fixed proportion of a crop whose real value is fall-ing. However, it is a measure of the apparent overall hired labor shortagethat mechanized rice and cotton schemes are experiencing considerable diffi-culty in finding adequate supplies of casual labor. It is estimated thatit is costing the large-scale rice farmer between ¢16.67 and 025.45 per hec-tare simply to move labor to and from the rice fields (see Annex VIII Table3), in an effort to attract more labor.
8. Data on laborers' incomes is non-existent. A study on rural wagerates 2/ conducted in 1970 found the actual remuneration of casual laborersto be very similar to the minimum wage prevailing in urban centers, but acomparison of wage rates cannot be confused with a comparison of incomes.
9. In the absence of information on numbers of laborers and on thecomparative advantages of paid employment in the agricultural and urbansectors it is virtually impossible to forecast the degree to which produc-tion increases required to feed the nation by 1985, will be constrainedby lack of available labor. However, in a situation where areas of laborsurplus and labor shortage coexist, the general strategy should combinemeasures aimed at increasing labor mobility and at the adoption of tech-nologies that solve specific labor bottlenecks. With respect to mobility,labor in Ghana has shown a high propensity to move to job opportunitiesand a certain amount of spontaneous migration is likely to occur.
Training
10. MOA Staff Training. The present output of five agricultural col-leges of 350 future Technical Officers annually is planned to be doubledin the coming years. Numerically, this output appears sufficient to coverfuture project needs. However, no provision for retraining and upgradinghas been made, an essential precondition for requiring higher standards ofextension to familiarize farmers with improved production systems.
1/ With effect from July 1, 1977, the minimum wage was raised from ¢2 to ¢4per day.
2/ Rourke B.E. and S.K. Sakyi - Gyinae. Agricultural and Urban Wage Ratesin Ghana. The Economic Bulletin of Ghana, Vol. 2, No. 1, 1972.

ANNEX IXPage 5
11. Farmers Training. The country has five Farmn Tnstitutes with acapacity for 350 students to be trained in annual courses. The courses
are designed to instruct young farmers in practical farming, and candidateshave to be sponsored by existing farms to ensure productive employnent aftercompletion of the course. In practice, however, this selection process nasproved to be insufficient, indicated bv a high rate of school leavers seek--ing e.lpioyment outside farming. There is nc follcw-up progra-m: to ensurethat school leavers are reintegrated into practica'L farming enabling theTr.to aapplv their newly gained know'Ledge successfuily. On the other hand,Lhere is a growing need for improved manager1a]. capacity in mechanizedstate and private farming. The Farm Institutes appear as the suitable toolto satisfy this need. An inventory of future training requirements forlarge-scale farming would help to access required capacity and permit thereorientation of training programs to produce farm managers. This againwould necessitate an effort to upgrade teachers knowledge of applied mod-ern farming practices. The Farm Institutes could thus play a leading rolein raising the standards of mechanized farming in Ghana.

APPENDIX
NOTE ON POPULATION PROJECTIONS
1. Future population projections have been made from the published1970 census figures and assume an overall annual growth rate of 2.7 percentfor 1970-19,5, 3.0 percent thereafter. In the National Development Plan,1975-1980, 2.7 percent is used throughout. Estimates of regional popula-tions reflect observed rates of change between 1960 and 1970. The resultantratios of regional to total population are therefore a simple extrapolationof intercensal changes adjusted proportionally as necessary to sum to unity.
2. 1970 urban population accounted for only 28.9 percent of totalpopulation, reflecting an annual growth of about 4.8 percent since 1960.This rate is believed to be increasing sharply and figures of 5.3 percentand 5.5 percent have been used through 1975 and 1985 respectively.
3. Crude activity rates have been established regionally and reflectthe proportion of economically active persons (employed + unemployed) in theregional populations. Future Labor Force estimates assume that crude activitywill remain constant at 1970 levels (adjusted for Upper Northern Regions toallow for seasonality). Agricultural Labor Force has been estimated on theassumption that the rate of change observed between 1960 and 1970 will con-tinue, i.e. the Agricultural Labor Force is a declining proportion of TotalLabor Force.
4. The Agricultural Population has been calculated on the assumptionthat its proportion in the total population is equal to the proportion ofagricultural Labor Force in Total Labor Force.
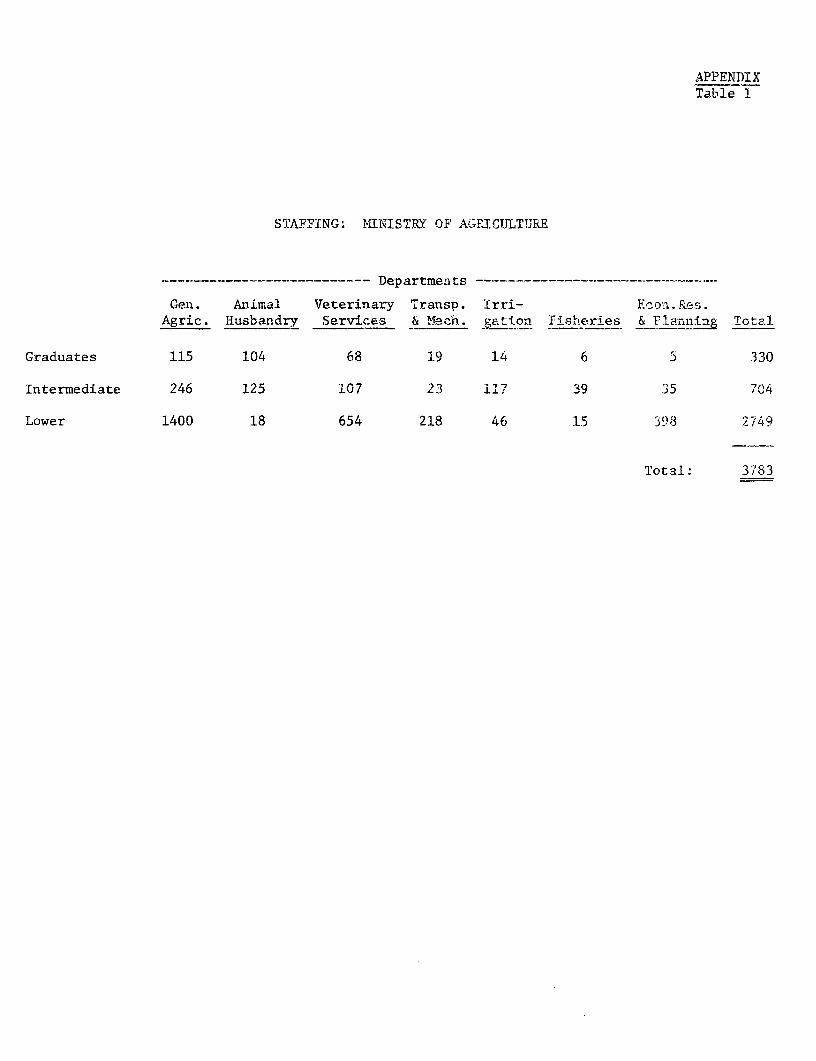
APPENDIXTable 1
STAFFING: bINISTRY OF AFICTULTTjRE
…----------------------- Departments-
Geri. Animal Veterinary Transp. 'Lrri- Ecs.n;Res.Agric. Husbandry Services & Mecn. gation F;istheries & Plann!X Total
Graduates 115 104 68 1.9 14 6 5 330
Intermediate 246 125 107 23 il7 39 35 704
Lower 1400 18 654 218 46 15 398 2749
Total: 3783

TOTAL AND AGRICULTURAL LABOR FORCE 1970/85('000)
Rates of Growth
Re g Ion 1970 1973 1975 1980 1985 1970-75 1975-85
Western 770 825 862 973 1,092 2.3 2.4
Total Labor Force 331 355 371 418 470 2.3 2.4
Agricultural Labor Force 159 191 198 210 228 1.6 1.4
Central 890 941 972 1,075 1,178 1.8 1.9
Total Labor Force 371 392 405 448 491 1.8 1.9
Agricultural Labor Force 202 247 253 267 284 1.2 1.2
Greater Accra 851 1,009 1,128 1,518 2,042 5.8 6.1
Total Labor Force 366 434 485 653 879 5.8 6.1
Agricultural Labor Force 35 38 42 47 58 3.7 3.3
Eastern 1,262 1,324 1,369 1,492 1,620 1.6 1.7
Total Labor Force 5(2 52,527 545 594 645 1.6 1.7
Agricultural Labor Force 282 295 305 324 347 1.4 1.3
Volta 94;7 1,012 1,056 1,186 1,325 2.2 2.3
Total Labor Force 377 403 420 472 527 2.2 2.3
Agricultural Labor Force 206 240 250 275 303 1.9 2.0
Ashanti 1,482 1,624 1,725 2,032 2,383 3.1 3.3
Total Labor Force 585 641 680 801 940 3.1 3.3
Agricultural Labor Force 320 369 389 442 508 2.6 2,7
Brong Ahafo 766 833 881 1,033 1,205 2.9 3.2
Total Labor Force 314 341 361 423 494 2.9 3.2
Agricultural Labor Force 230 259 274 310 354 2.4 2.6
Northern 728 &(03 857 1,015 1,197 3.3 3.4
Total Labor Force 273 0,(2 322 381 450 3.3 3.4
Agricultural Labor Force 219 229 244 279 323 3.0 2.9
Upper 863 901 929 1,013 1,100 1.:5 1.7
Total Labor Force 341 356 368 401 435 1.5 1.7 b >J
Agricultural I.abor Force 242 249 256 268 284 1.0 1.0 o(D
Ghana 8,559 9,272 9,779 11,337 13,142 2.7 3.0
Total Labor Force 3,460 3,75]. 3,957 4,591 5,331 2.7 3.0
Agricultural Labor Force 2,007 2,117 2.211 2.422 2.689 2.0 2.0

APPENDIXTable 3
PERCENTAGE OF HOLDERS EMPLOYING LABOURBY TYPE OF HOLDING BY REGIONS
Region Percentages of Holders Employing LabourSubsistence Mainly MainlyOnly Subsistence Sale Total
Western 62 73 74 73Central 44 62 79 73Eastern 50 60 80 73Volta 35 63 65 60Ashanti 68 75 90 87Brong-Ahafo 46 68 79 74Northern 15 19 18Upper 20 50 50 30
Total Ghana: 26 55 77 63
Source: Ghana Sample Census of Agriculture 1970, Vol.l.
PERCENTAGE OF HOLDERS EMPLOYING PERMANENT LABOURBY SIZE OF HOLDING BY REGIONS
Region Percentages of Holders Employing Labour with Holding Size0-2 acres 2-4 acres 4-6 acres 6-10 acres 10+acres Total
Western 61 67 77 76 89 73Central 64 72 80 89 92 73Eastern 50 69 72 85 92 73Volta 50 66 84 78 85 60Ashanti 74 83 86 81 96 87Brong-Ahafo 47 65 65 85 91 74Northern 7 5 16 15 33 18Upper 14 20 27 19 37 30
Total Ghana: 52 54 60 63 81 63
Source: Ghana Sample Census of Agriculture, 1970, Vol. I.
ANNEX XPage 1
AGRICULTURAL RESEARCH
1. Responsibility for agricultural research in Ghana is presentlydivided between the Council for Scientific and Industrial Research (CSIR),the National Council for Higher Education which controls the universities,the Ministry of Cocoa Affairs, and the Cotton Development Board. Until1962 the Ministry of Agriculture was responsible for agricultural researchin Ghana but with its reorganization in 1962 its research activities weretransferred to the Ghana Academy of Sciences which was later transformedinto the CSIR. As a governing body the CSIR has little influence and thefour agricultural research institutes under its mandate operate very muchin isolation from each other, as well as from the universities, and thereis little effective control. The role of the Ministry of Agriculture atpresent appears to be minimal though very recently they have reestablishedan Agricultural Research Advisory Committee, to report to the Commissionerof Agriculture. It is not clear what powers this committee will have.
2. Cotton research is under the auspices of the Cotton DevelopmentBoard, while cocoa research is carried out at the Cocoa Research Instituteof Ghana (CRIG) at Tafo, under the responsibility of the Ministry of CocoaAffairs.
University Research
3. The Universities of Legon, and of Science and Technology (UST) atKumasi, carry out soil and crop research in similar disciplines to the Soiland Crop Research Institutes on separate stations in Kpong and Kade, EasternRegion. The Kpong station has been successful in establishing recommendablecultural practices principally for irrigated sugar cane and rice. To copewith the needs of the area, it would need to supplement these programs withtrials under rainfed conditions. The Kade station carries out tree cropresearch other than oil palm, as well as research on foodcrops of the for-est zone. Some research on annual crops is undertaken at the universitiesthemselves covering typical crops of the region.
4. The Institute of Statistical, Social and Economic Research(I.S.S.E.R.) at the University of Legon, the Department of AgriculturalEconomics of Legon University, the Land Administration Research Centre atU.S.T., and the Social Studies Department of the Cape Coast University carryout on the only economic research related to agriculture in Ghana. WithinI.S.S.E.R. the Cocoa Research Unit works specifically on the economic prob-lems of the cocoa sector, while research on internal and external marketingis handled by the research department of the C.M.B.
CSIR Research
5. Five institutes under the CSIR carry out research in agriculture,namely the Crops Research Institute (CRI), Animal Research Institute, SoilResearch Institute (SRI), Food Research Institute and the Oil Palm ResearchInstitute (OPRI). The Crops and Soils Research Institutes were one institute

ANNEX XPage 2
till the middle 1960s when, following personality clashes, two separate in-stitutions were created. Since much of their work has common objectivesthere is much duplication between the two bodies and they fail even toshare such facilities as library services and vehicle workshops though theyare located only one hundred yards apart.
6. Soil Research Institute. SRI is grouped into 6 sections repre-senting the different work programs. General mapping and soil surveys forspecial projects constitute an important function. Work on soil fertilityis limited to detection of nutritional deficiency and fertilizer response.In microbiology, nitrification and decomposition questions are studied,while in soil chemistry, trials on availability of trace elements and nutri-ent fixation are carried out. The soil physics and soil conservation anderosion control sections do not function due to lack of professional staff.The SRI has a staff of some 400 people and runs on a budget of some 01.7million of which ¢0.8 million is capital expenditure.
7. Crops Research Institute. Equipped with 14 substations, the CRIundertakes a wide range of crop specific research encompassing most annual,bush, and tree-crops in Ghana. Depending on individual crops and prevailingproblems, experiments are concerned with breeding, varietal selection, adap-tation, cultural practices, fertilization, pest, and disease control. The11 sections of the Institute deal with exotic crops, sugar cane, plantpathology, entomology, plant physiology, plant breeding (sorghum, maize,legumes, fibres), agronomy (root crops, tobacco, cotton), weed science, asection working with the Commonwealth Institute for Biological Control,statistics, which is being taken over by the West Africa Rice Association(WARDA) in Liberia, and a publications and information section. Cooperativework is carried out with several research institutes of the ConsultativeGroup for International Agricultural Research, namely, CIMMYT, which issupplying maize material, with IITA on maize and legumes, and with WARDAon rice. There are possibilities that work on weed control will begin withICRISAT. CRI has a permanent staff of 1000 to 1100 of whom 30 are graduates.Its budget is in the order of 02.5 million per year of which 0.25 millionis capital expenditure.
8. Oilpalm Research Institute (OPRI), located at Kade, has recentlybeen created out of the oil palm section of CRI. Ongoing oil palm researchat the 1000 ha station at Kade covers plant breeding, seed production andgermination, fertilizer and spacing trials, insect and weed control measures,and nursery practices. Seed production is presently insufficient to satisfyGhana's needs and a consultant oil palm breeder, financed through IDA creditGH-531, is assessing the suitability of the plant materials produced by OPRIand is monitoring the breeding program.
Cotton Research
9. The research unit of the Cotton Development Board (CDB) is respon-sible for insecticide screening, variety testing, population trials, date ofplanting and spacing trials. Work began in this area in 1970 under an FAO
ANNEX XPage 3
project and a 3-man professional team continues this work with advice fromCFDT seconded staff. Variety testing terminated three years ago with thedeparture of the plant breeder and has not been reactivated.
Cocoa Research
10. Cocoa research is carried out at the Cocoa Research Institute ofGhana (CRIG) on disease and pests, development of vigorous early-bearing,high-yielding and disease resistant varieties, and on the by-products ofcocoa bean husks. Swollen shoot virus disease is the most serious virusaffecting cocoa production in Ghana but research efforts to develop a curehave so far proved abortive. The only method still of control is to cut outthe infected tree and trees surrounding it, and since 1952 an estimated 15million trees have been uprooted representing about 9000 hectares of cocoa."Black Pod" disease has been shown in recent surveys to affect virtually allof Ghanaian cocoa and is estimated to be reducing overall production by about20 percent. These are signs that the disease is on the increase, particularlyin the Volta Region. The disease can be controlled chemically but frequentand regular harvesting is considered a more economic method of control atpresent yield levels. Further research is required on more economic methodsof chemical control. Capsid resistance to Gammalin, the principal insecticideused for controlling capsids, has been demonstrated by the research institutefor the past decade. However, only in 1976 did Government begin to changeits spraying recommendation in favor of carbonates. This reflects the lackof influence the research institute has on overall cocoa policy.
11. Serious questions are now being raised about the benefits of thenew cocoa hybrids. Average yields from hybrids are now expected to be muchlower than originally projected, ranging from 550 kg to 650 kg per hectareas compared to the more optimistic estimates of 880 kg per hectare. However,it still appears to hold true that replanting old cocoa land is only possibleusing the new hybrids.
Research on Special Projects
12. Under the FAO Fertilizer Program, fertilizer and rotation trialson maize, cotton, cassava, groundnuts, and cowpeas in the Ashanti, Central,Volta, and Brong Ahafo Region are being carried out. This program, on-goingsince 1969, has provided valuable information on yield potential under goodmanagement as well as on suitable rotations. The trials were combined withdemonstration and extension efforts that have led to substantial increasesin fertilizer consumption, especially in the Central Region.
13. Under the Ghanaian/German Agricultural Development Project in theNorthern Region, a number of varietal adaptation, fertilizer response, herbi-cide application, and green manure application trials have been carried outon rice. The results indicate that under good management yields exceeding3 tons per ha can be obtained in a normal year.

ANNEX XPage 4
14. In the Eastern part of the Upper Region, a project to develop suit-able soil conservation measures for the maintenance of soil fertility andecological equilibrium in semi-arid areas is being carried out by an Americanuniversity in cooperation with SRI and CRI. This program has only recentlystarted.
Conclusions
15. Research on agricultural problems in Ghana is carried out by anumber of institutions and bodies without an overall co-ordinating body andwithout the formal involvement of MOA. Consequently, research is uncoordi-nated, duplicated, unrelated to priorities of the agricultural sector asset by the Ministry of Agriculture and therefore often irrelevant; researchstaff morale is low as a consequence and the research programs that do func-tion are poorly directed and equipped. Ghana cannot afford such a situationand there is an immediate need to reorient and restructure the research pro-gram to work on the short and long-term requirements of the agricultural sec-tor. The following points should be considered specifically:
(i) the removal of all duplication of effort andfacilities, in particular the duplication betweenthe universities and the CSIR network. This wouldinvolve setting up a single organization to monitorand control all agricultural research in Ghana;
(ii) the research program should reflect the prioritiesof the agricultural sector as seen by the Ministry ofAgriculture, the Ministry of Cocoa Affairs and theMinistry of Economic Planning;
(iii) it is important that the social and economic frame-work within which the bulk of agricultural produc-tion takes place in Ghana, namely in the smallholdersector, be taken into account in the agriculturalresearch program;
(iv) the need to strengthen certain short-term programs,especially the cotton research program which has nocapacity for variety testing;
(v) the need for closer links with the research effortsof other West African countries. Nigeria, whichfaces many of the same problems in her agriculturalsector as Ghana, spends at least six times moreon agricultural research. Equally for cotton, someof the French speaking West African countries areachieving more on farmers' fields than Ghana isachieving on its research stations;

ANNEX XPage 5
(vi) the need for research programs to consider cropassociations and systems of farming as practicedby the small farmer, as opposed to research whichis directed at single crop activities. This shouldtake into acccount the problems of long term soilfertility maintenance; and
(vii) the need for proper and timely dissemination ofresearch results.
Recommendations
18. This reorientation and restructuring could be achieved through Bankfinancing to provide the necessary technical assistance to design and implementsuch a reorganization, and to provide additional equipment and spare parts whereneeded. However any such effort, whether Bank assisted or not, would be put atrisk by the strong personality clashes that underly and indeed have led to thepresent situation.

ANNEX XI: AGRICULTURAL PROCESSING
Table of Contents
Paragraph
Review of Processing Activities 1- 6
Role of Small-Scale Producers 7 - 10
Prospects and Policies 11 - 33
Appendix 1- 93
Vegetable oils 2- 38Fruits and Vegetables 39 - 48Starchy Foods 49 - 57Rice Milling 58 - 70Cotton 71 - 85Other Crops 86 - 93


ANNEX XIPage 1
AGRICULTURAL PROCESSING
Review of Processing Activities
1. Following independence, the government of Ghana embarked upona program of establishing and promoting several types of processingactivities. Some of these were aimed primarily at replacing imports(e.g. tomato and citrus processing) while others were established tosupplement and improve upon traditional processing methods with a viewto ultimately competing in the export market.
2. During the 1960's investments were made for production ofcanned fruits and vegetables, vegetable oil, canned fish, cocoa-butter,flour, rice, confectionary products and milk powder. No exact figureis available for the total sum invested but it is estimated that thisamounted to about 120 million cedis. 1/ In its investments, governmentspent about 8 million cedis for three fruit and vegetable processingmills and about 6 million cedis were spent in establishing 4 oil mills.Private investment was about 55.1 million cedis.
3. A period of adjustment followed the initial spurt of activitiesof the early sixties. In this adjustment period many processing plantshad to close or scale down their operations because of the unavailabilityof inputs, lack of spare parts to maintain their equipment, lack offoreign exchange to import raw material to supplement domestic inputs,etc. In some government operations (e.g. its oilmill) the idle plantswere disassembled and used for spare parts. Others (e.g. its tomatoplant at Pwalagu) were temporarily closed down, and some (e.g. its ricemilling equipment) were kept in storage for later installation.
4. Although large investments were made in this sector, imports ofprocessed products grew from US$34 million in 1965 to about US$57 mil-lion in 1970, and levelled off at about US$60 million in 1975 as aresult of government actions to curb such imports. At the same time,as the following table shows, almost all of the processing plants wereoperating well below capacity.
Table 1: CAPACITY UTILIZATION (IN PERCENT)
1966 1970 1971 1972 1973 1974
Oil Palm 55 20 35 37 42 43Coconut 45 11 16 26 24 26Pineapples NA 31 36 43 43 43Tomatoes NA 8 12 12 25 29Lime 60 100 100 100 100 100
Source: Ghana Five-Year Development Plan, 1975-1980, p. 9.
1/ UNDP, Ghana's Food Industries 1968, p. 3.

AKiNEX XIPage 2
5. In its 1975-1980 five-year plan, the Ghana Government acknowledgesthe fact that poor planning, weak institutional support and other such fac-tors contributed to the difficulties which processing firms face today. Ithas therefore decided to place more emphasis upon these areas and to expanddomestic output through policies aimed at increasing the utilization capa-city of existing mills, reactivation of unused ones where feasible, andconstruction of new mills.
6. To achieve its objectives, the main line of Dolicy implementationis through more emphasis upon the Operation Feed Your Industry Program, underwhich (a) more nucleus farms will be opened up by such agencies as GIHOC andthe State Farms Corporation, (b) more outgrower programs will be establishedto guarantee a portion of the input requirements of the factories, and (c)several new types of partnership agreements between domestic and foreignindividuals and companies will be concluded to produce various crops and/orprocessing facilities. A detailed review of processing activities is givenin the appendix to this annex.
Role of Small-Scale Producers
7. Because of various economic and socio-cultural factors small-scaleprocessors play a very prominent role in the Ghanaian economy. They arewidely dispersed and they serve rather small market areas. In this waythey avoid problems which arise through inadequate transport facilities.The small-scale food processor overcomes problems of regional and culturalpreferences in tastes, etc., because he is a part of the society in whichhe sells his product. He also builds up goodwill among his customers throughsocial ties, the provision of credit facilities and other forms of assist-ance. Thus, from the beginning, the traditional processor is not constrainedby many of the problems which a processor in the modern sector faces.
8. Unfortunately, most of the factors which give the .raditionalproducer an initial advantage are the very ones which tend to prevent himfrom expanding his operations in production of such products as kenkey, fufu,etc., for a larger market. There are, however, a few products which arewildly acceptable and can be produced with the use of simple machinery. Amongthese are gari, cassava chips and oil. Gari is consumed throughout Ghana. Itcan be stored for long periods and it is not easily damaged in transport. Thefact that efficiency in production is approximately the same for small as wellas large quantities and the producer can sell to customers who require variousamounts also makes the production and sale of gari attractive. Almost all ofthe gari produced in Ghana comes from small producers who make it from surpluscassava from their farms or cassava purchased from neighbors. Several gariproducers have acquired graters and presses which are operated by smallmachines. They have shown great interest in purchasing more locally madeimplements for producing gari but as this time there are only two principalsources from which they can obtain this equipment - The Technology Consult-ancy Center at Kumasi and a private company.

ANNEX XIPage 3
9. In oil production (see appendix) the traditional producer isresponsible for some 94 percent of Ghana's output. Production by thetraditional method does not result in the most efficient extractionrate nor does it produce oil of a very high quality. However, becauseof some of the same advantages mentioned above, the traditional producerwill continue to dominate the market over the next decade or so. Pre-liminary feasibility studies indicate that oil from oil palm, ground-nuts, cottonseed and sunflower can be profitably processed by small- andmedium-scale plants using improved techniques compared to the traditionalmethod.
10. Apart from drying pepper and a few vegetables, there is not muchtraditional - producer activity in processing fruits and vegetables. Thismay be partly due to the difficulty involved in engaging in these activitiesas well as to the fact that some fresh fruits and vegetables come intoseason as others become scarce, and thus there is a regular supply of freshfruits available. Also, fruits and vegetables are not usually as importantas gari and oil in the Ghanaian diet. The Food Research Institute plansto explore the potential for establishing small juice-extraction sheds ormobile units in villages which have excess fruits.
Prospects and Policies
11. Location and installed capacity. From a location standpoint,factors which influence the siting of a plant include weight of the inputand output, transportation, power source, storage and marketing facilities,manpower availability, etc. For products such as pineapple, tomatoes,cassava, oilpalm and copra, processing greatly reduces the bulk and weight,and several special requirements (e.g. cassava and oilpalm need to be pro-cessed within one day of harvesting and tomatoes need careful handling)combined with poor transportation facilities all work in favor of locationwithin the area of production of the crops. On the basis of these facts,most of the existing plants are located in areas where their inputs have thebest growth potential. There may be some questions about the location ofGIHOC's pineapple processing plant which should have been more in the maingrowing belt of the Central and Western Region. However, the existence ofrelatively adequate roads and the fact that more pineapple is now beingcultivated in the Eastern Region reduce this problem.
12. Although there may not be too many questions based on locationfactors, the basis for determining the capacity of machinery to be installedis open to several criticisms. When the present mills were purchased, thegovernment received suppliers' credit on very generous terms. Very favorabledepreciation conditions were offered and duty-free concessions and labor lawsencouraged minimizing the use of labor. These and other conditions resultednot only in the purchase of more machinery than was needed at that time; italso led to the purchase of large capital-intensive equipment requiring theemployment of few workers with a relatively high level of skills. The factthat the various government corporations acquired capital free of interestpayment also influenced the way in which such capital was used. To justifymachinery purchases, for example, it was assumed that the total output of

ANNEX XIPage 4
the nation (or most of it) would be available for processing, and thatfarmers would expand production to meet industry needs. The implicationsof separate markets (e.g. for fresh, as opposed to industrial requirements),transportatior. facilities, storage facilities, availability of other jointinputs (e.g. bottles, cans, etc.) were apparently not fully considered.
13. There was also the understanding that whenever local inputsbecame scarce, imports would supplement them and the plants would continueoperating at satisfactory levels. However, as foreign-exchange problems aroseat the same time that local inputs became unavailable, the plants were forcedto shut down or begin production of their own input supply. The government'simport restrictions aided the local high-cost producer.
14. Even in industrialized countries where many of the above problemsare few, the attrition rate of business ventures of this type is rather high.1/ For a plant in the LDC to develop into a viable unit it is thereforenecessary to support it with the best personnel available and not to burden itwith unnecessary expenses. In Ghanaian public enterprises, it appears thatthese problems cannot be easily eliminated. The most competent managementpersonnel is not usually hired, on-the-job training facilities are inadequate,there is great over-staffing, a high degree of centralized control exists, andpolitics, tribalism and nepotism are all factors influencing personnel alloca-tion and employment.
15. Many other problems will persist if the government and privateplants try to imitate all of the production and marketing methods whichwere used by foreign producers who previously sold their goods in Ghana.Supplanting imported goods involves much more than relocating productionfacilities in the country. This is especially true where, as in Ghana, thegoods are for domestic consumption (at least in the short and medium-term).
16. Coordination. Producers in Ghana have to become more involved inseveral areas. The farmers who supply them with inputs must be assisted,their processing methods must be adapted so that their products appeal todomestic tastes and preferences, and their marketing and advertising cam-paigns must be aimed at winning consumers from the ranks of both those whouse foreign brands, as well as from those who are new to the market. Accom-plishing these goals would be very difficult since it involves so many groupsand it requires a great deal of money and expertise. Because of this, theeffort must be a coordinated one with several agencies participating.
17. There is need for greater coordination to deal with some of theproblems faced by small-scale industries in Ghana. At this time, GIHOC,State Farms Corporation, National Investment Bank (NIB), Capital InvestmentBoard (CIB), Ghana Enterprises Development Corporation (GEDC), the Bank of
1/ See IBRD, Problems of Food Processing Industries in Developing Coun-tries, 1969; and IBRD, Financing the Development of Small-ScaleIndustries, 1974, for typical problems facing these activities inLDC.

ANNEX XIPage 5
Ghana and several other agencies are all involved to some degree with theseoperations. In some cases, a few agencies (e.g. NIB and CIB) cooperate witheach other to promote a new venture, but mostly, they work independent ofeach other even though some of their functions may overlap. It is suggestedthat GEDC's responsibilities be expanded with a view to helping to translategovernment policies into actions which facilitate the establishment and smoothoperation of food-processing plants and other small industrial ventures.Members of the mission met one potential investor who visited over ten sepa-rate agencies and spoke to as many people in an effort to obtain some basicinvestment information and assistance. Potential investors and any otherinterested individuals should be able to go to a central agency and obtainthe assistance which they seek (or be referred to the appropriate sources)without having to spend days and weeks at a dozen places and not receivingthe required assistance. To some extent, the CIB is presently involved inthis type of operation. However, it does not focus enough on small-scaleactivities nor does it have follow-up programs which are aimed at assistingnewly-established plants with the various bureaucratic and other difficultieswhich they face after operation commences.
18. Government's role. A primary concern of the Government should beto create a more favorable general investment climate. Prospective localand foreign investors are discouraged by existing overcapacity in industry,price control, import restrictions, the Investment Policy Decree, interestrates, restrictions on profit and dividend remittances and an overvaluedcedi. These factors affect investment in all sectors of the economy andimprovement in these areas should be part of the Government's overallmacro economic policy.
19. The Government is trying to encourage exports of non-traditionalproducts 1/ through various incentive schemes. Among these incentives arean export bonus scheme, a duty drawback system, a system of special importlicense for producers of export goods and rebate of corporate-profit tax.The 20 percent export bonus system functions in a rather straightforwardmanner. Under it, exporters who qualify receive 20 percent more cedis whenthey exchange the foreign-exchange earnings which they receive for theirexports. However, in general, all these schemes suffer from cumbersomeness inapplication and inefficient administration.
20. In 1974, processed agricultural goods shared about 36 percent of thetotal export bonus payments made, but in 1975 this figure was reduced to about12 percent. In some cases exporters still have not received their bonusesafter over a year of waiting. Only one food-processing area, flour milling,receives drawback benefits from this part of the scheme. Here, apparently,the duty drawback mechanism is working against expansion of processing opera-tions which can utilize the bran (from flour-milling) as a feed-industryinput.
1/ In the 1977/78 budget, a 20 percent export bonus on all traditionalexports excluding cocoa was announced. The bonus on non-traditionalexports was increased from 20 to 30 percent.

ANNEX XIPage 6
21. So long as domestic producers receive the effective protection whichthey now enjoy, exporting will not be attractive to producers except as aresidual. Some incentive schemes may ameliorate the situation but these haveto be greatly simplified and more widely publicized and understood than theschemes which now exist for export promotion.
22. Apart from factor-price distortions there are other factorsthat tend to push processors towards the use of capital-intensiveequipment (e.g. to obtain a standardized product). The government willtherefore have to apply some type of countervailing tax system to dealwith the combined effects of this and an overvalued cedi. However, sucha policy will run counter to the government's existing concessions whichinclude duty-free entry and accelerated depreciation schedules formachinery used in processing activities.
23. The government of Ghana has consistently stated its support forpromotion of small and medium-scale food-processing operations and its recent5-year plan and again reiterates this position. Up to this time, government'sactivities have not been enough to supply the food processing industry withthe impetus it needs for a strong start. Government's commitment must betranslated into a system of policies and incentives which should be designedin such a way that food processing activities (and small-scale operations ingeneral) receive the type of assistance they need to develop into viableoperations. Factors such as resource availability, financial, natural andhuman, must be realistically assessed and these must form the basis for set-ting achievable goals. In the 1975-1980 Plan, the Ghana government has setsome output targets for certain products. However, it does not appear tohave any clearly worked-out analysis on how to achieve the potential ofvarious regions, projected market conditions, etc., which are needed for arealistic assessment. Furthermore, in most of the plan projections of pro-cessing activities, the role of the government overshadows all other groupsand individuals.
24. It may be well on both efficiency and financial grounds for thegovernment to withdraw and remove itself as much as possible from the roleof a direct participator to that of a supporting actor. In such a position,the government will provide the physical infrastructure e.g. storage facil-ities, feeder and main roads, ports, railway systems, marketing facilitiesand other requirements and incentives needed for private individuals tooperate the food-processing system. Where it must participate directly,it should do so through agencies and corporations which borrow governmentfunds and pay both interest and capital back to the government. Such apolicy may force these corporations to deal with many of the inefficien-cies listed above.
25. Regarding the supply of raw material to food processors, nucleusfarms are important since they provide a guaranteed source of input. How-ever, these farms do not have to be owned by the plants. Initial experimentsby GIHOC factories as well as by the Rice Mills Unit at Tamale all resulted

ANNEX XIPage 7
in extremely low output at a very high cost. Modifications of thispolicy (under which the mills provide almost all of the farm inputsfree of charge) were also not successful. Apart from providing costlyinputs at heavily subsidized prices, such an approach taxes the adminis-trative ability of the available personnel and still, in the end, thecrop reaches other outlets.
26. While steps are being taken to deal with incentives for increasedoutput, the question of selection of crops primarily for industrial produc-tion should also be dealt with. In Ghana, processors have been using cropsgrown for the fresh-food market for processing activities. This practicereduces the risk to the farmer but it results in an unsuitable input for theprocessor. Tomato processing offers a good example of this. The crops grownin Ghana have a lot of seeds and the skin of the berry is folded. Thesefactors cause the recovery rate to be rather low when compared to processeswhich use the large smooth industrial varieties of tomato. A similar situa-tion exists between groundnut grown for oil and the confectionary type ofgroundnut. With arpropriate experiments and incentives, producers can beinduced to grow crops for each market without hedging as they now do.
27. In a similar vein, a grading system should be instituted to rewardproducers according to the degree of care they take in producing their crops.At the present time, the Ghanian rice farmer who sells his paddy with 15-20percent impurities receives the same price as his neighbor whose crop has only5-10 percent chaff. The practice of giving each farmer the same price thuspenalizes the latter farmer when, in fact, he should be rewarded. A similarsystem operates for pineapple producers who sell large overripe fruits andthose who reap the fruits earlier when the weight is less.
28. Like most LDCs, Ghana's supply of managers, entrepreneurs, tech-nicians, etc., is rather inadequate. The country has three main traininginstitutions for managers: The School for Administration, the ManagementDevelopment and Productivity Institute and the Ghana Institute of Manage-ment and Public Administration. It also has several professional associa-tions which sponsor training seminars, and there are a few private individualsand firms which provide consulting services. It appears as if many of thegraduates of the institutions are hired by the civil service and the managersof most processing facilities do not receive much formal managerial training.By itself, the lack of formal managerial training need not be a great handicap.However, managers may tend to be more innovative and they may contribute muchmore if they were exposed to more seminars and training courses which aretailored to their needs. In the government-owned plants the managers and top-level personnel are transferred too often and they do not get an opportunityto contribute to the organization. The government should try to reduce thesefrequent transfers and it should use experience and ability as two of the maincriteria when making appointments.
29. For private firms, especially the local small-scale operations,government should help to provide consultancy service covering all aspects ofthe operation. The consultants so employed would have a role similar to that

ANNEX XIPage 8
of an extension agent who deals with small farmers. They should be able toprovide advice on proper bookkeeping methods, budgeting, marketing, etc.There is one group, the Technology Consultancy Center at Kumasi, which hastried to provide some of these services for a nominal fee. The response whichthey have received show that there are many people who are interested in suchadvice. Another source of technical and other administrative assistance isTechnoserve. This is a private, non-profit company which provides a widerange of services for firms in LDC. Its operations in Ghana have been insugar production but it is willing to participate in other ventures if itreceives appropriate support.
30. While each company should advertise its own products for its sellingcampaign, the government should encourage Ghanians to "buy local". In suchan effort it will need the help of the communications media as well as organi-zations such as the Food Research Institute (FRI). The FRI and other suchbodies can conduct tests to determine nutritional factors and they can alsodecide consumer acceptance of various products, the degree of substitutionconsumers would accept, etc. The National Standards Board already testsproducts to determine purity and wholesomeness. Unfortunately, with thedegree of scarcity existing in Ghana at this time, the Board's findings andrecommendations are usually not heeded by consumers.
31. There are several institutions which promote export of processedgoods of Ghana. Among these are the Ghana Export Company (GEC) and the GhanaExport Promotion Council (GEPC). The GEC was established by the Bank of Ghanato purchase and export Ghanian products which were not traditionally exportedand the GEPC was created by the government to publicize Ghana's productsabroad and to assist local processors to export their goods. Ghanian embas-sies also try to promote export of local products. So far, the efforts ofall these agencies have not been too successful. This is due partly to theabsence of exportable products as well as to infighting and suspicion aboutthe motives of each side. What is needed is a strong single council composedof representatives of all affected groups. This council should focus onspecific products and try to reach a few large markets in which there isinterest in the product concerned.
32. Of all of the suggestions made above, none will have as much short-and long-term impact as that affecting the flow of foreign exchange to pro-cessors. Even if Ghana has all of the required agricultural inputs, itstill has to purchase machinery from abroad. Government's policy on foreignexchange allocation is therefore very important. In its 1975-1980 Plan,the government stated that it would re-examine its system of foreign-exchange allocations and give food-processing activities a larger share offunds. Unfortunately, the available evidence suggests that most of theallocation would be used in financing new machinery, transport equipment,etc., and not many of the downed equipment in the country would receivespare parts.

ANNEX XIPage 9
33. Several foreign companies have funds in Ghana which they cannotlegally repatriate abroad. Many of these companies have agreed to investthese blocked funds in agriculture projects in partnership with the govern-ment or Ghanians. In return for these investments the government wouldallow the companies to repatriate a part of their blocked funds accordingto a formula which incorporates the size of the initial investment, thegestation period of the project, the size of the after-tax profit, etc.Additional incentives offered to the company include exemption of importduty on equipment, special foreign-exchange allocation for importationof machinery, accelerated depreciation on all equipment and buildingsand a tax holiday for 5 years. About eight firms have so far agreed toparticipate in this program and the sum involved is almost $80,000,000.

APPENDIXPage 1
1. The following gives a more detailed description of existingagricultural processing activities in Ghana.
Vegetable Oils
2. Ghana presently extracts most of its crude vegetable oil fromoilpalm, fruits and nuts, coconuts and groundnuts. Sheanut is also animportant source of oil in the northern part of the country and there aresome experiments involving oil extraction from other seeds such as cotton-seed, soybean, cashewnut, sesame and sunflower.
3. In 1967, Ghana's total industrial milling capacity was about24,434 tons with an additional 15,272 tons under construction. 1/ Afterthe initial construction and expansion decade of the 60's several plantswere closed down and today there are only about 25,453 tons of existingplant capacity. According to a recent FAO study, 2/ present domesticdemand for vegetable oil is about 105,882 tons of which 43,778 tons areneeded for food and 62,104 tons for other uses. At an average utilizationcapacity of about 5,000 tons for 1975, indications are that almost 97,000tons of oil are now being produced by small village crushing plants withthe remaining 4,000 tons being imported.
4. Over the past six years, the volume of vegetable oil importshas been rather erratic. This is due to such factors as weather condi-tions, Government policies restricting imports, and changes in the internalutilization pattern for vegetable oil. Even with such changes, importsstill remain significant. Imports of vegetable oils between 1970 and 1975were as follows:
Table 1: VEGETABLE OIL IMPORTS
Year Oil Imports(Cedis) (Tons)
1970 969,224 2,9971971 1,309,409 4,5841972 791,800 2,5341973 3,856,141 14,3431974 12,794,277 19,9801975 2,609,367 4,368
Source: External Trade Statistics, 1970-1975.
1/ UNDP, Ghana's Food Industries 1968, p. 75.2/ FAO, Country Perspective Study, 1976.
APPENDIXPage 2
Coconut Oil Production
5. Coconuts are widely grown in the coastal areas of the country, butmost of the plantations are located in the Western Region and parts of theCentral Region. In 1973, there were about 36,000 ha. under coconut. Ofthese, about 20,000 ha. were pure stands, about 11,600 ha. were mixed predo-minant, and about 4,400 ha. were mixed subsidiary. Most of these were ownedby peasants, with the government owning a negligible fraction (about 682 ha.)through the State Farms Corporation.
6. Estimates on yields are subject to large margins of errors becauseof the long maturation period of trees, differences in yields due to climateand soil conditions, husbandry practices, etc. However, it is estimatedthat of the 246,000 tons of nuts reaped annually between 1971 and 1973,86,000 tons went to fresh consumption uses, 135 tons went for oil productionand other uses and about 25,000 tons were wasted. It is estimated that theyield is 1.25 tons copra per hectare for existing coconut plantations.
7. Modern Milling Facilities. The Ghana Industrial Holdings Corpora-tion (GIHOC) has an oil mill at Esiana in the Western Region. This millbegan operations in 1961 and it has a total annual capacity of about 12,200tons per year. There are five expellers in this plant. Four of these eachhave a capacity of 20 tons per day (3 shifts) and the fifth has a capacityof 15 tons per day. Production figures for 1974, 1975 and 1976 are intable 2 on page 8. The oil is sold in bulk to distributors who retail it tothe final consumers for home use and the oilcake is exported to Europeanfeed-processors. Earlier on, Lever Brothers purchased the oil for its Temasoap-manufacturing plant. However, the small and irregular volume of supplyand the higher price which consumers were willing to pay caused Lever Brothersto seek other sources of oil. In 1976, there were 290 permanent and 84 casualemployees at this mill.
8. Competition between the mill and small producers (who generallylive in the villages) is intense and the small producers have advantagein social ties, prompt payment and higher price offered. The mill has aconstraint arising from government price controls and so cannot competetoo much in price. In 1976, the mill paid about ¢ 700 for a ton ofcopra (vs. a world price of approximately $392/ton).
9. Compared to traditional production methods, the mill has a reco-very rate of between 50 and 60 percent while cottage producers have an averagerecovery rate of 35-40 percent. Traditional processing method leaves about40-48 percent of oil in the oilcake while the mill leaves only about 8-12percent. The oilcake from traditional method is usually either discarded orused for pig feed. In 1976, production cost per ton of oil was about e 1,963and selling price (wholesale) was about V 2,245 per ton, giving a marginof about V 282 per ton to the mill. Since figures on fixed costs, deprecia-tion, interest rate on capital, etc. were not used in these cost compu-tations, it is not possible to accurately measure the profitability ofthe mill.

APPENDIXPage 3
10. Among some of the problems faced by the mill were the lack of spareparts needed to maintain both processing and transportation equipment. Themill has a central location within the coconut-producing belt but its operat-ing radius is less than 117 km. and its coverage of the area is not adequate.It generally has to hire local lorries to transport the coconuts and thisadds to its production costs and affects the smooth flow of inputs fromproducers. Up to 1974, it did not have enough working capital to pay for itspurchases and this caused several of its customers to seek the private buyersor reap less of their crops. After 1974, the Bank of Ghana started to supplyGIHOC with working capital and this problem has been eliminated but time isstill needed to develop confidence among sellers.
11. Competition from other buyers and lack of spare parts is coupled withtwo other disadvantages to increased oil production: demand for fresh coconutmilk and meat and the poor state of several existing plantations. The freshcoconut market accounts for over 30 percent of the crop and it reduces theamount of nuts available for other uses. Since the peasants do not normallyview coconut as a source of primary income, they tend not to take care of itby using high yielding trees, clearing weeds, fertilizing, spraying insectpests, etc. Consequently, the plantations are not properly maintained.Another threat to the industry now appears. This is the St. Paul's diseasewhich has spread westward from Togo and is destroying many trees. Effortsmade to check and eradicate this disease are not too strong nor is thereenough interest in replanting the affected areas.
12. Figures show that compared to the area under coconut in 1973, about400 additional hectares were under cultivation in 1974. Under the 1975-1980five-year development plan, the government expects to expand the area undercultivation to 44,000 ha. by 1980. Government intends to establish nurseriesto provide outgrowers with hybrid varieties and there are also plans todevelop trees which can resist the Cape St. Paul disease. The Ghana Commu-nity Farms (formerly Food Production Corporation), and the State Farms Cor-poration plan to establish large-scale estates totalling over 6,400 ha. by1980.
Groundnuts
13. Over 84 percent of the groundnut cultivated in Ghana is grown inthe Northern and Upper Regions. Other regions of importance include theCentral Region, Eastern Region, Volta Region, Ashanti Region and the BrongAhafo Region. Like coconut, groundnut is a smallholder crop in Ghana, theaverage farm size in 1974 being about 0.8 ha. in the main producing regions.Much of the crop is grown along with other crops and only about 17 percent isgrown in pure stand.
14. In 1974, Ghana produced 121,765 tons of groundnuts (in shell) from77,600 ha. of mixed and pure-stand farms. This figure includes a second-season crop for certain parts of the Volta and Northern Regions and so theyields per acre are therefore overstated if computed as for a single crop-year. Direct consumption of groundnuts (in roasted and crushed form forgroundnut soup) is estimated to be about 50-60 percent of the nation's output.The remaining amount is used for oil production.

APPENDIXPage 4
15. Modern Milling Facilities. The government installed threegroundnut-processing mills in 1961 at Atebubu in the Brong Ahafo Region,Tamale in the Northern Region, and Bawku in the Upper Region. Each millhad an annual installed capacity of 1,629 tons of groundnuts and themachines were imported from East Germany. Initially, adequate supplies ofgroundnuts were not available for high utilization rate of any of thesemills, especially the Bawku mill which was working at about 2.5 percent ofcapacity in 1968. There was a problem of obtaining spare parts and this wasfurther complicated by the fact that the equipment was of the East Germanorigin. Since the Bawku mill was not obtaining adequate inputs, it wasdecided to close it down and use its machinery to meet the spare-partsneeds of the other two existing mills at Atebubu and Tamale. Later on,capacity of the Tamale mill was expanded to 24,434 tons per year (300 days oftwo 8-hour shifts).
16. Government groundnut mills achieve an oil-recovery rate of between35 and 40 percent while 10-15 percednt of oil remains in the cake. Fortraditional producers these figures are 30-40 percent and 15-25 percentrespectively. Oilcake from the mills is sold as animal-feed but the oilcakefrom cottage operations is used for food. After the oil is refined anddeodorized at the mill, some of it is packaged in one-gallon cans while theremainder is kept in drums. These are then marketed by GIHOC directly toretail establishments and bulk sellers. In 1976, there were 41 full timeand 28 temporary employees at the Atebubu mill and 75 full time and 60temporary employees at the Tamale mill. Both mills seek inputs over morethan 167 km radius and this has led to an overlapping of the area coveredin some places along the Volta.
17. Since traditional producers manufacture and distribute over 95percent of the groundnut oil produced in Ghana, they provide strong competi-tion to the mills. They use social relations and higher prices to bid awaysupplies of nuts from the mills. The mills cannot compete with these otherbuyers because the price of the oil produced by GIHOC is controlled by theGovernment. In February, 1977, the Ghana Price Control Board allowed GIHOC tocharge only e 57.60 per carton (of four one-gallon bottles) of groundnut oil.The variable cost of production of this oil was ¢ 69.78 at that time and soGIHOC was losing about ¢ 12.18 per carton. Until 1974, the lack of workingcapital for prompt payment of purchases was also a disadvantage which themills faced.
18. Like the copra mills, scarcity of spare parts and lack of adequatevehicles to cover a wider area and transport the groundnuts pose problemsto full utilization of available plant capacity. Inadequate storage facil-ities also affect processing activities in the mills. To counter some ofthese disadvantages GIHOC planned to open up a 240 ha experimental groundnutfarm at Atebubu in 1972. However, lack of machinery and other inputsreduced the actual area cultivated to 80 ha. After the plot was harvested

APPENDIXPage 5
it was found that the cost of production was much higher than the costto private farmers for similar yields. For the 1976 crop it was decidedto distribute the land among local farmers giving each a two-hectare plot.The Government was expected to provide all of the required inputs forgroundnut production while the farmers were to agree to sell their cropsto the mill in a tied type of arrangement. Unfortunately, bureaucraticsnags and the unavailability of cultivating machinery and other farminputs prevented this experiment from being implemented as planned. Asimilar experiment involving about 800 ha. with Tamale groundnut producersalso has not produced enough evidence to evaluate its success at this time.
19. Part of the difficulties faced by the mills is competition forthe land by other crops. As incentives for the cultivation of rice, yams,cotton, tomato, etc., increase, farmers tend to shift toward cultivation ofthese crops at the expense of crops such as groundnuts. Producers of thesecrops, unlike those of coconut and other tree crops with a long maturityperiod, take considerably less time to respond to various inducement schemes,and so the groundnut oil producers face a much more elastic supply in themarket from one year to the other.
20. The government is attempting to eliminate some of these problemsby cultivating and promoting cultivation of groundnuts on larger acreage andby more farmers. In the 1975-1980 five-year plan, the Grains DevelopmentBoard has set a target of 26,000 ha of new land to be planted with groundnut.Additionally, the Ministry of Agriculture, the State Farms Corporation andthe Community Farms plan to bring over 3,000 acres under groundnut cultiva-tion.
Palmoil
21. Oilpalm trees are found in several areas of Southern Ghana. Becausethey grow wild and are so dispersed, it is rather difficult to find reasonablyaccurate figures on such features as acreage under cultivation, yields, age oftrees, etc.
22. The Volta hydroelectric project has flooded and destroyed a signi-ficant portion of the wild-stand of oil palm. But this did not have as greatan impact upon the commercial processors as they did upon the traditionalones. In 1973, it was estimated that there were about 18,000 ha. on purestand farms, 4,000 ha. in mixed predominant farms and 93,600 ha. in mixedsubsidiary cultivation. Almost 90 percent of the crop is located in theAshanti, Western, Eastern and Brong-Ahafo Regions. The pure stand areas areusually found on parastatal plantations and private estates while the mixedcrops and wild stands are generally owned by smallholders.
23. Oilpalm is a very important crop to Ghanians. Apart from producingoil, its leaves and trunks also provide material for construction and house-hold items and the fruit is generally used in soups and stews while the sapof the tree is a source of palmwine. On the industrial side, palmoil isan important ingredient for soap and margarine manufacturing.

APPENDIXPage 6
24. Output in 1973 was estimated to be about 321,000 tons of freshfruit bunches. Figures for 1972 show that about 25,453 tons of palmoilwere imported and about 20,400 were produced domestically to meet an internaldemand for about 46,000 tons of palm oil. It is also estimated that about70,000 tons of palm oil will be needed to meet domestic demand by 1985.
25. Milling Facilities. The State Farms Corporation (SFC) has an oilmill at Asraku, and this, together with smaller private mills and tradi-tional producers, supply Ghana's output. The SFC mill begun operationsin 1969. It initially had equipment to process only palmfruit but laterexpansion made it possible for it to process palm kernel also. Fresh fruitcapacity is about 27,500 tons per year. In its first year of operation itreceived about 60 percent of its input from the Pretsea Estate (which isowned by the SFC) and the remaining 40 percent was purchased from surroundingfarmers. Utilization rate has been much higher than that for GIHOC oil mills.In 1970, 19,900 tons of fresh fruits were processed and 3,258 tons of palmoil were produced. In 1972, about 26,500 tons of fruit gave about 4,072tons of oil, while in 1974, 18,817 tons of fresh fruits yielded 2,679 tons ofpalm oil and 421 tons of palmkernel oil.
26. The oil produced by the SFC mill is sold both to wholesalers andindustrial manufactures depending upon the prices offered by each. In1972, for example, Lever Brothers Ghana Ltd. purchased 3,054 tons of palmoil from SFC for production of margarine and other food products. In compari-son to traditional producers, the SFC mill has a 14-16 percent rate ofoil extraction while the traditional processes have a 9-10 percent rate forpalm nutbunch. However, for palm kernel, traditional extraction methodyields about 40-42 percent oil while modern mills yield only 35-38 percentoil. Part of the reason for this is because the traditional processors workwith fresh nuts while the mills usually have to accumulate the nuts for someperiod of time. About 15 to 20 percent of oil remains in the cake afterextraction by modern methods. For traditional methods the figure is about20-25 percent. Cake from kernels leave about 10-15 percent oil in the tradi-tional method and about 9-18 percent in factory process.
27. According to a recent World Bank study, 1/ consumer demand forpalm oil is expected to grow by 4-6 percent annually as population and incomerise in Ghana. Even with no real growth in income, demand is still expectedto grow by 2-3 percent. Because of this and the fact that such a smallproportion of palm oil is produced by modern mills, the future for additionalcommercial oil mills appears to be encouraging. However, because of thenature of this crop and its present location, certain points need to beconsidered in more detail.
28. In Ghana, palm trees usually start to bear fruits after the thirdyear but their yields do not reach maximum levels until 11 to 14 yearslater. This long gestation period means that processing mills will be
I/ IBRD, Appraisal of the Oil Palm Project, Ghana, 1975, Annex 1, page 4.
APPENDIXPage 7
needed a few years after the trees are planted. Also needing considerationis the fact that the fruits are rather bulky and heavy and they must beprocessed within 24 hours of harvesting if the quality of the oil is to beacceptable to consumers. These factors indicate that the mill must becentrally located in areas where the yield is from concentrated predominantor pure-stand clusters and there are good transportation facilities androads to move the crop out quickly.
29. In Ghana, the ratio of pure-stand and mixed predominant trees tothe total area under oil palm cultivation is below 20 percent. Furthermore,only about half of the existing pure-stands are bearing fruit and an averageyield of 6.5 tons of bunches per hectare show that either these trees have notreached maximum yields as yet or they are not well taken care of. For mixedstands, yields of between 0.75 and 3.75 tons per hectare show mostly theresult of improper husbandry practices by farmers who do not regard this cropas their primary source of income.
30. Recently, several new oilpalm plantations were established byboth private and governmental agencies. In 1976, the UAC Ltd., a UnileverCompany, acquired 4,000 ha. of land at Bunso and it has a partnershipagreement with the Government of Ghana (UAC 60 percent, Ghana Government 40percent) for joint cultivation of oilpalm. This 4,000 ha of oilpalm planta-tion will be supplemented by a 2,000 ha. outgrower project through whichprivate farmers in areas adjacent to the plantation will be assisted withfertilizer, credit and other inputs needed to cultivate their own trees andsell the crop to the company. By 1981, the company plans to establish its ownoil mill capable of processing 8 tons of fruit per hour; and this will beexpanded as yields and acreage increase. In embarking on this projectUnilever has two primary aims: (a) its investment is under a special schemeunder which some of its blocked funds can be repatriated in proportion to itsinvestment and (b) it will get supplies for its soap and margarine plant, thusreducing or eliminating imports.
31. In another project, the Bank is assisting the Ghanaian Governmentin establishing the first phase of a 10,000 ha. integrated oil palm devel-opment program in which there will again be a nucleus plantation withoutgrower holdings. This project is at Kwae in the Eastern Region. A10-ton per hour palm oil mill will also be constructed later to processthe fruits of both the nucleus and the outgrower farms.
32. Apart from the Unilever and Bank-assisted projects, the govern-ment of Ghana through the State Farms Corporation and the Ghana CommunityFarms plan to establish over 42,000 ha. of new oilpalm plantations andplans are underway to establish nurseries and experimental stationsto assist outgrowers to plant large areas also. The Agricultural Develop-ment Bank is planning to establish a palm oil mill at Kumasi.

Table 2
GIHOC VEGETABLE OIL MILLS
Mill Input Input OutputCapacity (tons)(tons/yr) Cake Oil
Esiama (1961) Coconut 12,200 1974 1511 2992
1975 1420 2972
1976 993 2065
Atebubu (1961) Groundnut 1,629 1974 304 240
1975 500 407
1976 168 133
Tamale (1961) Groundnut 24,434 1974 934 761
1975 1061 827
1976 1027 862
Asraku (1969) Palm oil 27,500 1970 3258
1972 4072
1974 3108
Source: GIHOC Oil Mills Division

APPENDIXPage 9
Other Oilseeds
_3 Sheanuts. In 1975, ahana expa-ted just over 18,529 tons of oilseeds, oil nuts and oil kernels. Of this amount, sheanuts and cottonseedwere the predominant products. When compared to preceeding years, the volumeof export of oil seeds, nuts and kernels appear to be rather high especiallysince the Cocoa Marketing Board, which purchases and exports Sheanuts, hasbeen purchasing smaller amounts recently. Although the volume of theseexports may have been overstated. sheanut and cottonseed still remainthe most important export items in this category.
34. Iheanut comes f^-Om rees which grow wild in the Northern areasof Ghana. i_s an important source of oil and butter for people wholive there. Figures on ar-ea, yields and output differ widely because ofthe nature of the crop. However, in 1973, it was estimated that produc-tion of sheanuts was about 41,742 tons and of this amount, about 31,561tons were used for butter making. The government plans to open up newsheanut plantations and encourage farmers to cultivate this crop in thenorth. By 1990, it hopes to produce about 69,230 tons of sheanuts to meetboth domestic and exporL needs.
35. Cotton Seed. Since cotton is cultivated primarily to satisfythe fiber needs cf Ghana's textile industry, cottonseed supply for oilproduction has not greatly influenced present production policies. However,it is recognized that the use to which cottonseed is put does have a sig-nificant impact upon the profitability of cotton cultivation operations.
36. In 1974, orly abcu"c S oercent of the capacity of Ghana's textilemills was met throughl-ocal-y p--fficnd cotton. Large-scale cotton productionbegan about 1969 in the Northern areas, and from an initial area of about800 ha., there has been an expansion to about 24,000 ha. yielding about15,000 tons of seed cotton. The government plans to expand productionto about 98,000 tons of seed cotton by 1980. If only a quarter of thistarget is reached, there will be a large amount of cottonseed availble forprocessing.
37. Presently, most of the cotton seed produced in Ghana is exported toEngland and the United States but there have been some recent experimentsaimed at processing the seeds in Ghana. The Technology Consultancy Center(TCC) at Kumasi has been working with GIHiOC, and in their initial tests, theyobtained satisfactory results in using GIHOC's mill to crush and processcottonseed into oil. After some more work there are plans to process allavailable cottonseed domestically, using the residual cake for animal feed.When full production commences, it will reduce some of the idle capacity ofGIHOC's oil mills while Ghana's domestic oil supply increases and cottonproducers receive guaranteed market for the cottonseed they produce.
38. The government is also planning to establish and encourageproduction of soya-bean, winged bean, sunflower and cashew nuts. Plansfor several experimental farms are underway and many governmental agenciesare seeking funds under the new five-year plan for promotion of these crops.

APPENDIX
Page 10
One interesting experiment involves oil extraction from leaves. The TCChas a small soap-producing factory which is presently facing difficultiesbecause palm oil, one of its main ingredients, cannot be bought at afavorable price. It has, therefore, sought a non-edible source of oiland initial experiments with the leaf of the Neem plant have been encourag-ing. If this method of oil extraction becomes economically feasible inGhana, it will have a significant impact upon the vegetable oil market.
Fruits and Vegetables
39. Modern processing mills produce all of Ghana's output of cannedfruits and vegetables. There are presently seven factories which process localfruits and vegetables. Four of these are privately owned while the remainingthree make up the Cannery Division of GIHOC. Two of the private firms producelime juice and dried lime peels; one produces pineapple juice and tomatopaste, and the fourth produces jam, lime juice, canned vegetables and soups.The citrus operaticas are located in the Cape Coast area of the CentralRegion, the pineapple and tomato paste factory is at Winneba in the CentralRegion, and the fourth firm mentioned above is located in Accra. GIHOC'sstate-owned plants are at Nsawam in the Eastern Region (products: tomatopuree, pineapple pieces and juice, pepper puree and garden eggs). Wenchi inthe Brong-Ahafo Region (products: tomato puree, mango juice, bambarra beans,okra, etc.), and Pwalagu in the Upper Region (products: tomato puree).Installation cost of the three GIHOC canneries is estimated to be about 8million cedis.
40. Excluding the citrus plants in the south, the combined installedannual capacity of the Nsawam and Accra plants is over 8,100 tons of products.The capacity of the Wenchi plant is about 51 tons/day and the Pwalagu planthas 102 tons/day capacity (24 hour day in both cases). Assuming a 150-dayseason for both plants their capacities will be 7,650 tons and 15,300 tonsrespectively. While the privately-owned lime-juice plants operate close to100 percent of capacity, the other private plants reach less than 50 percentof theirs and two GIHOC canneries have a utilization rate ranging from 3 to 20percent while the third plant at Pwalagu was just being reactivated in 1976.The table on page 13 shows the area cultivated and the production of variousfruits and vegetables, between 1970 and 1975 Ghana. Looking at the productionfigures, it might appear that the supply of most of these products is morethan adequate to meet the needs of existing processing facilities. However,after various spatial factors and fresh-produce demand conditions are takeninto account, the quantity remaining for canning purposes becomes signifi-cantly less. A closer look at GIHOC's canning facilities follows.
41. GIHOC's Nsawam Cannery. Operations at this plant began in 1961.The plant was designed to produce canned tomato puree, whole tomatoes, andpineapple juice and pineapple pieces but as these products were not alwaysavailable to satisfy its requirements, it began to process oranges, peppersand garden eggs. To augment its supply of pineapple, 30 ha of land were

APPENDIXPage 11
acquired by the plant. Management intends to cultivate this together withanother 200 ha. area as a nucleus plantation. However, scarcity of capital,machinery and various other inputs has resulted in only 17 ha. being culti-vated at this time. The plant also owns a small plot on which it cultivatesoranges and it plans to expand this in the future.
42. About 482 workers are employed by the plant. This includes 112temporary workers. Because GIHOC has several other operations among whichworkers are usually assigned, it is rather difficult to determine the ratioof workers to output at any given plant. Storage facilities for (a) produceto be processed, (b) jars and containers, and (c) the processed product, areall very inadequate and it is estimated that the factory suf f-ers losses of12-20 percent because of this. The Nsawam plant with a capacity of about4,072 tons was only operating at 39 percent in 1971, 43 percent in 1972, 38percent in 1973, 43 percent in 1974, 11 percent in 1975 and 2^j percent in 1976.
43. GIHOC's Wenchi Cannery. The Wenchi Cannery was constructed in 1961but it was idle for most of the time until 1972 when it was reactivated. Itwas not until 1974 that the reactivation process was completed. The maincrops to be processed here were tomato and mango. Like the Nsawam plant,inputs are purchased from farmers in the area. Output over the last threeyears are given in the table on page 13. Capacity utilization of this plantfor 1974, 1975 and 1976 were 5 percent, 35 percent and 5 percent respectively.
44. Two nucleus tomato projects are now under preparation for the Wenchiplant. On completion, these farms will cover an area of about 6,800 ha. andthey should provide a significant quantity of tomatoes. However, there areseveral problems in getting these farms started. Lack of equipment to clearthe land and lack of inputs are two main constraints at this time,
45. About 100 people are employed at the Wenchi plant and of thisnumber about 30 are temporary workers. Approximately 80 percent of the outputof the Wenchi plant is marketed through the Nsawam facilities of GIHOC andvehicles and service personnel usually move between Nsawam and Wenchi whenthey are needed.
46. GIHOC's Pwalagu Plant. This plant was established primarily toprocess tomatoes in the Upper Region but limited supplies of tomato causedit to remain idle. To overcome the problem of securing ade-quate inputsupplies, 320 ha. of land were acquired by GIHOC within a 17 km. radiusof its Pwalagu plant. The aim was to irrigate this land and have acombination of nucleus farm and private farmers producing tomatoes forthe cannery. For the 1976 crop, about 80 ha. were planted; 20 ha, byprivate farmers and 60 ha. by GIHOC. It was expected that yields on thisland would be at least 6-7 tons of tomato per acre. On the basis of thiscalculation, the Pwalagu mill was scheduled to be reactivated in early1977.
47. By February, 1977, a combination of factors once again led touncertainty about available supplies for the mill. Instead oL the 6-7 tons

APPENDIXPage 12
per acre which was expected, the yield was only about 1-15 tons per acre.Lack of adequate input on the farm and bad weather caused yields to be low.The available supplies which were reaped were quickly disposed of in thefresh-produce market where consumers were paying over 10 cedis per 20kilos compared to the 4 cedis which GIHOC was offering.
48. There were also other problems with GIHOC's 60 ha. of tomato.At first, the Pwalagu manager was waiting for the production managerfrom Nsawam to get the mill in operating condition. After this, cratesand transportation vehicles were not available to move the produce outof the fields and the result was loss through spoilage and pilfering.The future of the Pwalagu plant thus remains in doubt at this t4me.For the 1977-1978 period the manager of GIHOC canneries is requestinga total of 780,000 cedis worth of equipment and inputs. Among these aretractors, harrows, ploughs, sprayers, water-pumps and chemicals and seeds.Government is also being asked to provide spare parts for processing andtransport equipment for the three factories. In total, almost one mil-lion cedis worth of foreign exchange is requested by GIHOC for its pro-cessing facilities and farm operations.
Starchy Foods
49. In this category, cassava stands out as one of the most widely grownand consumed staple in Ghana. Apart from being cooked fresh, cassava isusually converted into gari, chips, starch, pellets, tapioca, flour, etc.Like oil production, most of these cassava products are made by traditionalproducers.
50. Of the 365,200 ha. under cassava during the 1973 crop-year about90,000 ha. (25 percent) were in the Eastern Region, 70,400 ha. (19 percent)were in the Volta Region, 63,200 ha. (17 percent) were in the Ashanti Region,47,200 ha. (13 percent) were in the Brong Ahafo Region, and 41,600 (11 percent)were in the Central Region with the remainder dispersed among the otherregions. Because most of the traditional producers are small-scale and theywork in their homes, production of cassava products usually takes place in theareas where the crops are grown. Recently, a few producers have expandedtheir scale of operation through acquisition and use of power-driven graters,pressing devices and drying units. The nature of the extraction and conversionprocesses is such that a very wide range of machinery could be employed.Two examples involving the use of local and advanced imported machineryare examined below.
51. Agropat Commercial Farms. This is a gari-producing plant locatedin the Central Region. It began operating in February, 1975, with a capitalinvestment of about 275,000 cedis. About 4 tons of cassava could be pro-cessed in a 10-hour day and there is a storage shed of 200-ton capacity.The engine was imported from India and the grating machine, storage tanks,filters, boiler-cooker, drier and grinding machines were made in Ghana eitherat a local workshop or by the owner himself. The owner has a 320 ha. plotof land surrounding the mill, and of this area, 16 ha. were cultivated in1976 and 60 ha. are now under cultivation. There are fifty employees andthey work at various activities on the farm when the plant is not operating.

Table 3
GIHOC FRUITS AND VEGETABLE PROCESSING PLANTS
A. Mill: Nsawam (1961)
Capacity: 4072 tons/yr (input)
Output: (tons)
Tomato Pineapple Orange Lemon Pepper GardenPuree Juice & Juice Juice Puree Eggs
Pieces
1971 - 683 45 8 0.6 4
1972 - 650 96 20 10 17
1973 110 363 28 6 2 6
1974 45 654 26 0.2 - -
1975 9 118 20 4 - 40
1976 14 268 102 - -
B. Mill: Wenchi (1961)
Capacity: 7650 tons/year (input)
Output: (tons)
Tomato Mango Beans Okra Pepper GardenPuree Juice Puree Eggs
1974 44 30 3 0.6 6 4
1975 130 287 153 45 407 244
1976 42 56 0.3 - - 4
C. Mill: Pwalagu (1961)
Capacity: 15,300 tons/year of tomatoes
Output: Not in operation
Source: GIHOC Cannery Division

APPENDIXPage 14
52. For his first crop, the owner reaped about 140 tons of cassavaon 1976, and from this he obtained about 35 tons of gari. According tohis computation, the processing cost per ton (including fuel, labor anddepreciation) was about 150 cedis; the packaging costs were about 75 cedisper ton, the cost of production of 1 ha of cassava (including cassavastems, all labor costs, fertilizer, etc;) was about 500 cedis per hectare.With gari selling at 800 cedis per ton in 1976, he estimated the residualbetween total outlays (including implicit costs) and total receipts to beabout 250 cedis per hectare. The product was sold domestically where uni-versities, hospitals and other government institutions provided a readymarket for it.
53. Roots Processing Company. This is a plant which is located inthe Eastern Region. It began operations in 1971 with a capital investmentof about 800,000 cedis. Installed plant capacity was about 30 tons ofcassava per 8-hour day. There is a Lister turbine engine which was origi-nally designed for coffee drying, but was specially modified by the manu-facture for use in the cassava mills. Other imported equipment include twoWest German engines (both specially modified for cassava production), twodryers and a compressor from England. The company produces gari, pellets,chips, and a variety of custom-made feed products both for domestic andforeign markets. Employment varies between 76 and 100 workers.
54. Supplies of cassava come from a 600 ha acre tract of land ownedby the company and about 800 ha. acres of farm owned by outgrowers. Theradius of operation is about 83 to 125 km from the plant. Between 1973and 1975, about 320 ha. of the company's land were cultivated. In 1976,this fell to 280 ha. and for 1977, only about 200 ha. are being cultivated.Part of the reason for this reduction is the lack of foreign exchange forspare parts which are needed for machinery which broke down. Out of fourtractors owned by the company only one is now operating; and all of its5-ton trucks (4) and jeeps (3) are down through lack of spare parts. Themill also needs spare parts at this time and it is estimated that 15,000-20,000 cedis foreign exchange allocation is now needed to get the downedequipment operating once again.
55. Because of the importance of cassava to Ghanaians, price increasesresult in less than proportionate changes in quantity demanded. This hasled to the price of cassava rising relatively faster than the price ofgari, pellets, etc., and outgrowers who received 15 cedis per ton ofcassava in 1971 were asking for 60-70 cedis per ton in 1976. The combi-nation of factors listed above led to exports of cassava products fallingfrom an average of 800 tons per year in 1973-1975 to about 200 tons in 1976.
56. For most of the smaller producers of cassava products there isusually no clear-cut distinction between the various stages which are foundin larger commercial operations. A small producer may reap his own cassavaor purchase the crop of his relatives or neighbors before the crop isharvested. fie will then reap and produce the various products (maybe with

APPENDIXPage 15
the help of other family members) and these products will be sold in themarket to the final consumers.
57. In its 1975-1980 plan the Ghana government intends to have anadditional 93,600 ha of cassava farms with production increase of about1,019,000 tons of cassava. Of this, the Ghana Community Farms and the StateFarms Corporation, plan to open up about 6,400 ha. and each of these agencieswill also establish plants to process gari, tapioca and cassava chips.Additionally, by 1980, the Tema Food Complex will be processing 468,326 tonsof cassava pellets for the export market. The Food Research Institute hasbeen trying to substitute cassava flour for wheat flour in bread and otherproducts which use wheat flour. Initial tests show that the public may acceptsuch a combination but this will require intensive public education programs.Perhaps less than 10 percent of cassava flour can be substituted in theseproducts. However, considering the fact that wheat flour is totally importedand it is consumed in ever-increasing quantities, even a 10 percent substitu-tion rate may be a good start.
Rice Milling
58. Rice is grown in several regions of Ghana but over 80 percent ofthe country's output is now produced in the Northern Region, the Upper Regionand the Volta Region. In 1973, just over 73 percent of the total output camefrom these three regions. Smallholders account for about 75 percent of theacreage planted and about 63 percent of the rice produced in 1975. Large-scale private owners planted about 20 percent of the total area and theremainder was cultivated by public agencies such as the State Farms Corpora-tion.
59. Encouraged by liberal governmental subsidies and other inducementsin promotion of an import-substitution policy, many farmers began to cultivatepaddy in Ghana. Between 1961 and 1971 the area under cultivation increasedslowly, but between 1971 and 1973 it grew by about 16 percent per year. Thenational output was about 34,615 tons in 1961 compared to about 56,000 tonsin 1973. In spite of these recent increases, Ghana still imported milledrice up to 1974 to meet about half of its domestic requirements. The Gov-ernment banned further rice imports in 1974 in an effort to boost domesticproduction.
60. In 1967, total annual milling capacity (excluding traditionalmethods) averaged 1,018 tons for parboiled rice and 14,253 for hulled rice.Additionally, milling capacity for 10,018 tons of parboiled rice and 3,054tons of hulled rice was installed in 1968. Government rice mills competewith several small privately-owned mills as well as with individuals whouse home-made implements to crush paddy and extract the rice.
61. The rice which is produced in Ghana is not of a very high quality.There is a very high percentage of broken rice and foreign matter in themilled rice. Part of the reason for the existence of this problem is theextreme temperatures in the northern areas which cause the grains to break.

APPENDIXPage 16
Other contributing reasons include poor milling due to inexperienced millersand/or old equipment and the limited use of parboiling facilities beforemilling. Although Ghanaians do not seem to be too concerned about thisproblem, they may at a later stage. Also, producers who intend to nroducerice for the export market will find that a high proportion of broken ricewill not be acceptable to many foreign consumers.
62. Apart from location and administrative problems, there are severalfactors which place government mills at a disadvantage when it competeswith private mills. With appropriate adjustments, the small village millprocesses paddy, maize, millet, guinea-corn, konkonte, groundnut, copra andpalm kernel. It is therefore used much more intensively and so milling feescan be much lower than for the single-purpose government mills. Added tothis, the owner of the village mill may offer better credit facilities,quicker payment and higher prices for farmers' products and other serviceswith which government mills cannot readily compete. These small mills arealso much more accessible than the government mills.
63. Partly as a result of these factors, fourteen of the government'sfifteen mills remained idle for several years after installation and thefifteenth mill at Tamale operated well below capacity. In 1970, a neweffort was made to reopen the government mills at Tamale, Yendi, Bolga,Bawku, Wa and Kwame Damso. At each of these locations the mills couldprocess 2 tons of paddy per hour while at the Tamale mill the capacitywas 4 tons per hour. Milling records for 1970-71 were as shown on page 46.
64. For the 1973/1974 crop, the government's target and actual purchasesfor the various regions were as follows:
Table 4: RICE PURCHASES BY RICE MILLS UNIT
Purchases (180 lb. bag paddy)
Region Target Actual % of target purchased
Northern 146,920 78,616 54Upper 73,460 11,161 15Brong Ahafo 5,000 645 13Volta 5,000 173 3
TOTAL 230,380 90,595 39
Bad weather was one of the main factors responsible for the low volumepurchased but several others including inadequate transport facilities,bush fires, the low price offered by the government and its delayed paymentsalso had their effect upon these purchases.
APPENDIXPage 17
65. To help improve the utilization capacity of its mills, governmentdecided to grow some of its own paddy. Four hundred hectares of farmlandswere acquired, from the State Farms Corporation at Demon but through lackof adequate machinery and inputs, only about 160 ha. were planted in 1975.From this land, about 200 bags of paddy were reaped in 1976 before firedestroyed the rest of the crop. The Rice Mills Unit decided to move else-where for the 1977 crop and so it purchased about 800 ha. acres of farm-land at Salaga and discarded its Demon holdings. The dry weather and lackof machinery are affecting land preparation but it is hoped that most ofthe latter problem will be solved through recent machinery purchases madeby the unit.
66. Along with expansion of its croplands, the government is alsopurchasing more rice milling equipment. Six mills, each with capacity ofone ton per hour, have been purchased from Japan. Of these mills, two willbe at Tamale, one at Salaga, and one at Kumasi. Existing mills at Tamalewill also be replaced by a 4-ton per hour German mill and a parboilingunit of two tons per hour.
67. The Tamale facility has 12 storage bonds each with a capacity of25,000 bags. There are also two silos each of which can store 14,000 bagsof paddy. Each of the other mills has smaller storage facilities forapproximately 25,000 bags of paddy.
68. The Nasia Project. The Nasia Rice Scheme is located at Tamale.It is owned by a consortium of Ghanaian banks and it began operations in 1976with a long-range target of developing about 12,000 ha. acres of rice farm andestablishing mills to process the crop. For the 1976-77 crop 3,360 ha. acreswere planted and total output was about 16,000 bags. By August 1977 milling(4 ton/hr) and parboiling (2 ton/hr) facilities will be established, and inaddition to existing storage facilities of 1,000 tons, there will be another1,000 ton capacity.
69. There is an adequate supply of farm machinery and spare parts andthe company has plans to work with private outgrowers to establish about 80farms of 100 ha. each. These private growers will receive a wide range ofassistance from the company, and in return for this, they have to agreeto sell at least one half of their crop to the company. The company willpay the going price less the cost of the services which were provided to thefarmers.
70. For the 1975-1980 plan period, an additional area of about 27,200ha. is to be cultivated with rice in Ghana. Small farmers and privateproducers will be encouraged to cultivate rice but most of this increaseis expected to arise through large-scale activities of agencies such asthe Ministry of Agriculture, the Grains and Legumes Development Board,Ghana Community Farms and the IBRD/Ghana Upper Region Agricultural Project.
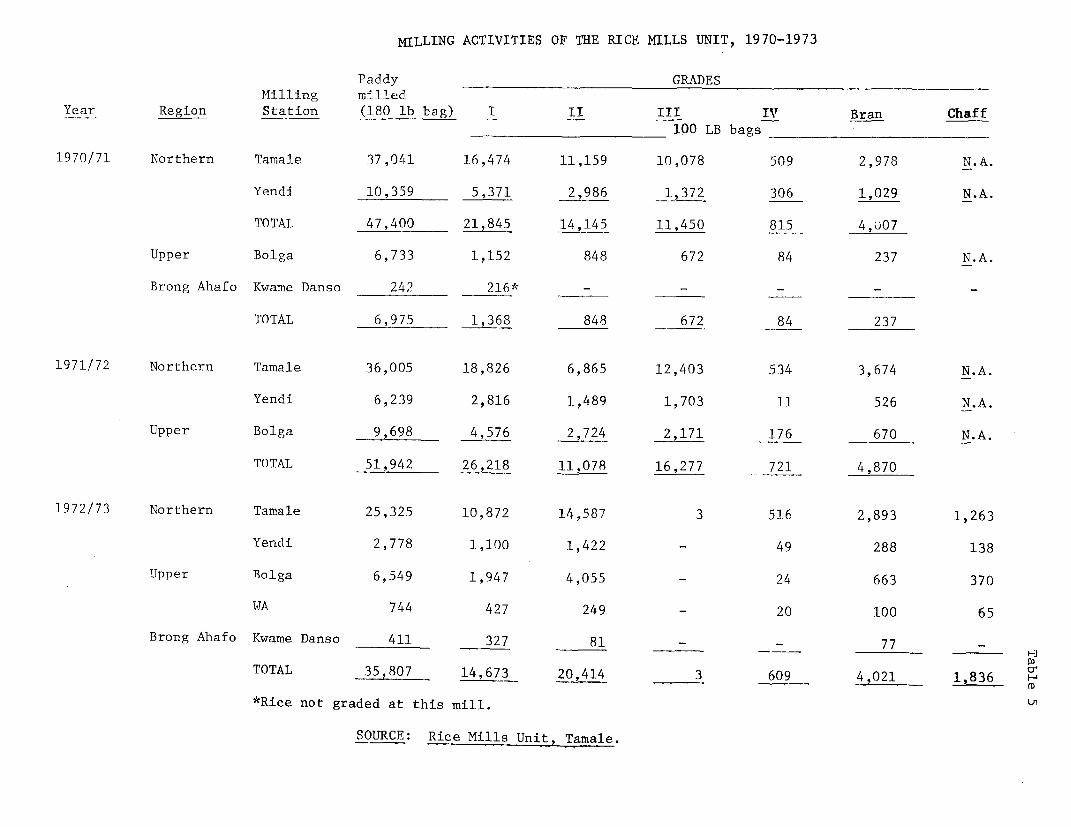
MILLING ACTIVITIES OF THE RICE MILLS UNIT, 1970-1973
Paddy GRADESMilling Tr,.1Ie d
Year Region Station (180 lb bag) I II III IV Bran Chaff100 LB bags
1970/71 Northern Tamale 37,041 16,474 11,159 10,078 509 2,978 N.A.
Yendi 10,359 5,371 2,986 1,372 306 1,029 N.A.
TOTAL 47,400 21,845 14,145 11,450 815 4,607
Upper Bolga 6,733 1,152 848 672 84 237 N.A.
Brong Ahafo Kwame Danso 242 216* - - - -
TOTAL 6,975 1,368 848 672 84 237
1971/72 Northern Tamale 36,005 18,826 6,865 12,403 534 3,674 N.A.
Yendi 6,239 2,816 1,489 1,703 11 526 N.A.
Upper Bolga 9,698 4,576 2,724 2,171 176 670 N.A.
TOTAL 51,942 26,218 11,078 16,277 721 4,870
1972/73 Northern Tamale 25,325 10,872 14,587 3 516 2,893 1,263
Yencli 2,778 1,100 1,422 - 49 288 138
Upper Bolga 6,549 1,947 4,055 - 24 663 370
WA 744 427 249 - 20 100 65
Brong Ahafo Kwame Danso 411 327 81 - - 77 -
TOTAL 35,807 14,673 20,414 3 609 4,021 1,836
*Rice not graded at this mill.
SOURCE: Rice Mills Unit, Tamale.

APPENDIXPage 19
Cotton
71. Cotton is almost exclusively a smallholder crop. The major tex-tile manufacturing companies have recently embarked on estate type productionprojects but their contribution to national production, estimated at 7,600tonnes for 1976/77, has been negligible so far.
72. The Cotton Development Board (CDB) which was founded in 1968 isresponsible for all production aspects of the smallholder crop as well asmarketing, ginning, research and seed multiplication. CDB headquartersis in Tamale and its operations are split geographically into two areas,each managed separately. The Northern Area comprises the Upper and NorthernRegions, which account for about 65 percent of total output,while the Southern Area covers the rest of the country.
73. CDB field staff work within political boundaries on a Districtbasis and are responsible for both production extension and buying. Wherepossible farmers are encouraged to group together and block farming is beingpromoted, an average of 0.6 ha. per participant being aimed for. CDB assistsin organizing or providing the initial mechanical cultivations, includingclearing, for which normal government rates are charged. Block farmingis mainly confined to those northern parts of the country where there are noland ownership problems; it improves extension effectiveness and facilitatesmarketing economies.
74. CDB provides fertilizers and insecticides to registered farmers andmakes available knapsack sprayers seasonally on the basis of one for every4 ha. of growing cotton. Input distribution is by CDB and hired transportand delivery is made as near as possible to farmgate. This is in markedcontrast to the input supply practices followed by MA. A capital amountof ¢ 2.5 million has been budgeted to cover the cost of inputs to CDB in1977/78.
75. Seed cotton is purchased by mobile buying teams operating one ortwo rounds. Usually about 80 percent of the crop is bought on the firstround. Growers assemble their cotton at mutually agreed collecting points tomeet a pre-arranged buying schedule. On average four buying teams operatedin each District in 1976/77, it is planned to increase this to eight in1977/78. Seed cotton is bought in a single grade, and initially presentedpacked in a hessian square, supplied by CDB. After quality inspection itis weighed and then bulked on to truck. When feasible the resultant loadsare check weighed into the ginnery area or store as a form of buying con-trol. Information concerning buying team performance is not yet availablefor the recent season but in 1975 it was low, rather less than 5 tons beingbought per team/lorry/day.
76. Ginning and Storage. CDB has two 3 x 40 saw gins situated at Waand Tamale and the use of a 90 Saw Murray Gin owned by Ghana TextileManufacturing Company, at Tema. Available capacity is inadequate for

APPENDIXPage 20
the 1976/77 crop. Although additional equipment is being installed, CDBwill be hard pressed to have this operational before the onset of the rainsprevents ginning from being a practical proposition. Erection and instal-lation of a 90 saw gin at Wa has in fact been completed, but the plant isinoperative due to lack of electrical power. Building construction fora 3 x 128 less one Lummus gin is in progress at Tamale where the machineryis on site ready for installation. Work seemed quite well advanced in March1977 but with machinery installation not then started there was still nofirm indication as to expected completion date. When both the Wa and Tamaleginneries are established CDB capacity, excluding the 3 x 40 saw gins whichare not really suited for continuous operation, will be about as follows:
Situation Tonnes seed cotton
Wa 2,600Tamale 16,000 1/
Future planning provides for the Tamale gin plant to be replicated atKumasi, Ho, Wa and Pwalugu and for a further stand to be added at Tamale.Provision for the Kumasi and Ho installations is contained in the 1977/78budget. The future construction program reflects the planned fivefoldexpansion of seed cotton production by 1980, and in 1976 prices wouldrepresent an investment in excess of ¢ 4.5 million. Monitoring the timingof such a large program will be made more difficult by the long lead onmachinery deliveries and subsequent installation. Given the ambitiousnature of the production plans, however, vigilant and realistic monitoringwill be essential if scarce capital is not to be unnecessarily and waste-fully committed through under-utilization of plant or poor siting.
77. The GTMC gin capacity probably will be increasingly taken up byestate grown cotton and thus less available to meet emergency requirements,although at least one estate is planning to install its own gin. Some elas-ticity in ginning can be induced by increasing storage facilities whichallows improved gin capacity utilization, particularly at the end of theseason, and permits an early start to be made in the new season on anyunavoidable carry-over stocks of seed cotton.
78. CDB has about 1,200 tons covered storage available at Tamale and afurther 500 tons at Wa. An additional 2,000 tons is under constructionat Tamale, some of which although unfinished is already being used as anemergency measure. Covered storage has been and probably will continue to beinadequate over the short term. Seed cotton storage problems and requirementsare made more onerous by the bulk handling techniques that have been adopted;there has already been at least one instance of spontaneous combustion instored seed cotton. The need to limit seed temperatures in order to avoidsevere degradation of oil quality and content makes some form of coveredstorage for seed highly desirable.
1/ Assumes 140 day ginning season, 80 percent utilization at 65 percentmanufacturers estimated capacity.

APPENDIXPage 21
79. Varieties. Medium staple (1-1/32" to 1-1/16") varieties are grown;BGA 592 in the Northern and Upper Region, Allen 333 elsewhere. BGA 592 ginsout up to 39 percent and Allen 333 only to 37 percent, but this latter varietyis being progressively replaced by HAR 4442 which has a ginning percentage ofabout 40 percent. Private estates tend to follow CDB recommendations, althoughthere is no legal requirement in this respect, and Akasombo Textiles who usemachine pickers import an appropriate variety seed, "Stoneville", directlyfrom USA.
80. Seed multiplication is done by CDB on its own sites, subsequentbulking being carried out by smallholders in selected areas. Planting seedis dressed prior to distribution but is not delinted and there is no selec-tion from within the bulk. Surplus seed is exported, despite the shortageof edible oils and animal feed in Ghana.
81. Future Development. No formal CDB financial accounts have beensighted but from other evidence the cost of developing cotton productionusing the task force approach is and has been substantial. 1/ CDB activitiesare an inevitable but nevertheless unfortunate mix of public service andcommercial type operation. A high farmgate price plus the lavish provisionof services and inputs has been used as a production incentive. The successof this approach is clearly demonstrable, although the unilateral method hasresulted in some of the increased output being at the expense of other econo-mically desirable production, notably food crops. The arbitrary nature ofgovernment controlled prices (seed cotton above financial import parity, lintbelow it) means that CDB viability depends on continuing subsidy. Actualemployment of this subsidy is masked by the comprehensive nature of CDBoperations. This in turn makes it impossible to assess the true costs andefficiency of what are properly commercial operations, namely marketing andprocessing, and therefore the extent to which the subsidy is justified.
82. Given the large number of general extension staff and the factthat cotton is now an established crop, the role of CDB needs to be re-appraised. The feasibility of translating it into a fully commercialized andproperly structured company solely engaged in marketing and processing shouldbe carefully examined. If reoriented in such a way it's capital commitmentwould ensure that CDB remained a powerful production catalyst, while therewould be added incentive to improve seed selection, sorting and processing andto develop more positive approaches to primary marketing. A "commercialized"CDB would still be able to implement official pricing policies, providedgovernment maintained a price subsidy account with CDB to make up any differ-ences between officially set selling prices and those which can be finan-cially justified.
1/ For 1975/76 it was estimated that administrative and operationaloverheads accounted for over 70% of CDB income from sales. Governmentsubsidy exceeded ¢ 4 million in respect of seed cotton purchases plusall expenditure on inputs and capital and other developments.

APPENDIXPage 22
83. It is sometimes argued that the present marketing system is themost economic possible since it makes better use of staff who would other-wise only be fully employed during the growing season. This argumentpresumes a constant relationship between extension staff and production andignores the inefficient use of transport inevitably associated with mobilebuying. With continuing expansion marketing arrangements will have to changeand improve if they are not to constitute a constraint on production. Theuse of a two tier price structure should be examined, a higher price beingpayable for cotton delivered to gin. Such a system, which is successfullyemployed elsewhere, encourages greater participation by local traders aswell as the development of group marketing by farmers associations. Indi-vidual farmers can be helped against price exploitation through officiallyestablished market points and, where essential, by associated CDB buyingteams.
84. Proper seed selection processes need to be instituted; this willinvolve delinting and subsequent sorting. Relatively little equipment isrequired for sorting, depending on the delinting process used but theinstallation required for this latter tends to be expensive. A furtherdegree of vertical integration may therefore be desirable and the feasibilityof establishing delinting, seed selection, crushing and oil extraction at themain gin site, (Tamale) requires careful investigation. All seed destinedfor oil extraction has to be delinted prior to crushing and it is logicalthat this should be carried out as near to the gin as possible. Whetherinstalling further processing at this point can be justified depends onthe capacity, suitability and situation of existing seed crushing plantand requires a full scale technical evaluation.
85. Finally, suitable legislation covering cotton production and market-ing needs to be introduced as soon as possible. Cotton is attractive tomany insects whose populations can build up at an alarming rate and despiteappropriate spraying regimes. Timely uprooting helps to control diseasesand pests and uprooting dates should be established and enforced by law.Similarly, it is desirable to limit the range of insecticides used in orderto assist maintaining adequate supplies and speedy stock turnover. Permittedvarieties and associated planting areas need to be defined in order to pre-vent varietal degradation. The specific responsibilities and duties of thevarious organizations associated with the industry also need to be stipulatedin order to clarify the structure and prevent confusion.
Other Crops
86. Two other crops, rubber and kenaf, should be examined here. Eventhough these are not food crops, they can help in providing some insightsinto various aspects of processing activities.
87. Kenaf. The Best Fibres Development Board at Kumasi is the prin-cipal unit involved in kenaf production. GIHOC has also started to cul-tivate kenaf but its operation is still very small. Kenaf is cultivatedin the Eastern Region, the Ashanti Region, the Brong Ahafo Region, theNorthern Region and the Upper Region. In the 1974-1975 crop-year, about

APPENDIXPage 23
859 ha. were cultivated. This increased to 920 ha. for the 1975-1976 cropyear and to 1,000 ha. in the following year. The Best Fibres Board buysfiber from two types of farmers - those who cultivate the crop individually on1 to 10 ha. plots and those who form cooperatives of 5-12 members and culti-vate between 40 and 60 ha.
88. Some farmers sell only their ribbons to the Board while others soakthese ribbons and sell the fiber which they produce. The Board has its own
netting tanks in the Ashanti region (cap. 42 tons), the Brong-Ahafo Region(cap. 80 tons) and the Northern Region (cap. 20 tons). Additional tanks withtotal capacity of about 428 tons are now under construction at the abovelocations. The fibre which the Board buys and produces is sold to GIHOC'sfibre bag mill at Kumasi. In 1972 about 0.02 percent of the factory's capa-city was met from locally-produced fibre. In 1973 it rose to 0.6 percent, and
in 1974 it was about 0.9 percent.
89. For 1975, Ghana imported 12,135 tons of jute from Ceylon and
Pakistan for which it paid ¢ 1,281,216. The CIF cost per ton of importedjute was thus ¢ 105.58. According to figures supplied by the Board, itsvariable cost per ton of kenaf fibre was ¢ 948.86. Apart from qualityaspects and the regularity of supply, it was over nine times more expensiveto produce fibre domestically in 1975. Even with exchange-rate adjustments,
these figures still differ by a wide margin.
90. The Best Fibre Development Board has as its target satisfactionof 40 percent of the requirements of the jute factory by 1980. At the same
time GIHOC plans to expand its production of kenaf and the Ghana CommunityFarms will also be producing kenaf. These agencies and private farmers will
produce over 20,000 additional hectares of kenaf by 1980. Before furtherexpansion of kenaf production is undertaken, the government should reconsiderthe economic costs of achieving self-sufficiency in this crop.
91. Rubber Production. Almost all of Ghana's rubber output comesfrom the Western, Central and Eastern Regions. Like palm trees, rubber treestake several years to mature and produce maximum yields. It is, therefore,not easy to estimate acreage under production and acreage in various stages ofmaturity. In 1973, there were about 10,800 acres under rubber in Ghana.Although most rubber producers are companies which have large plantations,there are a few individual growers who are beginning to supply a small amountof rubber also. In 1974, about 2,000 tons of rubber were produced in Ghana.Output rose to about 2,500 tons in 1975, and in 1976, it was about 3,000 tons.Between 1973 and 1976 the area under rubber expanded by over 2,800 ha. asseveral new companies entered and existing ones expanded their plantations.More trees are also reaching the tapping stage, and as this occurs, thenation's rubber output will be greatly expanded.
92. The Firestone company has one of the largest rubber plantations inGhana. It took over some State Farm plantations and it now operates it in a

APPENDIXPage 24
partnership arrangement with the government (Firestone 40 percent, Governmentof Ghana 60 percent). There are 10,000 ha. under cultivation of which about4,800 ha. are mature and being tapped. An expansion program involving about6,000 ha. is now underway. The rubber is sold in semi-processed sheet form tothe company's tire factory which uses it for the production of new tires aswell as for recapping old tires. Some rubber is also used for shoe-production.Outgrowers tap about 400 ha. of their trees and sell the output to the com-pany. The outgrowers receive a variety of assistance from the company. Theseinclude extension services, seeds, budded stumps, and tapping equipment.However, unlike other programs such as the GIHOC outgrower program, thesefarmers have to pay for their equipment and services at the same time thatthe company provides them.
93. Rubber production in Ghana appears to be a profitable operationand it is encouraging the entry of several new producers. The State FarmsCorporation along with various private companies and individuals plan toplant almost 20,000 ha. additional acres of rubber by 1980.