Embed Size (px)
Citation preview
Pakistan: Reinvigorating the Trade Agenda José Guilherme Reis and Daria Taglioni
Policy Paper Series on Pakistan PK 15/12
March 2013
86255
Pub
lic D
iscl
osur
e A
utho
rized
Pub
lic D
iscl
osur
e A
utho
rized
Pub
lic D
iscl
osur
e A
utho
rized
Pub
lic D
iscl
osur
e A
utho
rized

_______________________________________________ This publication is a product of the South Asia Poverty Reduction and Economic
Management Unit. It is part of a larger effort by the World Bank to provide open access to its
research and make a contribution to development policy discussions in Pakistan and around
the world. Policy Working Papers are also posted on the Web at http://econ.worldbank.org.
The authors may be contacted at [email protected] and
Abstract This paper reviews Pakistan’s recent trade performance, its trade policy and trade costs.
Different dimensions of trade performance—growth and orientation, diversification and
sophistication—are assessed, complemented by an in-depth analysis of export dynamics in
the period 2001-10 using firm-level data. An econometric exercise is also performed to
identify the impact of tariffs, exchange rates, fixed costs to export, foreign demand, and
preferential trade policy on the ability of firms to increase their exports. The analysis of
Pakistan’s trade policy includes tariffs, effective protection and trade restrictiveness
estimates, as well as an assessment of the role of preferential trade agreements in the context
of regional integration. Finally, the main characteristics of trade facilitation and logistics are
analyzed, covering the capacity, performance, quality of services and degree of integration of
the logistics system.
The Policy Research Working Paper Series disseminates the findings of work in progress to
encourage the exchange of ideas about development issues. An objective of the series is to get
the findings out quickly, even if the presentations are less than fully polished. The papers
carry the names of the authors and should be cited accordingly. The findings,
interpretations, and conclusions expressed in this paper are entirely those of the authors.
They do not necessarily represent the views of the International Bank for Reconstruction and
Development / World Bank and its affiliated organizations, or those of the Executive
Directors of the World Bank or the governments they represent.
Pakistan: Reinvigorating the Trade Agenda
José Guilherme Reis and Daria Taglioni
This paper was prepared by José Guilherme Reis and Daria Taglioni, with contributions
from Nihal Pitigala and Maros Ivanic (Trade Policy), Charles Kunaka (Trade Facilitation),
Megha Mukim (Export Performance) and Florencia Piacci (Research Assistance). The
authors would like to thank valuable comments and suggestions from José R. Lopez Calix,
Eric Manes, Thomas Farole and Daniel Reyes. The team also consulted with authorities from
the Ministry of Commerce, PITAD and Central Bank.
Pakistan: Reinvigorating the Trade Agenda
1
Table of Contents
Executive Summary 4
Background 6
Overview of Trade Performance, Trends and Outcomes 8
Trade Policy Objectives, Tools for Implementation and Effectiveness 24
Policy Recommendations 54
References 60
Annexure 63
Figures
Figure 1 Openness to Trade 6
Figure 2 Export Growth: 1980-2010 8
Figure 3 Pakistan’s Exports, Predicted vs. Actual Flows (2007-09) 11
Figure 4 Herfindahl Index of Export Product and Market Concentration 11
Figure 5 Intensive and Extensive Margin in Products and Markets 12
Figure 6 Technological Content of Exports 13
Figure 7 Export Sophistication (EXPY), 2002-10 13
Figure 8 Export Sophistication 14
Figure 9 Services Trade Restriction Index (STRI) 15
Figure 10 Pakistan: STRI by Sector 15
Figure 11 Export of Service, Pakistan and Peer Countries 16
Figure 12 Service Export Sophistication (EXPY) 16
Figure 13 Total FDI Inflows (US$ Million) 18
Figure 14 FDI Inflows by Sector (US$ Million) 18
Figure 15 Concentration of Exports Across Exporters 18
Figure 16 Entry and Exit Rates in Pakistan and in Peer Countries 19
Figure 17 Annual Export Growth Generated by Firm Churning (Firm Extensive Margin) 19
Figure 18 Annual Export Growth Generated by Firm Entry and Exit from Specific Export Markets (Country Extensive Margin)
19
Figure 19 Annual Export Growth Generated by Firm Entry and Exit into/from New Sectors and New Products (Sector and Product Extensive Margin)
20
Figure 20 The Intensive Margin of Exports, Annual Export Growth 21
Figure 21 Survival Rates After 1 Year of Export Activity 21
Figure 22 The Margins of Export, Annual Export Growth 22
Figure 23 Estimated OTRI (Except for Pakistan, Baseline Year 2007) 26
Figure 24 Pakistan’s Tariff Reform, MFN Unweighted Average (1982-09) 28
Figure 25 Distribution of Tariff Rates, by Frequency, including Regulatory Duties (2009-10)
29
Figure 26 Distribution of effective tariff rates by frequency, including regulatory duties (2009-2010)
29
Figure 27 Decomposition of statutory and applied tariff rate variation 35
Figure 28 Effective Rates of Protection 35
Pakistan: Reinvigorating the Trade Agenda
2
Figure 29 Pakistan’s exports enjoying preferential, non-preferential or MFN-zero tariff in largest twenty world export markets (percentage shares)
38
Figure 30 Change in Pakistan’s total imports (% 2009 total imports) 41
Figure 31 Tariff revenue losses (US$ million) 42
Figure 32 Welfare gains (US$ million) 42
Figure 33 Pakistan’s predicted vs. actual exports 45
Figure 34 India’s predicted vs. actual exports 45
Figure 35 Pakistan Logistic Performance 48
Figure 36 Logistics Performance 49
Figure 37 Transport Prices in Pakistan and Other Regions 50
Figure 38 World Air Services Network Structure: 2011 52
Tables
Table 1 Composition and Growth of Exports by Sector 9
Table 2 Export Share in Selected Destination Markets 9
Table 3 Pakistan: Commercial Services Exports 16
Table 4 FDI Inflows (% of Gross Fixed Capital Formation) 17
Table 5 Survival Rates by Cohort 21
Table 6 Gini coefficients and average statutory and applied tariffs by sector 30
Table 7 Pakistan’s official tariff schedule by stages of processing (2010) 31
Table 8 The Statutory and Effective Duty Regime based on Customs Transactions (2009-2010)
34
Table 9 Sector-wise distribution of key SROs based on Customs Transactions data (2009-2010)
34
Table 10 Preferential Trade Regime for Pakistan’s Exports to Larges 20 Export Markets
38
Table 11 List of Pakistan’s multilateral and preferential trade agreements 40
Table 12 Pakistan: Changes in bilateral imports from main partners as a result of hypothetical full tariff liberalization in current PTAs
41
Table 13 Changes in tariff revenue and welfare as a result of proposed PTAs 43
Table 14 Provisions in Pakistan’s PTAs with SAFTA partners and China 43
Table 15 Pakistan Bilateral Investment Agreements 44
Table 16 Major Non-Tariff Impediments to Pakistan-India Trade 47
Pakistan: Reinvigorating the Trade Agenda
3
Boxes
Box 1 Sophistication of Exports in Pakistan 14
Box 2 Overall Trade Restrictiveness Index: OTRI 25
Box 3 Recent import Tariff and Tax Reforms 30
Box 4 Exception to MFN Regime: SROs 565(I)/2006, SRO 567 (I)/2006 and SRO 575(I)/2006
33
Box 5 Protectionism in the Automotive Sector 37
Pakistan: Reinvigorating the Trade Agenda
4
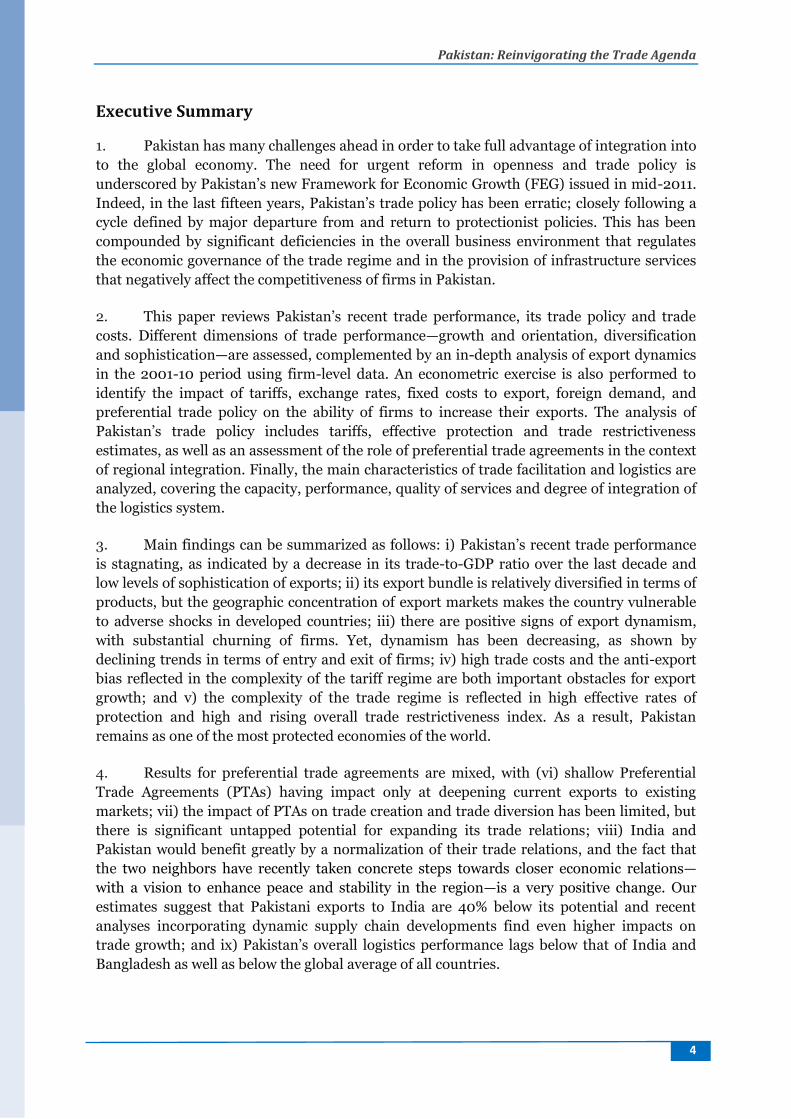
Executive Summary 1. Pakistan has many challenges ahead in order to take full advantage of integration into
to the global economy. The need for urgent reform in openness and trade policy is
underscored by Pakistan’s new Framework for Economic Growth (FEG) issued in mid-2011.
Indeed, in the last fifteen years, Pakistan’s trade policy has been erratic; closely following a
cycle defined by major departure from and return to protectionist policies. This has been
compounded by significant deficiencies in the overall business environment that regulates
the economic governance of the trade regime and in the provision of infrastructure services
that negatively affect the competitiveness of firms in Pakistan.
2. This paper reviews Pakistan’s recent trade performance, its trade policy and trade
costs. Different dimensions of trade performance—growth and orientation, diversification
and sophistication—are assessed, complemented by an in-depth analysis of export dynamics
in the 2001-10 period using firm-level data. An econometric exercise is also performed to
identify the impact of tariffs, exchange rates, fixed costs to export, foreign demand, and
preferential trade policy on the ability of firms to increase their exports. The analysis of
Pakistan’s trade policy includes tariffs, effective protection and trade restrictiveness
estimates, as well as an assessment of the role of preferential trade agreements in the context
of regional integration. Finally, the main characteristics of trade facilitation and logistics are
analyzed, covering the capacity, performance, quality of services and degree of integration of
the logistics system.
3. Main findings can be summarized as follows: i) Pakistan’s recent trade performance
is stagnating, as indicated by a decrease in its trade-to-GDP ratio over the last decade and
low levels of sophistication of exports; ii) its export bundle is relatively diversified in terms of
products, but the geographic concentration of export markets makes the country vulnerable
to adverse shocks in developed countries; iii) there are positive signs of export dynamism,
with substantial churning of firms. Yet, dynamism has been decreasing, as shown by
declining trends in terms of entry and exit of firms; iv) high trade costs and the anti-export
bias reflected in the complexity of the tariff regime are both important obstacles for export
growth; and v) the complexity of the trade regime is reflected in high effective rates of
protection and high and rising overall trade restrictiveness index. As a result, Pakistan
remains as one of the most protected economies of the world.
4. Results for preferential trade agreements are mixed, with (vi) shallow Preferential
Trade Agreements (PTAs) having impact only at deepening current exports to existing
markets; vii) the impact of PTAs on trade creation and trade diversion has been limited, but
there is significant untapped potential for expanding its trade relations; viii) India and
Pakistan would benefit greatly by a normalization of their trade relations, and the fact that
the two neighbors have recently taken concrete steps towards closer economic relations—
with a vision to enhance peace and stability in the region—is a very positive change. Our
estimates suggest that Pakistani exports to India are 40% below its potential and recent
analyses incorporating dynamic supply chain developments find even higher impacts on
trade growth; and ix) Pakistan’s overall logistics performance lags below that of India and
Bangladesh as well as below the global average of all countries.
Pakistan: Reinvigorating the Trade Agenda
5
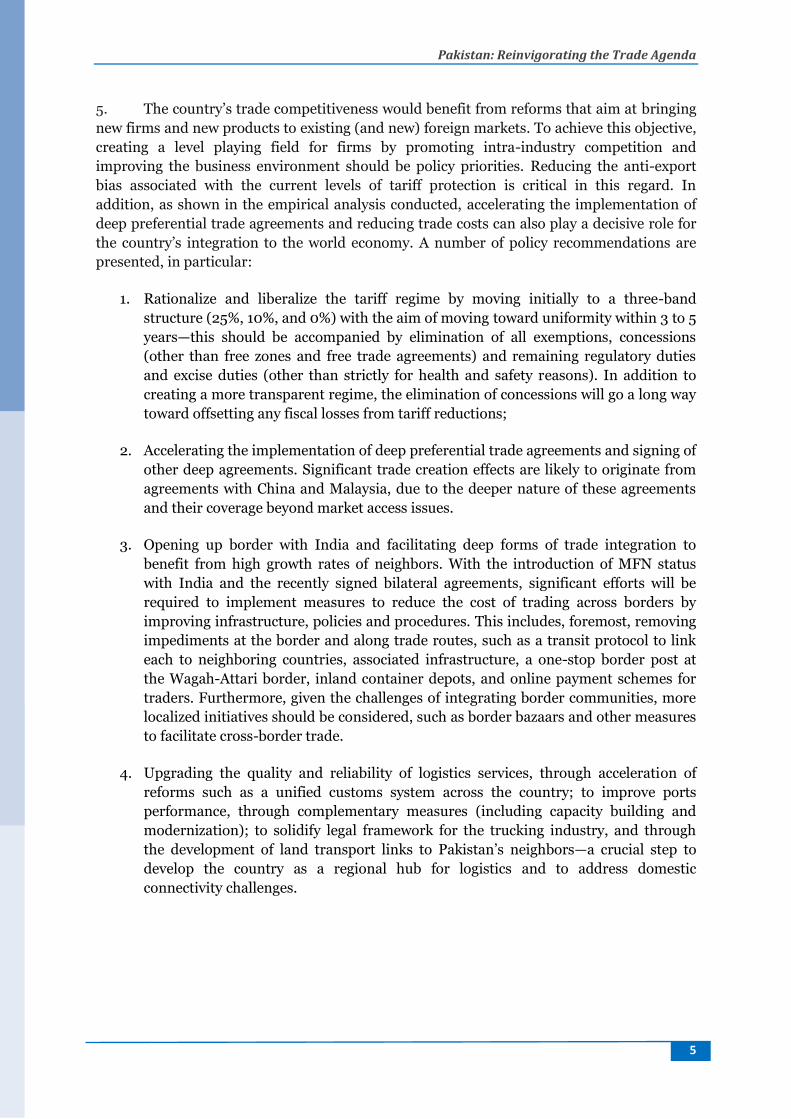
5. The country’s trade competitiveness would benefit from reforms that aim at bringing
new firms and new products to existing (and new) foreign markets. To achieve this objective,
creating a level playing field for firms by promoting intra-industry competition and
improving the business environment should be policy priorities. Reducing the anti-export
bias associated with the current levels of tariff protection is critical in this regard. In
addition, as shown in the empirical analysis conducted, accelerating the implementation of
deep preferential trade agreements and reducing trade costs can also play a decisive role for
the country’s integration to the world economy. A number of policy recommendations are
presented, in particular:
1. Rationalize and liberalize the tariff regime by moving initially to a three-band
structure (25%, 10%, and 0%) with the aim of moving toward uniformity within 3 to 5
years—this should be accompanied by elimination of all exemptions, concessions
(other than free zones and free trade agreements) and remaining regulatory duties
and excise duties (other than strictly for health and safety reasons). In addition to
creating a more transparent regime, the elimination of concessions will go a long way
toward offsetting any fiscal losses from tariff reductions;
2. Accelerating the implementation of deep preferential trade agreements and signing of
other deep agreements. Significant trade creation effects are likely to originate from
agreements with China and Malaysia, due to the deeper nature of these agreements
and their coverage beyond market access issues.
3. Opening up border with India and facilitating deep forms of trade integration to
benefit from high growth rates of neighbors. With the introduction of MFN status
with India and the recently signed bilateral agreements, significant efforts will be
required to implement measures to reduce the cost of trading across borders by
improving infrastructure, policies and procedures. This includes, foremost, removing
impediments at the border and along trade routes, such as a transit protocol to link
each to neighboring countries, associated infrastructure, a one-stop border post at
the Wagah-Attari border, inland container depots, and online payment schemes for
traders. Furthermore, given the challenges of integrating border communities, more
localized initiatives should be considered, such as border bazaars and other measures
to facilitate cross-border trade.
4. Upgrading the quality and reliability of logistics services, through acceleration of
reforms such as a unified customs system across the country; to improve ports
performance, through complementary measures (including capacity building and
modernization); to solidify legal framework for the trucking industry, and through
the development of land transport links to Pakistan’s neighbors—a crucial step to
develop the country as a regional hub for logistics and to address domestic
connectivity challenges.
Pakistan: Reinvigorating the Trade Agenda
6
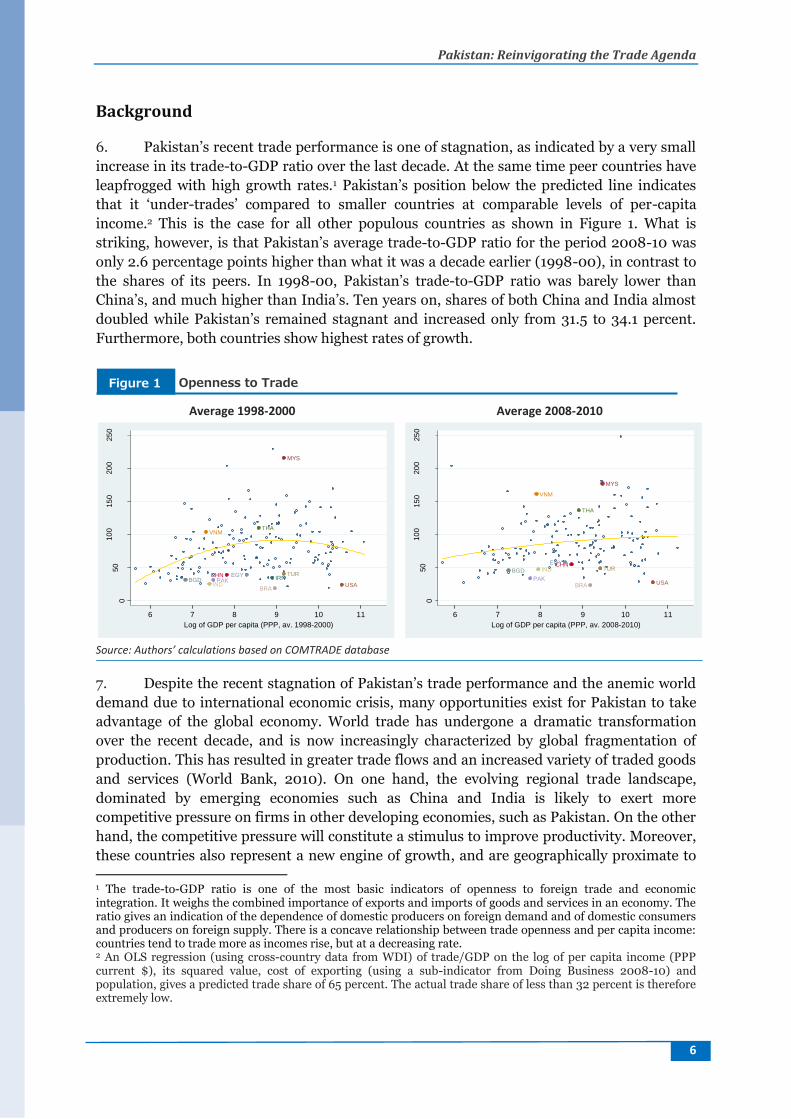
Background 6. Pakistan’s recent trade performance is one of stagnation, as indicated by a very small
increase in its trade-to-GDP ratio over the last decade. At the same time peer countries have
leapfrogged with high growth rates.1 Pakistan’s position below the predicted line indicates
that it ‘under-trades’ compared to smaller countries at comparable levels of per-capita
income.2 This is the case for all other populous countries as shown in Figure 1. What is
striking, however, is that Pakistan’s average trade-to-GDP ratio for the period 2008-10 was
only 2.6 percentage points higher than what it was a decade earlier (1998-00), in contrast to
the shares of its peers. In 1998-00, Pakistan’s trade-to-GDP ratio was barely lower than
China’s, and much higher than India’s. Ten years on, shares of both China and India almost
doubled while Pakistan’s remained stagnant and increased only from 31.5 to 34.1 percent.
Furthermore, both countries show highest rates of growth.
Average 1998-2000 Average 2008-2010
Source: Authors’ calculations based on COMTRADE database
7. Despite the recent stagnation of Pakistan’s trade performance and the anemic world
demand due to international economic crisis, many opportunities exist for Pakistan to take
advantage of the global economy. World trade has undergone a dramatic transformation
over the recent decade, and is now increasingly characterized by global fragmentation of
production. This has resulted in greater trade flows and an increased variety of traded goods
and services (World Bank, 2010). On one hand, the evolving regional trade landscape,
dominated by emerging economies such as China and India is likely to exert more
competitive pressure on firms in other developing economies, such as Pakistan. On the other
hand, the competitive pressure will constitute a stimulus to improve productivity. Moreover,
these countries also represent a new engine of growth, and are geographically proximate to 1 The trade-to-GDP ratio is one of the most basic indicators of openness to foreign trade and economic integration. It weighs the combined importance of exports and imports of goods and services in an economy. The ratio gives an indication of the dependence of domestic producers on foreign demand and of domestic consumers and producers on foreign supply. There is a concave relationship between trade openness and per capita income: countries tend to trade more as incomes rise, but at a decreasing rate. 2 An OLS regression (using cross-country data from WDI) of trade/GDP on the log of per capita income (PPP current $), its squared value, cost of exporting (using a sub-indicator from Doing Business 2008-10) and population, gives a predicted trade share of 65 percent. The actual trade share of less than 32 percent is therefore extremely low.
MYS
THAVNM
BGDCHN
PAKIND USA
EGYIRN
TUR
BRA
050
10
015
020
025
0
Tra
de
to G
DP
(%
), 1
99
8-2
00
0
6 7 8 9 10 11
Log of GDP per capita (PPP, av. 1998-2000)
MYS
THA
VNM
BGDCHN
PAK
IND
USA
EGYTUR
BRA
050
10
015
020
025
0
Tra
de
to G
DP
(%
), 2
00
8-2
01
0
6 7 8 9 10 11
Log of GDP per capita (PPP, av. 2008-2010)
Openness to Trade Figure 1
Pakistan: Reinvigorating the Trade Agenda
7
Pakistan, offering greater market opportunities than the debt-ridden and geographically
remote industrialized countries, which currently dominate the trade relations of Pakistan.
8. Yet, for Pakistan there are many challenges ahead. In the last seven years, Pakistan’s
trade policy has been defined by major reversal from the previous trade liberalization and
regulatory simplification program. With a limited, but effective return to more policies and
indigenization programs, Pakistan’s trade policy has become increasingly complex and
driven by vested interests. In addition, there are significant deficiencies in the overall
business environment that affect its economic governance and shortcoming in the provision
of infrastructure services that negatively affect the competitiveness of firms in Pakistan.
9. There is a broad recognition that a new strategy is urgently required in order for
Pakistan to revert course, reinvigorate the trade liberalization agenda and support faster and
sustainable growth. Pakistan’s Strategic Trade Policy Framework 2009-12 provides a
coherent agenda to achieve these objectives by developing a platform that would move
Pakistan away from low value-added and resource-driven activities toward higher value-
added activities. The recent FEG (Planning Commission 2011) also recognizes the critical
role played by trade for self-sustained growth, rightly pointing out that no success story in
growth accelerations has featured exclusive inward-looking strategies.
Pakistan: Reinvigorating the Trade Agenda
8
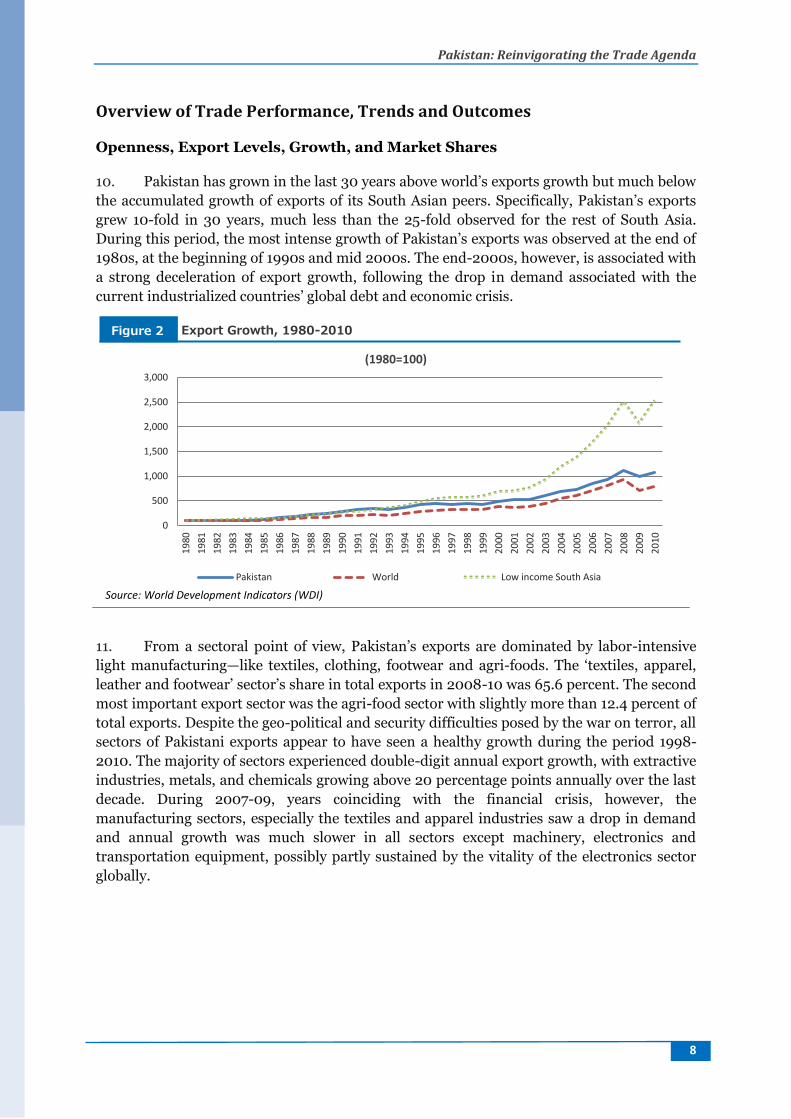
Overview of Trade Performance, Trends and Outcomes Openness, Export Levels, Growth, and Market Shares 10. Pakistan has grown in the last 30 years above world’s exports growth but much below
the accumulated growth of exports of its South Asian peers. Specifically, Pakistan’s exports
grew 10-fold in 30 years, much less than the 25-fold observed for the rest of South Asia.
During this period, the most intense growth of Pakistan’s exports was observed at the end of
1980s, at the beginning of 1990s and mid 2000s. The end-2000s, however, is associated with
a strong deceleration of export growth, following the drop in demand associated with the
current industrialized countries’ global debt and economic crisis.
(1980=100)
Source: World Development Indicators (WDI)
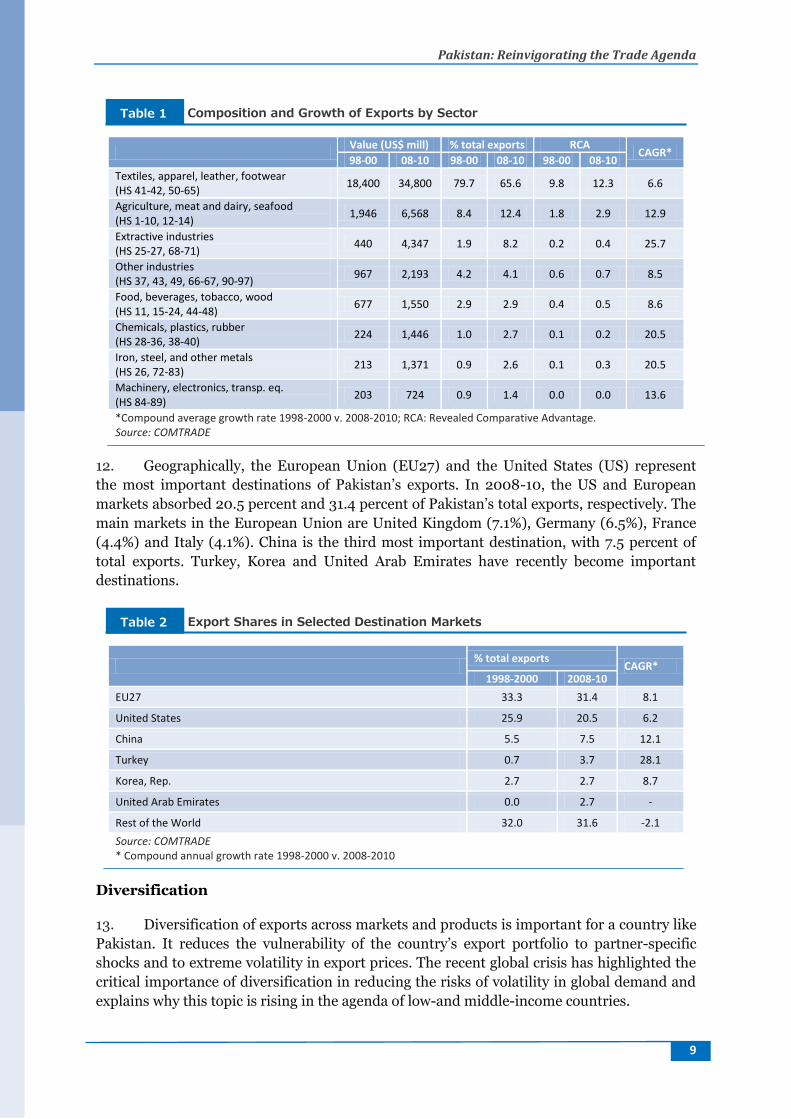
11. From a sectoral point of view, Pakistan’s exports are dominated by labor-intensive
light manufacturing—like textiles, clothing, footwear and agri-foods. The ‘textiles, apparel,
leather and footwear’ sector’s share in total exports in 2008-10 was 65.6 percent. The second
most important export sector was the agri-food sector with slightly more than 12.4 percent of
total exports. Despite the geo-political and security difficulties posed by the war on terror, all
sectors of Pakistani exports appear to have seen a healthy growth during the period 1998-
2010. The majority of sectors experienced double-digit annual export growth, with extractive
industries, metals, and chemicals growing above 20 percentage points annually over the last
decade. During 2007-09, years coinciding with the financial crisis, however, the
manufacturing sectors, especially the textiles and apparel industries saw a drop in demand
and annual growth was much slower in all sectors except machinery, electronics and
transportation equipment, possibly partly sustained by the vitality of the electronics sector
globally.
0
500
1,000
1,500
2,000
2,500
3,000
19
80
19
81
19
82
19
83
19
84
19
85
19
86
19
87
19
88
19
89
19
90
19
91
19
92
19
93
19
94
19
95
19
96
19
97
19
98
19
99
20
00
20
01
20
02
20
03
20
04
20
05
20
06
20
07
20
08
20
09
20
10
Pakistan World Low income South Asia
Export Growth, 1980-2010 Figure 2
Pakistan: Reinvigorating the Trade Agenda
9
Value (US$ mill) % total exports RCA
CAGR* 98-00 08-10 98-00 08-10 98-00 08-10
Textiles, apparel, leather, footwear (HS 41-42, 50-65)
18,400 34,800 79.7 65.6 9.8 12.3 6.6
Agriculture, meat and dairy, seafood (HS 1-10, 12-14)
1,946 6,568 8.4 12.4 1.8 2.9 12.9
Extractive industries (HS 25-27, 68-71)
440 4,347 1.9 8.2 0.2 0.4 25.7
Other industries (HS 37, 43, 49, 66-67, 90-97)
967 2,193 4.2 4.1 0.6 0.7 8.5
Food, beverages, tobacco, wood (HS 11, 15-24, 44-48)
677 1,550 2.9 2.9 0.4 0.5 8.6
Chemicals, plastics, rubber (HS 28-36, 38-40)
224 1,446 1.0 2.7 0.1 0.2 20.5
Iron, steel, and other metals (HS 26, 72-83)
213 1,371 0.9 2.6 0.1 0.3 20.5
Machinery, electronics, transp. eq. (HS 84-89)
203 724 0.9 1.4 0.0 0.0 13.6
*Compound average growth rate 1998-2000 v. 2008-2010; RCA: Revealed Comparative Advantage. Source: COMTRADE
12. Geographically, the European Union (EU27) and the United States (US) represent
the most important destinations of Pakistan’s exports. In 2008-10, the US and European
markets absorbed 20.5 percent and 31.4 percent of Pakistan’s total exports, respectively. The
main markets in the European Union are United Kingdom (7.1%), Germany (6.5%), France
(4.4%) and Italy (4.1%). China is the third most important destination, with 7.5 percent of
total exports. Turkey, Korea and United Arab Emirates have recently become important
destinations.
% total exports
CAGR* 1998-2000 2008-10
EU27 33.3 31.4 8.1
United States 25.9 20.5 6.2
China 5.5 7.5 12.1
Turkey 0.7 3.7 28.1
Korea, Rep. 2.7 2.7 8.7
United Arab Emirates 0.0 2.7 -
Rest of the World 32.0 31.6 -2.1
Source: COMTRADE * Compound annual growth rate 1998-2000 v. 2008-2010
Diversification 13. Diversification of exports across markets and products is important for a country like
Pakistan. It reduces the vulnerability of the country’s export portfolio to partner-specific
shocks and to extreme volatility in export prices. The recent global crisis has highlighted the
critical importance of diversification in reducing the risks of volatility in global demand and
explains why this topic is rising in the agenda of low-and middle-income countries.
Composition and Growth of Exports by Sector Table 1
Export Shares in Selected Destination Markets Table 2
Pakistan: Reinvigorating the Trade Agenda
10
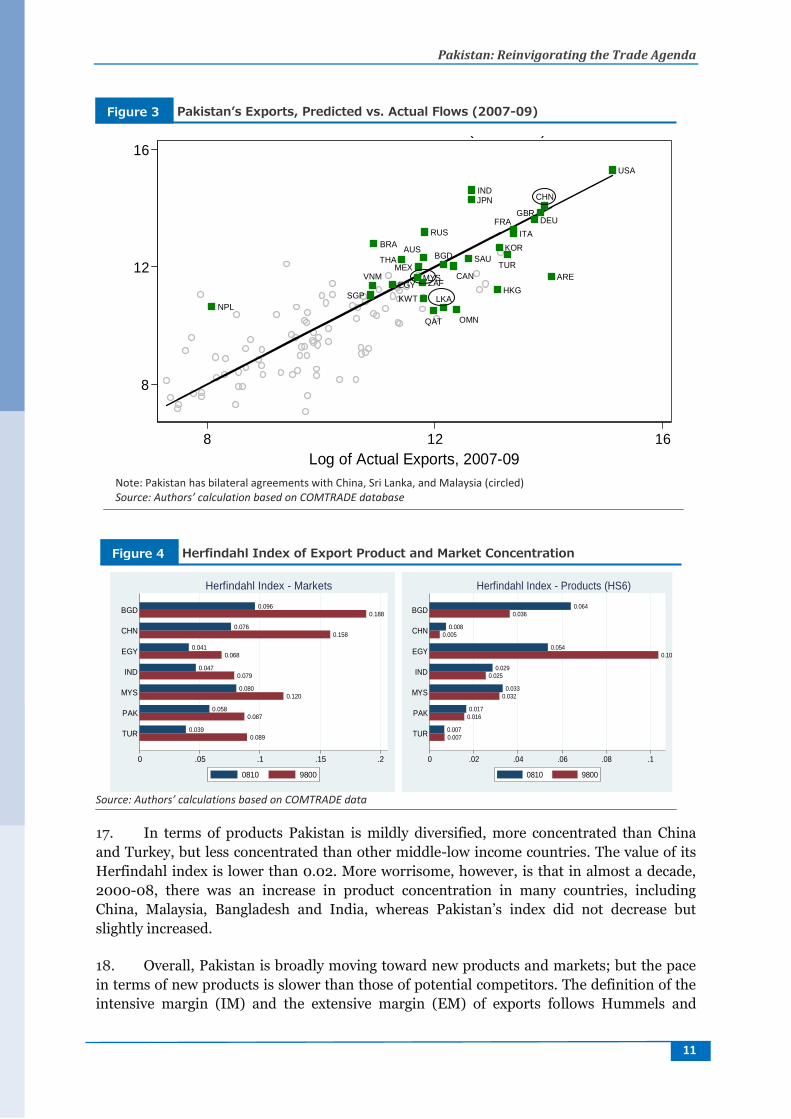
14. Overall, Pakistan’s export bundle is mildly diversified in terms of products, but not
geographically. The emphasis on industrialized countries export markets makes the country
too vulnerable to adverse shocks in these countries. In terms of geographical specialization,
Pakistan’s exports are more diversified than most of its peer countries with the exception of
China and Turkey (Figure 4)—but not so in terms of markets (see below).3
15. Pakistan’s exports are still very concentrated geographically, in the past decade the
country started diversifying, a path followed as well by all the peers. In a decade, the
prominence of US and European markets in Pakistan’s exports has reduced by about 7
percentage points (from 59.2 percent in 1998-2000 to 51.9 percent in 2008-2010). At the
same time the rest of the world has become more important. There is a small increase in
exports to the emerging bloc of Brazil, Russia, India and China (BRIC). UAE, Korea, and
Turkey have also become important destinations
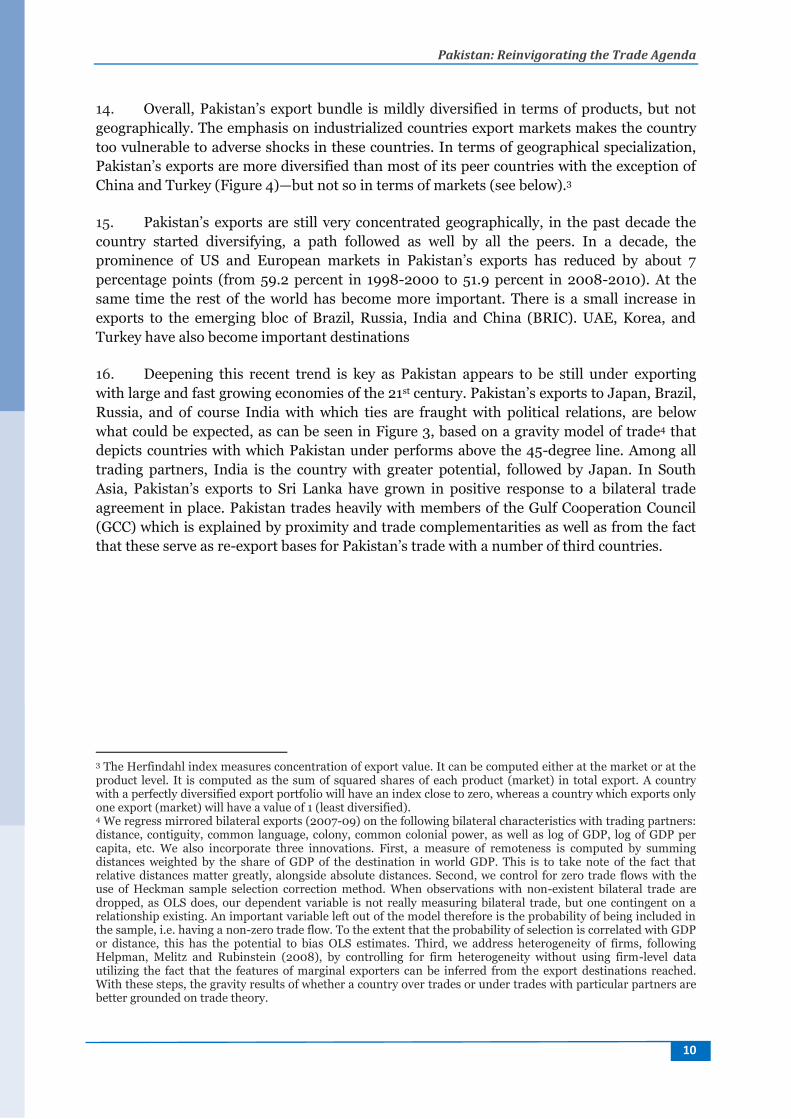
16. Deepening this recent trend is key as Pakistan appears to be still under exporting
with large and fast growing economies of the 21st century. Pakistan’s exports to Japan, Brazil,
Russia, and of course India with which ties are fraught with political relations, are below
what could be expected, as can be seen in Figure 3, based on a gravity model of trade4 that
depicts countries with which Pakistan under performs above the 45-degree line. Among all
trading partners, India is the country with greater potential, followed by Japan. In South
Asia, Pakistan’s exports to Sri Lanka have grown in positive response to a bilateral trade
agreement in place. Pakistan trades heavily with members of the Gulf Cooperation Council
(GCC) which is explained by proximity and trade complementarities as well as from the fact
that these serve as re-export bases for Pakistan’s trade with a number of third countries.
3 The Herfindahl index measures concentration of export value. It can be computed either at the market or at the product level. It is computed as the sum of squared shares of each product (market) in total export. A country with a perfectly diversified export portfolio will have an index close to zero, whereas a country which exports only one export (market) will have a value of 1 (least diversified). 4 We regress mirrored bilateral exports (2007-09) on the following bilateral characteristics with trading partners: distance, contiguity, common language, colony, common colonial power, as well as log of GDP, log of GDP per capita, etc. We also incorporate three innovations. First, a measure of remoteness is computed by summing distances weighted by the share of GDP of the destination in world GDP. This is to take note of the fact that relative distances matter greatly, alongside absolute distances. Second, we control for zero trade flows with the use of Heckman sample selection correction method. When observations with non-existent bilateral trade are dropped, as OLS does, our dependent variable is not really measuring bilateral trade, but one contingent on a relationship existing. An important variable left out of the model therefore is the probability of being included in the sample, i.e. having a non-zero trade flow. To the extent that the probability of selection is correlated with GDP or distance, this has the potential to bias OLS estimates. Third, we address heterogeneity of firms, following Helpman, Melitz and Rubinstein (2008), by controlling for firm heterogeneity without using firm-level data utilizing the fact that the features of marginal exporters can be inferred from the export destinations reached. With these steps, the gravity results of whether a country over trades or under trades with particular partners are better grounded on trade theory.
Pakistan: Reinvigorating the Trade Agenda
11
Note: Pakistan has bilateral agreements with China, Sri Lanka, and Malaysia (circled) Source: Authors’ calculation based on COMTRADE database
Source: Authors’ calculations based on COMTRADE data 17. In terms of products Pakistan is mildly diversified, more concentrated than China
and Turkey, but less concentrated than other middle-low income countries. The value of its
Herfindahl index is lower than 0.02. More worrisome, however, is that in almost a decade,
2000-08, there was an increase in product concentration in many countries, including
China, Malaysia, Bangladesh and India, whereas Pakistan’s index did not decrease but
slightly increased.
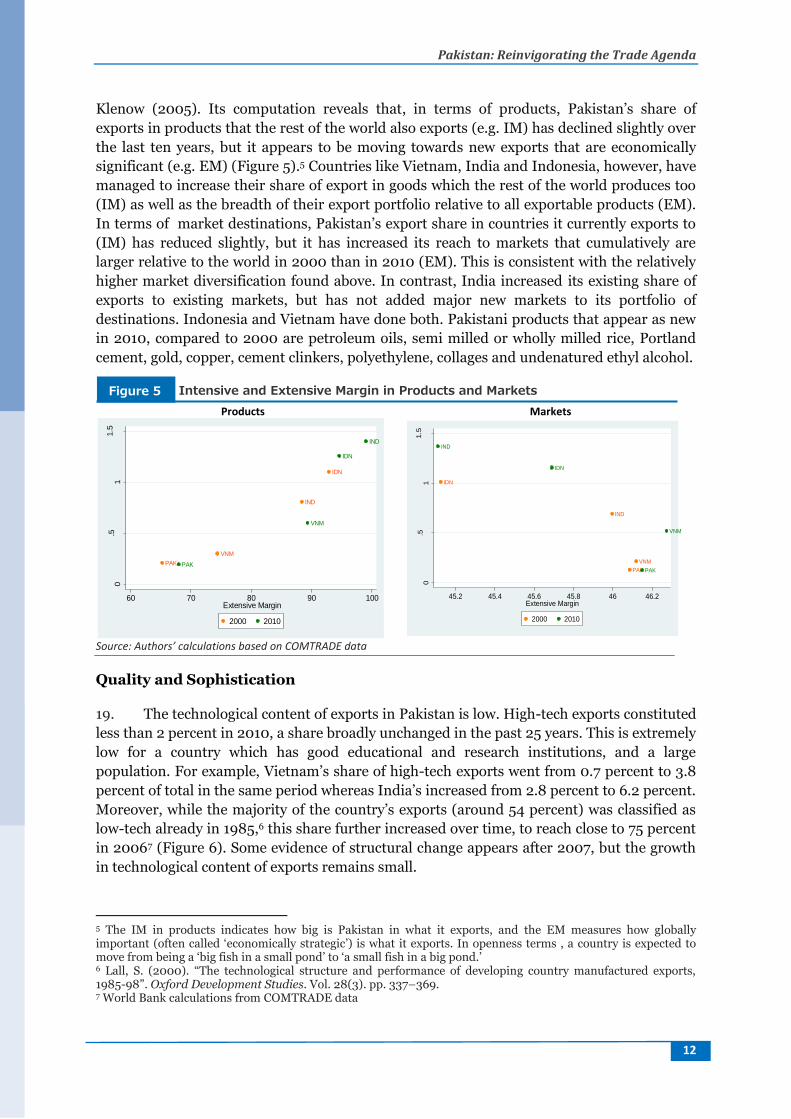
18. Overall, Pakistan is broadly moving toward new products and markets; but the pace
in terms of new products is slower than those of potential competitors. The definition of the
intensive margin (IM) and the extensive margin (EM) of exports follows Hummels and
ARE
AUSBGD
BRA
CAN
CHN
DEU
EGY
FRAGBR
HKG
IND
ITA
JPN
KOR
KWT LKA
MEX
MYS
NPL
OMNQAT
RUS
SAU
SGP
THATUR
USA
VNMZAF
8
12
16
Lo
g o
f P
red
icte
d E
xpo
rts,
200
7-0
9
8 12 16
Log of Actual Exports, 2007-09
PREDICTED VS. ACTUAL (GRAVITY)
Pakistan's Export Partners, 2007-09
0.089
0.039
0.087
0.058
0.120
0.080
0.079
0.047
0.068
0.041
0.158
0.076
0.188
0.096
0 .05 .1 .15 .2
TUR
PAK
MYS
IND
EGY
CHN
BGD
Herfindahl Index - Markets
0810 9800
0.007
0.007
0.016
0.017
0.032
0.033
0.025
0.029
0.104
0.054
0.005
0.008
0.036
0.064
0 .02 .04 .06 .08 .1
TUR
PAK
MYS
IND
EGY
CHN
BGD
Herfindahl Index - Products (HS6)
0810 9800
Herfindahl Index of Export Product and Market Concentration Figure 4
Pakistan’s Exports, Predicted vs. Actual Flows (2007-09) Figure 3
Pakistan: Reinvigorating the Trade Agenda
12
Klenow (2005). Its computation reveals that, in terms of products, Pakistan’s share of
exports in products that the rest of the world also exports (e.g. IM) has declined slightly over
the last ten years, but it appears to be moving towards new exports that are economically
significant (e.g. EM) (Figure 5).5 Countries like Vietnam, India and Indonesia, however, have
managed to increase their share of export in goods which the rest of the world produces too
(IM) as well as the breadth of their export portfolio relative to all exportable products (EM).
In terms of market destinations, Pakistan’s export share in countries it currently exports to
(IM) has reduced slightly, but it has increased its reach to markets that cumulatively are
larger relative to the world in 2000 than in 2010 (EM). This is consistent with the relatively
higher market diversification found above. In contrast, India increased its existing share of
exports to existing markets, but has not added major new markets to its portfolio of
destinations. Indonesia and Vietnam have done both. Pakistani products that appear as new
in 2010, compared to 2000 are petroleum oils, semi milled or wholly milled rice, Portland
cement, gold, copper, cement clinkers, polyethylene, collages and undenatured ethyl alcohol.
Products Markets
Source: Authors’ calculations based on COMTRADE data
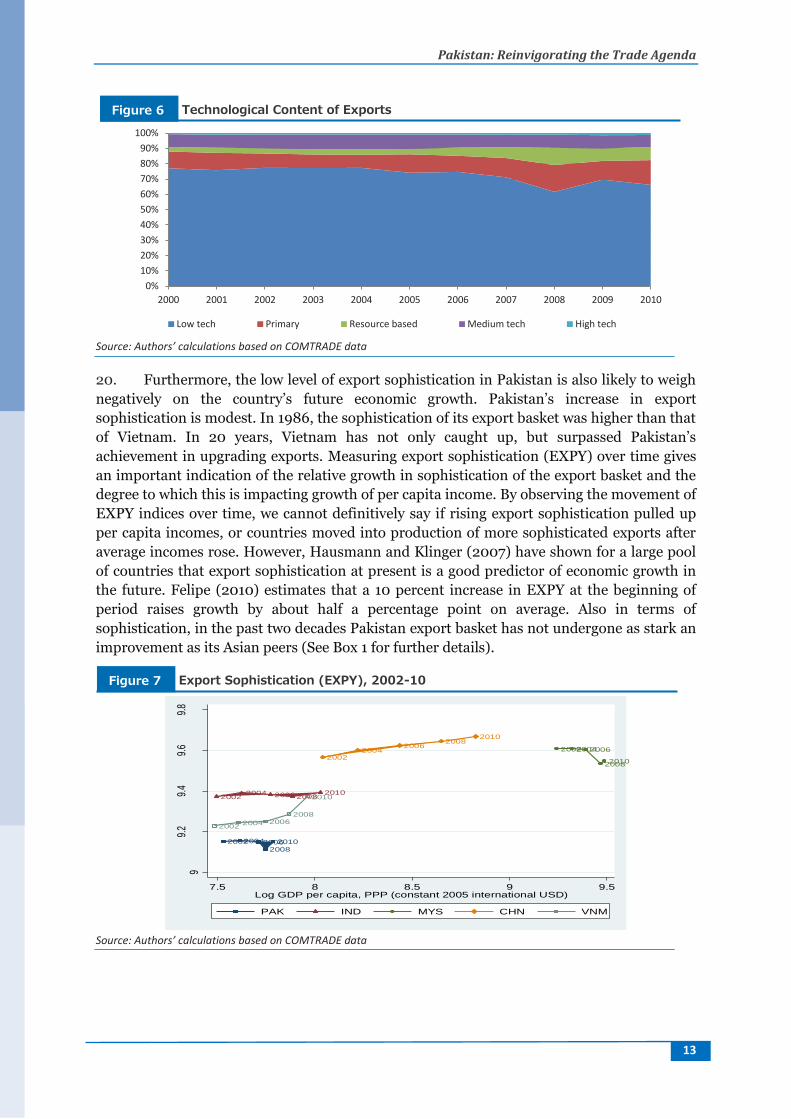
Quality and Sophistication 19. The technological content of exports in Pakistan is low. High-tech exports constituted
less than 2 percent in 2010, a share broadly unchanged in the past 25 years. This is extremely
low for a country which has good educational and research institutions, and a large
population. For example, Vietnam’s share of high-tech exports went from 0.7 percent to 3.8
percent of total in the same period whereas India’s increased from 2.8 percent to 6.2 percent.
Moreover, while the majority of the country’s exports (around 54 percent) was classified as
low-tech already in 1985,6 this share further increased over time, to reach close to 75 percent
in 20067 (Figure 6). Some evidence of structural change appears after 2007, but the growth
in technological content of exports remains small.
5 The IM in products indicates how big is Pakistan in what it exports, and the EM measures how globally important (often called ‘economically strategic’) is what it exports. In openness terms , a country is expected to move from being a ‘big fish in a small pond’ to ‘a small fish in a big pond.’ 6 Lall, S. (2000). “The technological structure and performance of developing country manufactured exports, 1985-98”. Oxford Development Studies. Vol. 28(3). pp. 337–369. 7 World Bank calculations from COMTRADE data
IDN
IND
PAK
VNM
IDN
IND
PAK
VNM
0.5
11.5
Inte
nsiv
e M
arg
in
60 70 80 90 100Extensive Margin
2000 2010
IDN
IND
PAK
VNM
IDN
IND
PAK
VNM
0.5
11.5
Inte
nsiv
e M
arg
in
45.2 45.4 45.6 45.8 46 46.2Extensive Margin
2000 2010
Intensive and Extensive Margin in Products and Markets Figure 5
Pakistan: Reinvigorating the Trade Agenda
13
Source: Authors’ calculations based on COMTRADE data
20. Furthermore, the low level of export sophistication in Pakistan is also likely to weigh
negatively on the country’s future economic growth. Pakistan’s increase in export
sophistication is modest. In 1986, the sophistication of its export basket was higher than that
of Vietnam. In 20 years, Vietnam has not only caught up, but surpassed Pakistan’s
achievement in upgrading exports. Measuring export sophistication (EXPY) over time gives
an important indication of the relative growth in sophistication of the export basket and the
degree to which this is impacting growth of per capita income. By observing the movement of
EXPY indices over time, we cannot definitively say if rising export sophistication pulled up
per capita incomes, or countries moved into production of more sophisticated exports after
average incomes rose. However, Hausmann and Klinger (2007) have shown for a large pool
of countries that export sophistication at present is a good predictor of economic growth in
the future. Felipe (2010) estimates that a 10 percent increase in EXPY at the beginning of
period raises growth by about half a percentage point on average. Also in terms of
sophistication, in the past two decades Pakistan export basket has not undergone as stark an
improvement as its Asian peers (See Box 1 for further details).
Source: Authors’ calculations based on COMTRADE data
0%
10%
20%
30%
40%
50%
60%
70%
80%
90%
100%
2000 2001 2002 2003 2004 2005 2006 2007 2008 2009 2010
Low tech Primary Resource based Medium tech High tech
2002200420062008
2010
20022004 2006 2008
2010
200220042006
200820102002
20042006
20082010
20022004 2006
2008
2010
99.
29.
49.
69.
8
Log
EXPY
7.5 8 8.5 9 9.5Log GDP per capita, PPP (constant 2005 international USD)
PAK IND MYS CHN VNM
Technological Content of Exports Figure 6
Export Sophistication (EXPY), 2002-10 Figure 7
Pakistan: Reinvigorating the Trade Agenda
14
Sophistication of Exports in Pakistan Box 1
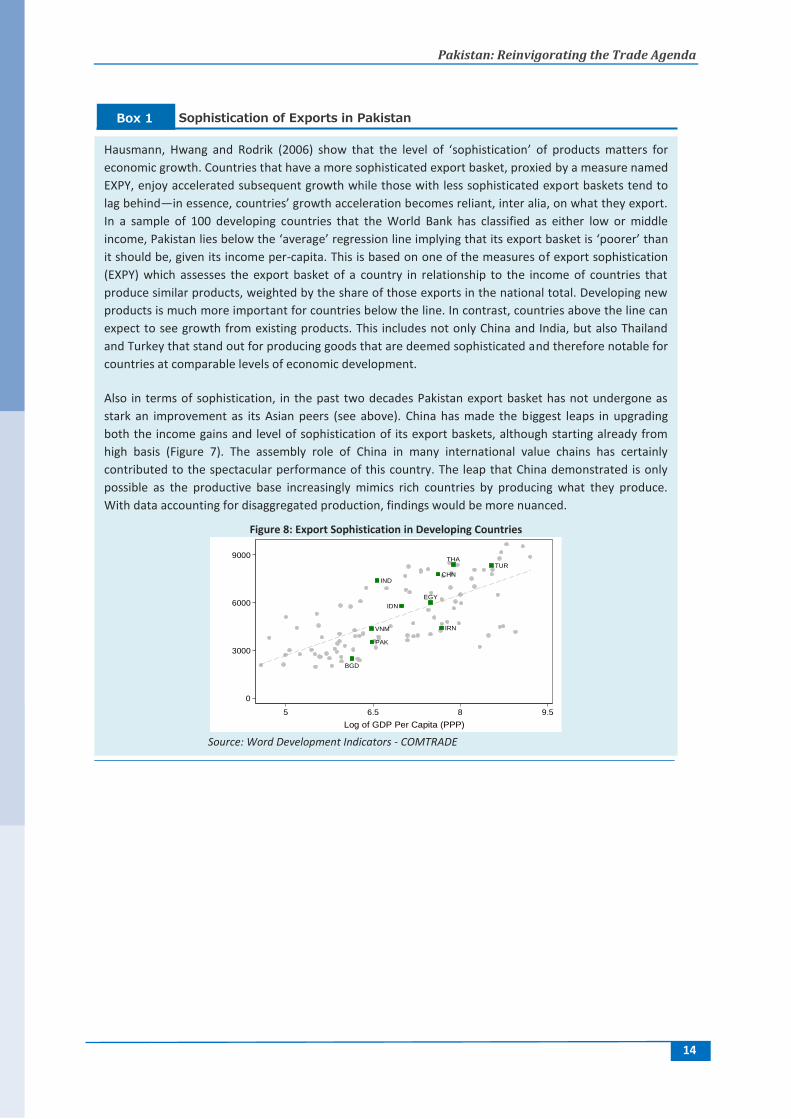
Hausmann, Hwang and Rodrik (2006) show that the level of ‘sophistication’ of products matters for
economic growth. Countries that have a more sophisticated export basket, proxied by a measure named
EXPY, enjoy accelerated subsequent growth while those with less sophisticated export baskets tend to
lag behind—in essence, countries’ growth acceleration becomes reliant, inter alia, on what they export.
In a sample of 100 developing countries that the World Bank has classified as either low or middle
income, Pakistan lies below the ‘average’ regression line implying that its export basket is ‘poorer’ than
it should be, given its income per-capita. This is based on one of the measures of export sophistication
(EXPY) which assesses the export basket of a country in relationship to the income of countries that
produce similar products, weighted by the share of those exports in the national total. Developing new
products is much more important for countries below the line. In contrast, countries above the line can
expect to see growth from existing products. This includes not only China and India, but also Thailand
and Turkey that stand out for producing goods that are deemed sophisticated and therefore notable for
countries at comparable levels of economic development.
Also in terms of sophistication, in the past two decades Pakistan export basket has not undergone as
stark an improvement as its Asian peers (see above). China has made the biggest leaps in upgrading
both the income gains and level of sophistication of its export baskets, although starting already from
high basis (Figure 7). The assembly role of China in many international value chains has certainly
contributed to the spectacular performance of this country. The leap that China demonstrated is only
possible as the productive base increasingly mimics rich countries by producing what they produce.
With data accounting for disaggregated production, findings would be more nuanced.
Figure 8: Export Sophistication in Developing Countries
Source: Word Development Indicators - COMTRADE
BGD
CHN
EGY
IDN
IND
IRN
PAK
THATUR
VNM
0
3000
6000
9000
EX
PY
20
08
(C
urr
ent
US
$)
5 6.5 8 9.5
Log of GDP Per Capita (PPP)
Export Sophistication in Developing Countries
Pakistan: Reinvigorating the Trade Agenda
15
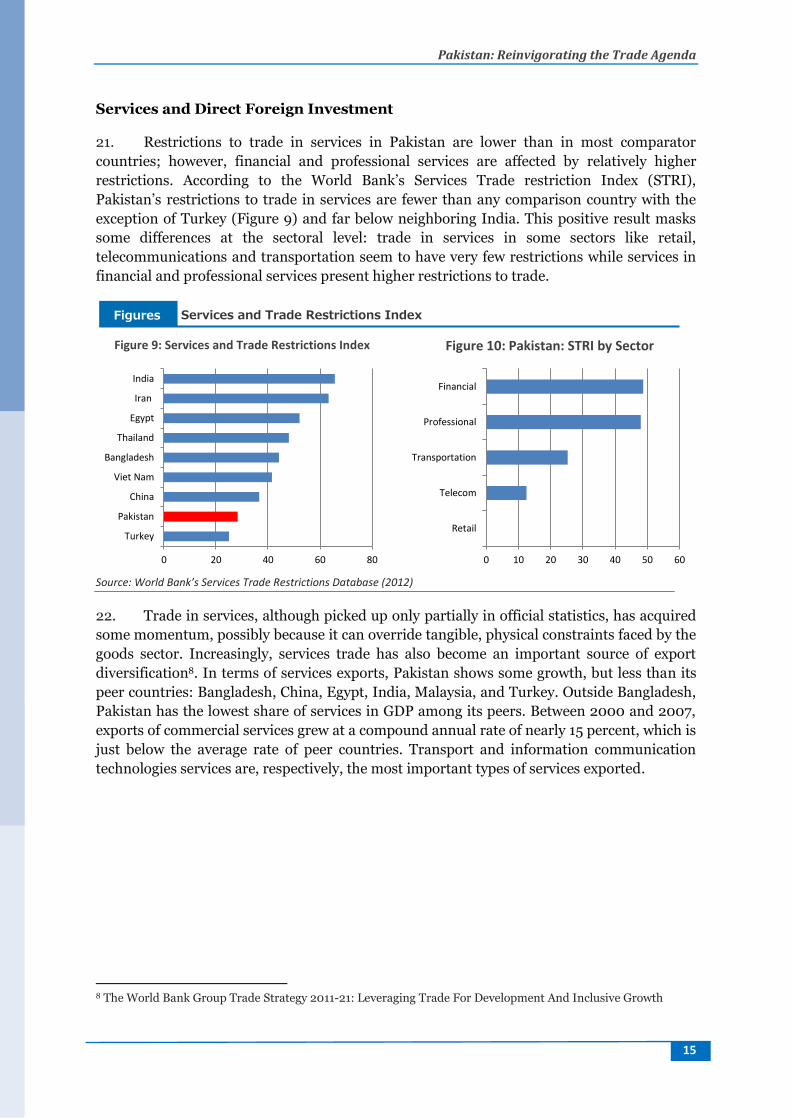
Services and Direct Foreign Investment 21. Restrictions to trade in services in Pakistan are lower than in most comparator
countries; however, financial and professional services are affected by relatively higher
restrictions. According to the World Bank’s Services Trade restriction Index (STRI),
Pakistan’s restrictions to trade in services are fewer than any comparison country with the
exception of Turkey (Figure 9) and far below neighboring India. This positive result masks
some differences at the sectoral level: trade in services in some sectors like retail,
telecommunications and transportation seem to have very few restrictions while services in
financial and professional services present higher restrictions to trade.
Figure 9: Services and Trade Restrictions Index Figure 10: Pakistan: STRI by Sector
Source: World Bank’s Services Trade Restrictions Database (2012)
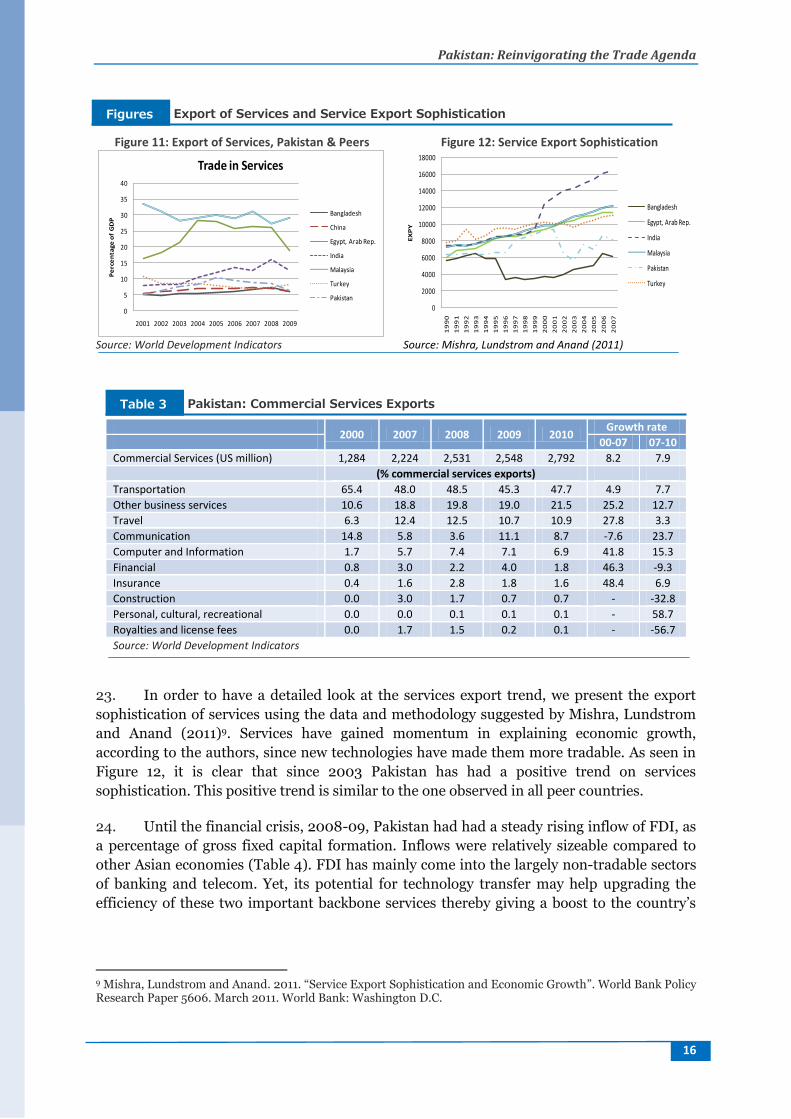
22. Trade in services, although picked up only partially in official statistics, has acquired
some momentum, possibly because it can override tangible, physical constraints faced by the
goods sector. Increasingly, services trade has also become an important source of export
diversification8. In terms of services exports, Pakistan shows some growth, but less than its
peer countries: Bangladesh, China, Egypt, India, Malaysia, and Turkey. Outside Bangladesh,
Pakistan has the lowest share of services in GDP among its peers. Between 2000 and 2007,
exports of commercial services grew at a compound annual rate of nearly 15 percent, which is
just below the average rate of peer countries. Transport and information communication
technologies services are, respectively, the most important types of services exported.
8 The World Bank Group Trade Strategy 2011-21: Leveraging Trade For Development And Inclusive Growth
0 20 40 60 80
Turkey
Pakistan
China
Viet Nam
Bangladesh
Thailand
Egypt
Iran
India
0 10 20 30 40 50 60
Retail
Telecom
Transportation
Professional
Financial
Services and Trade Restrictions Index Figures
Pakistan: Reinvigorating the Trade Agenda
16
Figure 11: Export of Services, Pakistan & Peers Figure 12: Service Export Sophistication
Source: World Development Indicators Source: Mishra, Lundstrom and Anand (2011)
2000 2007 2008 2009 2010
Growth rate
00-07 07-10
Commercial Services (US million) 1,284 2,224 2,531 2,548 2,792 8.2 7.9
(% commercial services exports)
Transportation 65.4 48.0 48.5 45.3 47.7 4.9 7.7
Other business services 10.6 18.8 19.8 19.0 21.5 25.2 12.7
Travel 6.3 12.4 12.5 10.7 10.9 27.8 3.3
Communication 14.8 5.8 3.6 11.1 8.7 -7.6 23.7
Computer and Information 1.7 5.7 7.4 7.1 6.9 41.8 15.3
Financial 0.8 3.0 2.2 4.0 1.8 46.3 -9.3
Insurance 0.4 1.6 2.8 1.8 1.6 48.4 6.9
Construction 0.0 3.0 1.7 0.7 0.7 - -32.8
Personal, cultural, recreational 0.0 0.0 0.1 0.1 0.1 - 58.7
Royalties and license fees 0.0 1.7 1.5 0.2 0.1 - -56.7
Source: World Development Indicators
23. In order to have a detailed look at the services export trend, we present the export
sophistication of services using the data and methodology suggested by Mishra, Lundstrom
and Anand (2011)9. Services have gained momentum in explaining economic growth,
according to the authors, since new technologies have made them more tradable. As seen in
Figure 12, it is clear that since 2003 Pakistan has had a positive trend on services
sophistication. This positive trend is similar to the one observed in all peer countries.
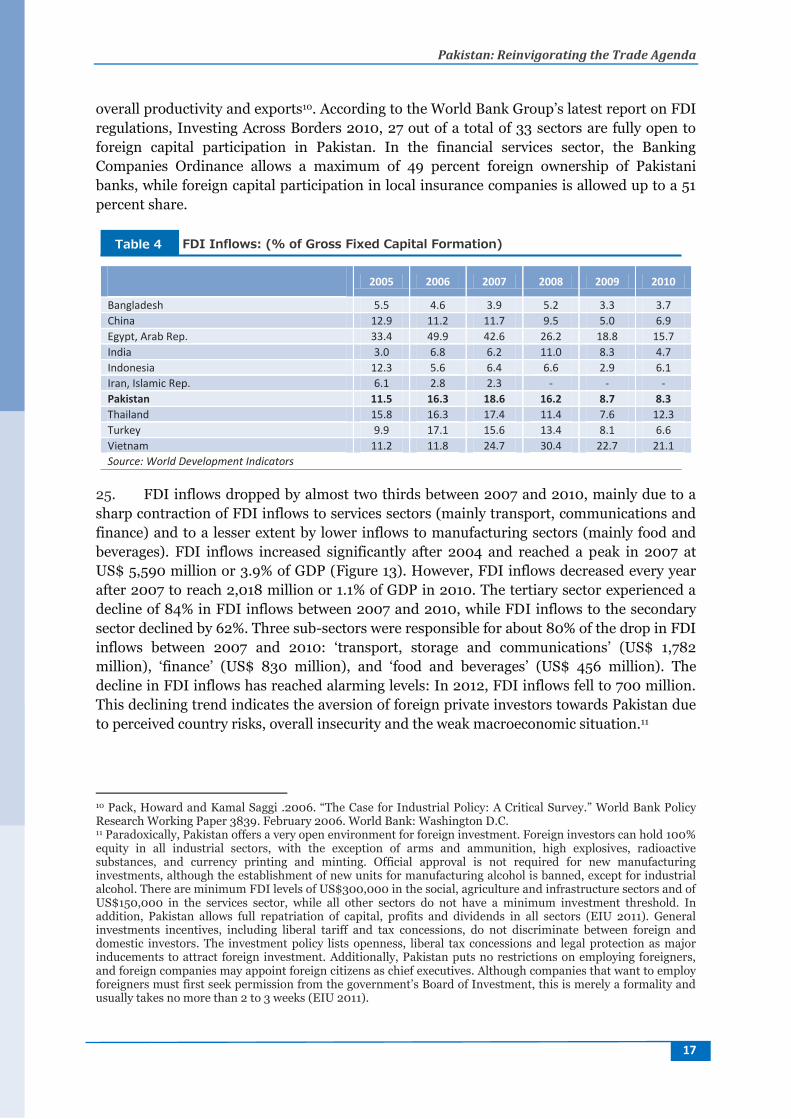
24. Until the financial crisis, 2008-09, Pakistan had had a steady rising inflow of FDI, as
a percentage of gross fixed capital formation. Inflows were relatively sizeable compared to
other Asian economies (Table 4). FDI has mainly come into the largely non-tradable sectors
of banking and telecom. Yet, its potential for technology transfer may help upgrading the
efficiency of these two important backbone services thereby giving a boost to the country’s
9 Mishra, Lundstrom and Anand. 2011. “Service Export Sophistication and Economic Growth”. World Bank Policy Research Paper 5606. March 2011. World Bank: Washington D.C.
0
5
10
15
20
25
30
35
40
2001 2002 2003 2004 2005 2006 2007 2008 2009
Pe
rce
nta
ge
of
GD
P
Trade in Services
Bangladesh
China
Egypt, Arab Rep.
India
Malaysia
Turkey
Pakistan
0
2000
4000
6000
8000
10000
12000
14000
16000
18000
19
90
19
91
19
92
19
93
19
94
19
95
19
96
19
97
19
98
19
99
20
00
20
01
20
02
20
03
20
04
20
05
20
06
20
07
EX
PY
Services EXPY
Bangladesh
Egypt, Arab Rep.
India
Malaysia
Pakistan
Turkey
Export of Services and Service Export Sophistication Figures
Pakistan: Commercial Services Exports Table 3
Pakistan: Reinvigorating the Trade Agenda
17
overall productivity and exports10. According to the World Bank Group’s latest report on FDI
regulations, Investing Across Borders 2010, 27 out of a total of 33 sectors are fully open to
foreign capital participation in Pakistan. In the financial services sector, the Banking
Companies Ordinance allows a maximum of 49 percent foreign ownership of Pakistani
banks, while foreign capital participation in local insurance companies is allowed up to a 51
percent share.
2005 2006 2007 2008 2009 2010
Bangladesh 5.5 4.6 3.9 5.2 3.3 3.7
China 12.9 11.2 11.7 9.5 5.0 6.9
Egypt, Arab Rep. 33.4 49.9 42.6 26.2 18.8 15.7
India 3.0 6.8 6.2 11.0 8.3 4.7
Indonesia 12.3 5.6 6.4 6.6 2.9 6.1
Iran, Islamic Rep. 6.1 2.8 2.3 - - -
Pakistan 11.5 16.3 18.6 16.2 8.7 8.3
Thailand 15.8 16.3 17.4 11.4 7.6 12.3
Turkey 9.9 17.1 15.6 13.4 8.1 6.6
Vietnam 11.2 11.8 24.7 30.4 22.7 21.1
Source: World Development Indicators
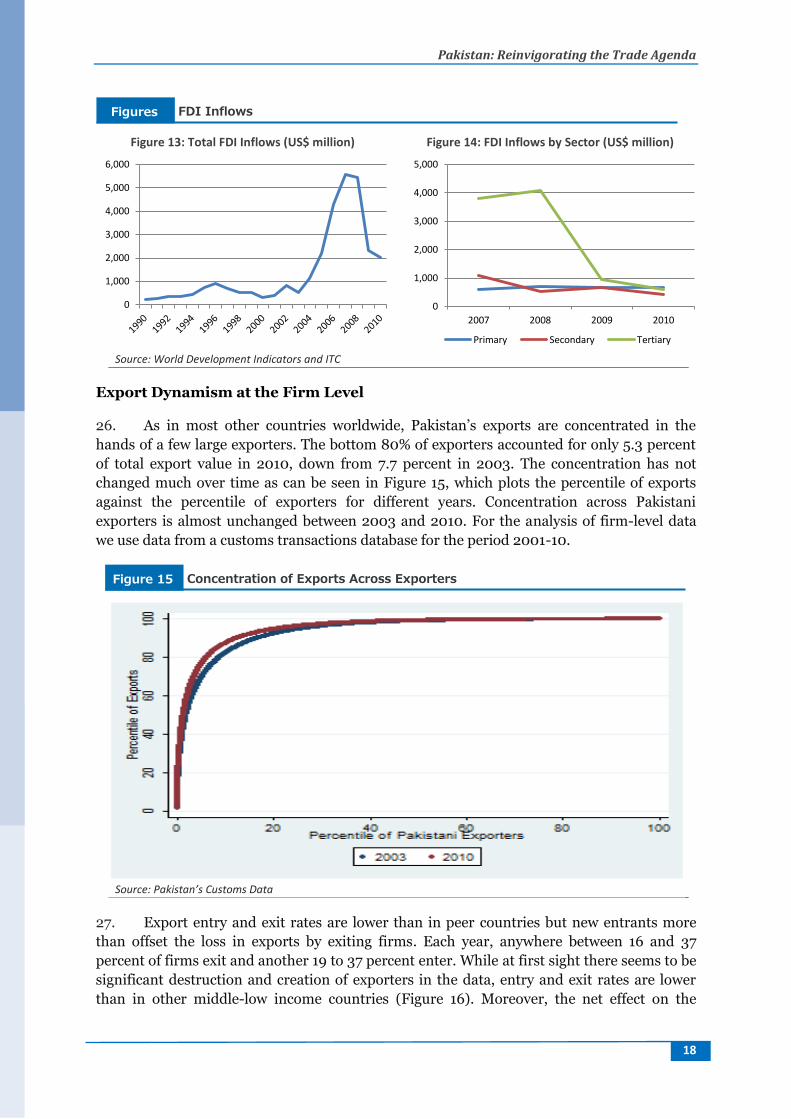
25. FDI inflows dropped by almost two thirds between 2007 and 2010, mainly due to a
sharp contraction of FDI inflows to services sectors (mainly transport, communications and
finance) and to a lesser extent by lower inflows to manufacturing sectors (mainly food and
beverages). FDI inflows increased significantly after 2004 and reached a peak in 2007 at
US$ 5,590 million or 3.9% of GDP (Figure 13). However, FDI inflows decreased every year
after 2007 to reach 2,018 million or 1.1% of GDP in 2010. The tertiary sector experienced a
decline of 84% in FDI inflows between 2007 and 2010, while FDI inflows to the secondary
sector declined by 62%. Three sub-sectors were responsible for about 80% of the drop in FDI
inflows between 2007 and 2010: ‘transport, storage and communications’ (US$ 1,782
million), ‘finance’ (US$ 830 million), and ‘food and beverages’ (US$ 456 million). The
decline in FDI inflows has reached alarming levels: In 2012, FDI inflows fell to 700 million.
This declining trend indicates the aversion of foreign private investors towards Pakistan due
to perceived country risks, overall insecurity and the weak macroeconomic situation.11
10 Pack, Howard and Kamal Saggi .2006. “The Case for Industrial Policy: A Critical Survey.” World Bank Policy Research Working Paper 3839. February 2006. World Bank: Washington D.C. 11 Paradoxically, Pakistan offers a very open environment for foreign investment. Foreign investors can hold 100% equity in all industrial sectors, with the exception of arms and ammunition, high explosives, radioactive substances, and currency printing and minting. Official approval is not required for new manufacturing investments, although the establishment of new units for manufacturing alcohol is banned, except for industrial alcohol. There are minimum FDI levels of US$300,000 in the social, agriculture and infrastructure sectors and of US$150,000 in the services sector, while all other sectors do not have a minimum investment threshold. In addition, Pakistan allows full repatriation of capital, profits and dividends in all sectors (EIU 2011). General investments incentives, including liberal tariff and tax concessions, do not discriminate between foreign and domestic investors. The investment policy lists openness, liberal tax concessions and legal protection as major inducements to attract foreign investment. Additionally, Pakistan puts no restrictions on employing foreigners, and foreign companies may appoint foreign citizens as chief executives. Although companies that want to employ foreigners must first seek permission from the government’s Board of Investment, this is merely a formality and usually takes no more than 2 to 3 weeks (EIU 2011).
FDI Inflows: (% of Gross Fixed Capital Formation) Table 4
Pakistan: Reinvigorating the Trade Agenda
18
Figure 13: Total FDI Inflows (US$ million) Figure 14: FDI Inflows by Sector (US$ million)
Source: World Development Indicators and ITC
Export Dynamism at the Firm Level 26. As in most other countries worldwide, Pakistan’s exports are concentrated in the
hands of a few large exporters. The bottom 80% of exporters accounted for only 5.3 percent
of total export value in 2010, down from 7.7 percent in 2003. The concentration has not
changed much over time as can be seen in Figure 15, which plots the percentile of exports
against the percentile of exporters for different years. Concentration across Pakistani
exporters is almost unchanged between 2003 and 2010. For the analysis of firm-level data
we use data from a customs transactions database for the period 2001-10.
Source: Pakistan’s Customs Data
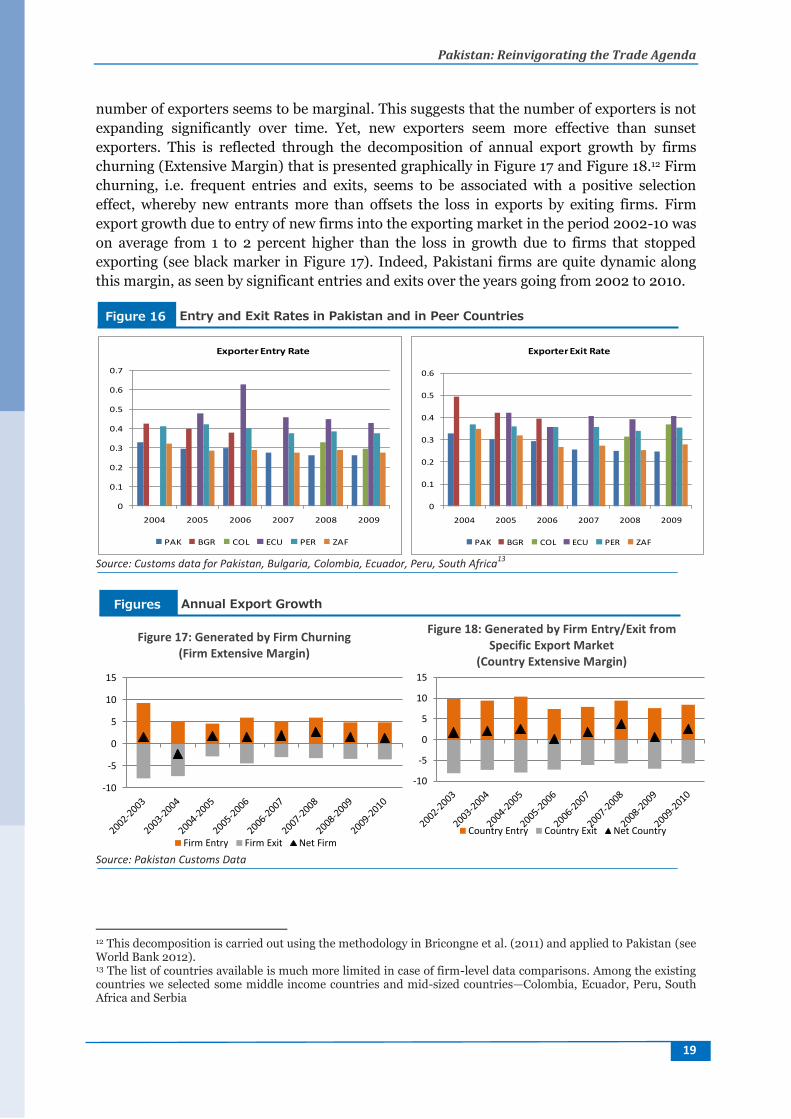
27. Export entry and exit rates are lower than in peer countries but new entrants more
than offset the loss in exports by exiting firms. Each year, anywhere between 16 and 37
percent of firms exit and another 19 to 37 percent enter. While at first sight there seems to be
significant destruction and creation of exporters in the data, entry and exit rates are lower
than in other middle-low income countries (Figure 16). Moreover, the net effect on the
0
1,000
2,000
3,000
4,000
5,000
6,000
0
1,000
2,000
3,000
4,000
5,000
2007 2008 2009 2010
Primary Secondary Tertiary
FDI Inflows Figures
Concentration of Exports Across Exporters Figure 15
Pakistan: Reinvigorating the Trade Agenda
19
number of exporters seems to be marginal. This suggests that the number of exporters is not
expanding significantly over time. Yet, new exporters seem more effective than sunset
exporters. This is reflected through the decomposition of annual export growth by firms
churning (Extensive Margin) that is presented graphically in Figure 17 and Figure 18.12 Firm
churning, i.e. frequent entries and exits, seems to be associated with a positive selection
effect, whereby new entrants more than offsets the loss in exports by exiting firms. Firm
export growth due to entry of new firms into the exporting market in the period 2002-10 was
on average from 1 to 2 percent higher than the loss in growth due to firms that stopped
exporting (see black marker in Figure 17). Indeed, Pakistani firms are quite dynamic along
this margin, as seen by significant entries and exits over the years going from 2002 to 2010.
Source: Customs data for Pakistan, Bulgaria, Colombia, Ecuador, Peru, South Africa
13
Figure 17: Generated by Firm Churning (Firm Extensive Margin)
Figure 18: Generated by Firm Entry/Exit from Specific Export Market
(Country Extensive Margin)
Source: Pakistan Customs Data
12 This decomposition is carried out using the methodology in Bricongne et al. (2011) and applied to Pakistan (see World Bank 2012). 13 The list of countries available is much more limited in case of firm-level data comparisons. Among the existing countries we selected some middle income countries and mid-sized countries—Colombia, Ecuador, Peru, South Africa and Serbia
0
0.1
0.2
0.3
0.4
0.5
0.6
0.7
2004 2005 2006 2007 2008 2009
PAK BGR COL ECU PER ZAF
Exporter Entry Rate
0
0.1
0.2
0.3
0.4
0.5
0.6
2004 2005 2006 2007 2008 2009
PAK BGR COL ECU PER ZAF
Exporter Exit Rate
-10
-5
0
5
10
15
Firm Entry Firm Exit Net Firm
-10
-5
0
5
10
15
Country Entry Country Exit Net Country
Entry and Exit Rates in Pakistan and in Peer Countries Figure 16
Annual Export Growth Figures
Pakistan: Reinvigorating the Trade Agenda
20
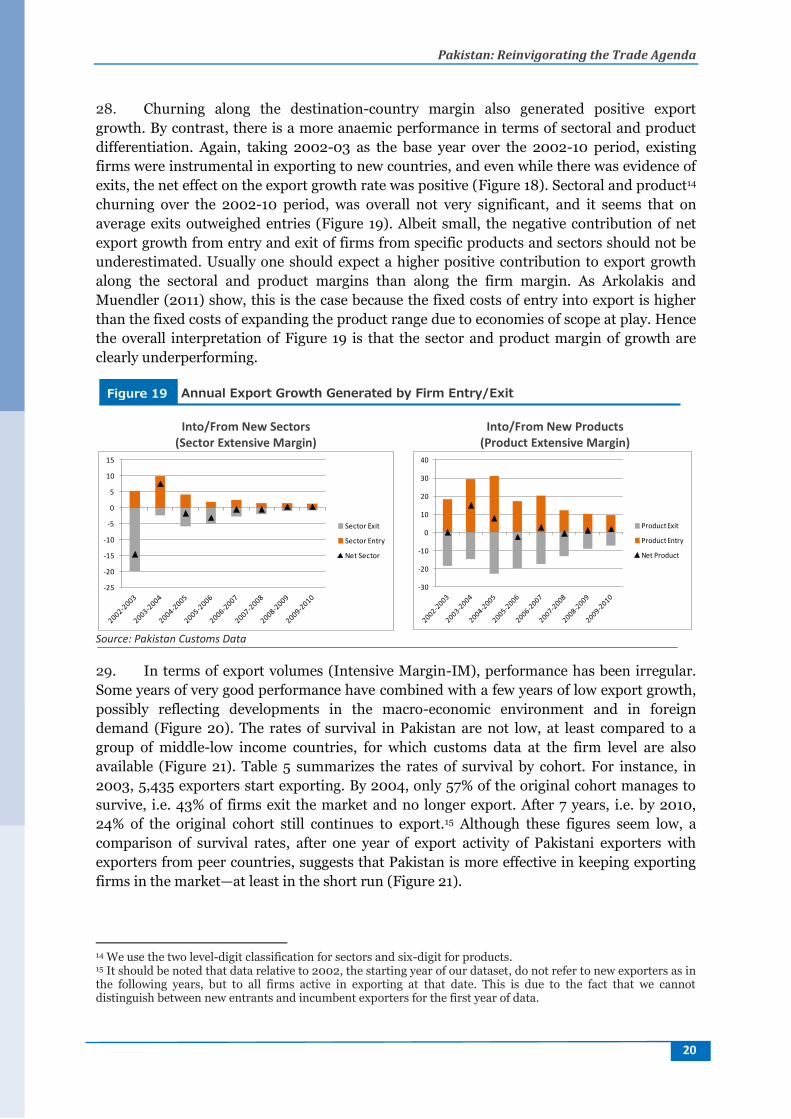
28. Churning along the destination-country margin also generated positive export
growth. By contrast, there is a more anaemic performance in terms of sectoral and product
differentiation. Again, taking 2002-03 as the base year over the 2002-10 period, existing
firms were instrumental in exporting to new countries, and even while there was evidence of
exits, the net effect on the export growth rate was positive (Figure 18). Sectoral and product14
churning over the 2002-10 period, was overall not very significant, and it seems that on
average exits outweighed entries (Figure 19). Albeit small, the negative contribution of net
export growth from entry and exit of firms from specific products and sectors should not be
underestimated. Usually one should expect a higher positive contribution to export growth
along the sectoral and product margins than along the firm margin. As Arkolakis and
Muendler (2011) show, this is the case because the fixed costs of entry into export is higher
than the fixed costs of expanding the product range due to economies of scope at play. Hence
the overall interpretation of Figure 19 is that the sector and product margin of growth are
clearly underperforming.
Into/From New Sectors (Sector Extensive Margin)
Into/From New Products (Product Extensive Margin)
Source: Pakistan Customs Data
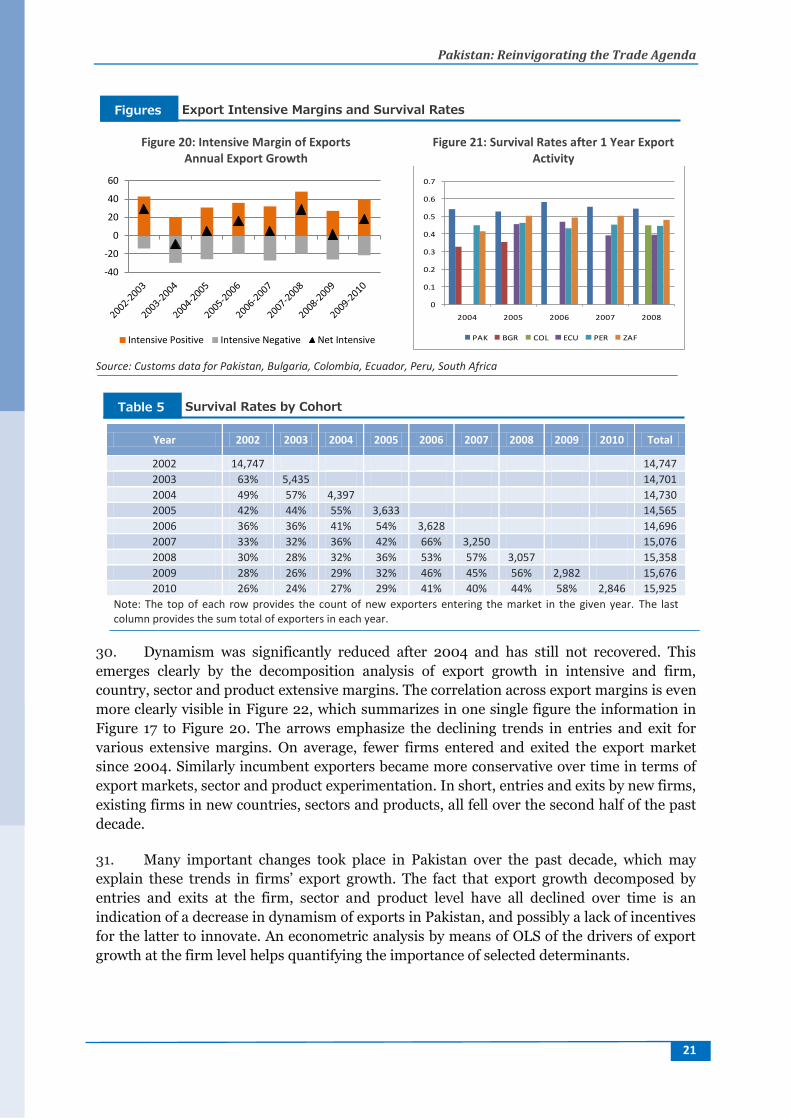
29. In terms of export volumes (Intensive Margin-IM), performance has been irregular.
Some years of very good performance have combined with a few years of low export growth,
possibly reflecting developments in the macro-economic environment and in foreign
demand (Figure 20). The rates of survival in Pakistan are not low, at least compared to a
group of middle-low income countries, for which customs data at the firm level are also
available (Figure 21). Table 5 summarizes the rates of survival by cohort. For instance, in
2003, 5,435 exporters start exporting. By 2004, only 57% of the original cohort manages to
survive, i.e. 43% of firms exit the market and no longer export. After 7 years, i.e. by 2010,
24% of the original cohort still continues to export.15 Although these figures seem low, a
comparison of survival rates, after one year of export activity of Pakistani exporters with
exporters from peer countries, suggests that Pakistan is more effective in keeping exporting
firms in the market—at least in the short run (Figure 21).
14 We use the two level-digit classification for sectors and six-digit for products. 15 It should be noted that data relative to 2002, the starting year of our dataset, do not refer to new exporters as in the following years, but to all firms active in exporting at that date. This is due to the fact that we cannot distinguish between new entrants and incumbent exporters for the first year of data.
-25
-20
-15
-10
-5
0
5
10
15
Sector Exit
Sector Entry
Net Sector
-30
-20
-10
0
10
20
30
40
Product Exit
Product Entry
Net Product
Annual Export Growth Generated by Firm Entry/Exit Figure 19
Pakistan: Reinvigorating the Trade Agenda
21
Figure 20: Intensive Margin of Exports Annual Export Growth
Figure 21: Survival Rates after 1 Year Export Activity
Source: Customs data for Pakistan, Bulgaria, Colombia, Ecuador, Peru, South Africa
Year 2002 2003 2004 2005 2006 2007 2008 2009 2010 Total
2002 14,747 14,747
2003 63% 5,435 14,701
2004 49% 57% 4,397 14,730
2005 42% 44% 55% 3,633 14,565
2006 36% 36% 41% 54% 3,628 14,696
2007 33% 32% 36% 42% 66% 3,250 15,076
2008 30% 28% 32% 36% 53% 57% 3,057 15,358
2009 28% 26% 29% 32% 46% 45% 56% 2,982 15,676
2010 26% 24% 27% 29% 41% 40% 44% 58% 2,846 15,925
Note: The top of each row provides the count of new exporters entering the market in the given year. The last column provides the sum total of exporters in each year.
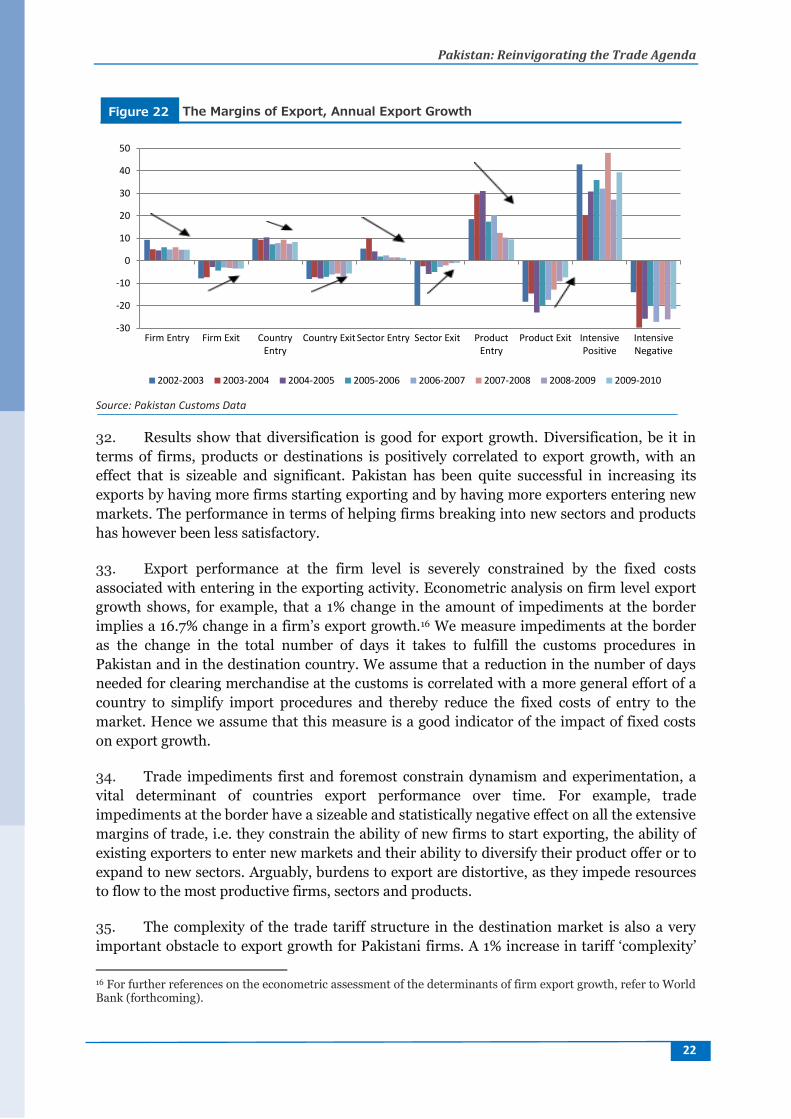
30. Dynamism was significantly reduced after 2004 and has still not recovered. This
emerges clearly by the decomposition analysis of export growth in intensive and firm,
country, sector and product extensive margins. The correlation across export margins is even
more clearly visible in Figure 22, which summarizes in one single figure the information in
Figure 17 to Figure 20. The arrows emphasize the declining trends in entries and exit for
various extensive margins. On average, fewer firms entered and exited the export market
since 2004. Similarly incumbent exporters became more conservative over time in terms of
export markets, sector and product experimentation. In short, entries and exits by new firms,
existing firms in new countries, sectors and products, all fell over the second half of the past
decade.
31. Many important changes took place in Pakistan over the past decade, which may
explain these trends in firms’ export growth. The fact that export growth decomposed by
entries and exits at the firm, sector and product level have all declined over time is an
indication of a decrease in dynamism of exports in Pakistan, and possibly a lack of incentives
for the latter to innovate. An econometric analysis by means of OLS of the drivers of export
growth at the firm level helps quantifying the importance of selected determinants.
-40
-20
0
20
40
60
Intensive Positive Intensive Negative Net Intensive
0
0.1
0.2
0.3
0.4
0.5
0.6
0.7
2004 2005 2006 2007 2008
PAK BGR COL ECU PER ZAF
1-Year Exporter Survival Rate
Export Intensive Margins and Survival Rates Figures
Survival Rates by Cohort Table 5
Pakistan: Reinvigorating the Trade Agenda
22
Source: Pakistan Customs Data
32. Results show that diversification is good for export growth. Diversification, be it in
terms of firms, products or destinations is positively correlated to export growth, with an
effect that is sizeable and significant. Pakistan has been quite successful in increasing its
exports by having more firms starting exporting and by having more exporters entering new
markets. The performance in terms of helping firms breaking into new sectors and products
has however been less satisfactory.
33. Export performance at the firm level is severely constrained by the fixed costs
associated with entering in the exporting activity. Econometric analysis on firm level export
growth shows, for example, that a 1% change in the amount of impediments at the border
implies a 16.7% change in a firm’s export growth.16 We measure impediments at the border
as the change in the total number of days it takes to fulfill the customs procedures in
Pakistan and in the destination country. We assume that a reduction in the number of days
needed for clearing merchandise at the customs is correlated with a more general effort of a
country to simplify import procedures and thereby reduce the fixed costs of entry to the
market. Hence we assume that this measure is a good indicator of the impact of fixed costs
on export growth.
34. Trade impediments first and foremost constrain dynamism and experimentation, a
vital determinant of countries export performance over time. For example, trade
impediments at the border have a sizeable and statistically negative effect on all the extensive
margins of trade, i.e. they constrain the ability of new firms to start exporting, the ability of
existing exporters to enter new markets and their ability to diversify their product offer or to
expand to new sectors. Arguably, burdens to export are distortive, as they impede resources
to flow to the most productive firms, sectors and products.
35. The complexity of the trade tariff structure in the destination market is also a very
important obstacle to export growth for Pakistani firms. A 1% increase in tariff ‘complexity’
16 For further references on the econometric assessment of the determinants of firm export growth, refer to World Bank (forthcoming).
-30
-20
-10
0
10
20
30
40
50
Firm Entry Firm Exit CountryEntry
Country Exit Sector Entry Sector Exit ProductEntry
Product Exit IntensivePositive
IntensiveNegative
2002-2003 2003-2004 2004-2005 2005-2006 2006-2007 2007-2008 2008-2009 2009-2010
The Margins of Export, Annual Export Growth Figure 22
Pakistan: Reinvigorating the Trade Agenda
23
in the destination country leads to a 13.2% decrease in export growth by Pakistani firms. We
measure tariff complexity as the standard deviation at the (HS-4 digit) sector level of
individual HS-6 digit MFN and applied tariffs.
36. Finally, findings show that fluctuations in export growth are linked to developments
in the global demand. Largely determined by external and market conditions, demand can
explain an important share of fluctuations and cyclical patterns in the export performance.
Amidst very uncertain and volatile conditions for global demand, Pakistan can maximize its
chances of exporting by eliminating barriers to trade and by using trade policy to create the
conditions that foster firm dynamism, experimentation and quality upgrading of their
products. In the following sections we will assess how trade policy can help improving firms’
export performance. Namely, we will discuss more in detail the importance of a streamlined
and transparent tariff regime; the effectiveness of Pakistan’s preferential trade strategy; and
the state of the country’s infrastructure as a facilitator for trade.
Pakistan: Reinvigorating the Trade Agenda
24
Trade Policy Objectives, Tools for Implementation and Effectiveness 37. In the last fifteen years, Pakistan’s trade patterns have been characterized by a
pendulum-like trajectory of trade liberalization. Starting in the mid-1990s, Pakistan
embarked on a major trade liberalization program, which included reductions to the level of
trade tariffs, simplifications of the overall tariff structure, and the abolition of nearly all
remaining quantitative restrictions. Over this period of time, trade policy in Pakistan had
favored multilateral and unilateral trade liberalization and aimed at reducing government
intervention. Meanwhile, a relatively favorable macro-economic environment supported the
process of trade policy reform and export expansion.
38. In the mid-2000s the pendulum started swinging back. New import substitution
policies started being implemented, with the pace accelerating since the beginning of the
global crisis in 2008.17 Current trade policies have become increasingly oriented to provide
extra protection to the processing margins of determined local products and producers. The
Planning Commission of the Government of Pakistan (2011) reports that out of the 906
manufactured products that have been granted tariff exemptions, 91% benefit a single local
monopoly producer, and 5% two producers, while smaller producers, in particular, are
excluded from the exemption benefits.
39. Two major factors explain such acceleration. On the one hand, protection increased
as part of a series of extraordinary measures adopted by the Government to counter a severe
terms of trade shock and stop massive losses in international reserves (which fell from 15
weeks of imports in November 2007 to less than 5 weeks of imports in September 2008).
Such losses did not prevent the sharp depreciation of the rupee. On the other hand,
increased protectionism encompassed intensive lobbying reflected in a significant number of
SROs introduced since 2006 by the Government, well before the crisis started, to benefit
certain firms in both the agricultural and industrial sectors. This explains why, even after the
balance of payments crisis ended, those SROs remained. There is no reliable estimate of how
much these SROs represent the fiscal losses, but proxy estimates are around 1 percent of
GDP.
40. The reversal in trade policy has converted Pakistan into the sixth most protected
economy in the world, thus risking further deterioration in its already poor performance in
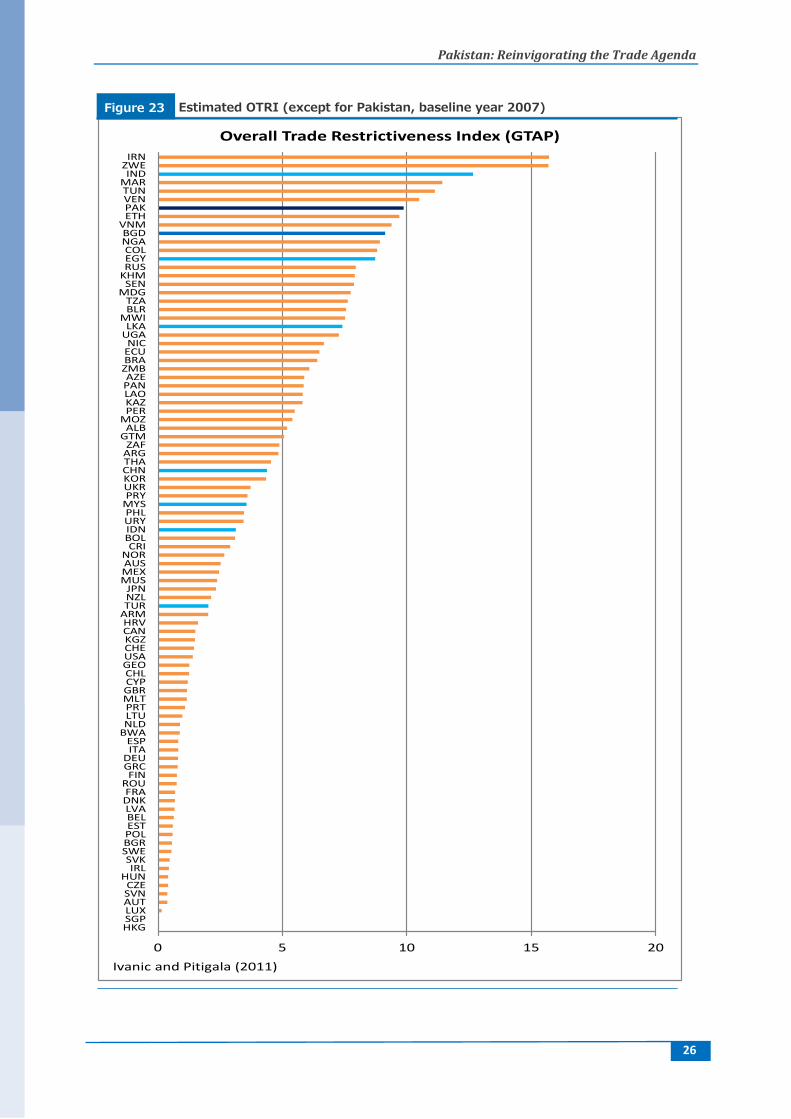
terms of openness. The Overall Trade Restrictiveness Index (OTRI) suggests that Pakistan’s
overall restrictiveness has increased over time. On the OTRI scale, which ranges from an
index of 0 in Singapore and Hong Kong to 16 in Iran, Pakistan reached a value of 9.9 in 2010,
up from 9.0 in 2004 (see Box 2 for further details as to the construction of the index; the full
results for 2004 and 2007 can be found in World Bank (forthcoming). While the OTRI of
Pakistan is not the highest in the South Asia region, as it is surpassed by the restrictiveness
of India, the value of 9.9 places Pakistan in the 88th percentile, making it among the group of
countries with more restrictive trade policies. We illustrate this in Figure 23, which depicts
the distribution of observed OTRI for all countries in the world and marks the position of
Pakistan (dark blue) and some of its main competitors (light blue). Overall trade
restrictiveness developments in Pakistan are possibly associated with the increasing
17 See Planning Commission Government of Pakistan (2011) “Pakistan: Framework for Economic Growth”, pag.74.
Pakistan: Reinvigorating the Trade Agenda
25
complexity of trade policy in Pakistan and to the reversal of some of the early progress
towards reforms.
41. Pakistan should consider that its prospects of negotiating improved market access
with key trade partners may be negatively affected by maintaining its higher barriers.
Countries that maintain higher protection are likely to face high trade barriers on their
export bundles (Kee et al. 2009). This may be explained by reciprocity in multilateral and
bilateral trade agreements: what you get in terms of market access depends on what you are
ready to give up in terms of protection at home. The following section will investigate the
features of Pakistan’s domestic market protection, thereby assessing the determinants of the
high levels of OTRI for Pakistan.
Overall Trade Restrictiveness Index (OTRI) Box 2
Measuring the restrictiveness of a trade policy is often a complex task, especially given the multifarious
nature of tariff and trade regimes in countries. Standard indicators of restrictiveness do not capture
widespread exemptions affecting imports and other policy barriers and are not well grounded in theory
(Kee et. al. 2008). The Overall Trade Restrictiveness Index (OTRI) quantifies the uniform tariff that, if
imposed on home imports instead of the existing, heterogeneous structure of protection, would leave
aggregate imports at their current level. It is a rigorous way to calculate and compare weighted average
tariffs of countries, with weights reflecting the importance of each good in total imports and the
responsiveness of the import of each good with respect to the relative tariff. Its theoretical foundation,
developed in Anderson and Neary (1994, 1996, and 2003) was first applied empirically by Kee et al.
(2008 and 2009). Following (Kee et. al. 2008), the authors estimate the OTRI for Pakistan and other
countries using the latest GTAP database (version 8, base year of 2007) and the current GTAP model
(Hertel, 1997), using applied tariffs and non-tariff barriers. The GTAP database provides a more
comprehensive estimate of non-tariff barriers compared to the measures available in the UNCTAD
TRAINS database, the latter of which are utilized in the calculation of OTRI published in the World Bank
Trade Indicators data set. Results are illustrated in Figure 23, which depicts the distribution of observed
OTRI for all countries in the world and marks the position of Pakistan and some of its main competitors
Pakistan: Reinvigorating the Trade Agenda
26
0 5 10 15 20
HKGSGPLUXAUTSVNCZE
HUNIRL
SVKSWEBGRPOLESTBELLVADNKFRA
ROUFIN
GRCDEUITAESP
BWANLDLTUPRTMLTGBRCYPCHLGEOUSACHEKGZCANHRV
ARMTURNZLJPN
MUSMEXAUSNOR
CRIBOLIDNURYPHL
MYSPRYUKRKORCHNTHAARGZAF
GTMALB
MOZPERKAZLAOPANAZE
ZMBBRAECUNIC
UGALKA
MWIBLRTZA
MDGSEN
KHMRUSEGYCOL
NGABGD
VNMETHPAKVENTUNMAR
INDZWEIRN
Ivanic and Pitigala (2011)
Overall Trade Restrictiveness Index (GTAP)
Estimated OTRI (except for Pakistan, baseline year 2007) Figure 23
Pakistan: Reinvigorating the Trade Agenda
27
Domestic Market Protection 42. The guiding principles of trade policy in Pakistan are not fully clear, as different
programmatic documents seem to have divergent objectives. On one hand, the Planning
Commission (2011) recommends that the way forward should include the re-establishment
of the unilateral trade liberalization program, regardless of ongoing multilateral, regional or
bilateral trade negotiations; the immediate abolishment of the present system of distortive
regulatory duties that interfere with the tariff structure; the maintenance of a neutral real
exchange rate policy; the re-establishment of normal trade relations with India, including the
border opening; and the acceleration of the maximum potential possible of already signed
free trade agreements, notably with China and Malaysia. On the other hand, a few recent
publications including the ‘Strategic Trade Policy Framework 2009-12’ by the Ministry of
Commerce, and the websites of the Ministry of Industry, of the National Tariff Commission
(NTC) and of the Engineering Development Board (EDB) suggest that protection of domestic
industries is an objective of Pakistan’s trade policy. For example, the website of the NTC
indicates that its objectives are to set tariff measures or other forms of assistance for
providing protection to the indigenous industry, after having ascertained that there is a cost
disadvantage; and to deal with any other matters relating to protection or assistance to
indigenous industry that the federal government may refer to the Commission.18 The criteria
for granting protection suggest that an infant industry approach and the cascading
principle—whereby relatively low tariffs are set for upstream industries and higher tariffs for
downstream industries—are used in granting protection. However, no objective criteria are
set to determine the period in which an industry is to be considered ‘infant’ and therefore
eligibility for protection and acceptable levels of protection are unclear. Finally, it is
acknowledged that, since protection is a cost for the consumer, it should not be excessive. In
addition, no further criteria are specified for determining when protection is to be
considered excessive.
43. Being unclear how the Government of Pakistan will reconcile the objective of
protecting the domestic industry with ad-hoc interventions while also aiming at streamlining
its trade policy and pursuing greater openness, it is worth recalling that ‘customized’
domestic protection entails important costs and risks. A first risk is that public support will
be distortive, going to industries with high costs and low productivity at the expense of more
efficient industries. Second, the very existence of schemes that grant protection increases the
scope for smuggling and under-invoicing. The cascading principle, evoked by many
governmental documents, makes this likely especially for final goods. Third, domestic
market protection achieved through tariff protection generates an anti-export bias. Since
Pakistan cannot influence the world market prices, exporting firms do not have any benefit
from domestic tariff policies. By contrast, producers for the domestic market enjoy a price
advantage over foreign competitors. This leads to market distortions whereby the incentive
for producers is to focus on serving the domestic market, unless exports are similarly
subsidized. Field interviews confirmed the existence of some anti-export bias in the strategic
decisions of some successful exporters. Fourth, protection increases the complexity of the
tariff regime and the associated information costs for firms.
18
http://www.ntc.gov.pk/tProtevent.asp
Pakistan: Reinvigorating the Trade Agenda
28
44. The existence of conflicting objectives in Pakistan’s trade policy and the ensuing
approach of pursuing very precisely targeted protection measures have given rise to an
increase in tariff complexity. Since July 2006, applied levels of protection for many products
have diverged from the statutory customs duty rates due to the imposition of various
exemptions and/or regulatory duties. Regulatory duties and special duties are issued in
Statutory Regulatory Orders (SROs) by the Federal Bureau of Revenue (FBR) and, though
published by notification in the official Gazette, are not included in the tariff schedule nor
consolidated in any published format, creating a lack of transparency in the trade regime and
to a distorted and uncertain regime of incentives. Between 2007 and 2009, protection levels
were increased for selected products through regulatory duties, while others were made low
or zero through concessions to facilitate selected firms and industries. By 2008, some 379
products were subjected to regulatory duties on top of custom duties. In 2011, signaling a
reversal of this policy, Pakistan removed the bulk of the regulatory duties, including all such
duties on edible items, leaving regulatory duties on 60 PCT codes in place, including sanitary
ceramics, tableware, and other selected manufacturing products, in addition to tobacco (see
Box 3). The increases in c.i.f. prices on these products range from 15% to 50%, the latter
mainly on automobiles. At the same time, tariffs were reduced on many inputs not produced
by Pakistan, which, combined with a system of escalated tariffs, creates a very heterogeneous
system of effective protection.
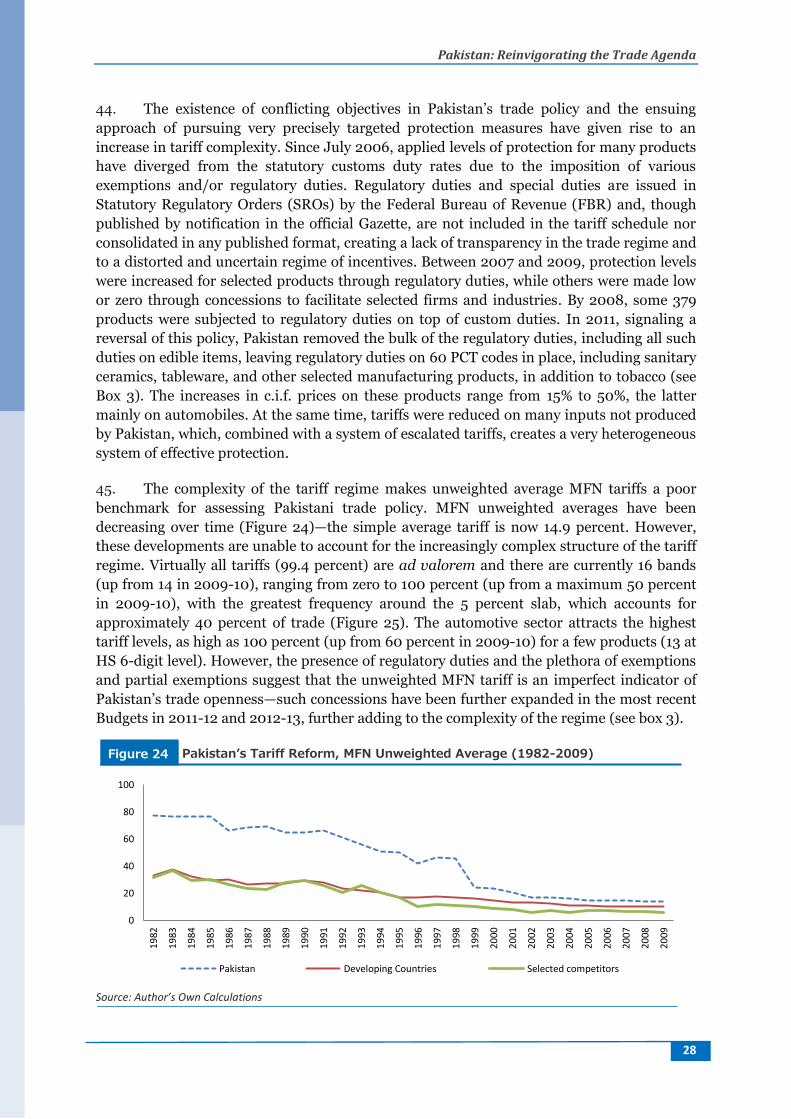
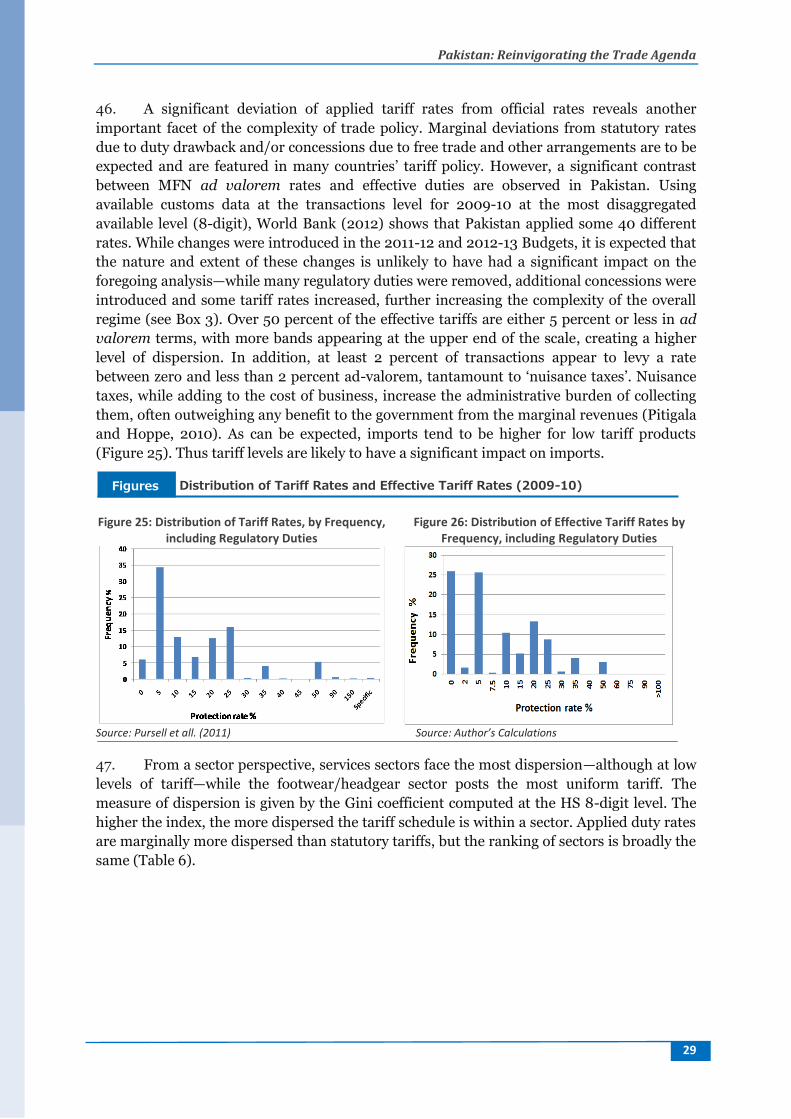
45. The complexity of the tariff regime makes unweighted average MFN tariffs a poor
benchmark for assessing Pakistani trade policy. MFN unweighted averages have been
decreasing over time (Figure 24)—the simple average tariff is now 14.9 percent. However,
these developments are unable to account for the increasingly complex structure of the tariff
regime. Virtually all tariffs (99.4 percent) are ad valorem and there are currently 16 bands
(up from 14 in 2009-10), ranging from zero to 100 percent (up from a maximum 50 percent
in 2009-10), with the greatest frequency around the 5 percent slab, which accounts for
approximately 40 percent of trade (Figure 25). The automotive sector attracts the highest
tariff levels, as high as 100 percent (up from 60 percent in 2009-10) for a few products (13 at
HS 6-digit level). However, the presence of regulatory duties and the plethora of exemptions
and partial exemptions suggest that the unweighted MFN tariff is an imperfect indicator of
Pakistan’s trade openness—such concessions have been further expanded in the most recent
Budgets in 2011-12 and 2012-13, further adding to the complexity of the regime (see box 3).
Source: Author’s Own Calculations
0
20
40
60
80
100
19
82
19
83
19
84
19
85
19
86
19
87
19
88
19
89
19
90
19
91
19
92
19
93
19
94
19
95
19
96
19
97
19
98
19
99
20
00
20
01
20
02
20
03
20
04
20
05
20
06
20
07
20
08
20
09
Pakistan Developing Countries Selected competitors
Pakistan’s Tariff Reform, MFN Unweighted Average (1982-2009) Figure 24
Pakistan: Reinvigorating the Trade Agenda
29
46. A significant deviation of applied tariff rates from official rates reveals another
important facet of the complexity of trade policy. Marginal deviations from statutory rates
due to duty drawback and/or concessions due to free trade and other arrangements are to be
expected and are featured in many countries’ tariff policy. However, a significant contrast
between MFN ad valorem rates and effective duties are observed in Pakistan. Using
available customs data at the transactions level for 2009-10 at the most disaggregated
available level (8-digit), World Bank (2012) shows that Pakistan applied some 40 different
rates. While changes were introduced in the 2011-12 and 2012-13 Budgets, it is expected that
the nature and extent of these changes is unlikely to have had a significant impact on the
foregoing analysis—while many regulatory duties were removed, additional concessions were
introduced and some tariff rates increased, further increasing the complexity of the overall
regime (see Box 3). Over 50 percent of the effective tariffs are either 5 percent or less in ad
valorem terms, with more bands appearing at the upper end of the scale, creating a higher
level of dispersion. In addition, at least 2 percent of transactions appear to levy a rate
between zero and less than 2 percent ad-valorem, tantamount to ‘nuisance taxes’. Nuisance
taxes, while adding to the cost of business, increase the administrative burden of collecting
them, often outweighing any benefit to the government from the marginal revenues (Pitigala
and Hoppe, 2010). As can be expected, imports tend to be higher for low tariff products
(Figure 25). Thus tariff levels are likely to have a significant impact on imports.
Figure 25: Distribution of Tariff Rates, by Frequency,
including Regulatory Duties Figure 26: Distribution of Effective Tariff Rates by
Frequency, including Regulatory Duties
Source: Pursell et all. (2011) Source: Author’s Calculations
47. From a sector perspective, services sectors face the most dispersion—although at low
levels of tariff—while the footwear/headgear sector posts the most uniform tariff. The
measure of dispersion is given by the Gini coefficient computed at the HS 8-digit level. The
higher the index, the more dispersed the tariff schedule is within a sector. Applied duty rates
are marginally more dispersed than statutory tariffs, but the ranking of sectors is broadly the
same (Table 6).
Distribution of Tariff Rates and Effective Tariff Rates (2009-10) Figures
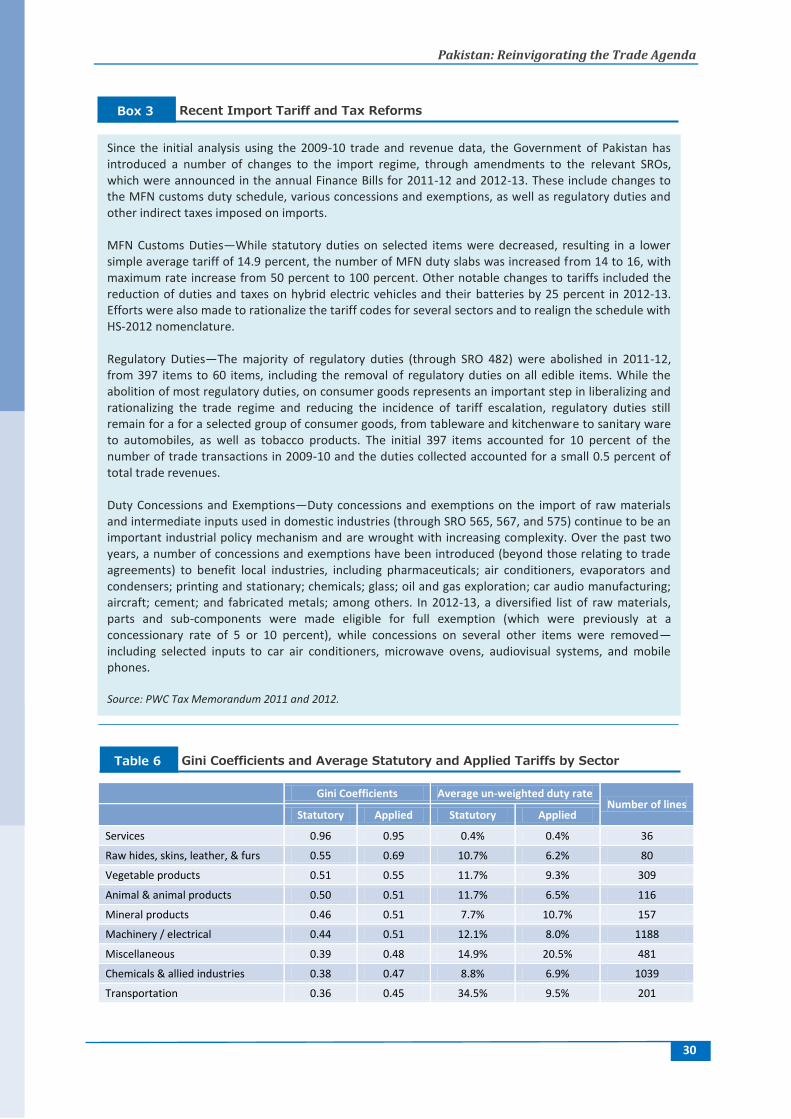
Pakistan: Reinvigorating the Trade Agenda
30
Gini Coefficients Average un-weighted duty rate
Number of lines
Statutory Applied Statutory Applied
Services 0.96 0.95 0.4% 0.4% 36
Raw hides, skins, leather, & furs 0.55 0.69 10.7% 6.2% 80
Vegetable products 0.51 0.55 11.7% 9.3% 309
Animal & animal products 0.50 0.51 11.7% 6.5% 116
Mineral products 0.46 0.51 7.7% 10.7% 157
Machinery / electrical 0.44 0.51 12.1% 8.0% 1188
Miscellaneous 0.39 0.48 14.9% 20.5% 481
Chemicals & allied industries 0.38 0.47 8.8% 6.9% 1039
Transportation 0.36 0.45 34.5% 9.5% 201
Recent Import Tariff and Tax Reforms Box 3
Since the initial analysis using the 2009-10 trade and revenue data, the Government of Pakistan has introduced a number of changes to the import regime, through amendments to the relevant SROs, which were announced in the annual Finance Bills for 2011-12 and 2012-13. These include changes to the MFN customs duty schedule, various concessions and exemptions, as well as regulatory duties and other indirect taxes imposed on imports. MFN Customs Duties—While statutory duties on selected items were decreased, resulting in a lower simple average tariff of 14.9 percent, the number of MFN duty slabs was increased from 14 to 16, with maximum rate increase from 50 percent to 100 percent. Other notable changes to tariffs included the reduction of duties and taxes on hybrid electric vehicles and their batteries by 25 percent in 2012-13. Efforts were also made to rationalize the tariff codes for several sectors and to realign the schedule with HS-2012 nomenclature. Regulatory Duties—The majority of regulatory duties (through SRO 482) were abolished in 2011-12, from 397 items to 60 items, including the removal of regulatory duties on all edible items. While the abolition of most regulatory duties, on consumer goods represents an important step in liberalizing and rationalizing the trade regime and reducing the incidence of tariff escalation, regulatory duties still remain for a for a selected group of consumer goods, from tableware and kitchenware to sanitary ware to automobiles, as well as tobacco products. The initial 397 items accounted for 10 percent of the number of trade transactions in 2009-10 and the duties collected accounted for a small 0.5 percent of total trade revenues. Duty Concessions and Exemptions—Duty concessions and exemptions on the import of raw materials and intermediate inputs used in domestic industries (through SRO 565, 567, and 575) continue to be an important industrial policy mechanism and are wrought with increasing complexity. Over the past two years, a number of concessions and exemptions have been introduced (beyond those relating to trade agreements) to benefit local industries, including pharmaceuticals; air conditioners, evaporators and condensers; printing and stationary; chemicals; glass; oil and gas exploration; car audio manufacturing; aircraft; cement; and fabricated metals; among others. In 2012-13, a diversified list of raw materials, parts and sub-components were made eligible for full exemption (which were previously at a concessionary rate of 5 or 10 percent), while concessions on several other items were removed—including selected inputs to car air conditioners, microwave ovens, audiovisual systems, and mobile phones. Source: PWC Tax Memorandum 2011 and 2012.
Gini Coefficients and Average Statutory and Applied Tariffs by Sector Table 6
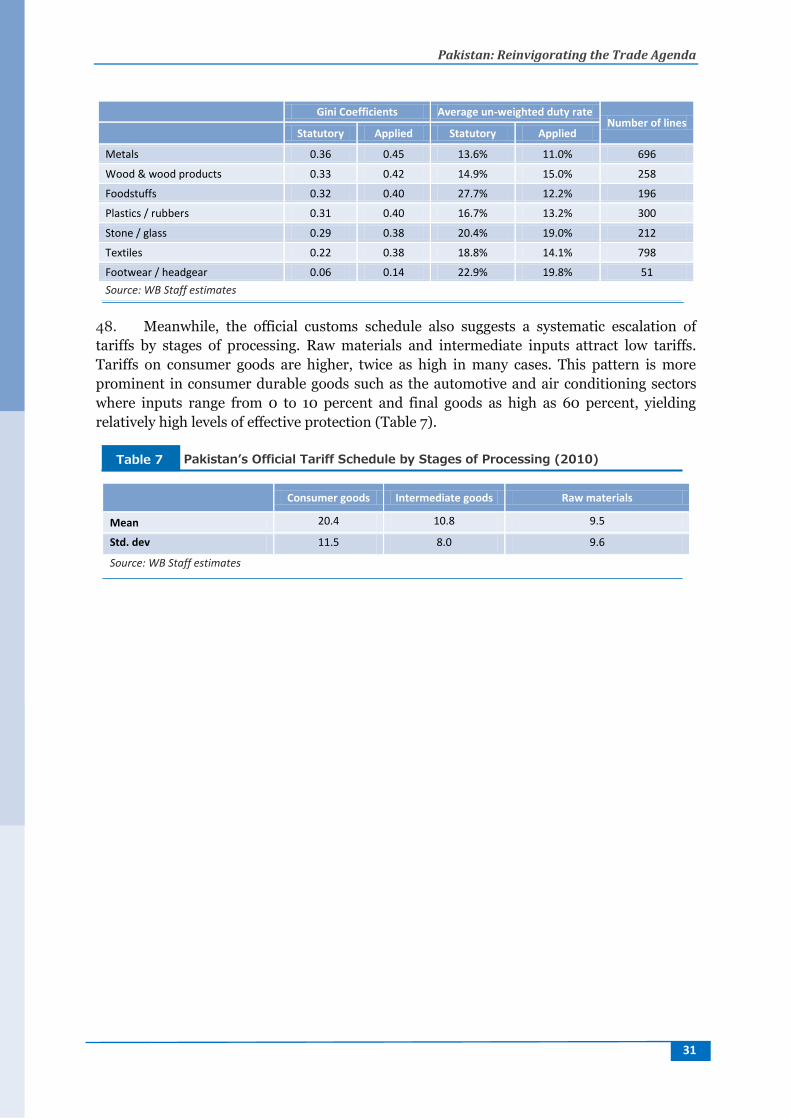
Pakistan: Reinvigorating the Trade Agenda
31
Gini Coefficients Average un-weighted duty rate
Number of lines
Statutory Applied Statutory Applied
Metals 0.36 0.45 13.6% 11.0% 696
Wood & wood products 0.33 0.42 14.9% 15.0% 258
Foodstuffs 0.32 0.40 27.7% 12.2% 196
Plastics / rubbers 0.31 0.40 16.7% 13.2% 300
Stone / glass 0.29 0.38 20.4% 19.0% 212
Textiles 0.22 0.38 18.8% 14.1% 798
Footwear / headgear 0.06 0.14 22.9% 19.8% 51
Source: WB Staff estimates
48. Meanwhile, the official customs schedule also suggests a systematic escalation of
tariffs by stages of processing. Raw materials and intermediate inputs attract low tariffs.
Tariffs on consumer goods are higher, twice as high in many cases. This pattern is more
prominent in consumer durable goods such as the automotive and air conditioning sectors
where inputs range from 0 to 10 percent and final goods as high as 60 percent, yielding
relatively high levels of effective protection (Table 7).
Consumer goods Intermediate goods Raw materials
Mean 20.4 10.8 9.5
Std. dev 11.5 8.0 9.6
Source: WB Staff estimates
Pakistan’s Official Tariff Schedule by Stages of Processing (2010) Table 7
Pakistan: Reinvigorating the Trade Agenda
32
A Deeper Look into Regulatory Duties and Partial Exemptions as Distortions to Trade 49. The dispersion in tariff rates is further associated with additional duties and
exemptions. Until 2006, many products were subject to local content requirements.
However, in 2006, local content requirements had to be removed to align with Pakistan’s
WTO commitments. In order to maintain a certain degree of protection of the domestic
market, Pakistan substituted such local content requirements with a complex mix of
regulatory duties and partial exemptions for inputs. While the recent abolition of most
regulatory duties on consumer goods represents an important step in liberalizing and
rationalizing the trade regime, reducing the incidence of tariff escalation on consumer goods,
regulatory duties still remain for a selected group of consumer goods, from tableware and
kitchenware to sanitary ware to automobiles, as well as tobacco products. In case of
automobiles, regulatory duties may be as high as 50 percent, while special duties may be up
to 35 percent. While additional special duties are not applied on other products, it begs the
policy rationale of isolating the narrow range of manufacturing products to retain regulatory
duties, systematically escalating the effective tariff regime. Retaining regulatory duties on
selected consumer goods and not others is symptomatic of the selective distortion created by
Pakistan’s trade policy. Furthermore, retaining regulatory duties on excisable products, such
as tobacco, adds to the administrative burden as a dual tax.
50. Exemptions and partial exemptions provided for industries under SRO regimes are a
key source of deviation from MFN rates. Analysis of the level and structure of Pakistan’s
tariffs is greatly complicated by large numbers of exemptions and partial exemptions which
are announced separately through SROs and do not affect the customs duty rate shown in
the customs duty column of the tariff schedule. Additional SROs further specify whether
specific products are exempted from sales and other domestic taxes, as well as rules and
ordinances affecting imports. While these are now provided on the Federal Bureau of
Revenue’s website, the separate SROs make it difficult to discern the applicable taxes and
other measures imposed on individual tariff items, which may be covered under multiple
SROs with different exemptions and criteria.19 These create distortions, as in most cases they
are exemptions for inputs and are confined to specified firms or groups of firms. By
confining regulations to a selected group of firms and by barring other importers, in
particular commercial importers, these exemptions act as a de facto licensing scheme
(Purcell et al. 2011).
51. The most prominent exemptions and partial exemptions applicable to the industrial
sector are found under three SROs: 565(1)2006, 567(1) 2007 and 575(1) 2007, (see Box 4),
accounting for 23 percent of Pakistan’s imports in 2009-10 (Table 8). On average, firms or
industries under these three SRO provisions received concessions up to about 11 percentage
points from the statutory rates, applied non-uniformly across industries (see Box 4). The
exemptions under SRO (565, 567 and 575) cover several sectors, including chemicals,
automotive, rubber and plastic industries as well as the agricultural sector. Concerning their
distribution across sectors, 44 percent of all SROs providing exemptions were on machinery
and appliances sector (Table 9). In addition, an extensive scheme of exemptions in the
automotive sector, which discriminates by type of market (Original Equipment Manufacturer
19 http://www.cbr.gov.pk/SROsImportA.aspx.
Pakistan: Reinvigorating the Trade Agenda
33
(OEM) versus after sales parts), is implemented under SRO 656 (1) 2006, auto vendors
under SRO 655 (1) 2006 and SRO 693 (1) 2006. The recent budget in 2011-12 introduced
amendments to SRO 565(1) that increased the number of concessions and exemptions
(beyond those relating to trade agreements) to benefit local industries, including
pharmaceuticals, printing and stationary, chemicals, glass, oil and gas exploration, car audio
manufacturing, fabricated metals etc. among others.
52. A common feature of all SROs is that their within sector incidence varies
considerably, increasing the inefficiency of the incentive structure. More generally, the
complex tariff system in place does not generate easily detectable patterns of effective
protection. For example, optical photography and related products which have high
technological and capital intensity content enjoy low mean tariffs and many exemptions (30
percent of the total), proving low effective protection for a large range of products. In
contrast, footwear and head gear has virtually no exemptions and high tariffs, leading to high
effective rates of protection.
Exception to MFN Regime: SROs 565(I), 567(I) SRO 575(I)[2006] Box 4
The Ministry of Finance/CBR issues these as Statutory Regulation Orders (SROs), which are approved by the Economic Coordination Committee of Cabinet. Most SROs provide exemptions or partial exemptions from normal tariffs, but others provide for increased tariffs subject to at least one special condition announced in the SRO. The EDB administered SRO’s mostly providing exemptions for inputs and are confined to specified firms or groups of firms. They are not available to other importers, in particular commercial importers. The three key SRO administered for the objective indigenization or domestic orientation for industry development are SRO 565(I)/2006, SRO 567 (I)/2006 and SRO 575(I)/2006. SRO 565(I)/2006 (‘Survey based’) provides a long (45 page) list of 154 domestically manufactured products. For each of these products there is an associated list of inputs (raw materials, sub-components, components, sub-assemblies, and assemblies) which can be imported at specified low Customs duty rates—mostly zero, 5% or 10%. SRO 567 (I)/2006 (Non-survey based) gives another long (28 pages) list of products for which the normal statutory CDs have been reduced, mainly to zero or 5%, but others (e.g. various textile and garment products) to 3%, 6.5% and 9%. Many of the listed products are organized by industry e.g. Sl. 4 consists of 33 inputs for the poultry sector, and there are similar groups of surgical sector, textile and clothing, and pharmaceutical products. SRO 575(I)/2006 similarly give a long (about 40 pages) list of machines and ‘capital goods’ for which the normal CD is reduced, nearly all to either zero or 5%. As for the other SROs, the machines listed in SRO 575 are mostly listed by user industry e.g. machines used in horticulture and floriculture. While many of these machines are specialized and would probably not have uses outside the specified user industry, others (e.g. gen-sets) certainly have alternative uses.
Source: Purcell et al., 2011.
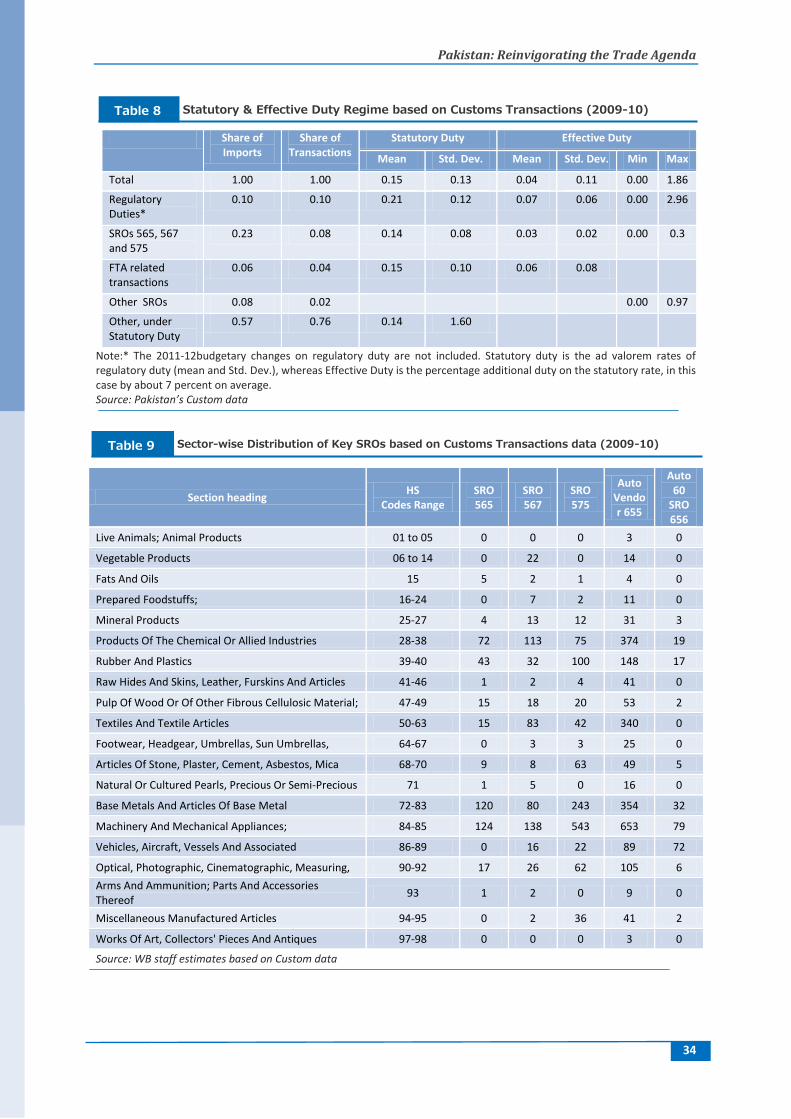
Pakistan: Reinvigorating the Trade Agenda
34
Share of Imports
Share of Transactions
Statutory Duty Effective Duty
Mean Std. Dev. Mean Std. Dev. Min Max
Total 1.00 1.00 0.15 0.13 0.04 0.11 0.00 1.86
Regulatory Duties*
0.10 0.10 0.21 0.12 0.07 0.06 0.00 2.96
SROs 565, 567 and 575
0.23 0.08 0.14 0.08 0.03 0.02 0.00 0.3
FTA related transactions
0.06 0.04 0.15 0.10 0.06 0.08
Other SROs 0.08 0.02 0.00 0.97
Other, under Statutory Duty
0.57 0.76 0.14 1.60
Note:* The 2011-12budgetary changes on regulatory duty are not included. Statutory duty is the ad valorem rates of regulatory duty (mean and Std. Dev.), whereas Effective Duty is the percentage additional duty on the statutory rate, in this case by about 7 percent on average. Source: Pakistan’s Custom data
Section heading HS
Codes Range SRO 565
SRO 567
SRO 575
Auto Vendor 655
Auto 60
SRO 656
Live Animals; Animal Products 01 to 05 0 0 0 3 0
Vegetable Products 06 to 14 0 22 0 14 0
Fats And Oils 15 5 2 1 4 0
Prepared Foodstuffs; 16-24 0 7 2 11 0
Mineral Products 25-27 4 13 12 31 3
Products Of The Chemical Or Allied Industries 28-38 72 113 75 374 19
Rubber And Plastics 39-40 43 32 100 148 17
Raw Hides And Skins, Leather, Furskins And Articles 41-46 1 2 4 41 0
Pulp Of Wood Or Of Other Fibrous Cellulosic Material; 47-49 15 18 20 53 2
Textiles And Textile Articles 50-63 15 83 42 340 0
Footwear, Headgear, Umbrellas, Sun Umbrellas, 64-67 0 3 3 25 0
Articles Of Stone, Plaster, Cement, Asbestos, Mica 68-70 9 8 63 49 5
Natural Or Cultured Pearls, Precious Or Semi-Precious 71 1 5 0 16 0
Base Metals And Articles Of Base Metal 72-83 120 80 243 354 32
Machinery And Mechanical Appliances; 84-85 124 138 543 653 79
Vehicles, Aircraft, Vessels And Associated 86-89 0 16 22 89 72
Optical, Photographic, Cinematographic, Measuring, 90-92 17 26 62 105 6
Arms And Ammunition; Parts And Accessories Thereof
93 1 2 0 9 0
Miscellaneous Manufactured Articles 94-95 0 2 36 41 2
Works Of Art, Collectors' Pieces And Antiques 97-98 0 0 0 3 0
Source: WB staff estimates based on Custom data
Statutory & Effective Duty Regime based on Customs Transactions (2009-10) Table 8
Sector-wise Distribution of Key SROs based on Customs Transactions data (2009-10) Table 9
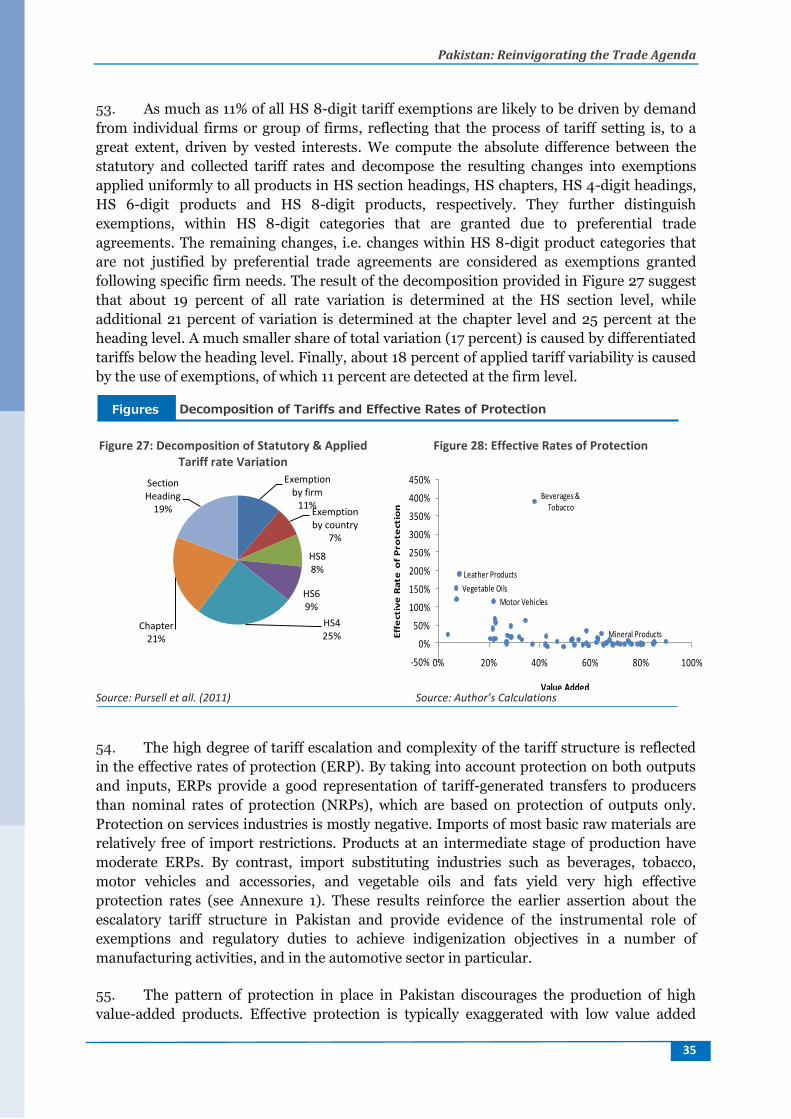
Pakistan: Reinvigorating the Trade Agenda
35
53. As much as 11% of all HS 8-digit tariff exemptions are likely to be driven by demand
from individual firms or group of firms, reflecting that the process of tariff setting is, to a
great extent, driven by vested interests. We compute the absolute difference between the
statutory and collected tariff rates and decompose the resulting changes into exemptions
applied uniformly to all products in HS section headings, HS chapters, HS 4-digit headings,
HS 6-digit products and HS 8-digit products, respectively. They further distinguish
exemptions, within HS 8-digit categories that are granted due to preferential trade
agreements. The remaining changes, i.e. changes within HS 8-digit product categories that
are not justified by preferential trade agreements are considered as exemptions granted
following specific firm needs. The result of the decomposition provided in Figure 27 suggest
that about 19 percent of all rate variation is determined at the HS section level, while
additional 21 percent of variation is determined at the chapter level and 25 percent at the
heading level. A much smaller share of total variation (17 percent) is caused by differentiated
tariffs below the heading level. Finally, about 18 percent of applied tariff variability is caused
by the use of exemptions, of which 11 percent are detected at the firm level.
Figure 27: Decomposition of Statutory & Applied
Tariff rate Variation Figure 28: Effective Rates of Protection
Source: Pursell et all. (2011) Source: Author’s Calculations
54. The high degree of tariff escalation and complexity of the tariff structure is reflected
in the effective rates of protection (ERP). By taking into account protection on both outputs
and inputs, ERPs provide a good representation of tariff-generated transfers to producers
than nominal rates of protection (NRPs), which are based on protection of outputs only.
Protection on services industries is mostly negative. Imports of most basic raw materials are
relatively free of import restrictions. Products at an intermediate stage of production have
moderate ERPs. By contrast, import substituting industries such as beverages, tobacco,
motor vehicles and accessories, and vegetable oils and fats yield very high effective
protection rates (see Annexure 1). These results reinforce the earlier assertion about the
escalatory tariff structure in Pakistan and provide evidence of the instrumental role of
exemptions and regulatory duties to achieve indigenization objectives in a number of
manufacturing activities, and in the automotive sector in particular.
55. The pattern of protection in place in Pakistan discourages the production of high
value-added products. Effective protection is typically exaggerated with low value added
Exemption by firm
11% Exemption by country
7%
HS8 8%
HS6 9%
HS4 25%
Chapter 21%
Section Heading
19%
Vegetable Oils
Beverages & Tobacco
Leather Products
Mineral Products
Motor Vehicles
-50%
0%
50%
100%
150%
200%
250%
300%
350%
400%
450%
0% 20% 40% 60% 80% 100%
Eff
ect
ive
Ra
te o
f P
rote
ctio
n
Value Added
Effective Rates of Protection
Decomposition of Tariffs and Effective Rates of Protection Figures
Pakistan: Reinvigorating the Trade Agenda
36
activities such that even quite low tariffs on final goods can lead to increased returns. Figure
28 illustrates this assertion. Sectors with high effective rates of protection tend to have low
value-added or conversely there is a higher incentive to produce low-value added goods.
Since sectors with higher effective protection tend to be domestic-oriented this demonstrates
the inherent bias against the export competing sectors.
56. Industry and product level ERP measures further help illustrate the protective effects
of the existing tariff and incentive regime. Using survey based input-output data, provided by
the EDB and by Pakistan’s Input Output Coefficient Organization (IOCO) of the FBR sectoral
ERPs20, on selected domestic-oriented sectors show that refrigerators, air-conditioners and
deep freezers have effective protection rates between 65 percent and 150 percent, whereas
cotton yarn has about 5 percent. This suggests that the ‘indigenization programs’—which
target refrigerators, air-conditioners and deep freezers, in particular—are a source of
economic inefficiency.
57. Since the global crisis, a few measures have been taken that may increase the
protection of the domestic market. As a result of the first generation reforms in early 2000s,
the use of quantitative restrictions, as protective devices, has been substantially reduced in
Pakistan. However, Pakistan has continued to apply a number a number of non-tariff
measures. The most prominent is the EDB-administered ‘Indigenization Program’ with its
discretionary control over new entrants to the industry, since all potential entrants need to
negotiate with the EDB and agree on an individual indigenization program and how that
would be phased-in over time. The administration of this often competing dual SRO/CGO
(Customs General Order) regime discriminates against the import of domestically-available
materials, amounting to a de facto local content requirement. In addition, according to the
Global Trade Alert, other NTBs include bail out/state aid measures, export subsidy
measures, export taxes and restrictions, import bans, sanitary and phytosanitary measures
and trade defense measures such as anti-dumping measures, countervailing duties and
safeguard measures.
20 Both EDB and the IOCO carry out firm-level survey-based estimates input-output coefficient for their respective mandates: The former to implement the Indigenization Program, and the latter for establishing coefficients to implement duty-drawback and other temporary importation schemes. These rates are reviewed and revised periodically.
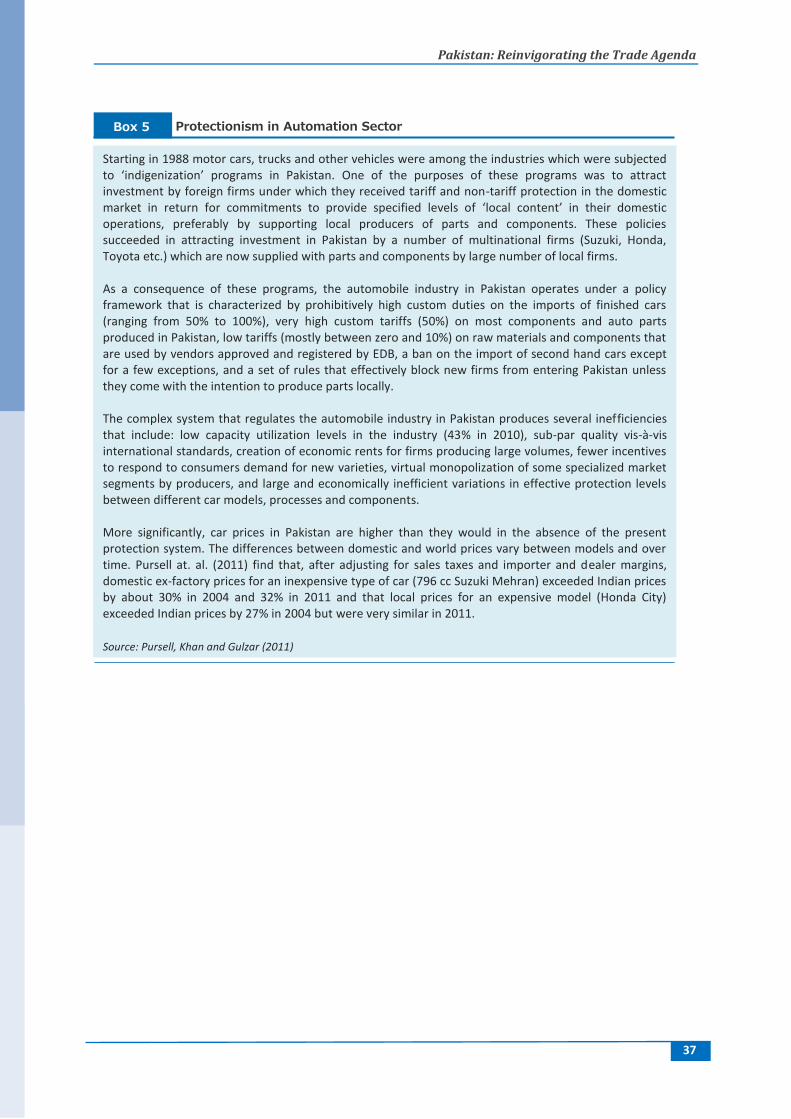
Pakistan: Reinvigorating the Trade Agenda
37
Protectionism in Automation Sector Box 5
Starting in 1988 motor cars, trucks and other vehicles were among the industries which were subjected to ‘indigenization’ programs in Pakistan. One of the purposes of these programs was to attract investment by foreign firms under which they received tariff and non-tariff protection in the domestic market in return for commitments to provide specified levels of ‘local content’ in their domestic operations, preferably by supporting local producers of parts and components. These policies succeeded in attracting investment in Pakistan by a number of multinational firms (Suzuki, Honda, Toyota etc.) which are now supplied with parts and components by large number of local firms. As a consequence of these programs, the automobile industry in Pakistan operates under a policy framework that is characterized by prohibitively high custom duties on the imports of finished cars (ranging from 50% to 100%), very high custom tariffs (50%) on most components and auto parts produced in Pakistan, low tariffs (mostly between zero and 10%) on raw materials and components that are used by vendors approved and registered by EDB, a ban on the import of second hand cars except for a few exceptions, and a set of rules that effectively block new firms from entering Pakistan unless they come with the intention to produce parts locally. The complex system that regulates the automobile industry in Pakistan produces several inefficiencies that include: low capacity utilization levels in the industry (43% in 2010), sub-par quality vis-à-vis international standards, creation of economic rents for firms producing large volumes, fewer incentives to respond to consumers demand for new varieties, virtual monopolization of some specialized market segments by producers, and large and economically inefficient variations in effective protection levels between different car models, processes and components. More significantly, car prices in Pakistan are higher than they would in the absence of the present protection system. The differences between domestic and world prices vary between models and over time. Pursell at. al. (2011) find that, after adjusting for sales taxes and importer and dealer margins, domestic ex-factory prices for an inexpensive type of car (796 cc Suzuki Mehran) exceeded Indian prices by about 30% in 2004 and 32% in 2011 and that local prices for an expensive model (Honda City) exceeded Indian prices by 27% in 2004 but were very similar in 2011.
Source: Pursell, Khan and Gulzar (2011)
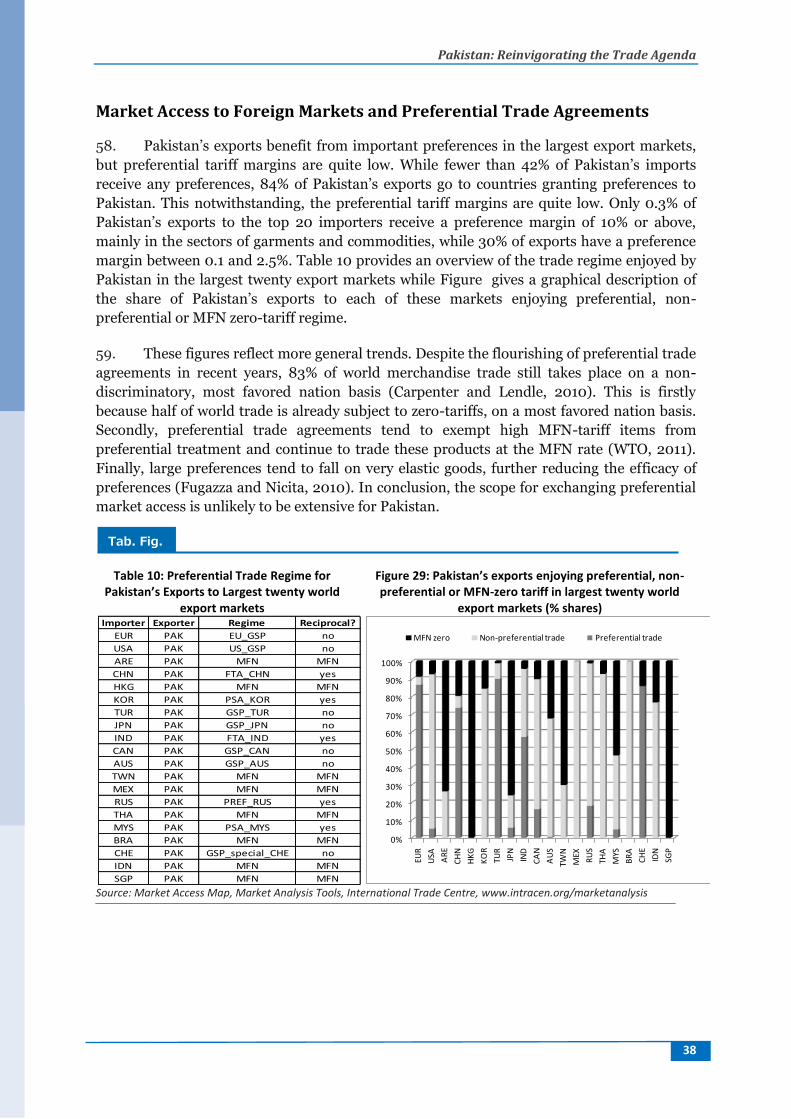
Pakistan: Reinvigorating the Trade Agenda
38
Market Access to Foreign Markets and Preferential Trade Agreements 58. Pakistan’s exports benefit from important preferences in the largest export markets,
but preferential tariff margins are quite low. While fewer than 42% of Pakistan’s imports
receive any preferences, 84% of Pakistan’s exports go to countries granting preferences to
Pakistan. This notwithstanding, the preferential tariff margins are quite low. Only 0.3% of
Pakistan’s exports to the top 20 importers receive a preference margin of 10% or above,
mainly in the sectors of garments and commodities, while 30% of exports have a preference
margin between 0.1 and 2.5%. Table 10 provides an overview of the trade regime enjoyed by
Pakistan in the largest twenty export markets while Figure gives a graphical description of
the share of Pakistan’s exports to each of these markets enjoying preferential, non-
preferential or MFN zero-tariff regime.
59. These figures reflect more general trends. Despite the flourishing of preferential trade
agreements in recent years, 83% of world merchandise trade still takes place on a non-
discriminatory, most favored nation basis (Carpenter and Lendle, 2010). This is firstly
because half of world trade is already subject to zero-tariffs, on a most favored nation basis.
Secondly, preferential trade agreements tend to exempt high MFN-tariff items from
preferential treatment and continue to trade these products at the MFN rate (WTO, 2011).
Finally, large preferences tend to fall on very elastic goods, further reducing the efficacy of
preferences (Fugazza and Nicita, 2010). In conclusion, the scope for exchanging preferential
market access is unlikely to be extensive for Pakistan.
Table 10: Preferential Trade Regime for Pakistan’s Exports to Largest twenty world
export markets
Figure 29: Pakistan’s exports enjoying preferential, non-preferential or MFN-zero tariff in largest twenty world
export markets (% shares)
Source: Market Access Map, Market Analysis Tools, International Trade Centre, www.intracen.org/marketanalysis
Importer Exporter Regime Reciprocal?
EUR PAK EU_GSP no
USA PAK US_GSP no
ARE PAK MFN MFN
CHN PAK FTA_CHN yes
HKG PAK MFN MFN
KOR PAK PSA_KOR yes
TUR PAK GSP_TUR no
JPN PAK GSP_JPN no
IND PAK FTA_IND yes
CAN PAK GSP_CAN no
AUS PAK GSP_AUS no
TWN PAK MFN MFN
MEX PAK MFN MFN
RUS PAK PREF_RUS yes
THA PAK MFN MFN
MYS PAK PSA_MYS yes
BRA PAK MFN MFN
CHE PAK GSP_special_CHE no
IDN PAK MFN MFN
SGP PAK MFN MFN
0%
10%
20%
30%
40%
50%
60%
70%
80%
90%
100%
EUR
USA
AR
E
CH
N
HK
G
KO
R
TUR
JPN
IND
CA
N
AU
S
TWN
MEX
RU
S
THA
MYS
BR
A
CH
E
IDN
SGP
MFN zero Non-preferential trade Preferential trade
Tab. Fig.
Pakistan: Reinvigorating the Trade Agenda
39
60. Yet, Pakistan is increasingly pursuing a strategy of economic integration through
preferential trade agreements. Up to the mid-2000’s Pakistan was member of multilateral
preferential trade agreements only. Since 2006, it has instead been pursuing a policy of
regional and bilateral trade integration. The country is, since that year, a member of the
South Asian Free Trade Agreement. Moreover, since 2005, Pakistan has engaged in bilateral
trade agreements with China, Iran, Malaysia, Mauritius and Sri Lanka and in 2010 in a
Transit Trade Agreement with Afghanistan (Government of Pakistan, 2011)
61. This shift reflects more general global trends in trade policy. In the last two decades,
the number of preferential trade agreements has increased four-fold, to around 300
agreements in 2011.21 It also reflects public awareness that Pakistan under trades with
several large and fast growing economies from the region, including India and China
(Planning Commission Government of Pakistan, 2011).
62. The overall economic and welfare effects of full tariff liberalization in the context of
preferential trade agreements contracted by Pakistan are limited. This is what emerges from
simulation analysis using the World Bank SMART (System of Market Analysis and
Restrictions of Trade)—a partial equilibrium tool that is part of the World Bank—UNCTAD
WITS (World Integrated Trade Solution) platform. A caveat of the model on which the
simulations are based is that it can only account for effects on the intensive margin of trade.
In other words, it is unable to quantify changes in terms of new trade relationships, i.e. new
products’ exports or new markets.
63. The increase in Pakistan’s imports of currently traded products as a result of
implementation of a corner solution, i.e. the hypothetical establishment of a zero-tariff
regime in the framework of currently signed PTAs, is modest and ranges from 0.3 percent to
2.7 percent of total imports (Figure 30). The biggest impact would result from the full
implementation of a zero-tariff regime under the PTA with China. Imports would increase by
2.7 percent with respect to the baseline (total imports in 2009). Slashing tariffs in the
framework of PTAs with Malaysia and India would have a smaller effect, which is similar for
the two agreements. In both cases, bilateral imports would increase by less than 0.5%. The
impact of implementing full liberalization with all SAFTA countries would increase imports
by 0.33%. India accounts for 94% of that increase. It is to be expected, however, that tariff
reduction would also increase the product range of imported goods for which barriers are
currently prohibitive. We will quantify the impact in terms of overall trade potential in
further section of the paper.
21 World Trade Organization. 2011. “World Trade Report 2011”. Geneva.
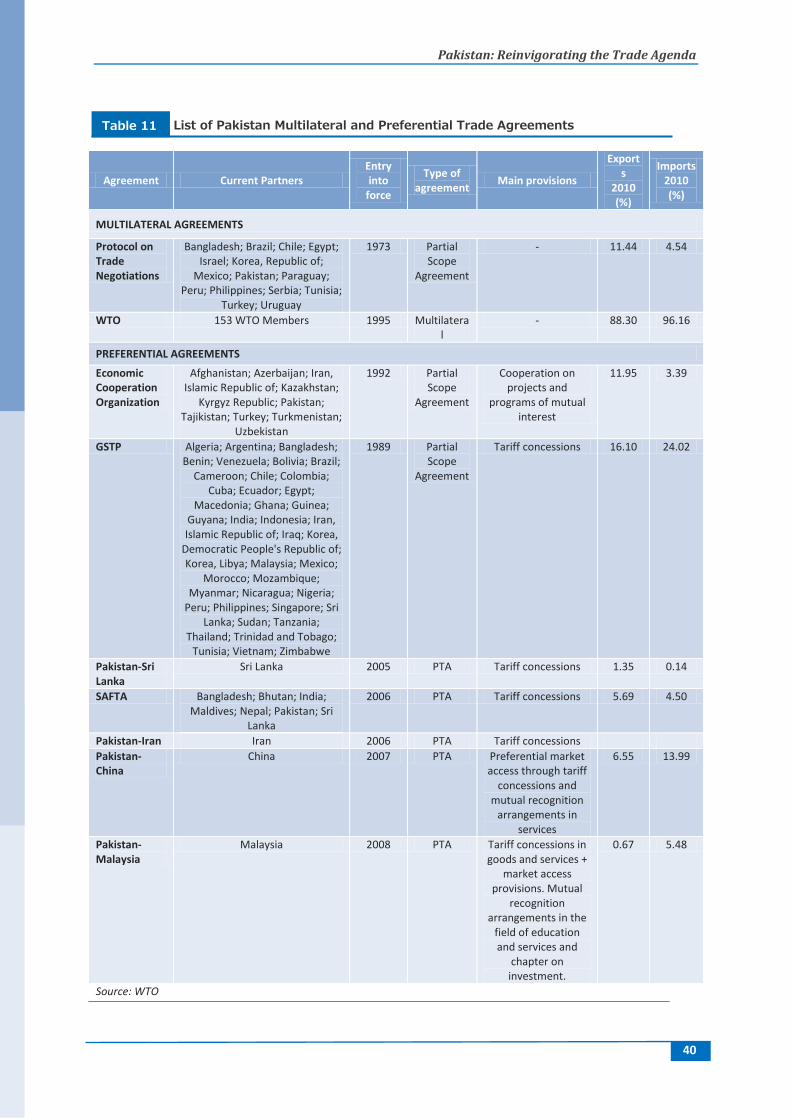
Pakistan: Reinvigorating the Trade Agenda
40
Agreement Current Partners Entry into
force
Type of agreement
Main provisions
Exports
2010 (%)
Imports 2010 (%)
MULTILATERAL AGREEMENTS
Protocol on Trade Negotiations
Bangladesh; Brazil; Chile; Egypt; Israel; Korea, Republic of;
Mexico; Pakistan; Paraguay; Peru; Philippines; Serbia; Tunisia;
Turkey; Uruguay
1973 Partial Scope
Agreement
- 11.44 4.54
WTO 153 WTO Members 1995 Multilateral
- 88.30 96.16
PREFERENTIAL AGREEMENTS
Economic Cooperation Organization
Afghanistan; Azerbaijan; Iran, Islamic Republic of; Kazakhstan;
Kyrgyz Republic; Pakistan; Tajikistan; Turkey; Turkmenistan;
Uzbekistan
1992 Partial Scope
Agreement
Cooperation on projects and
programs of mutual interest
11.95 3.39
GSTP Algeria; Argentina; Bangladesh; Benin; Venezuela; Bolivia; Brazil;
Cameroon; Chile; Colombia; Cuba; Ecuador; Egypt;
Macedonia; Ghana; Guinea; Guyana; India; Indonesia; Iran, Islamic Republic of; Iraq; Korea,
Democratic People's Republic of; Korea, Libya; Malaysia; Mexico;
Morocco; Mozambique; Myanmar; Nicaragua; Nigeria;
Peru; Philippines; Singapore; Sri Lanka; Sudan; Tanzania;
Thailand; Trinidad and Tobago; Tunisia; Vietnam; Zimbabwe
1989 Partial Scope
Agreement
Tariff concessions 16.10 24.02
Pakistan-Sri Lanka
Sri Lanka 2005 PTA Tariff concessions 1.35 0.14
SAFTA Bangladesh; Bhutan; India; Maldives; Nepal; Pakistan; Sri
Lanka
2006 PTA Tariff concessions 5.69 4.50
Pakistan-Iran Iran 2006 PTA Tariff concessions
Pakistan-China
China 2007 PTA Preferential market access through tariff
concessions and mutual recognition
arrangements in services
6.55 13.99
Pakistan-Malaysia
Malaysia 2008 PTA Tariff concessions in goods and services +
market access provisions. Mutual
recognition arrangements in the
field of education and services and
chapter on investment.
0.67 5.48
Source: WTO
List of Pakistan Multilateral and Preferential Trade Agreements Table 11
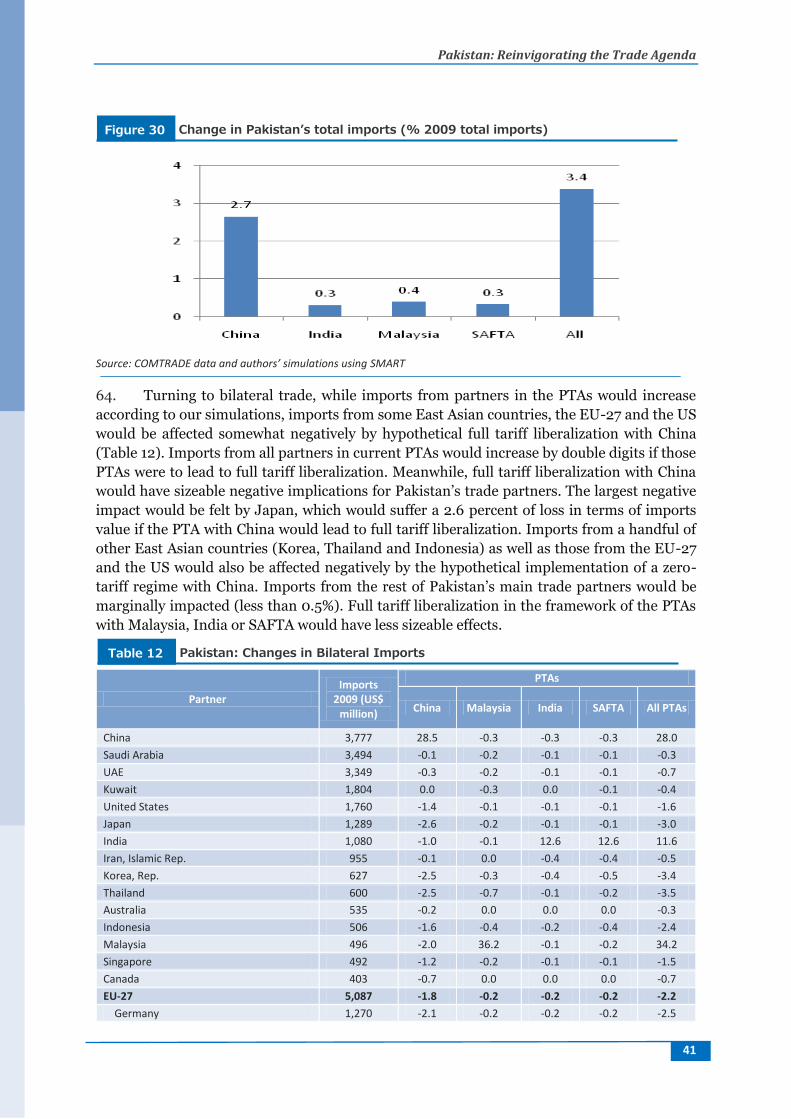
Pakistan: Reinvigorating the Trade Agenda
41
Source: COMTRADE data and authors’ simulations using SMART 64. Turning to bilateral trade, while imports from partners in the PTAs would increase
according to our simulations, imports from some East Asian countries, the EU-27 and the US
would be affected somewhat negatively by hypothetical full tariff liberalization with China
(Table 12). Imports from all partners in current PTAs would increase by double digits if those
PTAs were to lead to full tariff liberalization. Meanwhile, full tariff liberalization with China
would have sizeable negative implications for Pakistan’s trade partners. The largest negative
impact would be felt by Japan, which would suffer a 2.6 percent of loss in terms of imports
value if the PTA with China would lead to full tariff liberalization. Imports from a handful of
other East Asian countries (Korea, Thailand and Indonesia) as well as those from the EU-27
and the US would also be affected negatively by the hypothetical implementation of a zero-
tariff regime with China. Imports from the rest of Pakistan’s main trade partners would be
marginally impacted (less than 0.5%). Full tariff liberalization in the framework of the PTAs
with Malaysia, India or SAFTA would have less sizeable effects.
Partner Imports
2009 (US$ million)
PTAs
China Malaysia India SAFTA All PTAs
China 3,777 28.5 -0.3 -0.3 -0.3 28.0
Saudi Arabia 3,494 -0.1 -0.2 -0.1 -0.1 -0.3
UAE 3,349 -0.3 -0.2 -0.1 -0.1 -0.7
Kuwait 1,804 0.0 -0.3 0.0 -0.1 -0.4
United States 1,760 -1.4 -0.1 -0.1 -0.1 -1.6
Japan 1,289 -2.6 -0.2 -0.1 -0.1 -3.0
India 1,080 -1.0 -0.1 12.6 12.6 11.6
Iran, Islamic Rep. 955 -0.1 0.0 -0.4 -0.4 -0.5
Korea, Rep. 627 -2.5 -0.3 -0.4 -0.5 -3.4
Thailand 600 -2.5 -0.7 -0.1 -0.2 -3.5
Australia 535 -0.2 0.0 0.0 0.0 -0.3
Indonesia 506 -1.6 -0.4 -0.2 -0.4 -2.4
Malaysia 496 -2.0 36.2 -0.1 -0.2 34.2
Singapore 492 -1.2 -0.2 -0.1 -0.1 -1.5
Canada 403 -0.7 0.0 0.0 0.0 -0.7
EU-27 5,087 -1.8 -0.2 -0.2 -0.2 -2.2
Germany 1,270 -2.1 -0.2 -0.2 -0.2 -2.5
Change in Pakistan’s total imports (% 2009 total imports) Figure 30
Pakistan: Changes in Bilateral Imports Table 12
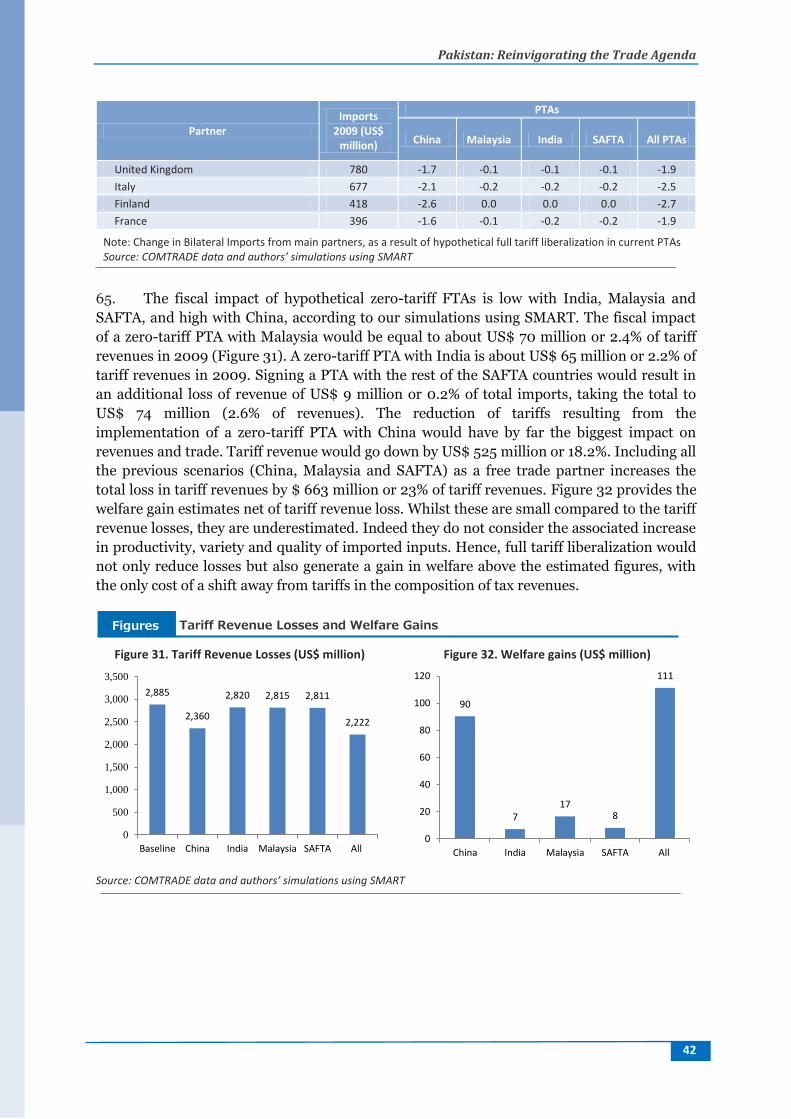
Pakistan: Reinvigorating the Trade Agenda
42
Partner Imports
2009 (US$ million)
PTAs
China Malaysia India SAFTA All PTAs
United Kingdom 780 -1.7 -0.1 -0.1 -0.1 -1.9
Italy 677 -2.1 -0.2 -0.2 -0.2 -2.5
Finland 418 -2.6 0.0 0.0 0.0 -2.7
France 396 -1.6 -0.1 -0.2 -0.2 -1.9
Note: Change in Bilateral Imports from main partners, as a result of hypothetical full tariff liberalization in current PTAs Source: COMTRADE data and authors’ simulations using SMART
65. The fiscal impact of hypothetical zero-tariff FTAs is low with India, Malaysia and
SAFTA, and high with China, according to our simulations using SMART. The fiscal impact
of a zero-tariff PTA with Malaysia would be equal to about US$ 70 million or 2.4% of tariff
revenues in 2009 (Figure 31). A zero-tariff PTA with India is about US$ 65 million or 2.2% of
tariff revenues in 2009. Signing a PTA with the rest of the SAFTA countries would result in
an additional loss of revenue of US$ 9 million or 0.2% of total imports, taking the total to
US$ 74 million (2.6% of revenues). The reduction of tariffs resulting from the
implementation of a zero-tariff PTA with China would have by far the biggest impact on
revenues and trade. Tariff revenue would go down by US$ 525 million or 18.2%. Including all
the previous scenarios (China, Malaysia and SAFTA) as a free trade partner increases the
total loss in tariff revenues by $ 663 million or 23% of tariff revenues. Figure 32 provides the
welfare gain estimates net of tariff revenue loss. Whilst these are small compared to the tariff
revenue losses, they are underestimated. Indeed they do not consider the associated increase
in productivity, variety and quality of imported inputs. Hence, full tariff liberalization would
not only reduce losses but also generate a gain in welfare above the estimated figures, with
the only cost of a shift away from tariffs in the composition of tax revenues.
Figure 31. Tariff Revenue Losses (US$ million) Figure 32. Welfare gains (US$ million)
Source: COMTRADE data and authors’ simulations using SMART
2,885
2,360
2,820 2,815 2,811
2,222
0
500
1,000
1,500
2,000
2,500
3,000
3,500
Baseline China India Malaysia SAFTA All
90
7 17
8
111
0
20
40
60
80
100
120
China India Malaysia SAFTA All
Tariff Revenue Losses and Welfare Gains Figures
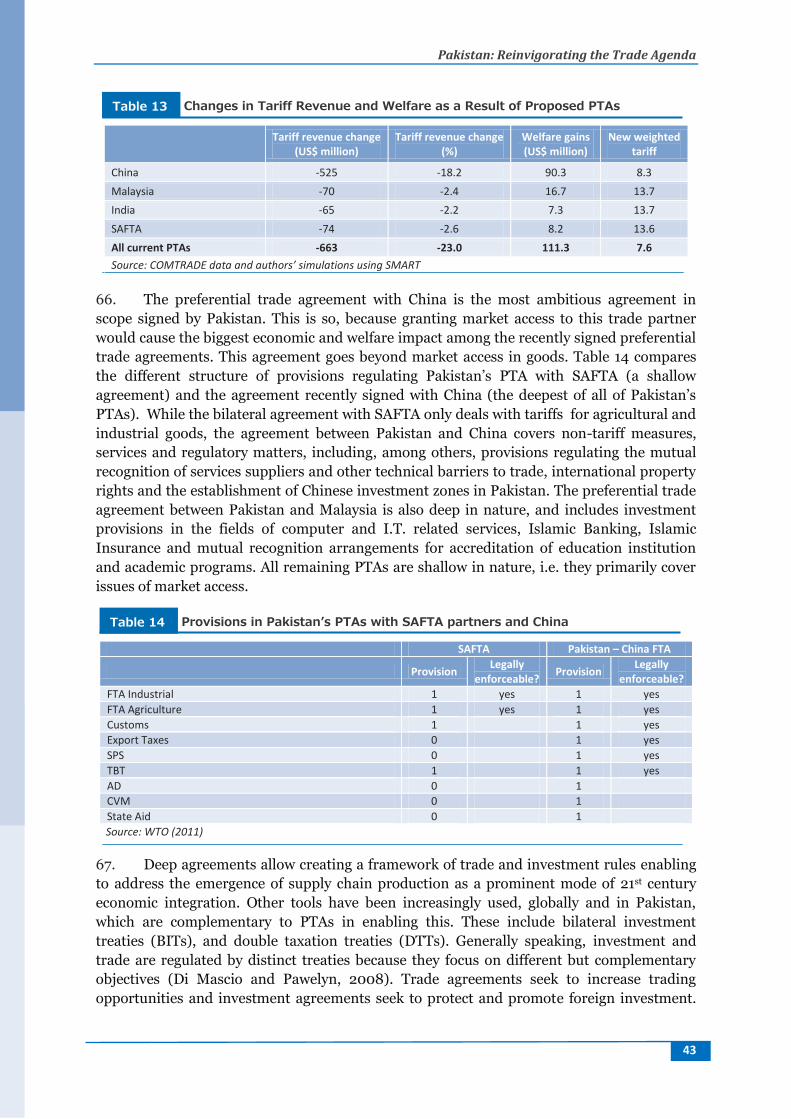
Pakistan: Reinvigorating the Trade Agenda
43
Tariff revenue change
(US$ million) Tariff revenue change
(%) Welfare gains (US$ million)
New weighted tariff
China -525 -18.2 90.3 8.3
Malaysia -70 -2.4 16.7 13.7
India -65 -2.2 7.3 13.7
SAFTA -74 -2.6 8.2 13.6
All current PTAs -663 -23.0 111.3 7.6
Source: COMTRADE data and authors’ simulations using SMART
66. The preferential trade agreement with China is the most ambitious agreement in
scope signed by Pakistan. This is so, because granting market access to this trade partner
would cause the biggest economic and welfare impact among the recently signed preferential
trade agreements. This agreement goes beyond market access in goods. Table 14 compares
the different structure of provisions regulating Pakistan’s PTA with SAFTA (a shallow
agreement) and the agreement recently signed with China (the deepest of all of Pakistan’s
PTAs). While the bilateral agreement with SAFTA only deals with tariffs for agricultural and
industrial goods, the agreement between Pakistan and China covers non-tariff measures,
services and regulatory matters, including, among others, provisions regulating the mutual
recognition of services suppliers and other technical barriers to trade, international property
rights and the establishment of Chinese investment zones in Pakistan. The preferential trade
agreement between Pakistan and Malaysia is also deep in nature, and includes investment
provisions in the fields of computer and I.T. related services, Islamic Banking, Islamic
Insurance and mutual recognition arrangements for accreditation of education institution
and academic programs. All remaining PTAs are shallow in nature, i.e. they primarily cover
issues of market access.
SAFTA Pakistan – China FTA
Provision Legally
enforceable? Provision
Legally enforceable?
FTA Industrial 1 yes 1 yes
FTA Agriculture 1 yes 1 yes
Customs 1 1 yes
Export Taxes 0 1 yes
SPS 0 1 yes
TBT 1 1 yes
AD 0 1
CVM 0 1
State Aid 0 1
Source: WTO (2011)
67. Deep agreements allow creating a framework of trade and investment rules enabling
to address the emergence of supply chain production as a prominent mode of 21st century
economic integration. Other tools have been increasingly used, globally and in Pakistan,
which are complementary to PTAs in enabling this. These include bilateral investment
treaties (BITs), and double taxation treaties (DTTs). Generally speaking, investment and
trade are regulated by distinct treaties because they focus on different but complementary
objectives (Di Mascio and Pawelyn, 2008). Trade agreements seek to increase trading
opportunities and investment agreements seek to protect and promote foreign investment.
Changes in Tariff Revenue and Welfare as a Result of Proposed PTAs Table 13
Provisions in Pakistan’s PTAs with SAFTA partners and China Table 14
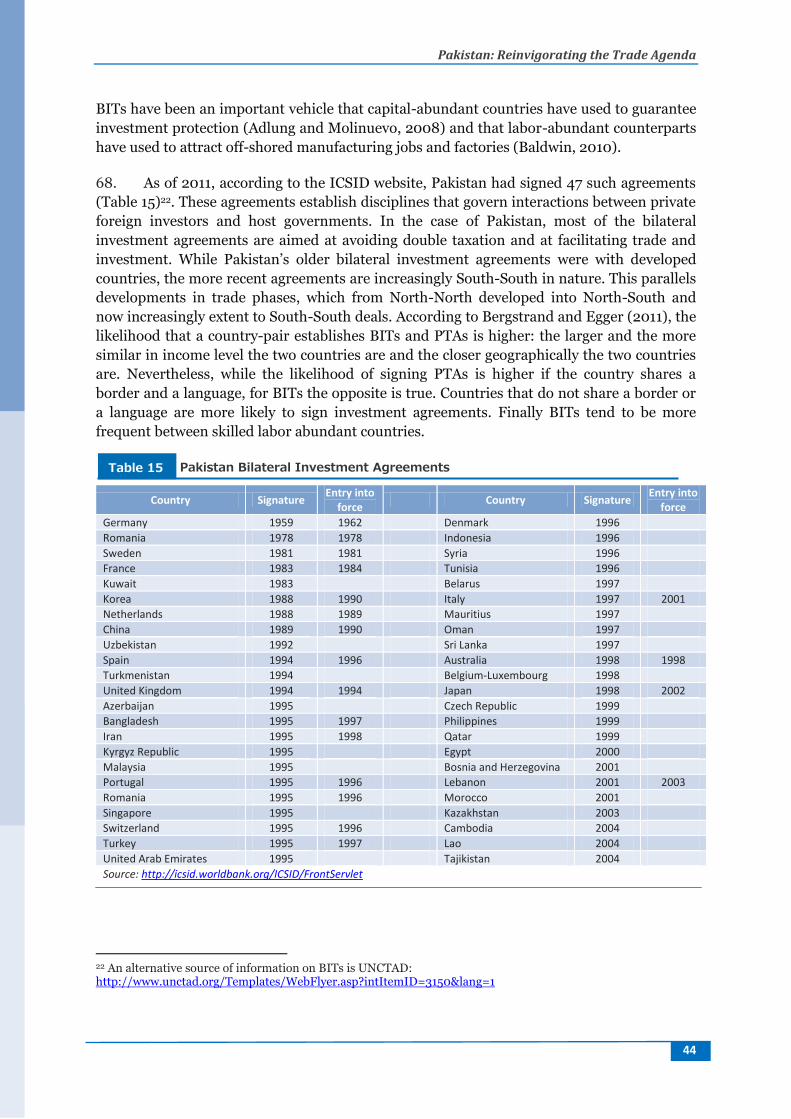
Pakistan: Reinvigorating the Trade Agenda
44
BITs have been an important vehicle that capital-abundant countries have used to guarantee
investment protection (Adlung and Molinuevo, 2008) and that labor-abundant counterparts
have used to attract off-shored manufacturing jobs and factories (Baldwin, 2010).
68. As of 2011, according to the ICSID website, Pakistan had signed 47 such agreements
(Table 15)22. These agreements establish disciplines that govern interactions between private
foreign investors and host governments. In the case of Pakistan, most of the bilateral
investment agreements are aimed at avoiding double taxation and at facilitating trade and
investment. While Pakistan’s older bilateral investment agreements were with developed
countries, the more recent agreements are increasingly South-South in nature. This parallels
developments in trade phases, which from North-North developed into North-South and
now increasingly extent to South-South deals. According to Bergstrand and Egger (2011), the
likelihood that a country-pair establishes BITs and PTAs is higher: the larger and the more
similar in income level the two countries are and the closer geographically the two countries
are. Nevertheless, while the likelihood of signing PTAs is higher if the country shares a
border and a language, for BITs the opposite is true. Countries that do not share a border or
a language are more likely to sign investment agreements. Finally BITs tend to be more
frequent between skilled labor abundant countries.
Country Signature Entry into
force Country Signature
Entry into force
Germany 1959 1962 Denmark 1996
Romania 1978 1978 Indonesia 1996
Sweden 1981 1981 Syria 1996
France 1983 1984 Tunisia 1996
Kuwait 1983 Belarus 1997
Korea 1988 1990 Italy 1997 2001
Netherlands 1988 1989 Mauritius 1997
China 1989 1990 Oman 1997
Uzbekistan 1992 Sri Lanka 1997
Spain 1994 1996 Australia 1998 1998
Turkmenistan 1994 Belgium-Luxembourg 1998
United Kingdom 1994 1994 Japan 1998 2002
Azerbaijan 1995 Czech Republic 1999
Bangladesh 1995 1997 Philippines 1999
Iran 1995 1998 Qatar 1999
Kyrgyz Republic 1995 Egypt 2000
Malaysia 1995 Bosnia and Herzegovina 2001
Portugal 1995 1996 Lebanon 2001 2003
Romania 1995 1996 Morocco 2001
Singapore 1995 Kazakhstan 2003
Switzerland 1995 1996 Cambodia 2004
Turkey 1995 1997 Lao 2004
United Arab Emirates 1995 Tajikistan 2004
Source: http://icsid.worldbank.org/ICSID/FrontServlet
22 An alternative source of information on BITs is UNCTAD: http://www.unctad.org/Templates/WebFlyer.asp?intItemID=3150&lang=1
Pakistan Bilateral Investment Agreements Table 15
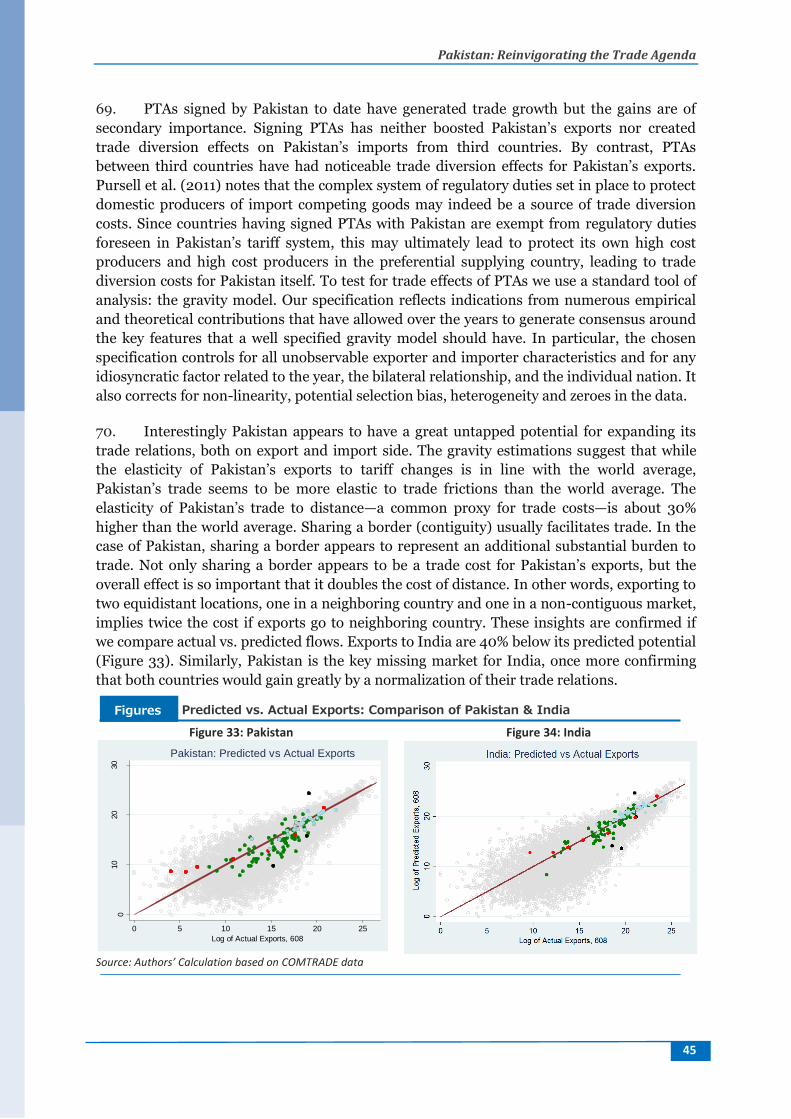
Pakistan: Reinvigorating the Trade Agenda
45
69. PTAs signed by Pakistan to date have generated trade growth but the gains are of
secondary importance. Signing PTAs has neither boosted Pakistan’s exports nor created
trade diversion effects on Pakistan’s imports from third countries. By contrast, PTAs
between third countries have had noticeable trade diversion effects for Pakistan’s exports.
Pursell et al. (2011) notes that the complex system of regulatory duties set in place to protect
domestic producers of import competing goods may indeed be a source of trade diversion
costs. Since countries having signed PTAs with Pakistan are exempt from regulatory duties
foreseen in Pakistan’s tariff system, this may ultimately lead to protect its own high cost
producers and high cost producers in the preferential supplying country, leading to trade
diversion costs for Pakistan itself. To test for trade effects of PTAs we use a standard tool of
analysis: the gravity model. Our specification reflects indications from numerous empirical
and theoretical contributions that have allowed over the years to generate consensus around
the key features that a well specified gravity model should have. In particular, the chosen
specification controls for all unobservable exporter and importer characteristics and for any
idiosyncratic factor related to the year, the bilateral relationship, and the individual nation. It
also corrects for non-linearity, potential selection bias, heterogeneity and zeroes in the data.
70. Interestingly Pakistan appears to have a great untapped potential for expanding its
trade relations, both on export and import side. The gravity estimations suggest that while
the elasticity of Pakistan’s exports to tariff changes is in line with the world average,
Pakistan’s trade seems to be more elastic to trade frictions than the world average. The
elasticity of Pakistan’s trade to distance—a common proxy for trade costs—is about 30%
higher than the world average. Sharing a border (contiguity) usually facilitates trade. In the
case of Pakistan, sharing a border appears to represent an additional substantial burden to
trade. Not only sharing a border appears to be a trade cost for Pakistan’s exports, but the
overall effect is so important that it doubles the cost of distance. In other words, exporting to
two equidistant locations, one in a neighboring country and one in a non-contiguous market,
implies twice the cost if exports go to neighboring country. These insights are confirmed if
we compare actual vs. predicted flows. Exports to India are 40% below its predicted potential
(Figure 33). Similarly, Pakistan is the key missing market for India, once more confirming
that both countries would gain greatly by a normalization of their trade relations.
Figure 33: Pakistan Figure 34: India
Source: Authors’ Calculation based on COMTRADE data
010
20
30
Log o
f P
redic
ted E
xport
s, 6
08
0 5 10 15 20 25
Log of Actual Exports, 608
Pakistan: Predicted vs Actual Exports
Predicted vs. Actual Exports: Comparison of Pakistan & India Figures
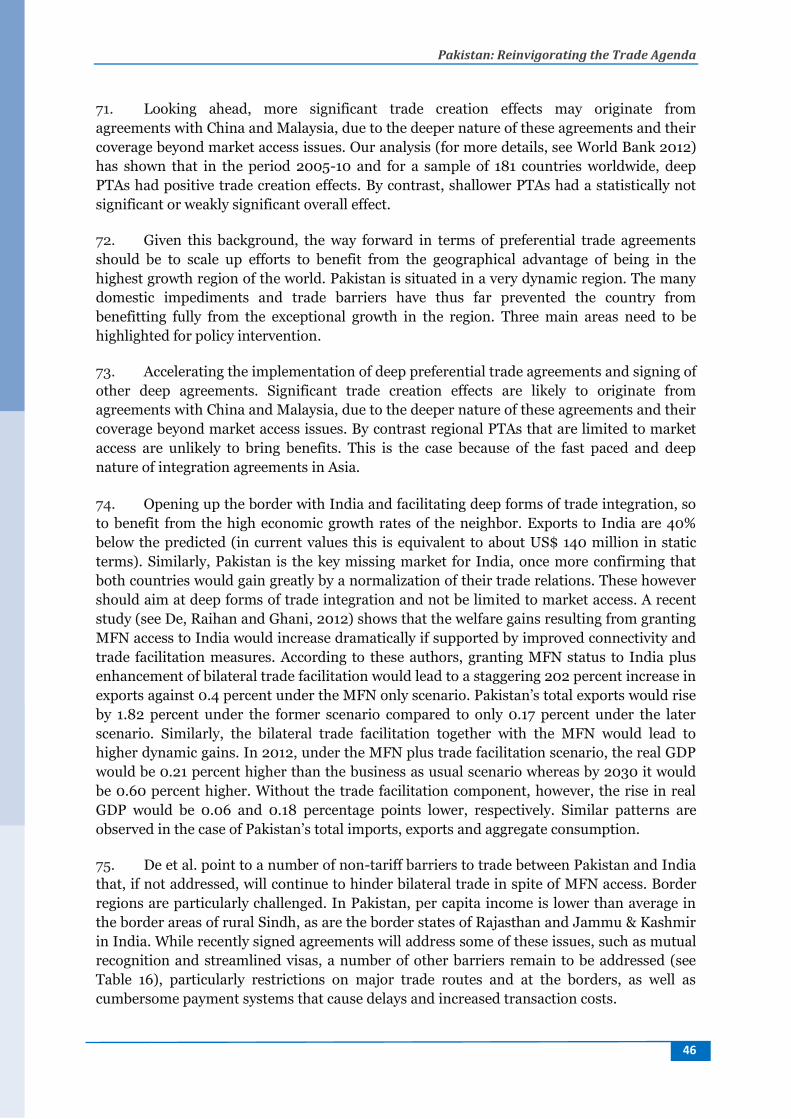
Pakistan: Reinvigorating the Trade Agenda
46
71. Looking ahead, more significant trade creation effects may originate from
agreements with China and Malaysia, due to the deeper nature of these agreements and their
coverage beyond market access issues. Our analysis (for more details, see World Bank 2012)
has shown that in the period 2005-10 and for a sample of 181 countries worldwide, deep
PTAs had positive trade creation effects. By contrast, shallower PTAs had a statistically not
significant or weakly significant overall effect.
72. Given this background, the way forward in terms of preferential trade agreements
should be to scale up efforts to benefit from the geographical advantage of being in the
highest growth region of the world. Pakistan is situated in a very dynamic region. The many
domestic impediments and trade barriers have thus far prevented the country from
benefitting fully from the exceptional growth in the region. Three main areas need to be
highlighted for policy intervention.
73. Accelerating the implementation of deep preferential trade agreements and signing of
other deep agreements. Significant trade creation effects are likely to originate from
agreements with China and Malaysia, due to the deeper nature of these agreements and their
coverage beyond market access issues. By contrast regional PTAs that are limited to market
access are unlikely to bring benefits. This is the case because of the fast paced and deep
nature of integration agreements in Asia.
74. Opening up the border with India and facilitating deep forms of trade integration, so
to benefit from the high economic growth rates of the neighbor. Exports to India are 40%
below the predicted (in current values this is equivalent to about US$ 140 million in static
terms). Similarly, Pakistan is the key missing market for India, once more confirming that
both countries would gain greatly by a normalization of their trade relations. These however
should aim at deep forms of trade integration and not be limited to market access. A recent
study (see De, Raihan and Ghani, 2012) shows that the welfare gains resulting from granting
MFN access to India would increase dramatically if supported by improved connectivity and
trade facilitation measures. According to these authors, granting MFN status to India plus
enhancement of bilateral trade facilitation would lead to a staggering 202 percent increase in
exports against 0.4 percent under the MFN only scenario. Pakistan’s total exports would rise
by 1.82 percent under the former scenario compared to only 0.17 percent under the later
scenario. Similarly, the bilateral trade facilitation together with the MFN would lead to
higher dynamic gains. In 2012, under the MFN plus trade facilitation scenario, the real GDP
would be 0.21 percent higher than the business as usual scenario whereas by 2030 it would
be 0.60 percent higher. Without the trade facilitation component, however, the rise in real
GDP would be 0.06 and 0.18 percentage points lower, respectively. Similar patterns are
observed in the case of Pakistan’s total imports, exports and aggregate consumption.
75. De et al. point to a number of non-tariff barriers to trade between Pakistan and India
that, if not addressed, will continue to hinder bilateral trade in spite of MFN access. Border
regions are particularly challenged. In Pakistan, per capita income is lower than average in
the border areas of rural Sindh, as are the border states of Rajasthan and Jammu & Kashmir
in India. While recently signed agreements will address some of these issues, such as mutual
recognition and streamlined visas, a number of other barriers remain to be addressed (see
Table 16), particularly restrictions on major trade routes and at the borders, as well as
cumbersome payment systems that cause delays and increased transaction costs.
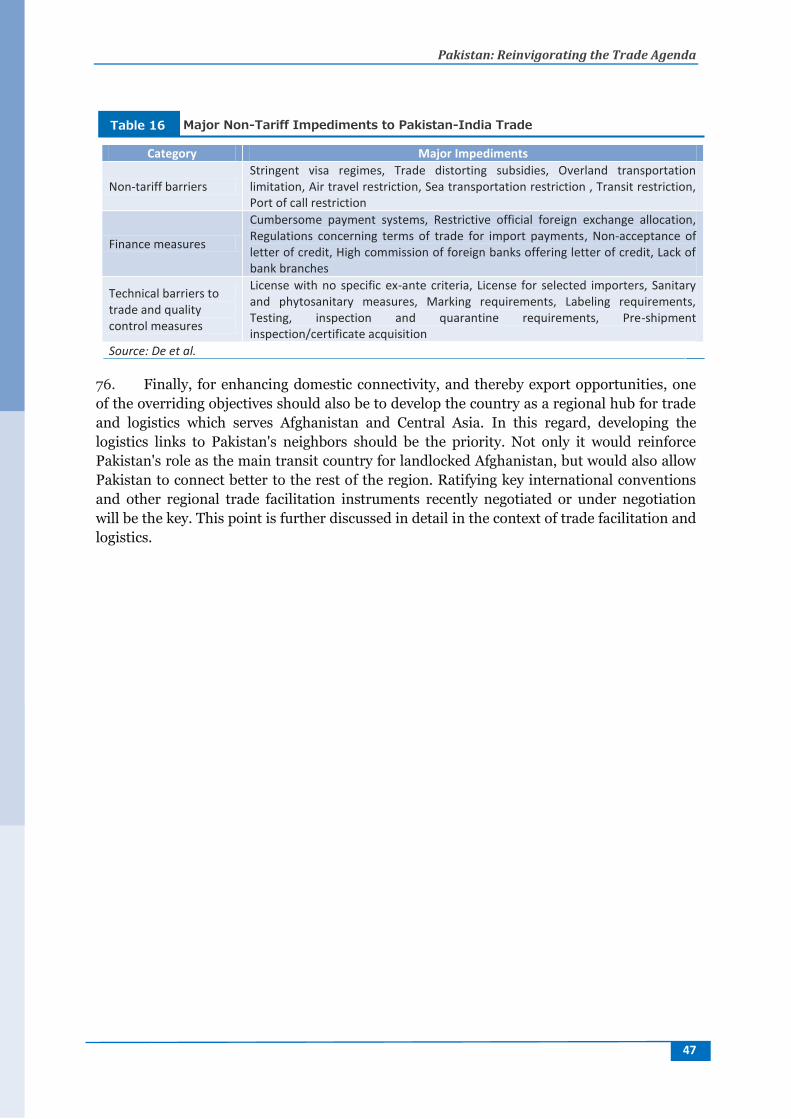
Pakistan: Reinvigorating the Trade Agenda
47
Category Major Impediments
Non-tariff barriers Stringent visa regimes, Trade distorting subsidies, Overland transportation limitation, Air travel restriction, Sea transportation restriction , Transit restriction, Port of call restriction
Finance measures
Cumbersome payment systems, Restrictive official foreign exchange allocation, Regulations concerning terms of trade for import payments, Non-acceptance of letter of credit, High commission of foreign banks offering letter of credit, Lack of bank branches
Technical barriers to trade and quality control measures
License with no specific ex-ante criteria, License for selected importers, Sanitary and phytosanitary measures, Marking requirements, Labeling requirements, Testing, inspection and quarantine requirements, Pre-shipment inspection/certificate acquisition
Source: De et al.
76. Finally, for enhancing domestic connectivity, and thereby export opportunities, one
of the overriding objectives should also be to develop the country as a regional hub for trade
and logistics which serves Afghanistan and Central Asia. In this regard, developing the
logistics links to Pakistan's neighbors should be the priority. Not only it would reinforce
Pakistan's role as the main transit country for landlocked Afghanistan, but would also allow
Pakistan to connect better to the rest of the region. Ratifying key international conventions
and other regional trade facilitation instruments recently negotiated or under negotiation
will be the key. This point is further discussed in detail in the context of trade facilitation and
logistics.
Major Non-Tariff Impediments to Pakistan-India Trade Table 16
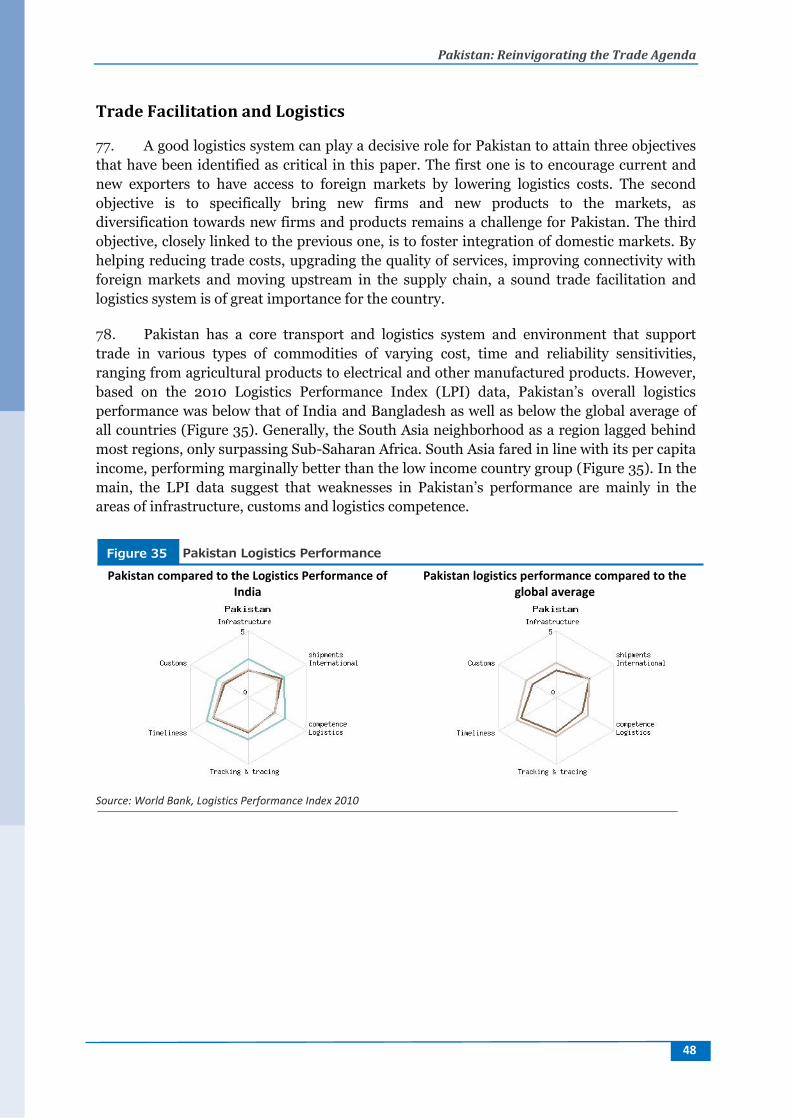
Pakistan: Reinvigorating the Trade Agenda
48
Trade Facilitation and Logistics 77. A good logistics system can play a decisive role for Pakistan to attain three objectives
that have been identified as critical in this paper. The first one is to encourage current and
new exporters to have access to foreign markets by lowering logistics costs. The second
objective is to specifically bring new firms and new products to the markets, as
diversification towards new firms and products remains a challenge for Pakistan. The third
objective, closely linked to the previous one, is to foster integration of domestic markets. By
helping reducing trade costs, upgrading the quality of services, improving connectivity with
foreign markets and moving upstream in the supply chain, a sound trade facilitation and
logistics system is of great importance for the country.
78. Pakistan has a core transport and logistics system and environment that support
trade in various types of commodities of varying cost, time and reliability sensitivities,
ranging from agricultural products to electrical and other manufactured products. However,
based on the 2010 Logistics Performance Index (LPI) data, Pakistan’s overall logistics
performance was below that of India and Bangladesh as well as below the global average of
all countries (Figure 35). Generally, the South Asia neighborhood as a region lagged behind
most regions, only surpassing Sub-Saharan Africa. South Asia fared in line with its per capita
income, performing marginally better than the low income country group (Figure 35). In the
main, the LPI data suggest that weaknesses in Pakistan’s performance are mainly in the
areas of infrastructure, customs and logistics competence.
Pakistan compared to the Logistics Performance of India
Pakistan logistics performance compared to the global average
Source: World Bank, Logistics Performance Index 2010
Pakistan Logistics Performance Figure 35
Pakistan: Reinvigorating the Trade Agenda
49
South Asia Logistics Performance Pakistan performance relative to South Asia
Source: World Bank, Logistics Performance Index 2010
79. Connectivity in Pakistan features great geographical disparities. Outside the system
connecting specialized markets in Karachi, Lahore, Islamabad, Sialkot and Peshawar, which
is relatively well functioning, trade logistics services are generally of a poor quality, especially
when compared to other countries of a similar level of income. The national logistics hub in
Pakistan is located in the south of the country. As one moves north and west of the country
and away from the core national corridor, access to high quality infrastructure and services
reduces. In relatively lagging regions, plans to grow exports in niche products such as fresh
produce for instance, would require measures that better connect remote areas to main
export gateway. Given the nature of some of the prospective export commodities, which have
high volume to weight ratios and the distances involved, it would appear the key to
improving domestic connectivity lies in developing multi-modal systems based on rail and
consolidation of trade volumes.
The Main Components of the Logistics System—Current Situation 80. Railways—Presently Pakistan Railways plays a relatively limited role in the country’s
freight transport despite having a network that extends over much of the country. Pakistan
Railways has almost eight thousand kilometers of broad gauge routes linking all the major
centers, and also interconnects to the Iranian network. Although the railway market share
continues to decline, there has been a leveling off in the volume of freight traffic.
81. Despite the downward trend in traffic carried by rail, there is evidence that Pakistan
railways has been increasing the average length of haul—meaning it has been moving
towards distances where rail has a comparative advantage over road transport (World Bank,
2012). The pricing policy of Railways is designed to make it attractive to different types of
commodities, officially depending on their ability to bear the cost since Pakistan Railway
rates are based on the principle of ‘what each type of traffic can bear’. Simply, railway tariffs
are based not so much on cost of providing the service but on broader objectives to allow
trade in various commodities. Different types of cargo are charged different amounts even if
they may weigh the same and are transported over equivalent distances. However, the
downside of this approach is that the railways are perennially making losses and have to be
Logistics Performance Figure 36
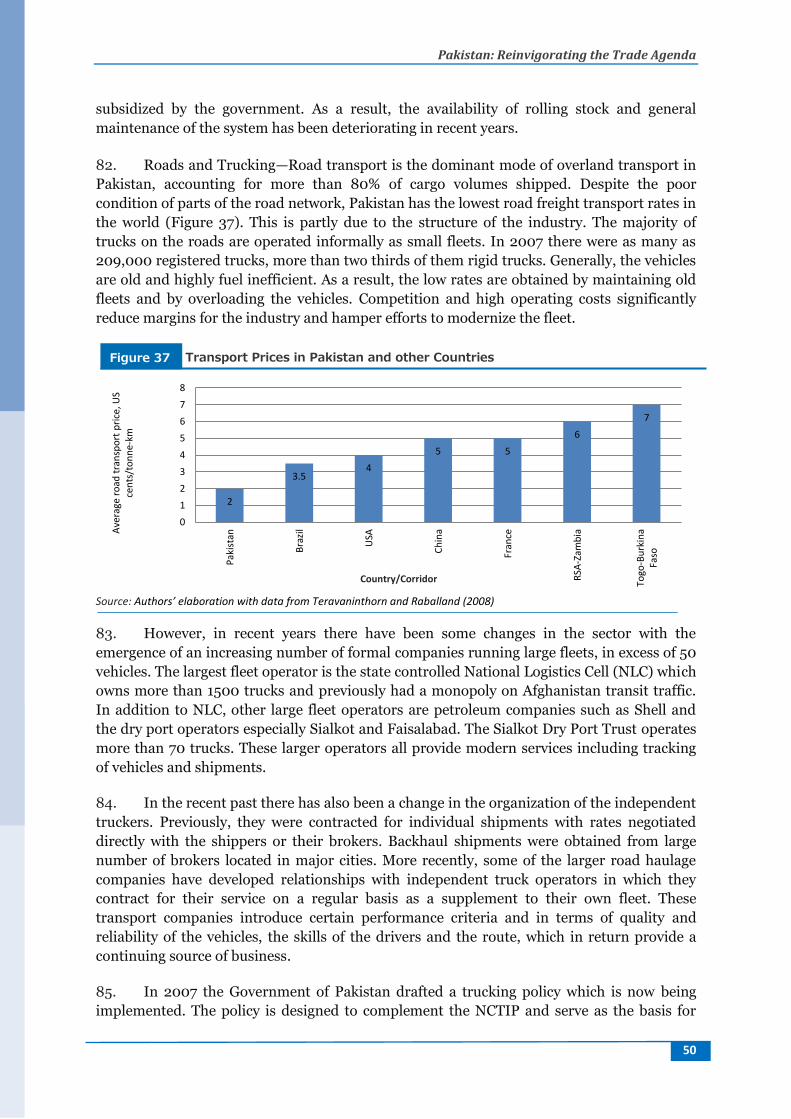
Pakistan: Reinvigorating the Trade Agenda
50
subsidized by the government. As a result, the availability of rolling stock and general
maintenance of the system has been deteriorating in recent years.
82. Roads and Trucking—Road transport is the dominant mode of overland transport in
Pakistan, accounting for more than 80% of cargo volumes shipped. Despite the poor
condition of parts of the road network, Pakistan has the lowest road freight transport rates in
the world (Figure 37). This is partly due to the structure of the industry. The majority of
trucks on the roads are operated informally as small fleets. In 2007 there were as many as
209,000 registered trucks, more than two thirds of them rigid trucks. Generally, the vehicles
are old and highly fuel inefficient. As a result, the low rates are obtained by maintaining old
fleets and by overloading the vehicles. Competition and high operating costs significantly
reduce margins for the industry and hamper efforts to modernize the fleet.
Source: Authors’ elaboration with data from Teravaninthorn and Raballand (2008)
83. However, in recent years there have been some changes in the sector with the
emergence of an increasing number of formal companies running large fleets, in excess of 50
vehicles. The largest fleet operator is the state controlled National Logistics Cell (NLC) which
owns more than 1500 trucks and previously had a monopoly on Afghanistan transit traffic.
In addition to NLC, other large fleet operators are petroleum companies such as Shell and
the dry port operators especially Sialkot and Faisalabad. The Sialkot Dry Port Trust operates
more than 70 trucks. These larger operators all provide modern services including tracking
of vehicles and shipments.
84. In the recent past there has also been a change in the organization of the independent
truckers. Previously, they were contracted for individual shipments with rates negotiated
directly with the shippers or their brokers. Backhaul shipments were obtained from large
number of brokers located in major cities. More recently, some of the larger road haulage
companies have developed relationships with independent truck operators in which they
contract for their service on a regular basis as a supplement to their own fleet. These
transport companies introduce certain performance criteria and in terms of quality and
reliability of the vehicles, the skills of the drivers and the route, which in return provide a
continuing source of business.
85. In 2007 the Government of Pakistan drafted a trucking policy which is now being
implemented. The policy is designed to complement the NCTIP and serve as the basis for
2
3.5 4
5 5
6
7
0
1
2
3
4
5
6
7
8
Pak
ista
n
Bra
zil
USA
Ch
ina
Fran
ce
RSA
-Zam
bia
Togo
-Bu
rkin
aFa
so
Ave
rage
ro
ad t
ran
spo
rt p
rice
, US
cen
ts/t
on
ne-
km
Country/Corridor
Transport Prices in Pakistan and other Countries Figure 37
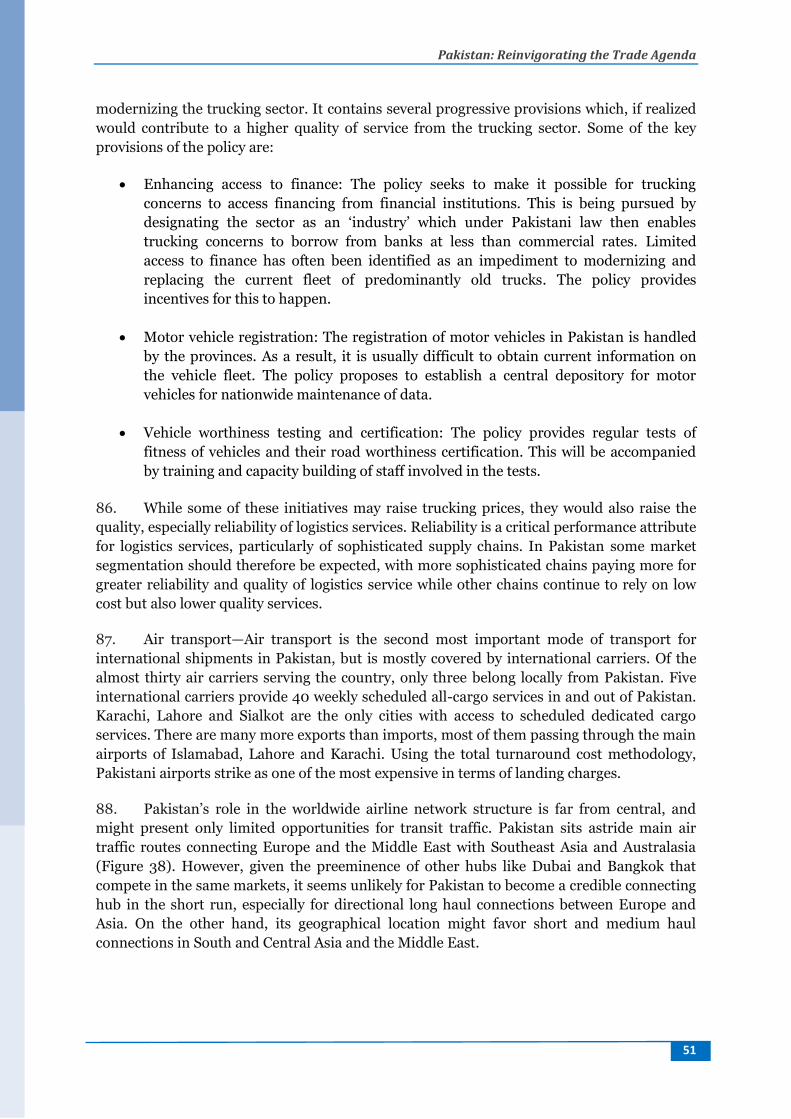
Pakistan: Reinvigorating the Trade Agenda
51
modernizing the trucking sector. It contains several progressive provisions which, if realized
would contribute to a higher quality of service from the trucking sector. Some of the key
provisions of the policy are:
Enhancing access to finance: The policy seeks to make it possible for trucking
concerns to access financing from financial institutions. This is being pursued by
designating the sector as an ‘industry’ which under Pakistani law then enables
trucking concerns to borrow from banks at less than commercial rates. Limited
access to finance has often been identified as an impediment to modernizing and
replacing the current fleet of predominantly old trucks. The policy provides
incentives for this to happen.
Motor vehicle registration: The registration of motor vehicles in Pakistan is handled
by the provinces. As a result, it is usually difficult to obtain current information on
the vehicle fleet. The policy proposes to establish a central depository for motor
vehicles for nationwide maintenance of data.
Vehicle worthiness testing and certification: The policy provides regular tests of
fitness of vehicles and their road worthiness certification. This will be accompanied
by training and capacity building of staff involved in the tests.
86. While some of these initiatives may raise trucking prices, they would also raise the
quality, especially reliability of logistics services. Reliability is a critical performance attribute
for logistics services, particularly of sophisticated supply chains. In Pakistan some market
segmentation should therefore be expected, with more sophisticated chains paying more for
greater reliability and quality of logistics service while other chains continue to rely on low
cost but also lower quality services.
87. Air transport—Air transport is the second most important mode of transport for
international shipments in Pakistan, but is mostly covered by international carriers. Of the
almost thirty air carriers serving the country, only three belong locally from Pakistan. Five
international carriers provide 40 weekly scheduled all-cargo services in and out of Pakistan.
Karachi, Lahore and Sialkot are the only cities with access to scheduled dedicated cargo
services. There are many more exports than imports, most of them passing through the main
airports of Islamabad, Lahore and Karachi. Using the total turnaround cost methodology,
Pakistani airports strike as one of the most expensive in terms of landing charges.
88. Pakistan’s role in the worldwide airline network structure is far from central, and
might present only limited opportunities for transit traffic. Pakistan sits astride main air
traffic routes connecting Europe and the Middle East with Southeast Asia and Australasia
(Figure 38). However, given the preeminence of other hubs like Dubai and Bangkok that
compete in the same markets, it seems unlikely for Pakistan to become a credible connecting
hub in the short run, especially for directional long haul connections between Europe and
Asia. On the other hand, its geographical location might favor short and medium haul
connections in South and Central Asia and the Middle East.
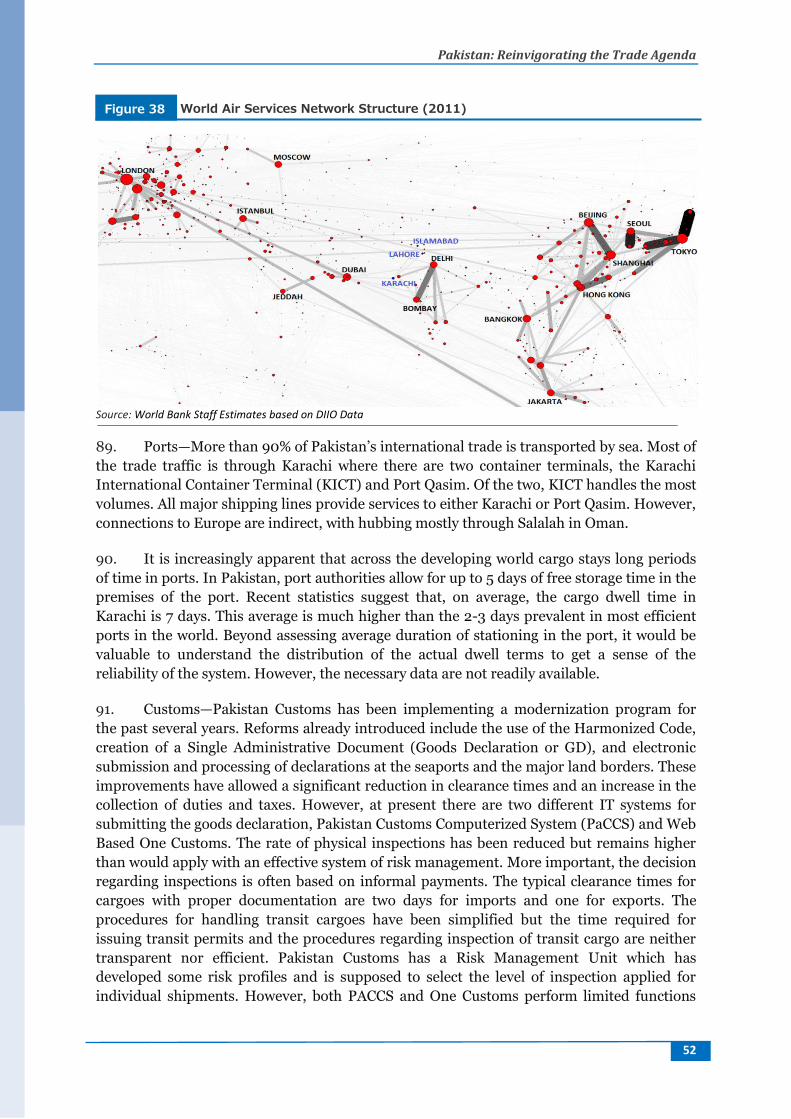
Pakistan: Reinvigorating the Trade Agenda
52
Source: World Bank Staff Estimates based on DIIO Data
89. Ports—More than 90% of Pakistan’s international trade is transported by sea. Most of
the trade traffic is through Karachi where there are two container terminals, the Karachi
International Container Terminal (KICT) and Port Qasim. Of the two, KICT handles the most
volumes. All major shipping lines provide services to either Karachi or Port Qasim. However,
connections to Europe are indirect, with hubbing mostly through Salalah in Oman.
90. It is increasingly apparent that across the developing world cargo stays long periods
of time in ports. In Pakistan, port authorities allow for up to 5 days of free storage time in the
premises of the port. Recent statistics suggest that, on average, the cargo dwell time in
Karachi is 7 days. This average is much higher than the 2-3 days prevalent in most efficient
ports in the world. Beyond assessing average duration of stationing in the port, it would be
valuable to understand the distribution of the actual dwell terms to get a sense of the
reliability of the system. However, the necessary data are not readily available.
91. Customs—Pakistan Customs has been implementing a modernization program for
the past several years. Reforms already introduced include the use of the Harmonized Code,
creation of a Single Administrative Document (Goods Declaration or GD), and electronic
submission and processing of declarations at the seaports and the major land borders. These
improvements have allowed a significant reduction in clearance times and an increase in the
collection of duties and taxes. However, at present there are two different IT systems for
submitting the goods declaration, Pakistan Customs Computerized System (PaCCS) and Web
Based One Customs. The rate of physical inspections has been reduced but remains higher
than would apply with an effective system of risk management. More important, the decision
regarding inspections is often based on informal payments. The typical clearance times for
cargoes with proper documentation are two days for imports and one for exports. The
procedures for handling transit cargoes have been simplified but the time required for
issuing transit permits and the procedures regarding inspection of transit cargo are neither
transparent nor efficient. Pakistan Customs has a Risk Management Unit which has
developed some risk profiles and is supposed to select the level of inspection applied for
individual shipments. However, both PACCS and One Customs perform limited functions
World Air Services Network Structure (2011) Figure 38
Pakistan: Reinvigorating the Trade Agenda
53
and neither has a risk management module (PACCS system uses random selection of
containers). Still, the random selection can be overridden by an officer thereby creating
significant opportunities for informal payments.
92. Presently, Pakistan does not have a formal system of Authorized Economic
Operators, although informal recognition is given to preferred traders who receive expedited
clearance. Modern X-ray scanning has been introduced but only at QICT and only for exports
to the US as part of the C-TPAT program.
Pakistan: Reinvigorating the Trade Agenda
54
Policy Recommendations 93. In this paper, a thorough analysis of Pakistan’s recent trade performance was
conducted, with focus on its trade policy and trade costs. In addition to assessing different
dimensions of trade performance—growth and orientation, diversification and sophistication
—an in-depth analysis of export dynamics in the 2001-11 period, using firm-level data, was
performed. It also includes an analysis of Pakistan’s trade policy including tariffs, effective
protection and trade restrictiveness estimates, as well as an assessment of the role of
preferential trade agreements in the context of regional integration. Finally, the main
characteristics of trade facilitation and logistics were analyzed, covering the capacity,
performance, quality of services and degree of integration of the logistics system.
94. Pakistan’s recent trade performance stagnated in recent years, as indicated by a
moderate decrease in its trade-to-GDP ratio over the last decade, in stark contrast to peer
countries that have leapfrogged with high growth rates in the last two decades. The firm-level
analysis shows that, despite positive signs of exports dynamism, with substantial churning of
firms, Pakistan has not been very successful in terms of helping firms break into sectors and
products to be able to deliver higher export growth. In addition, the performance has become
poorer after 2004, well before the global financial crisis, and has still not recovered.
95. Amidst very uncertain and volatile conditions for global demand, Pakistan can
maximize its chances of increasing domestic competitiveness and hence exports by creating
the conditions that foster firm dynamism, experimentation and quality upgrading of their
products and by eliminating domestic impediments and barriers to trade.
96. Diversification is critical to enhance export performance. Diversification, be it in
terms of firms, products or destinations, is positively correlated to export growth, with an
effect that is quantitatively sizeable and statistically significant. To achieve the objectives of
more dynamic and diversified export base, Pakistan needs to take substantial measures to
develop a competitive business environment and eliminate barriers to export. This will have
a clear impact in terms of lowering the entry costs for exporters and firms to venture in new
products and sectors by creating a level playing field for firms, promoting intra-industry
competition, and creating a more transparent business environment. It is also likely to
attract foreign direct investment that is crucial for both acquiring technological know-how
and much needed capital.
97. In particular, the following policy actions analyzed in this paper are likely to
stimulate diversification and increase of exports:
98. Promoting intra-industry competition and enabling environment conducive for
exports requires first and foremost the abolition of highly complex trade regulations, further
refining the tariff structure, and the elimination of remaining regulatory duties. Pakistan’s
complex import tariff and tax regime creates uncertainty, reduces transparency, and reduces
firm dynamism. First, the selective protection and concessions on inputs is a source of
economic inefficiency because valuable resources are being diverted to less productive
sectors that are protected from otherwise low international prices, and away from Pakistan’s
true comparative advantage industries. Second, administering the concessions which
operates as a de facto import licensing regime involves transaction costs to the firms that
hope to benefit the government bodies that administer it and the EDB. The transaction costs
Pakistan: Reinvigorating the Trade Agenda
55
incurred by firms reduce the value to them of participating in the system. Because the
information and transaction costs will tend to be lower relative to their output, the system
very probably benefits larger established firms and discriminates against small and medium
enterprises. Meanwhile ‘customized’ domestic protection entails important costs and risks,
including the risk that protected firms have a disincentive to become efficient and often rely
on continued protection to remain in business, rendering a loss to consumers and reducing
economic efficiency.
99. High duty rates and a regulatory duty imposed only on imports was and remains an
extremely inefficient way of cutting imports of ‘luxury’ products and is also a
counterproductive method of generating government revenue. The very existence of schemes
granting protection to selected sectors and products increases the scope for smuggling and
under-invoicing. The cascading principle, evoked by many governmental documents, makes
this likely especially for final goods. Third, domestic market protection through tariff
protection generates an anti-export bias. Since Pakistan cannot influence world market
prices, exporting firms do not have any benefit from domestic tariff policies. By contrast,
producers for the domestic market enjoy a price advantage over foreign competitors. This
leads to market distortions whereby the incentive for producers is to focus on serving the
domestic market rather than exports. We therefore recommend the following phased
rationalization and liberalization of the import tax regime:
In the short-term, a simplification of the tariff regime toward a three-band structure.
This includes an immediate reduction of the top level to 25% and the move to a
transparent, three-band structure (25%, 10%, 0%), with the aim of moving over the
medium term (within three to five years) to a uniform 10% tariff rate. This latter
stage should be accompanied by the removal of all regulatory duties and elimination
for concessions outside of trade agreements and free zones. This would have
important positive effects in the long run, with the transitory effects of adjustment in
terms of output and employment limited to some sectors and a relatively small
impact on tariff revenues. An exercise conducted for this paper shows that a reform
that puts a ceiling for tariffs at 25 percent but retains all other features of the current
tariff regime, including exemptions, would cause a 3.7 percent reduction in tariff
revenues, but only 1.8 percent on total import tax revenues, and a 0.6 percent decline
in import prices. As a result of reform, higher value-added export-oriented sectors
such as Chemicals and Chemical Products, and Machinery and Equipment are likely
to benefit, even in the short run. Meanwhile, many lower value-added, import-
competing sectors—such as Processed Foods, Rubber and Plastic Goods, and Other
Manufacturing–would adjust production downward in the short run, as would many
service sectors that temporarily lose out as consumption adjusts to take advantage of
lower prices, particularly in traded goods.
In the medium-term, move to uniform tariff rate that is applied across-the-board.
Moving to a uniform 10 percent tariff and eliminating all exemptions, as
recommended over the medium-term, would imply a 79.2 percent increase in tariff
revenues and a 36.4 percent increase in total import tax revenue, while increasing
moderately the price of imports (by 1.4 percent). In the medium run, it is expected
that the full effects of reform will start to emerge, as economic agents are better able
to respond to the new incentive environment, resulting in the shift of resources from
Pakistan: Reinvigorating the Trade Agenda
56
less productive to more productive economic activities and, more importantly,
Pakistan is able to attract new capital to its more competitive sectors.
100. This paper also brought supporting evidence that Pakistan could achieve great
advances in trade performance by pursuing greater regional integration through deep
agreements that look beyond market access and improvement of the country’s overall
logistics system.
101. In regards to market access, accelerating the implementation of deep preferential
trade agreements and signing of other agreements in that vein are key initiatives. Significant
trade creation effects are likely to originate from the agreements with China and Malaysia,
due to the deeper nature of these agreements and their coverage beyond market access
issues. By contrast regional PTAs that are limited to market access are likely not to bring
benefits. This is the case because of the fast paced and deep nature of integration agreements
in Asia.
102. Pakistan has to scale up efforts to benefit from the geographical advantage of being in
the highest growth region of the world. Pakistan is situated in a very dynamic region. The
many domestic impediments and trade barriers have thus far prevented the country from
benefitting fully from the exceptional growth in the region. Opening up the border with India
and facilitating deep forms of trade integration is necessary to benefit from the high growth
rates of the neighbor. Exports to India are 40% below their predicted potential. Similarly,
Pakistan is the key missing market for India, once more confirming that both countries
would gain greatly by a normalization of their trade relations. These however should aim at
deep forms of trade integration and not be limited to market access. Given that normalized
trade is only now being established, the focus should be expediting measures to facilitate
trade, building on the agreements that have recently been signed on mutual recognition and
visas, by improving infrastructure, institutions, services, policies, procedures, and market-
oriented regulatory systems. Some specific measures that should be considered for further
assessment, potentially on a joint basis with India include the following:
Removing impediments at the border and along trade routes. A number of key
impediments remain that raise the time and cost of bilateral trade. To facilitate the
movement of goods and people across the border, specific measures should be
considered for further analysis include the potential for transit agreements to link
Pakistan to Bangladesh and Nepal and India to Afghanistan (similar to that which
was negotiated between Pakistan and Afghanistan) and associated infrastructure to
support new trade routes, a one-stop border post at the Wagah-Attari border, inland
container depots on either side of the border, and online payment schemes.
Further integrating border communities. Given populations along the border regions
are among the poorest, the particular challenges of integrating border communities,
more localized initiatives to target border populations may include border bazaars
and other measures to encourage cross-border trade—something that is already
happening to some degree between India and Bangladesh and can be replicated on
the Pakistan-India border.
Pakistan: Reinvigorating the Trade Agenda
57
103. Finally, weaknesses in the logistics system and great geographical disparities also
restrain Pakistan’s competitiveness and exports. By helping reducing trade costs, upgrading
the quality of services, improving connectivity with foreign markets and moving upstream in
the supply chain, a sound trade facilitation and logistics system is of great importance for the
country. Pakistan has a core transport and logistics system and environment that support
trade in various types of commodities of varying cost, time and reliability sensitivities,
ranging from agricultural products to electrical and other manufactured products. However,
based on the 2010 Logistics Performance Index data, Pakistan’s overall logistics performance
was below that of India and Bangladesh as well as below the global average of all countries.
Pakistan’s performance main weaknesses are in the areas of infrastructure, customs and
logistics competence. Moreover, outside the core north-south corridor, trade logistics
services are generally of a poor quality. In order to upgrade the quality and reliability of the
logistics services, five areas of action are suggested:
Overall, improving port performance is critical to lowering logistics costs. The stated
average is much higher than the 2-3 days that is prevalent in most efficient ports in
the world. If trade in time sensitive products is to grow, then this time will have to be
reduced. Improvement of port operations and customs procedures is key to reach this
objective. In particular, it would be beneficial from a trade logistics perspective if a
unified and comprehensive customs system was introduced and operational across
the country. This would enable the private sector to develop and invest in appropriate
interfaces to the system. Presently this is difficult and inefficient as there are
duplications. Critical but still lacking is the introduction of the following: an effective
risk management system, a formal Authorized Economic Operators regime, and an
expedited regime for transit shipments. These will allow more cargo to be cleared
inland thereby reducing bottlenecks at the seaports and land borders and increasing
the effectiveness of the clearance procedures and allowing for greater cooperation
between shippers and customs officials. As Pakistan is developing trade links to the
Central Asian Republics in the north, these systems can be strategic.
Further improving regulation of the trucking industry is another crucial step. There
are already a number of initiatives underway to address the problems of the road
haulage sector. Overall, the trucking policy seems comprehensive and well founded.
It is at par with policies in other middle income countries and when fully
implemented should have a significant effect on the quality of trucking services in
Pakistan. Given the presence of numerous small players in the logistics market in
Pakistan, a solid legal framework for the responsibilities and liabilities, including
those of truckers, is paramount. Presently, this is a significant gap in the legal
framework in the country especially where it concerns liability for goods as they move
along the chain. Truck operators for instance only carry third-party liability. This is
one of the reasons why the quality of freight forwarding is critical. Freight forwarders,
most of who also serve as clearing agents are the most important intermediary in
trade logistics in any country. It is imperative that capacity building programs are
implemented for this sector.
For enhancing domestic connectivity, and thereby export opportunities, one of the
overriding objectives of the Government of Pakistan is to develop the country as a
regional hub for logistics. In this regard, developing the land transport links to
Pakistan: Reinvigorating the Trade Agenda
58
Pakistan’s neighbors, including India, should be the priority, since in doing so this
allows developing a multi-modal system which connects the more remote north and
north-west areas of the country to the well established national logistics hub located
in the south. Not only it would reinforce Pakistan’s role as the main transit country
for landlocked Afghanistan, but would also allow Pakistan to connect better to the
rest of the region. Exploiting this potential requires first of all changing the approach
in the country, from viewing herself as a transit country for landlocked Afghanistan to
relying on transit rights through the same country for access to and from the Central
Asian Republics in particular. It further requires that Pakistan takes additional steps,
especially with respect to ratifying key international conventions and other regional
trade facilitation instruments. 23 Pakistan has already been working for some time on
negotiating transport agreements with several of its neighbors to the north and west.
The highest priority of these agreements has been the one with Afghanistan, whose
revised version entered into force in mid-2011. Others are being negotiated with the
Central Asian Republics.
Addressing domestic connectivity disparities to create trade opportunities especially
in fresh produces requires a holistic approach. Exploring dry ports and railway
expansion within a logistics cluster based approach can lead to the expansion of
exports of new products, specially fruits and vegetables. Small scale production,
spread over large areas increases logistics costs as there are limited opportunities to
exploit economies of scale. There is therefore a need for strategically located
infrastructure for consolidation, grading, processing, packing, cold stores to facilitate
such trade by reducing cost. Secondly, these products though time sensitive, have
large volumes and low values. This makes the more readily available mode of
transport, which is air, unsuited to expanding their trade. Air transport is suited to
high value products that are time sensitive. The challenge is how to develop an
efficient land transport system that can connect producers in the northern part of
Pakistan to the export gateways in the south so as to minimize time and cost.
Prospects for this in the Pakistani context lie in efficient road and rail services and
strategically located cargo consolidation facilities. The Sialkot Dry Port experience
clearly suggests this can be done with significant impacts on efficiency. The Sialkot
area has three major industrial complexes in Pakistan, namely sports goods, surgical
instruments and tannery industries. A common logistics system was established in
1984 designed around a dry port. The dry port facility was built by 52 reputed
exporters to enable them to build an efficient logistics system with Customs
Clearance services on site and access to air, road and rail transport services. The
services are of high quality in terms of transit time, safety and reliability. In fact
Sialkot is one of the most sophisticated and efficient logistics operations in Pakistan.
The experience demonstrates the potential of mutually beneficial collaboration
between exporters at the same location.
23 In 1992 UNESACP identified several international legal instruments that South Asia countries were to ratify to improve trade facilitation: Road Traffic 1968; Road Signs and Signals 1968; Customs Convention on the International Transport of Goods under Cover of TIR Carnets (TIR Convention) 1975; Customs Convention on the Temporary Importation of Commercial Road Vehicles 1956; Customs Convention on Containers 1972; International Convention on the Harmonization of Frontier Controls of Goods 1982; Convention on the Contract for the International Carriage of Goods by Road (CMR) 1956; and Maritime Trade and Transit Facilitation Convention 1965.
Pakistan: Reinvigorating the Trade Agenda
59
Finally, improving coordination is essential. The majority of Pakistan’s logistics
providers are small-scale enterprises offering a limited range of services and
competing on cost with relatively little consideration for reliability or value. This has
two significant consequences: firstly, services are generally of a poor quality and
secondly, there is a high level of fragmentation in services, meaning there are
numerous parties involved in the supply chain. The fragmentation of services is at the
policy, institutional and operational levels. The coordination of trade facilitation and
logistics in Pakistan is not easy, mainly due to institutional fragmentation. Each
mode of transport falls under a different ministry: Roads are under the Ministry of
Communications, while there is also a Ministry of Railways, Ministry of Ports and
Shipping and Ministry of Defense which has a say on civil aviation matters. This
multiplicity of public agencies makes it a challenge to coordinate actions and
engender an integrated core logistics system. However, any coordinating body would
need sufficient authority to see through critical reforms, ideally with very high level
support in government.
Pakistan: Reinvigorating the Trade Agenda
60
References Adlung, R. and M. Molinuevo, 2008. “Bilaterlism in Services Trade. Is there Fire behind the (BIT) Smoke?” Journal of International Economic Law. Vol. 11(2). pp:365-409. Anderson, J.E. and J.P.Neary. 1994. “Measuring the Restrictiveness of Trade Policy”. World Bank Economic Review. Vol. 8(2). pp:151-169. Anderson, J.E. and J Peter Neary. 1996. “A New Approach to Evaluating Trade Policy”. Review of Economic Studies. Vol. 63(1). pp:107-125. Anderson, J.E. and J Peter Neary. 2003. “The Mercantilist index of trade policy”. International Economic Review. Vol. 44. pp:627-649. Antràs, P and R Staiger. 2008."Offshoring and the Role of Trade Agreements". CEPR Discussion Papers 6966. C.E.P.R. Discussion Papers. Arkolakis, C. & M.A. Muendler, 2010. “The Extensive Margin of Exporting Products: A Firm-level Analysis”. NBER Working Papers 16641. National Bureau of Economic Research, Inc Baldwin R. 2011. “21st century regionalism: Filling the gap between 21st century trade and 20th century trade governance”. CEPR Policy Insight No. 56. CPER. Bergstrand, J. H. and P. Egger. 2011."What Determines BITs?". CESifo Working Paper Series 3514. CESifo Group Munich. Bricongne, J. C., Fontagne, L., Gaulier, G., Taglioni, D. & Vicard V. 2011.“Firms and the Global Crisis: French Exports in the Turmoil”. Forthcoming in Journal of International Economics. Carpenter, T and A Lendle. 2010. “How Preferential is World Trade?”. CTEI Working Paper 2010-32. Geneva: The Graduate Institute Centre for Trade and Economic Integration. Carrere C. 2006. “Revisiting the effects of regional trade agreements on trade flows with proper specification of the gravity model". European Economic Review. Vol. 50(2). pp:223-247. Chaffour J.P., J.C. Maur. 2011. “Preferential Trade Agreement Policies for Development: A Handbook”. The World Bank: Washington DC. Damuri, Y.R. 2009. “How preferential are preferential trade agreements? Analysis of product exclusions in PTAs”. Swiss National Centre of Competence in Research, Working Paper 2009/30. Davis, S. and J.C. Haltiwanger. 1992. “Gross Job Creation, Gross Job Destruction and Employment Reallocation”. Quarterly Journal of Economics. Vol.107(3). pp: 819-63. De, P., S. Raihan and E. Ghani. 2012. “What does MFN mean for India and Pakistan? Is MFN a Panacea?” World Bank Mimeo Di Mascio N and J Pawelyn. 2008. “Non-discrimination in trade and investment treaties: Worlds apart of Two Sides of the Same Coin?” American Journal of International Law. Vol. 102(1). pp: 48-89. Dollar, D. and A. Kraay. 2004.;
Pakistan: Reinvigorating the Trade Agenda
61
Dollar, D. and A. Kraay. 2002.; Fernandez, R and J Portes. 1998."Returns to Regionalism: An Analysis of Nontraditional Gains from Regional Trade Agreements". World Bank Economic Review. Vol. 12(2). pp:197-220. EIU. 2011. “Pakistan Country Commerce Report 2011”. New York: The Economist Intelligence Unit. Felipe, J. 2010. “Inclusive Growth, Full Employment, and Structural Change: Implications and .Policies for Developing Asia”. Asian Development Bank. Freund C. and E. Ornelas. 2010. "Regional Trade Agreements". Annual Review of Economics Vol. 2(1). pp:139-166, 09. Fugazza, M. and A. Nicita. 2010. “The Value of Preferential Market Access”. UNCTAD Blue series on Policy Issues in International Trade and Commodities. Hausmann, R., Hwang, J., and Rodrik, D. 2006. “What you exports matters”. NBER Working Papers 11905. National Bureau of Economic Research, Inc. Helpman, E., Melitz, M., and Y. Rubinstein. 2008. “Estimating Trade Flows: Trading Partners and Trading Volumes.” Quarterly Journal of Economics, Vol. CXXIII(2). Horn, H., P. Mavroidis and A. Sapir. 2010. "Beyond the WTO? An anatomy of EU and US preferential trade agreements”. The World Economy. Vol.33(11). pp::1565-1588. Hummels, D. and P. Klenow. 2005. “The Variety and Quality of a Nation’s Exports.” American Economic Review, Vol. 95(3). Kee, H.L., A. Nicita and M. Olarreaga. 2008. “Import Demand Elasticities and Trade Distortions”. The Review of Economics and Statistics. Vol 90(4). pp:666-682. Kee, H.L., A. Nicita and M. Olarreaga. 2009. “Estimating Trade Restrictiveness Indices”. The Economic Journal. Vol. 119. pp: 172-199. Lall, S. 2000. “The technological structure and performance of developing country manufactured exports, 1985-98”. Oxford Development Studies. Vol. 28(3). pp: 337–369. Lawrence, R.Z. 1996. “Regionalism, Multilateralism and Deeper integration”. Brookings Institution. Ministry of Commerce. 2009. “Strategic Trade Policy Framework 2009-12”. Government of Pakistan. Mishra, L. and R. Anand. 2011. “Service Export Sophistication and Economic Growth”. World Bank Policy Research Paper 5606. World Bank: Washington D.C. Orefice, G and N. Rocha. 2011. “Deep integration and production networks: an empirical analysis”. WTO Working Paper. Pack, H. and K. Saggi. 2006. “The case for industrial policy: a critical survey.” World Bank Policy Research Working Paper 3839. World Bank: Washington D.C. Pitigala, N. and M. Hoppe. "The Impact of Multiple-Taxation on Competitiveness in Nigeria". Africa Policy Note Series No. 16. World Bank: Washington DC.
Pakistan: Reinvigorating the Trade Agenda
62
Planning Commission. 2011. “Framework for Economic Growth”. Government of Pakistan. Pursell G., A. Kahn and S. Gulzar. 2011. “Pakistan’s Trade Policies: Future Directions”. International Growth Centre Working Paper 11/0361. London School of Economics, London: UK Santos-Silva J.M.C. and S. Tenreyro. 2006. “The Log of Gravity”. Review of Economics and Statistics. Vol.88(4). pp: 641-658. Tinbergen, J. 1962. “Shaping the World Economy”. The 20th Century Fund, New York. Viner. 1950. “The Customs Union Issue”. Carnegie Endowment for Peace. Winters, L. A., N. McCulloch, and A. McKay. 2004. "Trade Liberalization and Poverty: The Evidence So Far". The Journal of Economic Literature. Vol.42(1). pp:72-115. World Trade Organization. 2011. "World Trade Report 2011- The WTO and Preferential Trade Agreements: From Co-existence to Coherence". WTO: Geneva. World Bank. 2010. “Connecting to Compete—The Logistics Performance Index and its Indicators”. The World Bank: Washington DC. World Bank. 2012. “Trade competitiveness in Pakistan”. The World Bank: Washington DC.
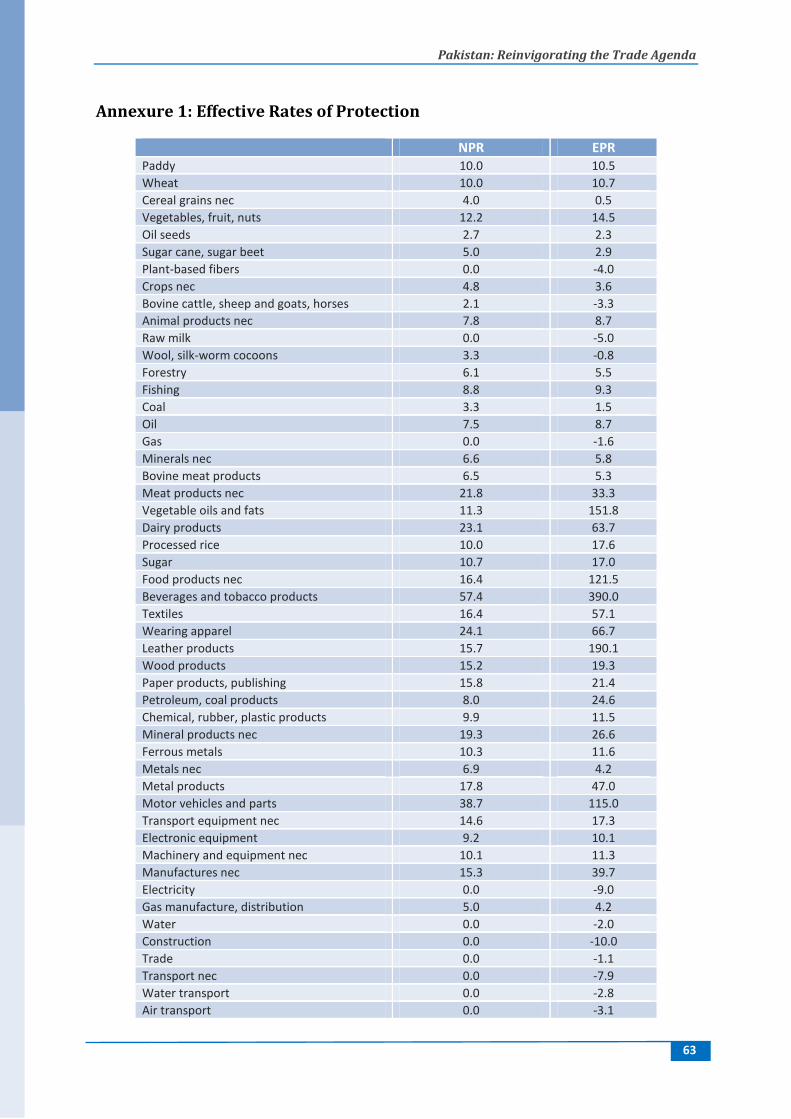
Pakistan: Reinvigorating the Trade Agenda
63
Annexure 1: Effective Rates of Protection
NPR EPR Paddy 10.0 10.5
Wheat 10.0 10.7
Cereal grains nec 4.0 0.5
Vegetables, fruit, nuts 12.2 14.5
Oil seeds 2.7 2.3
Sugar cane, sugar beet 5.0 2.9
Plant-based fibers 0.0 -4.0
Crops nec 4.8 3.6
Bovine cattle, sheep and goats, horses 2.1 -3.3
Animal products nec 7.8 8.7
Raw milk 0.0 -5.0
Wool, silk-worm cocoons 3.3 -0.8
Forestry 6.1 5.5
Fishing 8.8 9.3
Coal 3.3 1.5
Oil 7.5 8.7
Gas 0.0 -1.6
Minerals nec 6.6 5.8
Bovine meat products 6.5 5.3
Meat products nec 21.8 33.3
Vegetable oils and fats 11.3 151.8
Dairy products 23.1 63.7
Processed rice 10.0 17.6
Sugar 10.7 17.0
Food products nec 16.4 121.5
Beverages and tobacco products 57.4 390.0
Textiles 16.4 57.1
Wearing apparel 24.1 66.7
Leather products 15.7 190.1
Wood products 15.2 19.3
Paper products, publishing 15.8 21.4
Petroleum, coal products 8.0 24.6
Chemical, rubber, plastic products 9.9 11.5
Mineral products nec 19.3 26.6
Ferrous metals 10.3 11.6
Metals nec 6.9 4.2
Metal products 17.8 47.0
Motor vehicles and parts 38.7 115.0
Transport equipment nec 14.6 17.3
Electronic equipment 9.2 10.1
Machinery and equipment nec 10.1 11.3
Manufactures nec 15.3 39.7
Electricity 0.0 -9.0
Gas manufacture, distribution 5.0 4.2
Water 0.0 -2.0
Construction 0.0 -10.0
Trade 0.0 -1.1
Transport nec 0.0 -7.9
Water transport 0.0 -2.8
Air transport 0.0 -3.1
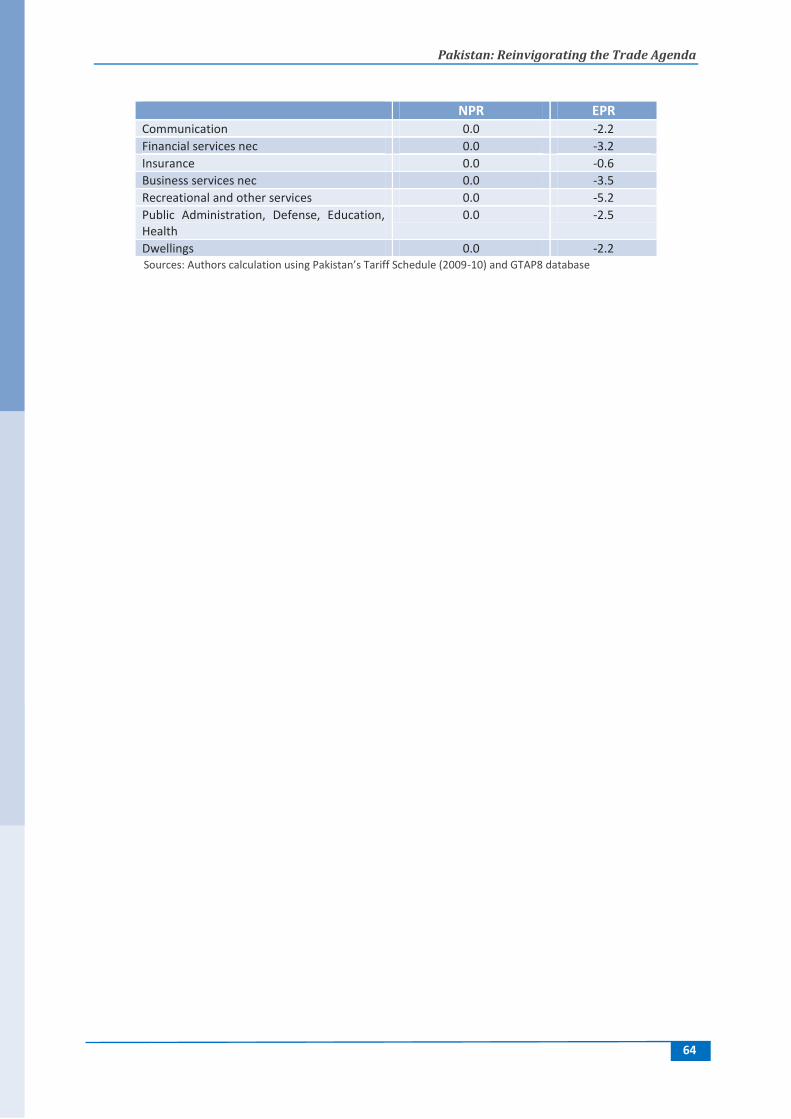
Pakistan: Reinvigorating the Trade Agenda
64
NPR EPR Communication 0.0 -2.2
Financial services nec 0.0 -3.2
Insurance 0.0 -0.6
Business services nec 0.0 -3.5
Recreational and other services 0.0 -5.2
Public Administration, Defense, Education, Health
0.0 -2.5
Dwellings 0.0 -2.2 Sources: Authors calculation using Pakistan’s Tariff Schedule (2009-10) and GTAP8 database
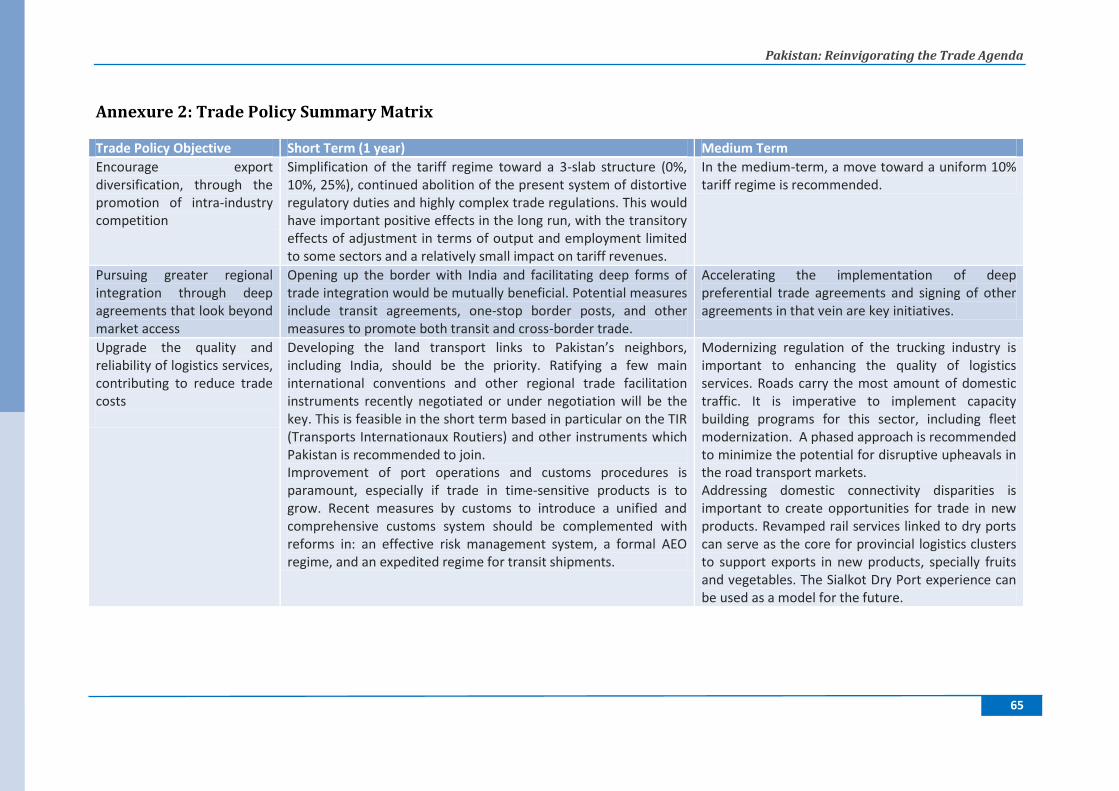
Pakistan: Reinvigorating the Trade Agenda
65
Annexure 2: Trade Policy Summary Matrix
Trade Policy Objective Short Term (1 year) Medium Term
Encourage export diversification, through the promotion of intra-industry competition
Simplification of the tariff regime toward a 3-slab structure (0%, 10%, 25%), continued abolition of the present system of distortive regulatory duties and highly complex trade regulations. This would have important positive effects in the long run, with the transitory effects of adjustment in terms of output and employment limited to some sectors and a relatively small impact on tariff revenues.
In the medium-term, a move toward a uniform 10% tariff regime is recommended.
Pursuing greater regional integration through deep agreements that look beyond market access
Opening up the border with India and facilitating deep forms of trade integration would be mutually beneficial. Potential measures include transit agreements, one-stop border posts, and other measures to promote both transit and cross-border trade.
Accelerating the implementation of deep preferential trade agreements and signing of other agreements in that vein are key initiatives.
Upgrade the quality and reliability of logistics services, contributing to reduce trade costs
Developing the land transport links to Pakistan’s neighbors, including India, should be the priority. Ratifying a few main international conventions and other regional trade facilitation instruments recently negotiated or under negotiation will be the key. This is feasible in the short term based in particular on the TIR (Transports Internationaux Routiers) and other instruments which Pakistan is recommended to join. Improvement of port operations and customs procedures is paramount, especially if trade in time-sensitive products is to grow. Recent measures by customs to introduce a unified and comprehensive customs system should be complemented with reforms in: an effective risk management system, a formal AEO regime, and an expedited regime for transit shipments.
Modernizing regulation of the trucking industry is important to enhancing the quality of logistics services. Roads carry the most amount of domestic traffic. It is imperative to implement capacity building programs for this sector, including fleet modernization. A phased approach is recommended to minimize the potential for disruptive upheavals in the road transport markets. Addressing domestic connectivity disparities is important to create opportunities for trade in new products. Revamped rail services linked to dry ports can serve as the core for provincial logistics clusters to support exports in new products, specially fruits and vegetables. The Sialkot Dry Port experience can be used as a model for the future.