Embed Size (px)
Citation preview
34078
Issues in Prices and Incomes Policy in Zambia
by
mark LeisersonDavid Lindauer
oey Astra MeesookParita Suebsaeng
The World BankFebruary 1984
Pub
lic D
iscl
osur
e A
utho
rized
Pub
lic D
iscl
osur
e A
utho
rized
Pub
lic D
iscl
osur
e A
utho
rized
Pub
lic D
iscl
osur
e A
utho
rized
Pub
lic D
iscl
osur
e A
utho
rized
Pub
lic D
iscl
osur
e A
utho
rized
Pub
lic D
iscl
osur
e A
utho
rized
Pub
lic D
iscl
osur
e A
utho
rized

Contents
Page
I. Introduction. ............................................... 1I.1 The Background of the Prices and Incomes Commission... 1I.2 Prices and Incomes Policy: Rationale and Objectives 3
II. wage Guidelines and Controls . .. .................. . 6II.1 Government Objectives and Wage Guidelines ........... 7II.2 Collective Bargaining Settlements .................. 11II.3 Government Wage Decisions .......................... 14II,4 Nonunionized Wages and Salaries ....o ................ 18
III. Price Controls: when Good Intentions Backfire .............. 22II1.1 Agricultural Producer Prices ................... ... 23II1.2 Prices of Essential Commoditiesn...*...o ts............ 25III.3 Prices of Parastatal Products ...- o ucts............... 29II1.4 New Directions ................ ....... . .......... .... 31
IV. The Role and Operational Responsibilities of the Pricesand Incomes Commission.m.m..i ..... . .... 35
V. Wage Administration and Employment Policies in the Public Sector:Suggestions for a Collaborative Work Program..............o 41
Annex I: Wage Trends After Independence.................... 48
Annex II: Data Requirements. ..... o.................. . ........ 57
Appendix ..... o. ................. 68
S 4
Issues in Prices and Incomes Policy in Zambia
I. Introduction
this paper presents some preliminary findings and views on wage and
price policy issues facing the Prices and Incomes Commission (PIC). Following
indications by the Chairman of the PIC that he would welcome assistance from
the World Bank, a mission visited Zambia in May - June 1983. 1/ This paper is
intended for circulation and discussion in the PIC, the Ministry of Finance
and others in the Zambian government to broaden the awareness of the types of
issues which will have to be dealt with by the PIC and the importance of
coordination among the various policy-making units within the government. It
is not a formal World Bank report; rather, it should be seen as an informal
paper which raises a large number of issues and opens up more areas for
investigation than the PIC is likely to be able to carry out. The intention
is to present the views of World Bank staff on the areas which should be given
priority by the PIC and to propose a work program for collaboration between
the PIC and the World Bank in one of these areas, namely public sector pay
policy.
I.1 The Background of the Prices and Incomes Commission
Following the recommendations of the TUrner report, the Prices and
Incomes Commission Act of 1981 established the Prices and Incomes Commission
-/ The mission consisted of Mark Leiserson and Oey Astra Meesook. Amemorandum (dated June 9, 1983) was given to the Chairman of the PIC at theend of the mission summarizing our initial findings.
-2-
and provided it with a very broad general mandate along with some quite
specific responsibilities and powers. Formally its principal functions are to
recommend policy actions to the government and to report on their implement-
ation. However, in the case of collectively-negotiated wages, the PIC has
been empowered by a 1983 amendment to the Industrial Relations Act to
disapprove of or amend any agreement which does not conform to the
government's wage guidelines. The ratification of collective agreements had
previously been the responsibility of the Industrial Court. A "statutory
instrument" to give the PIC similar authority over wages and salaries for
nonunionized categories of employees is expected to be issued shortly. With
these broad legal powers over wage and salary adjustments, the PIC is faced
with the task of how they are, in fact, to be exercised and administered.
The position of the PIC with regard to price regulation and control
is both more complex and less clear. Under its legislative authority the PIC
is responsible for making general recommendations on price policy; making
specific recommendations for price levels of any "controlled" good or service;
and investigating and reporting to the government on the implementation of
price control. With the general decontrol of prices in early 1983, it is not
clear precisely where or how government influence over price developments is
being exercised. The basic price control legislation has not been repealed
and the government still maintains close control over the pricing of
agricultural output and a selected number of commodities by the parastatals.
Since overall pricing policies in Zambia are undergoing fundamental reform,
the PIC will need to anticipate how its role in pricing decisions should
evolve.
-3-
1.2 Prices and Incomes Policy: Rationale and Objectives
Price and wage policies are properly viewed as integral parts of any
system of national economic management. Decisions taken with respect to
different economic sectors in the process of carrying out development policy
have implications for the levels and movements of prices and wages and, con-
versely, direct decisions concerning prices and wages will have repercussions
on the levels of production in different sectors of the economy and on the
level and pattern of consumption. The formulation of a comprehensive prices
and incomes policy necessarily implies that the interrelationships between
wages, prices and other economic variables are explicitly and simultaneously
examined within a context and forum in which the interests of different
parties can be weighed against one another, including those of unorganized
groups whose well-being may otherwise be slighted in general policy
discussion. Thus, the objectives of prices and incomes policy are those
shared with other areas of economic and social policy. They include the
achievement and maintenance of internal and external financial stability; the
fostering of economic growth and full employment; the efficient use of
natural, human and capital resources; the reduction of wage and income
inequities; and the protection and enhancement of basic living standards.
A number of special economic and institutional features provide
further rationale for a comprehensive prices and incomes policy in Zambia.
First, the country is heavily dependent on foreign trade, with a concentration
of exports in copper and other metals. This situation entails both great
potential benefits and substantial vulnerability to international economic
fluctuations. Given the recent deterioration in the external terms of trade
facing Zambia, a critical question is how government actions, market forces
-4-
and institutional arrangements determine who will absorb the resulting income
losses. Second, the Zambian domestic market is small and many industries are
characterized by monopolistic situations. The government may therefore have a
role through pricing policies to intervene in an attempt to protect consumers
from the higher prices and lower output levels monopolies tend to offer.
Third, because of the dominance of the government and parastatal sectors in
the formal sector labor market, government decisions concerning public
employment and wages have a major effect on the formal sector as a whole, as
well as on the government budget. Rather than being able to use private
sector wage levels as a yardstick, the government finds itself having a major
impact on wages and salaries throughout the formal sector whenever it takes
action concerning wages or employment of its own civil servants. This fact
needs to be taken into account by the government in the formulation of an
overall prices and incomes policy. Finally, given the size and strength of
the trade unions in Zambia, the formulation of wage and price policies may
provide the opportunity for government, management and labor to reach a
consensus on wage and price adjustments. Without some such mechanism for
reaching a consensus, the resolution of competing interests may prove to be
more difficult.
Against this background, the policy concerns which can be
considered to come under the purview of the Prices and Incomes Commission and
for which the Commission would want to take some responsibility include short-
run stabilization and inflation control; market structure issues of efficiency
and equity; the management of the public sector, that is to say employment and
wage issues in the government and parastatals; poverty alleviation and
distributive issues; and industrial relations and dispute settlement. The
-5-
Commission will of course have to define its role in terms of policy analysis
and to select which issues it needs to focus on, subject to its functions as
set out in the legislation.
In its deliberations and operations the Prices and Incomes
Commission will need to distinguish between short-run problems, which have to
be dealt with as part of the country's macro-economic management, and the
longer-term issues of structural changes. In the short-run, the PIC can be
expected to be consulted on wage and price issues which arise in connection
with, for example, exchange rate adjustments, fluctuating external terms of
trade, government expenditure management and inflation control. It is in this
context that the PIC became involved in the issuance of guidelines for, and
administration of, the 10% wage ceiling imposed in connection with the recent
standby agreement with the IMF. However, it is also crucial that the PIC give
due consideration to the question of the longer-term development of the
Zambian economy.
Among the specific policy instruments for which advice and recommen-
dations by the Prices and Incomes Commission should be most influential are
wage-price guidelines, price control levels and pricing regulations, wage con-
trols and labor market regulations, government wage levels and wage structure,
and parastatal pricing and wage decisions. In the next two sections, we
discuss a number of specific issues related to wage and price policy
formulation and implementation.
-6-
II. Wage Guidelines and Controls
Until the recent establishment of the Prices and Incomes Commission,
Zambia had no central agency which was charged with the responsibility for
formulating an overall prices and incomes policy. A number of institutions,
for example the Office of the Price Controller in the Ministry of Commerce,
were in place for regulating the levels of key prices and their rates of
increase, whereas attempts to influence the rates of increase in wages and
salaries were neither comprehensive in coverage nor systematically applied.
Nevertheless, the government has had a great deal of influence over
rates of nominal wage increases in the formal sector. First, it is respon-
sible for setting the salary scales in the civil service which alone accounts
for over one-third of total wage employment. Second, it has in the past
attempted to influence wage decisions in the parastatal sector from time to
time in individual cases. Eventually, the frustration of the competition
offered by the parastatal sector and the perceived need for the public sector
to catch up with it periodically were behind the government's decision to
forge a unified salary scale for the public and parastatal sectors in the late
1970's. Finally, the government has attempted to influence the wages of
unionized workers through the issuance of wage guidelines.
However, without clearly-defined objectives with regard to overall
wage policy and without direct means of enforcing wage guidelines, the
government has not until recently been in a position to influence the rates of
increase in the wages of unionized workers in any systematic fashion. Now
that the Prices and Incomes Commission has been given legal authority to
ratify, modify or reject collective agreements, it could become a powerful
instrument for ensuring compliance of government wage guidelines for the vast
-7-
majority of the formal sector work force. Since a 'statutory instrument' to
give the Prices and Incomes Commission similar authority over the wages and
salaries of nonunionized employees is expected to be issued shortly, the
potential degree of government control over wage decisions in the formal
sector will be quite far-reaching.
In the following sections, we shall deal separately with issues of
government objectives and wage guidelines, collective bargaining settlements,
government wage decisions, and nonunionized wages and incomes.
II.1 Government Objectives and Wage Guidelines
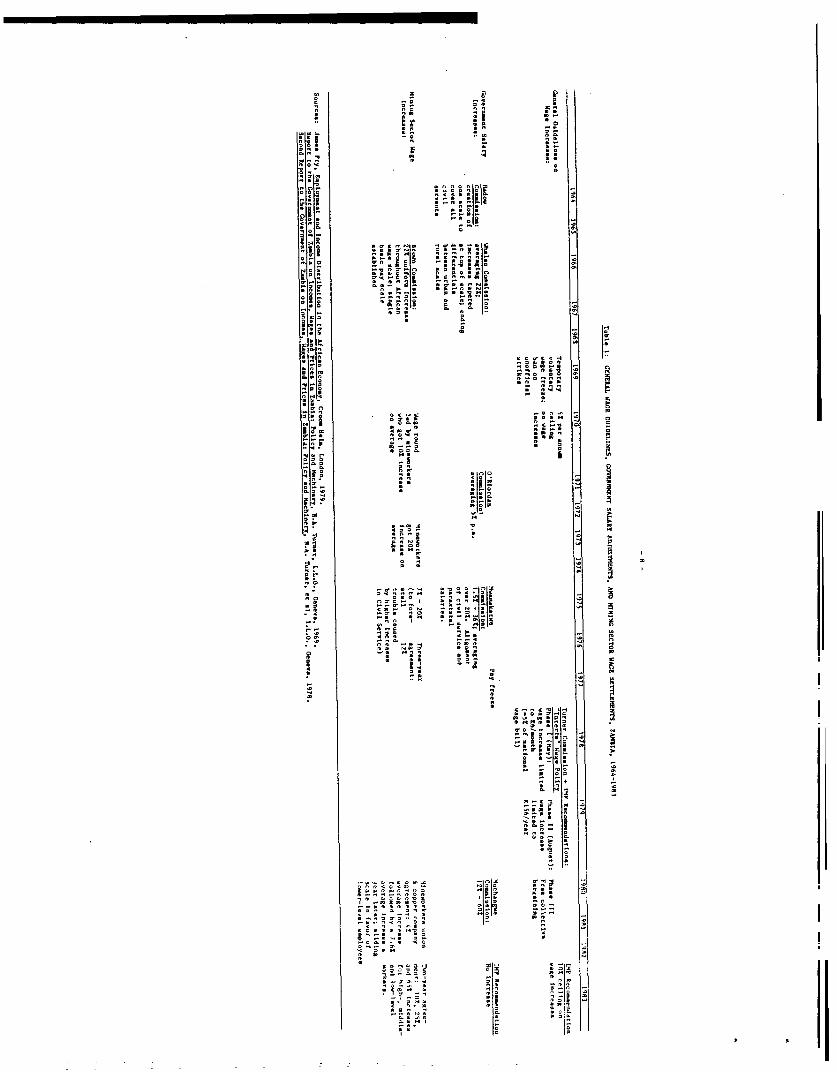
Table 1 summarizes government attempts to set general wage guide-
lines, government wage decisions regarding the civil service, and key wage
settlements in the mining sector over the past two decades or so. Although
government preoccupation in the area of wage policy has been increasingly with
wage restraint, this has not always been the case. The wage scales for Afri-
cans and non-Africans were completely distinct up to 1961, while the period
1961-1967 saw a gradual movement towards a unified nonracial pay scale which
was marked by large pay increases in all sectors, the unification taking the
form of a rise in African wages to meet those of non-Africans. The impetus to
this development came from the unification of pay scales in the mining sector
following the recommendation of the Brown Commission in 1966 to raise the
wages of Africans by 22%. Thus the objective of reducing the gap between the
levels of pay for Africans and non-Africans was achieved largely through wage
increases.
A somewhat different official wage policy started to emerge after
the first Turner report in 1969. Since then government wage policy has
. 'Ia e Oa
*l a : t * 1 --
*5 N jJ a.e
_ c O4 n al a.
C C n 4 V i = - B *
C'. a ° a S a an
a,4 *f a, -
a.,,G" -
-9-
generally been equated with wage restraint. Given the current economic
difficulties facing Zambia and the identification by many observers of high
wages as a major contributing factor to these difficulties, it seems likely
that the establishment of wage guidelines by the Prices and Incomes
Commission, primarily with the objective of restraining money wage increases,
will become an increasingly important policy instrument, at least over the
short run. Yet over the longer term, it is presumably not an objective of the
government to keep real wages low. Indeed, the most basic goal of development
policy is to raise the standard of living of the population, and this can only
be attained if real labor incomes rise over time. If for no other reason,
recognition of the longer-term objective of increasing productivity
accompanied by growing real wages suggests that wage policy needs to be
considered not as independent from, but rather as part of, national
development policy. In actual practice, the Commission needs to determine
both what the wage guideline should be in general, and also how to make it
sufficiently flexible to be workable. The determination of wage guidelines
should be governed by two of the most fundamental objectives of economic
policy: to raise the overall level of real income and to improve its
distribution among the population. It must, however, also be dictated by a
realistic assessment of the various prospects and constraints facing Zambia at
any given time. Thus the guidelines need to be considered in the context of
the government's current development strategy and will require a proper
understanding of the macro-economic interrelationships in Zambia.
A number of factors should be taken into consideration in the deter-
mination of general wage guidelines: changes in productivity and profit-
ability, trends in import and export prices ('terms of trade'), and consumer
- 10 -
price movements. An important function of the Prices and Incomes Commission
is to explain to the parties concerned why it has set the general wage
guideline at a particular level. If money wages on average are not to rise as
fast as consumer prices, what considerations have entered the Commission's
decision? If it is because the external terms of trade facing Zambia have
deteriorated, this should be made clear. The articulation of the major
reasons influencing the Commission's recommendations will go a long way to
dispel the notion that the government has not thought through the effects of
its actions on the well-being of workers.
The recommendation for the general wage guideline will be based on
macro-economic relationships, but allowances will have to be made for indus-
tries or sectors which deviate from the norm, for specific skill categories,
and for protecting the poorer groups in the population. Thus there are a
number of factors to take into account in allowing for deviations from the
general wage guideline: changes in productivity and profitability in specific
industries; relative skill shortages; and basic needs of the lowest income
groups.
In shaping its guideline recommendations, the Commission will need
to give close attention to labor demand and supply situations of particular
types of workers and in particular productive sectors. Attempts to enforce
higher wages in the face of declining labor demand or to maintain too-low wage
and salary levels in areas of critical labor shortages are bound to have
adverse effects on productivity and efficiency. Thus, the Commission will
need to be sensitive to shortages that may exist in specific skill categories,
such as doctors, engineers, architects and accountants. These will need to be
identified as part of the Commission's monitoring functions so that greater
flexibility in terms of deviations from average levels of wage increases can
be allowed for. Likewise, the Commission needs to inform itself of the
employment and unemployment situations in different areas or sectors. The
guidelines should be given in such a way as to encourage below-average wage
adjustments in those areas or sectors suffering relative declines in labor
demand and relatively higher levels of unemployment, and above-average wage
adjustments where there is rising labor demand. Such a situation is expected
when the economy diversifies away from copper towards agriculture, for
example.
Thus the Commission as part of its monitoring functions will cer-
tainly need to follow levels and trends in wages, employment and unemployment
in major sectors, as well as degrees of shortages of specific skill cate-
gories, in order to be in a position to make appropriate recommendations
concerning acceptable deviations from the government's general wage guide-
lines.
Finally, although the Commission will only have formal responsibil-
ities to set wage guidelines in the organized sector, it nevertheless must
inform itself of trends in wages and incomes in the unorganized sector in
order to be able to assess the effect of its policy recommendations on
disparities in incomes between these population groups.
II.2 Collective Bargaining Settlements
There has been a long tradition of trade unions and collective
bargaining in Zambia. The Industrial Relations Act provides for the estab-
lishment of trade unions, employers' associations, the Zambia Congress of
Trade Unions, the Zambia Federation of Enployers, works councils and joint
- 12 -
industrial councils. It makes provisions for collective bargaining at both
the establishment and industry levels, and for the Industrial Relations Court
which is independent but comes under the Ministry of Labour and Social
Services. Following the establishment of the Prices and Incomes Commission,
the Industrial Relations (Amendment) Act of 1983 transferred the authority of
examining and ratifying collective agreements from the Industrial Relations
Court to the Prices and Incomes Commission. The ratification is subject to
the Commission's being satisfied that the collective agreement is not contrary
to any written law or to the Government's declared policy on prices and
incomes, or prejudicial to public interest. The Industrial Relations Court,
however, is still charged with the settlement of industrial disputes, again
subject to the settlement not being contrary to any written law in force at
the time or to public policy in the Republic. However, since the Industrial
Relations Court itself has to abide by the guidelines issued by the Prices and
Incomes Commission and may consult with it on matters of interpretation, the
precise working relationship between them seems unclear at this point.
The existing legislation provides by far the greatest degree and
specificity of authority to the Prices and Incomes Commission to execute that
part of the government's prices and incomes policy which concerns the wages of
unionized labor. Collective agreements which do not conform to government
policy, expressed, for example, through wage guidelines, can be rejected by
the Commission. Although the Industrial Relations Court was previously
charged with the responsibility for ratifying collective agreements, it
operated without any guidelines and consequently never disapproved any
collective agreements. In contrast, the Prices and Incomes Commission is
charged with "formulating and recommending a comprehensive prices and incomes
- 13 -
policy" for the approval of the government. Thus the guidelines governing the
ratification of collective agreements are set by the Prices and Incomes
Commission itself, so that its ability to ensure compliance of its prices and
incomes policy insofar as it involves wages of unionized workers is poten-
tially very great. This gives it enormous influence over wage developments in
the formal sector as a whole; at the end of 1980 when total formal sector
employment was estimated to be around 384,000, total trade union membership
stood at over 300,000. 1/
There are 18 individual trade unions which carry out negotiations
separately. The secretariat of the Zambian Federation of Employers monitors
all agreements which are available at the Industrial Relations Court going
back as far as 1973. The small number of workers in the formal sector not
belonging to unions, mostly shopworkers and some categories of farm workers,
are covered by the Minimum Wages and Conditions of Employment Act of 1982
which sets out the minimum rates of pay and conditions of employment for any
group of workers for whom the Minister of Labour and Social Services is of the
opinion that no adequate provision already exists.
The legislation gives the entire responsibility for ratifying
collective agreements to the PIC. The Commission will therefore need to have
the capacity to analyze all collective agreements which will be coming to it
for ratification, summarize the resulting pay increases and follow the
negotiation schedules. The Commission needs to find ways to make these tasks
easier by specifying in its wage guidelines the information that should be
1/ Report on Employment and Earnings, 1980, Central Statistical Office,Lusaka, April 1983; and Annual Report of the Department of Labour for the Year1980, Ministry of Labour and Social Services, Lusaka, 1982, Table 19, p. 41.
- 14 -
submitted to it along with the collective agreement. The burden should be put
on the negotiating parties to present evidence that wage guidelines have
indeed been complied with. The PIC should require every agreement submission
to include information on the percentage increase in total pay (basic salary,
allowances and fringe benefits), so that the trend in negotiated pay increases
can be monitored on a continuous basis.
A more fundamental issue, however, is that the system of wage
guidelines should not be construed as a system of comprehensive and mandatory
wage controls. The government should not consider itself to be in the
business of wage fixing in general, although as an employer it already fixes
the wages of its own civil servants. Wage guidelines should come about
through a process of consensus involving the government and representatives of
employers and workers; this puts emphasis on negotiation and persuasion. The
guidelines should be treated as points of reference for wage settlements and,
therefore, they should leave room for negotiation in individual cases. Thus
the PIC's power of ratification of collective bargaining settlements should
not be interpreted in a rigid fashion. The important thing is that wage
guidelines can only be successful if they work and, in the context of
collective bargaining, they can only work if the parties concerned have
reached a general consensus on their broad orders of magnitude.
II.3 Government Wage Decisions
Wage settlements in the Zambian civil service have had the following
characteristics: they have taken place at infrequent intervals, usually
following recommendations of specially appointed salaries review commissions;
the commissions have generally based their recommendations on criteria
- 15 -
involving comparability in salary scales between the civil service and the
parastatal and private companies; fringe benefits and other allowances are
significant components in total pay and have become increasingly important
over time.
Given the magnitude of government employment, it seems appropriate
that the Prices and Incomes Commission should make recommendations concerning
civil service pay adjustments and, as part of its monitoring functions, keep
itself informed on matters bearing on its recommendations. Some of the issues
related to civil servants' pay which have emerged as requiring attention by
the PIC include the appropriate frequency of adjustments in civil service pay
level and structure; the factors which should be included in determining civil
service pay level and structure; the appropriate composition of the pay
package; and the relationship between civil servants' pay and the government's
wage bill and its impact on the budget.
Since Independence, salary adjustments in the civil service have
generally been based on the recommendations of salaries review commissions
appointed specially for the purpose at roughly four-year intervals. The
adjustments have involved changes in both the general level and the structure
of salaries. For the years between reviews, civil servants have generally had
to forego any adjustments in their pay, even when the government's general
wage guidelines have allowed increases. T¶his means that when adjustments are
finally made, they tend to be large and consequently have a disruptive effect
on the formal sector as a whole by setting off a series of pay adjustments in
the parastatal and private sectors in response to the government action. In
addition, a hardship is imposed on civil servants, especially the lowest-paid,
when salaries lag behind the cost of living in the years between adjustments.
- 16 -
Now that the Prices and Incomes Commission is charged with setting
general guidelines on wage increases, it would be appropriate for it to
consider, for example, whether to recommend general adjustments in government
and parastatal salary scales on an annual basis, while reserving less frequent
reviews by special commissions to recommend more extensive revisions in the
structure of civil service grades and salary scales. The factors which should
enter in the determination of pay increases in the civil service are the same
as those for the general wage guideline but should, in addition, include the
budgetary position of the government.
the approach of the salaries review commissions in the past has been
to compare the salary scales in the civil service with those for the para-
statal companies, especially for the more senior levels. Recommendations for
salary increases were intended to close the gap between the civil service and
the parastatal sector on the grounds that the government needed to be able to
attract qualified people and if it could not compete with public enterprise
salaries, government officials would resign and join the parastatals.
An issue facing the Prices and Incomes Commission is whether parity
with the parastatals is still the appropriate criterion for wage determination
in the public sector. Now that following the Mwanakatwe report a unified
salary scale exists for both the public and parastatal sectors, the question
becomes how to administer and adjust this unified scale. The PIC will also
need to be aware of how its actions concerning the public and parastatal
sectors affect the formal sector labor market as a whole, given that together
these sectors account for three-quarters of total formal sector employment.
In comparing the levels of pay in the government, parastatal and
private sectors, it is essential not to overlook fringe benefits and
allowances. The relationship between total pay packages could be very dif-
ferent from that between basic salaries. Comparisons of trends in total pay
over time can also be affected since there has recently been a tendency for
pay increases in the parastatal and private sectors to be in the form of
nonsalary benefits, such as housing and transportation allowances. For the
government itself, it needs to consider what the appropriate composition of
pay for its civil servants is and to have a clearer idea of the link between
the level and composition of pay and job performance.
Turning to the budgetary issue concerning government employment, two
problems make it difficult for the government to have an accurate picture of
what its total wage bill is. The valuation of all fringe benefits is one of
them. At present under the heading 'Personal Emoluments' in the government's
estimates of expenditures are listed various allowances such as housing,
sitting, outfit and uniform, and other allowances. However, what are left out
altogether are the fringe benefits which are given in kind and do not involve
cash payments, such as the provision of actual housing, cars or servants. It
has been estimated that the subsidy in the provision of high-cost housing at
low rents to civil servants and parastatal employees amounts to about K95
million annually. 1/ The second problem concerns classified daily employees
who can be hired at the discretion of the individual departments and whose
wage payments appear under the heading 'Recurrent Departmental Charges' and
not 'Personal Enoluments.' No central record is kept of the numbers employed
as classified daily employees; they are considered to be temporary workers
1/ ILO/JASPA, Zambia: Basic Needs in an Economy Under Pressure, I.L.O., AddisAbaba, 1981, Table 1.2, p. 10.
- 18 -
even though many of them have been at their jobs for years and the departments
feel an obligation to keep on hiring them. In 1980, the wage payments to
classified daily employees amounted to K34 million, or 13% of the government's
total wage bill excluding fringe benefits. 1/ In order to estimate accurately
the size of its total wage bill and how sensitive this might be to changes in
the level and structure of wages and salaries, the government will need to get
an accurate estimate of the value and distribution of all the fringe benefits
to its civil servants and the total employment of, and wage payments to,
classified daily employees.
II.4 Nonunionized Wages and Salaries
A number of issues have arisen with respect to the wages and
salaries of nonunionized workers: the problems related to the unification of
the salary scales in the civil service and the ZIMCO companies; the problems
of the relationships between the wages of unionized and nonunionized workers;
and the increasing tendency for pay to be given in the form of fringe
benefits.
The Mwanakatwe Commission in 1975 made recommendations which led to
a unified salary scale for the nonunionized workers in the civil service and
the parastatal companies of the Zambia Industrial and Mining Corporation
(ZIMCO), thereby forcing the desired comparability between their salaries.
ZIMCO has found this arrangement to be unsatisfactory for a number of
reasons. First, it feels that the unification has hurt its subsidiaries which
World Bank, Planning and Budgeting in Zambia, Volume II - TechnicalAnnexes, February 1983.
- 19 -
have to compete with the private sector, rather than the government, for their
workers. Private companies are at an advantage in having the freedom to fix
and adjust their salary scales whenever necessary. Another problem with the
unification concerns the wage relationship between the unionized and
nonunionized workers. The wage scale and fringe benefits for unionized
workers are obtained through collective bargaining. ihe nonunionized workers
can be expected to make similar demands in order to retain the existing pay
differentials. In fact, it would be in their own self-interest to acquiesce
to union demands in order to be in a position to justify similar increases for
themselves subsequently. In the private sector there is no restraint on this
catching up, but in the parastatals where there is pressure to keep the
salaries of nonunionized workers in line with the government scale which is
adjusted only periodically, the level of pay of unionized workers has been
catching up with that of the nonunionized workers and, not surprisingly,
creating dissatisfaction within the latter group.
While the pay differentials between the public, parastatal and
private companies cannot be ascertained without a detailed study, it is clear
that ZIMCO already has a great deal more flexibility than the government
through its extended scale for professional and technical workers which allows
it to increase their salaries by up to 40% of their basic levels. Moreover,
there is further flexibility in terms of which of four possible grades the
chief executive of a ZIMCO subsidiary is slotted in, since this determines the
effective salary scale for all the workers in the company. It is also
generally believed that the parastatals offer superior fringe benefits
compared with the government. Thus the parastatals are not as constrained as
- 20 -
the government in terms of their ability to compete with the private sector
for workers.
There has recently been a tendency for pay increases in the non-
government sectors to be in the form of nonsalary benefits, such as housing
and transportation allowances, in part as a result of high marginal tax rates
on wage income and because of recent wage ceilings imposed by the govern-
ment. In the parastatals, additional fringe benefits have been granted to
nonunionized workers in an effort to make up for the erosion in their basic
salaries vis-a-vis the unionized workers. The fact that there are many ways
of increasing workers' earnings without increasing basic salaries or wages
means that control over fringe benefits will present the government with
difficult problems of interpretation and administration. But since the real
objective of government wage guidelines is to influence total labor costs, it
is clear that the guidelines should be applied to total pay, not just wages
and salaries.
The government is apparently planning to give the Prices and Incomes
Commission authority over the wages and salaries of nonunionized employees
similar to what it already has over the wages of unionized workers. It is not
known at this stage what form this authority will take, but there will be even
greater need for the government to formulate clear and consistent policies to
guide the development of wage levels for the unionized and nonunionized
workers in the public, parastatal and private sectors. The PIC will need to
understand both the structure and composition of pay packages in these
different sectors and to be able to set some clear principles concerning wage
determination and adjustments in order to make recommendations concerning wage
guidelines for these sectors.
- 21 -
In considering the wage and salary relationships between government,
parastatal and private organizations, the Commission and the government will
have to face the basic policy choices regarding the degree of autonomy of the
various types of employers in settling on wages and working conditions. Since
some of the basic facts about the size and trends in differentials between
total remuneration or wage packages are unknown, the whole area warrants
considerable further study.
- 22 -
III. Price Controls: When Good Intentions Backfire
The desire of the Zambian government to protect consumers from
exploitation by producers and distributors and to ensure the same advantage
for the rural population as for the urban population has led over the years to
a very great degree of involvement by the government in a complex system of
price controls, with economic consequences far beyond what had originally been
foreseen or intended by the policy makers.
Three major categories of prices come under some form of price
control: agricultural producer prices, prices of 'essential commodities', and
prices of the products of parastatal companies. Since December 1982, with the
announcement of the general decontrol of wholesale and retail prices, only
three commodities (maize meal, wheat flour/bread and candles) have continued
to be classified as 'essential'; price increases for them must still be
approved by the government. The prices of all other commodities can be set by
the enterprises themselves, subject to the ex post review by the Prices and
Incomes Commission. In practice, the prices of the products of parastatal
companies will be subject to the approval of the Board of Directors of INDECO
and, for eight commodity groups, by ZIMCO. Agricultural producer prices and
input prices are still subject to price regulation.
At this juncture, Zambia is in the process of undergoing fundamental
reforms in the area of pricing policy. Thus, our discussion below of the
system of price controls as it was before. December 1982 is with a view of
learning how pricing policies in the future can better serve the stated policy
objectives which had provided the rationale for instituting the system of
price controls in Zambia in the first place.

- 23 -
III.1 Agricultural Producer Prices
The government sets prices for a number of key crops and livestock. 1/
The regulation fixes the prices paid to producers on delivery of the product
to NAMBoard and Provincial Cooperative Unions or specified depots; in
practice, they are the maximum prices received by farmers. The producer
prices are reviewed and announced annually; they are based on the average
costs of production for the different crops on commercial farms estimated from
surveys, with an allowance for a pre-tax rate of return on capital of around
10%. 2/ Actual costs of production may of course differ from the average
because of differences in the method of production, type and location of the
farm, weather conditions and so on. A uniform price is set for each crop
throughout the country.
A number of observations can be made about the regulation of agri-
cultural producer prices concerning their general level, variations across
different locations, trends over time, and levels and trends for different
crops.
Agricultural producer prices are generally set at levels which are
different from their border prices or, more accurately, the import/export
1/ The main exceptions are pork, poultry, vegetables and a number of cropswith a limited demand such as chilis.
2/ H. A. Turner et. al., Second Report to the Government of Zambia onIncomes, Wages and Prices in Zambia: Policy and Machinery, Part II: SpecialStudies and Reference Documents, p. I/4, ILO, Geneva 1978.
- 24 -
parity prices. 1/ It has been estimated that, for the period 1965/66-1974/75,
producer prices were on average 75% of the import/export parity prices, while
for the period 1975/76-1978/79 they were 84%. 2/ The producer price for
maize, the basic staple, was 74% of the import parity price between 1965/66-
1974/75; when the fertilizer subsidy was included, it was still only 79%. The
production of maize at this price was insufficient to meet the domestic
demand, thus making it necessary to import to make up the deficit. And since
the consumer prices of agricultural products are in turn based on the producer
prices, government subsidies have been involved when the necessity for imports
arises. Likewise, the producer prices for a number of export crops have been
below the export parity prices. Thus the low levels of agricultural producer
prices have had adverse effects on the economy in terms of smaller agricul-
tural output, lower rural incomes, erosion of scarce foreign exchange through
imports, and a drain on the government budget. The immediate beneficiaries
are the urban consumers who pay lower prices for their food and probably
consume more than they would at higher prices.
Although most of agricultural output is sold to the official mar-
keting boards at the official prices, a certain amount of output escapes the
system. Some is sold in a different region of the country; some is smuggled
across the borders into neighboring countries, for example from Luapula
province into neighboring Zaire which provides a market at higher prices and
1/ Import parity prices include the transportation cost to primarydistribution centers in Zambia, while export parity prices include thetransportation cost to the border.
2/ The World Bank, Zambia Country conomic Memorandum, Report No. 3007-ZA,February 27, 1981, Table 18, p. 23.
- 25 -
relatively low transport costs.- / Some higher-grade produce is sold byfarmers directly to hotels, supermarkets and traders at prices above thegovernment prices. 2/
The government has a policy of setting a uniform level of agricul-tural producer prices all over Zambia. This is defended on equity grounds asa subsidy to the more remote areas. Efficiency considerations make thispolicy questionable since the marketing boards have to operate uneconomicalservices and the incentive to grow crops in unsuitable areas is not dampened.
A comparison of the development over time of agricultural producerprices and the prices of urban-produced goods shows that the latter have risenfaster than the former so that the terms of trade have moved against ruralproducers who must pay more in agricultural output for commodities they pur-chase from urban areas. The overall effect of price control has beenincreasingly to the disadvantage of rural producers.
Moreover, for crops produced by the poorer farmers, such as cassava,sorghum and millet, there has been little attention given by the government totheir marketing and the increases in prices for these crops over time have notbeen so fast as that for maize which is apparently grown by farmers who arebetter off.
III.2 Prices of Essential Commodities
The government applies direct control over prices through theControl of Goods Act. Until December 1982 a large number of commodities
I/ ILO/JASPA, Op. Cit., Technical Paper No. 9, p. 127.
2/ ILO/JASPA, Ibid., p. 94.
- 26 -
deemed to be 'essential' came under price control, both at the wholesale and
retail levels, and whether they were produced by parastatal or private
companies. The Office of the Price Controller in the Ministry of Commerce was
responsible for determining the appropriate levels of prices and for enforcing
price controls, although the final approval for the prices of nine commodities
(salt, sugar, mealie meal, flour/bread, beer, stockfeed, cooking oil, medi-
cines and petroleum) rested with the Cabinet. The commodities covered were
those which were seen to be controllable as well as essential. Services, for
example, did not come under price control. There were, however, a number of
items which might be considered essential but were not covered, for example
shoes.
The price of a controlled good is determined through a cost-
accounting approach, that is, a pre-determined mark-up is allowed over the
actual cost of production. The price of an imported good is based on the
landed cost with a 10% mark-up for the wholesaler and a 15% mark-up for the
retailer. Ihe retail price of an agricultural commodity is based on the
producer price. As a rule, a uniform price is set throughout the country.
Maize meal and bread are exceptions; for them variations in prices are allowed
in different parts of the country to reflect the costs of transportation and
distribution.1/ The enforcement of price controls is carried out through
inspection and prosecution of violators.
The stated purpose of price control is to protect the consumers from
being exploited by monopoly producers and distributors, but the actual outcome
has worked against the government's original intention. Although compliance
H. A. Turner et. al., Op. Cit., p. I/26.
- 27 -
with price control has probably been reasonably good in large urban retail
stores, economic forces tend to push the market prices above the controlled
prices where price supervision is less thorough. The attempt to hold down
prices has reduced the incentives to supply while stimulating consumer
demand. Smuggling and blackmarket operations have been observed for con-
trolled goods at various times. Shortages, or even absence of goods in some
cases, have been observed, as well as a reduction in the number of retail
stores. 1/ The consumer does not benefit from price control when he is faced
with a shortage and has to incur costs in terms of search time or higher
prices in the black market. There is evidence that the market prices of some
essential commodities can be much higher than the controlled prices,
especially when they are sold in smaller units.
For some time the government introduced legislation to bar sale in
the market of 'essential' commodities on the grounds that marketeers charged
excessive prices, especially when the product is repackaged. Although the
legislation has since been repealed, repackaging is still said to be illegal
and the practice is condemned by Party leaders. 2/ Such an attitude has only
served to encourage traders to withdraw their goods from the market and to
sell them from houses where they can increase the mark-up on small units of
commodities further, to the hardship of poor people who cannot afford to buy
large quantities at a time.
The government also has a policy of setting the same price for a
commodity throughout Zambia. The transport and distribution costs are
1/ ILO/JASPA, Op. Cit., pp. 22 and 35.
2/ ILO/JASPA, Ibid., pp. 94 and 99.
- 28 -
averaged in the cost calculation for a commodity and this is used in setting
the price. The objective of this policy is to protect consumers in rural
areas from having to pay higher prices than their urban counterparts. In
practice this policy makes it less attractive for distributors to supply to
rural areas when compared to urban areas, and makes it altogether uneconomical
to transport and distribute merchandise to some distant rural areas. 1/ The
problem of uniform pricing further aggravates the basic problem of low
controlled prices to make the supply of basic commodities even more erratic
and unreliable in rural areas. Whenever there are shortages in urban areas,
the situation is worse in rural areas and the difference between the official
and actual prices is also greater in rural locations when the commodities can
be found there at all. 2/ The difference in price between a district
subcenter or village and a district center can be very great.
Not only have prices tended to be set too low, as manifested in
shortages and market prices above the controlled prices, in a number of
instances the problem has been further aggravated over time as prices have
been allowed to increase too slowly. The goods which have been most affected
in this way are processed food items for which a large proportion of raw
materials and other inputs are imported. The regulated consumer prices have
not increased as fast as the prices of imports so that the processing industry
has been operating at an increasing loss. The larger parastatal processing
companies, such as the grain and vegetable oil mills, have carried losses and
later been compensated by subsidies from the government budget, while the
1/ ILO/JASPA, Op. Cit., pp. 73 and 126.
ILO/JASPA, Ibid., p. 34.
- 29 -
smaller mills have gone out of business and the supply situation has been
further aggravated. 1/
In general, the controlled prices for rural products have risen more
slowly than those for urban-produced goods. Moreover, official prices have
been kept especially low for the produce of the poor, for example fish and
charcoal. 2/ It has been observed that, where a parastatal or government
department purchases the produce of poor rural people, the producer prices can
be very low while the trading margins very high, as in the cases of cassava
chunks and honey.
III.3 Prices of Parastatal Products
Similar procedures are used for setting parastatal manufacturing and
public utility prices. The INDBCO group of parastatal companies produces
roughly half of total manufacturing output. These companies are mostly mono-
polies and their product range covers a large number of basic consumer items
and industrial products. Before the decontrol of prices, the INDECO companies
submitted the recommended prices of their products to the Ministry of Industry
for approval. If the commodity was one which was controlled, the proposed
price was sent via the Ministry of Industry to the Office of the Price
Controller. In the case of important commodities, such as cement and ferti-
lizer, the prices were sent to the Cabinet for final approval. The private
1/ ILO/JASPA, 2p. Cit., p. 126.
3/ ILO/JASPA, Ibid, pp. 23-24.
- 30 -
sector was not subject to price control except where essential commodities
were concerned.
The Ministry of Industry has in the past generally followed a cost-
plus approach in the regulation of parastatal prices, although there has been
a number of parastatals which have operated at a loss at various times, as a
result of government policy to hold down the consumer prices of 'essential'
commodities. The government has now endorsed the idea of 'economic pricing',
meaning setting prices which cover costs with a reasonable rate of return on
investment, for all its parastatals. However, the dominant position of
parastatals in Zambia is bound to raise problems of coordination between
parastatal pricing and overall prices and incomes policies. One set of
difficult issues concerning parastatal pricing policy which may require
external surveillance has to do with whether the cost of production of a
parastatal commodity is unnecessarily high because of internal inefficiencies,
excessive profits or excessive remuneration of employees, given the monopoly
position of many parastatal companies. The parastatals have been able to
obtain finance from the government when they have run at a loss or lacked
additional finance for investment and this has certainly reduced management
incentives to operate efficiently or to hold down the wage bill. In addition,
the appropriateness of cost-plus pricing can be questioned in the case of an
acute shortage of imported commodities where the result may be that the
benefit of the scarcity rent resulting from easier access to the foreign
exchange required is simply passed on to the individual customers rather than
accruing to the government. Most of the parastatal pricing issues are
inextricably connected with questions of the role, management and efficiency
- 31 -
of public enterprises in Zambia and these will require careful study and
consideration.
With the exception of the three commodities which remain classified
as essential, prices of parastatal products can now be set by the enterprises
themselves, subject to the approval of ZIMCO and the ex post review by the
Prices and Incomes Commission. Since the announcement of price decontrol, the
prices of a wide range of commodities, including politically-sensitive pro-
ducts like rice, sugar, cooking oil, beer, soap and washing powders, have been
raised by up to 28%, as well as the prices of various petroleum products which
were raised at the same time as increases in excise duties were announced in
the budget. The prices of maize-meal products and fertilizer were also raised
in May 1983 by an average of 32% and 62% respectively.
III4 New Directions
The system of price controls in Zambia has been based on the desire
on the part of the government to protect the consumer from high price levels
and rapid price increases in general, and exploitation by monopoly producers
and distributors, the 'price sharks', in particular. Although the system
consists of a complex set of price settings and controls, some common elements
run through it: the appropriate price of a commodity is seen to be the cost of
production with a reasonable mark-up; attempts are made to keep prices low and
to limit price increases over time; and in general a uniform price applies
throughout Zambia.
The generally low prices have discouraged production and encouraged
consumption, resulting in inadequate supplies in relation to demand. These
have led to smuggling and shortages, as well as infringements of the price
- 32 -
controls. Where goods have had to be imported to make up the difference, they
have required subsidies to fill the gap between the domestic and import
prices, so that the balance-of-payments and budgetary problems facing the
government have been aggravated. The uniform price set for the whole country
has made the supply problem more severe in rural areas, and in particular the
more remote areas. The government's strategy of protecting the consumer has
in fact backfired so that the consumer ends up facing shortages or having to
pay higher-than-controlled prices.
The chief lesson to be learned from the experience of two decades of
government control over wholesale and retail prices of essential commodities
and parastatal products is surely that 'price sharks' represent a symptom,
rather than the cause, of the problems related to pricing in Zambia. Price
sharks take advantage of shortage situations; they do not create them. This
suggests that a system of price controls does not constitute an adequate
pricing policy.
As already pointed out, Zambia has some special economic and
institutional features which make it desirable for the government to have some
role in the area of pricing. However, this role should be predicated on a
clear overall pricing policy based on the use of border prices and a realistic
exchange rate. A country like Zambia, with a small domestic market, faces the
problem of there being too few producers, leading to monopolistic situ-
ations. Thus efficiency cannot be generated internally through market forces
and it becomes necessary to pay attention to border prices which provide the
only competitive references for the Zambian economy. Border prices provide a
signal of whether domestic producers, including import-substituting
industries, are efficient compared with foreign producers. In addition to the
- 33 -
use of border prices as references for domestic prices, a pricing policy
should be based on a realistic exchange rate which implies a reasonable
relationship between the prices of tradeable and nontradeable commodities.
Pricing policy, on the other hand, should not be confused with price
control. In fact, it would be desirable for Zambia to place greater reliance
on macroeconomic policies to achieve the appropriate general level of prices
through the exchange rate, monetary and fiscal policies, as well as policies
regarding the parastatals. There may be reasons for direct controls but these
should be for specific cases with good justification, such as for agricultural
commodities if the government deems it desirable to stabilize farmers'
incomes, or for some essential commodities to protect the poorer groups of the
population. In these instances, the PIC will still need to appreciate the
connection between prices and quantities, and hence the effect of price
controls on the quantities in demand and supply.
In terms of the role of the PIC in the area of pricing, this would
mean that the PIC should be generally supportive of the general thrust of
macro-economic policy through its pricing and wage policies, while confining
its attention on individual commodities to those cases that require special
attention.
One situation in which the government ought to be concerned about
exploitation of consumers involves monopoly producers and distributors; a
great many parastatal companies fall into this category. The reliance on
cost-plus pricing by itself is not an adequate solution since it provides no
incentives to keep down costs in the case of government-supported parastatals,
and where the good intentions of the government in holding down prices in
situations involving shortages cannot overcome the basic problem of shortages
- 34 -
in which someone else will secure the scarcity rent if the parastatal company
itself does not. The World Bank is doing work with ZIMCO to assess the
efficiency of parastatals which should help to ensure that the prices of their
products are "economic".
The Price Control Department of the Ministry of Commerce is still in
existence although its functions have been essentially eliminated by the
decision to decontrol prices. There has been some discussion of transferring
the department to the PIC so that it would have the capability to "monitor
prices". The precise purposes of this price monitoring are not at all clear
and it would be better for the PIC not to take over the Price Control
Department in order to stay away from the responsibility for controlling
prices.
- 35 -
IV. The Role and Operational Responsibilities of the Prices and IncomesCommission
The passage of legislation now in force has provided the Prices and
Incomes Commission and the government with ample statutory authority to inter-
vene in virtually any aspect of wage and price setting mechanisms. In fact
the legal powers that have been provided probably exceed the administrative
capacity likely to be available now or in the foreseeable future for effective
execution and implementation. Under these circumstances, the Commission will
have to use considerable restraint in recommending or exercising direct
governmental authority and to concentrate on those strategic elements of wage
and price determination through which it can expect to have some influence on
general wage and price developments. Decisions on policy actions will require
careful analytic and empirical work to provide guidance as to the form,
character and points of intervention. Otherwise there is a danger that the
resources of the Commission might be dispersed over too wide a range of
activities and, in attempting to do too much, jeopardize its effectiveness in
dealing with the central issues.
The various functions of the PIC can be classified into three cate-
gories: advisory, operational and monitoring. Most of the functions of the
Commission as delineated in the legislation are either advisory or moni-
toring. The advisory functions include formulating and recommending for the
approval of the government a comprehensive prices and incomes policy; and
recommending for the approval of the government a) minimum wage levels and
minimum conditions of service, and b) price levels for any controlled goods,
services, products or commodities, including price levels of agricultural
produce and livestock. The monitoring functions include evaluating and
reporting to the government on the implementation of the prices and incomes
- 36 -
policy as approved by the government, the Commission's recommendations
relating to minimum wage levels and minimum conditions of service, and the
price control. In addition, the Commission is charged with investigating and
reporting to the government "such particular cases or general issues as are
likely to affect any current or future prices and incomes policy." The only
specific operational function of the Commission involves examining and rati-
fying collective agreements. In addition, the Commission is charged with
doing "all such things as the Minister may direct in writing in order to give
effect to the execution and implementation of Government approved prices and
incomes policy."
Given the different degrees of specificity in the functions of the
Commission in the legislation, there may be a danger of the Commission's con-
centrating its efforts and resources on the more clearly defined functions of
examining and ratifying collective agreements and making recommendations on
the minimum wage and price levels. mhe case can be made, however, that the
advisory and monitoring functions of the Commission should be given at least
as much emphasis as the operational functions. Indeed, these different func-
tions should serve and enhance one another. The Commission will need to have
the capacity to monitor the implementation of price and wage policy and
general economic issues in order to be in a position to make recommendations
to the Government concerning wages and prices. Moreover, its operational
duties should serve the policies embodied in the Commission's recommendations
to the government. As already pointed out, the formulation of a comprehensive
prices and incomes policy will involve the consideration of the interrelation-
ships between wages and prices and other economic variables, including trade-
offs between the income levels, and hence standards of living, of different
- 37 -
population groups. The Commission and its Consultative Council 1/ are in a
position to carry out this task and should consider it part of its responsi-
bility to forge a consensus among the different parties on what an overall
prices and incomes policy should be, given the government's strategy for
economic development and the economic circumstances currently facing Zambia,
in order that its recommendations will not run into obstacles at the
implementation stage.
Such an interpretation of the functions of the Commission will have
implications for the types of information and data it requires, the sorts of
analyses it must be able to carry out and, consequently, on the way the
Commission itself is staffed. Moreover, the Commission will want to be
concerned with being included in relevant policy discussions and establishing
channels of communications with other parts of the government so that its
findings from its monitoring functions are taken into account in these
discussions and, on the other side, its policy recommendations in the area of
prices and wages are consistent with overall economic policy.
In setting up its operations, it may be helpful to distinguish
between the different types of responsibilities assigned to it. The advisory
and monitoring functions require it to follow various economic trends, analyze
relationships between the economic variables, anticipate both short-term and
long-term problems, and make appropriate recommendations. The operational
.1/ The Consultative Council was established by the Prices and IncomesCommission Act and consists of representatives from the government, members ofthe general public, ZIMCO, the Zambia Congress of Trade Unions, the ZambiaFederation of Employers, the Zambia Industrial and Commercial Association, theZambia Commercial Farmers' Bureau and the Zambia Consumers' ProtectiveFederation.
- 38 -
functions require it to have the capacity to execute well-defined and more
mechanical tasks, such as examining collective agreements to ensure that they
comply with the government's wage guidelines. Thus the PIC staff have three
major functions which can be classified as analytical, informational and
operational.
the analytical functions of the PIC require it to carry out economic
analysis, both on a routine basis and when special issues require attention.
It will be useful for the PIC to have the capacity for macro-economic analysis
to use in its recommendations to the government on general wage guidelines and
to help it follow trends in wages and prices in different parts of the
economy. Such a capacity is helpful, for instance, for appreciating the
relationship between the external terms of trade and the general levels of
wages and prices. In an economy like Zambia which is highly vulnerable to
external conditions, it is necessary for the formulation of a sensible wages
and price policy to have the capability to work through the effects of changes
in the prices of exports or imports, or the exchange rate, on key economic
variables.
The types of analytic work that the Commission may want to carry out
should help it to appreciate some of the following relationships: (a) the
effects on employment and unemployment of changes in wage rates in different
sectors, including increases in the minimum wage; (b) the effect on the
availability of categories of labor in short supply of changes in the wage
structure; (c) the impact on the government budget of changes in the civil
service pay scale, pay structure or pay package; (d) the effect of changes in
agricultural producer prices on rural incomes, urban-rural income
differentials, and the consumer price indices in urban and rural areas; and
- 39 -
(e) the impact of changes in import and export prices on employment, wages and
prices. The Commission will also want to be able to distinguish among
underlying causes of price increases and profit levels, in order to be in a
position to concentrate its attention on those situations where there is clear
abuse or exploitation of monopoly or excessive economic power.
It follows that priority should perhaps be given to the task of
building up the Commission's capability to carry out the economic analysis and
empirical investigations necessary to inform and support its policy
recommendations and operational decisions. These functions are not yet
adequately reflected in the staffing of the Commission. In particular, there
is a great need for general economists and statisticians to carry out the
types of analyses envisaged, as well as a capacity for the design-and
execution of quick, small-scale surveys at short notice.
In terms of informational requirements, the Commission needs to have
the capability to monitor levels and trends in employment and unemployment,
and key wages and prices, On the side of employment and wages this would
include employment and wages in key economic sectors, in the government,
parastatal and private organizations, for unionized and nonunionized workers,
by skill level, and in the organized and unorganized sectors. Price infor-
mation needed includes consumer prices in both urban and rural areas, whole-
sale prices, import and export prices, and urban-rural terms of trade. Given
the heavy burden of work which is bound to fall on the Commission, existing
sources of statistics, notably those collected by the Central Statistical
Office (CSO), will have to be used wherever possible; major data collection
and processing exercises should not be undertaken unless absolutely necessary
to obtain vital information not otherwise available. Some of the more impor-
- 40 -
tant information required is discussed in Annex II, along with existing data
sources.
The operational staff of the PIC will be responsible for a number of
areas: issuing wage guidelines; enforcing wage guidelines through its
responsibility for examining and ratifying collective agreements; giving
advice on civil service pay adjustments; and giving advice on price controls
and price levels. These tasks will require close cooperation from the
analytical staff of the PIC.
It is our opinion that on the prices side, the PIC should as a rule
avoid getting drawn in to set and control prices of individual commodities.
Rather, the Commission should be instrumental in helping to ensure an
appropriate general level of prices through its deliberations with other parts
of the government which are responsible for fiscal and monetary policies and
liberalization of the trade regime. As pointed out earlier, pricing policy
has a direct effect on the distribution of income between different groups of
the population and this will provide a guide to the PIC's concerns and its
operational work in the area of pricing. The clearest operational responsi-
bilities of the PIC are with regard to wages, through the issuance and
enforcement of wage guidelines, as well as its advice concerning public sector
pay adjustments.
Thus, taken as a whole, there are a number of areas which could be
given priority by the PIC, including macroeconomic analysis, pricing policies
and the concern for the urban informal and rural sectors, wage guidelines in
the formal sector, and public sector pay policies. we would like to offer
some assistance to the PIC in the last of these areas.
- 41 -
V. Wage Administration and Employment Policies in the Public Sector:Suggestions for a Collaborative Work Program
Although we would be interested in discussing with the PIC any of
the issues raised in this report, in this section we would like to propose a
collaborative work program between the PIC and the World Bank which focuses on
issues arising in the management of wages and employment in the public and
parastatal sectors. Given Zambian circumstances, this focus is not a
particularly narrow one. Government and parastatal employment is estimated to
account for three-quarters of total wage employment. Given the size of the
public sector, decisions affecting both compensation and employment levels in
the government and parastatals are likely to influence indirectly the private
sectors of the urban economy as well.
Government wage and employment policies may be used to pursue the
following economic objectives: increasing public resources by restraining the
growth in expenditures on public employees; encouraging improved job
performance of public sector workers; improving national distributional goals
through the use of wage equity policies; and promoting the efficient
allocation of labor resources through various adjustments in the inter-
sectoral wage structure.
In order to achieve these objectives the government can employ a
number of policy instruments. Most obvious are annual (or less frequent)
public service pay adjustments which can either increase or decrease the level
of real compensation. Such adjustments can be implemented across-the-board or
according to salary grade. As already noted, varying degrees of control on
parastatal compensation levels can be exercised through the use of unified
salary scales and the ratification of collective agreements. Government
employment policy, including promotion and termination protocols and decisions
- 42 -
either to expand or to freeze public hirings, are additional instruments which
should be noted. Finally, decisions concerning the actual structure of com-
pensation, that is, the mix of wage and nonwage benefits (housing, transport,
education allowances, etc.) are additional measures available for affecting
the budgetary, efficiency and equity outcomes of public employment.
One of the tasks confronting the PIC is to develop procedures for
evaluating how these policy interventions affect the economic objectives noted
above. In order-to achieve this understanding, a clearer picture of existing
public sector employment and compensation must be developed. With the consent
of the PIC, we would propose to carry out a study which deals with the fol-
lowing related issues, namely wage administration within the public sector and
forms of compensation. We elaborate on each of these below.
(i) Wage Administration Within the Public Sector
In order to investigate the effects of government pay policy initia-
tives, it will be useful to understand the system of wage administration
within the public sector. In this context the public sector includes all
levels of government and the parastatals. The system of wage administration
refers in part to the structure of wage payments within the public sector.
These payments are related to a number of factors including worker skill
levels, occupational categories and organizational affiliations (central civil
service, police service, ZIMCO affiliates, etc.)
Since all employees do not receive the same level of compensation, a
task of wage administration is to adjust pay differentials across classes of
workers. If inappropriate differentials prevail, the system can be expected
to show signs of stress as workers respond to existing incentives. officials
- 43 -
involved in implementing pay policy must therefore be alert to signals that
the public sector's wage structure is not producing desired results.
In recent years the Zambian government has taken steps to coordinate
the process of wage administration throughout the formal economy. One of
these steps, for example, was to establish a unified salary scale covering
both government and nonunionized parastatal employees. Even though a unified
wage scale now exists, differentials embodied in that scale, as well as
varying degrees of compliance, will determine pay differences between
government and public enterprise employees. The impact of such differentials
is something which needs to be more fully considered.
One of the steps in evaluating the system of wage administration
should be to distinguish the different organizations within the public sector
which receive somewhat distinct treatment in the setting of their wage
levels. IThe extended wage scale for nonunionized parastatal employees is one
example of this process. Other examples might include the treatment of educa-
tion services or of the police. Differences across public enterprises may be
another element of this internal process of public wage administration. In
providing this overview of the organizational character of the wage structure,
attention should be paid to the relative size of each organization, measured
in terms of employment or share of the wage bill, so that the most significant
organizations can be identified.
Once the organizational character of the public sector wage struc-
ture is specified, it may be possible to relate signals of stress within the
system to prevailing wage differentials. Since wages are set, employees may
respond to relative rewards by changing the quantity and quality of work
provided. Signals of stress within the system might include job turnover,
- 44 -
mismatching between worker qualifications and job requirements, moonlighting,
excessive vacancy rates, job queues, poor job performance, etc. Appreciating
both the character of the organizational dimension of the public sector wage
structure, as well as responses to prevailing differentials, should be a
useful first step in evaluating the effectiveness of the system of wage
administration.
other dimensions of the public sector wage structure which should be
emphasized are skill and occupation. within any particular public organiza-
tion, it would be useful to build a wage and employment matrix which disaggre-
gates the total wage bill. By so doing it will be possible to identify those
salary or occupational groups which weigh the most heavily in determining
total pay obligations. Such matrices provide simple means for evaluating the
budgetary trade-offs of granting different levels of pay increases to dif-
ferent groups or of determining possible trade-offs between increased, or
decreased, wages versus employment.
(ii) Forms of Compensation
In order to provide a complete accounting of wages and conditions of
employment or to specify correctly the wage relationships across organizations
within the public sector, a well-defined notion of compensation is required.
In essence, what needs to be included when we are discussing government pay?
Since nonwage payments, including housing and transport, are alleged to com-
prise significant shares of at least some public sector employees' total
compensation, it seems advisable to account for nonwage benefits and to
attempt some crude estimation of the nominal value of these benefits.
With improved measures of total compensation, the information avail-
able from the wage and employment matrices discussed above should offer a tool
- 45 -
for more accurate projections of total labor costs. The budgetary implica-
tions of changes in wages, fringe benefits or employment may, therefore, be
more accurate as well. Development of total compensation measures will
facilitate pay comparisons within the public sector. Since public enterprise
employees are believed to receive disproportionately more nonwage benefits
than government workers, the estimation of total compensation statistics will
contribute to the evaluation of intra-public sector wage differentials. Total
compensation estimates should also be used in determining whether wage
guidelines have been adhered to. If wage increases conform to the wage
guidelines set by the PIC but fringe benefits, assuming that they account for
a significant share of total remuneration, rise by an amount above the
guidelines, the intent of the wage control orders may not be fully realized.
A corollary to this problem is also worth noting. If a significant share of
total compensation is in fringe benefits and if these fringe benefits are paid
in kind (for example, housing or health care), then the increase in the costs
of these fringe benefits and hence in the nominal value of compensation will
be partially linked to the price increases of the goods in question. By
relying on in-kind forms of compensation, government expenditures on public
employees can rise appreciably regardless of existing wage guidelines. The
significance of this point is that, from a budgetary perspective, the
government should be aware of the payment obligations it locks itself into as
a result of the forms of compensation it chooses to adopt.
In addition to clarifying the costs of existing practices of compen-
sation, another objective of a review of the structure of government pay would
be to relate different forms of payment to workers' incentives. For example,
do fringe benefits tend to increase or decrease compensation differentials
- 46 -
across all skill categories, or how are cash versus nonwage benefits adminis-
tered in order to reward superior job performance? As part of a discussion of
forms of compensation and job performance, there should be a review of termi-
nation and promotion policies, merit pay increases, classification schemes for
temporary versus permanent employees, and any other administrative procedures
which are critical to an employee's status and subsequent level of pay.
Understanding various elements of the system of public sector wage admini-
stration will help in predicting responses to changes in wage policy and
should, therefore, contribute to improving policy interventions.
In conclusion, we would like to propose a collaborative work program
which would permit the World Bank to contribute to background information
which should prove valuable to the Commission in its evaluation of wage policy
alternatives. The initial focus of this work will be on public sector wage
and employment issues and the work will deal with the institutional features
of government and public enterprise wage setting and employment.
Tb set this work in motion, we would like to discuss this report
with the Zambian government in early 1984 and to reach agreement on a
collaborative program of work. During this mission we would hope to work with
the PIC to set up a system for assembling information on employment and the
various components of pay which would permit the PIC to evaluate public sector
wage and employment developments in the future. Such a task will most likely
require the cooperation and assistance of a number of government agencies,
such as the Personnel Division, the Public Service Commission, the Ministry of
Works and Supplies, the Ministry of Labour and Social Services, and the
Central Statistical Office. We hope to return to Zambia in mid-1984 and,
together with the PIC, evaluate the issues of wage administration raised in
- 47 -
this proposal. We plan to submit a report on "Wage Administration and
Employment Policies in the Public Sector" to the Zambian government by the end
of 1984. It is hoped that the analysis proposed in this work program can
assist the PIC in formulating policies consistent with national economic
objectives.
- 48 -
ANNEX I: WAGE TRENDS AFTER INDEPENDENCE
Trends and Disparities in the Formal Sector
Tb shed light on the present wage situation, the following briefly
reviews past developments in relative wage trends for different groups and
various sectors. Disparities between Zambians and non-Zambians, as well as
between mining and other sectors, have been of major concern for the past two
decades. The Zambian government initiated wage policies aimed at reducing
these differentials soon after Independence 1/ and has continued to address
this problem throughout the various stages of development planning during the
1970's. Although the earnings gap between Zambians and non-Zambians has
narrowed considerably, expatriates still earned over four times what native
Zambians did in 1980. 2/ Earnings in the mining sector have also remained
significantly higher than the average earnings of all workers (Annex Table 1).
See J. Fry, Employment and Income Distribution in the African Economy,Croom Helm, London, 1979, Chapter 5.
2/ Data on earnings in this section relate to average earnings of employeesin the formal sector based on information from the Employment andEarnings Survey of establishments. The series suffers from severalinconsistencies, among them (a) the annual average is based on 4th-quarter estimates after 1966; (b) certain fringe benefits and noncashearnings were excluded from 1970 onwards; and (c) after 1972 theclassification of employees changed from ethnic group to citizenship (seeAppendix Table 1), making the series not strictly comparable with regardto this disaggregation. It was not possible to examine earningsdifferentials by skill classification because occupational data were notreported. It is estimated that formal sector employment constituted only22 percent of the labor force in 1979. Thus, for the majority of thelabor force, and for the informal sector in particular, information onwage trends does not exist.
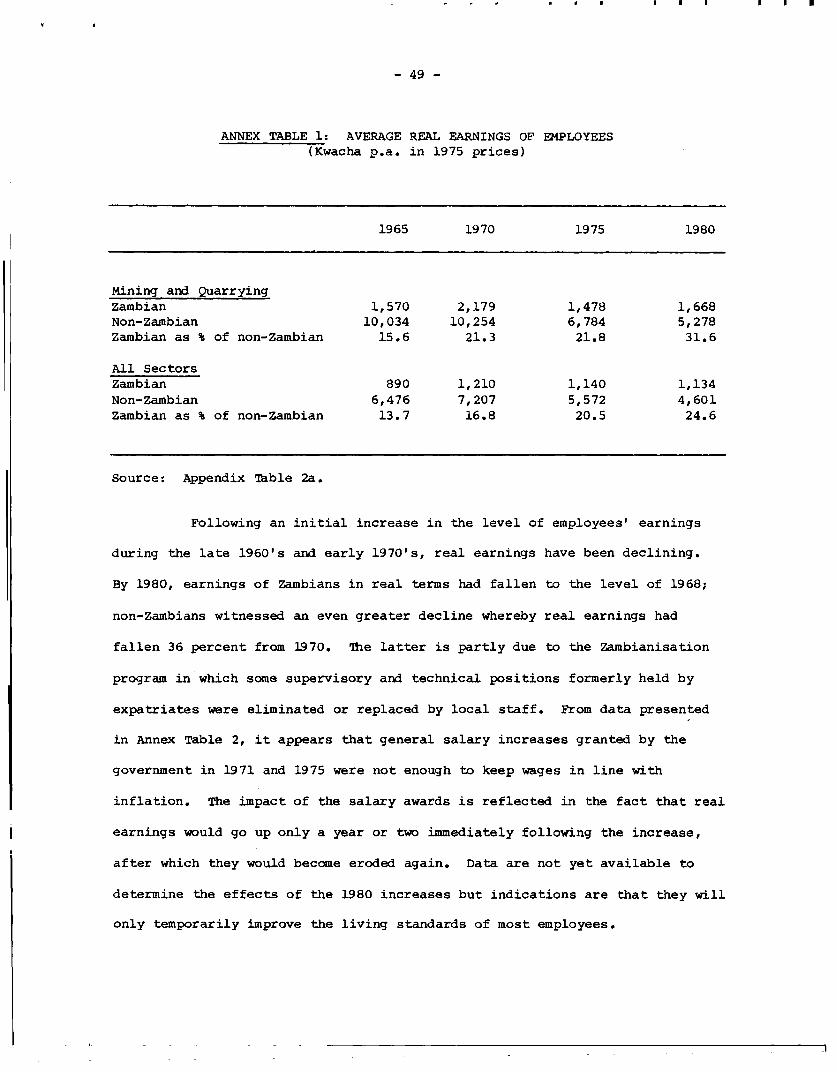
- 49 -
ANNEX TABLE 1: AVERAGE REAL EARNINGS OF EMPLOYEES(Kwacha p.a. in 1975 prices)
1965 1970 1975 1980
Mining and QuarryingZambian 1,570 2,179 1,478 1,668Non-Zambian 10,034 10,254 6,784 5,278Zambian as % of non-Zambian 15.6 21.3 21.8 31.6
All SectorsZambian 890 1,210 1,140 1,134Non-Zambian 6,476 7,207 5,572 4,601Zambian as % of non-Zambian 13.7 16.8 20.5 24.6
Source: Appendix Table 2a.
Following an initial increase in the level of employees' earnings
during the late 1960's and early 1970's, real earnings have been declining.
By 1980, earnings of Zambians in real terms had fallen to the level of 1968;
non-Zambians witnessed an even greater decline whereby real earnings had
fallen 36 percent from 1970. The latter is partly due to the Zambianisation
program in which some supervisory and technical positions formerly held by
expatriates were eliminated or replaced by local staff. From data presented
in Annex Table 2, it appears that general salary increases granted by the
government in 1971 and 1975 were not enough to keep wages in line with
inflation. The impact of the salary awards is reflected in the fact that real
earnings would go up only a year or two immediately following the increase,
after which they would become eroded again. Data are not yet available to
determine the effects of the 1980 increases but indications are that they will
only temporarily improve the living standards of most employees.
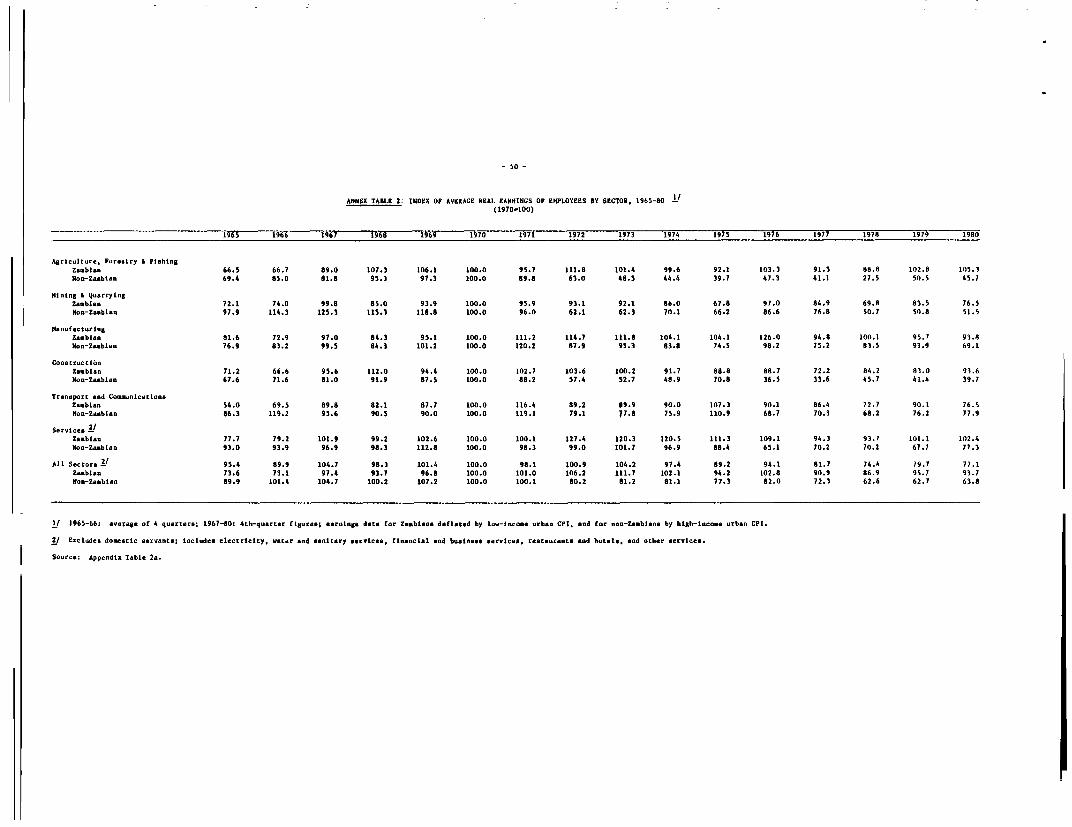
- 50 -
ANNeX TABLE 2. INDEX OF AVERIAGE REAL EARNINGS OF EMPLOYEES BY SECTOR. 1965-80 I,(1970-100)
1965 1966 1967 1968 1969 1970 1971 1972 1973 1974 1975 1976 1977 1978 1979 1980
Agriculture. Fore.try P itchlngZublan 66.5 66.7 89.0 107.3 106.1 100.0 95.7 111.8 101.4 99.6 92.1 103.3 91.3 88.8 102.8 105.3Non-Za.blao 69.4 85.0 81.8 95.3 97.3 100.0 89.8 63.0 48.3 44.4 39.7 47.3 41.1 27.5 50.5 45.7
Mining & QuarryingZambian 72.1 74.0 99.8 85.0 93.9 100.0 95.9 93.1 92.1 86.0 67.8 97.0 84.9 69.8 83.5 76.5Non-Zamblan 97.9 114.3 125.3 115.1 118.8 100.0 96.0 62.1 62.3 70.1 66.2 86.6 76.8 50.7 50.9 51.5
Mn-factarlngZanblon 81.6 72.9 97.0 84.3 95.1 100.0 111.2 114.7 111.8 104.1 104.1 126.0 94.8 100.1 95.7 93.8Non-Z"blan 76.9 83.2 99.5 84.3 101.2 100.0 120.2 87.9 95.3 83.8 74.5 98.2 75.2 83.5 93.9 69.1
ConStructlonZamblan 71.2 66.6 95.6 112.0 94.4 100.0 102.7 103.6 100.2 91.7 88.8 88.7 72.2 84.2 83.0 93.6Non-Zaablan 67.6 71.6 81.0 91.9 87.5 100.0 88.2 57.4 52.7 48.9 70.8 36.5 33.6 45.7 41.4 39.7
Tr-u.port cnd CounicationaZmblan 54.0 69.5 89.8 82.1 87.7 100.0 116.4 89.2 09.9 90.0 107.3 90.1 86.4 72.7 90.1 76.5Non-Zablan 86.3 119.2 95.6 90.5 90.0 100.0 119.1 79.1 17.8 75.9 110.9 68.7 70.3 68.2 76.2 77.9
Services 2/Zambian 77.7 79.2 101.9 99.2 102.6 100.0 100.1 127.4 120.3 120.5 111.3 109.1 94.3 93.7 101.1 102.4Nlo-Zambhan 93.0 93.9 96.9 98.3 112.8 100.0 98.3 99.0 101.7 96.9 88.4 65.1 70.2 70.2 67.1 77.3
All Sectors 3. 95.4 89.9 104.7 98.3 101.4 100.0 98.1 100.9 104.2 97.4 89.2 94.1 81.7 74.4 79.7 77.1Z-blan 73.6 73.1 97.4 93.7 96.8 100.0 101.0 106.2 111.7 102.1 94.2 102.8 90.9 86.9 95.7 93.7Non-Zlablan 89.9 101.4 104.7 100.2 107.2 100.0 100.1 80.2 81.2 81.1 77.3 82.0 72.3 62.6 62.7 63.8
I/ 1965-66: average of 4 quarters; 1967-80: 4th-qoarter figures; earnings data for lsbians deflated by lou-l...e. urban CPI, and for non-Z..blana by high-ioco-e urban CPI.
2/ Exclude. donatic servants; includa electricity, water and sanitary services, financial end business services. restaurants and hotels, and other services.
Source: AppendIx Table 2a.
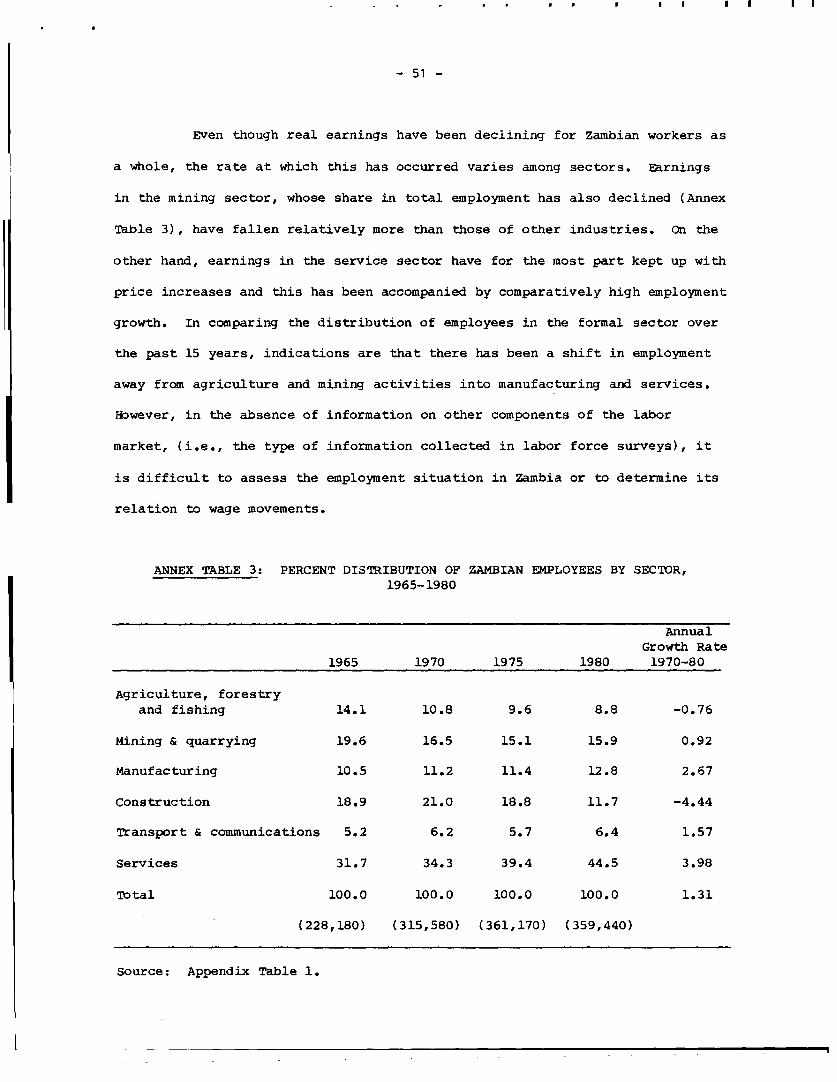
- 51 -
Even though real earnings have been declining for Zambian workers as
a whole, the rate at which this has occurred varies among sectors. Earnings
in the mining sector, whose share in total employment has also declined (Annex
Table 3), have fallen relatively more than those of other industries. On the
other hand, earnings in the service sector have for the most part kept up with
price increases and this has been accompanied by comparatively high employment
growth. In comparing the distribution of employees in the formal sector over
the past 15 years, indications are that there has been a shift in employment
away from agriculture and mining activities into manufacturing and services.
However, in the absence of information on other components of the labor
market, (i.e., the type of information collected in labor force surveys), it
is difficult to assess the employment situation in Zambia or to determine its
relation to wage movements.
ANNEX TABLE 3: PERCENT DISTRIBUTION OF ZAMBIAN EMPLOYEES BY SECTOR,1965-1980
AnnualGrowth Rate
1965 1970 1975 1980 1970-80
Agriculture, forestryand fishing 14.1 10.8 9.6 8.8 -0.76
Mining & quarrying 19.6 16.5 15.1 15.9 0.92
Manufacturing 10.5 11.2 11.4 12.8 2.67
Construction 18.9 21.0 18.8 11.7 -4.44
Transport & communications 5.2 6.2 5.7 6.4 1.57
Services 31.7 34.3 39.4 44.5 3.98
Total 100.0 100.0 100.0 100.0 1.31
(228,180) (315,580) (361,170) (359,440)
Source: Appendix Table 1.

- 52 -
Earnings in the Public, Parastatal and Private Sectors
The public and parastatal sectors provide employment for the majority
of Zambians in the formal sector, each accounting for 38 percent of the formal
sector work force in 1980. while employment in the private sector has been
declining between 1975 and 1980 at the rate of 6.2 percent per annum, the
public and parastatal sectors grew at 1.7 percent and 3.3 percent per annum,
respectively (Appendix Table 3). Over 70 percent of all public employees are
in the service sector; the largest single group of employees in the parastatal
sector is engaged in mining, and the private sector provides employment for
the bulk of workers in manufacturing. In 1980, average earnings in the
parastatal sector were significantly higher than earnings in the private
sector (33 percent). Public sector earnings were the lowest at 41 percent
below that of parastatals (Annex Table 4). Since 1975, real earnings of
parastatal employees have remained above those in the other two sectors;
public sector earnings were higher than private earnings prior to 1978, but
since then the reverse has been true. The existing situation is substantiated
by the fact that, while real earnings in the parastatals have been maintained,
real earnings in the public sector declined by 16 percent between 1975 and
1980, and private sector earnings increased by 14 percent (Appendix Table 4a).
Public Sector Salaries, 1967-1980
Increases in public sector salaries are granted based upon the
recommendations of salaries review commissions appointed by the government;
there have been four such commissions since Independence. Annex Table 5
compares the basic salary awards of each commission for a few selected groups
of government employees. The data show that public sector wages in real terms
have been declining, particularly for higher-level personnel. This reflects
the government's attempt to narrow the gap between higher- and lower-paid
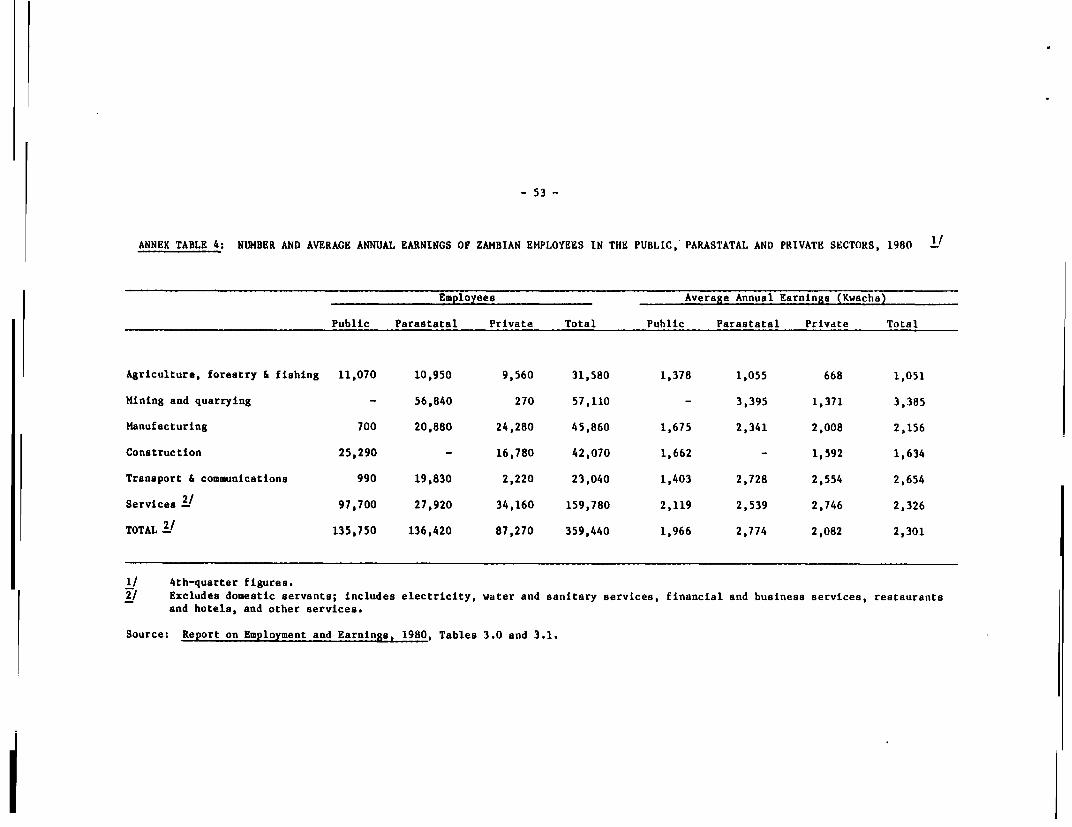
- 53 -
ANNEX TABLE 4: NUMBER AND AVERAGE ANNUAL EARNINGS OF ZAMBIAN EMPLOYEES IN THE PUBLIC, PARASTATAL AND PRIVATE SECTORS, 1980 1!
Employees Average Annual Earnings (Kwacha)
Public Parastatal Private Total Public Parastatal Private Total
Agriculture, forestry & fishing 11,070 10,950 9,560 31,580 1,378 1,055 668 1,051
Mining and quarrying - 56,840 270 57,110 - 3,395 1,371 3,385
Manufacturing 700 20,880 24,280 45,860 1,675 2,341 2,008 2,156
Construction 25,290 - 16,780 42,070 1,662 - 1,592 1,634
Transport & communications 990 19,830 2,220 23,040 1,403 2,728 2,554 2,654
Services 2/ 97,700 27,920 34,160 159,780 2,119 2,539 2,746 2,326
TOTAL 2/ 135,750 136,420 87,270 359,440 1,966 2,774 2,082 2,301
1/ 4th-quarter figures.2/ Excludes domestic servants; includes electricity, water and sanitary services, financial and business services, restaurants
and hotels, and other services.
Source: Report on Employment and Earnings, 1980, Tables 3.0 and 3.1.
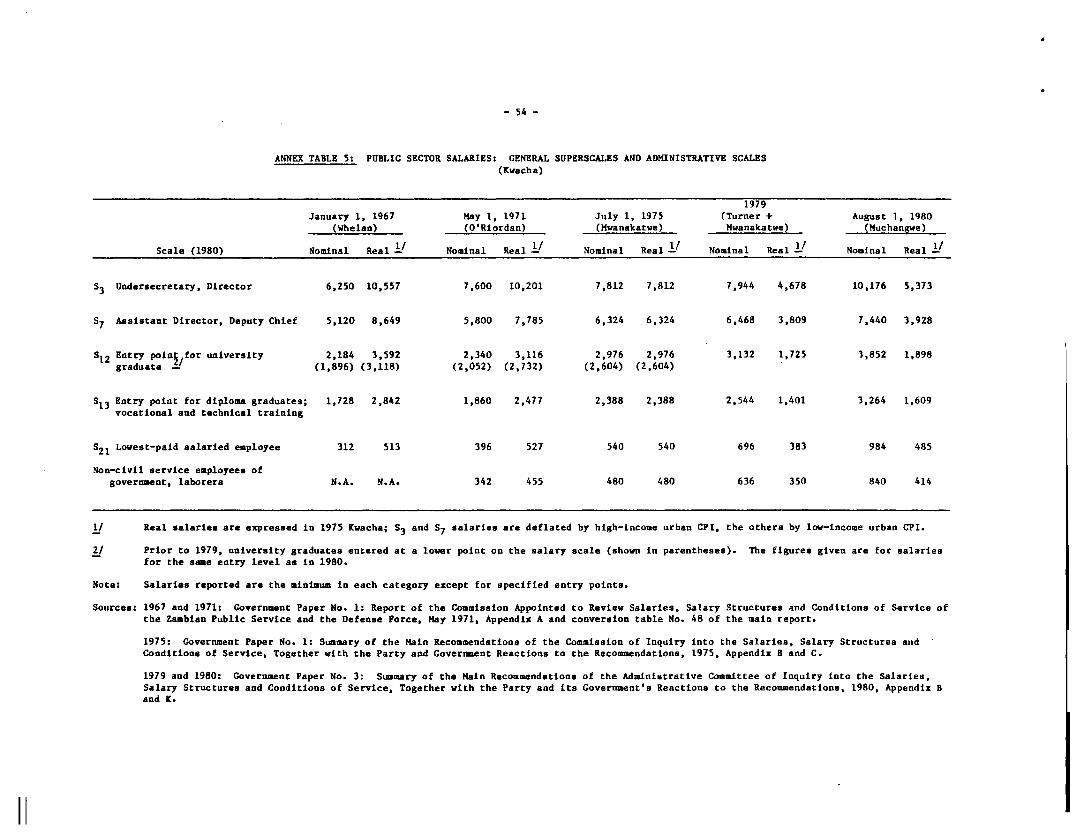
- 54 -
ANNEX TABLE 5: PUBLIC SECTOR SALARIES: GENERAL SUPERSCALES AND ADMINISTRATIVE SCALES(Ywacha)
1979January 1, 1967 May 1, 1971 July 1, 1975 (Turner + August 1, 1980(Whelan) (O'Riordan) (Mwanakatwe) Mwanakatwe) (Muchangwe)
Scale (1980) Nominal Real 1! Nominal Real - Nominal Real V/ Nominal Real V Nominal Real 1Y
S3 Undersecretary, Director 6,250 10,557 7,600 10,201 7,812 7,812 7,944 4,678 10,176 5,373
S7 Assistant Director, Deputy Chief 5,120 8,649 5,800 7,785 6,324 6,324 6,468 3,809 7,440 3,928
S12 Entry poinJ/for university 2,184 3,592 2,340 3,116 2,976 2,976 3,132 1,725 3,852 1,898graduate - (1,896) (3,118) (2,052) (2,732) (2,604) (2,604)
S13 Entry point for diploma graduates; 1,728 2,842 1,860 2,477 2,388 2,388 2,544 1,401 3,264 1,609vocational and technical training
S21 Lowest-paid salaried employee 312 513 396 527 540 540 696 383 984 485
Non-civil service employees ofgovernment, laborers N.A. N.A. 342 455 480 480 636 350 840 414
1/ Real salaries are expressed in 1975 Kuacha; S3 and S7 salaries are deflated by high-income urban CPI, the others by low-income urban CPI.
2/ Prior to 1979, university graduates entered at a lower point on the salary scale (shown in parentheses). The figures given are for salariesfor the same entry level as in 1980.
Note: Salaries reported are the minimum in each category except for specified entry points.
Sources: 1967 and 1971: Government Paper No. 1: Report of the Commission Appointed to Review Salaries, Salary Structures and Conditions of Service ofthe Zambian Public Service and the Defense Force, May 1971, Appendix A and conversion table No. 48 of the main report.
1975: Government Paper No. 1: Summary of the Main Recommendations of the Commission of Inquiry into the Salaries, Salary Structures andConditions of Service, Together with the Party and Government Reactions to the Recommendations, 1975, Appendix B and C.
1979 and 1980: Government Paper No. 3: Siumary of the Main Recommendations of the Administrative Committee of Inquiry into the Salaries,Salary Structures and Conditions of Service, Together with the Party and its Government's Reactions to the Recommendations, 1980, Appendix Band K.
11
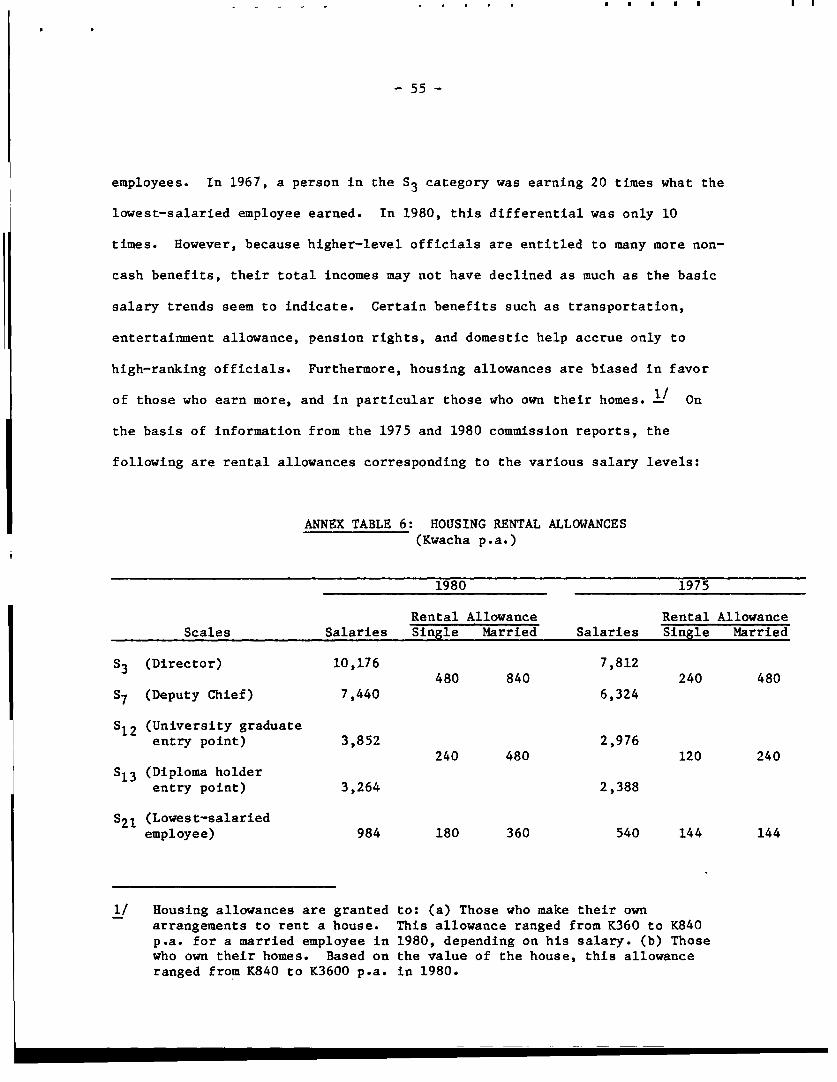
- 55 -
employees. In 1967, a person in the S3 category was earning 20 times what the
lowest-salaried employee earned. In 1980, this differential was only 10
times. However, because higher-level officials are entitled to many more non-
cash benefits, their total incomes may not have declined as much as the basic
salary trends seem to indicate. Certain benefits such as transportation,
entertainment allowance, pension rights, and domestic help accrue only to
high-ranking officials. Furthermore, housing allowances are biased in favor
of those who earn more, and in particular those who own their homes. 1' On
the basis of information from the 1975 and 1980 commission reports, the
following are rental allowances corresponding to the various salary levels:
ANNEX TABLE 6: ROUSING RENTAL ALLOWANCES(Rwacha p.a.)
1980 1975
Rental Allowance Rental AllowanceScales Salaries Single Married Salaries Single Married
S3 (Director) 10,176 7,812480 840 240 480
S7 (Deputy Chief) 7,440 6,324
S12 (University graduateentry point) 3,852 2,976
240 480 120 240S13 (Diploma holder
entry point) 3,264 2,388
S21 (Lowest-salariedemployee) 984 180 360 540 144 144
1/ Housing allowances are granted to: (a) Those who make their ownarrangements to rent a house. This allowance ranged from K360 to K840p.a. for a married employee in 1980, depending on his salary. (b) Thosewho own their homes. Based on the value of the house, this allowanceranged from K840 to K3600 p.a. in 1980.
- 56 -
It appears from the above that recent increases in housing
allowances have benefitted married employees in the lower groups relatively
more. Although information on money earnings and housing benefits indicates
that real differentials between high- and low-level employees have in general
been declining, more information regarding changes in the total compensation
package is needed before any conclusions can be made concerning the relative
position of employees in the lower end of the pay scale.
-57-
ANNEX II: DATA REQUIREMENTS
(a) Labor Force and Employment
In order that the Commission be able to formulate effective wage
policies and determine their impact on various groups, some very fundamental
information on labor force and employment must be collected and analyzed. It
will be desirable to obtain up-to-date data on the size and growth of the
labor force, and the composition of the work force by industrial sector,
occupational structure, public (including state and local government
breakdown), private and parastatal, urban-rural and province. In addition,
details pertaining to the employed (e.g. employment status, occupation and
industry) and unemployed (e.g. rate, characteristics, and seasonality) need to
be examined. This type of information is a prerequisite for analytic work on
such topics as relationships between wages and employment; manpower require-
ments and skill shortages; effects of changes in import and export prices on
employment; and locational and structural disparities.
At present, data sources providing the kind of information described
above are virtually nonexistent. Results of the 1969 Population Census are
outdated; and because it was conducted during the agricultural slack period
(August), underestimated the number of persons in the labor force. The 1980
Population Census which collected information on the economic activities of
individuals will provide some basic data. However, in the future it will be
useful to set up a system of regular labor force surveys to be conducted once
or twice annually. These surveys should be well defined and involve a repre-
sentative sample of households for all Zambia. The methodology should be well
thought out and questions should be formulated to provide coherent and system-
- 58 -
atic information on employment, wage and income. The aim of these surveys
should be to establish a continuous data series which will serve as a basis
for subsequent policy action.
The only source available on employment is the Central Statistical
Office's Enployment and Earnings Survey 1/ which covers only the formal
sector. Thus, the information provided is limited and should be used with
caution, particularly with regard to a) incomplete coverage of establishments
which therefore means an underestimate of employment; b) nonresponse by
establishments which results in estimates being made by survey personnel; and
c) the exclusion of self-employed and informal sector employees and the fact
that information on employers and proprietors are not reported which limit the
usefulness of the survey.
Since formal sector employment accounts for only 22% of the labor
force, it is clear that more effort should be made to understand the workings
of other components in the labor market. Employment in the urban informal
sector and in rural areas have been studied in the past by various research
teams. However, information is sketchy and fragmented, making it impossible
to determine accurately the overall size of these sectors and their role in
the economy. Efforts to piece together information from such disparate
sources as the Agricultural and Pastoral Production Surveys and the Zambia
National Provident Fund to arrive at some estimate of the work force are
inaccurate and misleading. Thus, it should be a primary concern of the PIC to
mobilize its efforts in order to eliminate informational gaps such as this.
1/ And the Manpower Survey which is basically the same survey but collectsadditional information on occupation and, supposedly, earnings by occupation,but the latter is not reported in the published volumes.
- 59 -
(b) Earnings/Wages
The formulation of appropriate policy action with regard to wages
requires a thorough understanding of the present situation. Ideally, the PIC
would want to collect wage data by the same disaggregation as described pre-
viously for employment. However, wage data hardly exist and, in the future,
it will be important to collect this information either as part of the labor
force survey or by doing specific studies. Clarification with respect to
definitions and terminologies should be made from the start. For example,
wage rate (remuneration per hour, day, week, year) should be distinguished
from earnings (which include gratuity, bonuses, overtime, allowances, etc.),
as well as from total pay (which includes all cash and noncash fringe bene-
fits). In its analysis of wage relationships, the PIC should take account of
the total compensation package. This implies getting employers and unions to
assess the real costs of labor and to quantify noncash benefits so that they
may be included in the analysis of pay differentials. It must be emphasized
that fringe benefits constitute a significant portion of the total pay
package, and, owing to recent wage ceilings, have become an increasingly
important means of raising workers' incomes.
In setting up the data base for wage analysis, the PIC should focus
on collecting data which would best serve its purpose in terms of assessing
current situations and formulating appropriate policy instruments. For
example, an analysis of wage differentials between urban and rural areas or
between various provinces could shed light on the problems of income inequi-
ties and rural poverty. Concern over effective manpower planning policies and
labor shortages in certain occupations would warrant a look at skill differen-

- 60 -
tials. If possible, an assessment of formal-informal sector earnings dispari-
ties would provide a better understanding of the employment situation and
general labor market condition.
Within the formal sector where the government and parastatals domi-
nate, pay differentials between these and private organizations are parti-
cularly important. In the past, there has been an attempt to narrow the
salaries gap between the government and parastatals to discourage civil
servants from moving to the parastatals. It would be relevant for future
development planning to determine differences between these sectors with
respect to salary scales and procedures employed in the wage-setting
process. A possible first step could be to select several occupations common
to all three sectors, and compare their basic salaries across the board. In
addition, a list of fringe benefits could be constructed for each selected
occupation in each sector to build up a total pay package. Information on the
government sector could be drawn from the Muchangwe Report, the parastatal
sector from ZIMCO pay scales, and the private sector from a few privately-
owned companies.
Within the parastatal and private sectors, there is also a wage
relationship between the unionized and nonunionized workers. The PIC needs to
monitor the trend in negotiated pay increases contained in collective agree-
ments for unionized workers. Wage information for nonunionized workers should
also be collected and monitored, perhaps through labor force surveys or as
part of the Employment and Earnings Survey.
The primary data source presently available on formal sector
earnings is the DEployment and Earnings Survey described in the employ-
ment section. The survey provides earnings information by industrial sector,
- 61 -
public - parastatal - private sectors, ethnic group, and province (although
not reported in the published volumes after 1971). Annual figures are aver-
age earnings of a particular quarter multiplied by four. Average quarterly
earnings are total quarterly earnings divided by the number of employees.
Because the data are averages, they should be relied upon only as indica-
tors of gross relatives and trends. The levels of earnings should not be used
without additional substantiation from other sources. The margin for error is
high both in the numerator (i.e. what different establishments include as
earnings) and in the denominator (i.e. whether or not unpaid family workers
are included and the inclusion of piece-rate workers regardless of the amount
they earn).
Other sources with wage information include the Department of Labor
Annual Reports and the records of the Industrial Relations Court. The
Department of Labor collects data on basic pay scales for different
industries. If these could be augmented with information on fringe benefits,
comparisons of total pay could be made between various groups for different
years. Industrial Relations Court records could provide similar kinds of
information based on wage settlements.
(c) Government Expenditure
As pointed out in Section II.3, a central issue requiring investi-
gation by the PIC involves the relationship between the pay package and the
government's wage bill and the impact of the latter on the budget. Before
this assessment can be made, the PIC must obtain information on the total wage
bill. Information on actual government expenditures is provided in statement
C of the Ministry of Finance's Financial Report. However, wage and allowance
- 62 -
data which appear under the heading 'Personal Emoluments' and 'Recurrent
Departmental Charges' are not summarized for Zambia but are disaggregated by
Ministry/Department, of which there are approximately 170. 1/ As a first
step, the PIC will need to obtain a yearly summary of government salaries,
housing and other allowances, as well as total wage payments for classified
daily employees. In the future, the PIC should also attempt to get estimates
of noncash fringe benefits (e.g. provision of housing, transportation, and
servants) and the total employment as well as wage payments to classified
daily employees.
(d) Prices
(i) Consumer Prices: The Central Statistical Office (CSO) collects
retail prices on a monthly basis from a number of retail outlets in urban
centers for a number of commodities which make up the consumer price index:
400 for the low-income group and 600 for the high-income group. 2/ They are
reported in the Consumer Price Statistics Quarterly as well as the Monthly
Digest of Statistics.
Price information, if properly collected, can serve as valuable
market signals and point the way to appropriate price adjustments. Unfor-
tunately, because of price controls in the past, the collection of price data
as was carried out by the CSO has not been as useful as it might have been.
1/ Summaries of total 'Personal Emoluments' and 'Recurrent DepartmentalCharges' are provided in the Estimates of Revenue and Expenditures volumes.
2/ In 1975, low-income included urban households with gross monthly incomesof less than K100, and high-income included urban households with grossmonthly incomes of K300 or more.
- 63 -
The CSO prices included in the consumer price indices are those
charged by conventional retail outlets such as shops, supermarkets and
markets. 1/ 'Blackmarket' prices are not included even when the only way to
obtain an item is through the blackmarket. In such a case the shop price at
which previous supplies were sold is used in the price index. Three reasons
are given for not using blackmarket prices in the price indices: they are
difficult to collect on a regular basis; they would cause the index to
fluctuate excessively; and the change in the cost of living is unaffected if
the blackmarket price is always a constant percentage above the normal retail
price. The CSO itself points out that the differences between the market
prices and the usual prices (when available) for some essential commodities in
early 1981 were well over 100%. In a more extreme case, the price of a scoop
of salt (weighing 118 grams) was 20n, or equivalent to K1.69 per kilogram,
whereas the usual price when salt was available was 23n per kilogram, implying
a difference of 635%. The price indices therefore failed to capture the
fluctuations caused by shortages and blackmarkets. Moreover, no rural price
data have ever been collected, so that we cannot compare urban and rural price
levels or the differences in the trends of these over time. In the same way,
since prices are not collected for varying units of commodities for which the
poor can only buy in small quantities (see Appendix Table 6), we cannot
properly compare the cost of living of the low- and high-income groups at any
point in time.
- 64 -
(ii) Wholesale prices are collected by the CSO from a number of
wholesale outlets on a quarterly basis, and reported in the Monthly Digest of
Statistics. The PIC should work with the CSO to keep a comprehensive, up-to-
date list of outlets and to minimize data processing time.
(iii) Producer prices are also collected for some commodities by
the CSO and published in the Annual Agricultural Statistical Bulletin.
However, the data for a number of items produced in the rural areas are not
available in the form of a continuous series. The PIC will need this
information to calculate the rural-urban terms of trade (discussed below).
(iv) Prices of commodities produced by parastatals could be
obtained from ZIMCO subsidiaries. They generally keep these statistics up-to-
date.
(v) Import and export prices are necessary for monitoring movements
in the terms of trade facing Zambia. These are collected by the External
Trade Section of the CSO. Export prices relate primarily to metals and are
straightforward. However, import prices which are presented only in the form
of import price indices by industry are not useful in their present format.
The PIC should investigate what form the raw data take and whether these can
be made available.
(e) Rural-Urban Terms of Trade
Changes over time in the standard of living of the population in
rural as compared with urban areas can be measured by constructing terms-of-
trade indices. In the past, these indices have been formulated by various
people (Turner, Maimbo and Fry, Young, Jolly) using different methods and
employing different data bases. Rather than review the results from these
-65 -
studies, it will be more useful to set out what kinds of data the PIC will
need and how it may wish to proceed in constructing such indices. The
following is based primarily on Maimbo and Fry's analysis. 1/ The barter
terms of trade measures the purchasing power of a representative fixed
quantity of African farmer's produce in terms of units of goods bought from
the urban sector. These are price terms on which rural agricultural producers
trade with urban nonagricultural producers. The income terms of trade
measures the real purchasing power of all farm cash income. It is an index of
real income of Zambian farmers, since it takes into account changes in output
as well as prices of agricultural commodities. These two indices can be
expressed as follows: 2/
Barter Terms of Trade = Index of Agricultural Producer PricesCost-of-Living Index for Urban Products
Income Terms of Trade = Index of Value of Total Marketed Output of Farmers 3/'Cost-of-Living Index for Urban Products
1/ See Fabian J.M. Maimbo and James Fry, "An Investigation into the Change inthe Terms of Trade between the Rural and Urban Sectors of Zambia,"AfricanSocial Research, No. 12, December, 1971.
2/ These indices could also be constructed for the entire agricultural sectorwhich includes both commercial and small-scale units.
3/ Ideally, if data on value added in agriculture were available, this shouldbe used instead of total marketed output.
- 66 -
To gather information to calculate the above is difficult because of
lack of data. Ideally, the PIC will need to set up data series dating from
1965 to the present for:
(i) The value of total marketed output: This entails the selec-
tion of a group of agricultural goods typically produced by small farmers.
This would most likely include maize, tobacco, cotton, groundnuts, fish,
poultry, eggs, beef, etc. To derive the total value for each commodity, the
PIC would have to collect:
a) Production/output data. These are available from the CSO
and published (although incompletely) in the Annual Agricultural Statistical
Bulletin and the Monthly Digest of Statistics. Data are provided either as
'crop intake by official marketing organizations', 'sales of commodity in
Zambia', or 'marketed production of some crops'. In constructing the time
series, adjustments of the data may be necessary because the unit of measure
often changes. Furthermore, output should be in per capita terms, and if this
is not available, some correction should be made for the fact that part of the
increases in production may be due to increases in the number of farmers
selling produce rather than increases in the amount sold by each farmer.
b) Producer prices. These are available for most crops and
cattle in the same sources as above. However, for such items as fish, poultry
and eggs, the data were not reported. The PIC should try to fill this gap
with the help of the CSO.
(ii) Cost-of-living index for urban products: As mentioned in
section (d), there are severe limitations in the usefulness of the price data
presently available. Owing to lack of cost-of-living indices, the urban low
income consumer price index excluding food has been used in the past as the
- 67 -
deflator. However, because the urban consumer price index is not representa-
tive of the consumption pattern of small-scale farmers, Maimbo and Fry con-
structed their own cost-of-living index based on a budget survey of heads of
households and price inquiries in local stores in several southern villages.l/
It was an attempt to get a more precise estimate of the consumption basket of
small-scale farmers for urban goods and the prices they had to pay at local
townships. Based on the methodology used in Maimbo and Fry, the PIC could
easily construct up-to-date indices, provided data as described above could be
obtained. This information could give insights into the relative income
position of the rural population vis-a-vis their urban counterparts.
(f) Household Budget Survey
A comprehensive nationwide household survey is long overdue. The
last household survey was conducted in 1974/75. Because these surveys supply
additional information which is complementary to that from other sources
previously discussed, they should be conducted periodically. The data will
provide information on income distribution in Zambia, rural-urban, formal-
informal and provincial income differentials, and more up-to-date consumption
weights for use in constructing price and cost-of-living indices.
1/ See Maimbo and Fry, p. 99.
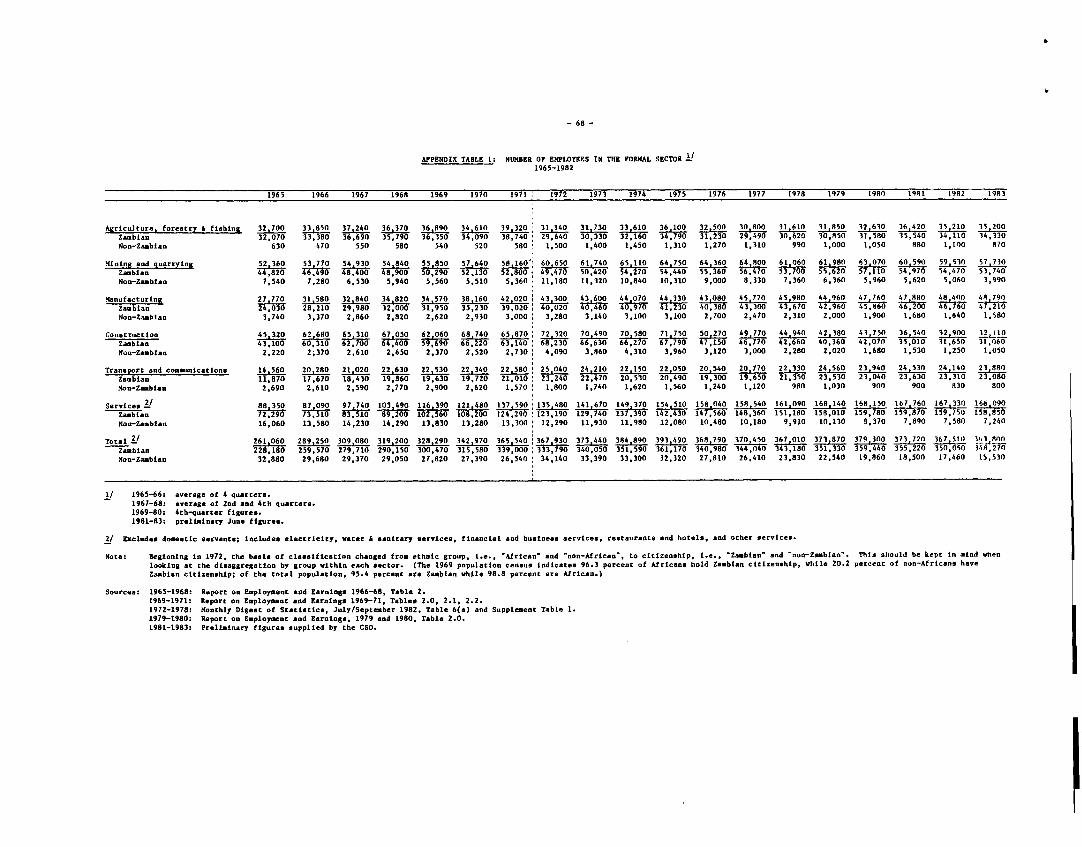
- 68 -
APPENDIX TABLE 1: NUMBER OF EMPLOYEES IN THE FORMAL SECTOR!1965-1982
1965 1966 1967 1968 1969 1970 1911 1972 1973 1974 1975 1976 1977 1978 1979 1980 199l 1982 1983
Agriculture, forestry b fishing 32,700 33,850 37,240 36,370 36,890 34 610 39,320 31,140 31,730 33,610 36,100 32,500 30,800 31 610 31,850 32,630 36,420 35,210 35,200Zeabian 32,070 33,380 36,690 35,790 36,350 38,740 29,640 30 330 32,160 34,793050 31,580 35,540 34,110 34,330Noo-Zaablao 630 470 550 580 540 520 580 1,500 1,400 1,450 1,310 1,270 1,310 990 1,000 1,050 880 1,100 870Mining snd quarrying 52 360 53,770 54,930 54,840 55,850 57 640 58,160" 60,650 61 740 65,110 64,750 64 360 64,800 61 060 61 980 63,070 60, 59 ,530 57 730Zambien 44,820 46,490 48,400 48,900 50,290 523 52,800 49,470 50,420 54,440 55,360 56,470 53,70 55,620 57,110 54,970 54,470 53,740Non-Zambian 7,540 7,280 6.530 5,940 5,560 5,510 5,360 11,180 11,320 10,840 10,310 9,000 8,330 7,360 6,360 5,960 5,620 5,060 3,990Manufacturing 27,770 31,580 32,840 34,820 34,570 38 160 42 020 43,300 43600 44070 44 330 43 080 45 770 45 980 44 960 47 760 47,880 48 400 4 79aZa bian 24,030 28,210 29,980 32,000 31,95920 40,020 40,040 40,970 41,230 40,380 43,300 43,60 4 4 46 760 47.210Non-Zaabi-n 3,740 3,370 2.860 2,820 2,620 2,930 3,000 3,280 3,140 3,100 3,100 2,700 2,470 2,310 2,000 1,900 1,680 1,640 1,580Construction 45,320 62,680 65,310 67,050 62 060 68,740 65,870 72,320 70 490 70 580 71,750 50,270 49,770 44,940 42 380 43,750 36,540 32,900 32,110Zasbian 43,100 60,310 0 64400 59 690 663220 63,140 68,230 t6 6 30 6 627 67,790 47,150 46,770 42,660 40,360 42,070 35,010 31,650 31,060Non-Zambtan 2,220 2,370 2,610 2,650 2,370 2,520 2,730 4,090 3,960 4,310 3,960 3,120 3,000 2,280 2,020 1,680 1,530 1,250 1,050Transport and comunications 14,560 20,280 21,020 22,630 22.530 22,340 22,580 25,040 24210 22,150 22,050 20,540 20 770 22,330 24560 2 24,530 23880Za-bian 11,870 17,670 18,430 19,860 19,630 19,720 21,010 23,240 22470 20,530 20,490 19,300 19,650 21,350 23,530 23,040 23,630 23,310 2 3,80Non-Zeabian 2,690 2.610 2,590 2,770 2,900 2,620 1,570 1,800 1,740 1,620 1,560 1,240 1,120 980 1,030 900 900 830 800Services 2/ 88.350 87,090 97,740 103,490 116,390 121 480 137,590 135,480 141,670 149,370 154,510 158,040 158,540 161,090 168,140 168,150 167,760 167,330 166,090Zeabian 72.290 73,510 83,510 89,200 102,560 108,200 124,290 123,190 712974 137,390 142,430 147,560 148,360 151,180 158,010 159,780 159,870 159,750 158,850Non-Zambian 16,060 13,580 14,230 14,290 13,830 13,280 13,300 12,290 11,930 11,980 12,080 10,480 10,180 9,910 10,130 8,370 7,890 7,580 7,240Tot-1 2/ 261,060 289,250 309,080 319,200 328,290 342,970 365 540 367,930 373 440 384,890 393,490 368,790 370,450 367,010 371,870 379 3nO 37l720 367,5 T1 180)IZambian 228,180 259,570 279,710 290,150 300,470 315,580 339,000 333,790 340,050 351,590 361,170 340,980 344,040 343,180 351,330 359,440 355,220 350,050 348,270Non-Zambian 32,880 29,680 29,370 29,050 27,820 27,390 26,540 34,140 33,390 33,300 32,320 27,810 26,410 23,830 22,540 19,860 18,500 17,460 15,530
1/ 1965-66; average of 4 quarters.1967-68: sverage of 2nd and 4th quarters.1969-80: 4th-quarter figures.1981-83: preliminary June figures.
2/ Excludes domesttc servants; includes electricity, water 6 sanitary services, financial and business services, restaurant. and hotels, and other services.Note: Beginning in 1972, the basis of classification changed from ethnic group, i.e., 'African' and 'non-African', to citizenship, I.e., 'Zabian' and -non-Zambian'. This should be kept In mind whenlooking at the disaggregation by group within each sector. (The 1969 population census indicates 96.3 percent of Africans hold Zambian citizenship, while 20.2 percent of non-Africans haveZambian citizenship; of the total population, 95.4 percent are Zanblan while 98.8 percent are African.)
Sources. 1965-1968: Report on Employment and Earnings 1966-68, Table 2.1969-1971: Report on Employment end Earnings 1969-71, Tables 2.0, 2.1, 2.2.1972-1978: Monthly Digest of Statistices, July/Septenber 1982, Table 6(a) and Supplement Table 1.1979-1980: Report on Employment and Earnings, 1979 and 1980, Table 2.0.1981-1983: Preliminary figures supplied by the CSO.
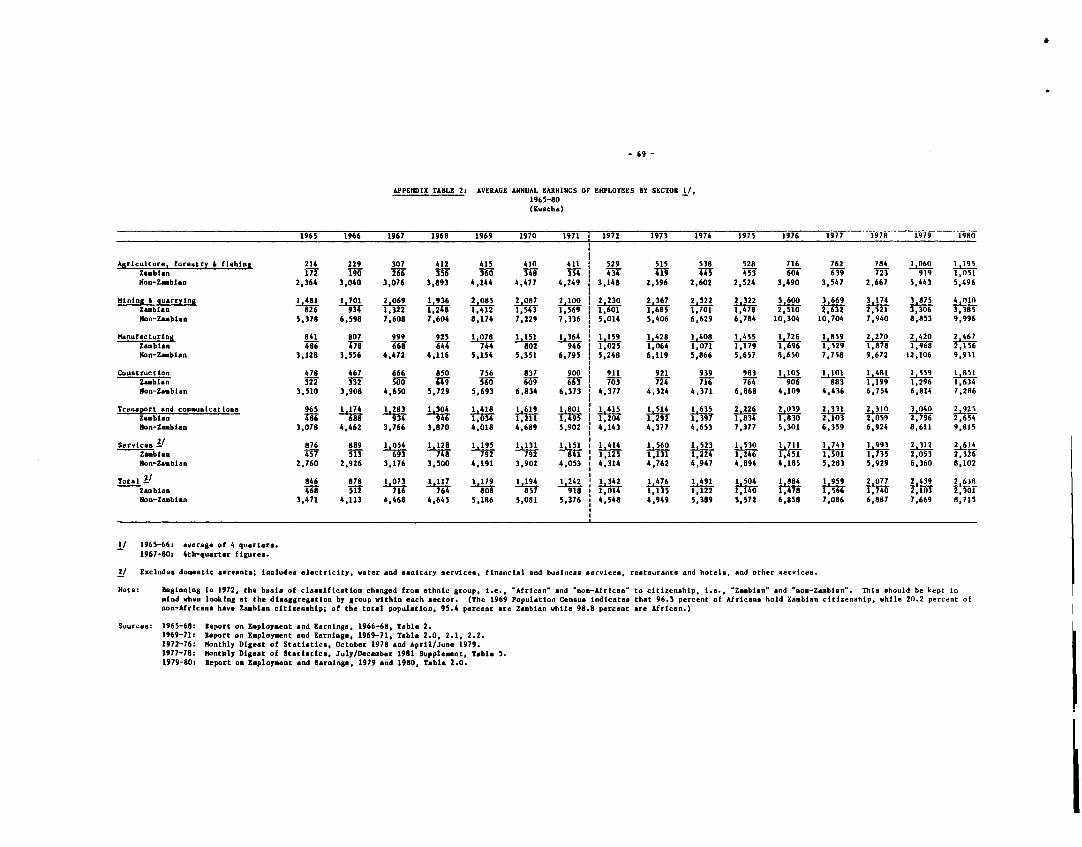
- 69 -
APP9tUDIX TABLE 2: AVERAGE ANNUAL EARNINGS OF EMPLOYEES BY SECTOR 1/,1965-80(Kwacha)
1965 1966 1967 1968 1969 1970 1971 1 1972 1973 1974 1975 1976 1977 1978 1979 1980Agriculture, forestry 4 fishing 214 229 307 412 415 410 411 j 529 515 538 528 716 762 784 1,060 1,l9S
Zambian 171 II 266 356 361 0 3448 34 TW 1W m i04 639 7 919 1,051Non-Zambian 2,364 3,040 3,076 3,893 4,144 4,477 4,249 3,148 2.596 2,602 2,524 3,490 3,547 2,667 5,443 5,496Mining & quarrying 1 481 1 701 2 069 1 936 2,085 2 087 2,100 2 230 2,367 2.522 2,322 3,600 3 669 3Ida 3,875 4 .ll1ambian 9 3 4 1326 T1~ 248 1,412 1,53 1,569 1601i 1 685 1,701 1,478 2,510 2,632 2,521 3,306 3,385Mon-Zambian 5,378 6,598 7,608 7,604 8,174 7,229 7,336 i 5,014 5.406 6,629 6,784 10,304 10,704 7.940 8,853 9,996Manufacturing 841 807 999 925 1,078 1,151 1.364 1,159 1,428 1 408 1,455 1,726 1,859 2270 2,420 2467
Z____b____
946 __ * 148 148 ,5 2 18529 2 2706Zambien 486 478 ME 11 744 802 946 1025 1,064 1,071 1,179 1,696 1,529 1,8 1,968 2,156Non-Zambian 3,128 3,556 4,472 4,116 5,154 5,351 6,795 ,5248 6,119 5,866 5,657 8,650 7,758 9,672 12,106 9,931Construction 478 467 666 850 756 837 900 ! 911 921 939 983 1,105 1,101 1,481 1,559 1.R51Zblabn 322 131 500 ITT 560 609 663 Toy 7E 711 764 906 883 1,199 1,296 1,634Non-Zamblan 3,510 3,908 4,650 3,729 5,693 6,834 6,373 4,377 4,324 4,371 6,868 4,109 4,436 6,754 6,814 7,286Transport and conmunications 965 1 174 1,283 1 304 1,418 1,619 1,801 I 1,415 1,514 1,635 2,226 2,039 2,331 2,310 3,040 2,925Zambian I 688 934 946 1,034 1,211 1T,4 1 1,204 1,292 1,397 1,834 1,830 2,103 2,059 2,796 2,654Non-Zamblan 3,078 4,462 3,766 3,870 4,018 4,689 5,902 | 4,143 4,377 4,653 7,377 5,301 6,359 6,924 8,611 9,815Services 2 876 889 1 054 1,128 1.195 1 131 1,151 1 414 1 560 1,523 1,530 1,711 1,743 1,993 2,312 2,614Za btgn 45_7 33 i6# 748 792 792 841 t 1,125 tl1 1,224 1,246 1,451 1,501 1,735 2,053 2,326Non-Zamblan 2,760 2,926 3,176 3,500 4,191 3,902 4,053 4,314 4,762 4,947 4,894 4,185 5,283 5,929 6,360 8,102Total V 846 878 1,073 1,117 1,179 1,194 1,242 I1 342 1,476 1 491 1,504 1 884 1 959 2077 2439 2 6J8Zambian 468 512 716 764 808 857 918 T' 1 01 1,135 1,122 1,140 1iT78 1 1,740 2,103 2,301Non-Zambian 3,471 4,113 4,468 4,645 5,186 5,081 5,376 4,548 4,949 5,389 5,572 6,858 7,086 6,887 7,669 8,715
1/ 1965-66: average of 4 quartera.1967-80: 4th-quarter figures.
2/ Excludes domestic servants; lacludes electricity, water and sanitary services, financial and buainess services, restaurants and hotels, and other aervices.Note: Beginning in 1972, the basis of claasificetion changed from ethnic group, I.e., 'African and 'non-African to citizenahip, i.e., Zamblan and 'non-Zabian'. This should be kept Inmind when lookaing at the disaggregation by group within each aector. (The 1969 Population Census Indicates that 96.3 percent of Africans hold Zambian citizenahip, while 20.2 percent ofnon-Africans have Zabian citiseaship; of the total population, 95.4 percent are Zambian while 98.8 percent are African,)
Sources: 1965-68: Report on Employment and Earnings, 1966-68, Table 2.1969-71: Report on Employment and Earnings, 1969-71, Table 2.0, 2.1, 2.2.1972-76: Nonthly Digest of Statistics, October 1978 end April/June 1979.1977-78: Monthly Digest of Statistics, July/December 1981 Supplement, Table 5.1979-801 Report on Employment and Earnings, 1979 and 1980, Table 2.0.
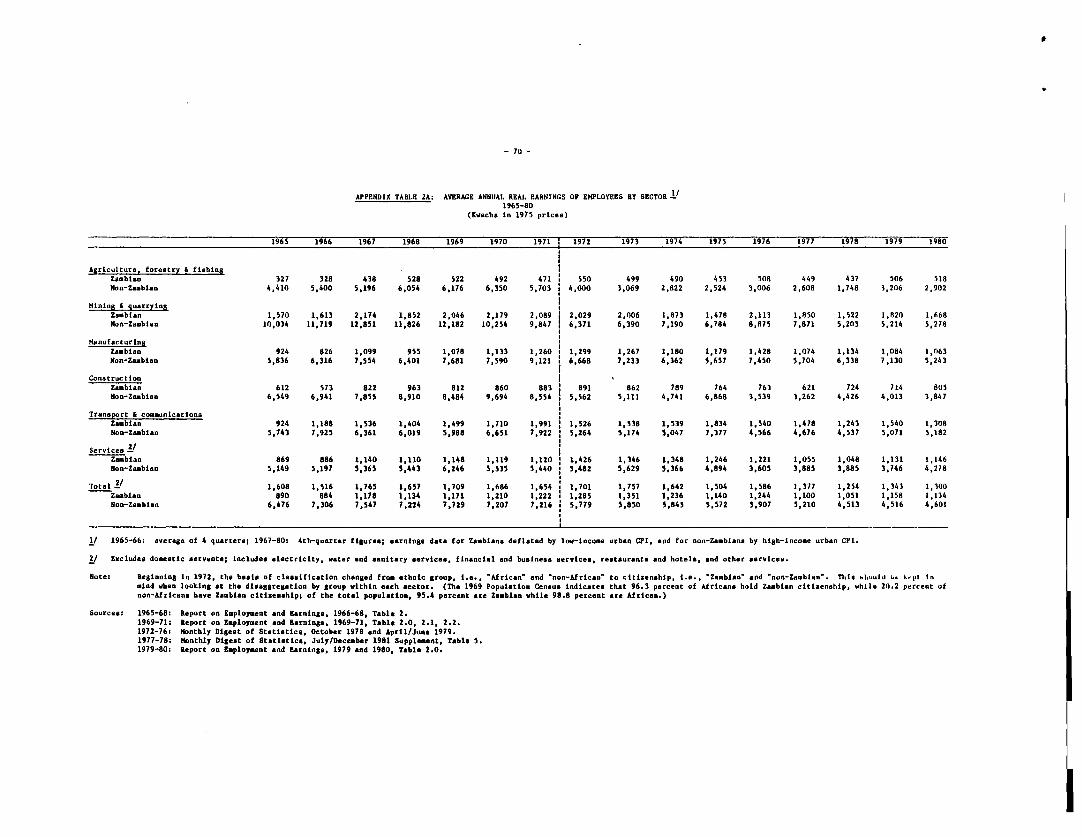
- 70 -
APPENDIX TABLE 2A: AVERAcE ANNUAL REAL EARNINGS OF ENPLOYEES BY SECTOR V,1965-80
(Pwacha In 1975 prices)
1965 1966 1967 1968 1969 1970 1971 T 1972 1973 1974 1975 1976 1977 1978 1979 1980
Agriculture, forestry & fishingZasbian 327 328 438 528 522 492 471 i 550 499 490 453 508 449 437 506 518Non-Zmbian 4,410 5,400 5,196 6,054 6,176 6,350 5,703 1 4,000 3,069 2,822 2,524 3,006 2,608 1,748 3,206 2,902
Nfining A quarrying IZambian 1,570 1,613 2,174 1,852 2,046 2,179 2,089 2,029 2,006 1,873 1,478 2,113 1,850 1,522 1,820 1,668Non-Zmblan 10,034 11,719 12,851 11,826 12,182 10,254 9,847 1 6,371 6,390 7,190 6,784 8,875 7,871 5,203 5,214 5,278
Manufacturing
Zambian 924 826 1,099 955 1,078 1,133 1,260 I 1,299 1,267 1,180 1,179 1,428 1,074 1,134 1,084 1,063Non-Zambian 5,836 6,316 7,554 6,401 7,681 7,590 9,121 * 6,668 7,233 6,362 5,657 7,450 5,704 6,338 7,130 5,243Construction
Zambian 612 573 822 963 812 860 883 ' 891 862 789 764 763 621 724 714 805Non-Zasbian 6,549 6,941 7,855 8,910 8,484 9,694 8,554 1 5,562 5,111 4,741 6,868 3,539 3,262 4,426 4,013 3,847Tranaport & co-unicatlona
Zambian 924 1,188 1,536 1,404 1,499 1,710 1,991 1,526 1,538 1,539 1,834 1,540 1,478 1,243 1,540 1,308Non-Zambian 5,743 7,925 6,361 6,019 5,988 6,651 7,922 5,264 5,174 5,047 7,377 4,566 4,676 4,537 5,071 5,182Services
Zambian 869 886 1,140 1,110 1,148 1,119 1,120 1,426 1,346 1,348 1,246 1,221 1,055 1,048 1,131 1,146Non-Zasbian 5,149 5,197 5,365 5,443 6,246 5,535 5,440 5,482 5,629 5,366 4,894 3,605 3,885 3,885 3,746 4,278Total 2/ 1,608 1,516 1,765 1,657 1,709 1,686 1,654 1,701 1,757 1,642 1,504 1,586 1,377 1,254 1,343 1,300Zambian 890 884 1,178 1,134 1,171 1 210 1,222 1,285 1,351 1,236 1,140 1,244 1,100 1,051 1,158 1,134ino-Zambian 6,476 7,306 7,547 7,224 7,729 7,207 7,216 5,779 5,850 5,845 5,572 5,907 5,210 4,513 4,516 4,601
I/ 1965-66: average of 4 quarters; 1967-80: 4th-quarter figures; earnings data for Zambian& deflated by low-income urban CPI, and for non-Zaeblana by high-incoe urban CPI.2/ Excludes doestic servants; includes electricity, water and sanitary services, financial ard business services, restaurants and hotels, snd other services.Note: Beginning In 1972, the basis of classification changed from ethnic group, I.e., "African' and 'non-African' to citizenship, i.e., 'Zambian' and 'non-Zasbian'. Thti hbould i. k,pt tnmind when looking at the dioaggregation by group within each sector. (The 1969 Population Census Indicates that 96.3 percent of Africans hold Zablan citizenship, while 20.2 percent ofnon-Africans have Zasbian citizenship; of the total population, 95.4 percent are Zambian while 98.8 percent ere African.)Sources: 1965-68: Report on Employment and Earnings, 1966-68, Table 2.
1969-71: Report on Employment and Earnings, 1969-71, Table 2.0, 2.1, 2.2.1972-76, Monthly Digest of Statistics, October 1978 and April/June 1979.1977-78: Monthly Digest of Statistics, July/December 1981 Supplement, Table 5.1979-80: Report on Employment end Earnings, 1979 and 1980, Table 2.0.
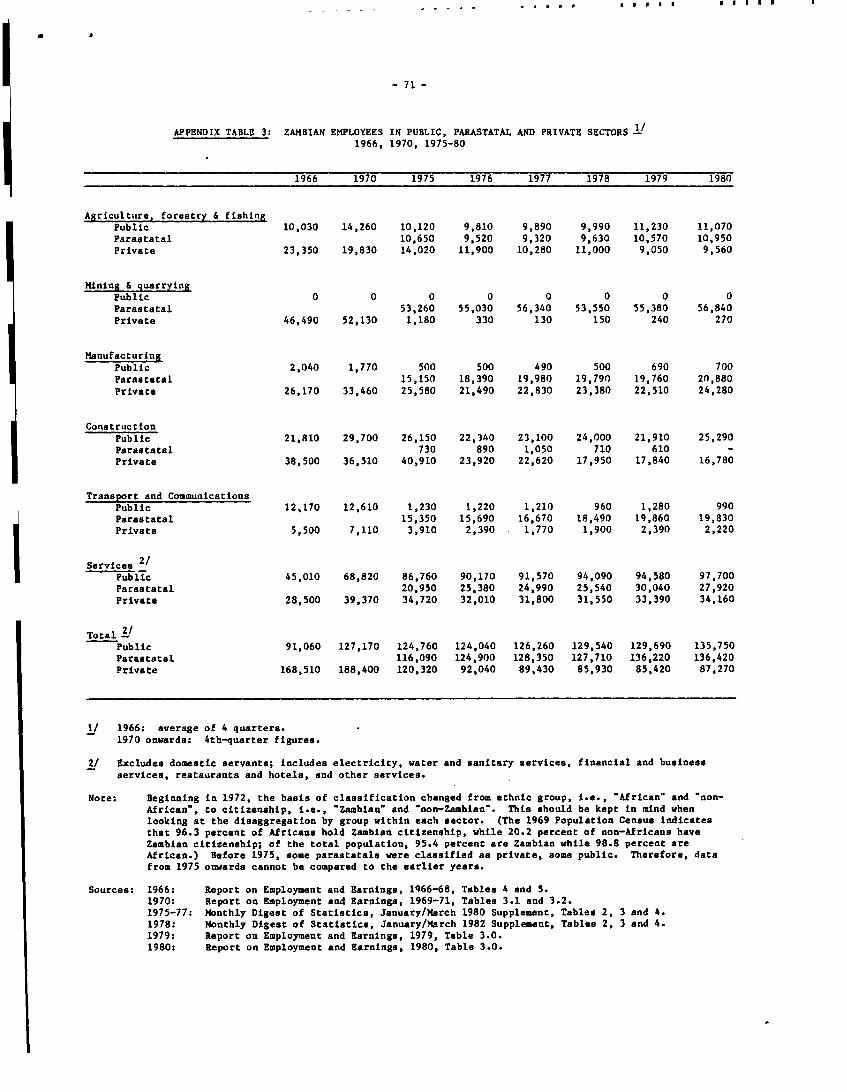
APPENDIX TABLE 3: ZAMBIAN EMPLOYEES IN PUBLIC, PARASTATAL AND PRIVATE SECTORS1966, 1970, 1975-80
1966 1970 1975 1976 1977 1978 1979 1980
Agriculture, forestry 6 fishingPublic 10,030 14,260 10,120 9,810 9,890 9,990 11,230 11,070Parastatal
10,650 9,520 9,320 9,630 10,570 10,950Private 23,350 19,830 14,020 11,900 10,280 11,000 9,050 9,560
Mining & quarryingPublic
0 0 0 0 0 0 0 0Parastatal 53,260 55,030 56,340 53,550 55,380 56,840Private 46,490 52,130 1,180 330 130 150 240 270
Manufacturing
Public 2,040 1,770 500 500 490 500 690 700Parastatal 15,150 18,390 19,980 19,790 19,760 2n,880Private 26,170 33,460 25,580 21,490 22,830 23,380 22,510 24,280
Construction
Public 21,810 29,700 26,150 22,340 23,100 24,000 21,910 25,290Parastatal 730 890 1,050 710 610 -Private 38,500 36,510 40,910 23,920 22,620 17,950 17,840 16,780
Transport and CommunicationsPublic 12,170 12,610 1,230 1,220 1,210 960 1,280 990Parastatal
15,350 15,690 16,670 18,490 19,860 19,830Private 5,500 7,110 3,910 2,390 1,770 1,900 2,390 2,220
Services 2/Public 45,010 68,820 86,760 90,170 91,570 94,090 94,580 97,700Parastatal
20,950 25,380 24,990 25,540 30,040 27,920Private 28,500 39,370 34,720 32,010 31,800 31,550 33,390 34,160
Total 2/Public 91,060 127,170 124,760 124,040 126,260 129,540 129,690 135,750Parastatal
116,090 124,900 128,350 127,710 136,220 136,420Private 168,510 188,400 120,320 92,040 89,430 85,930 85,420 87,270
1/ 1966: average of 4 quarters.1970 onwards: 4th-quarter figures.
2/ Excludes domestic servants; includes electricity, water and sanitary services, financial and businessservices, restaurants and hotels, and other services.
Note: Beginning in 1972, the basis of classification changed from ethnic group, i.e., 'African' and "non-African", to citizenship, i.e., 'Zambian' and 'non-Zambian". This should be kept in mind whenlooking at the disaggregation by group within each sector. (The 1969 Population Census indicatesthat 96.3 percent of Africans hold Zambian citizenship, while 20.2 percent of non-Africans haveZambian citizenship; of the total population, 95.4 percent are Zambian while 98.8 percent areAfrican.) Before 1975, some parastatals were classified as private, some public. Therefore, datafrom 1975 onwards cannot be compared to the earlier years.
Sources: 1966: Report on Employment and Earnings, 1966-68, Tables 4 and 5.1970: Report on Employment and Earnings, 1969-71, Tables 3.1 and 3.2.1975-77: Monthly Digest of Statistics, January/March 1980 Supplement, Tables 2, 3 and 4.1978: Monthly Digest of Statistics, January/March 1982 Supplement, Tables 2, 3 and 4.1979: Report on Employment and Earnings, 1979, Table 3.0.1980: Report on Employment and Earnings, 1980, Table 3.0.
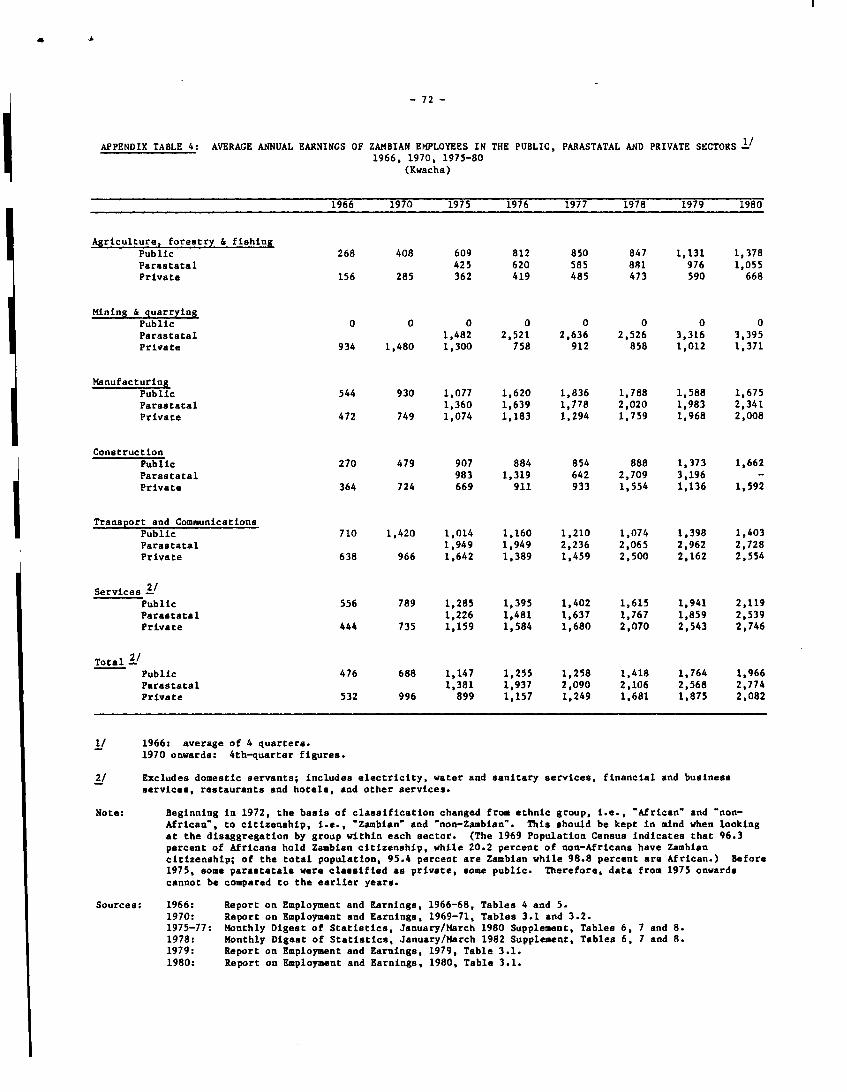
0~~~~~~~~~~~~~~~~~~~~~~~~~~~~~~~~~~~~~~~~~~~~~~~~~~~~~~~~~~~~~~~~~~~~~~~~~~~~~~~~~~~~~~~~~~~~~~~~~~~~~
APPENDIX TABLE 4: AVERAGE ANNUAL EARNINGS OF ZAMBIAN EMPLOYEES IN THE PUBLIC, PARASTATAL AND PRIVATE SECTORS-Y1966, 1970, 1975-80(Kwacha)
1966 1970 1975 1976 1977 1978 1979 1980
Agriculture, forestry & fishingPublic
268 408 609 812 850 847 1,131 1,378Parastatal 425 620 585 881 976 1,055
Private 156 285 362 419 485 473 590 668
Mining & quarryingPublic
0 0 0 0 0 0 0 0Parastatal
1,482 2,521 2,636 2,526 3,316 3,395Private 934 1,480 1,300 758 912 858 1,012 1,371
Manufacturing
Public 544 930 1,077 1,620 1,836 1,788 1,588 1,675Parastatal
1,360 1,639 1,778 2,020 1,983 2,341Private 472 749 1,074 1,183 1,294 1,759 1,968 2,008
Construction
Public 270 479 907 884 854 888 1,373 1,662Parastatal
983 1,319 642 2,709 3,196 -Private
364 724 669 911 933 1,554 1,136 1,592
Transport and CommunicationsPublic
710 1,420 1,014 1,160 1,210 1,074 1,398 1,403Parastatal
1,949 1,949 2,236 2,065 2,962 2,728Private
638 966 1,642 1,389 1,459 2,500 2,162 2,554
Services 2/Public
556 789 1,285 1,395 1,402 1,615 1,941 2,119Parastatal 1,226 1,481 1,637 1,767 1,859 2,539
Private 444 735 1,159 1,584 1,680 2,070 2,543 2,746
Total 2/Public
476 688 1,147 1,255 1,258 1,418 1,764 1,966Parastatal
1,381 1,937 2,090 2,106 2,568 2,774Private
532 996 899 1,157 1,249 1,681 1,875 2,082
1/ 1966: average of 4 quarters.1970 onwards: 4th-quarter figures.
2/ Excludes domestic servants; includes electricity, water and sanitary services, financial and businessservices, restaurants and hotels, and other services.
Note: Beginning in 1972, the basis of classification changed from ethnic group, i.e., 'African' and 'non-African", to citizenship, i.e., 'Zambian' and 'non-Zambian". This should be kept in mind when lookingat the disaggregation by group within each sector. (The 1969 Population Census indicates that 96.3percent of Africans hold Zambian citizenship, while 20.2 percent of non-Africans have Zambiancitizenship; of the total population, 95.4 percent are Zambian while 98.8 percent are African.) Before1975, some parastatals were classified as private, some public. Therefore, data from 1975 onwardscannot be compared to the earlier years.
Sources: 1966: Report on Employment and Earnings, 1966-68, Tables 4 and 5.1970: Report on Employment and Earnings, 1969-71, Tables 3.1 and 3.2.1975-77: Monthly Digest of Statistics, January/March 1980 Supplement, Tables 6, 7 and 8.1978: Monthly Digest of Statistics, January/March 1982 Supplement, Tables 6, 7 and 8.1979: Report on Employment and Earnings, 1979, Table 3.1.1980: Report on Employment and Earnings, 1980, Table 3.1.
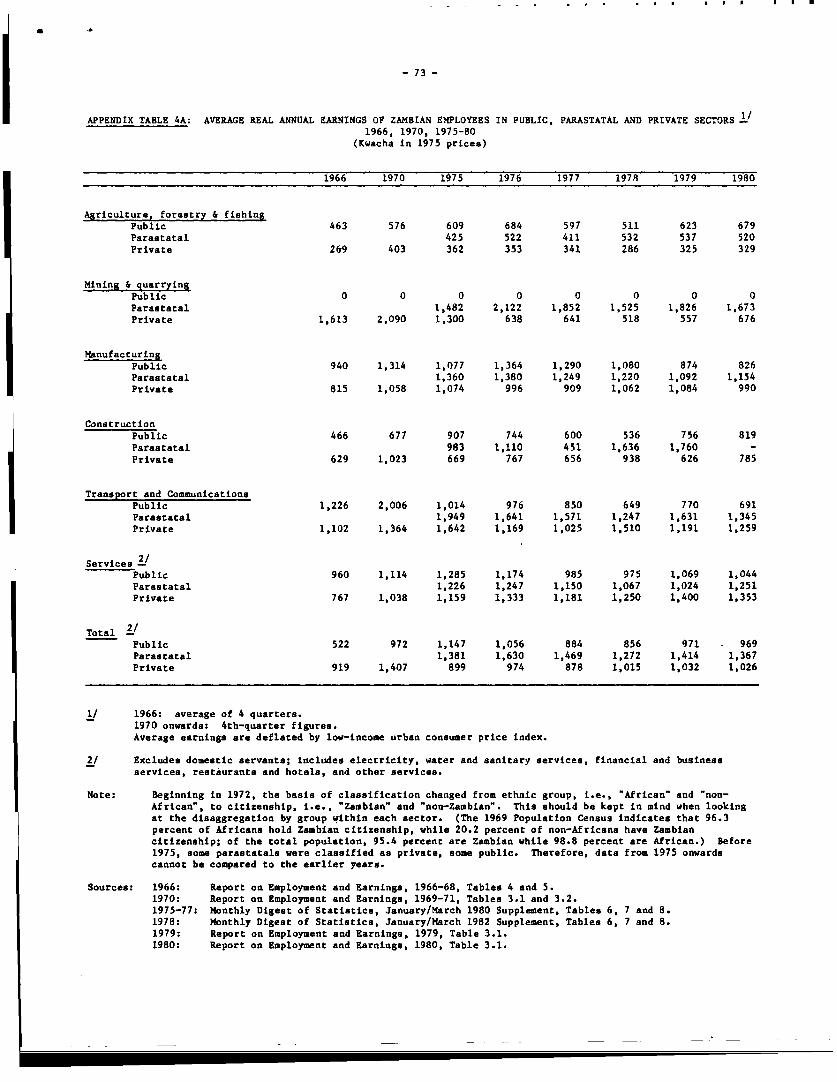
- 73 -
APPENDIX TABLE 4A: AVERAGE REAL ANNUAL EARNINGS OF ZAMBIAN EMPLOYEES IN PUBLIC, PARASTATAL AND PRIVATE SECTORS It1966, 1970, 1975-80(Kwacha in 1975 prices)
1966 1970 1975 1976 1977 197R 1979 1980
Agriculture, forestry & fishingPublic 463 576 609 684 597 511 623 679Parastatal
425 522 411 532 537 520Private 269 403 362 353 341 286 325 329
Mining & quarryingPublic 0 0 0 0 0 0 0 0Parastatal
1,482 2,122 1,852 1,525 1,826 1,673Private 1,613 2,090 1,300 638 641 518 557 676
ManufacturingPublic 940 1,314 1,077 1,364 1,290 1,080 874 826Parastatal 1,360 1,380 1,249 1,220 1,092 1,154Private 815 1,058 1,074 996 909 1,062 1,084 990
ConstructionPublic 466 677 907 744 600 536 756 819Parastatal
983 1,110 451 1,636 1,760 -Private 629 1,023 669 767 656 938 626 785
Transport and CommunicationsPublic 1,226 2,006 1,014 976 850 649 770 691Parastatal 1,949 1,641 1,571 1,247 1,631 1,345Private 1,102 1,364 1,642 1,169 1,025 1,510 1,191 1,259
Services2/Public 960 1,114 1,285 1,174 985 975 1,069 1,044Parastatal
1,226 1,247 1,150 1,067 1,024 1,251Private 767 1,038 1,159 1,333 1,181 1,250 1,400 1,353
Total 2tPublic 522 972 1,147 1,056 884 856 971 969Parastatal 1,381 1,630 1,469 1,272 1,414 1,367Private 919 1,407 899 974 878 1,015 1,032 1,026
I/ 1966: average of 4 quarters.1970 onwards: 4th-quarter figures.Average earnings are deflated by low-income urban consumer price index.
2/ Excludes domestic servants; includes electricity, water and sanitary services, financial and businessservices, restiurants and hotels, and other services.
Note: Beginning in 1972, the basis of classification changed from ethnic group, i.e., 'African' and 'non-African", to citizenship, i.e., 'Zambian' and 'non-Zambian". This should be kept in mind when lookingat the disaggregation by group within each sector. (The 1969 Population Census indicates that 96.3percent of Africans hold Zambian citizenship, while 20.2 percent of non-Africans have Zambiancitizenship; of the total population, 95.4 percent are Zambian while 98.8 percent are African.) Before1975, some parastatala were classified as private, some public. Therefore, data from 1975 onwardscannot be compared to the earlier years.
Sources: 1966: Report on Employment and Earnings, 1966-68, Tables 4 and 5.1970: Report on Employment and Earnings, 1969-71, Tables 3.1 and 3.2.1975-77: Monthly Digest of Statistics, January/March 1980 Supplement, Tables 6, 7 and 8.1978: Monthly Digest of Statistics, January/March 1982 Supplement, Tables 6, 7 and 8.1979: Report on Employment and Earnings, 1979, Table 3.1.1980: Report on Employment and Earnings, 1980, Table 3.1.
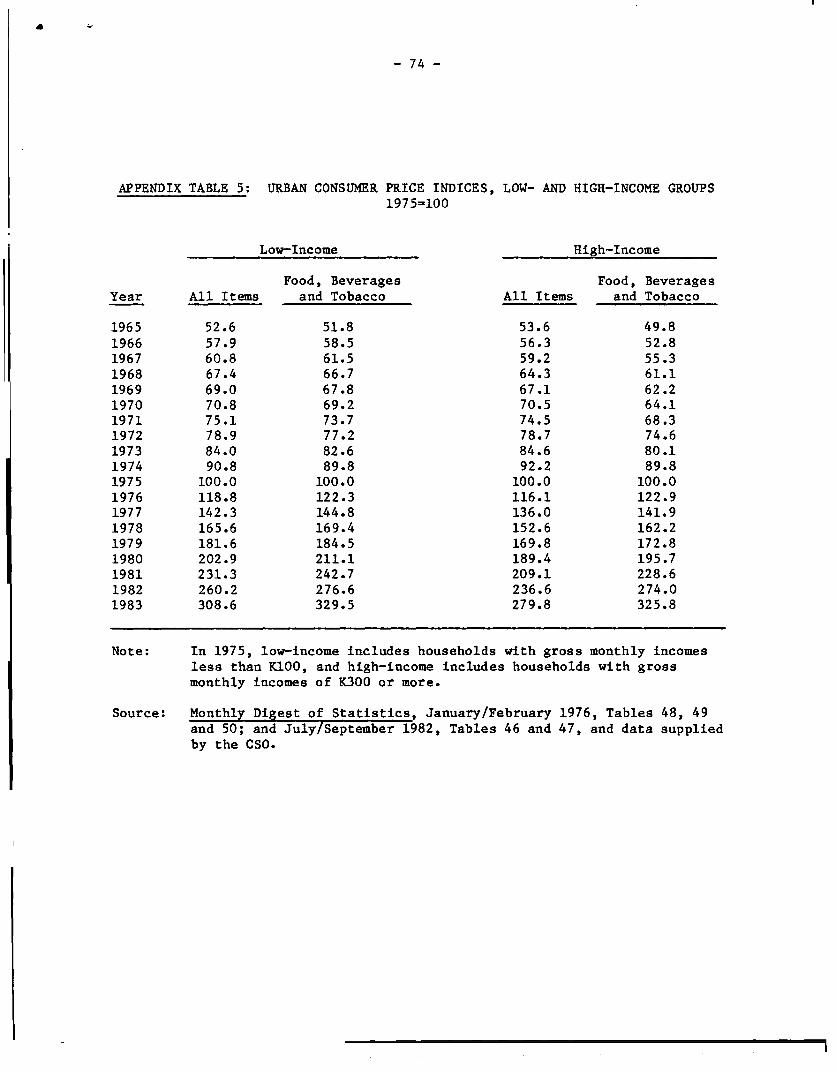
a~~~~~~~~~~~~~~~~~~~~~~~~~~~~~~~~~~~~~~~~~~~~~~~~~~~~~~~~~~~~~~~~~~~~~~~~~~~~~~~~~~~~~~~~~~~~~~~~~~~~~
- 74 -
APPENDIX TABLE 5: URBAN CONSUMER PRICE INDICES, LOW- AND HIGH-INCOME GROUPS1975=100
Low-Income High-Income
Food, Beverages Food, BeveragesYear All Items and Tobacco All Items and Tobacco
1965 52.6 51.8 53.6 49.81966 57.9 58.5 56.3 52.81967 60.8 61.5 59.2 55.31968 67.4 66.7 64.3 61.11969 69.0 67.8 67.1 62.21970 70.8 69.2 70.5 64.11971 75.1 73.7 74.5 68.31972 78.9 77.2 78.7 74.61973 84.0 82.6 84.6 80.11974 90.8 89.8 92.2 89.81975 100.0 100.0 100.0 100.01976 118.8 122.3 116.1 122.91977 142.3 144.8 136.0 141.91978 165.6 169.4 152.6 162.21979 181.6 184.5 169.8 172.81980 202.9 211.1 189.4 195.71981 231.3 242.7 209.1 228.61982 260.2 276.6 236.6 274.01983 308.6 329.5 279.8 325.8
Note: In 1975, low-income includes households with gross monthly incomesless than K100, and high-income includes households with grossmonthly incomes of K300 or more.
Source: Monthly Digest of Statistics, January/February 1976, Tables 48, 49and 50; and July/September 1982, Tables 46 and 47, and data suppliedby the CSO.
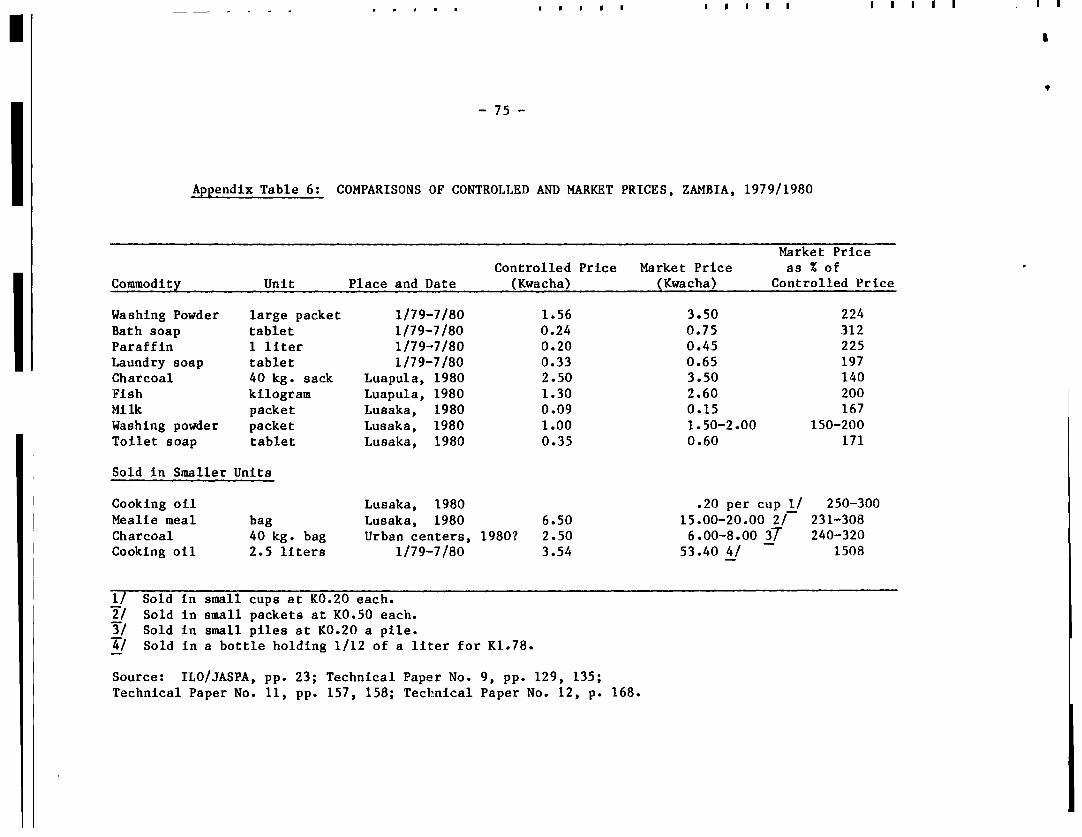
- 75
Appendix Table 6: COMPARISONS OF CONTROLLED AND MARKET PRICES, ZAMBIA, 1979/1980
Market PriceControlled Price Market Price as X ofCommodity Unit Place and Date (Kwacha) (Kwacha) Controlled Price
Washing Powder large packet 1/79-7/80 1.56 3.50 224Bath soap tablet 1/79-7/80 0.24 0.75 312Paraffin 1 liter 1/79-7/80 0.20 0.45 225Laundry soap tablet 1/79-7/80 0.33 0.65 197Charcoal 40 kg. sack Luapula, 1980 2.50 3.50 140Fish kilogram Luapula, 1980 1.30 2.60 200Milk packet Lusaka, 1980 0.09 0.15 167Washing powder packet Lusaka, 1980 1.00 1.50-2.00 150-200Toilet soap tablet Lusaka, 1980 0.35 0.60 171
Sold in Smaller Units
Cooking oil Lusaka, 1980 .20 per cup 1/ 250-300Mealie meal bag Lusaka, 1980 6.50 15.00-20.00 2/ 231-308Charcoal 40 kg. bag Urban centers, 1980? 2.50 6.00-8.00 37 240-320Cooking oil 2.5 liters 1/79-7/80 3.54 53.40 4/ 1508
1/ Sold in small cups at KO.20 each.2/ Sold in small packets at KO.50 each.3/ Sold in small piles at KO.20 a pile.4/ Sold in a bottle holding 1/12 of a liter for K1.78.
Source: ILO/JASPA, pp. 23; Technical Paper No. 9, pp. 129, 135;Technical Paper No. 11, pp. 157, 158; Technical Paper No. 12, p. 168.