Embed Size (px)
Citation preview

Public Agenda Showcase: Senior Staff
August 7, 2012

Private Business and Vocational Schools
Dr. Dan Cullen, Interim Deputy Director for Academic Affairs
2

PBVS Act of 2012
…to provide for the protection, education, and welfare of the citizens of this State; to provide for the education, protection, and welfare of the students of its PBVSs; and to facilitate and promote quality education and responsible, ethical, business practices in each of the… schools...
3

Challenges
Charge came with no funds nor staff. IBHE’s charge is different than ISBE’s, resulting in
the need to develop all new processes. Transfer of authority was rough. Agency staff losses delayed progress.
4

Accomplishments
Completed deliverables are few. Infrastructure-building is progressing. Staffing:
Division funds now support one full-time Assistant Director and another A.D. is dedicated to PBVS;
IS staff are working on PBVS at highest priority.
5

Goals Hire Division staff - July 15 through December 15
PBVS Professional—Promote Nina Tangman to Assistant Director. Date: Accomplished July 15, 2012
1st PBVS Support Date: Planned August 15, 2012
PBVS Professional—Move Assistant Director Franklin to PBVS. Date: Planned September 15, 2012
2nd PBVS Support Date: Tentatively planned October 15, 2012
3rd PBVS Professional Date: Tentatively planned December 15, 2012
Senior PBVS Professional Date: Tentatively planned December 15, 2012
6

Goals Develop application materials—Ongoing through
August 15, 2012 Application for annual renewal
Date: Due August 15, 2012 Application for five-year renewal
Due August 15, 2012 Modification of existing approval application
Due August 15, 2012 New program application
Due August 15, 2012 New school application
Due August 15, 2012 Exemption application
Due August 15, 2012
7

Goals Develop online systems—Ongoing through
calendar year 2012 Establish verification system.
Due August 15, 2012 Set up fees and invoicing system.
Due August 20, 2012 Establish change request system.
Due August 25, 2012 Bring up online applications system.
Due September 1, 2012 Go live with online student complaint system.
Due September 15, 2012 Establish system for schools to apply for exemptions.
Due October 1, 2012 Develop a database of approved schools and programs (i.e., a
program inventory). Due December 15, 2012
8

Goals
Applications reviews—September 16, 2012 through October 15, 2012 to establish process, then ongoing Begin accepting applications.
Date: Due October 15, 2012
9

Goals
Begin of five-year reviews August 30, 2012 through October 1, 2012 to establish
process, then ongoing Develop cohort system.
Date: Due August 30, 2012 Begin of five-year reviews.
August 30, 2012 through October 1, 2012 to establish process, then ongoing
Notify schools which cohort they are in. Date: September 1, 2012
Review first cohort. Date: Planned to commence October 1, 2012
10

Goals
Begin of annual reviews of existing schools’ authority—August 30, 2012 through September 15, 2012 to establish process, then ongoing Notify schools which five-year review cohort they are in.
Date: September 1, 2012 Review applications.
Date: Planned to commence September 15, 2012
11
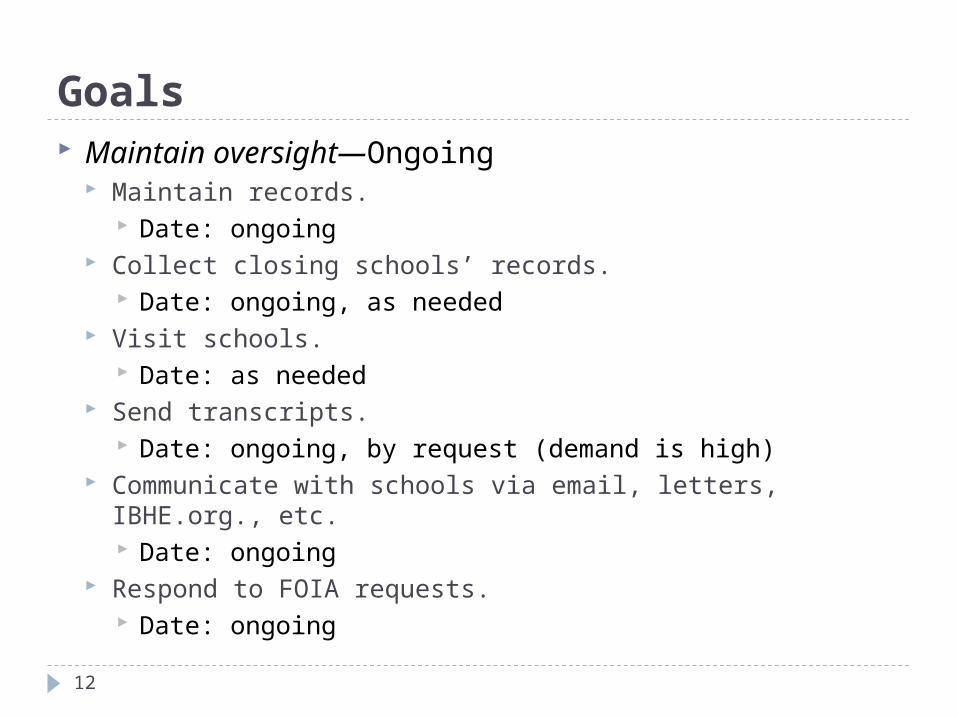
Goals Maintain oversight—Ongoing
Maintain records. Date: ongoing
Collect closing schools’ records. Date: ongoing, as needed
Visit schools. Date: as needed
Send transcripts. Date: ongoing, by request (demand is high)
Communicate with schools via email, letters, IBHE.org., etc. Date: ongoing
Respond to FOIA requests. Date: ongoing
12

Goals
Establish Advisory Council—July 5, 2012 through December 4, 2012 Create and make public application.
Date: Accomplished July 5, 2012 Review applications and select members.
Due August 15, 2012 Hold initial meeting.
Date: Planned September 25, 2012 Put Council charter in place.
Date: Planned December 4, 2012
13

Performance Funding
Dr. Alan Phillips, Deputy Director for Fiscal Affairs, Budgeting and Information Technology
14

Performance Funding Objective
To develop a performance funding model for public universities that is…
Linked directly to the Goals of the Illinois Public Agenda and the principles of Public Act 97-320
Equipped to recognize and account for each university’s mission and set of circumstances
Adjustable to account for changes in policy and priorities
Not prescriptive in how to achieve excellence and success
Include a performance funding component in the FY2013 Higher Education Budget Submission
15

What We Accomplished
Developed a workable performance funding model. Model and budget recommendations were approved
by both the Steering Committee and the IBHE Board. A performance funding component was included in
the FY 2013 Higher Education Budget Submission. The IBHE funding recommendation was included in
the Governor’s Budget without change. The General Assembly allocated funding based on
performance consistent with the IBHE performance funding recommendation.
16

FY 2013 Performance Funding Results
At Public Universities: 0.5% of the base ($6.15M) was re-allocated
based on the performance funding model
At Community Colleges: $360K was re-allocated based on their model’s
six performance measures
17

Refinement Effort
18

Members of the Refinement Committee
Refinement Committee members include representatives from: Each public university ICCB The Illinois Education Research Council (IERC) The Lieutenant Governor’s Office IBHE Staff
19

Purpose of the Refinement Effort Refine the existing measures and subcategories to
the extent possible or find replacement measures that capture what we are trying to measure in a better way (i.e. research expenditures, low income students, cost per FTE, etc.).
Identify additional measures and subcategories to add to the model.
Identify better and more current sources of data.
See if there is a better way to scale (normalize) the data.
Discuss ways to account for other factors (i.e. hospitals, medical schools, veterinary schools, dental schools, etc.)
20

Measures and Subcategories Measures
Bachelors degrees Masters degrees Doctoral and professional degrees Undergraduate degrees per 100 FTE Education and general spending per completion (may
change) Research and public service expenditures (FY09-11)
Subcategories Low income (Pell eligible/MAP recipient) Adult (age 25 and older) Hispanic Black, non-Hispanic STEM & health care (by CIP code)
21

Refinement Goals Identify additional measures and subcategories to
add to the model.
Want to keep the additional measures and subcategories to a minimum.
The Committee reviewed a number of additional measures and subcategories. Many of the measures had significant drawbacks. Data still does not exist for many of the measures
Possible additions: Cost per credit hour and cost per completion Credit hour accumulation and time to degree Performance of students requiring remediation
22
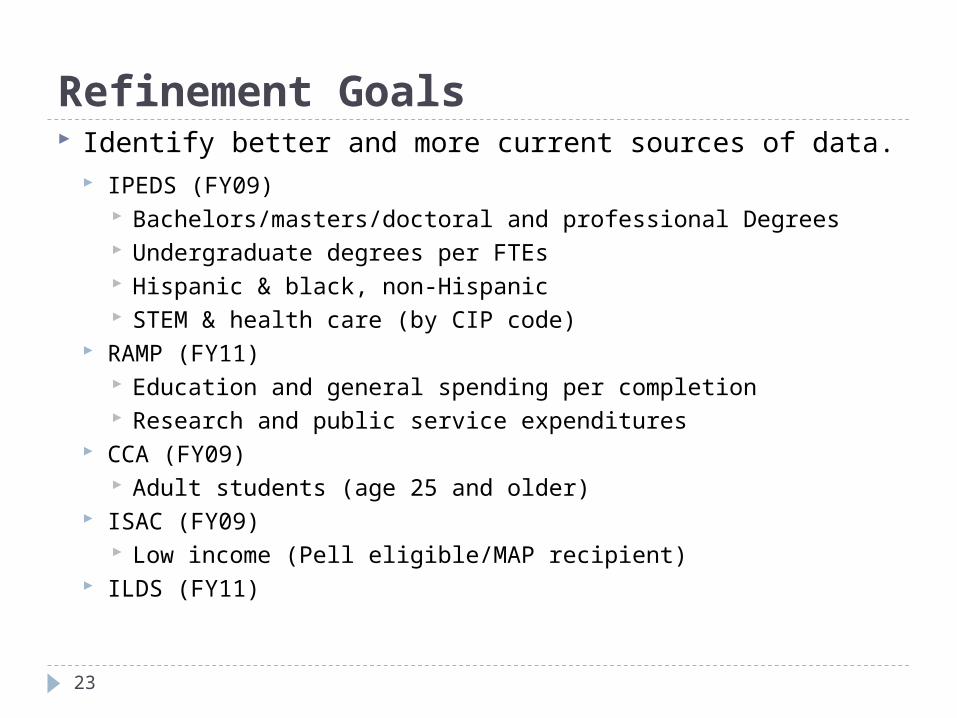
Refinement Goals Identify better and more current sources of data.
IPEDS (FY09) Bachelors/masters/doctoral and professional Degrees Undergraduate degrees per FTEs Hispanic & black, non-Hispanic STEM & health care (by CIP code)
RAMP (FY11) Education and general spending per completion Research and public service expenditures
CCA (FY09) Adult students (age 25 and older)
ISAC (FY09) Low income (Pell eligible/MAP recipient)
ILDS (FY11)
23

Additional Sources of Data Cost Study ILDS (FY11) – not ready for prime time
Age (date of birth) Ethnicity Location (county/zip code) ACT/SAT High school GPA/class rank (%) Entry enrollment (first time/transfer) Enrollment (part-time/full-time) Remediation (GED/math/language arts) Credit Hours (total/by term) Income (Pell eligible/MAP recipient) First generation
24

Refinement Goals Determine if there is a better way to scale
(normalize) the data.
25
The Question:
How can you scale the data so that the
measures are roughly equivalent, without
creating more problems than you solve, while
at the same time keeping it simple enough
that an individual can understand what you
did?

Refinement Goals
Discuss ways to account for other factors (i.e. hospitals, medical schools, veterinary schools, dental schools, etc.)
The Committee agreed to look at removing these entities from the calculation for spending per completion.
We are looking at using the Cost Study, which does not include most of this information in the calculation of cost data.
26

Refinement Issues Data continues to be an issue.
Although we have received our first ILDS submission, the quality of the data is not sufficient to use at this time.
The timeliness of data also continues to be a problem.
Quality We still have significant challenges in defining quality as it
pertains to universities, and determining how best to assess that quality.
Subcategories First generation Geographic area
27

Next Steps
The next Performance Funding Refinement Committee meeting is scheduled for the 28th of August.
The next Performance Funding Steering Committee meeting is scheduled for the 11th of September.
28

Image Building
Jonathan Lackland, Deputy Director for Advancement, External & Governmental Relations
29

Goal
Further IBHE’s advancement strategy through the development of professional branding material such as brochures & signage.
30

IBHE Brochure Contents
Who We Are Academic Facts
Top five majors at Illinois colleges/universities Number of certificates/degrees awarded by
community college, public & private institution Number of bachelor degrees awarded by year
31

IBHE Presentation Contents
IBHE Responsibilities Organizational Chart History Board Composition Higher Education Information, i.e. number of
community colleges, colleges & universities, etc.
32

IBHE Presentation Contents
Tuition & Fee Information IBHE Statutory Responsibilities Performance Funding Illinois Public Agenda for College & Career
Success
33

Logo Benefits
Serves as the visual representation of an organization
Establishes organizational credibility Communicates the goals and objectives of the
organization Offers an organization a recognizable identity
34

35

36

Agency Slogan
Promoting an Educated Illinois
37

38

Dropout Re-Enrollment Made Real
Dr. Arthur Sutton, Deputy Director for Diversity & Outreach
39

Project Objective
Establishing a resource base
Philanthropic organizations
Areas of specialized giving
40

Methodology
Initial contact methods
Correspondence with potential funders
Solicitation structure
41

Results
Overview of initial responses
Higher Education Cooperation Act (HECA) grants awarded
Question of state solicitation
Foundation meetings and site visits
42

Report
Conclusion
Recommendations
43

Accountability
Karen Helland, Acting Director of Research, Analysis, Policy Development and Publications
44

Accountability Report for each GoalGoal 1: Increase educational attainment to match the best-performing U.S. states and world countries, 2010. Goal 2: Ensure college affordability for students, families, and taxpayers, 2011.
Goal 3: Increase the number of high-quality postsecondary
credentials to meet the demands of the economy and an increasingly global society, 2012.
Goal 4: Better integrate Illinois’ educational, research, and innovation assets to meet economic needs of the state and its regions, 2013.
45

46
A Blueprint for the Future of Illinois [ IBHE | Home ]
How We Are Doing: The Public Agenda Accountability Report
Goal 1 Goal 2 Goal 3 Goal 4
Increase Educational Attainment Ensure College Affordability Address Workforce Needs Enhance Economic Growth
Education Level of Adult Population Age 25-34 with an associate’s degree or higher.
Education Level of Adult Population Age 25-64 with a college degree or certificate.
High School Graduation. Ethnic/ racial group rates.
Family Income. Percent required to attend public 4-year.
Family Income. Percent required to attend private 4-year.
Family Income. Percent required to attend public 2-year.
Family Income. Percent required to pay tuition and fees at public 2-year.
NEW! Complete College America’s National Goal. 60% of adults 25-64 with a college degree or certificate by 2025.
AA/AS Degrees and Certificates. Associate-degree granting institutions
BA/BS Degrees. Baccalaureate-degree granting institutions
Research and Development. Academic expenditures.
Cooperative Work Study Grants. Employment after graduation
www.1illinois.org
State Accountability Reports

Goal 3
Increase the number of high-quality postsecondary credentials to meet the demands of the economy and an increasingly global society.
47

Recommendations
1) Increase the number of people with high-quality postsecondary credentials to ensure the state has an educated workforce and an engaged citizenry.
2) Improve transitions all along the education pipeline.
3) Increase the number of postsecondary degrees in fields of critical skills shortages.
48

49
Twelve Performance Measures, including Number of student completions Student pass rates for licensure exams Number of student transfers Completions in critical fields
Benchmarked against Illinois trends over one-, five-, and ten-year periods Five best-performing U.S. states Selected competitor / neighboring states
Performance Measures & Benchmarks

Report Format
One report for each goal A section for each recommendation Each recommendation has a summary page with
performance measures, data, and arrows Public Agenda Baseline (data available in 2008) Year 4 (most recent data) 2018: Year 10 (data available in 2018)
Page for each performance measure Table with Baseline, Year 4 and Year 10 Chart comparing Illinois to four high population states,
five surrounding states, and U.S.
50

Performance Measures Credentials Produced Complete College America Completions: < Bachelor’s Completions: Bachelor’s State Licensure Pass Rates Adult Education Transitions Program Quality
Benchmarked Against Illinois Trends 5 Best-Performing States 4 High-Population States 5 Neighboring States
Goal 3: Recommendation 1
51

Completions
52
Performance Measures Public
Agenda Baseline
Year 4 2018
Year 10 Benchmarks
Credentials Produced: Number of postsecondary certificates and associate’s and baccalaureate degrees produced each year by all institutions in the state.
145,513
162,144
See CCA Goal
Illinois trend over one-year period;
Five best-performing U.S. states; and
Selected competitor/ neighboring U.S. states
NEW! Complete College America. Number of postsecondary certificates (one-year and longer), associate’s degrees, and baccalaureate degrees produced each year by all institutions in the state.
112,246
130,906
152,246 The 2018 goal is based on the
national goal of 60% of adults ages 25-64 by 2025.
Completions. Percent of certificates and associate’s degrees granted as a proportion of Full-Time Equivalencies (FTE) at associate-degree granting institutions.
21.8%
23.2%
43.7%
Five best-performing U.S. states; and
Selected competitor/ neighboring U.S. states
Completions. Baccalaureate degrees awarded as a proportion of FTEs at baccalaureate-degree granting institutions.
23.1%
22.1%
23.5%
Five best-performing U.S. states; and
Selected competitor/ neighboring U.S. states

Illinois Compared to Other States
53
52,700 52,622 47,379
25,894 18,990 16,631 12,033 11,636 9,041 8,941
Source: U.S. Department of Education, Institute of Education Sciences, National Center for Education Statistics, IPEDS Data Center.
Increase in Annual Number of Total Credentials Produced, Academic Year 2008 to 2011
Increase in the total number of undergraduate certificates, associate’s degrees, and bachelor’s degrees from 2008 to 2011. The increase in Illinois is less than the increases in other high population states (green) and Iowa, a surrounding state (yellow).

Complete College America
54
117,
565
119,
448
124,
875
130,
906
112,246
116,646
121,046
125,446
129,846
134,246
138,646
143,046
147,446
151,846
156,246
160,646
165,046
169,446
173,846
178,246
182,646
187,046
2008 2009 2010 2011 2012 2013 2014 2015 2016 2017 2018 2019 2020 2021 2022 2023 2024 2025
Goal of 60 x 2025Current Production
Complete College America Goal
Source: IBHE and Complete College America, 2012 .
2018 is the 10th year of the Public Agenda
2008 is the base year of the Public Agenda
2025 is the year to reach the 60% goal for Complete
College America
Achieving the Goal of 60 x 2025 will require institutions to produce more than 4,000 additional graduates each year until 2025 (approximately 4.0 percent each year).

Credentials per Enrollment
51.5%
47.4%
44.7%
37.3%
35.9%
44.7%
35.9%
32.7%
23.2%
22.3%
21.7%
20.8%
18.7%
18.0%
17.9%
17.8%
(1) Alaska
(2) Louisiana
(3) Kentucky
(4) Georgia
(5) Wisconsin
(3) Kentucky
(5) Wisconsin
Florida
Illinois (20)
Iowa
U.S.
Missouri
Indiana
New York
California
Texas
Midpoint 43.7 %
Source: U.S. Department of Education, Institute of Education Sciences, National Center for Educational Statistics, Academic Years 2007-08 and 2010-11.
Certificates and Associate's Degrees Granted as Percentage of Enrollment
55

Credentials: Other Measures
56
State Licensure Pass Rates. Pass rates of first-time candidates taking a state licensure or certification examination
Certified Public Accountants
Five best-performing U.S. states; and
Selected competitor/ neighboring U.S. states
40.83% 42.19% 46.68% Registered Nurses
86.4% 88.1% 92.1%
Licensed Practical Nurses
90.7% 90.8% 93.7%
Adult Education Transitions. Percentage of adults enrolling in postsecondary coursework that complete adult education or remedial coursework and transition to certificate or degree programs.
Data by state on adult education transitions are not available for comparison in 2012.
Illinois trends over one- five- and ten-year periods;
Five best-performing U.S. states; and
Selected competitor/ neighboring U.S. states
Program Quality. Quality of certificate and degree programs as assessed by employers, graduate schools, alumni, and other stakeholders.
Data by state on quality assessments are not available for comparison in 2012. Illinois
institutions use a variety of tools to measure quality but there is no statewide methodology.
Illinois trends over one- five- and ten-year periods;
Five best-performing U.S. states; and
Selected competitor/ neighboring U.S. states
Performance Measures Public
Agenda Baseline
Year 4 2018
Year 10 Benchmarks
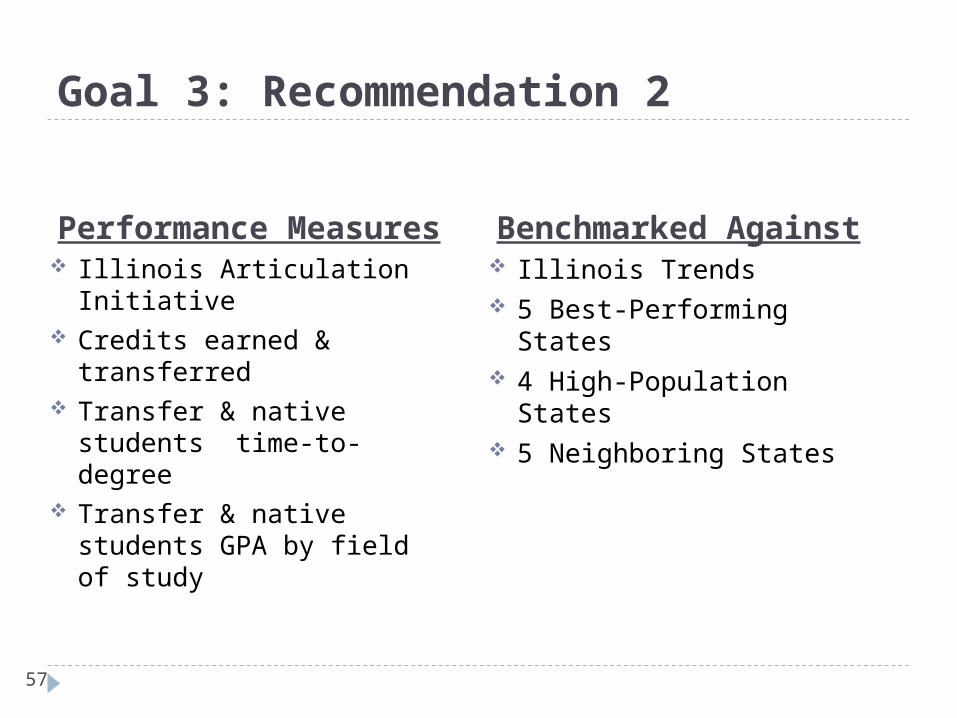
Performance Measures Illinois Articulation Initiative Credits earned &
transferred Transfer & native students
time-to-degree Transfer & native students
GPA by field of study
Benchmarked Against Illinois Trends 5 Best-Performing States 4 High-Population States 5 Neighboring States
Goal 3: Recommendation 2
57

Transitions Along Pipeline
58
Performance Measures Public
Agenda Baseline
Year 4 2018
Year 10 Benchmarks
Percentage of Illinois institutions participating in the Illinois Articulation Initiative.
60.0%
72.4%
100.0% Illinois trends over one-, five-,
and ten-year periods;
Ratio of credits earned to credits accepted in transfer.
Data by state on credits earned versus accepted are not available for comparison
in 2012.
Illinois trends over one-, five-, and ten-year periods ;
Five best-performing U.S. states; and
Selected competitor/ neighboring U.S. states
Average time-to-degree and credits-attempted-to-credits-earned for transfer students compared to native students. Data by state to compare the
performance of transfer students to native students are not available for
comparison in 2012.
Illinois trends over one-, five-, and ten-year periods;
Five best-performing U.S. states; and
Selected competitor/ neighboring U.S. states
Average GPA by field of study for transfer students compared to native students.
Illinois trends over one-, five-, and ten-year periods;
Five best-performing U.S. states; and
Selected competitor/ neighboring U.S. states

Illinois Articulation Initiative
59

Performance Measures Supply & demand by
occupation Pass rates of licensure
exams in critical fields
Benchmarked Against Illinois Trends 5 Best-Performing States 4 High-Population States 5 Neighboring States
Goal 3: Recommendation 3
60

Supply & Demand by Occupation
61
Performance Measures Public
Agenda Baseline
Year 4 2018
Year 10 Benchmarks
Absolute number of certificates and degrees awarded in critical fields benchmarked against demand in those fields.
40.0%
46.7%
100.0% Illinois demand
Supply Demand
Completions (Average)
Job Openings (Average)
2008 Employment
Projected 2018
Employment
Employment Change
Baccalaureate Degree* Registered Nurses (baccalaureate & associate) 5,821 4,238 1,583 110,739 133,772 23,033
Long-Term Projections
Supply vs. Demand Occupational Titles
Comparison of Annual Completions to Annual Job Openings for Illinois Occupations in Critical Fields by Credential
Sources: Illinois Department of Employment Security, 2008-2018 long-term projections and U.S. Department of Education, Institute of Education Sciences, National Center for Educational Statistics completions in academic years 2009-10 and 2010-11.

Licensure Examinations
62
Performance Measures Public
Agenda Baseline
Year 4 2018
Year 10 Benchmarks
Pass rates on licensure examinations in critical fields.
Registered Nurses
Five best-performing U.S. states
86.4% 88.1% 92.1% Certified Public Accountants
40.83% 42.19% 46.68% Radiological Technologists/Techs
84.8% 84.3% 89.7%
Licensed Practical Nurses
90.7% 90.8% 93.7%

63
Performance Measures Baseline to Year 4
Credentials Produced
Complete College America
Efficiency for < Bachelor’s
Efficiency for Bachelor’s
State Licensure Pass Rates
Illinois Articulation Initiative
Supply & Demand by Occupation
Licensure Examinations, Critical Fields
Summary: Credentials

Questions & Comments
64
Private Business & Vocational Schools, Dan Cullen
Performance Funding, Al Phillips
Image Building, Jonathan Lackland
Dropout Re-enrollment Made Real, Arthur Sutton
Accountability, Karen Helland