Embed Size (px)
Citation preview

PUBLIC ACCOUNTABILITY FROM OUR OWN
HISTORY
(Extract from the stone inscription of King Mihindu IV in the 10th Century A.D. at Minhintale as shown in the above photograph)
“Whatever is spent on the maintenance of the Maha Paya on revenue collections and on the renovation of
works shall be entered in the register. (From the particulars therein) a statement of accounts shall be
made with the concurrence of (those at the respective) places of business and such entries as are found
false shall be expunged from the accounts. The statements of accounts shall (thus) be placed in a casket
under lock (and key). Every month sheet of accounts (so deposited) shall be made public and (fresh)
statement of accounts prepared from them. From the 12 statements of accounts (so made) during the year
there shall be compiled a balance sheet at the end of (each) year which shall be read out in the midst of the
community of monks and be (thus finally) disposed of. Those employees who infringe these rules shall be
made to pay gedand fines and be dismissed from the service”.
(Extract from an inscription of King Mihindu IV-10th Century AD – at Mihintale, Sri Lanka – Source : Empgraphia Zeylanica
Vol. 1- Page 75)
The Way forward of the Auditor General’s Department
The Auditor General’s Department commenced in the year 1799 is to
further expand the services performance over two centuries for the achievement
of high expectations by providing strength to Sri Lanka undergoing a development process and being the foremost guide of public financial control, is committed to serve the
general public of Sri Lanka and to assist the Government and Semi-Government
Institutions to achieve their targets.
FOREWORD
I am pleased to present my report for the year 2013 on the performance
and discharge of the duties and functions devolved on the Auditor General
in pursuance of the provisions in Article 154 of the Constitution of the
Democratic Socialist Republic of Sri Lanka for the direction of the
independent examination on the effective and efficient maintenance of the
Parliamentary control on the Public Finance devolved on Parliament in
pursuance of provisions in Article 148 of the Constitution.
The Annual Report is presented as the Seventh installment of my report presented to Parliament and
arrangements have already been taken to table the other reports under the following seven installments.
First Installments Ministries and Departments
Second Installment State Corporations Authorities and Boards
Third Installment Statutory and Other Fund Accounts
Fourth Installment Foreign Funded Projects
Fifth Installment Provincial Councils
Sixth Installment Local Authorities
Eighth Installment Performance Audits and Other Special Audits
The possibility of achieving a substantial number of targets set out in the Corporate Plan for the years 2012
to 2015 and the Action Plan for the year under review is a matter to rejoice. The tiring efforts made by the
Audit Officers in the audit approach and reporting on the financial statements that should be prepared by
the Semi-Government institutions in accordance with the Sri Lanka Accounting Standards prepared in
compliance with the International Financial Reporting Standards which became operative from the year
2012 and the financial statements that should be prepared in accordance with the Sri Lanka Public Sector
Accounting Standards by the other Government and Semi-Government Institutions are commendable.
Even though the progress of work done by the Auditor General’s Department of Sri Lanka as the
independent observer of the public finance and functions with the foremost objective of serving for the
benefit of the overall Sri Lankan public is not so matured to be measured in accordance with methodologies
adopted by the western and other developed countries it has to be admitted that the audits done in the year
2013 had provided effective results to the public. The contribution to the country through the State Audit is
briefly described in the Chapter on “To the Country Through State Audit”. A special course of action for
the improvement of the knowledge of Audit Officers was undertaken in the year under review. Special
training programmes were conducted on the Financial Audit, the Computerized Audit and the Audit of
Local Authorities while classes in Tamil Language were conducted for the improvement of the knowledge
in Tamil Language.
With a view to signifying the important of State Audit and with the objective of strengthening the audit
process, March 19 was declared as the Audit Day and the Audit Day was celebrated on 19 March 2014 at
the Head Office and the Offices of the Provincial Assistant Auditors General.
Action was taken in the latter part of the year 2013 to fill 20 vacancies in the posts of Assistant Auditors
General and 08 posts Deputy Auditors General included in the approved cadre which enabled the
regularization of audit work and reporting process. These appointments formed a foundation for the
strengthening of the supervision of auditing and reporting. A Gazette Notification was published for
holding a competitive examination to fill about 400 vacancies representing about 1/3 of the approved posts
in the cadre of Audit Examiners. It is expected to fill these vacancies in the latter part of the year 2014 or
the first half of the year 2015. Action is also being taken for filling 79 posts of Superintendents of Audit.
The preparation of the Services Minutes, which had been hampering working of the Department was
finalized and the Minute on the Sri Lanka Audit Service and the Minute on the Audit Examiners Service
had been approved by the Public Service Commission on 17 September 2012 and 03 January 2014
respectively and forwarded to the Secretary to the President for the clearance by the Cabinet of Ministers.
Nevertheless, the Secretary to the President, based on a request made by the Audit Examiners’ Service
Association, made a request for the preparation of a Combined Service Minute. Accordingly a Combined
Service Minute prepared by amalgamating both Service Minutes had been forwarded to the Secretary to the
President.
The reporting patterns of the Department were reviewed and the reporting formats and patterns were
revised as an inducement for reporting in accordance with the modern auditing practices and effective audit
reporting. Specially the reporting formats relating to the Provincial Councils were revised and an
awareness programme on the use of those formats was held for the Sabaragamuwa Provincial Council in
March 2014.
In fulfilling the long felt need of the Department, a Training Complex with residential facilities, a
conference hall, an indoor sports facility and an administrative unit was constructed at a cost of Rs.158
million near Batuhenawatta, Hidellana, Ratnapura. Plans have been made for the opening of the Centre for
Public Audit Training & Developments of Auditor General’s Department (CPATD) before the end of
October 2014. Through this Training School, it is expected to provide professional training to the Officers
of the Department under a systematic training programme to achieve training activities in line with
international levels and for the training of Internal Audit Officers. Arrangements have been made for the
maintenance of the institution without being a heavy financial burden to the General Treasury.
Significant courses of action were taken in connection with the welfare, religious and social welfare
activities for the benefit of the officers. An evaluation of the officers who had completed 30 years service
in the Department was carried out. A special programme aimed at strengthening the finance of the Welfare
Association of the Department was held in the year 2014. A special achievement during the year 2013 was
the assistance provided to the Committee on Public Accounts and the Committee on Public Enterprises to
conduct their affairs actively and effectively in the examination of the Audit Reports of Government and
Semi-Government institutions tabled in Parliament in making public financial control more meaningful.
The compilation of the history of the 215 years of the Department established in the year 1799 for
preservation for the benefit of the posterity was commencement in the latter part of the year 2013 and it is
expected to launch the book in October 2014.
I thank entire staff of the Department who assistant me in the performance of the statutory function, the
firms of Chartered Accountants in public practice which carried out the assisted audits, the Institute of
Chartered Accountants of Sri Lanka, the Auditee Institutions, the Secretary to the President and his staff
who assisted in the administrative matters of the Department, the Secretary to the Ministry of Finance and
Planning and staff, the Public Service Commission, the Salaries and Cadre Commission and the other State
Institutions which assisted in the administrative, the International Development Association which
contributed to the improvement of the physical and human resources of the Department and the Supreme
Audit Institution of the countries such as India, Malaysia, Japan, the Republic of South Korea and the
People’s Republic of China which contributed to the training of my staff.
I thank the Honourable Chairman and the Honourable Members of the Committee on Public Accounts and
the Honourable Chairman of the Committee on Public Enterprises and the Sub-Committees and the
Honourable Members who reviewed the Audit Reports of 250 Auditee Institutions and the Secretary
General of Parliament and his staff.
H.A.S. Samaraweera
Auditor General
30 September 2014.
CONTENTS
Part I General Matters Page
Our Role in Public Accountability 1
Out Mandate and Independence 3
Out Client Base
Organization Structure
8
10
International Relations, Staff Training and Development 14
Religious and Corporate Social Responsibility
17
Part II Reporting on our Performance
To the Country through the State Audit 20
Part III Financial Statements
Financial Statements for the year ended 31 December 2013
25
Part IV Summary Audit Review of State Audit Sectors
Management of Public Enterprises 37
Foreign Funded Projects 48
Provincial Councils 50
Local Authorities 52
Special Investigations and Examination of Public Representations 54
Part V Detailed Review of State Audit Sectors
Public Revenue Management 58
Public Expenditure Management 68
Management of Public Debt 73
Banking 77
Defence and Urban Development 87
Power and Energy 90
Education 102
Health Services 106
Transport 108
National Heritage and Religious Affairs 114
Tourism Industry 118
Diplomatic Relations 120
Water Supply and Sanitation 123
Port Services 129
Part VI Auditor General’s Comments on Selected Areas
Purchase and Storage of Paddy 134
Protection of Fauna and Flora 136
1
AN
NU
AL
RE
PO
RT
OF
TH
E A
UD
IT
OR
GE
NE
RA
L
- 2
01
3
_____________________________________________________________________________________________________________________________________________________________
Our Role on Public Accountability ____________________________________________________________________________________________________________________
According to the responsibility and the authority devolved on the Parliament in pursuance of the provisions
in Article 148 of the Constitution of the Democratic Socialist Republic of Sri Lanka, money and resources
for the Government and Semi-Government Institutions are apportioned from the Annual Appropriation Act.
The major role of the Auditor General is to carry out an independent examination whether the
managements of the institutions to which the custody of the resources are entrusted have discharged the
public accountability devolved on them and report to Parliament and Parliament had confidence in the
Auditor General for the independent assessment of the Government affairs carried out and the accounting
thereof. The public accountability comprises the following main stages.
Functions of Public Accountability
The functions of public accountability are as follows.
Authorization of Government expenditure on supplies and services by the Parliament
through the Appropriation Act.
Preparation of annual financial statements/ accounts by Ministries, Departments and other Public
Enterprises.
The audit of those financial statements/ accounts and affairs of the Public Entities by the Auditor
General.
Review of the Audit Reports submitted to Parliament by the Auditor General by the two
Parliamentary Committees called the Committee on Public Accounts and the Committee on Public
Enterprises by summoning the parties concerned.
The Committee on Public Accounts and the Committee on Public Enterprises examine the Audit
Reports and issue recommendations.
The Institutions concerned respond to those reports.
The three central agencies within the institutional and organizational framework of accountability are the
Parliament, the General Treasury and the Auditor General‟s Department as the Supreme Audit Institution.
The Auditor General, through his reports, makes the Parliament aware whether the provisions made for the
public institutions through the Budget have been utilized with economy, efficiency, effectiveness and
preservation of the environment. By expressing an opinion on the financial statements of the Public
Enterprises, Funds and Projects, the status of the financial statements presented by those institutions is
communicated to the interested parties. According to the existing Statutory provisions, the Auditor General
2
AN
NU
AL
RE
PO
RT
OF
TH
E A
UD
IT
OR
GE
NE
RA
L
- 2
01
3
enjoys an independent mandate to determine the extent and scope his audits. Aside from the criminal
issues which are taken up the Commission to Investigate Allegations of Bribery or Corruption and the
Criminal Investigation Department, the audit findings and recommendations arising from the financial,
performance, regularity and systems audits of the auditee institutions are tabled in Parliament in the three
languages for the benefit of the performance of the public sector and the enhancement of the financial
control and the efficiency of the auditee institutions. As in the other Commonwealth Countries, the
Committee on Public Accounts and the Committee on Public Enterprises of Sri Lanka have the remit that
permits reference to any current and historical Government financial authority across the whole of the
Public Sector. The Auditor General‟s Department of Sri Lanka and the two oversight Committees of
Parliament need to maintain close relationship. The Auditor General‟s Department of Sri Lanka provides
the two Committees with reports based on financial audits, performance audits and investigative audit
reports of comprehensive coverage that from the basis for their work.
3
AN
NU
AL
RE
PO
RT
OF
TH
E A
UD
IT
OR
GE
NE
RA
L
- 2
01
3
_____________________________________________________________________________________________________________________________________________________________
Our Mandate and Independence _____________________________________________________________________________________________________________________
Article 154 of the Constitution of Democratic Socialist Republic of Sri Lanka provides the mandate for the
Auditor General to audit the public sector institutions. The Auditor General should audit the accounts of
all Departments of Government, the Office of the Cabinet of Ministers, the Judicial Service Commission,
the Public Service Commission, the Parliamentary Commissioner for Administration, the Secretary General
of Parliament and Commissioner of Elections, Local Authorities, the Public Corporations and Business or
other Undertakings vested in the Government under any written law.
Nevertheless the right to audit the Government Companies registered under the Companies Act is not
devolved on the Auditor General. This position has to be pointed out as a weaknesses in the public
financial control.
The duties and functions devolved on the Auditor General are further expanded by the following Statutes.
(a) Part II of the Finance Act, No. 38 of 1971 which provides for the Audit of Public Corporations.
(b) Section 23 of the Provincial Councils Act, No. 42 of 1987 which provides for the Audit of
Provincial Councils.
(c) Section 219 of the Municipal Councils Ordinance (Cap. 252) which provides for the Audit of
Municipal Councils.
(d) Section 181 of the Urban Councils Ordinance (Cap 255) which provides for the Audit of Urban
Councils.
(e) Section 172 of the Pradeshiya Sabha Act, No. 15 of 1987 which provides for the Audit of
Pradeshiya Sabhas.
(f) Section 58 of the Agrarian Development Act, No. 46 of 2000 which provides for the Audit of
Agrarian Development Councils.
(g) Section 9 of the Sports Act, No. 47 of 1993 which provides for the Audit of Sports Associations.
The Auditor General has also been vested with authority under Article 154 of the Constitution to engage the
services of audit firms in public practice to assist him in his work. He also has the power to obtain the
assistance of specialists in the examination of any technical, professional or scientific problems relevant to
the Audit. According to Article 154(5) of the Constitution, the Auditor General or any person authorized
by him shall in the performance and discharge of his duties and functions be entitled-
to have access to all books, records, returns and other documents.
to have access to stores and other property, and
to be furnished with such information and explanations as may be necessary for the
performance of such duties and functions.
4
AN
NU
AL
RE
PO
RT
OF
TH
E A
UD
IT
OR
GE
NE
RA
L
- 2
01
3
Our Independence
The independence of the Auditor General is preserved to a great extent by the Constitution and the Article
153 states that –
There shall be an Auditor General who shall be appointed by the President with the recommendation of the Constitutional Council and who shall hold office during good behavior”. Further the Auditor General can be removed from the Office “on his removal by the President on account of ill health or physical or mental infirmity or on his removal by the President upon an address of Parliament.
As stated in the Article 153 of the Constitution
The salary of the Auditor General shall be determined by Parliament, shall be charged on the Consolidated Fund and shall not be diminished during his term of office. Nevertheless, the prevailing position with regard to the determination of the salary of the Auditor General has not reached the level expected in the Constitutional provisions.
The Auditor General does not come under the supervision of any Minister or officer of the Government.
Though the functional independence of the Auditor General has been safeguarded by the Constitution, the
financial and administrative independence of the Auditor General is constrained by the Executive due to the
Constitutional and legislative provisions on the subject. The Auditor General must be completely free from
all obligations to any individual or an institution and must be free from arbitrary retaliation. The
dependence of the Auditor General on the Executive for his resources in terms of both financial resources
and manpower would harm the truly independent nature of the audit performed on behalf of the Parliament.
As such, elaborate safeguards have to be provided by the Parliament through legislation to ensure the
functional and financial independence of the Auditor General.
5
AN
NU
AL
RE
PO
RT
OF
TH
E A
UD
IT
OR
GE
NE
RA
L
- 2
01
3
As present the Auditor General depends on the General Treasury for his budget and the resource allocation
for his Department is not limited to fiduciary risks. Unlike in the other Commonwealth countries, the
budget of the Auditor General in Sri Lanka is neither subject to scrutiny or approval by a legislative
committee nor are there any safeguards against the Executive Control over his budget. The administrative
control over the appointments, promotion, transfer, disciplinary issues, salaries and the other administrative
matters of the staff of the Auditor General‟s Department rested earlier with the Secretary to the President
and later on with the adoption of the Seventeenth Amendment to the Constitution, those powers have been
vested in the Public Service Commission. Even under the present arrangement the Auditor General faces
difficulties with regard to the filling of vacancies in his cadre, where he has not been delegated with the
authority by the Public Service Commission. The Audit Service is a special service from the point of view
of the independence it should enjoy, as in the case of the Judicial Service which comes under the purview
of a specialized body, the Judicial Service Commission. Further, as the Constitution does not include the
Auditor General in the “Public Officers Exception List”, all administrative regulations of the Government,
as described in the Establishments Code, are applicable to the Auditor General himself and to his staff.
This further constrains the administrative independence of the Auditor General. There have been many
instances where this lack of administrative control over his officers had significantly hampered the audit
work.
From the point of view of the staff turnover, the staff turnover of the Auditor General‟s Department is very
heavy. The recruitment of a staff most suitable to conduct the audits of the financial statements in prepared
by the institutions in compliance with the Sri Lanka Accounting Standards or the Sri Lanka Public Sector
Accounting Standards in accordance with the Local and the International Auditing Standards and obtaining
their services continuously should be based on attractive allowances. The value addition to the economy of
the country through the State Audit is of high significance. It should be pointed out that this aspect has so
far not received the due attention of any of the Sectors.
In the year 1977, the “Lima Declaration” of the International Organization of Supreme Audit Institutions
(INTOSAI) also determined the principle of independence of the Government Auditing in methodological
and professional terms. In the “Mexico Declaration” after 30 years, the XIX Congress of International
Organization of Supreme Audit Institutions (2007 in Mexico) defined these requirements in more concrete
terms and identified eight major requirements for the independence of the Supreme Audit Institution as
reproduced below.
In order to guarantee the appropriate and effective legal position of SAIs within the state,
independence of Supreme Audit Institution (SAI) has to be defined clearly in the
Constitution and the legislation, including provisions for its de facto application.
SAI should have available necessary and reasonable Human, Material and Monetary resources and
should manage their own budgets without interference or control from Government and its
authorities.
The condition for appointment of SAI Heads and the members of collegial institutions should be
specified in legislation. The independence of Heads of the SAI and members of collegial
institutions can only be ensured if they are given appointments with sufficiently long and fixed
6
AN
NU
AL
RE
PO
RT
OF
TH
E A
UD
IT
OR
GE
NE
RA
L
- 2
01
3
terms with removal only by a process independent from the executive. This allows them to carry
out their mandates without fear of retaliation.
In order to fulfill their Mandate effectively, SAIs have to be independent in the choice of audit
issues, in their audit planning and in the implemented audit methods, as well as in the conduct of
their audits and in the organization and management of their officers. Therefore SAIs should be
free from direction or interference from the Legislature or the Executive while fulfilling their audit
tasks.
Auditors are entitled to be granted free, timely and unrestricted access to all documents and
information they might need for the proper discharge of their responsibilities.
SAIs should report on the results of their audit work at least once a year, however they are free to
report more often, if considered necessary.
SAIs should be free to decide the content of their audit reports and to publish and disseminate their
reports, once they have been formally tabled to deliver to the appropriate authority.
SAIs should have independent procedures for follow-up audits to ensure that audited entities
properly address their observations and recommendations and that corrective actions are taken.
Apart from the Mexico Declaration consisting the above requirements, the latest development in this regard
is that on 22 December 2011, the 66th United Nations General Assembly adopted the Resolution
A/RES/66/209 “Promoting the efficiency, accountability, effectiveness and transparency of public
administration by strengthening, Supreme Audit Institutions”. Similarly, Resolutions on the Independence
and Functions of the State Audits were adopted at the Conference held in the year 2013 in Beijing, People‟s
Republic of China and the Commonwealth Heads of Government Meeting held in Sri Lanka in the year
2013. It should be pointed out that the parties responsible have not made an effective contribution to the
implementation of these resolutions. Though the initial stage for the enactment of a National Audit Act for
the interpretation of the functions of the audit was launched as far back as the first decade of 2000, the
results thereof have not been achieved thus far. This situation has hampered the proper implementation of
the Parliamentary control of the public finance.
Audit Scope
The Auditor General, at his discretion, decides on the scope of audit, and in this regard, he is guided by
the prevailing Standards as introduced in terms of the provisions in the Sri Lanka Accounting and Auditing
Standards Act, No. 15 of 1995 and the conventions and the best practices relating to audit as adopted by
the Institute of Chartered Accountants of Sri Lanka (ICASL), the International Organization of Supreme
Audit Institutions (INTOSAI) the Asian Organization of Supreme Audit Institutions (ASOSAI), and the
guidance provided by the Committee on Public Accounts (COPA) and the Committee on Public Enterprises
(COPE) Further to the above, as regards the Public Corporations, the Finance Act, No. 38 of 1971 defines
the scope of audit to be considered by the Auditor General in more specific terms and it requires the
Auditor General to render three distinct statutory reports, viz. the detailed report to the management of the
Corporation, a report for publication together with the Annual Report of such Corporation and another
7
AN
NU
AL
RE
PO
RT
OF
TH
E A
UD
IT
OR
GE
NE
RA
L
- 2
01
3
separate report to Parliament. The scope of the audit as defined in the Finance Act, requires the Auditor
General to examine as far as possible, and as far as necessary, the following.
Whether the organization, systems, procedures, books, records and other documents have
been properly and adequately designed from the point of view of the presentation of
information to enable a continuous evaluation of the activities of the corporation, and
whether such systems, procedures, books, records and other documents are in effective
operation;
Whether the conduct of the corporation has been in accordance with the laws, rules and regulations
relevant to the corporation and whether there has been fairness in the administration of the
corporation;
Whether there has been economy and efficiency in the commitment of funds and utilization of such
funds;
Whether systems of keeping moneys and the safeguarding of property are satisfactory;
Whether the accounts audited have been so designed as to present a true and fair view of the affairs
of the corporation in respect of the period under consideration with due regard being given to
principles of accountancy, financing and valuations; and
Any such other matters as the Auditor General may deem necessary.
According to the above matters included in the Finance Act passed in the year 1971, it is evident that Sri
Lanka had made efforts in the 1970s decade to enter the sphere of Value for Money Audits, that is
Performance Audit,. As such our modest opinion is that Sri Lanka has been a forerunner of the concept of
Value for Money Audit or the Performance Audit. The Auditor General can examine only the affairs of the
Government and Semi-Government Institutions. However, the wholly or partly owned Government
Companies incorporated under the Companies Act do not come under the purview of the Auditor General.
Apart from the direct investment in capital by the General Treasury, there is a trend in the Public
Enterprises incorporating public companies under the Companies Act. Similarly the examination of the
Private Organizations connected with Government activities as well do not come under the purview of the
Auditor General. Nevertheless, he can look into the activities of a public entity in contracting with or
directly funding a private entity and how the public entity has monitored the private entity‟s use of public
funds. The Auditor General does not have any authority to question matters of Government Policy.
Nevertheless, the Auditor General could consider how well the public entities had implemented such
decisions in keeping with the applicable policy and the laws or whether the decision making process met
the relevant Standards. The powers for quasi-judicial function in relation to the Local Authorities and the
Universities have been vested in the Auditor General through the relevant Acts and Ordinances.
Accordingly, the powers for the imposition of surcharges on the Local Authorities and the Universities is
vested the Auditor General.
8
AN
NU
AL
RE
PO
RT
OF
TH
E A
UD
IT
OR
GE
NE
RA
L
- 2
01
3
Our Client Base
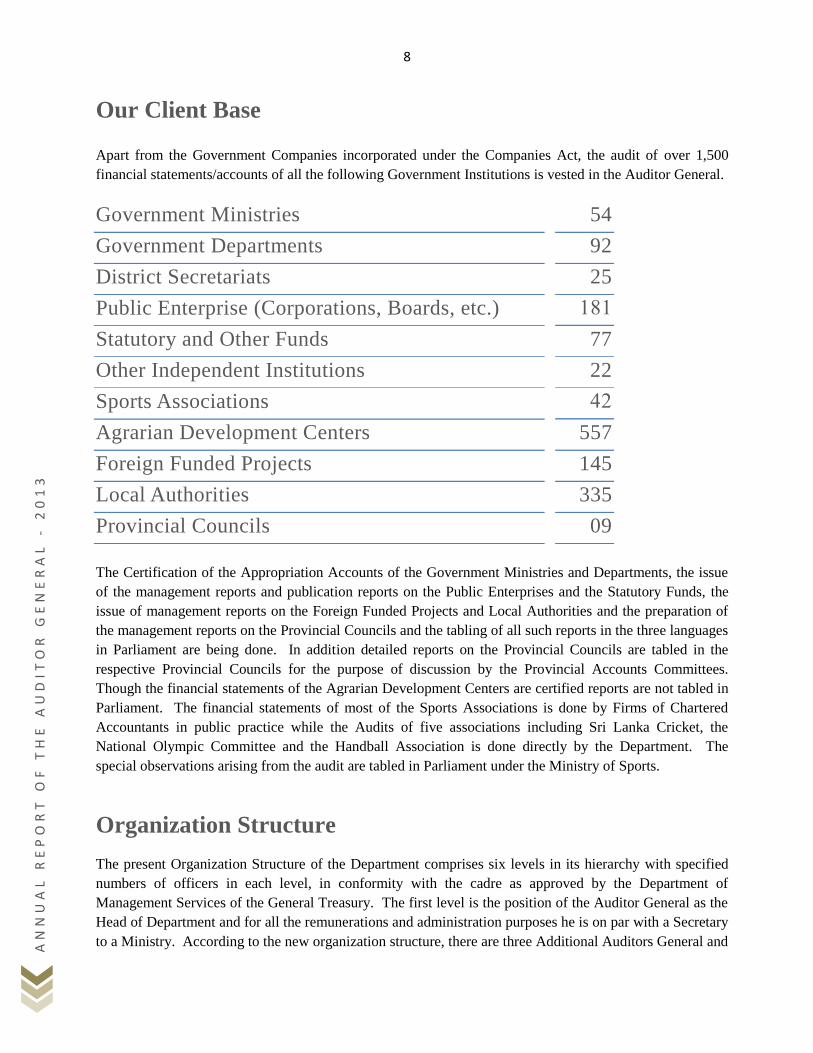
Apart from the Government Companies incorporated under the Companies Act, the audit of over 1,500
financial statements/accounts of all the following Government Institutions is vested in the Auditor General.
Government Ministries 54
Government Departments 92
District Secretariats 25
Public Enterprise (Corporations, Boards, etc.) 181
Statutory and Other Funds 77
Other Independent Institutions 22
Sports Associations 42
Agrarian Development Centers 557
Foreign Funded Projects 145
Local Authorities 335
Provincial Councils 09
The Certification of the Appropriation Accounts of the Government Ministries and Departments, the issue
of the management reports and publication reports on the Public Enterprises and the Statutory Funds, the
issue of management reports on the Foreign Funded Projects and Local Authorities and the preparation of
the management reports on the Provincial Councils and the tabling of all such reports in the three languages
in Parliament are being done. In addition detailed reports on the Provincial Councils are tabled in the
respective Provincial Councils for the purpose of discussion by the Provincial Accounts Committees.
Though the financial statements of the Agrarian Development Centers are certified reports are not tabled in
Parliament. The financial statements of most of the Sports Associations is done by Firms of Chartered
Accountants in public practice while the Audits of five associations including Sri Lanka Cricket, the
National Olympic Committee and the Handball Association is done directly by the Department. The
special observations arising from the audit are tabled in Parliament under the Ministry of Sports.
Organization Structure
The present Organization Structure of the Department comprises six levels in its hierarchy with specified
numbers of officers in each level, in conformity with the cadre as approved by the Department of
Management Services of the General Treasury. The first level is the position of the Auditor General as the
Head of Department and for all the remunerations and administration purposes he is on par with a Secretary
to a Ministry. According to the new organization structure, there are three Additional Auditors General and
9
AN
NU
AL
RE
PO
RT
OF
TH
E A
UD
IT
OR
GE
NE
RA
L
- 2
01
3
arrangements have been made to maintain those posts on acting basis until the approval of the new Service
Minutes. One post of Additional Auditor General is in charge of the audit of Ministries and Departments,
the Performance Audits and the Accounts and Administrative Affairs of the Department and another post of
Additional Auditor General is in charge of the Corporations and the audit of the other institutions of the
Central Government while the remaining post of Additional Auditor General is in charge of the audit of
Provincial Councils, Local Authorities, and Surcharges. These posts are in the second level.
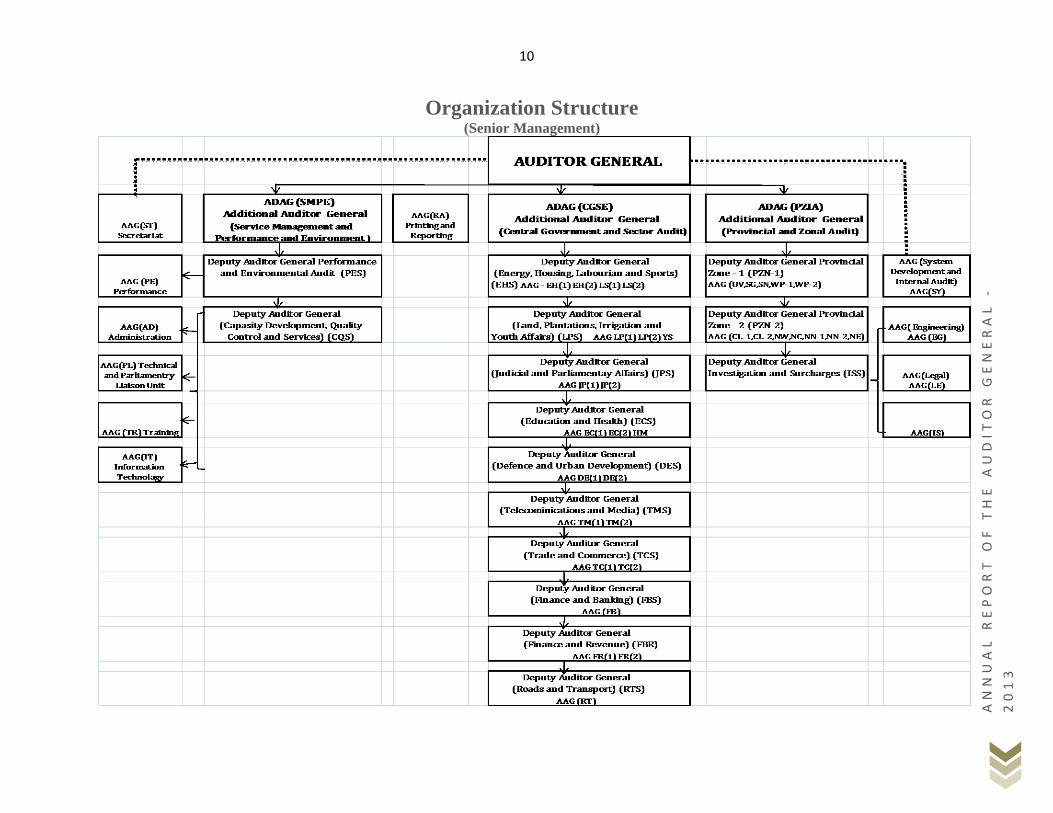
The posts of Deputy Auditors General come under the third level. This includes 10 Divisions under Deputy
Auditors General for the affairs of the Central Government, two Deputy Auditors for the Local Government
Audits, one Deputy Auditor General for the Performance and the Environmental Audits, one Deputy
Auditor General for Investigations and Surcharges and one Deputy Auditor General for Quality Control,
Capacity Building and Services, thus constituting 15 Divisions.
The direct supervision of audit is assigned to the Assistant Auditors General and they come under the fourth
level. According to the approved cadre there should be 44 Assistant Auditors General and out of that 08
posts are reserved for professionally qualified Accountants while 03 posts are reserved for those qualified
in Engineering, Law and Information Technology. Recruitment has not been made so far to fill those posts
as the Schemes of Recruitment have not been prepared as yet.
The Superintendent of Audit come under the fifth level and they carry out the direct operation of the audits.
The final level comprises the Audit Examiners and they are deployed in the office based and field based
work. They come under the sixth level of the Organization Structure.
Accordingly those field officers assist their Heads of Branches by carrying out the work assigned to them in
accordance with the approved programs, and in compliance with the Sri Lanka Auditing Standards, other
Statutory and legal requirements and in accordance with the best practices.
The Organization and the Senior Management Structure as at 30 June 2014 in depicted in the figure below.
10
AN
NU
AL
RE
PO
RT
OF
TH
E A
UD
IT
OR
GE
NE
RA
L
-
20
13
Organization Structure (Senior Management)
11
AN
NU
AL
RE
PO
RT
OF
TH
E A
UD
IT
OR
GE
NE
RA
L
-
20
13
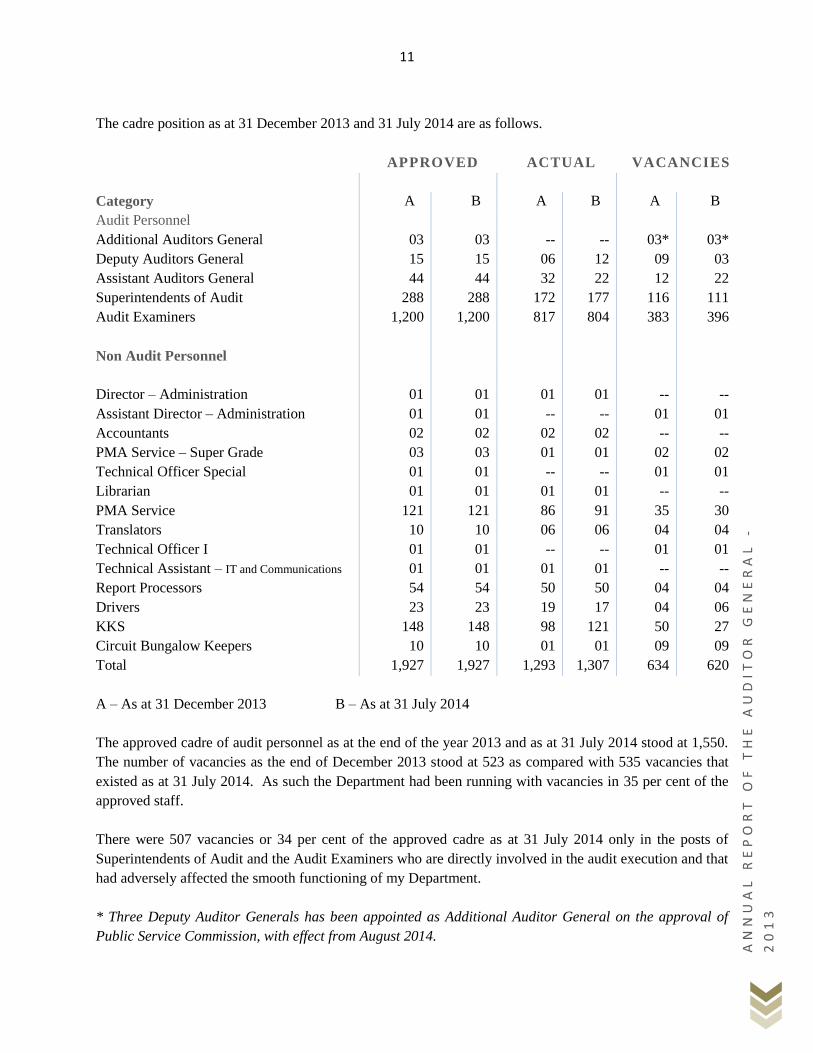
The cadre position as at 31 December 2013 and 31 July 2014 are as follows.
APPROVED ACTUAL VACANCIES
Category A B A B A B
Audit Personnel
Additional Auditors General 03 03 -- -- 03* 03*
Deputy Auditors General 15 15 06 12 09 03
Assistant Auditors General 44 44 32 22 12 22
Superintendents of Audit 288 288 172 177 116 111
Audit Examiners 1,200 1,200 817 804 383 396
Non Audit Personnel
Director – Administration 01 01 01 01 -- --
Assistant Director – Administration 01 01 -- -- 01 01
Accountants 02 02 02 02 -- --
PMA Service – Super Grade 03 03 01 01 02 02
Technical Officer Special 01 01 -- -- 01 01
Librarian 01 01 01 01 -- --
PMA Service 121 121 86 91 35 30
Translators 10 10 06 06 04 04
Technical Officer I 01 01 -- -- 01 01
Technical Assistant – IT and Communications 01 01 01 01 -- --
Report Processors 54 54 50 50 04 04
Drivers 23 23 19 17 04 06
KKS 148 148 98 121 50 27
Circuit Bungalow Keepers 10 10 01 01 09 09
Total 1,927 1,927 1,293 1,307 634 620
A – As at 31 December 2013 B – As at 31 July 2014
The approved cadre of audit personnel as at the end of the year 2013 and as at 31 July 2014 stood at 1,550.
The number of vacancies as the end of December 2013 stood at 523 as compared with 535 vacancies that
existed as at 31 July 2014. As such the Department had been running with vacancies in 35 per cent of the
approved staff.
There were 507 vacancies or 34 per cent of the approved cadre as at 31 July 2014 only in the posts of
Superintendents of Audit and the Audit Examiners who are directly involved in the audit execution and that
had adversely affected the smooth functioning of my Department.
* Three Deputy Auditor Generals has been appointed as Additional Auditor General on the approval of
Public Service Commission, with effect from August 2014.
12
AN
NU
AL
RE
PO
RT
OF
TH
E A
UD
IT
OR
GE
NE
RA
L
- 2
01
3
Sri Lanka Audit Service
The cadre of the Sri Lanka Audit Service constitutes the senior and middle management levels of the
Department, namely, three Additional Auditors General, 15 Deputy Auditors General, 44 Assistant
Auditors General and 288 Superintendents of Audit. Out of the 15 Deputy Auditors General, two will be
recruited on the open basis. Out of the 44 Assistant Auditors General, 08 will be recruited from the
professionally qualified Accountants and 03 will be recruited from those qualified in Law, Information
Technology literacy and Engineering disciplines with a view to introducing Multi-Disciplinary Culture to
the Audit Service .
Audit Examiners’ Service
The cadre of the Audit Examiners‟ Service comprises 1,200 field and office based officers. These officers
are under Audit Examiners Grade I and II. The services of these officers are used in the implementation of
Audits. According to the provisions in the Minute on the Audit Examiners‟ Service, recruitment to Grade
II is only through an open competitive examination. According to the existing provisions, officers with 10
years satisfactory service in Grade II and who have passed the Efficiency Bar Examinations and not
subjected to disciplinary action, are promoted to Grade I on the recommendations of an Interview Board on
the approval of the Public Service Commission.
Welfare Association
Action was taken in the latter half of the year 2013 and the first half of the year 2014 to give a new lease of
life to the Welfare Association active for over 30 years in the Head Office. The new Welfare Association
was organized by amalgamating the Welfare Association, the Help-in-need Fund and the Day Care Fund.
The Constitution of the Association was amended to allow every officer/ employee of the Department to
obtain membership and the members of the former Welfare Association and the „Help – in – need Fund
were absorbed to the new Association. The monthly contribution was increased from Rs.7 to Rs.50 to
augment the fund of the Association while the sum exceeding Rs. 3 million was collected by staging a
drama “Deviyoth Danne ne” in March 2014.The Constitution was amended to enable the payment of a
grant on resignation, retirement or death of a member. Cash donations were made to the children of the
members who had obtained excellent results in the Grade Five Scholarship Examination, General
Certificate of Education, Ordinary and the Advanced Level Examinations. Arrangements were also made
with a private company for the members to obtain textiles on welfare basis during the Sinhala and Tamil
New Year.
In addition to the Welfare Association at the Head Office, Associations are maintained in the Sub-offices in
the Central, North Central, Sabaragamuwa and Southern Provinces to promote mutual relationships among
the members.
13
AN
NU
AL
RE
PO
RT
OF
TH
E A
UD
IT
OR
GE
NE
RA
L
- 2
01
3
Buddhist Association
The Buddhist Association conducted several religious and social activities in the year 2013 and the
particulars of such activities conducted under the auspices of the Association are given the Chapter on
Religious and Social Responsibilities. The Association published two booklets on the Worship Somawathi
Stupa and the Sri Pada.
14
AN
NU
AL
RE
PO
RT
OF
TH
E A
UD
IT
OR
GE
NE
RA
L
- 2
01
3
_____________________________________________________________________________________________________________________________________________________________
International Relations, Staff Training and
Development ____________________________________________________________________________________________________________________
International Relations
The following officers participated in the International Conference held in the year 2013.
Mr. H.A.S. Samaraweera, Auditor General and Mr. W.P.C. Wickramaratne, Deputy Auditor General
participated in the 22nd
UN/INTOSAI Symposium held in Vienna, Austria from 03 to 07 March 2013 and
on the return journey inspected the Sri Lankan Embassy Offices in Austria and Italy and the Offices of Sri
Lankan Consul General in Frankfurt, Germany and the Sri Lankan Embassy Office in Berlin.
Mr. H.A.S. Samaraweera, Auditor General and Mr. U.G.S. Wijesinghe, Deputy Auditor General
participated in a Conference held in October 2013 in Beijing, People‟s Republic of China and on the return
journey inspected the Sri Lankan Embassy Office in Moscow, Russia.
Mr. H.A.S. Samaraweera, Auditor General and Mr. S.A.D.S.A. Christy, Deputy Auditor General
participated in the Conference on the Role of SAI in Fighting against Corruption held from 03 to 07 March
2014 in Hungary and on this tour inspected the Sri Lankan Embassy Office in Poland and the Sri Lankan
Consul General‟s Office in Dubai.
International Training
Following Superintendents of Audit have undergone training in five ASSOSAI member countries on
Performance audit, Audit of public works, IT audits and quality control in audit.
NAME OF OFFICER TRAINING PERIOD COUNTRY
Mrs. S. Ratnaweera 2013.06.23 – 2013.07.13 Japan
Mrs. M.D.S. Amaratunga 2013.11.04 – 2013.11.15 Malaysia
Mr. N.R.M. Dharmasiri 2013.11.11 – 2013.11.15 Republic of Korea
Mr. M.G. Madarasinghe 2013.11.25 – 2013.12.06 Malaysia
Miss. M.K.D.N. Mayakaduwa 2013.11.18 – 2013.11.27 Thailand
Mr. A. Chandrapala 2013.12.02 – 2013.12.05 Vietnam
15
AN
NU
AL
RE
PO
RT
OF
TH
E A
UD
IT
OR
GE
NE
RA
L
- 2
01
3
Local Training
The officers who received training under the Special Training Programmes in the year 2011, conducted
training programmes on the conduct of investigations in accordance with the new methodologies for the
rest of the audit staff of the Department. Accordingly 65 officers in the audit staff were trained in two
training programmes of 3 days each held in the year 2013. A short term training in investigation audit was
provided to the 19 Superintendents of Audit recruited in the year 2013. The particulars of other training
provided to the staff of the Department in the year are given below.
FIELD OF TRAINING NUMBER OF
OFFICERS
TRAINING
HOURS
Financial Audit 859 11,728
Constructions 60 3,360
Performance Audit 60 1,560
Investigative Audit 30 720
Local Authorities 158 1,106
Public Sector Accounting Standards 95 560
Leadership Training 179 7,990
Computer Hardware Training 06 270
Computer Network Training 03 135
Web Designing Training 01 45
Data Base Management Training 01 45
Introduction training to Newly
recruited Superintendents of Audit
46 3,680
Total 1,498 31,199
Training of Internal Auditors
Training courses of 5 days each were held during the year under review for 40 Internal Audit Officers of
the Ministry of Health and 40 Internal Audit Officers of the Sri Lanka Navy.
Public Audit Journal
The half yearly publication issued up to the year 2000 ceased temporarily and action was taken to issue a
journal on a new format and the first issue of the Journal was launched on 01 January 2014.
16
AN
NU
AL
RE
PO
RT
OF
TH
E A
UD
IT
OR
GE
NE
RA
L
- 2
01
3
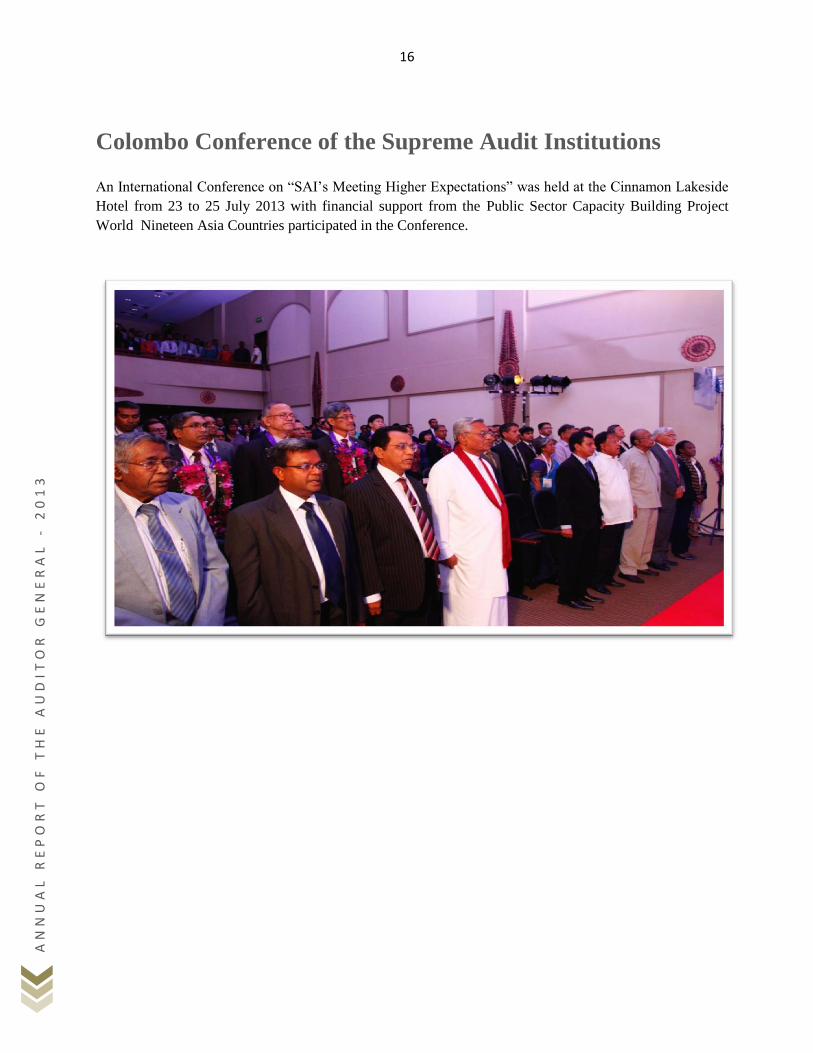
Colombo Conference of the Supreme Audit Institutions
An International Conference on “SAI‟s Meeting Higher Expectations” was held at the Cinnamon Lakeside
Hotel from 23 to 25 July 2013 with financial support from the Public Sector Capacity Building Project
World Nineteen Asia Countries participated in the Conference.
17
AN
NU
AL
RE
PO
RT
OF
TH
E A
UD
IT
OR
GE
NE
RA
L
- 2
01
3
____________________________________________________________________________________________________________________________________________________________
Religious and Corporate Social
Responsibility ____________________________________________________________________________________________________________________
The audit staff of the Auditor General‟s Department is committed itself for the execution of the statutory
audit mandated by the Constitution of the Democratic Socialist Republic of Sri Lanka and their valuable
assistance is regularly provided for the purpose. In addition to the discharge of statutory duties and
responsibilities, the entire staff of the Department discharge the Social responsibilities willingly. The
staff of the Department commence work on the first of January or the first working day with the blessings
of all religions and continue the 31 year long tradition of conducting Buddha Pooja at the Buddha Statue
at the Head Office on every Monday morning and act as a model to the public service by conducting
religious programmes on all important full moon days for spiritual development. The officers act in
unison in connection with Christmas, Ramazan, Deepawali and Thaipongal celebrations. The entire staff
of the Department participated in the year 2013 for carrying out the social and religious activities.
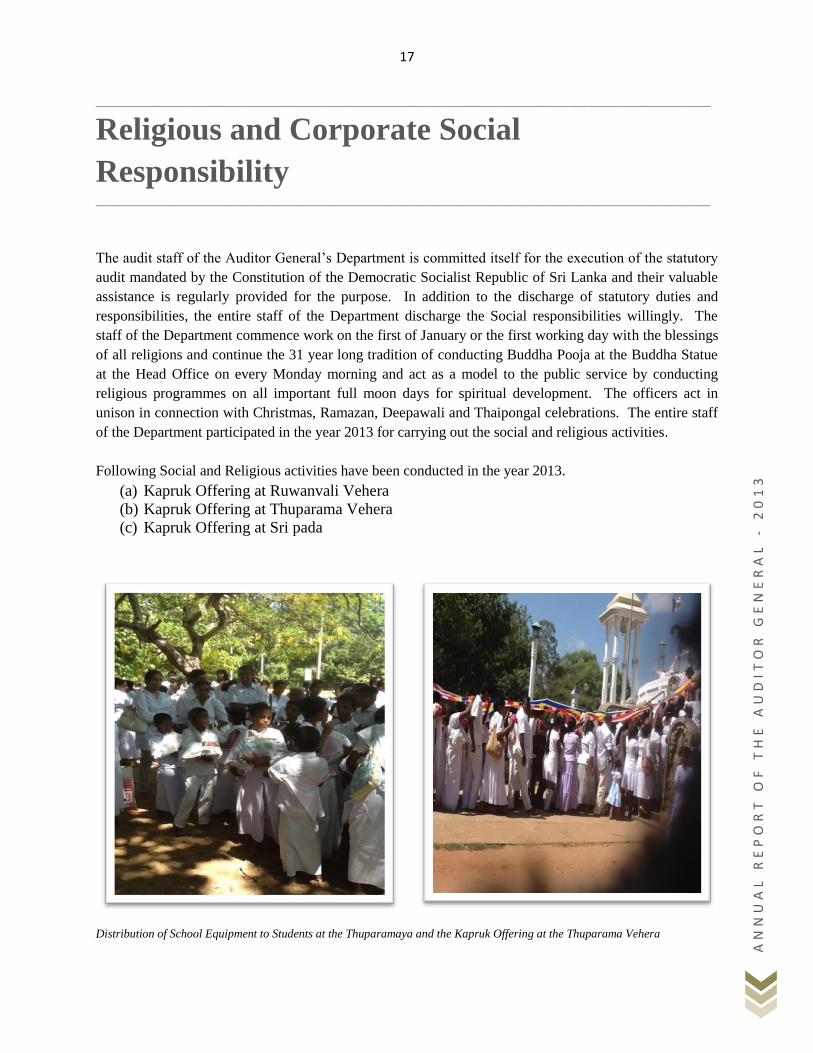
Following Social and Religious activities have been conducted in the year 2013.
(a) Kapruk Offering at Ruwanvali Vehera
(b) Kapruk Offering at Thuparama Vehera
(c) Kapruk Offering at Sri pada
Distribution of School Equipment to Students at the Thuparamaya and the Kapruk Offering at the Thuparama Vehera
18
AN
NU
AL
RE
PO
RT
OF
TH
E A
UD
IT
OR
GE
NE
RA
L
- 2
01
3
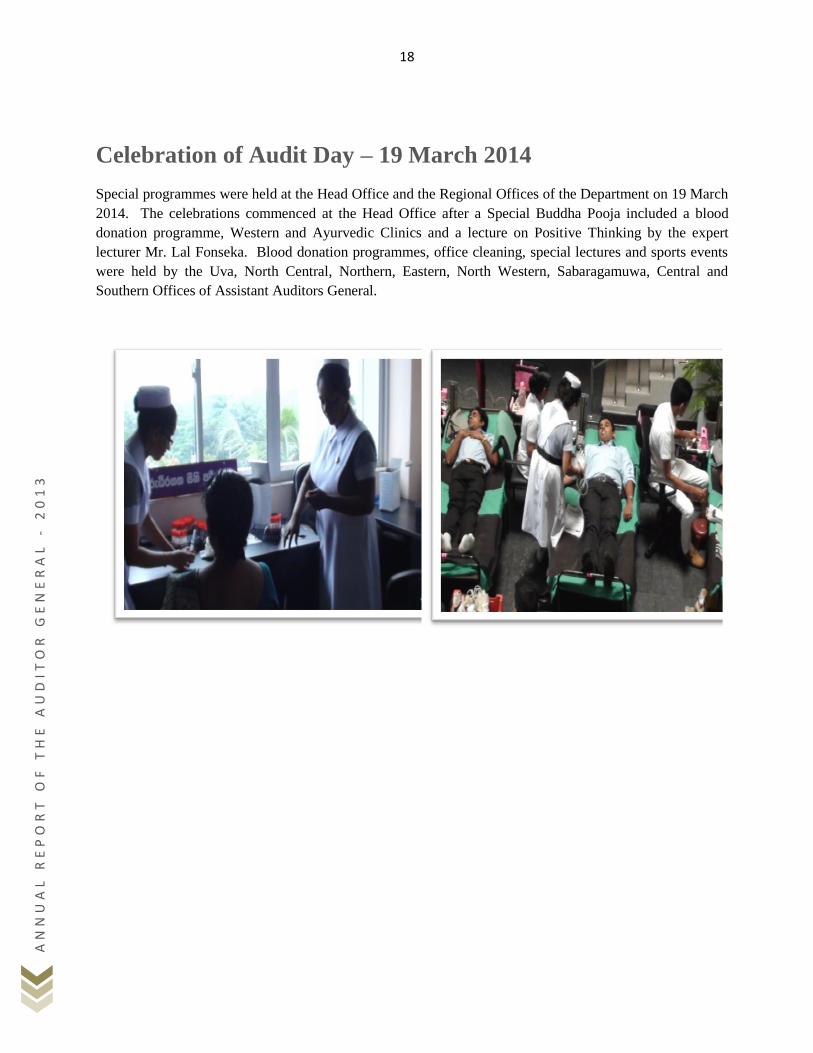
Celebration of Audit Day – 19 March 2014
Special programmes were held at the Head Office and the Regional Offices of the Department on 19 March
2014. The celebrations commenced at the Head Office after a Special Buddha Pooja included a blood
donation programme, Western and Ayurvedic Clinics and a lecture on Positive Thinking by the expert
lecturer Mr. Lal Fonseka. Blood donation programmes, office cleaning, special lectures and sports events
were held by the Uva, North Central, Northern, Eastern, North Western, Sabaragamuwa, Central and
Southern Offices of Assistant Auditors General.
19
AN
NU
AL
RE
PO
RT
OF
TH
E A
UD
IT
OR
GE
NE
RA
L
- 2
01
3
PART II
REPORTING ON OUR
PERFORMANCE
20
AN
NU
AL
RE
PO
RT
OF
TH
E A
UD
IT
OR
GE
NE
RA
L
- 2
01
3
_____________________________________________________________________________________________________________________________________________________________
To the Country through the State Audit ____________________________________________________________________________________________________________________
Urban Development Authority
Contrary to the instructions in the Circular No. PCMD/PR/2013 dated 05 June 2013 of the Secretary to the
President, 78 motor vehicles belonging to different Government Institutions had been left parked over a
long period in the premises of Sethsiripaya Stages I and II without being disposed of.
Condominium Management Authority
The following bogus payments had been made under the contracts for the painting and repair of the houses
of the stage I of the Dias Place Housing Scheme, Colombo 15 and the Dissanayakewatta Housing Scheme.
Rs.
(a) Payment for 06 water tanks not supplied 180,000
(b) Payments made for 15 items of work not done under the estimate for
repairs to lavatories and bathrooms of Dias Place Housing Scheme
544,277
(c) Payment for temporary lavatories not supplied 153,000
(d) Payment for work in the estimate not done – Repairs to lavatories and
bathrooms of Dissanayakewatta Housing Scheme
2,012,529
(e) Payments made for additional lavatory facilities not supplied to the above
Housing Scheme
510,000
Total 3,399,806
Department of Irrigation
Arrangements had been made to fell and remove 1,885 valuable trees such as Kumbuk , Mee and Koon for
clearing the curves and barriers of the Kahambiliya Oya in the areas of authority of Medirigirya and
Lankapura Pradeshiya Sabhas in the Polonaruwa District under the Kahambiliya Oya Flood Protection
Project. About 250 trees had been felled by the date of audit. The following weaknesses were observed in
that connection.
(a) According to the Notification published in the Gazette Extraordinary No. 772/22 of 24 June 1993,
under Section 23(i) of the National Environmental Act, No. 47 of 1980 as amended by the National
Environmental (Amendment) Act, No 56 of 1988, any project covering a land area exceeding 05
hectares should obtain the approval of the Central Environmental Authority. But such approval had
not been obtained for the project covering over 25 hectares.
21
AN
NU
AL
RE
PO
RT
OF
TH
E A
UD
IT
OR
GE
NE
RA
L
- 2
01
3
(b) A Feasibility Study had not been done and Engineering advice had not been obtained for a project
including the construction of a retaining wall.
(c) Financial proposal had not been prepared for the project.
(d) Even though the timber had been removed proper arrangements had not been made for stumping
while no arrangements had been made to handover removed timber to the State Timber Corporation.
(e) There was no proper co-ordination among the different Government Institutions participating in the
project.
Divisional Secretariat, Monaragala
Fraudulent payments amounting to Rs.4,659,980 comprising Rs.3,407,300 under the Samurdhi Sipdora
Secondary Education Scholarship Programme and Rs.1,252,680 in respect of payment for deaths, marriages
and births under the Social Security Fund had been made during the period 2006 to 2011.
Southern Development Authority
Twenty two agreements valued at Rs.30,270,000 had been entered into between 30 June 2006 to 24 January
2011 for the purchase of tea seedlings and advances amounting to Rs.22,638,000 which exceeded the 20
per cent mobilization advance that can be allowed, had been paid in 17 instances without obtaining
advance payment guarantees. Out of the 22 agreements referred to above, the supply of tea seedlings under
06 agreements relating to the years 2006 and 2007 had been delayed over periods ranging from 01 month to
13 months. Under such circumstances, further 10 agreements had been entered into on 29 December 2008
and advances amounting to Rs.9,000,000 had been paid. Several other agreements had been entered into on
24 January 2011 and 26 January 2011 and two advances of Rs.3,600,000 totalling Rs.7,200,000 had been
paid. As at 27 May 2013, the date of audit, the advances not settled by external parties over periods
ranging from 2 ½ years to 4 ½ years amounting to Rs.18,034,507, the interest recoverable thereon
amounting to Rs.5,687,260 and the Departmental charges amounting to Rs.5,930,442 remained recoverable
by the Authority.
22
AN
NU
AL
RE
PO
RT
OF
TH
E A
UD
IT
OR
GE
NE
RA
L
- 2
01
3
Purchase of Machinery from the People’s Republic of China
by the Ministry of Economic Development
The Ministry of Economic Development had purchased 725 items of construction machinery valued at U.S.
$ 115,853,893 (Sri Lankan Rs. 14,504 million) from a company in the People‟s Republic of China in the
year 2011 for distribution to the State Development and Construction Corporation, the Western Provincial
Road Development Authority, the Ministry of Agrarian Services and Wildlife, the Central Engineering
Consultancy Bureau, the State Engineering Corporation of Sri Lanka and the Road Development Authority.
The Ministry of Economic Development should have entered into a supply Agreement with that Company
in accordance with the Cabinet Decision dated 01 June 2011 and the Secretary to the Treasury should enter
into a Loan Agreement with that Company as specified in paragraph 3.2 of the above Cabinet Decision,
such agreement had not been entered into.
Even though sums totaling Rs. 3,454 million had been paid from the Consolidated Fund to the said
company as loan installments and interest on that loan in the years 2011 and 2012, that loan had not been
brought to account as a Public Debt.
Sri Lanka Customs
A fine of Rs.208,283,881 had been imposed on the Ceylon Electricity Board, a Government Corporation,
reporting that imported goods which should have been classified under the Classification No. 7614.10 of
the Harmonised System Classification had been erroneously shown under No. 8544.60 and a sum of
Rs.104,142,940 or 50 per cent and a sum of Rs.41,656,776 or 20 per cent out of that had been allocated for
the payment of rewards to a few officers and for welfare activities of the officers respectively instead of
having recourse for the revision or waiver of the fines imposed by Sri Lanka Customs by the Minister of
Finance in accordance with the powers devolved on him in terms of provisions in Sections 164 and 165 of
the Customs Ordinance (Cap. 235). The payment of a sum of Rs.60,000,000 as a reward to an officer whose
duty is the performance of customs functions and receiving salaries, incentives, overtime and allowances
for the purpose is a severe inequity as compared with the remunerations paid to the rest of the public
officers of the Island. It should be pointed out that the authorities responsible for amending the archaic
provisions in the Customs Ordinance have not paid their attention for amending the Customs Ordinance in
line with the present conditions.
Surcharges In terms of provisions in Sub-section 226(1) of the Municipal Councils Ordinance, Sub-section 182(1) of
the Urban Councils Ordinance and Sub-section 172(3) of the Pradeshiya Sabha Act, No. 15 of 1987, the
Auditor General has the powers to surcharge all item contrary to law, all deficiencies and losses due to
negligence and misconduct, and items that should be brought to account but not brought to account.
23
AN
NU
AL
RE
PO
RT
OF
TH
E A
UD
IT
OR
GE
NE
RA
L
- 2
01
3
Accordingly 48 Surcharge Certificates valued at Rs.29,258,218 were issued on 392 persons of Local
Authorities during the period from January 2008 to 31 December 2012. Out of that, a sum of Rs.1,006,303
only had been recovered by 31 May 2014.
Though 10 Surcharge Certificates valued at Rs.3,738,830 were issued on 104 persons in the year 2013, no
recoveries have been made up to date.
Eight Surcharge Notices valued at Rs.245,205,168 were issued on 96 persons by 30 June 2014.
24
AN
NU
AL
RE
PO
RT
OF
TH
E A
UD
IT
OR
GE
NE
RA
L
- 2
01
3
PART III
FINANCIAL STATEMENS
25
AN
NU
AL
RE
PO
RT
OF
TH
E A
UD
IT
OR
GE
NE
RA
L
- 2
01
3
_____________________________________________________________________________________________________________________________________________________________
Financial Statements ____________________________________________________________________________________________________________________
It should be noted that the incorporation of the assets generated from the annual budget estimates into the
financial statements through the introduction of this process would provide for their control, as well as the
computation of the value of the assets held by the Government on behalf of the country, and ensure their
protection by the assignment of responsibility. This system also can maintain the control of revenue
collection and expenditure through reconciliation of the revenue and expenditure appearing in the annual
budget estimates with the revenue and expenditure computed on the accrual basis as appearing in the
financial statements.
Annual Appropriations
The total provision made for the Department for the year 2013 amounted to Rs.1,024 million as compared
with the provision of Rs.1,088 million for the preceding year. Out of the total provision, a sum of Rs.263
million was allocated for the implementation of the Capacity Building Project funded by the International
Development Agency. The actual expenditure of the project for the year 2013 amounted to Rs.153 million
as compared with the corresponding expenditure of Rs.216 million for the preceding year.
A sum of Rs. 97 million was credited to the Consolidated Fund in the year 2013 as audit fees from Public
Corporations. Statutory Boards, Local Authorities, Universities and Statutory Funds. Though the
estimated revenue form audit fees for the year amounted to Rs.45 million, collection of audit fees during
the year under review exceeded the estimate by a sum of Rs.52 million.
Preparation of Financial Statements
Initial steps of the preparation of financial statements as an instrument of measurement of the assets control
and efficiency of operations were commenced in the year 2010. For the first time, this system was
introduced to the Department under the institutions in the category of which only the Appropriation
Accounts are being presented from the colonial period. Further, this system was introduced to all
Ministries and Departments from the year 2013 by the Department of State Accounts by the Letter No.
SA/AS/AA/Circular of 24 January 2013 issued by the Director General of State Accounts. By Introducing
this system, the preparation of the financial statements as an initial step the Department has set an example
to the public sector.
26
AN
NU
AL
RE
PO
RT
OF
TH
E A
UD
IT
OR
GE
NE
RA
L
- 2
01
3
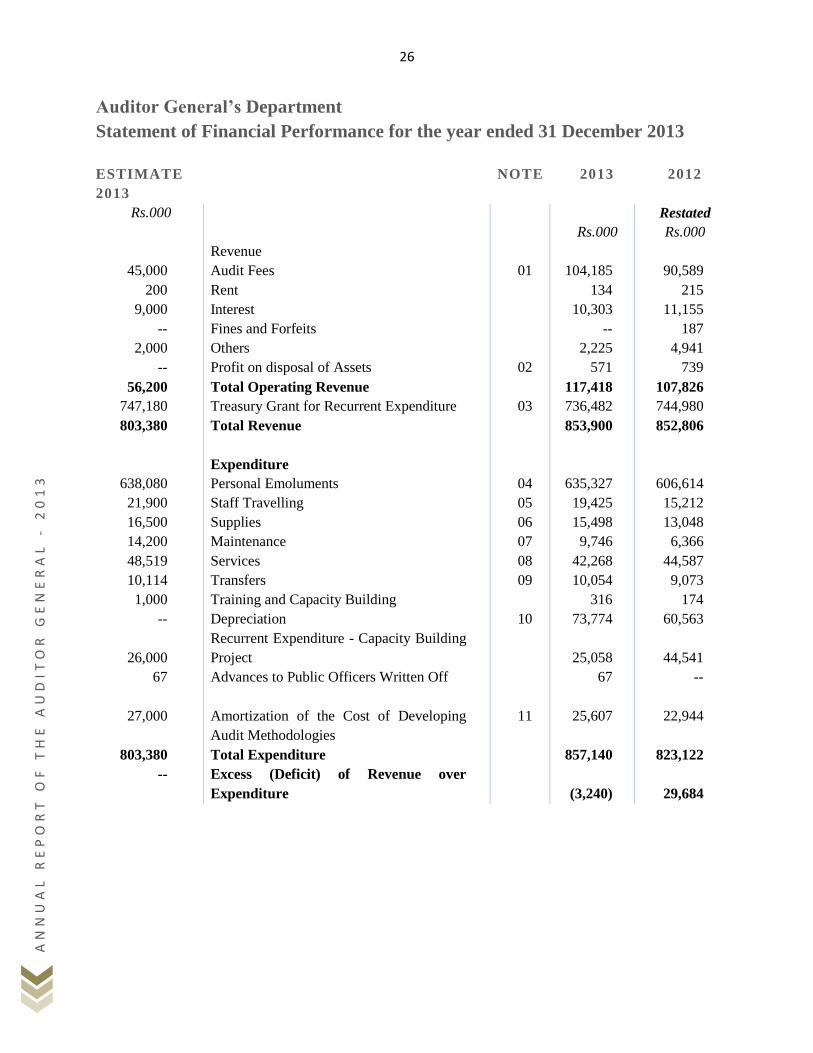
Auditor General’s Department
Statement of Financial Performance for the year ended 31 December 2013
ESTIMATE
2013
NOTE 2013 2012
Rs.000
Rs.000
Restated
Rs.000
Revenue
45,000 Audit Fees 01 104,185 90,589
200 Rent 134 215
9,000 Interest 10,303 11,155
-- Fines and Forfeits -- 187
2,000 Others 2,225 4,941
-- Profit on disposal of Assets 02 571 739
56,200 Total Operating Revenue 117,418 107,826
747,180 Treasury Grant for Recurrent Expenditure 03 736,482 744,980
803,380 Total Revenue 853,900 852,806
Expenditure
638,080 Personal Emoluments 04 635,327 606,614
21,900 Staff Travelling 05 19,425 15,212
16,500 Supplies 06 15,498 13,048
14,200 Maintenance 07 9,746 6,366
48,519 Services 08 42,268 44,587
10,114 Transfers 09 10,054 9,073
1,000 Training and Capacity Building 316 174
-- Depreciation 10 73,774 60,563
26,000
Recurrent Expenditure - Capacity Building
Project
25,058
44,541
67 Advances to Public Officers Written Off 67 --
27,000 Amortization of the Cost of Developing
Audit Methodologies
11 25,607 22,944
803,380 Total Expenditure 857,140 823,122
-- Excess (Deficit) of Revenue over
Expenditure
(3,240)
29,684
27
AN
NU
AL
RE
PO
RT
OF
TH
E A
UD
IT
OR
GE
NE
RA
L
- 2
01
3
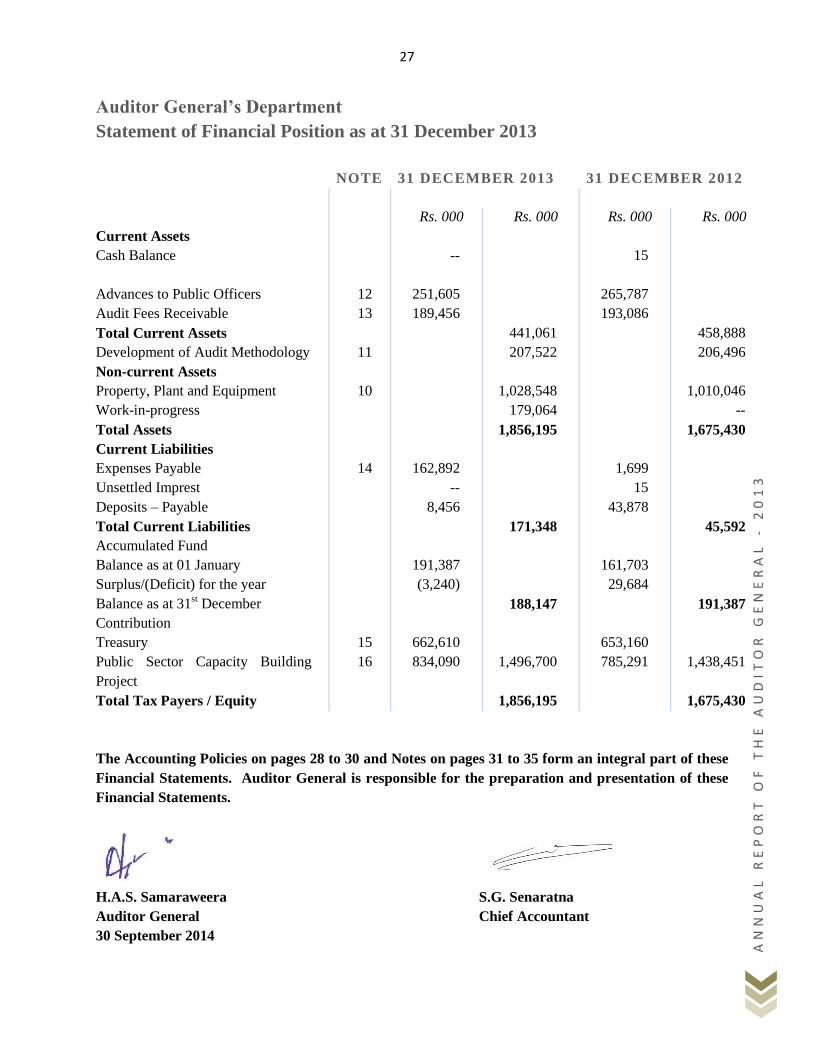
Auditor General’s Department
Statement of Financial Position as at 31 December 2013
NOTE 31 DECEMBER 2013 31 DECEMBER 2012
Rs. 000 Rs. 000 Rs. 000 Rs. 000
Current Assets
Cash Balance -- 15
Advances to Public Officers 12 251,605 265,787
Audit Fees Receivable 13 189,456 193,086
Total Current Assets 441,061 458,888
Development of Audit Methodology 11 207,522 206,496
Non-current Assets
Property, Plant and Equipment 10 1,028,548 1,010,046
Work-in-progress 179,064 --
Total Assets 1,856,195 1,675,430
Current Liabilities
Expenses Payable 14 162,892 1,699
Unsettled Imprest -- 15
Deposits – Payable 8,456 43,878
Total Current Liabilities 171,348 45,592
Accumulated Fund
Balance as at 01 January
191,387
161,703
Surplus/(Deficit) for the year (3,240) 29,684
Balance as at 31st December 188,147 191,387
Contribution
Treasury 15 662,610 653,160
Public Sector Capacity Building
Project
16 834,090 1,496,700 785,291 1,438,451
Total Tax Payers / Equity 1,856,195 1,675,430
The Accounting Policies on pages 28 to 30 and Notes on pages 31 to 35 form an integral part of these
Financial Statements. Auditor General is responsible for the preparation and presentation of these
Financial Statements.
H.A.S. Samaraweera S.G. Senaratna
Auditor General Chief Accountant
30 September 2014
28
AN
NU
AL
RE
PO
RT
OF
TH
E A
UD
IT
OR
GE
NE
RA
L
- 2
01
3
Accounting Policies
1. Reporting Entity
There is no specific law with regard to the establishment of the Auditor General‟s Department. However,
Article 153 of the Constitution of the Democratic Socialist Republic of Sri Lanka states that there shall be
an Auditor General. The main activity of the Auditor General‟s Department is to provide audit services to
Public Institutions specified in Article 154(1) and (3) of the Constitution. These Financial Statements are
for the year ended 31 December 2013.
2. Reporting Period
Reporting period is the calendar year commencing on 01 January and ending on 31 December.
3. Basis for Preparation
The financial statements have been prepared in accordance with Generally Accepted Accounting Principles.
These financial statements have been prepared on the historical cost basis and all the values are rounded to
the nearest thousand Rupees.
4. Income
The Treasury Grant received for recurrent expenditure, Audit Fees, Interest on Loans, Rent, Circuit
Bungalows Income, Profit on disposal of Assets, Fines and Charges are the main revenue of the
Department and these are brought to account under the accrual basis. Revenue is computed on the fair
basis according to the consideration received for those.
Audit fees are charged from Public Corporations, Statutory Boards, Local Authorities, Universities and
Statutory Funds. The fee is recognized as revenue in the period to which it is related. The value of audit
fees is decided based on the time spent for audit and the direct costs incurred on a particular audit.
Even though the Revenue Accounting Officer for the interest on loans, rent of buildings, circuit bungalow
charges, fines and charges and revenue from the sale of assets is the Head of another Department, as the
Auditor General is the officer collecting such revenue relating to the Department and as the revenue
collected represents a small percentage of the overall revenue, that revenue is stated in the financial
statements. Even though the Treasury Grants for recurrent expenditure are brought to account on cash basis,
the depreciation on fixed assets is brought to account as the Grants receivable for recurrent expenditure.
5. Expenditure
All recurrent expenditure is brought to account under the accrual basis.
29
AN
NU
AL
RE
PO
RT
OF
TH
E A
UD
IT
OR
GE
NE
RA
L
- 2
01
3
6. Foreign Currency Transactions
Foreign currency transactions are translated into Sri Lanka Rupees by using exchange rates prevailing on
the date of transaction. Foreign exchange gains and loses resulting from the settlement of such transactions
are recognized in the Statement of Financial Performance.
7. Cash and Cash Equivalents
Cash includes cash in hand and highly liquid short-term deposits with Banks.
8. Debtors and other Receivables
Debtors and receivables are initially measured at fair value. When there is evidence that the Department is
unable to recover cash or the receivable balance according to the basic conditions attached thereto, the
receivable amount is considered as impaired.
9. Property, Plant and Equipment
Property, Plant and Equipment consist of lands, buildings, furniture and fittings, office equipment including
computers, motor vehicles, mini press, electric lifts, etc. Property, Plant and Equipment are shown at cost,
less accumulated depreciation. The financial statements have been prepared for the first time based on the
carried forward balances of the year 2009 and all the lands and buildings that existed on 01 January 2010
have been brought to account according to the plans of the Department of Surveyor General and the value
assessed by the Department of Valuation. All motor vehicles have been brought to account on the basis of
revaluation done by the Chief Valuer while the furniture and computers and other items have been brought
to account on the basis of the valuation done by an independent team of assessors.
The cost of items of property, plant and equipment is recognized as an asset, if it is probable that the future
economic benefits or service potential associated with the item will flow to the Department and the cost of
the item can be measured reliably. In most instances, an item of property, plant and equipment is
recognized at its cost. Where an asset is acquired at no cost, or for a nominal cost, it is recognized at fair
value as at the date of acquisition.
9.1 Disposals
Gains and losses on disposals are determined by comparing the proceeds with the carrying amount of the
asset. Gains and losses on disposals are included in the Statement of Financial Performance.
30
AN
NU
AL
RE
PO
RT
OF
TH
E A
UD
IT
OR
GE
NE
RA
L
- 2
01
3
9.2 Subsequent Cost
Cost incurred subsequent to initial acquisition is capitalized only when it is probable that future economic
benefits or service potential associated with the item will flow to the Department and the cost of the item
can be measured reliably.
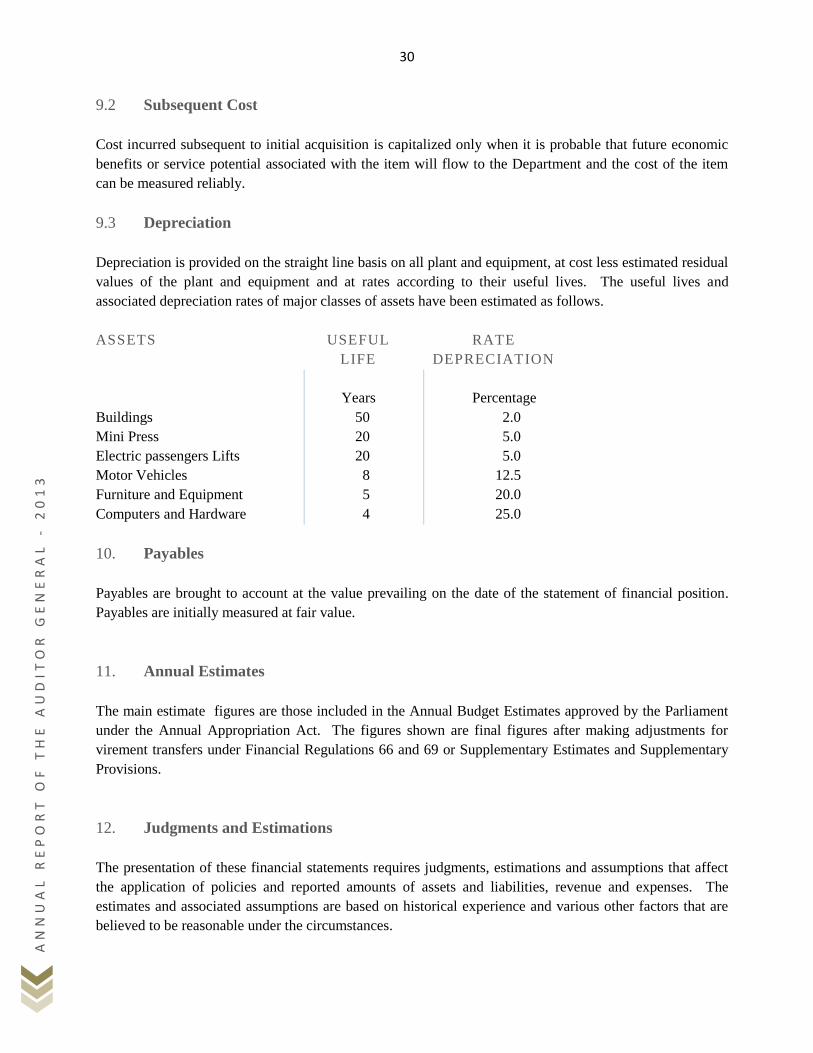
9.3 Depreciation
Depreciation is provided on the straight line basis on all plant and equipment, at cost less estimated residual
values of the plant and equipment and at rates according to their useful lives. The useful lives and
associated depreciation rates of major classes of assets have been estimated as follows.
ASSETS USEFUL
LIFE
RATE
DEPRECIATION
Years Percentage
Buildings
Mini Press
Electric passengers Lifts
Motor Vehicles
50
20
20
8
2.0
5.0
5.0
12.5
Furniture and Equipment 5 20.0
Computers and Hardware 4 25.0
10. Payables
Payables are brought to account at the value prevailing on the date of the statement of financial position.
Payables are initially measured at fair value.
11. Annual Estimates
The main estimate figures are those included in the Annual Budget Estimates approved by the Parliament
under the Annual Appropriation Act. The figures shown are final figures after making adjustments for
virement transfers under Financial Regulations 66 and 69 or Supplementary Estimates and Supplementary
Provisions.
12. Judgments and Estimations
The presentation of these financial statements requires judgments, estimations and assumptions that affect
the application of policies and reported amounts of assets and liabilities, revenue and expenses. The
estimates and associated assumptions are based on historical experience and various other factors that are
believed to be reasonable under the circumstances.
31
AN
NU
AL
RE
PO
RT
OF
TH
E A
UD
IT
OR
GE
NE
RA
L
- 2
01
3
Notes to Financial Statements
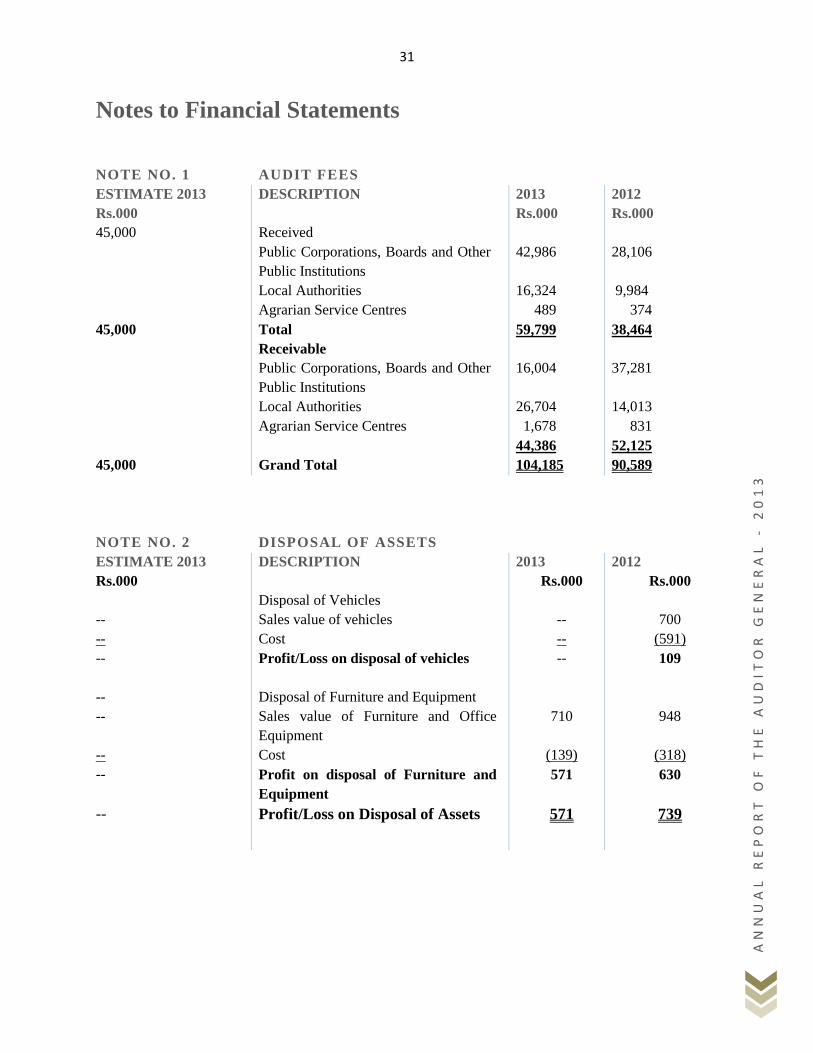
NOTE NO. 1
AUDIT FEES
ESTIMATE 2013 DESCRIPTION 2013 2012
Rs.000 Rs.000 Rs.000
45,000 Received
Public Corporations, Boards and Other
Public Institutions
42,986 28,106
Local Authorities 16,324 9,984
Agrarian Service Centres 489 374
45,000 Total 59,799 38,464
Receivable
Public Corporations, Boards and Other
Public Institutions
16,004 37,281
Local Authorities 26,704 14,013
Agrarian Service Centres 1,678 831
44,386 52,125
45,000 Grand Total 104,185 90,589
NOTE NO. 2
DISPOSAL OF ASSETS
ESTIMATE 2013 DESCRIPTION 2013 2012
Rs.000 Rs.000 Rs.000
Disposal of Vehicles
-- Sales value of vehicles -- 700
-- Cost -- (591)
-- Profit/Loss on disposal of vehicles -- 109
-- Disposal of Furniture and Equipment
-- Sales value of Furniture and Office
Equipment
710 948
-- Cost (139) (318)
-- Profit on disposal of Furniture and
Equipment
571 630
-- Profit/Loss on Disposal of Assets 571 739
32
AN
NU
AL
RE
PO
RT
OF
TH
E A
UD
IT
OR
GE
NE
RA
L
- 2
01
3
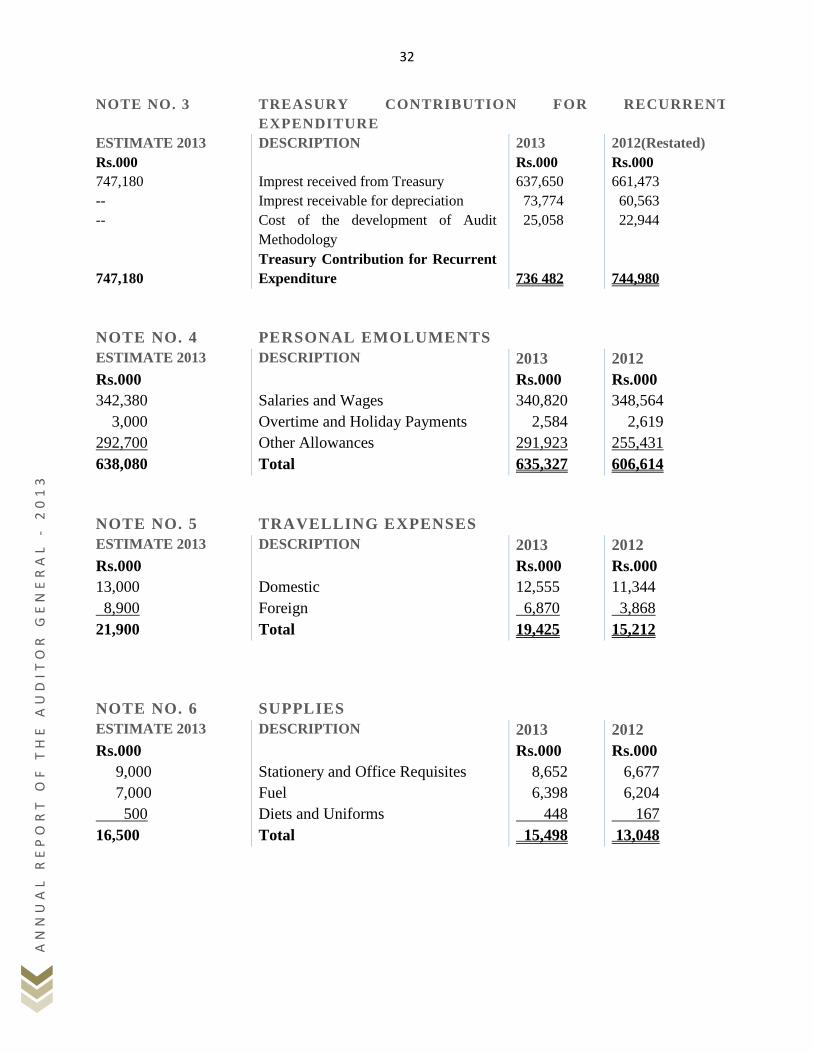
NOTE NO. 3 TREASURY CONTRIBUTION FOR RECURRENT
EXPENDITURE
ESTIMATE 2013 DESCRIPTION 2013 2012(Restated)
Rs.000 Rs.000 Rs.000
747,180 Imprest received from Treasury 637,650 661,473
-- Imprest receivable for depreciation 73,774 60,563
-- Cost of the development of Audit
Methodology
25,058 22,944
747,180
Treasury Contribution for Recurrent
Expenditure
736 482
744,980
NOTE NO. 4 PERSONAL EMOLUMENTS
ESTIMATE 2013 DESCRIPTION 2013 2012
Rs.000 Rs.000 Rs.000
342,380 Salaries and Wages 340,820 348,564
3,000 Overtime and Holiday Payments 2,584 2,619
292,700 Other Allowances 291,923 255,431
638,080 Total 635,327 606,614
NOTE NO. 5 TRAVELLING EXPENSES
ESTIMATE 2013 DESCRIPTION 2013 2012
Rs.000 Rs.000 Rs.000
13,000 Domestic 12,555 11,344
8,900 Foreign 6,870 3,868
21,900 Total 19,425 15,212
NOTE NO. 6 SUPPLIES
ESTIMATE 2013 DESCRIPTION 2013 2012
Rs.000 Rs.000 Rs.000
9,000 Stationery and Office Requisites 8,652 6,677
7,000 Fuel 6,398 6,204
500 Diets and Uniforms 448 167
16,500 Total 15,498 13,048
33
AN
NU
AL
RE
PO
RT
OF
TH
E A
UD
IT
OR
GE
NE
RA
L
- 2
01
3
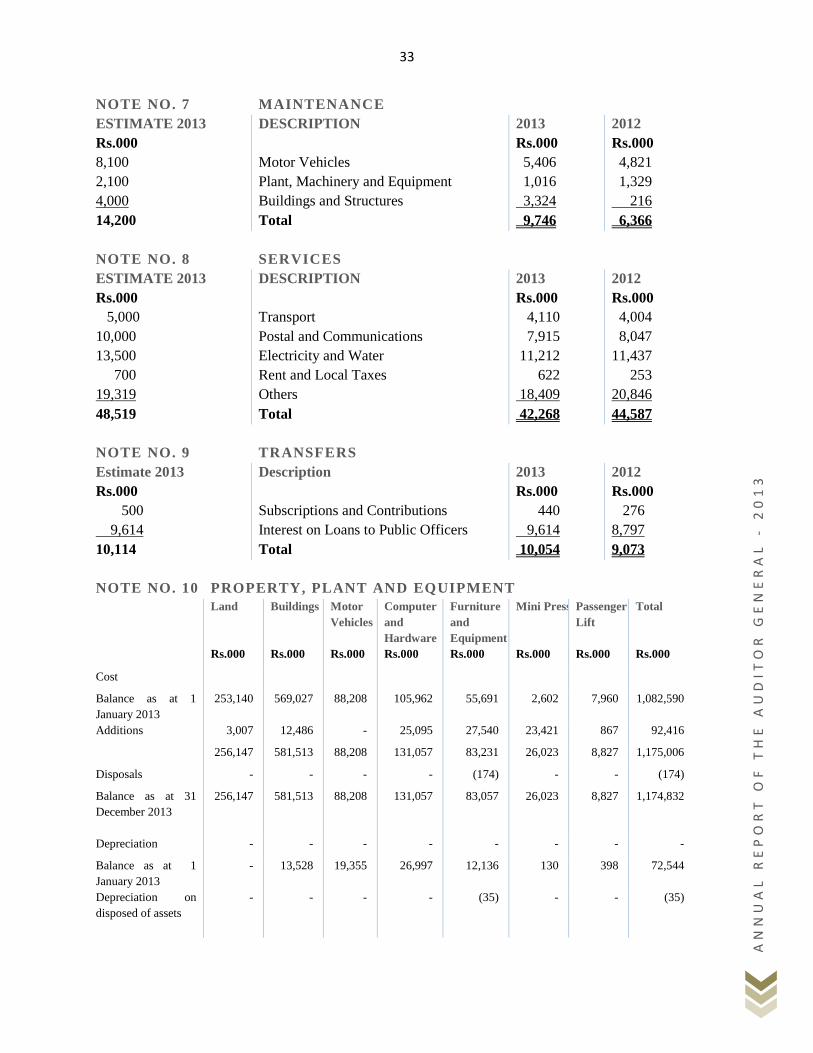
NOTE NO. 7 MAINTENANCE
ESTIMATE 2013 DESCRIPTION 2013 2012
Rs.000 Rs.000 Rs.000
8,100 Motor Vehicles 5,406 4,821
2,100 Plant, Machinery and Equipment 1,016 1,329
4,000 Buildings and Structures 3,324 216
14,200 Total 9,746 6,366
NOTE NO. 8 SERVICES
ESTIMATE 2013 DESCRIPTION 2013 2012
Rs.000 Rs.000 Rs.000
5,000 Transport 4,110 4,004
10,000 Postal and Communications 7,915 8,047
13,500 Electricity and Water 11,212 11,437
700 Rent and Local Taxes 622 253
19,319 Others 18,409 20,846
48,519 Total 42,268 44,587
NOTE NO. 9 TRANSFERS
Estimate 2013 Description 2013 2012
Rs.000 Rs.000 Rs.000
500 Subscriptions and Contributions 440 276
9,614 Interest on Loans to Public Officers 9,614 8,797
10,114 Total 10,054 9,073
NOTE NO. 10 PROPERTY, PLANT AND EQUIPMENT
Land Buildings Motor
Vehicles
Computer
and
Hardware
Furniture
and
Equipment
Mini Press Passenger
Lift
Total
Rs.000 Rs.000 Rs.000 Rs.000 Rs.000 Rs.000 Rs.000 Rs.000
Cost
Balance as at 1
January 2013
253,140 569,027 88,208 105,962 55,691 2,602 7,960 1,082,590
Additions 3,007 12,486 - 25,095 27,540 23,421 867 92,416
256,147 581,513 88,208 131,057 83,231 26,023 8,827 1,175,006
Disposals - - - - (174) - - (174)
Balance as at 31
December 2013
256,147 581,513 88,208 131,057 83,057 26,023 8,827 1,174,832
Depreciation - - - - - - - -
Balance as at 1
January 2013
- 13,528 19,355 26,997 12,136 130 398 72,544
Depreciation on
disposed of assets
- - - - (35) - - (35)
34
AN
NU
AL
RE
PO
RT
OF
TH
E A
UD
IT
OR
GE
NE
RA
L
- 2
01
3
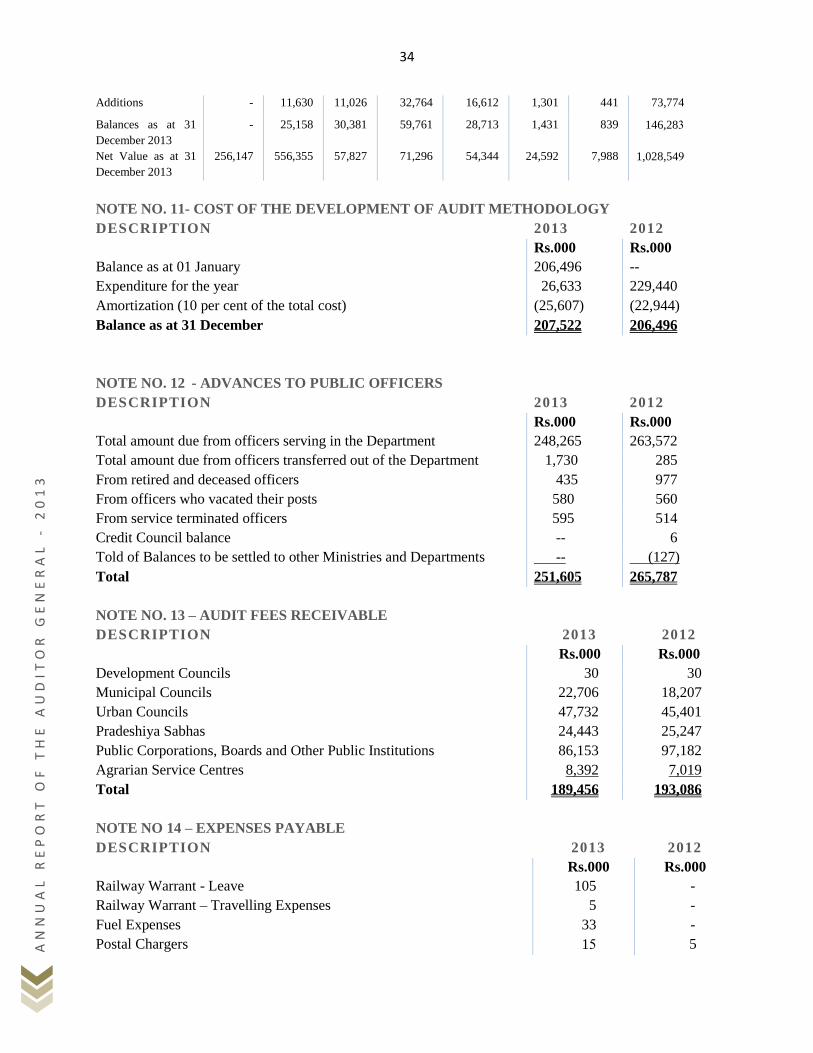
Additions - 11,630 11,026 32,764 16,612 1,301 441 73,774
Balances as at 31
December 2013
- 25,158 30,381 59,761 28,713 1,431 839 146,283
Net Value as at 31
December 2013
256,147 556,355 57,827 71,296 54,344 24,592 7,988 1,028,549
NOTE NO. 11- COST OF THE DEVELOPMENT OF AUDIT METHODOLOGY
DESCRIPTION 2013 2012
Rs.000 Rs.000
Balance as at 01 January 206,496 --
Expenditure for the year 26,633 229,440
Amortization (10 per cent of the total cost) (25,607) (22,944)
Balance as at 31 December 207,522 206,496
NOTE NO. 12 - ADVANCES TO PUBLIC OFFICERS
DESCRIPTION 2013 2012
Rs.000 Rs.000
Total amount due from officers serving in the Department 248,265 263,572
Total amount due from officers transferred out of the Department 1,730 285
From retired and deceased officers 435 977
From officers who vacated their posts 580 560
From service terminated officers 595 514
Credit Council balance -- 6
Told of Balances to be settled to other Ministries and Departments -- (127)
Total 251,605 265,787
NOTE NO. 13 – AUDIT FEES RECEIVABLE
DESCRIPTION 2013 2012
Rs.000 Rs.000
Development Councils 30 30
Municipal Councils 22,706 18,207
Urban Councils 47,732 45,401
Pradeshiya Sabhas 24,443 25,247
Public Corporations, Boards and Other Public Institutions 86,153 97,182
Agrarian Service Centres 8,392 7,019
Total 189,456 193,086
NOTE NO 14 – EXPENSES PAYABLE
DESCRIPTION 2013 2012
Rs.000 Rs.000
Railway Warrant - Leave 105 -
Railway Warrant – Travelling Expenses 5 -
Fuel Expenses 33 -
Postal Chargers 15 5
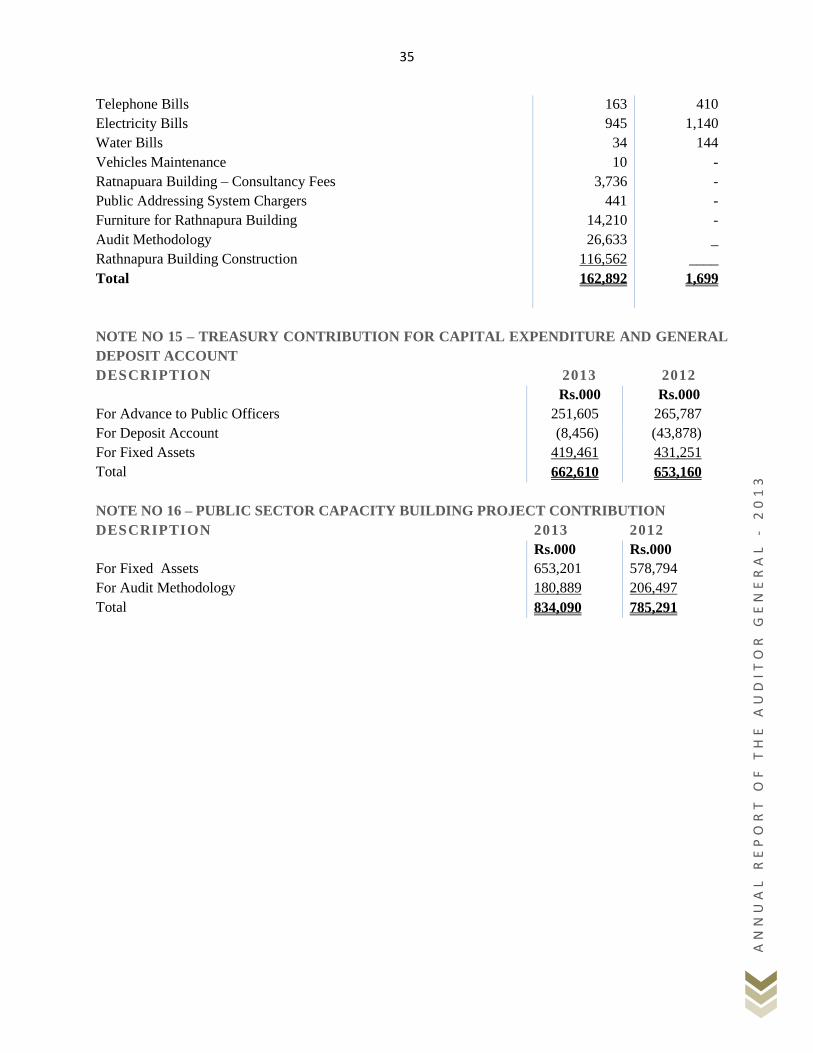
35
AN
NU
AL
RE
PO
RT
OF
TH
E A
UD
IT
OR
GE
NE
RA
L
- 2
01
3
Telephone Bills 163 410
Electricity Bills 945 1,140
Water Bills 34 144
Vehicles Maintenance 10 -
Ratnapuara Building – Consultancy Fees 3,736 -
Public Addressing System Chargers 441 -
Furniture for Rathnapura Building
Audit Methodology
Rathnapura Building Construction
14,210
26,633
116,562
-
_
____
Total 162,892
1,699
NOTE NO 15 – TREASURY CONTRIBUTION FOR CAPITAL EXPENDITURE AND GENERAL
DEPOSIT ACCOUNT
DESCRIPTION 2013 2012
Rs.000 Rs.000
For Advance to Public Officers 251,605 265,787
For Deposit Account (8,456) (43,878)
For Fixed Assets 419,461 431,251
Total 662,610 653,160
NOTE NO 16 – PUBLIC SECTOR CAPACITY BUILDING PROJECT CONTRIBUTION
DESCRIPTION 2013 2012
Rs.000 Rs.000
For Fixed Assets 653,201 578,794
For Audit Methodology 180,889 206,497
Total 834,090 785,291
36
AN
NU
AL
RE
PO
RT
OF
TH
E A
UD
IT
OR
GE
NE
RA
L
- 2
01
3
PART IV
SUMMARY AUDIT
REVIEW OF STATE AUDIT
SECTORS
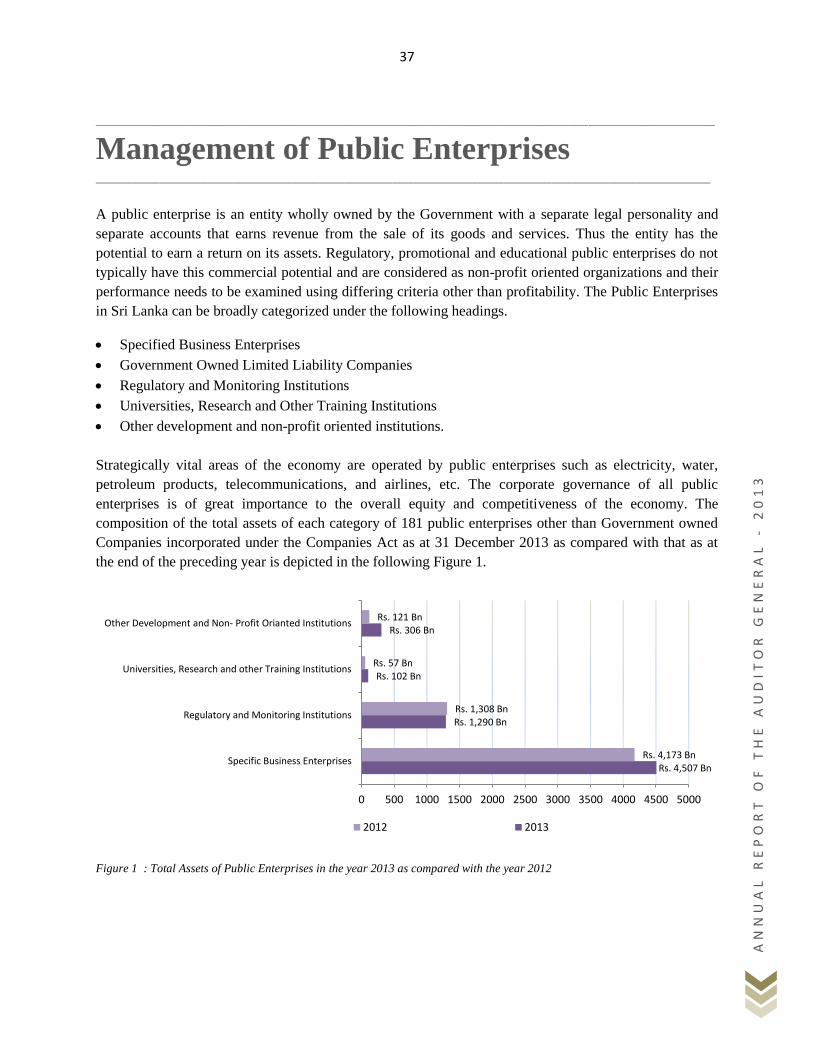
37
AN
NU
AL
RE
PO
RT
OF
TH
E A
UD
IT
OR
GE
NE
RA
L
- 2
01
3
_____________________________________________________________________________________________________________________________________________________________
Management of Public Enterprises ____________________________________________________________________________________________________________________
A public enterprise is an entity wholly owned by the Government with a separate legal personality and
separate accounts that earns revenue from the sale of its goods and services. Thus the entity has the
potential to earn a return on its assets. Regulatory, promotional and educational public enterprises do not
typically have this commercial potential and are considered as non-profit oriented organizations and their
performance needs to be examined using differing criteria other than profitability. The Public Enterprises
in Sri Lanka can be broadly categorized under the following headings.
Specified Business Enterprises
Government Owned Limited Liability Companies
Regulatory and Monitoring Institutions
Universities, Research and Other Training Institutions
Other development and non-profit oriented institutions.
Strategically vital areas of the economy are operated by public enterprises such as electricity, water,
petroleum products, telecommunications, and airlines, etc. The corporate governance of all public
enterprises is of great importance to the overall equity and competitiveness of the economy. The
composition of the total assets of each category of 181 public enterprises other than Government owned
Companies incorporated under the Companies Act as at 31 December 2013 as compared with that as at
the end of the preceding year is depicted in the following Figure 1.
Figure 1 : Total Assets of Public Enterprises in the year 2013 as compared with the year 2012
Rs. 4,507 Bn
Rs. 1,290 Bn
Rs. 102 Bn
Rs. 306 Bn
Rs. 4,173 Bn
Rs. 1,308 Bn
Rs. 57 Bn
Rs. 121 Bn
0 500 1000 1500 2000 2500 3000 3500 4000 4500 5000
Specific Business Enterprises
Regulatory and Monitoring Institutions
Universities, Research and other Training Institutions
Other Development and Non- Profit Orianted Institutions
2012 2013
38
AN
NU
AL
RE
PO
RT
OF
TH
E A
UD
IT
OR
GE
NE
RA
L
- 2
01
3
Government grants and subsidies to public enterprises accounted for Rs. 47.5 billion in the year 2013 and
amounting to 3.8 per cent of total Government recurrent expenditure as compared with the corresponding
figure of Rs. 42.2 billion and 3.8 per cent respectively. Poorly performing public enterprises can further
hamper private sector development by being poor payers for services and goods from the private sector.
The need for the improvement of the following areas for the efficient functioning of the Public
Enterprises is emphasised.
Performance Evaluation
Audit of public enterprises is not only confined to financial and compliance audits but also to the
efficiency, economy and effectiveness with which these operate and fulfill their objectives and goals.
The efficiency and effectiveness audit of public enterprises is conducted on the basis of certain standards
and criteria. Profit is not the key criterion of performance; management's performance in the economical
and efficient use of public funds and achievement of objectives is more relevant. The objectives vary
from enterprise to enterprise. The appraisal analyses whether the performance of an enterprise to bring out
the extent to which the objectives for which the enterprise was set up have been served. One of the first
tasks of the Audit is to identify the criteria for assessing the performance of an enterprise. In the case of a
manufacturing enterprise such as CPC for example, the objective and the basis of investment, capacity,
costs and time schedules, norms of consumption, yields, productivity, costs, rate of return, etc. are
relevant. These provide yardsticks by which the performance is measured. The enterprises have their
long and short term capital and operational plans and these provide another set of reference points for
assessment of the performance.
Where appropriate, rated capacity of the unit provides an acceptable bench mark against which physical
performance is evaluated. Utilisation of the rated capacity is, however, assessed along with norms for
consumption of raw materials and utilities, yields and rejections as well as requirements for proper
maintenance and servicing of equipment. Cost efficiency is another important basis for appraising
performance. Standard or target costs are determined on the basis of norms of capacity utilisation,
consumption, productivity, yields, etc. Treasury has issued guidelines to be followed by the public
enterprises in respect of corporate governance, general management, financial management, procurement
management, construction management, etc. and these guidelines provide another basis for appraising
enterprise performance and its systems. Other sources of criteria are technical studies conducted by
internal and external experts and the standards.
External Audit performed by the Auditor General is an instrument of accountability. But an equally
important purpose of public enterprises audit is to help the Government and the enterprise managements
to improve their efficiency and effectiveness. This is achieved by bringing out the financial and
operational deficiencies, inadequacies or ineffectiveness of systems, shortfalls in performances, non-
compliances with laws, rules and regulations, etc. and by analysing causes of non-attainement of
acceptable standards of performance. Financial performance is linked with physical performance and
issues of efficient and economic operations and management of resources are highlighted in the audit
report. During regular meetings with the managements of the entities my officers discuss the needed
39
AN
NU
AL
RE
PO
RT
OF
TH
E A
UD
IT
OR
GE
NE
RA
L
- 2
01
3
systems and operational improvements. It is also important to ensure follow-up by the Boards and the
managements of the public enterprises to adverse findings of the Auditor General. Repetition from year to
year of adverse findings on the same matter and a high incidence of qualified audit opinions indicate that
this is not always occurring.
Auditor General’s Opinion on the Financial Statements
Public Enterprises prepare financial statements annually comprising statement of financial position as at
the end of the year, statement of income, cash flow statement, statement of changes in equity for the year
then ended, a summary of significant accounting policies and other explanatory information. The
Auditor General provides independent assurance to Parliament as to whether the financial statements give
a true and fair view of the state of affairs of the institutions. This assurance is provided in the form of
expressing an opinion on the financial statements. The opinion simply states the Auditor General's
conclusion that the financial statements do or do not fairly represent the financial position and financial
performance of the Public Enterprises, and that they do or do not conform to the financial reporting
standards either Sri Lanka Accounting Standards or Sri Lanka Public Sector Accounting Standards which
are now in line with the respective International Accounting Standards.
Four types of audit opinion are expressed. Those are, the unqualified, qualified, adverse and the
disclaimer of opinion which are expressed in instances of material uncertainty, management disagreement
or limitation of work. The pervasiveness of the scope limitation would lead to express disclaimer of
opinion whereas the pervasiveness of the disagreement would lead to express an adverse audit opinion.
Unqualified Opinion
An unqualified audit opinion indicates that Auditor General could find no significant violations or
misstatements in the financial statements of a Public Enterprise. An alternate name for this opinion is a
clean opinion. Auditor General typically expresses this opinion referencing the Public Enterprise‟s
ability to record financial information according to financial reporting standards either Sri Lanka
Accounting Standards, or Sri Lanka Public Sector Accounting Standards. This is the best audit opinion
an enterprise can receive.
Qualified Opinion
A qualified audit opinion indicates that the Auditor General found issues in the financial information of a
Public Enterprise. These issues prevent the Auditor General from issuing a clean opinion on the affairs
of a Public Enterprise. Qualified audit opinion often has one or more specific qualifications. The
qualification may represents deviations from Reporting Accounting Standards. This indicates the
enterprise has improperly applied the Standards, and the financial statements do not conform to standard
accounting principles. Another qualification is limitation of scope. Limitation of scope indicates that
Auditor General cannot review one or more areas related to the financial statements. This qualification
relates only to the financial information not reviewed by the Auditor General due to unavailability of
documentary evidence.
40
AN
NU
AL
RE
PO
RT
OF
TH
E A
UD
IT
OR
GE
NE
RA
L
- 2
01
3
The Auditor General express a qualified opinion when:
(a) The Auditor General, having obtained sufficient appropriate audit evidence, concludes that
misstatements, individually or in the aggregate, are material, but not pervasive, to the financial
statements; or
(b) The Auditor General is unable to obtain sufficient appropriate audit evidence on which to base the
opinion, but concludes that the possible effects on the financial statements of undetected misstatements, if
any, could be material but not pervasive.
Disclaimer of Opinion
The Auditor General disclaims an opinion when he is unable to obtain sufficient appropriate audit
evidence on which to base the opinion, and he concludes that the possible effects on the financial
statements of undetected misstatements, if any, could be both material and pervasive. The Auditor
General disclaims an opinion when, in rare circumstances involving multiple uncertainties and concludes
that, notwithstanding having obtained sufficient appropriate audit evidence regarding each of the
individual uncertainties, it is not possible to form an opinion on the financial statements due to the
potential interaction of the uncertainties and their possible cumulative effect on the financial statements.
Adverse Opinion
An adverse opinion is one of two significantly negative audit opinion and the worst audit opinion a Public
Enterprise can receive. An adverse opinion indicates that the Auditor General found significant material
misstatements relating to financial statements. These misstatements typically mean that financial
statements do not conform to the financial reporting standards and the information is inaccurate or
unreliable. Auditor General expresses an adverse opinion after obtaining sufficient appropriate audit
evidences, concludes that misstatements, individually or in the aggregate, are both material and pervasive
to the financial statements. Expressing an adverse opinion on financial statements by the Auditor General
is very rare as he gives an opportunity to the public enterprise to rectify the misstatements and submit a
fresh set of financial statements. In this opinion the Auditor General states that, because of the
significance of the matters described in his audit report, the financial statements do not give a true and fair
view of the financial position, financial performance and cash flows for the year in accordance with
Reporting Financial Standards.
The audit opinions expressed on 181 Public Enterprises on which the Audit Reports have been issued for
the year 2013 as compared with the preceding two years are as follows.
TYPE OF AUDIT OPINION 2013 2012 2011
Unqualified 11 16 12
Qualified 107 144 156
Disclaimer - 8 8
Adverse - 4 3
Not yet decided 43 2 -
Financial Statements not Submitted 20 7 2
41
AN
NU
AL
RE
PO
RT
OF
TH
E A
UD
IT
OR
GE
NE
RA
L
- 2
01
3
The Governing Boards of certain Public Enterprises have withdrawn their financial statements as adviced
by the Auditor General due to serious misstatements which may lead to express an adverse opinion.
These institutions were advised to prepare a fresh set of financial statements and submit to the Auditor
General for his scrutiny. Certain institutions have either not yet submitted their financial statements for
audit or done so after a considerable delay. Due to these reasons the audit opinion has not yet been
decided.
By analyzing the above data it is clear that improvements are shown in the preparation of financial
statements in compliance with the reporting standards by reducing the issue of qualified, adverse and
disclaimer of audit opinion in respect of the year 2013.
Maintaining records on Fixed Assets
Maintenance of proper records such as Registers of Fixed Assets (RFA), schedules and other records on
Non-current assets is generally poor and in certain cases very poor. Non-current asset, also known as
property, plant, and equipment (PP&E), is a term used in accountancy for assets and property which
cannot easily be converted into cash. Fixed assets normally include items such as land and buildings,
motor vehicles, furniture, office equipment, computers, fixtures and fittings, and plant and machinery. In
a large corporation, the task of identifying and locating a specific fixed asset could be difficult unless
numbering is scientific, systematic, and up-to-date. A common problem in most enterprises is the
improper maintenance of the Registers of Fixed Assets. As a result it was observed that physical
verification of fixed assets becomes a futile exercise. The managements of the enterprises have the
responsibility to maintain proper records and the safeguard of the assets owned by the institution. In most
of the cases Annual Boards of Survey had not been conducted and as a result the existence and the
condition of assets had not been confirmed.
It was also observed that there were considerable delays in capitalization of fixed assets from Work- in-
progress due to delays in issuing completion certificates by the responsible officers. This situation was
observed mainly in water projects of the National Water Supply and Drainage Board and electrification
projects completed by the Ceylon Electricity Board. This situation was also observed with regard to the
National Expressways and other major road projects completed by the Road Development Authority
(RDA) and was later rectified and the cost of these roads had been capitalized and reflected in the
financial statements of the RDA after being shown by Audit the importance of capitalizing such assets.
It is emphasized that RFA must be maintained in the updated manner by all Public Enterprises in order to
be in compliance with the Treasury Circular No. 842 of 19 December 1978, It allows the entity to keep
track of details of each fixed asset, ensuring control and preventing misappropriation of assets. It also
keeps track of the correct value of assets, which allows for computation of depreciation and for tax and
insurance purposes. The RFA generates accurate, complete, and customized reports that suits the needs of
management.
It was also observed that records of lands belonging to Sri Lanka State Plantations Corporation, Janatha
Estates Development Board and the Land Reform Commission were incomplete and were not even in a
42
AN
NU
AL
RE
PO
RT
OF
TH
E A
UD
IT
OR
GE
NE
RA
L
- 2
01
3
position to produce a detailed schedule with the location and extent to audit to confirm the existence and
ownership.
However it was also observed that considerable number of entities have now moved to identify and get
their assets valued through the Chief Government Valuer with the adoption of the new Sri Lanka
Accounting Standards which made compulsory to bring their assets to fair value basis.
Lack of Autonomy to Recruit and to retain Professional Staff
The numerous approval requirements have the overall effect of constraining the ability of Directors to
make commercial decisions and to recruit and retain skilled staff. Due to this constraint it was observed
that most of the enterprises recruit professionals on contract basis with higher salaries. Specially in the
posts of Accountants, Engineers, Valuers etc. most of the public enterprises were struggling to recruit and
retain qualified professionals due to poor salary structure as compared with the private sector.
Lack of a Succession Plan
It was observed that in certain major institutions such as CEB and CPC, several key managerial positions
had been vacant for long periods without action being taken to fill the vacancies with suitable officers.
The main reason for this situation was that any succession plan had not been prepared to cover the key
positions of the institution. This situation allowed such enterprises to continue with acting arrangements
which ultimately results in delays in work.
PAYE Tax paid by the institutions.
It was observed that 53 Public Enterprises had paid Pay As You Earn (PAYE) Tax out of their own funds
on behalf of their officers against the rationale behind the Income Tax Law. Therefore it is emphasized
that the General Treasury should take a firm decision regarding the settlement of Payee Tax which does
not vary from institution to institution. The total amount so paid for the year 2013 amounted to Rs.1,541
million as compared with Rs.1,485 million in the preceding year. As such the purpose of the PAYE Tax
would not be fulfilled and on the other hand fair treatment to all public officers has been violated.
Preparation and submission of Annual Financial Statements
The financial statements of 160 Public Enterprises for the year 2013 had been presented to the Auditor
General for audit by 30 September 2014. However it was observed that 15 Institutions had not submitted
their financial statements for the year ended 31 December 2013 even after the elapse of 9 months after the
end of the financial year. These institutions are listed below. Further 7 institutions had not submitted their
financial statements for the financial year 2012 even by 30 September 2014 after laps of 21 months.
43
AN
NU
AL
RE
PO
RT
OF
TH
E A
UD
IT
OR
GE
NE
RA
L
- 2
01
3
NAME OF THE INSTITUTION NAME OF THE INSTITUTION
Academy of Financial Studies Paddy Marketing Board
Co-operative Wholesale Establishment Ranaviru Sewa Authority
Industrial Development Board of Ceylon Saumyamoorthi Thondaman Memorial
Foundation
Institute of Valuers of Sri Lanka Sri Lanka Ceramics Corporation
Lakshman Kadiragarmar Institute Sri Lanka Cement Corporation
National Library Documentation Services Board Sri Lanka State Plantations Corporation
Sri Lanka Transport Board
State Engineering Corporation of Sri Lanka
Urban Development Authority
Table : Public Enterprises which had not submitted Financial Statements for the year 2013 to Audit
It is also emphasized that 68 institutions had withdrawn their financial statements after pointing out by me
the serious misstatements in those statements to avoid issuing of adverse audit opinion.
It is emphasized that in accordance with a decision of the Cabinet of Ministers taken in the year 2002 to
the effect that the Public Enterprises should present their Annual Financial Statements and the draft
Annual Reports for audit within 60 days after the close of the financial year, the issue of the Audit
Reports thereon to the respective Public Enterprises within a period of 30 days from the date of receipt of
the Financial Statements and that the Public Enterprises should table their Annual Reports and the audited
Financial Statements in Parliament within 150 days after the close of the relevant financial year. The
Secretary to the Treasury had, by the Public Finance Circular No.PF/PE/21 dated 24 May 2002, issued
instructions thereon for compliance.
Settlement of Advances
It was observed that considerable amount of money had remained in the accounts as advances for a long
period of time without been charged as an expense even though the goods have already been purchased or
services have already been rendered. In certain instances same officer had been given several subsequent
advances regardless of the non-settlement of the advances granted previously.
Incorporating Subsidiary Companies
It was observed that certain institutions had formed limited liability companies incorporated under the
Companies Act sometimes without the approval from the Cabinet of Ministers. This action would dilute
the functions of the main institution as well as its operations are not coming under the Auditor General‟s
scrutiny. Certain strategic institutions such as CEB and CPC hold a number of subsidiary and associated
companies and represent in the Governing Boards as the major shareholder, but it was further noted that
the excising the controlling power by the respective enterprises are weak.
44
AN
NU
AL
RE
PO
RT
OF
TH
E A
UD
IT
OR
GE
NE
RA
L
- 2
01
3
Specified Business Enterprises (SBEs)
These are enterprises that are involved in business like other private companies by providing goods or
services and in certain cases engage in active competition with the private sector. SBEs are commonly
seen in areas of the economy normally considered as Monopolies which have little or no competition
from the private sector. That is those activities are done only by the respective SBE and not readily open
to competition and private sector involvement. There is widespread involvement in resource and utility
based industries such as electricity, water, petroleum products etc.
However there are certain SBEs which are open to competition with the private sector such as Sri Lanka
Transport Board, State Banks, etc. Accordingly, 39 enterprises in operation ( other than those
incorporated under the Companies Act and not coming under the Auditor General‟s purview) at present
can be categorized under Specified Business Enterprises and only 28 enterprises have submitted their
financial statements for the year 2013 for audit even by 30 September 2014. With the adoption of Sri
Lanka Accounting Standards (SLFRS and LKAS) based on International Financial Reporting Standards
(IFRS) in the year 2012, the SBEs were compelled to apply the same. However it was observed that most
of these enterprises managed to prepare their annual financial statements in compliance with these new
Standards to a great extent which are based on fair valuation. However there were certain enterprises that
struggled to prepare their financial statements due to lack of competence and technical support. I must
emphasize that I have given fair opportunities to these institutions to rectify their financial statements by
pointing out material misstatements and non-compliances with the SLASs. Most of these entities have
taken up this trend as a positive step and resubmitted their financial statements to a reasonable fairness
which averted expressing adverse audit opinions. Due to this new arrangement there were considerable
delays in the tabling of Annual Reports in Parliament. Even though delays were occurred in the
submission of financial statements, with reasonable fairness it would ultimately enhance the
accountability to a great extent.
In view of massive investments in these Specified Business Enterprises, it is expected that they generate
adequate surplus for their own replacements, expansion and growth. Self- financing for expansion should
be made a specific obligation of public enterprises operating in industrial and commercial fields. Such
enterprises should not only cover their cost but generate surplus for financing development plans of the
entity.
The net assets as at the end of the year 2013 of those 28 enterprises which had submitted their financial
statements for audit totaled Rs.404,917 million as compared with the net assets of Rs.362,192 million as
at the end of the preceding year.
Adverse Net Asset Position
Even though Ceylon Petroleum Corporation and Janatha Estates Development Board had made profits at
the inception, these two enterprises were making continuous losses from the recent past. The aggregated
accumulated losses had increased rapidly by 31 December 2013 which had badly affected the net assets
position of these enterprises and had recorded an aggregate negative net worth of Rs. 236,826 million as
at the end of the year 2013 as compared with that in the previous year amounting to Rs. 228,797 million.
It was further observed that the current liabilities of these enterprises had exceeded their current assets by
Rs. 288,993 million. The adverse difference between current assets and current liabilities had been
45
AN
NU
AL
RE
PO
RT
OF
TH
E A
UD
IT
OR
GE
NE
RA
L
- 2
01
3
continuing for a long period of time. The inability of setting off the current liabilities by the current assets
shows a suspense situation that these enterprises had faced a critical financial crisis as well as a doubt on
their going concern without the assistance from the General Treasury.
Financial Performance
According to the financial statements presented, the working of those 28 institutions for the year ended 31
December 2013 had resulted in a profit aggregating Rs.48,261 million as compared with the
corresponding net losses aggregating Rs.101,320 million for the preceding year thus indicating an
improvement of profits by Rs.149,581 million. This improvement of financial performance of these
institutions in the year 2013 was mainly due to reduction of losses incurred by the Ceylon Petroleum
Corporation and earning a profit of Rs. 18,593 million by the Ceylon Electricity Board. Out of those 28
institutions 3 institutions had incurred losses aggregating Rs.8,370 million and 25 institutions had earned
profits aggregating Rs.56,632 million in the year 2013. Three institutions namely Ceylon Petroleum
Corporation, Ceylon Fisheries Corporation and Janatha Estate Development Board had incurred
continuous losses for the last four years ended 31 December 2013 whereas Ceylon Electricity Board and
Sri Lanka Land Reclamation and Development Corporation had been able to show an improvement in
their financial results for the year 2013 by earning profits aggregating Rs. 18,712 million against the loss
of Rs.61,489 million in the preceding year. Ceylon Petroleum Corporation had also been able to reduced
their loss by Rs. 81,836 million in 2013 showing an improvement. Only 16 entities were able to either
improve its profits or earn profit as against losses in the previous year. Profits of twelve institutions had
deteriorated by Rs. 17,226 million in the year 2013 as compared with the preceding year.
The analysis of the profitability levels of poorly performing enterprises and their relative performances
from 2008 to 2013 indicated that the poor performance during the final year of this period was the result
of the aggravation of a declining trend which was already present in the earlier years of the period. The
typical path of a poorly performing enterprise during this period was characterized by a substantial annual
decline in profitability.
There has been a considerable variability in the performance amongst SBEs as shown by the rates of
return. Return On Capital Employed (ROCE) on total assets of SBEs for the year 2013 vary from -17.9
per cent to 83.4 per cent as compared with the range of -43.4 per cent to 90.5 per cent in the year 2012.
The average annual ROCE of 1.1 per cent for the year 2013 as compared with -2.4 per cent in the
preceding year shows an improvement in the year 2013.
However, even when the deficits were extremely large, as in the case of the enterprises such as the Ceylon
Petroleum Corporation and the Ceylon Electricity Board the enterprises have not been allowed to go into
liquidation, with the balance required being subsidized directly or indirectly from Government revenue.
As emphasized in my previous year Annual Report the interdependence of major public enterprises such
as the Ceylon Petroleum Corporation on the credit facilities provided by two State Banks and the Ceylon
Electricity Board on the credit facilities provided by the Ceylon Petroleum Corporation for supplying
furnace fuel to generate power had been worsened. This situation had adversely affected the maintenance
of the required Capital Adequacy Ratio of the two State owned commercial Banks.
But in view of massive investments in these public enterprises, it is imperative that they generate
adequate surpluses for their own replacements, expansion and growth as well as for financing the future
46
AN
NU
AL
RE
PO
RT
OF
TH
E A
UD
IT
OR
GE
NE
RA
L
- 2
01
3
developments. Self-financing for expansion should be made a specific obligation of public enterprises
operating in industrial and commercial fields. Such enterprises should not only cover their cost but
generate surplus for financing development plans of the country.
The losses and poor performance of SBE‟s are attributable to a variety of factors including the following
Inadequate Treasury monitoring.
Excessive staff, high overheads and low productivity
An absence of clear accountability and performance assessments.
Poor commercial practices.
Government controls on prices.
The pursuit of non-commercial activities at the Government‟s request.
Inappropriate facilities, poor quality plant and equipment.Bank of Ceylo
Lack of skilled staff and high staff turnover.
Lack of personal consequences of success and failure (motivation of staff).
Government owned Limited Liability Companies
There is a further set of public-type enterprises in the country. They are companies with a majority
shareholding by the Government (General Treasury). These companies are incorporated under the
Companies Act and therefore not coming under the Auditor General‟s examination. These companies are
sometimes fully owned by the Government or in certain percentage of the share capital which are in
operation as public private joint ventures. Typically private sector involvement brings into play a set of
control mechanisms that help to avoid many of the problems which beset purely Government-owned
Enterprises. There are also government owned companies formed by public enterprises and registered
under the Companies Act by capital infusion by the respective public enterprises without the involvement
of the General Treasury as Subsidiary or Associate Companies. Therefore it is necessary to extend the
scope and coverage of the Auditor General to enable him to assist Parliament to exercise the full control
over public finance, as envisaged in Article 148 of the Constitution.
There were instances where certain companies have refused to appear before the Committee of Public
Enterprises when they were summoned for examination. An amendment has already been proposed in the
draft Audit Bill to cover any body or authority established by or under any written law with public
resources provided wholly or partly and whether directly or indirectly by the Government. In recent years
it was observed that considerable number of limited liability companies have been incorporated under the
Companies Act by certain public enterprises even sometimes without the approval of the Cabinet of
Ministers.
Limited Liability Companies with 100 per cent of the shares owned by the Government or a Public
Enterprise would be one in which the Government would have the power to appoint directors and in
which no private individual would receive a share of the profit. It would be virtually the same as a public
corporation apart from the fact that the simple sale of shares by the Government would be sufficient to
transform it into a normal „private sector‟ company. The sale of less than 50 per cent of the shares would
still give the Government the power to appoint the directors of the company. Even the sale of more than
50 per cent of the shares might still place the Government in a sufficiently dominant position to influence
47
AN
NU
AL
RE
PO
RT
OF
TH
E A
UD
IT
OR
GE
NE
RA
L
- 2
01
3
corporate policy. However it was observed that most of the Public Corporations do not exercise their
controlling power over the subsidiaries although their members constitute the majority of the Board of
Directors.
Continuous losses incurred by Sri Lankan Airlines Limited and Mihin Lanka Limited during the last
couple of years are massive. The cumulative loss incurred by these two airlines as at 31 March 2013 is
Rs. 90,963 million. This position had badly affected to the net assets position of these two Companies
and which recorded aggregate negative net worth of Rs. 52,912 million as at 31 March 2013 as compared
with that in the previous year amounting to Rs. 35,833 million. It was also observed that the current
liabilities had exceeded their current assets by Rs. 22,364 million. The adverse difference between current
assets and current liabilities had been continuing since the year 2007/2008. The inability of setting off the
current liabilities by the current assets shows a suspense situation that these two airlines might face a
critical financial crisis as well as a doubt on their going concern.
Other Non-Profit oriented Public Enterprises
These enterprises consist of regulatory and monitoring institutions, Universities, research and other
training institutions and other development and non-profit oriented institutions. The main feature of these
institutions are that the main source of revenue is the annual Government grant or a levy imposed by the
Government on certain goods or services. According to the financial statements of these entities 99
institutions had earned surpluses over expenditure aggregating Rs.48,730 million after taking into
consideration the recurrent grants provided to these institutions by the General Treasury in the year 2013
amounting to Rs.21,850 million. However 27 institutions had incurred net deficits aggregating Rs.772
million even after taking into consideration the recurrent grants from the General Treasury as compared
with 28 institutions with net deficits aggregating Rs.1,256 million in the preceding year which shows a
remarkable decline in net deficits by Rs. 484 million.
48
AN
NU
AL
RE
PO
RT
OF
TH
E A
UD
IT
OR
GE
NE
RA
L
- 2
01
3
_____________________________________________________________________________________________________________________________________________________________
Foreign Funded Projects _____________________________________________________________________________________________________________________
Utilization of Foreign Funds
In view of the noticeable improvement in the per capita income in Sri Lanka, a change in the composition
of the foreign financing had taken place. Accordingly, the amount of foreign funds, its sources and
composition had changed in the current year. The foreign direct grants and the foreign borrowings on
concessionary terms had reduced substantially, whereas the borrowings from the bilateral and multilateral
sources, the borrowings on mixed terms and the borrowings from the money market had increased. Sri
Lanka had received US$ 2,302 million as foreign borrowings and U.S.$ 205.6 million as grants during the
year 2013. Out of the foreign borrowing US$ 1,479.4 million had been received from bilateral sources
and US$ 455 million had been received as foreign grants. Out of the foreign borrowings 17 per cent had
been allocated for the Water Supply and Sanitation Sector, allocations at the rate of 12 per cent had been
made for Health and Social Development, the Power and Energy and the Transport Sectors while 9 per
cent had been allocated to the Education Sector.
According to the statistics of the Ministry of Finance and Planning, the foreign borrowings for settlement
for the year 2013 amounted to US$18.9 billion. This also included the loans obtained for the
Development Projects and the borrowings of International Sovereign Bonds. A sum of U.S.$ 70.5 million
had been paid as capital loan installments in the year 2013 and U.S.$ 454 million had been paid as
interest. As compared with the Gross Domestic Product of Sri Lanka loans represented 35 per cent. As
compared with the export income for the year 2013 that represented 220 per cent. The foreign debt
service ratio as compared with the Gross Domestic Product represented 3.6 per cent and the foreign debt
service ratio as compared with the export income, represented 15.2 per cent.
The recent changes in the composition of the foreign debt of Sri Lanka can be summarized as given
below.
Instead of obtaining loans from the institutions that supply foreign loans, the Government
owned Enterprises had been induced by the Government of Sri Lanka to obtain loans
direct from the Foreign and Domestic Capital Market under the Public Finance Integrated
Strategic Plan. The Road Development Authority had been authorized under this
arrangement to obtain loans amounting to Rs.151 billion from local Banks for financing
64 of its Road Development Projects. Authority had been given to the Sri Lanka Land
Reclamation and Development Corporation and the National School of Business
Management and the Sir John Kotalawala Defence University to obtain loans amounting
to Rs.51.82 billion from the local Banking System.
The Foreign and Domestic loans obtained recently on the Unsolicited Development
Proposals had increased. A methodology for such loan proposals had been introduced
through the Public Finance Circulars No. 444 of 04 August 2010 and No. 444(1) of 16
May 2011. Under this arrangement the Feasibility Reports on the development proposals
49
AN
NU
AL
RE
PO
RT
OF
TH
E A
UD
IT
OR
GE
NE
RA
L
- 2
01
3
obtained by the line Ministries are evaluated by the Standing Cabinet Appointed
Procurement Committee. Thereafter the relevant proposals are analysed by the
Department of National Planning, the Department of External Resources and the Central
Bank of Sri Lanka to bring the proposals in line with the National Development Plan.
The analysis of requirements for which loans to be obtained for this purpose and
comparison with the Public Investment Strategies are done by a Loans Evaluation
Committee of the Department of External Recourses. The selection of contractors by
calling for bids for the implementation of Unsolicited Development Proposals is not
given priority and that has posed a challenge to the Department in the implementation of
the Public Audit Methodology in this connection. It is emphasized that the
methodologies to be followed by the Treasury in this connection should be made more
formal in order to ensure transparency and responsibility.
According to the information of the Department of External Resources, agreements had been
signed for 62 new foreign funded projects in the year 2013 and 138 foreign funded projects were
being implemented as at 31 December 2013. Out of that 113 Projects had presented the financial
statements for audit. Several deficiencies observed during the course of audit are given below.
Most of the Projects did not have implementation plans and as such it had not
been possible to utilize the foreign loans for the achievement of the objectives
of the Projects.
Inefficient utilization of funds had resulted due to the absence of a sound co-
ordination among the implementing institutions.
Lack of efficient contribution from the Consultants for the achievement of
objectives of the Projects.
Lack of proper financial control due to the absence of properly functioning
internal audits.
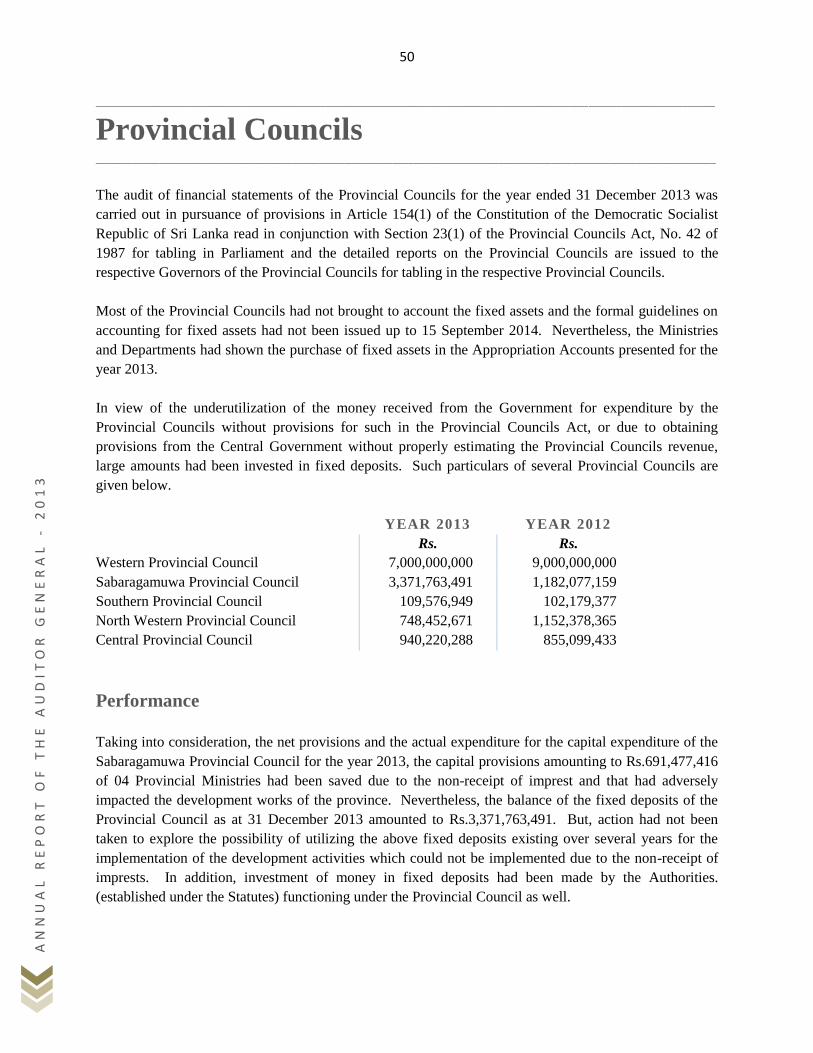
50
AN
NU
AL
RE
PO
RT
OF
TH
E A
UD
IT
OR
GE
NE
RA
L
- 2
01
3
_____________________________________________________________________________________________________________________________________________________________
Provincial Councils _____________________________________________________________________________________________________________________
The audit of financial statements of the Provincial Councils for the year ended 31 December 2013 was
carried out in pursuance of provisions in Article 154(1) of the Constitution of the Democratic Socialist
Republic of Sri Lanka read in conjunction with Section 23(1) of the Provincial Councils Act, No. 42 of
1987 for tabling in Parliament and the detailed reports on the Provincial Councils are issued to the
respective Governors of the Provincial Councils for tabling in the respective Provincial Councils.
Most of the Provincial Councils had not brought to account the fixed assets and the formal guidelines on
accounting for fixed assets had not been issued up to 15 September 2014. Nevertheless, the Ministries
and Departments had shown the purchase of fixed assets in the Appropriation Accounts presented for the
year 2013.
In view of the underutilization of the money received from the Government for expenditure by the
Provincial Councils without provisions for such in the Provincial Councils Act, or due to obtaining
provisions from the Central Government without properly estimating the Provincial Councils revenue,
large amounts had been invested in fixed deposits. Such particulars of several Provincial Councils are
given below.
YEAR 2013 YEAR 2012
Rs. Rs.
Western Provincial Council 7,000,000,000 9,000,000,000
Sabaragamuwa Provincial Council 3,371,763,491 1,182,077,159
Southern Provincial Council 109,576,949 102,179,377
North Western Provincial Council 748,452,671 1,152,378,365
Central Provincial Council 940,220,288 855,099,433
Performance
Taking into consideration, the net provisions and the actual expenditure for the capital expenditure of the
Sabaragamuwa Provincial Council for the year 2013, the capital provisions amounting to Rs.691,477,416
of 04 Provincial Ministries had been saved due to the non-receipt of imprest and that had adversely
impacted the development works of the province. Nevertheless, the balance of the fixed deposits of the
Provincial Council as at 31 December 2013 amounted to Rs.3,371,763,491. But, action had not been
taken to explore the possibility of utilizing the above fixed deposits existing over several years for the
implementation of the development activities which could not be implemented due to the non-receipt of
imprests. In addition, investment of money in fixed deposits had been made by the Authorities.
(established under the Statutes) functioning under the Provincial Council as well.
51
AN
NU
AL
RE
PO
RT
OF
TH
E A
UD
IT
OR
GE
NE
RA
L
- 2
01
3
The Authorities established under the Statutes functioning under the North Western Provincial Council
also had invested Rs.362,714,688 as at 31 December 2013 and had earned interest amounting to
Rs.39,871,627 as at that date.
The Provincial Council had provided money to most of these institutions established under the Statutes
for the payment of salaries. This matter had not been taken into account in providing money by the
Provincial Council while the Finance Commission and the Ministry of Local Government and Provincial
Councils had not taken into consideration the investments of the Provincial Council in making available
provisions to the Provincial Council.
General Observations
A summary of the general weaknesses existing in the Provincial Council System observed in audit are
given below. These deficiencies were brought to the notice of the Chief Accounting Officers, the
Accounting Officers and the other who had been functioning in the respective Provincial Councils as at
31 December 2013.
Large amounts of Courts fines and stamp duty which should be remitted to the Local Authorities
had been retained by the Provincial Councils without being so remitted.
Despite the availability of Officers in Principal‟s Grade, Non-grade Officers had been appointed
for covering up duties.
Failure to take appropriate action on losses and damage reported.
Certain institutions of Provincial Councils had not conducted Boards of Survey as at 31
December 2013. Appropriate action had not been taken on the deficiencies and shortages pointed
out in the reports of the Boards of Survey conducted.
Action had not been taken either for the use of the drugs of the Hospitals and Central
Dispensaries under the purview of the Provincial Councils before the expiry of validity or for
releasing those to other institution which need those drugs.
An indifferences had been shown by the authorities concerned in the implementation of the
directives made by the Provincial Accounts Committees on the matters surfaced at the discussion
of the Reports of the Auditor General.
Attention had not been paid for the effective direction of the Audit and Management Committees
functioning under the Provincial Councils.
Deficiencies such as the non-execution of certain items of work satisfactorily, non-preparation of
accurate cost estimates and the failure to follow the correct procurement procedure were observed
in relation to the contract works executed by certain institutions of the Provincial Councils were
observed.
52
AN
NU
AL
RE
PO
RT
OF
TH
E A
UD
IT
OR
GE
NE
RA
L
- 2
01
3
_____________________________________________________________________________________________________________________________________________________________
Local Authorities _____________________________________________________________________________________________________________________
Identification, implementation and evaluation of the common amenities and services that need to be
introduced and those existing at present, taking into consideration the social, economic and cultural needs
of the tax payers living in the Local Authority areas to their satisfaction are the key functions of the Local
Authorities.
Improvement observations relating to poor financial Management revealed during the course of the audit of
financial statements for the year 2013 furnished by Local Authorities are given below.
There were 335 Local Authorities comprising 23 Municipal Councils, 41 Urban Councils and 271
Pradeshiya Sabhas functioning as at 31 December 2013. 310 Local Authorities had presented financial
statements for the year under review for audit by 10 October 2014.
The audits of the financial statements of Local Authorities for the year under review were carried out in
pursuance of provisions in Article 154(1) of the Constitution of the Democratic Socialist Republic of Sri
Lanka read in conjunction with Section 219 of the Municipal Councils Ordinance (Cap. 252), Section
181(1) of the Urban Councils Ordinance (Cap. 255) and Section172(1) of the Pradeshiya Sabha Act, No. 15
of 1987. The matters observed during the course of audits are summarized below.
The respective authorities had not taken legal action in accordance with the Statutory
provisions in Section 254(1) of the Municipal Councils Ordinance, Section 170(A)(1) of
the Urban Councils Ordinance and Section 166 of the Pradeshiya Sabha Act for the
collection of the arrears of revenue and as such, the arrears of revenue of certain Local
Authorities had been increasing year after year.
The statutory provisions have been made in the Ordinances and Acts on Local Authorities for the
Local Authorities to charge 1 per cent tax on the annual receipts of hotels and lodging houses
approved by and registered with the Sri Lanka Tourism Development Authority. But most of the
Local Authorities are deprived of a considerable amount of revenue annually due to the failure to
by-laws for obtaining the information on the annual receipts.
According to the Gazette Notification published by the Urban Development Authority in relation to
the sub-division and sale of private lands in the areas of authority of Municipal Councils, Urban
Councils and Pradeshiya Sabhas, block of land 10 per cent of the extent of such lands should be
allocated to the respective Local Authorities for common purposes. Instances of failure to allocate
the specified extent from the lands sold for common purposes were revealed in audit while most of
the blocks of land allocated were not suitable for common purposes. Certain Local Authorities had
not collected the 1 per cent tax on the sale price recoverable in accordance with Statutory
provisions.
53
AN
NU
AL
RE
PO
RT
OF
TH
E A
UD
IT
OR
GE
NE
RA
L
- 2
01
3
There were instances of failure to carry out surveys of advertising boards and display boards
installed in the areas of authority of Local Authorities and collect revenue in accordance with the
provisions in by-laws.
Local Authorities are authorized to recover a business tax from the professionals not exceeding an
amount determined by the Minister in terms of the provisions in Section 247(c)(1A) of the
Municipal Councils Ordinance, Section 165(1)(A) of the Urban Councils Ordinance and Section
152(2) of the Pradeshiya Sabha Act. But there was no possibility of imposing taxes on professions
as the Minister had not made orders in accordance with those provisions.
Most of the Local Authorities had failed to recover the specified environmental charges on the
telephone/telecommunication towers in accordance with the provisions in the Gazette Notification
published in the year 2009 by the Ministry of Urban Development and Sacred Areas Development.
Local Authorities are accustomed only for billing revenue receivable periodically. The adoption of
methodologies for the promotion of revenue through identification of new revenue sources and the
improvement of the existing revenue had been at a weak level.
Many instances of non-compliance with the agreed specifications and standard criteria were
observed in relation to the constructions of rural roads under the Maga Neguma Rural Roads
Development Proramme were observed.
An adequate internal audit of the Local Authorities had not been carried out.
The major problems faced by the Local Authorities are the inability of discharge the statutory functions
devolves on the Local Authorities, maintenance of public utility services and the inability to generate
revenue required for the development works. In such circumstances, those institutions were dependent on
Government Capital Grants.
The attention of the authorities concerned should be paid to the following areas to break off from this
situation.
Formulation of draft enactment providing for the direct remittance of the fines relating to the
Local Authorities imposed by the Courts in the areas of Local Authorities,
Formulation of a mechanism for the recovery of the 1 per cent payable on the gross value of
the property to the Local Authorities as an advance at the time of approval of the Sub-
division Plans and,
The introduction of institutional framework for the implementation of a sound revenue
promotion process in the Local Authorities prepared by revising the age old by-laws in line
with the current requirements.
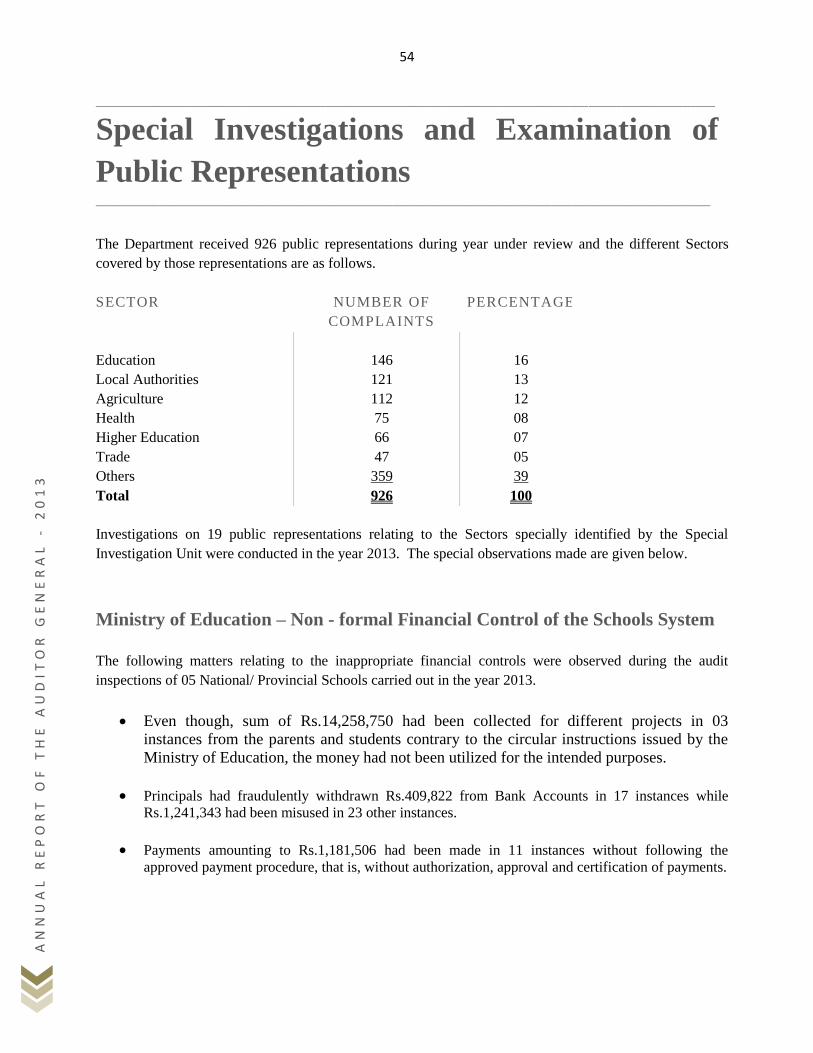
54
AN
NU
AL
RE
PO
RT
OF
TH
E A
UD
IT
OR
GE
NE
RA
L
- 2
01
3
_____________________________________________________________________________________________________________________________________________________________
Special Investigations and Examination of
Public Representations ____________________________________________________________________________________________________________________
The Department received 926 public representations during year under review and the different Sectors
covered by those representations are as follows.
SECTOR NUMBER OF
COMPLAINTS
PERCENTAGE
Education 146 16
Local Authorities 121 13
Agriculture 112 12
Health 75 08
Higher Education 66 07
Trade 47 05
Others 359 39
Total 926 100
Investigations on 19 public representations relating to the Sectors specially identified by the Special
Investigation Unit were conducted in the year 2013. The special observations made are given below.
Ministry of Education – Non - formal Financial Control of the Schools System
The following matters relating to the inappropriate financial controls were observed during the audit
inspections of 05 National/ Provincial Schools carried out in the year 2013.
Even though, sum of Rs.14,258,750 had been collected for different projects in 03
instances from the parents and students contrary to the circular instructions issued by the
Ministry of Education, the money had not been utilized for the intended purposes.
Principals had fraudulently withdrawn Rs.409,822 from Bank Accounts in 17 instances while
Rs.1,241,343 had been misused in 23 other instances.
Payments amounting to Rs.1,181,506 had been made in 11 instances without following the
approved payment procedure, that is, without authorization, approval and certification of payments.
55
AN
NU
AL
RE
PO
RT
OF
TH
E A
UD
IT
OR
GE
NE
RA
L
- 2
01
3
Ministry of Education – Supply of School Uniforms
A sum of US$ 5,473,800 had been spent in the year 2013 for the import of Uniform Materials for school
children. The following matters were revealed at an audit inspection carried out, in that connection.
The above procurement had not been done under the International Competitive Bidding
Procedure in accordance with the Government Procurement Guidelines.
Supply Orders had not been given to a Government institution which had submitted the lowest
quotations without adducing specific reasons and as compared with the quotations submitted by the
institution to which the orders were issued, the price exceeded that of the Government institution
by a sum of Rs.68,419,000.
It was established that a loss of Rs.83,340,000 had been caused due to the failure to invite separate
bids for the selection of suppliers for 3 types of uniforms.
Failure to make supplies on the agreed dates and the failure to carry out proper quality tests prior to the
import and distribution of uniform materials to the Schools System were observed. An additional interest
amounting to Rs.30.42 million had to be paid due to the failure to release money to the Banks for Letters of
Credit on the due dates. The two institutions which supplied 58 per cent of the textiles were owned by the
same person.
Ministry of Economic Development – Divineguma Programme
Purchase of Seed Sets
The following observations were made at the audit inspection of the purchase of seed sets for Rs. 232
million in the year 2013 for free distribution to the public under the Divineguma National Development
Programme.
According to the bid conditions, the seeds should be of 98 per cent physical purity and a
minimum of 75 per cent germination strength supported by test reports. But such reports
on the seeds imported had not been submitted for the seeds supplied. Despite that the
imported seeds had been accepted and distributed.
According to a sample test carried out to ascertain the quality of seeds the germination
capacity ranged between 11.9 per cent to 75 per cent. The value of seeds with minimum
germination capacity amounted to Rs.4.64 million. The seeds with 75 per cent germination
ranged between 7.2 per cent to 15.6 per cent of the total supply. The low success of the
seeds purchased had been due to the low germination capacity of 1 per cent to 10 per cent.
The number of seeds in a set had been less than the specified number in certain instances.
The computer software of the institution had not been used for the issue of seed reports.
56
AN
NU
AL
RE
PO
RT
OF
TH
E A
UD
IT
OR
GE
NE
RA
L
- 2
01
3
Sri Lanka Sustainable Energy Authority – Construction of Ten Minor Gauge
Towers
A contract valued at Rs.16,675,000 for the construction of ten windgauge towers and a contract valued at
Rs.7,095,000 for the supply of wind gauge equipment had been entered into in the year 2010 with a view to
collecting data on wind. The following matters were observed at an examination of the success of the
project.
The towers had not been constructed within the agreement period and the delays in the construction of 05
towers ranged from 03 months to 2 ½ years. One tower had not been constructed and two towers had not
been in working condition and the commencement of collection of data and computerization of data had
been inordinately delayed.
Manufacture of Three Electric Motors
Agreements had been entered into on 07 September 2007 for the manufacture of 03 electric motors at a cost
of Rs. 9 million as a new test project under the Technological Development Programme. The following
matters were observed at audit examination of the success of the project.
The feasibility study of the project had not been done as specified while the supervision had not been done
properly. Even though a sum of Rs.7,887,600 had been spent on the project up to 14 December2009, the
model electric motors had not been manufactured and handed over even by 07 February 2013.
57
AN
NU
AL
RE
PO
RT
OF
TH
E A
UD
IT
OR
GE
NE
RA
L
- 2
01
3
PART V
DETAILED REVIEW OF
STATE AUDIT SECTORS
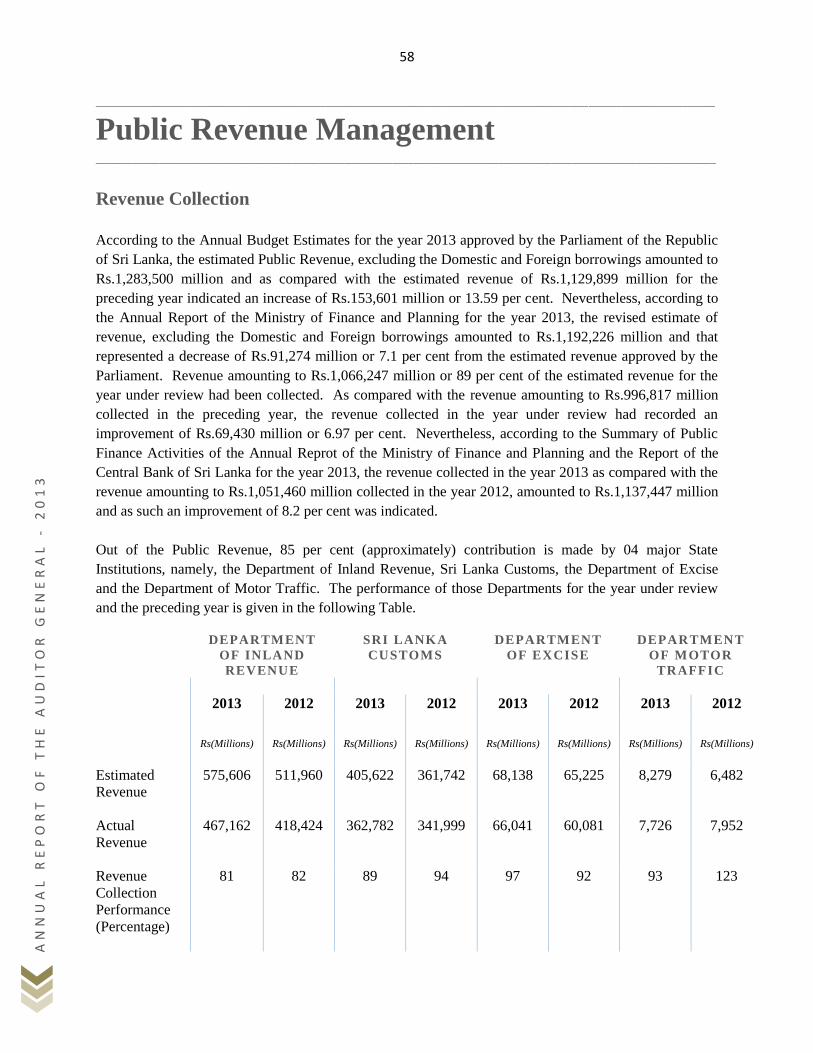
58
AN
NU
AL
RE
PO
RT
OF
TH
E A
UD
IT
OR
GE
NE
RA
L
- 2
01
3
_____________________________________________________________________________________________________________________________________________________________
Public Revenue Management _____________________________________________________________________________________________________________________
Revenue Collection
According to the Annual Budget Estimates for the year 2013 approved by the Parliament of the Republic
of Sri Lanka, the estimated Public Revenue, excluding the Domestic and Foreign borrowings amounted to
Rs.1,283,500 million and as compared with the estimated revenue of Rs.1,129,899 million for the
preceding year indicated an increase of Rs.153,601 million or 13.59 per cent. Nevertheless, according to
the Annual Report of the Ministry of Finance and Planning for the year 2013, the revised estimate of
revenue, excluding the Domestic and Foreign borrowings amounted to Rs.1,192,226 million and that
represented a decrease of Rs.91,274 million or 7.1 per cent from the estimated revenue approved by the
Parliament. Revenue amounting to Rs.1,066,247 million or 89 per cent of the estimated revenue for the
year under review had been collected. As compared with the revenue amounting to Rs.996,817 million
collected in the preceding year, the revenue collected in the year under review had recorded an
improvement of Rs.69,430 million or 6.97 per cent. Nevertheless, according to the Summary of Public
Finance Activities of the Annual Reprot of the Ministry of Finance and Planning and the Report of the
Central Bank of Sri Lanka for the year 2013, the revenue collected in the year 2013 as compared with the
revenue amounting to Rs.1,051,460 million collected in the year 2012, amounted to Rs.1,137,447 million
and as such an improvement of 8.2 per cent was indicated.
Out of the Public Revenue, 85 per cent (approximately) contribution is made by 04 major State
Institutions, namely, the Department of Inland Revenue, Sri Lanka Customs, the Department of Excise
and the Department of Motor Traffic. The performance of those Departments for the year under review
and the preceding year is given in the following Table.
DEPARTMENT
OF INLAND
REVENUE
SRI LANKA
CUSTOMS
DEPARTMENT
OF EXCISE
DEPARTMENT
OF MOTOR
TRAFFIC
2013 2012 2013 2012 2013 2012 2013 2012
Rs(Millions) Rs(Millions) Rs(Millions) Rs(Millions) Rs(Millions) Rs(Millions) Rs(Millions) Rs(Millions)
Estimated
Revenue
575,606 511,960 405,622 361,742 68,138 65,225 8,279 6,482
Actual
Revenue
467,162 418,424 362,782 341,999 66,041 60,081 7,726 7,952
Revenue
Collection
Performance
(Percentage)
81 82 89 94 97 92 93 123

59
AN
NU
AL
RE
PO
RT
OF
TH
E A
UD
IT
OR
GE
NE
RA
L
- 2
01
3
Composition
(As a
Percentage
of the Total
Public
Revenue)
43.81 39.24 34.02 32.01 6.19 5.63 0.72 0.74
The above Departments had failed to collect revenue exceeding the estimated revenue during the year
under review. Nevertheless, the contribution to the Public Revenue Structure in the year 2012 had been
further deteriorated in year 2013 only in Department of Motor Traffic. Further, the revenue of the
Government of Sri Lanka from the Value Added Tax for the year 2013 amounted to Rs.217,687 million
and that included Value Added Tax amounting to Rs.104,517 million collected on imports by the Sri
Lanka Customs.
Public Revenue is classified under Tax Revenue and Non-Tax Revenue and the revenue so collected
during the year under review and the 04 preceding years is given in the following Table.
ITEM 2013 2012 2011 2010 2009
Rs.Millions Rs.Millions Rs.Millions Rs.Millions Rs.Millions
Tax Revenue 1,005,895 908,913 845,697 724,748 618,932
Non-Tax Revenue 131,552 142,547 122,165 92,532 80,712
Total Revenue 1,137,447 1,051,460 967,862 817,280 699,644
Source : Annual Report of the Ministry of Finance and Planning
As compared with the Public Revenue amounting to Rs.1,051,460 million reported in the year 2012, the
Public Revenue reported in the year 2013 had improved by Rs.85,987 million or 8.18 per cent to
Rs.1,137,447 million. According to the overall performance of the revenue, despite the decrease of the
Non-Tax Revenue by Rs.10,995 million or 7.71 per cent as compared with the year 2012, the
improvement of the Tax Revenue by Rs.96,982 million or 10.67 per cent had impacted the improvement
of the overall Public Revenue.
The improvement of the income tax, taxes based on the local consumption and the taxes on imports
representing 19.2 per cent, 10.9 per cent and 7.4 per cent respectively had impacted the 10.67 per cent
improvement in the total tax revenue.
The Non-Tax Revenue, as compared with the year 2012, had decreased by Rs.10,995 million or 7.71 per
cent in the year 2013 and the decrease of the transfer of Profits from the Central Bank and the revenue
from dividends had impacted that decrease.
Gross Domestic Product and Public Revenue
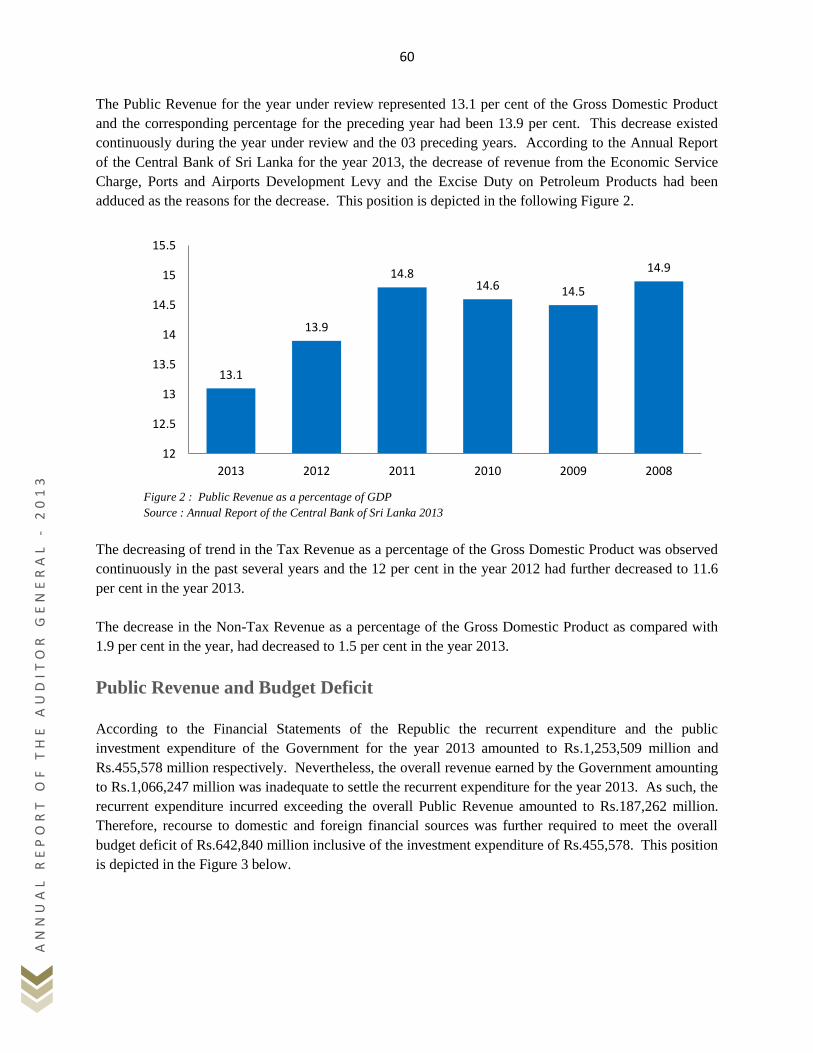
60
AN
NU
AL
RE
PO
RT
OF
TH
E A
UD
IT
OR
GE
NE
RA
L
- 2
01
3
The Public Revenue for the year under review represented 13.1 per cent of the Gross Domestic Product
and the corresponding percentage for the preceding year had been 13.9 per cent. This decrease existed
continuously during the year under review and the 03 preceding years. According to the Annual Report
of the Central Bank of Sri Lanka for the year 2013, the decrease of revenue from the Economic Service
Charge, Ports and Airports Development Levy and the Excise Duty on Petroleum Products had been
adduced as the reasons for the decrease. This position is depicted in the following Figure 2.
Figure 2 : Public Revenue as a percentage of GDP
Source : Annual Report of the Central Bank of Sri Lanka 2013
The decreasing of trend in the Tax Revenue as a percentage of the Gross Domestic Product was observed
continuously in the past several years and the 12 per cent in the year 2012 had further decreased to 11.6
per cent in the year 2013.
The decrease in the Non-Tax Revenue as a percentage of the Gross Domestic Product as compared with
1.9 per cent in the year, had decreased to 1.5 per cent in the year 2013.
Public Revenue and Budget Deficit
According to the Financial Statements of the Republic the recurrent expenditure and the public
investment expenditure of the Government for the year 2013 amounted to Rs.1,253,509 million and
Rs.455,578 million respectively. Nevertheless, the overall revenue earned by the Government amounting
to Rs.1,066,247 million was inadequate to settle the recurrent expenditure for the year 2013. As such, the
recurrent expenditure incurred exceeding the overall Public Revenue amounted to Rs.187,262 million.
Therefore, recourse to domestic and foreign financial sources was further required to meet the overall
budget deficit of Rs.642,840 million inclusive of the investment expenditure of Rs.455,578. This position
is depicted in the Figure 3 below.
13.1
13.9
14.8 14.6 14.5
14.9
12
12.5
13
13.5
14
14.5
15
15.5
2013 2012 2011 2010 2009 2008
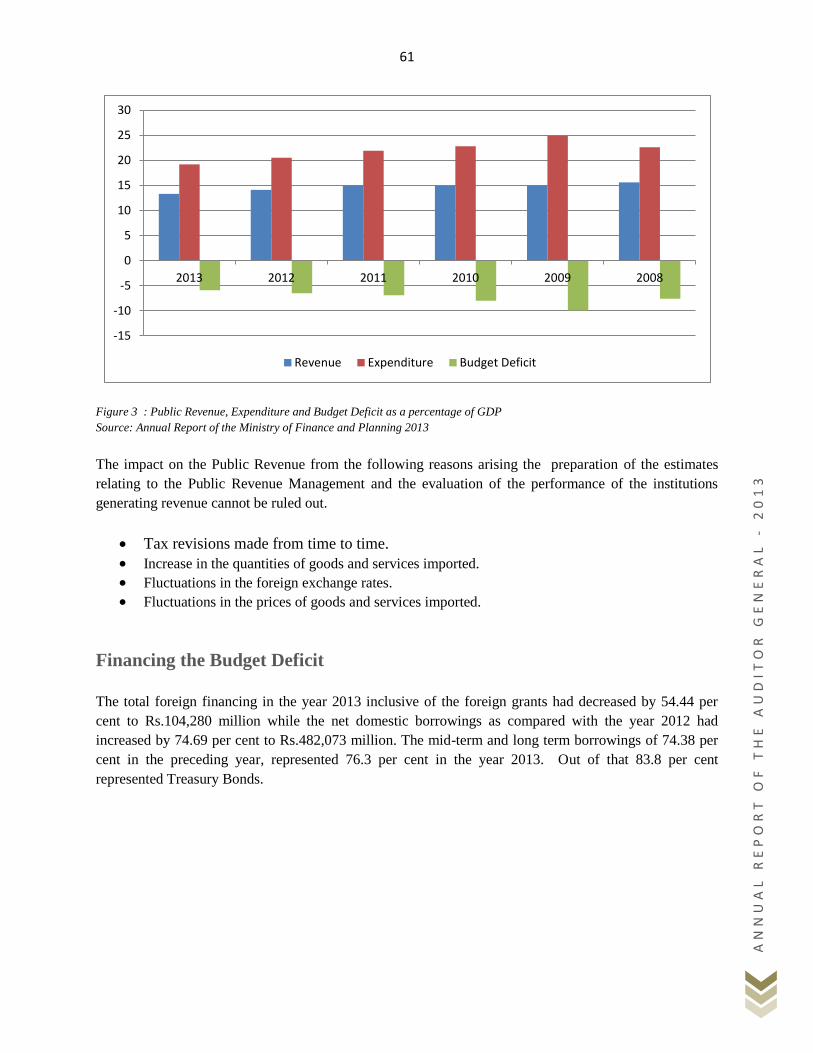
61
AN
NU
AL
RE
PO
RT
OF
TH
E A
UD
IT
OR
GE
NE
RA
L
- 2
01
3
Figure 3 : Public Revenue, Expenditure and Budget Deficit as a percentage of GDP
Source: Annual Report of the Ministry of Finance and Planning 2013
The impact on the Public Revenue from the following reasons arising the preparation of the estimates
relating to the Public Revenue Management and the evaluation of the performance of the institutions
generating revenue cannot be ruled out.
Tax revisions made from time to time.
Increase in the quantities of goods and services imported.
Fluctuations in the foreign exchange rates.
Fluctuations in the prices of goods and services imported.
Financing the Budget Deficit
The total foreign financing in the year 2013 inclusive of the foreign grants had decreased by 54.44 per
cent to Rs.104,280 million while the net domestic borrowings as compared with the year 2012 had
increased by 74.69 per cent to Rs.482,073 million. The mid-term and long term borrowings of 74.38 per
cent in the preceding year, represented 76.3 per cent in the year 2013. Out of that 83.8 per cent
represented Treasury Bonds.
-15
-10
-5
0
5
10
15
20
25
30
2013 2012 2011 2010 2009 2008
Revenue Expenditure Budget Deficit
62
AN
NU
AL
RE
PO
RT
OF
TH
E A
UD
IT
OR
GE
NE
RA
L
- 2
01
3
Special Investigations on the Public Revenue Management conducted by the Auditor General’s
Department and their Impact on Public Revenue.
The errors, weaknesses, inefficiencies and the uneconomic features prevailing in the Public Revenue
Management detected at the Special Investigations of the Public Revenue Management undertaken by the
Auditor General‟s Department from time to time had been pointed out. Even though observations on
these have been made continuously through audit queries and reports it has to be pointed out that the slow
progress in the action taken to minimize those deficiencies had adversely impacted the Public Revenue
Management. The summarized information on several weaknesses in the primary internal controls
observed at the audits of the 04 main institutions collecting Public Revenue, namely the Department of
Inland Revenue, Sri Lanka Customs, the Department of Excise and the Department of Motor Traffic are
given below.
Immediate action for the introduction of special methodologies for the prevention of error
and fraud had not been taken even after the areas of audit risk in the revenue systems
were pointed out in audit.
Action not taken for the prevention of the weaknesses prevailing in the methodologies for
maintenance and reporting of information of Government Institutions.
Lack of proper implementation of the accountability process.
Lack of an interconnected and updated information network system among the revenue collecting
authorities and the lack of co-operation for the rectification of the weaknesses in the laws, rules
and regulations existing in the respective Sectors.
Lack of strengthening of the methodologies relating to the prevention of revenue frauds from time
to time.
Lack of an accurate data system for the accurate estimation of revenue by identifying the future
uncertainties.
Greater attention should be paid to the protection of the existing revenue sources and the identification of
new revenue sources by minimizing the above weaknesses in the internal control.
Several weaknesses observed in the collection of revenue by the Sri Lanka Customs under 15 Revenue
Codes contributing over 34 per cent of the Public Revenue in the year under review are given below.
Nearly 84 per cent of the Customs Declarations relating to the release of containers had
been done through the Amber Channel where simple checks are exercised, thus leaving
room for the import goods contrary to the provisions in the Customs Ordinance and the
possibility of non-recovery of Public Revenue.
The possibility of loss of revenue due to the lack of a relevant information system for
determining the Customs examination methodology and the weaknesses arising from the
63
AN
NU
AL
RE
PO
RT
OF
TH
E A
UD
IT
OR
GE
NE
RA
L
- 2
01
3
officers of the Screening Division due to the changes made to the examination
methodology selected automatically at the discretion of the officers.
Four scanners purchased for U.S.$ 15,600,000 had been utilized for scanning of about
9.57 per cent of the total number of Customs Entries despite spending Rs.3,876,000 for
servicing quarterly in addition to the heavy cost of maintenance and salaries, thus
resulting in limiting in opportunities for the detection of Customs Offences.
As the Sri Lanka Customs is not performing a direct supervision of the import and export
containers of the institutions registered in the Board of Investments of Sri Lanka which
play a major role in the import and export process, any Customs offences committed are
not revealed.
In view of the current policy on charging duty on motor vehicles imported, very often a
lesser amount is taken into consideration for charging duty on motor vehicles purchased
at high prices from auctions in Japan.
In view of the failure to transmit all the data relating all motor vehicles to the Department
of Motor Traffic in a manner to prevent the fraudulent use of the Customs Declarations
relating to other motor vehicles for the registration of illegally imported or assembled
motor vehicles and the failure of the Customs to recapture and reconcile such data results
in the loss of revenue.
A system for the prevention of tax frauds through the registration and use of motor
vehicles fraudulently imported under the Customs Harmonized Nomenclature Number
for ambulances and hearses carrying a lower duty, under other categories of motor
vehicles.
Loss of tax revenue due to practices such as the delay in the submission of quarterly
reports on the collection of Excise Duty, failure to check their correctness, suspension of
production on all inspection days, deployment of the same group of officers for
supervision and non-maintenance of observation reports in writing.
In view of the absence of a formal control and supervision of the imports and exports
under the INFAC Scheme implemented for providing relief to the manufacturers of
garments not registered under the Board of Investments of Sri Lanka, instances of misuse
of the relief provided exist.
The contribution to the Public Revenue had been lost due to reasons such as the failure to
follow a formal storage methodology for the Security Rooms, the failure carry out a
proper handover of the stores on transfer, the non-maintenance of accurate and updated
stores registers, the difficulties in locating goods/items, certain goods perishing in the
stores and the unauthorized removal of parts from the goods at the time of issue of goods
for sale by the Central Disposal Division.
64
AN
NU
AL
RE
PO
RT
OF
TH
E A
UD
IT
OR
GE
NE
RA
L
- 2
01
3
The possibility of losses caused to the Public Revenue due to reasons such as subjecting
about 15 per cent to 18 per cent of the parcels in the release of parcels by the Customs
Postal Division, the lack of a proper supervision of Customs examinations and the non-
maintenance of a proper methodology for the maintenance of information and records
relating to import of goods through the Post Offices.
Several weaknesses observed in the collection of revenue by the Department of Inland Revenue,
contributing 43.81 per cent of the Public Revenue in the year under review are given below.
Even though the retention of 1/3 of the Value Added Tax and remitting the money to the
Department had made it possible to credit 1/3 of the tax to the Public Revenue and as
such checking whether the tax had been collected, in view of the amendments made with
effect from 01 April 2011 crediting of tax had been delayed in addition to be weakening
of the controls relating to the recovery of taxes.
In view of the deficiencies in the computer system maintained by the Department for the
purpose of tax administration, recording of taxes, refunds and other information had not
been at an accepted level in addition to the existence of instances of action taken contrary
to the instructions on computerizing taxes.
Tax payers are not induced to pay taxes due to the inability of the tax payers to understand the
prevailing tax systems in view of the complex nature of the Tax Laws and Rules enacted for the
purpose.
Failure to take timely and meaningful courses of action for the recovery of arrears of taxes.
Failure to call for the remittance slips on the taxes paid to Banks.
Delays prevailing from the payment of taxes to the Banks by taxpayers up to crediting such taxes
to the Public Revenue and differences existing between those returns.
Several weaknesses observed in the collection of revenue by the Department of Excise under 2 Revenue
Codes contributing 6.19 per cent of the Public Revenue are given below.
The progress of the recovery of arrears of Excise Revenue is not satisfactory while timely
and meaningful courses of action had not been taken for the recovery of arrears of tax.
Misplacing the old files of licence holders as well as the failure to furnish files to audit.
The collection of taxes by the officers attached to the distilleries had not been subjected to regular
test checks by the Department.
A computer system providing for simple and accurate collection of Excise Revenue and
accounting thereof had not been implemented.
65
AN
NU
AL
RE
PO
RT
OF
TH
E A
UD
IT
OR
GE
NE
RA
L
- 2
01
3
Weaknesses in the Collection of Revenue by the Department of Motor Traffic
Even though the Department of Motor Traffic collecting revenue under 3 Revenue Codes contributes less
than one per cent of the total Public Revenue, the prevailing internal control weaknesses as well as the
activities of the Department pose an extremely adverse impact on the collection of tax revenue on the
motor vehicle imports which contribute about 30 per cent of the revenue collected by the Sri Lanka
Customs. The audit observations on such instances are given below.
The information on illegally imported motor vehicles without the payment of Customs
Duty had been fraudulently registered by erroneously entering the information of such
motor vehicles to the numbers in the G, H and J series under which motor vehicles had
not been registered.
Brand new motor vehicles illegally imported had been fraudulently registered by
shrewdly altering the information on motor cycles and other low priced motor vehicles
registered under the G, H and J and erroneously entering the information of the illegally
imported motor vehicles.
Motor vehicles had been fraudulently registered by preparing forged documents as motor
vehicles auctioned by the Three Forces.
Brand new motor vehicles illegally imported without paying Customs Duty had been
fraudulently registered based on forged documents.
Motor vehicles illegally imported without paying Customs Duty had been fraudulently
registered by forging documents as motor vehicles auctioned by the Customs.
Fraudulent registration of motor vehicles by entering forged Customs Declaration
Numbers.
Double cab motor vehicles imported had been registered as motor cars.
Registration of luxury motor vehicles by utilizing Customs Declaration Numbers relating
to the import of motor cycles and other goods and other documents.
Registration of luxury motor vehicles by paying duty as hand tractors and utilizing other
erroneous documents.
The conditions attached to the vans imported by places of religious worship under import
licences under the Gift Scheme had been fraudulently eliminated and registered. Large
scale customs irregularities had been committed by erroneous alteration of the year of
manufacture and committing other offences.
66
AN
NU
AL
RE
PO
RT
OF
TH
E A
UD
IT
OR
GE
NE
RA
L
- 2
01
3
Fraudulent registration of illegally imported or assembled motor cycles and hand
tractors.
Large scale customs duty irregularities had been committed by the conversion of motor
vehicles imported by paying duty as double cab motor vehicles to five door luxury motor
vehicles and the conversion of motor vehicles imported by the payment of customs duty
as single cab motor vehicles as double cab motor vehicles.
Fraudulent registration of motor vehicles by utilizing Customs Declarations for the
import of motor vehicle spare parts.
Motor vehicles imported under Customs Harmonized Nomenclature 8705 for special
purposes other than the transport of goods and passengers had been registered as dual
purpose motor vehicles or motor lorries.
The motor vehicles brought for the use of the foreigners arriving temporarily to this
country or for use by foreign institutions under the Carnet Permits had been registered in
the Department of Motor Traffic after the expiry of the Carnet Permit and without the
payment of duty.
Illegally imported or assembled brand new motor vehicles had been registered under the
identification numbers of motor vehicles taken off from running due to accidents or other
reasons.
The use of brand new motor vehicles under old numbers had been permitted by allowing
the stamping of the chassis numbers of old motor vehicles registered with the
Department.
According to Section 16 of the Motor Traffic (Amendment) Act, No. 8 of 2009 no person
shall fabricate, manufacture, assemble, innovate, adopt, modify or change the
construction of a motor vehicle in Sri Lanka except with the prior written approval of the
Commissioner General. Nevertheless, the fact that the old designs have been totally
altered by violating the above provision. Instead of examining such motor vehicles and
taking action in accordance with the legal provisions the officers responsible had taken
action to regularize that situation.
Deviating from the provisions in the Act, the classification of the motor vehicles subject
to the luxury tax have been applied erroneously, thus resulting in the recovery of semi-
luxury tax from motor vehicles on which luxury tax should be recovered.
The Government had been deprived of a large sum of luxury tax due to the registration of
dual purpose motor vehicles as motor lorries.
67
AN
NU
AL
RE
PO
RT
OF
TH
E A
UD
IT
OR
GE
NE
RA
L
- 2
01
3
Books and registers had not been maintained systematically to facilitate the identification
of arrears of revenue and proper courses of action and not been taken for the recovery of
arrears of revenue.
Substantial loss is caused to the Government annually due to the non-recovery of the
luxury tax on motor vehicles subject such tax and due to the failure to recover the tax on
timely basis.
68
AN
NU
AL
RE
PO
RT
OF
TH
E A
UD
IT
OR
GE
NE
RA
L
- 2
01
3
_____________________________________________________________________________________________________________________________________________________________
Public Expenditure Management _____________________________________________________________________________________________________________________
The Minister of Finance is charged with the raising of Revenue and the collection of other Government
monies as well as with the general oversight of all the financial operations of the Government by Financial
Regulation 124. He or the Treasury on his behalf therefore lays down the broad framework within which
the Departmental financial transactions of all kinds may be undertaken. It is the duty of the Minister of
Finance to account to Parliament for all receipts and payments. He therefore appoints each Secretary to a
Ministry to be the Chief Account Officer and delegates to him the responsibility of Departmental
transactions on the collection of and incurring expenditure from, the public funds subject to the direction of
the Treasury. In addition to the Secretaries to the Ministries, the officers in charge of the Departments
specified in Article 52(7) of the Constitution and the other Departments not supervised by Secretaries to
Ministries will be the Chief Accounting Officers for the discharge of the Constitutional responsibility
relating to supervision of financial transactions of those Departments.
The full control over public finance is vested in the Parliament in pursuance of the provisions in Article 148
of Chapter XVII of the Constitution of the Democratic Socialist Republic of Sri Lanka in relation to the
control over public finance. The provisions required for the public expenditure for the year 2013 had been
made in the Appropriation Act, No. 23 of 2012. Accordingly, provision amounting to Rs.1,387 billion
comprising Rs.827 billion for recurrent expenditure and Rs.560 billion for capital expenditure had been
made under 202 Heads of Expenditure. Expenditure amounting to Rs.1,180 billion comprising recurrent
expenditure of Rs.462 billion and capital expenditure of Rs.718 billion as approval by the existing laws to
be charged to the Consolidated Fund, should have been incurred in the year under review. As such
provision amounting to Rs.2,567 billion had been made in the Annual Budget Estimates for the year 2013.
Together with the additional provisions of Rs.36 billion made for the Special Law Services the annual
provision for the year 2013 amounted to Rs.2,603 billion. Parliament had made provision amounting to
Rs.74 billion comprising Rs.37 billion for recurrent expenditure and Rs.37 billion for capital expenditure
under Head 240 Department of National Budget – Development Programme 2.
Utilization of Funds
Even though provision amounting to Rs.2,603 billion had been made for the year 2013, the utilization
amounted to Rs.2,412 billion, thus resulting in savings amounting to Rs.191 billion. As compared with the
savings amounting to Rs.101 billion for the preceding year, an increase of Rs. 90 billion in savings was
observed. Even though the provisions amounting to Rs.2,603 billion had been transferred to the Heads and
utilized, out of the net provisions amounting to Rs.13 billion made under 38 Objects of the year under
review, the entire provisions had been saved without making any utilization whatsoever. That represented
6.8 per cent of the overall savings. The savings out of net provisions ranging from 76 per cent to 99 per
cent amounted to Rs. 16 billion and that represented 8.4 per cent of the overall savings. Similarly, the
savings out of the net provisions ranging from 51 per cent to 75 per cent amounted to Rs. 25 billion and that
represented 13.1 per cent of the overall savings. Out of the overall savings amounting to Rs. 191 billion,
70.2 per cent or Rs. 134 billion represented savings of recurrent provisions and 29.8 per cent or Rs.57
69
AN
NU
AL
RE
PO
RT
OF
TH
E A
UD
IT
OR
GE
NE
RA
L
- 2
01
3
billion out of the overall savings represented capital provision. The estimated capital expenditure for the
year 2013, except the loan repayments amounted to Rs. 545 billion and the utilization out of that amounted
to 83.7 per cent or Rs. 456 billion. That as compared with the capital provision of Rs. 471 billion utilized
in the preceding year indicated a decrease of Rs.15 billion. The recurrent and capital provisions utilized in
the year under review and the 04 preceding years are given in the Table below.
YEAR 2013 2012 2011 2010 2009
Rs.Billions Rs.Billions Rs.Billions Rs.Billions Rs.Billions
Recurrent 1,956 1,721 1,562 1,404 1,381
Capital 456 471 399 347 366
Total 2,412 2,192 1,961 1,751 1,747
Source: Financial Statements of the Democratic Socialist Republic of Sri Lanka – 2013
The expenditure amounting to Rs.2,567 billion estimated for the year 2013 had been expected to be
financed from local funds amounting to Rs.2,344 billion and foreign funds amounting to Rs.223 billion. A
sum of Rs.199 billion had been received as foreign loans and grants during the year under review. As such
the foreign funds required for the expected utilization had not been received. Out of the provisions made
from foreign funds for the year under review 100 per cent had been utilized and that amounted to Rs.201
billion. Accordingly, an excess of Rs. 2 billion over the provision was observed. Details appear below.
NET
PROVISION
ACTUAL
RECEIPTS
UTILIZATION UTILIZATION IN THE
YEAR EXCEEDING THE
FOREIGN FUNDS
RECEIVED FOR NET
PROVISION
Rs.Billions Rs.Billions Rs.Billions Rs.Billions
Foreign Loans 208 183 186 (3)
Foreign Grants 15 16 15 1
Total 223 199 201 (2)
The collection of Rs.223 billion as foreign loans and grants had been expected for the year 2013. But the
amount collected from those financing sources had been less by Rs. 24 billion from the expected amount.
Out of the target of Rs.15 billion from foreign grants Rs.16 billion had been received. Accordingly, Rs. 1
billion had been received in excess from the foreign grants. The overall position is that the Treasury had
not been able to obtain financing requirements for the achievement of the expected targets of the Budget for
the year 2013 in quantities as expected.
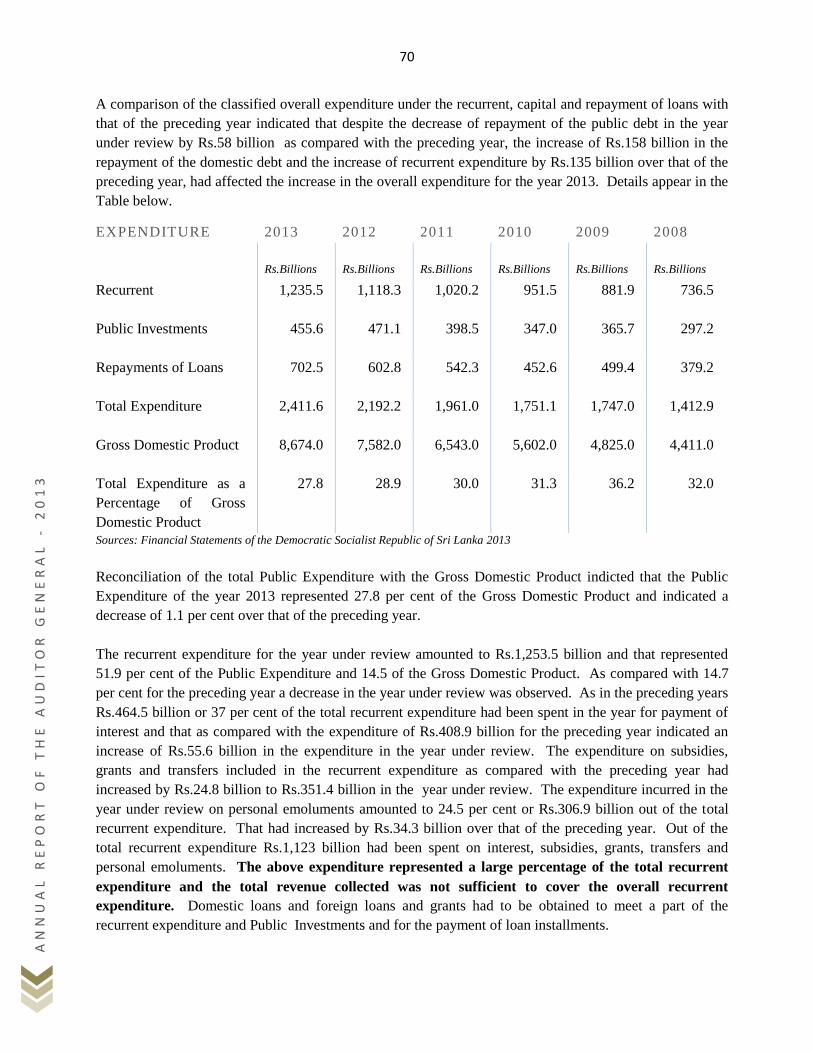
70
AN
NU
AL
RE
PO
RT
OF
TH
E A
UD
IT
OR
GE
NE
RA
L
- 2
01
3
A comparison of the classified overall expenditure under the recurrent, capital and repayment of loans with
that of the preceding year indicated that despite the decrease of repayment of the public debt in the year
under review by Rs.58 billion as compared with the preceding year, the increase of Rs.158 billion in the
repayment of the domestic debt and the increase of recurrent expenditure by Rs.135 billion over that of the
preceding year, had affected the increase in the overall expenditure for the year 2013. Details appear in the
Table below.
Sources: Financial Statements of the Democratic Socialist Republic of Sri Lanka 2013
Reconciliation of the total Public Expenditure with the Gross Domestic Product indicted that the Public
Expenditure of the year 2013 represented 27.8 per cent of the Gross Domestic Product and indicated a
decrease of 1.1 per cent over that of the preceding year.
The recurrent expenditure for the year under review amounted to Rs.1,253.5 billion and that represented
51.9 per cent of the Public Expenditure and 14.5 of the Gross Domestic Product. As compared with 14.7
per cent for the preceding year a decrease in the year under review was observed. As in the preceding years
Rs.464.5 billion or 37 per cent of the total recurrent expenditure had been spent in the year for payment of
interest and that as compared with the expenditure of Rs.408.9 billion for the preceding year indicated an
increase of Rs.55.6 billion in the expenditure in the year under review. The expenditure on subsidies,
grants and transfers included in the recurrent expenditure as compared with the preceding year had
increased by Rs.24.8 billion to Rs.351.4 billion in the year under review. The expenditure incurred in the
year under review on personal emoluments amounted to 24.5 per cent or Rs.306.9 billion out of the total
recurrent expenditure. That had increased by Rs.34.3 billion over that of the preceding year. Out of the
total recurrent expenditure Rs.1,123 billion had been spent on interest, subsidies, grants, transfers and
personal emoluments. The above expenditure represented a large percentage of the total recurrent
expenditure and the total revenue collected was not sufficient to cover the overall recurrent
expenditure. Domestic loans and foreign loans and grants had to be obtained to meet a part of the
recurrent expenditure and Public Investments and for the payment of loan installments.
EXPENDITURE 2013 2012 2011 2010 2009 2008
Rs.Billions Rs.Billions Rs.Billions Rs.Billions Rs.Billions Rs.Billions
Recurrent 1,235.5 1,118.3 1,020.2 951.5 881.9 736.5
Public Investments 455.6 471.1 398.5 347.0 365.7 297.2
Repayments of Loans 702.5 602.8 542.3 452.6 499.4 379.2
Total Expenditure 2,411.6 2,192.2 1,961.0 1,751.1 1,747.0 1,412.9
Gross Domestic Product 8,674.0 7,582.0 6,543.0 5,602.0 4,825.0 4,411.0
Total Expenditure as a
Percentage of Gross
Domestic Product
27.8 28.9 30.0 31.3 36.2 32.0
71
AN
NU
AL
RE
PO
RT
OF
TH
E A
UD
IT
OR
GE
NE
RA
L
- 2
01
3
Domestic and foreign loans had to be obtained for the other recurrent expenditure and Public Investments.
A large sum of money had to be spent for the payment of annual interest and loan installments and it was
observed as an annually increasing cost.
Despite the inadequacy of the revenue collected to meet the recurrent expenditure, a sum of Rs.455.6
billion had been spent in the year under review on Public Investments. That as compared with the
expenditure for the preceding year amounting to Rs.471.1 billion indicated a decrease of Rs.15.5 billion.
The Public Investments as compared with the Gross Domestic Product indicated 3.2 per cent in the year
2013.
Parliament had made provision amounting to Rs.74 billion in terms of Section 6(1) of the Appropriation
Act, No. 23 of 2012 for the Development Programme of Head 240.
Investments – In Public Enterprises
The investments as at 01 January 2013 in the shares and capital contributions in respect of 125 institutions
consisting of State Commercial Corporations, Government Owned Companies, Plantation Companies and
Development Banks amounted to Rs.176.6. billion. A sum of Rs.38 billion had been invested in 11
institutions in the year 2013. In addition, the total investment value had decreased by Rs.1.67 billion due to
the decrease of share capital of 16 institutions during the year. Accordingly the total value of investment is
Public Enterprises as at 31 December 2013 amounted to Rs.212.9 billion.
Even though investments totaling Rs.82.90 billion had been made in the share capital of 91 institutions
comprising 62 institutions owned by the Government, 24 Plantation Companies, 02 Development Banks
and 03 Companies quoted in U.S. Dollars, dividends amounting to Rs.4.8 billion had been credited to the
Public Revenue in the year under review by 38 institutions in which Rs.33.75 billion had been invested.
That revenue represented 5.8 per cent of the total value of the investment. Accordingly, no dividends
whatsoever had been received in the year under review from 67 institutions in which Rs.49.15 billion had
been invested. Similarly, 34 State Corporations out of the 125 institutions in which capital contribution of
Rs.212.9 billion had been made, had not declared dividends and the value of investments made in those
amounted to Rs.130.0 billion.
General Deposits
A sum of Rs.77,109.3 million had been shown in the Financial Statements of the Republic as the balance of
the General Deposit Account after the set off of a sum of Rs.2.6 million receivable by the Treasury against
the deposit balance payable amounting to Rs. 77,111.9 million.
According to the States Accounts Circular No. 200/2009 dated 29 October 2009, no deposits should be
credited to the Treasury General Deposits (old) Account after 01 November 2009 and that Deposit
72
AN
NU
AL
RE
PO
RT
OF
TH
E A
UD
IT
OR
GE
NE
RA
L
- 2
01
3
Account should be closed down after the settlement of the balance of the deposits under that Deposit
Number. But it had not been done.
Budget Deficit
According to the Financial Statements of the Republic the estimated budget deficit of Rs. 650 billion for the
preceding year had become Rs.664 billion to the year under review and that represented an increase of Rs.
14 billion or 2.1 per cent. In terms of Section 3(a) of the Fiscal Management (Responsibility) Act, No. 3 of
2003 the estimated budget deficit should not exceed 5 per cent of the estimated Gross Domestic Product.
As compared with the estimated Gross Domestic Product for the year 2013 amounting to Rs.8,674 billion,
that represented 7.4 per cent.
73
AN
NU
AL
RE
PO
RT
OF
TH
E A
UD
IT
OR
GE
NE
RA
L
- 2
01
3
_____________________________________________________________________________________________________________________________________________________________
Management of Public Debt _____________________________________________________________________________________________________________________
In terms of Article 148 of the Constitution of the Democratic Socialist Republic of Sri Lanka, the full
control over public finance including the Public Debt is vested in Parliament. The approval of Parliament
should be obtained for all borrowings of the Republic. In terms of Section 2.1(b) of the Appropriation Act,
No. 23 of 2012, the Parliamentary approval had been granted for borrowings subject to a limit of Rs.1,303
billion in or outside Sri Lanka for and on behalf of the Government.
According to the Financial Statements of the Republic, loans amounting to Rs.1,273 billion comprising
foreign loans amounting to Rs.183 billion and domestic non-banking loans amounting to Rs.1,090 billion
had been obtained during the year under review. That, as compared with Rs.1,092 billion obtained in the
preceding year indicated an increase of Rs.181 billion or 16.6 per cent. But with the addition of Rs.62.1
billion comprising Rs.61 billion relating to 45 loan agreements not brought to account due to unavailability
of provisions in the year 2013, a sum of Rs.0.16 billion received in the year 2013 in respect of the years
2008 and 2011 and not brought to account and the exchange difference amounting to Rs.0.94 billion
relating to those loans, to the loans amounting to Rs.1,273 billion brought to account in the year under
review, the total loans amounted to Rs.1,335.1 billion and as such the borrowing limit approved by the
Parliament had been exceeded by Rs.32.1 billion.
The Government had paid greater attention to the domestic borrowings even during this year and the
domestic borrowings in the year 2013 amounted to Rs.1,090 billion. Thus, as compared with the domestic
borrowings amounting to Rs.726 billion in the preceding year, indicated an increase of Rs. 364 billion or 50
per cent.
A sum of Rs.1,009 billion comprising Rs.608 billion for the repayment of domestic borrowings and a sum
of Rs.401 billion for payment of interest had been spent in the year under review. That expenditure
represented 92.6 per cent of the domestic borrowings during the year under review. Accordingly, an
extremely low percentage of 7.4 per cent only had been utilized out of the domestic borrowings for the
development works of the Republic. The domestic borrowings and the payment of loan installments and
interest during the year under review and the 04 preceding years had been as follows.
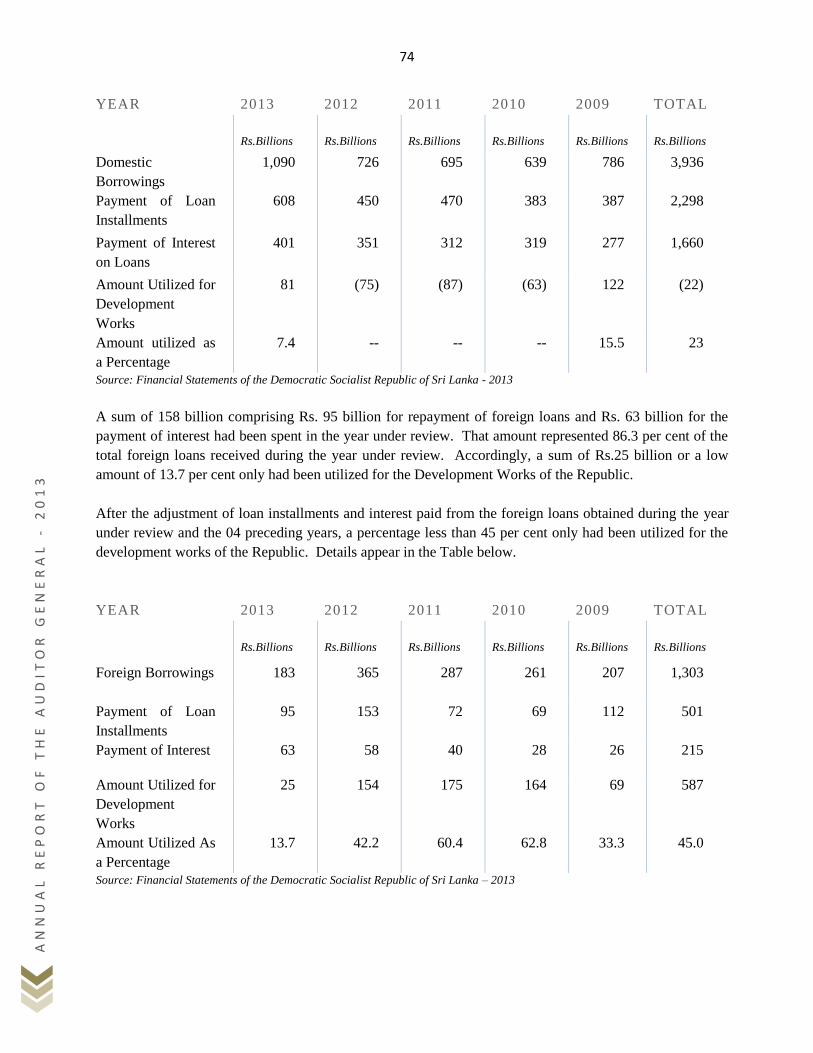
74
AN
NU
AL
RE
PO
RT
OF
TH
E A
UD
IT
OR
GE
NE
RA
L
- 2
01
3
YEAR 2013 2012 2011 2010 2009 TOTAL
Rs.Billions Rs.Billions Rs.Billions Rs.Billions Rs.Billions Rs.Billions
Domestic
Borrowings
1,090 726 695 639 786 3,936
Payment of Loan
Installments
608 450 470 383 387 2,298
Payment of Interest
on Loans
401 351 312 319 277 1,660
Amount Utilized for
Development
Works
81 (75) (87) (63) 122 (22)
Amount utilized as
a Percentage
7.4 -- -- -- 15.5 23
Source: Financial Statements of the Democratic Socialist Republic of Sri Lanka - 2013
A sum of 158 billion comprising Rs. 95 billion for repayment of foreign loans and Rs. 63 billion for the
payment of interest had been spent in the year under review. That amount represented 86.3 per cent of the
total foreign loans received during the year under review. Accordingly, a sum of Rs.25 billion or a low
amount of 13.7 per cent only had been utilized for the Development Works of the Republic.
After the adjustment of loan installments and interest paid from the foreign loans obtained during the year
under review and the 04 preceding years, a percentage less than 45 per cent only had been utilized for the
development works of the Republic. Details appear in the Table below.
YEAR 2013 2012 2011 2010 2009 TOTAL
Rs.Billions Rs.Billions Rs.Billions Rs.Billions Rs.Billions Rs.Billions
Foreign Borrowings 183 365 287 261 207 1,303
Payment of Loan
Installments
95 153 72 69 112 501
Payment of Interest 63 58 40 28 26 215
Amount Utilized for
Development
Works
25 154 175 164 69 587
Amount Utilized As
a Percentage
13.7 42.2 60.4 62.8 33.3 45.0
Source: Financial Statements of the Democratic Socialist Republic of Sri Lanka – 2013
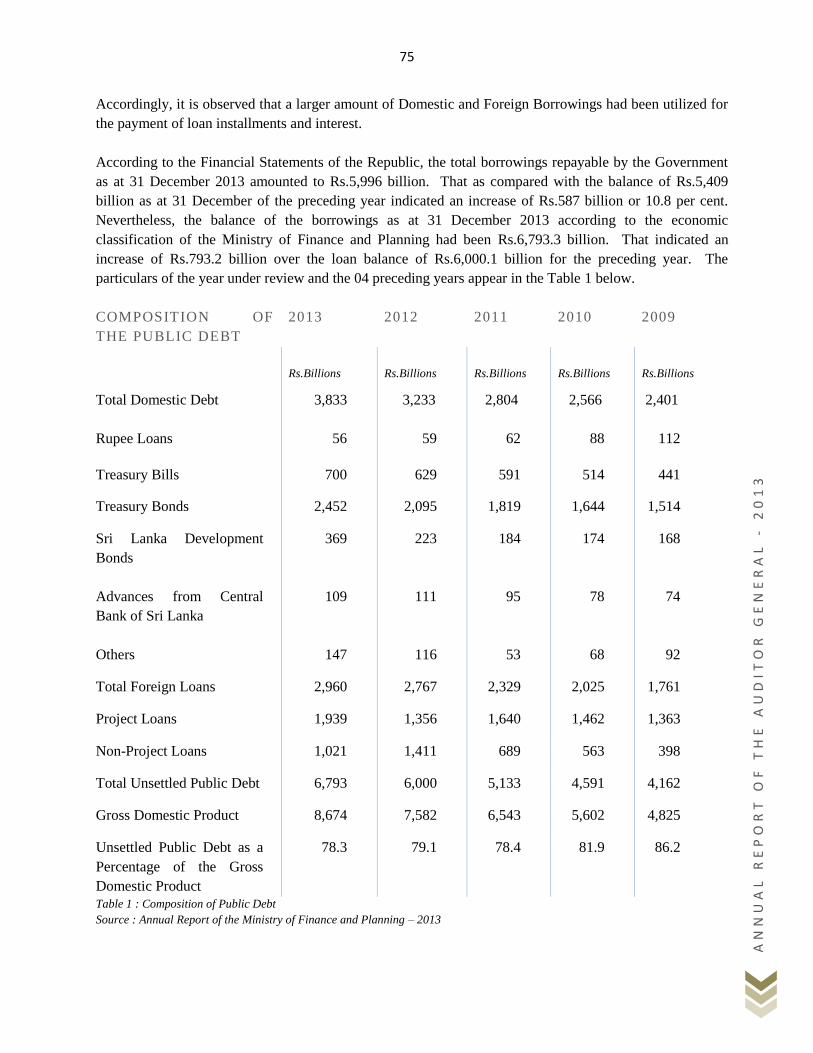
75
AN
NU
AL
RE
PO
RT
OF
TH
E A
UD
IT
OR
GE
NE
RA
L
- 2
01
3
Accordingly, it is observed that a larger amount of Domestic and Foreign Borrowings had been utilized for
the payment of loan installments and interest.
According to the Financial Statements of the Republic, the total borrowings repayable by the Government
as at 31 December 2013 amounted to Rs.5,996 billion. That as compared with the balance of Rs.5,409
billion as at 31 December of the preceding year indicated an increase of Rs.587 billion or 10.8 per cent.
Nevertheless, the balance of the borrowings as at 31 December 2013 according to the economic
classification of the Ministry of Finance and Planning had been Rs.6,793.3 billion. That indicated an
increase of Rs.793.2 billion over the loan balance of Rs.6,000.1 billion for the preceding year. The
particulars of the year under review and the 04 preceding years appear in the Table 1 below.
COMPOSITION OF
THE PUBLIC DEBT
2013 2012 2011 2010 2009
Rs.Billions Rs.Billions Rs.Billions Rs.Billions Rs.Billions
Total Domestic Debt 3,833 3,233 2,804 2,566 2,401
Rupee Loans 56 59 62 88 112
Treasury Bills 700 629 591 514 441
Treasury Bonds 2,452 2,095 1,819 1,644 1,514
Sri Lanka Development
Bonds
369 223 184 174 168
Advances from Central
Bank of Sri Lanka
109 111 95 78 74
Others 147 116 53 68 92
Total Foreign Loans 2,960 2,767 2,329 2,025 1,761
Project Loans 1,939 1,356 1,640 1,462 1,363
Non-Project Loans 1,021 1,411 689 563 398
Total Unsettled Public Debt 6,793 6,000 5,133 4,591 4,162
Gross Domestic Product 8,674 7,582 6,543 5,602 4,825
Unsettled Public Debt as a
Percentage of the Gross
Domestic Product
78.3 79.1 78.4 81.9 86.2
Table 1 : Composition of Public Debt
Source : Annual Report of the Ministry of Finance and Planning – 2013
76
AN
NU
AL
RE
PO
RT
OF
TH
E A
UD
IT
OR
GE
NE
RA
L
- 2
01
3
The overall unsettled loan balances of the year under review, represented 78.3 per cent of the Gross
Domestic Product and that amounted to a decrease of 0.8 per cent from that of the preceding year.
According to the Financial Statement of the Republic the total liabilities of the year under review inclusive
of the total Public Debt amounted to Rs.6,345 billion. The total Public Debt of the Government as a
percentage of the Gross Domestic Product represented 73.1 per cent and that indicated a decrease of 2.2 per
cent from the 75.3 per cent for the preceding year. Nevertheless according to Section 3(f) of the Fiscal
Management (Responsibility) Act, No. 3 of 2003, from the financial year commencing from 01 January
2013, the value of the total liabilities should not exceed 60 per cent of the estimated Gross Domestic
Product of the respective financial year. Nevertheless, that limit had been exceeded by 13.1 per cent in the
year 2013.
The total of the loans as at 31 December 2013 according to the Financial Statements of the Republic, as
compared with the Population of the year indicated a per capita debt of Rs.331,655. That as compared with
the per capita debt of Rs.296,106 for the preceding year indicated as increase of Rs.35,549.
77
AN
NU
AL
RE
PO
RT
OF
TH
E A
UD
IT
OR
GE
NE
RA
L
- 2
01
3
_____________________________________________________________________________________________________________________________________________________________
Banking ____________________________________________________________________________________________________________________
The Banking Sector in Sri Lanka is monitored by the Bank Supervision Department of the Central Bank
of Sri Lanka under the Banking Act.
The Banking Sector remained strong, with capital being maintained at healthy levels along with adequate
liquidity buffers. However, asset growth moderated during the year as credit granted by Banks to the
private sector expanded at a slower pace in the year 2013 as a result of the lagging effects of the tight
monetary policy maintained since the year 2012, subdued external demand impacting on trade related
activity, particularly during the early part of the year, and the contraction of the Banks‟ pawning advances
portfolios due to the steady decline in gold prices in the world market from around October 2012.
The Branch Network of Banks expanded further in the year 2013, improving financial accessibility. The
total banking network expanded with the opening of 89 Banking Outlets (including Student Savings
Units) and the installation of 123 Automated Teller Machines during the year 2013. Of these, 71
Banking Outlets and 95 ATMs were established outside the Western Province. Accordingly, by the end of
the year 2013, the Banking System was operating with 6,487 Banking Outlets and 2,538 ATMs.
Banking Sector Structure The Banking Sector includes;
Licensed Commercial Banks (LCBs): There are 24 LCBs. Among LCBs, the two largest (Bank
of Ceylon and People‟s Bank) Banks are State – owned, 12 are Domestic Banks owned and 12
are Branches of Foreign Banks.
Licensed Specialized Banks (LSBs): There are 9 Specialized Banks consisting of long-term
lending institutions, Development Banks, Savings Banks, Regional Development Banks etc. They
are mostly State owned with market share of about one fifth of LCBs. The single largest LSB is
the State owned National Savings Bank.
Overall Growth
Assets
The total assets of the Banking Sector increased by 16.5 per cent, year-on-year, to Rs. 5.9 trillion, as
compared with the growth of assets of the Banking Sector by 19.9 per cent in 2012. The moderation in
credit growth from 21.1 per cent in the year 2012 to 8.8 per cent in 2013 resulted in a decrease in the
share of loans and advances in total assets from 61.8 per cent in the year 2012 to 57.7 per cent in the year
2013. Consequently, funds mobilized were utilized in investment activities resulting in the share of
investments in total assets increasing from 23.9 per cent in the year 2012 to 28.5 per cent in the year
2013. Government securities largely accounted for the increase in total investments during the year 2013.
78
AN
NU
AL
RE
PO
RT
OF
TH
E A
UD
IT
OR
GE
NE
RA
L
- 2
01
3
The increase in lending during 2013 was largely on account of lending to five key areas of economic
activity. Construction (26 per cent), trading (21 per cent), infrastructure (20 per cent), manufacturing (17
per cent) and transport (11 per cent) mainly contributed to the increase in lending (their respective
contribution to the increase in lending is given within parentheses). Notably, lending for consumption
related purposes, contributed negatively to credit growth in the year 2013.
Liabilities
Deposits continued to be the main funding source in the Banking Sector, accounting for 70.2 per cent of
total liabilities as at end of the year 2013. The resultant funding gap was largely bridged through
borrowings, and the share of borrowings in funding sources increased from 15.8 per cent as at end of the
year 2012 to 17.1 per cent by end of the year 2013. Nevertheless, year-on-year growth of deposits and
borrowings slowed from 18 per cent and 26.6 per cent respectively, at end of the year 2012 to 15 per cent
and 26.2 per cent, respectively, as at the end of the year 2013. Notably, the share of foreign currency
borrowings in total borrowings increased from 54.8 per cent in the year 2012 to 64.6 per cent in the year
2013 due to an increase in borrowings from overseas sources by US$ 1,618 million.
Profitability
Profitability of the Banking Sector amounted to an after tax profit of Rs. 74.6 billion for the year 2013, as
compared with the after tax profit of Rs. 82.7 billion recorded for the year 2012. The net interest margin
declined from 4.1 per cent in the year 2012 to 3.5 per cent in the year 2013, due to the increase in the
share of high cost term deposits in total deposits, the moderation in credit growth and the increase in low
yielding assets. While the net interest margin declined, partly reflecting the slowing down of core
business operations of the Banking Sector in the year 2013, provisions for bad and doubtful debts and
loans written-off increased from Rs. 6.3 billion in the year 2012 to Rs. 18.4 billion in the year 2013.
However, there was no significant increase in the operating expenses as all the profitability indicators of
the Banking Sector, i.e., net interest margin (NIM), return on assets (ROA) and return on equity (ROE),
declined during the year 2013.
Risk and Resources of the Banking Sector
An analysis of the State Banks and the Private Banks prepared by using the main soundness indicators is
given below.
Credit Risk
The total amount of non-performing accommodations (NPAs) increased during the year 2013 to Rs.37
billion, from Rs.23 billion in the year 2012 The exposure to NPAs in relation to the total
accommodations outstanding increased to 6.7 per cent by end of the year 2013 from 5 per cent in the year
2012.The LFC sector accounts for 92 per cent of the NPAs with the restructured companies being the
main contributors to the NPAs. With respect to loan loss provisioning, the net NPA ratio was 2.5 per cent
as at end of the year 2013. The total provision coverage for NPAs increased marginally to 56.1 per cent in
the year 2013 from 55.6 per cent in the previous year.
79
AN
NU
AL
RE
PO
RT
OF
TH
E A
UD
IT
OR
GE
NE
RA
L
- 2
01
3
Performance of State Banks
The eight State Banks in Sri Lanka accounted for 49 per cent of the assets of the total Banking Sector as
at end of the year 2013. Among these, Bank of Ceylon (BOC) and People‟s Bank (PB) are the two largest
licensed commercial Banks with asset bases of Rs 1,193.6 billion and Rs 926.6 billion, respectively. The
National Savings Bank (NSB) is a licensed specialized Bank with an asset base of Rs 655 billion while
the other five specialized licensed Banks, namely, State Mortgage and Investment Bank (SMIB),
Regional Development Bank (RDB), Lankaputra Development Bank (LDB), Sri Lanka Savings Bank
(SLSB) and HDFC Bank (HDFC) have an aggregate of Rs 149.2 billion in assets. The asset base of the
State Banks grew by 14.3 per cent in the year 2013 as compared with in the year 2012.
The deposit base of the State Banks totalled Rs. 2 trillion during the year 2013. Profit after tax of these
Banks declined by 25 per cent in the year 2013 as non-performing advances increased by 71 per cent
largely contributed by the non-performing gold backed loans, consequent to the sharp decline in
international gold prices.
The following table 2 shows certain key performance indicators of the State owned Banks for the year
2013 as compared with the whole Banking Sector.
BANKING SECTOR STATE BANKS
2013
Rs. billions
2013
Rs. billions
Assets 5,942.0 2,924.4
Loans and Advances 3,427.0 1,718.5
Non-performing Advances 191.9 94.3
Deposits 4,170.0 2,209.7
Total Borrowings 1,015.0 387.2
Net Interest Income 196.7 92.6
Profit Before Tax 104.7 32.1
Profit After Tax 74.6 23.6
Return on Assets (ROA)
(Percentage)
1.26 0.8
Return on Equity (ROE)
(Percentage)
15.2 17.8
NPA Ratio (Percentage) 5.6 5.5
Table 2 : Key Performance Indicators of State Banks
Sources: Department of Public Enterprises, State Banks and Central Bank of Sri Lanka
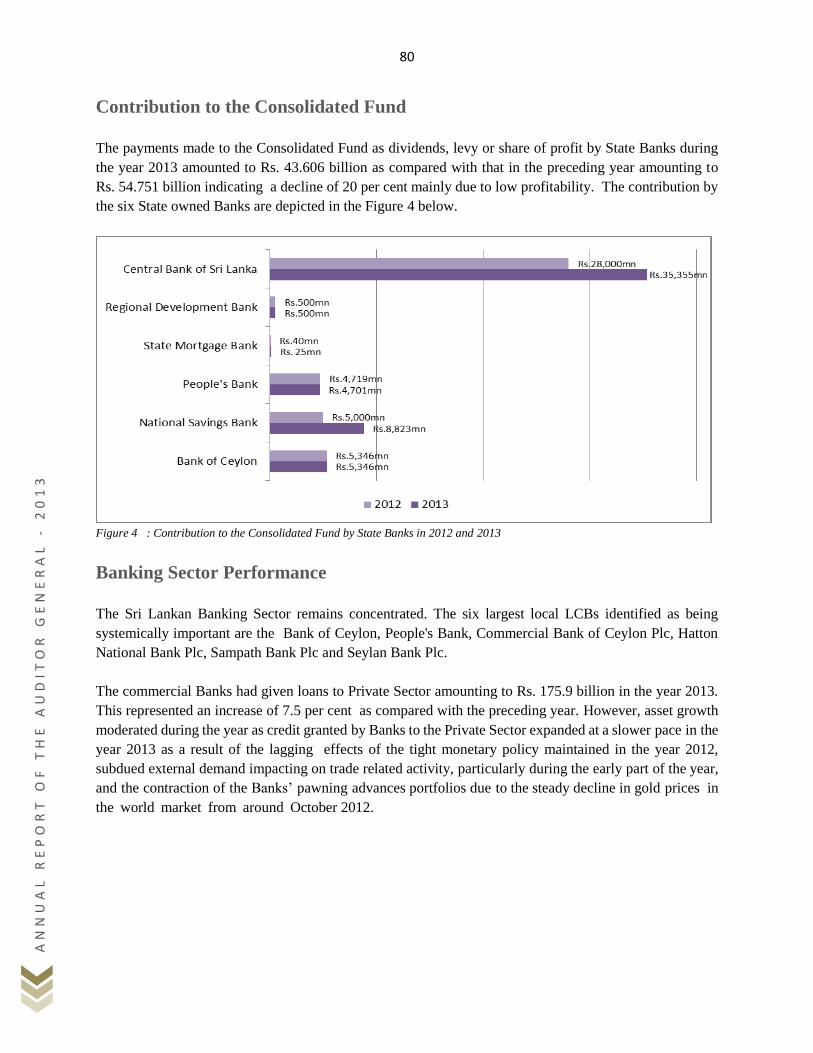
80
AN
NU
AL
RE
PO
RT
OF
TH
E A
UD
IT
OR
GE
NE
RA
L
- 2
01
3
Contribution to the Consolidated Fund
The payments made to the Consolidated Fund as dividends, levy or share of profit by State Banks during
the year 2013 amounted to Rs. 43.606 billion as compared with that in the preceding year amounting to
Rs. 54.751 billion indicating a decline of 20 per cent mainly due to low profitability. The contribution by
the six State owned Banks are depicted in the Figure 4 below.
Figure 4 : Contribution to the Consolidated Fund by State Banks in 2012 and 2013
Banking Sector Performance
The Sri Lankan Banking Sector remains concentrated. The six largest local LCBs identified as being
systemically important are the Bank of Ceylon, People's Bank, Commercial Bank of Ceylon Plc, Hatton
National Bank Plc, Sampath Bank Plc and Seylan Bank Plc.
The commercial Banks had given loans to Private Sector amounting to Rs. 175.9 billion in the year 2013.
This represented an increase of 7.5 per cent as compared with the preceding year. However, asset growth
moderated during the year as credit granted by Banks to the Private Sector expanded at a slower pace in the
year 2013 as a result of the lagging effects of the tight monetary policy maintained in the year 2012,
subdued external demand impacting on trade related activity, particularly during the early part of the year,
and the contraction of the Banks‟ pawning advances portfolios due to the steady decline in gold prices in
the world market from around October 2012.
81
AN
NU
AL
RE
PO
RT
OF
TH
E A
UD
IT
OR
GE
NE
RA
L
- 2
01
3
Major Audit Highlights
Bank of Ceylon The following cash frauds had occurred during the year 2013 due to lapses in the internal control.
Metropolitan Branch – Fraudulent Fund Transfer of Rs. 5.8 million
Bank had transferred a sum of Rs. 5.8 million on 23 October 2013 from the Non-resident Foreign
Currency Account of a deceased customer of the Metropolitan Branch to a Savings Account at a
Local Private Bank on a fraudulent request made by a fraudster.
According to the findings of the preliminary investigation, it was revealed that the Manager and
the Assistant Manager had discharged their duties in a grossly negligent manner while
transferring funds as mentioned above despite the notation made in the request to read as
“Signature Differs” and not referring to the Senior Manager of the Branch.
Further investigations had been conducted and the matter had been reported to the Criminal
Investigations Department.
Personal Branch – Fraudulent Fund Transfer of Rs. 11.1 million
Bank had transferred funds amounting to US$ 86,384 equivalents to Sri Lanka Rs. 11.1 million
from the DFC Account of a customer of the Personal Branch to an Account in the Bank of Cyprus
on a fraudulent request made by a fraudster on an unverified source. Investigations on this matter
are in progress.
Bogawanthalawa Branch – Fraudulent removal of Gold articles valued at Rs. 8 million
Fraudulently removing gold articles pawned by customers which were lodged in the vault, by an
Officer who worked as the Manager of the Bogawanthalawa Branch. The total advances paid by
the Bank on the removed articles amounted Rs. 8 million approximately. The Manager had been
retired from the Bank‟s service, but her pension benefits had been withheld by the Bank. The
matter had been reported to the Criminal Investigations Department and investigations are in
progress.
Bopitiya Branch – Fraudulent creation of Pawning Advances amounting to Rs. 18 million
A Junior Executive Officer of the Bank had defrauded a sum of Rs.18 million by creating
fraudulent Pawning Advances in the system by the time the fraud was detected. The officer who
committed the fraud and left the country had been interdicted from service. The Manager who
discharged the duties in a grossly negligent manner was interdicted from the Bank‟s service
pending finalization of the disciplinary proceedings. The matter had been reported to the Criminal
Investigations Department.
82
AN
NU
AL
RE
PO
RT
OF
TH
E A
UD
IT
OR
GE
NE
RA
L
- 2
01
3
Makandura Extension Office – Fraudulent substitution of fake articles in place of Gold
Articles valued at Rs. 3 million
In this case an officer of the Bank who worked as the Manager of the Makandura Branch had
fraudulently substituted fake articles in place of the Gold articles pledged to the Bank. The gross
value of the removed gold articles amounted to Rs. 3 million approximately and the officer had
been interdicted from the Bank‟s service. Further investigations are in progress.
Metropolitan Branch – Unauthorized fund transfer amounting to US$ 750,000
Allegation had been made by a customer regarding an unauthorized fund transfer amounting to
US$ 784,562 (with interest) effect by the Bank from his fixed deposit. Related requests and other
correspondence had been transmitted through emails. Representative Officer of the Bank at UAE
and Bank Manager of Metropolitan Branch had failed to re-confirm the customer over the phone.
However the Bank Manager had made the fund transfer without taking further instruction from
the higher authority. Bank made the said transaction in a negligent manner without identifying the
customer properly.
Personal Branch – Funds transfer from Special Foreign Investment Deposit Account
(SFIDA)
Bank had transferred funds amounting to US$ 70,000 and GBP 200,000 from the SFIDA Savings
Account of a customer of the Personal Branch to Accounts in Banks in People‟s Republic of
China and United Arab Emirates on a fraudulent request made by a customer using the different
e-mails. Investigations on this matter are in progress.
People’s Bank
The value of financial assets held to maturity had been calculated based on the simple interest
method instead of amortizing the same by using original Effective Interest Rate (EIR) violating
the LKAS 39 - Financial Instruments: Measurement and Recognition. This erroneous treatment
has resulted in the overstatement of the value of financial assets held to maturity by
Rs.36,960,694.
Since the Salaries Department of the Bank does not maintain appropriate and systematic records
in respect of the employees, in order to facilitate accurate payroll reconciliation, a difference of
Rs.56,015,643 had been observed between the payroll and financial statements.
The Corporate Banking Division had granted trade finance loan facilities to a customer and total
outstanding balance of those non-performing loans had exceeded the Forced Sale Value (FSV) of
Rs.220,000,000 by Rs.792,352,875 as at 22 January 2014.
The short term loan facilities amounting to Rs.17,020,362 and remaining non-performing as at 28
January 2014 had not been secured by immovable properly.
83
AN
NU
AL
RE
PO
RT
OF
TH
E A
UD
IT
OR
GE
NE
RA
L
- 2
01
3
Even though loan balances amounting to Rs.260,050,066 included in the Staff Loans Portfolio as
at 31 December 2013 had been non-performing, the Management had not taken effective action
for the recovery of the non-performing balances. Effective controls are not in place to avoid such
classification of staff loan balances and ensure prompt recovery.
National Savings Bank
Amount receivable from the Treasury for Unclaimed Deposits
The amount receivable from the Treasury for the unclaimed deposits as at 31 December 2013
amounted to Rs.659,014,723. Out of the amount receivable, 24 per cent or Rs.160,986,618 had
been older than 9 years. The percentage of the amounts older than one year had been 94 per
cent.
According to the financial statements for the year 2013, the value of unclaimed deposits
receivable from the Treasury including interest paid to customers amounted to
Rs.957,891,777.However this amount had not been received even though claim for the
reimbursements had been made to the Treasury.
Return on Investment on Shares in quoted Companies
The capital gain from the sale of shares in trade investments in the year 2013 amounted to Rs.
189,164,668. The percentage of capital gain on overall trade investments in the year 2013 had
been 3.68 per cent.
The dividend received from long term investments in 3 quoted companies in the year 2013
amounted to Rs. 150,223,421 and represented 5.34 per cent.
No dividends whatsoever had been received for the investment of Rs.1,193,572,481 made in 10
companies. That investment represented 15.01 per cent of the total investment of
Rs.7,950,328,654 made in the quoted companies as at 31 December 2013.
Diminution of Value of Investments without Dividends
No dividends had been received as at the end of the year 2013 for the investments costing of
Rs.744,681,081 made in 7 quoted companies by the Assets Management Division. That
investment represented 9.37 per cent of the total cost of investments made in quoted Companies
amounting to Rs.7,950,328,654.
The market value of investments made in the above 7 companies amounting to Rs.744,681,081
had diminished by Rs. 403,333,135.
The market value of the investments costing Rs.276,650,081 made in quoted companies had
diminished in the years 2011, 2012 and 2013 by a sum of Rs. 157,440,880.
84
AN
NU
AL
RE
PO
RT
OF
TH
E A
UD
IT
OR
GE
NE
RA
L
- 2
01
3
Investments in Equity Securities without adequate Returns
There were 4 equity certificates amounting to Rs.1,267,575,023 as at 31 December 2013. However
dividend of Rs. 6,090,000 had been received only from one equity certificate for Rs.57,363,543.
Accordingly, the return on Unit Trusts in Equity Securities in the year 2013 had been at a very low rate
of 0.48 per cent.
State Mortgage and Investment Bank
Differences of Rs.31,217,166 had been observed between amount show in the Financial
Statements and the balances generated by the computerized system in respect of 11 branches
with regard to the fixed deposits and savings accounts as at 31 December 2013.
Difference of Rs.10,212,121 observed between balances show in the Financial Statements totaled
Rs.150,378,908 and the balances generated by the computerized system totalled Rs.160, 602,177
with regard to the unappropriated accounts as at 31 December 2013.
Differences of Rs.6,369,435 and Rs.7,384,579 had been observed between the ledger balances
and the balances in the fixed assets register balances relating to the cost of assets accumulated
depreciation respectively.
Housing Development and Finance Corporation Bank (HDFC)
According to the financial statements presented, the operations of the Bank for the year ended 31
December 2013, had resulted in an after tax profit of Rs. 158.01 million as compared with the
corresponding after tax profit of Rs. 55.53 million in the preceding year thus indicating an
increase in the after tax profit by Rs.102.48 million or 182 per cent. The recognition of
revaluation gain of Rs.95 million on investment property is mainly attributed for this increase in
the financial results of the year under review.
The Board of Directors of the Bank at the meetings held on 26 September 2013 and 31 October
2013 had approved the creation of a new source of income by charging an administration fee on
every outstanding loan with effect from 01 January 2012. Accordingly, Rs.88, 382,116 had been
accounted as income for the year under review. However, it was observed that the unrealized
loan administration fees amounted to Rs.48, 736,213 as at 31 December 2013.
Further it was observed that the above decision would contravene the provisions in the Housing
Development Finance Corporation Bank of Sri Lanka Act, No.7 of 1997 as amended by the Act,
No.15 of 2003 and Act, No.45 of 2011 which specify that the Bank should formulate and
implement schemes for the provision of housing for the economically disadvantaged of section of
the society.
85
AN
NU
AL
RE
PO
RT
OF
TH
E A
UD
IT
OR
GE
NE
RA
L
- 2
01
3
It was observed that the Bank had claimed a sum of Rs.46,541,725 as loan administration fee
from the Employees Provident Fund „for the “Srama Udana Loans” granted against balances in
the Employees Provident Fund without issuing written notices of the decision to the customers.
Regional Development Bank
The Net Profit Ratio decreased to 3.61 per cent in the year 2013, as compared with the 11.21 per
cent in the year 2012.The reduction in profitability has been mainly caused by the increase in
interest expense due to high reliance on fixed deposits and increase in impairment due to growth
in non- performing loans. The non-performing loans represent 7 per cent of the total loan
portfolio of the Bank in the year 2013 compared with the 4 per cent in the year 2012. The specific
provision made on the capital loss on pawning advances amounting to Rs.348,787,046, had
affected the decrease in profitability.
The Bank had reported high interest margin of 5.92 per cent as at 31 December 2013 as compared
with the average LSB ratio of 3.7 per cent.
The contribution of non-interest income to the total income of the Bank is only 5.04 per cent
which is significantly lower than average LSB ratio of 9.78 per cent. Therefore the Bank is highly
concentrated on interest income and would be vulnerable to changes in interest rates.
According to Banking Industry Analysis in the year 2013, the Bank had recorded the highest ratio
of the personal cost out of total expenses excluding the interest expenses and fee and commission
expenses which is 72 per cent as compared with the average LSB ratio of 48 per cent.
Bank‟s Deposit structure is highly concentrated on high cost fixed deposits which represent 61
per cent of the total deposits as at 31 December 2013. Interest expense on fixed deposits
represents 83 per cent of total interest expense as at 31 December 2013. High dependence on
heavy cost fixed deposits may adversely affect the cost of funds.
The pawning portfolio of the Bank is around 38 per cent on the total loan portfolio of the Bank as
at 31 December 2013. High credit concentration on pawning advances may affect the liquidity of
the Bank.
Developments in Banking Sector 2013
In the year 2013, National Savings Bank was successful in raising dollar funds totaling US$ 750 million
at 8.76 per cent interest with maturity in 5 years while Bank of Ceylon passed yet another milestone by
raising its second international Dollar bond of 5 years amounting to US$ 500 million at 5.325 per cent
which was 6.8 times oversubscribed.
86
AN
NU
AL
RE
PO
RT
OF
TH
E A
UD
IT
OR
GE
NE
RA
L
- 2
01
3
Banking Sector Challenges
Sri Lanka‟s Banking Sector is faced with significant challenges in managing asset quality, accessing low
cost capital in the face of rapid expansion, poor risk management practices, and maintaining profitability
as margins narrow in the low interest rate regime and weaknesses in loan recoveries.
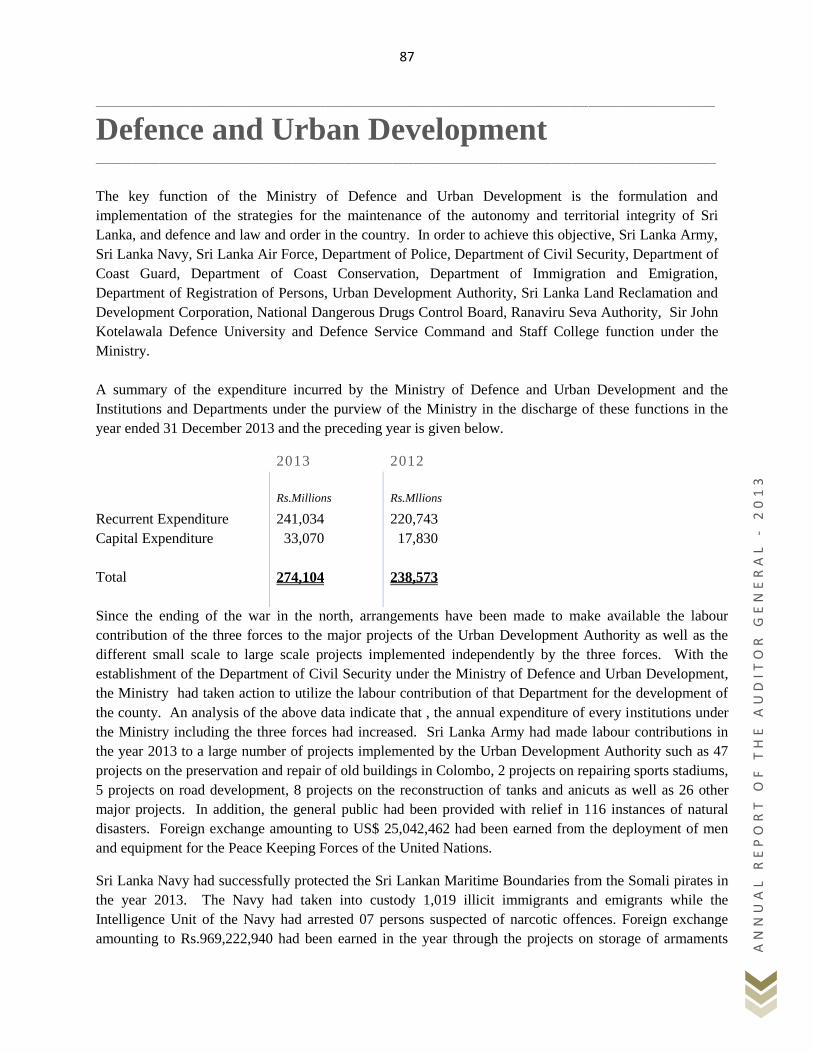
87
AN
NU
AL
RE
PO
RT
OF
TH
E A
UD
IT
OR
GE
NE
RA
L
- 2
01
3
_____________________________________________________________________________________________________________________________________________________________
Defence and Urban Development _____________________________________________________________________________________________________________________
The key function of the Ministry of Defence and Urban Development is the formulation and
implementation of the strategies for the maintenance of the autonomy and territorial integrity of Sri
Lanka, and defence and law and order in the country. In order to achieve this objective, Sri Lanka Army,
Sri Lanka Navy, Sri Lanka Air Force, Department of Police, Department of Civil Security, Department of
Coast Guard, Department of Coast Conservation, Department of Immigration and Emigration,
Department of Registration of Persons, Urban Development Authority, Sri Lanka Land Reclamation and
Development Corporation, National Dangerous Drugs Control Board, Ranaviru Seva Authority, Sir John
Kotelawala Defence University and Defence Service Command and Staff College function under the
Ministry.
A summary of the expenditure incurred by the Ministry of Defence and Urban Development and the
Institutions and Departments under the purview of the Ministry in the discharge of these functions in the
year ended 31 December 2013 and the preceding year is given below.
2013 2012
Rs.Millions Rs.Mllions
Recurrent Expenditure 241,034 220,743
Capital Expenditure 33,070 17,830
Total 274,104 238,573
Since the ending of the war in the north, arrangements have been made to make available the labour
contribution of the three forces to the major projects of the Urban Development Authority as well as the
different small scale to large scale projects implemented independently by the three forces. With the
establishment of the Department of Civil Security under the Ministry of Defence and Urban Development,
the Ministry had taken action to utilize the labour contribution of that Department for the development of
the county. An analysis of the above data indicate that , the annual expenditure of every institutions under
the Ministry including the three forces had increased. Sri Lanka Army had made labour contributions in
the year 2013 to a large number of projects implemented by the Urban Development Authority such as 47
projects on the preservation and repair of old buildings in Colombo, 2 projects on repairing sports stadiums,
5 projects on road development, 8 projects on the reconstruction of tanks and anicuts as well as 26 other
major projects. In addition, the general public had been provided with relief in 116 instances of natural
disasters. Foreign exchange amounting to US$ 25,042,462 had been earned from the deployment of men
and equipment for the Peace Keeping Forces of the United Nations.
Sri Lanka Navy had successfully protected the Sri Lankan Maritime Boundaries from the Somali pirates in
the year 2013. The Navy had taken into custody 1,019 illicit immigrants and emigrants while the
Intelligence Unit of the Navy had arrested 07 persons suspected of narcotic offences. Foreign exchange
amounting to Rs.969,222,940 had been earned in the year through the projects on storage of armaments
88
AN
NU
AL
RE
PO
RT
OF
TH
E A
UD
IT
OR
GE
NE
RA
L
- 2
01
3
nautical protection, project on Training of Maritime Guards ,Project on Armaments Cleaning and the
Project on Firing Training of Maritime Guards. In addition labour contribution valued at Rs.110,996,000
and Rs.48,617,000 had been provided by assisting in the activities of the Sri Lanka Land Reclamation and
Development Corporation and the Urban Development Authority respectively. Labour contribution valued
at Rs.321,031,452 had been provided in connection with repairs to Government buildings, construction of
hospital wards and buildings of Government intuitions, roads development and the development of places
of religious worship.
Sri Lanka Air Force had performed 10,283 flight hours in the year 2013 out of which 2,681 flight hours had
been for air operations. Assistance to the Light Infantry and Naval Operations had been provided through
14.45 flight hours of unmanned aircraft. Air transport had been supplied to 27,990 personnel of the Light
Infantry, Navy and Air Force while the goods transported amounted to 83,673 kilogrammes. A significant
service to the national economy had been made through providing the services of 06 Aircraft Technicians
to the Srilankan Airlines, carrying out repairs to aircraft at Katunayake and Ratmalana by deploying the
Engineering and Technical personnel of the Air Force and carrying out different Units of repairs to aircraft
by the Research and Development Division. In addition to the above, a significant services to the national
economy had been rendered by the labour contribution made for the projects of the Urban Development
Authority as well as 12 other projects.
The Department of Civil Security functioning with 19 Force Headquarters and 11 Sub-Force Headquarters
had taken part in the projects such as the development works of the Vihara Maha Devi Park, Improvements
to Elphinstone Theatre and the construction and maintenance of the elephant fence. In addition, labour
contribution had been made for the development places of religious worship situated throughout the Island.
Audit Observations
Action in terms of Financial Regulation 170(2) of the Financial Regulations of the
Democratic Socialist Republic of Sri Lanka had not been taken to credit to the Public
Revenue, a sum of Rs.127,647,083 received as donations by the Ministry of Defence and
Urban development from individuals, private institutions, Government Institutions during
the period from 18 July 2011 to 30 July 2014. A sum of Rs.107,308,091 out of that had
been spent and the balance Rs.20,338,992 had been retained in the General Deposit
Account even up to 31 August 2014.
All revenue earned by the three Forces, the Department of Police and the Department of
Civil Security from sources such as the sale of farm produce to outside parties, Hire of
Musical Groups, revenue received from restaurants, welfare trade stalls, barber and
tailoring services, sale of produce of camp premises, canine displays, aircraft and ship
operations, revenue received from repairs to aircrafts and ships and all other revenue
earned by deploying Government property should be credited to the Consolidated Fund
and the total credited to the Consolidated Fund should be given as a grant to the Api
Wenuven Api Fund. In accordance with the Cabinet Memorandum No.
MOD/FD/IA/5/3/(2) dated 23 January 2009 and the Cabinet Decision action should not be
89
AN
NU
AL
RE
PO
RT
OF
TH
E A
UD
IT
OR
GE
NE
RA
L
- 2
01
3
taken to distribute a portion of the revenue received from the supply of external services as
stated above among the participating officers. Even though action should have been taken
in accordance with the Cabinet decision, it had not been so done even up to 31 August
2014 and such revenue had been credited to the Funds maintained for the welfare of
officers. Even though the information on the revenue so collected was called for, such
information had not been made available to audit.
Even though a sum of Rs.24,671,115,345 comprising a sum of Rs.19,817,306,000 received
in connection with a land released for the development of the Hotel Industry and a sum of
Rs. 4,853,809,345 being the amount received up to 31 July 2014 should have been credited
to the Public Revenue in terms of Article 149 of the Constitution of the Democratic
Socialist Republic of Sri Lanka and the Financial Regulations, it had not been so done and
the monthly had been retained in a Bank Account of the Ministry of Defence and Urban
Development. A sum of the Rs.7,120,497,622 had been paid out of had by 31 December
2013 and the balance as at 31 December 2013 amounted to Rs.17,343,327,720.
Even though the balance sum of Rs. 39,682,343 remaining from the money made available
by the Ministry of Higher Education to the Sri Lanka Army in connection with the
University Students Leadership Training 2013 should be credited to the Consolidated Fund
in terms of Financial Regulation 807, it had not been so done.
Sri Lanka Army had invited quotations in the year 2011 for the purchase of 31,500 packets
of photocopy paper and there was no evidence that the suppliers who submitted quotation
had been property evaluator. The selected supplier has produced a forged Value Added
Tax number. Even though 20,000 packets of paper had been supplied during the period 03
to 27 December 2011 at Rs. 375 per packet as agreed, the quality of the papers supplied did
not conformed to the agreed quality and the receipt of 11,750 packets of paper supplied by
the store had not been established.
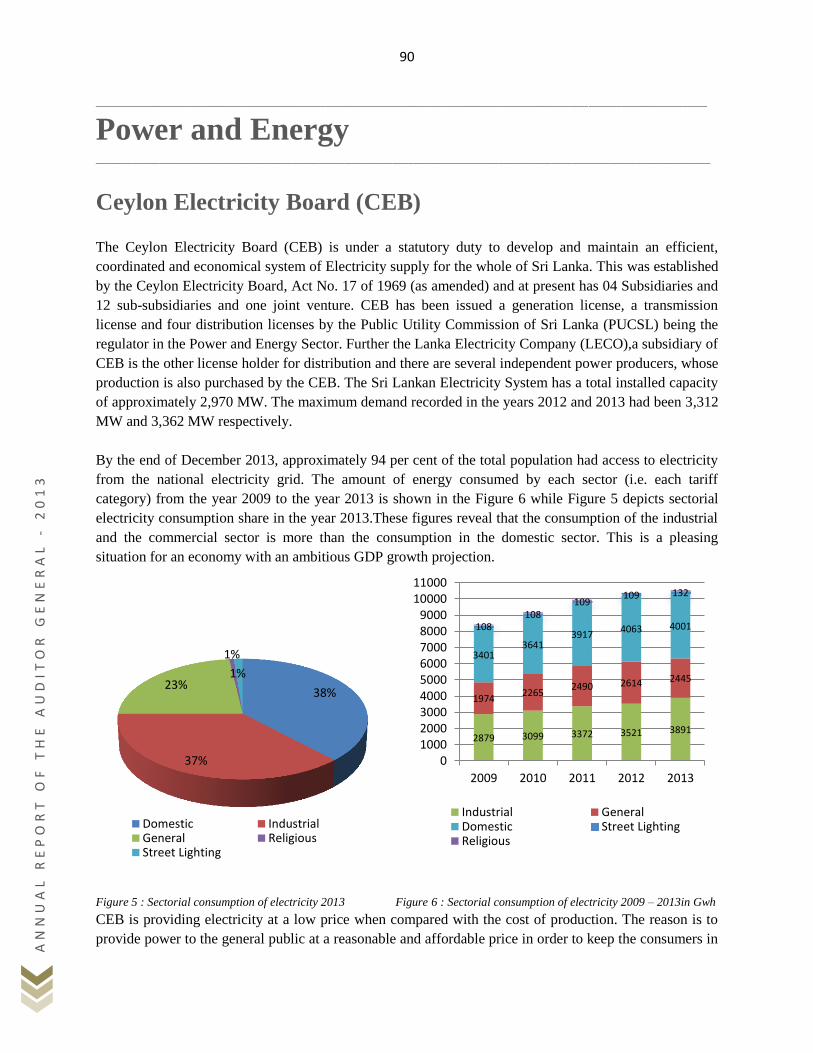
90
AN
NU
AL
RE
PO
RT
OF
TH
E A
UD
IT
OR
GE
NE
RA
L
- 2
01
3
___________________________________________________________________________________________________________________________________________________________
Power and Energy ____________________________________________________________________________________________________________________
Ceylon Electricity Board (CEB)
The Ceylon Electricity Board (CEB) is under a statutory duty to develop and maintain an efficient,
coordinated and economical system of Electricity supply for the whole of Sri Lanka. This was established
by the Ceylon Electricity Board, Act No. 17 of 1969 (as amended) and at present has 04 Subsidiaries and
12 sub-subsidiaries and one joint venture. CEB has been issued a generation license, a transmission
license and four distribution licenses by the Public Utility Commission of Sri Lanka (PUCSL) being the
regulator in the Power and Energy Sector. Further the Lanka Electricity Company (LECO),a subsidiary of
CEB is the other license holder for distribution and there are several independent power producers, whose
production is also purchased by the CEB. The Sri Lankan Electricity System has a total installed capacity
of approximately 2,970 MW. The maximum demand recorded in the years 2012 and 2013 had been 3,312
MW and 3,362 MW respectively.
By the end of December 2013, approximately 94 per cent of the total population had access to electricity
from the national electricity grid. The amount of energy consumed by each sector (i.e. each tariff
category) from the year 2009 to the year 2013 is shown in the Figure 6 while Figure 5 depicts sectorial
electricity consumption share in the year 2013.These figures reveal that the consumption of the industrial
and the commercial sector is more than the consumption in the domestic sector. This is a pleasing
situation for an economy with an ambitious GDP growth projection.
Figure 5 : Sectorial consumption of electricity 2013 Figure 6 : Sectorial consumption of electricity 2009 – 2013in Gwh
CEB is providing electricity at a low price when compared with the cost of production. The reason is to
provide power to the general public at a reasonable and affordable price in order to keep the consumers in
38%
37%
23% 1%
1%
Domestic IndustrialGeneral ReligiousStreet Lighting
2879 3099 3372 3521 3891
1974 2265
2490 2614 2445
3401 3641
3917 4063 4001 108
108 109
109 132
0100020003000400050006000700080009000
1000011000
2009 2010 2011 2012 2013
Industrial GeneralDomestic Street LightingReligious
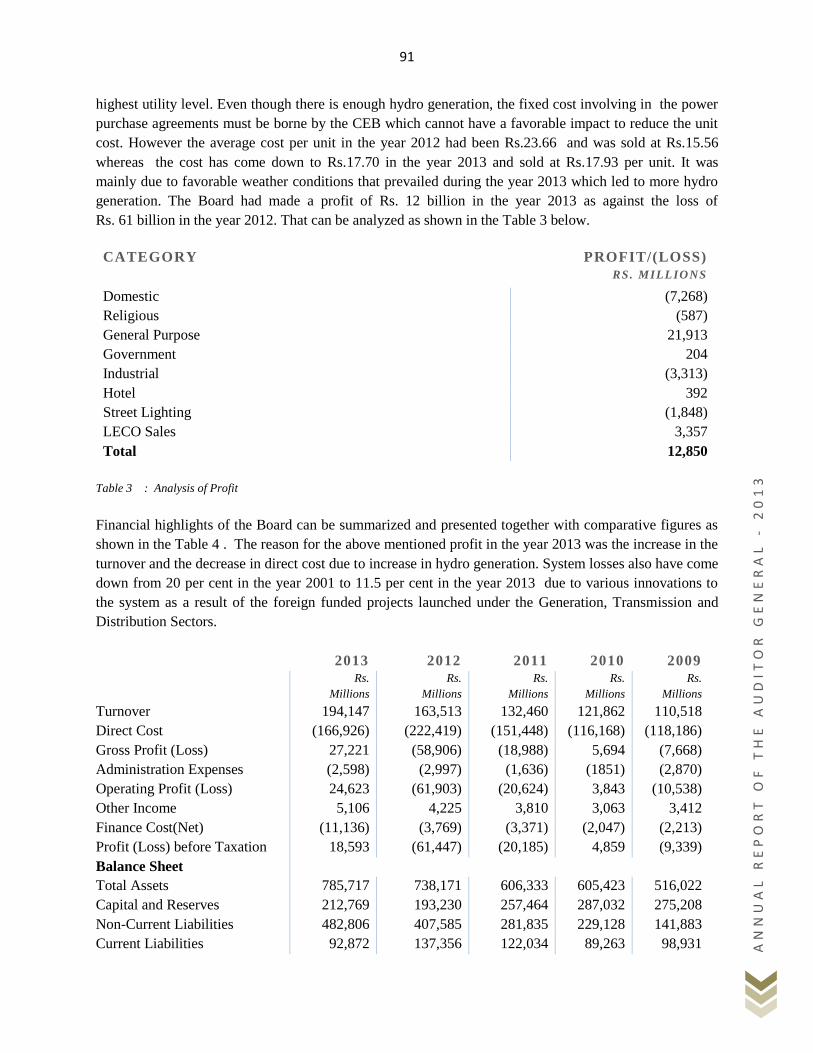
91
AN
NU
AL
RE
PO
RT
OF
TH
E A
UD
IT
OR
GE
NE
RA
L
- 2
01
3
highest utility level. Even though there is enough hydro generation, the fixed cost involving in the power
purchase agreements must be borne by the CEB which cannot have a favorable impact to reduce the unit
cost. However the average cost per unit in the year 2012 had been Rs.23.66 and was sold at Rs.15.56
whereas the cost has come down to Rs.17.70 in the year 2013 and sold at Rs.17.93 per unit. It was
mainly due to favorable weather conditions that prevailed during the year 2013 which led to more hydro
generation. The Board had made a profit of Rs. 12 billion in the year 2013 as against the loss of
Rs. 61 billion in the year 2012. That can be analyzed as shown in the Table 3 below.
Table 3 : Analysis of Profit
Financial highlights of the Board can be summarized and presented together with comparative figures as
shown in the Table 4 . The reason for the above mentioned profit in the year 2013 was the increase in the
turnover and the decrease in direct cost due to increase in hydro generation. System losses also have come
down from 20 per cent in the year 2001 to 11.5 per cent in the year 2013 due to various innovations to
the system as a result of the foreign funded projects launched under the Generation, Transmission and
Distribution Sectors.
2013 2012 2011 2010 2009
Rs. Rs. Rs. Rs. Rs.
Millions Millions Millions Millions Millions
Turnover 194,147 163,513 132,460 121,862 110,518
Direct Cost (166,926) (222,419) (151,448) (116,168) (118,186)
Gross Profit (Loss) 27,221 (58,906) (18,988) 5,694 (7,668)
Administration Expenses (2,598) (2,997) (1,636) (1851) (2,870)
Operating Profit (Loss) 24,623 (61,903) (20,624) 3,843 (10,538)
Other Income 5,106 4,225 3,810 3,063 3,412
Finance Cost(Net) (11,136) (3,769) (3,371) (2,047) (2,213)
Profit (Loss) before Taxation 18,593 (61,447) (20,185) 4,859 (9,339)
Balance Sheet
Total Assets 785,717 738,171 606,333 605,423 516,022
Capital and Reserves 212,769 193,230 257,464 287,032 275,208
Non-Current Liabilities 482,806 407,585 281,835 229,128 141,883
Current Liabilities 92,872 137,356 122,034 89,263 98,931
CATEGORY PROFIT/(LOSS)
RS. MILLIONS
Domestic (7,268)
Religious (587)
General Purpose 21,913
Government 204
Industrial (3,313)
Hotel 392
Street Lighting (1,848)
LECO Sales 3,357
Total 12,850
92
AN
NU
AL
RE
PO
RT
OF
TH
E A
UD
IT
OR
GE
NE
RA
L
- 2
01
3
Cash (1,431) (17,813) (1,178) (3,102) (4,039)
Sales (GWh) 10,621 10,424 10,023 9,268 8,441
Generation (GWh) 11,962 11,802 11,528 10,714 9,882
System Loss 1,341 1,378 1,505 1,446 1,441
Table 4 : Financial highlights of the CEB for the years from 2009 to 2013
As far as the sources of finance of the Board are concerned it had obtained commercial loans amounting
to Rs. 50 billion other than the loans provided by the General Treasury. The interest cost of the Board for
the year 2013 amounted to Rs. 12,813 million and 66 per cent of that represented interest on the
borrowings for the working capital requirements. The liability to the Ceylon Petroleum Corporation had
been reduced from Rs. 20 billion to Rs.6 billion in the year 2013 due to the settlement of dues.
Nevertheless, there is an increasing trend in debt financing. The debt position as at 31 December 2013 is
shown in the Table 5 given below.
Table 5 : Debt position as at 31 December 2013
The total net price variances of Rs 1,898 million in relation to the material purchases and
materials included in the inventories, direct labor and overhead recoveries had been considered as
Income in the Region 02 resulting in an overstatement of profit by that amount.
Further it should be stated that the Puttalam Coal Power Plant had lost 1,394.33 MWh costing Rs.
25,098 million due to breakdowns and inefficiency during the years 2012 and 2013.
The value of 35 reported frauds committed in the year 2013 due to weaknesses in the internal
control amounted to Rs. 49 million.
Sub- loan agreements had not been entered into with the General Treasury in respect to 04 loans
amounting to Rs. 128,240 million granted by the Treasury. As such, the repayment schedule and
the interest on those loans had not been furnished to audit.
RS.
MILLIONS
RS.
MILLIONS
Long Term Loans
Treasury Loans 334,684
Bank Loans 44,404
Lease Creditors 252
Loans from Related Party 3,695
Bank Overdraft 3,474 386,509
Other Liabilities
Ceylon Petroleum Corporation 6,358
Independent Power Suppliers 14,921
Renewable Energy Suppliers 1,122 22,401
Total 408,909
93
AN
NU
AL
RE
PO
RT
OF
TH
E A
UD
IT
OR
GE
NE
RA
L
- 2
01
3
Contrary to the decision of the Cabinet of Ministers dated 13 December 2007 to shift the Pay As
You Earn Tax to the employees from the next salary revision, that is in the year 2009, the Board
had paid the PAYE Tax of its employees from the Board funds. The PAYE Tax paid by the
Board as at 13 December 2013 contrary to the Cabinet decision, amounted to Rs.1,312 million.
Thirty nine different staff allowances had been paid from time to time to the staff by the Board on
the approval of the Board of Directors without obtaining the approval of the Cabinet of Ministers
or the Ministry of Public Administration and Home Affairs or the General Treasury as specified
in the Public Enterprises Circular No 95 of 04 June 1994. Audit test checks revealed that such
allowances amounting to Rs. 642 million had been paid in the year 2013.
Certain Independent Power Producers undertake maintenance contracts of other Independence
Power Producers resulting in related party transactions among them. As such the appropriateness
of reimbursement of the expenditure including taxes without verifying whether imported
materials had actually been used for the maintenance of power plants could not be ascertained in
audit. The reimbursements made in the year 2013 amounted to Rs. 78,356 million.
Ceylon Electricity Board had paid a fine amounting to Rs. 208,283,881 imposed by the Sri Lanka
Customs due to an error in classification of imported goods without making an appeal to the
Minister of Finance for revision or waiver of the fine imposed by the Sri Lanka Customs in terms
of the powers devolved on him under Sections 164 and 165 of the Custom Ordinance (Cap 235)
The number of vacancies in the Executive, Middle Level Technical Service, Skilled Technical
Service, Semi- Skilled Technical Service, and Other Skilled S Grade of the Board as at 31
December 2013 had been 2,486.
Board prepares its consolidated financial statements together with the subsidiaries and sub-
subsidiaries in each year. It should be stated that the Board had not exercising its control and as
such those subsidiaries had incorporated sub-subsidiaries like LTL Transformers (Pvt) Ltd, LTL
Galvanizing (Pvt) Ltd, LTL Energies (Pvt), Pawan Danavi (Pvt) Ltd etc. without the consent of
the Board. As the Ceylon Electricity Board is not represented in the Boards of the Sub-
Subsidiaries, the Board control over the subsidiaries diluted.
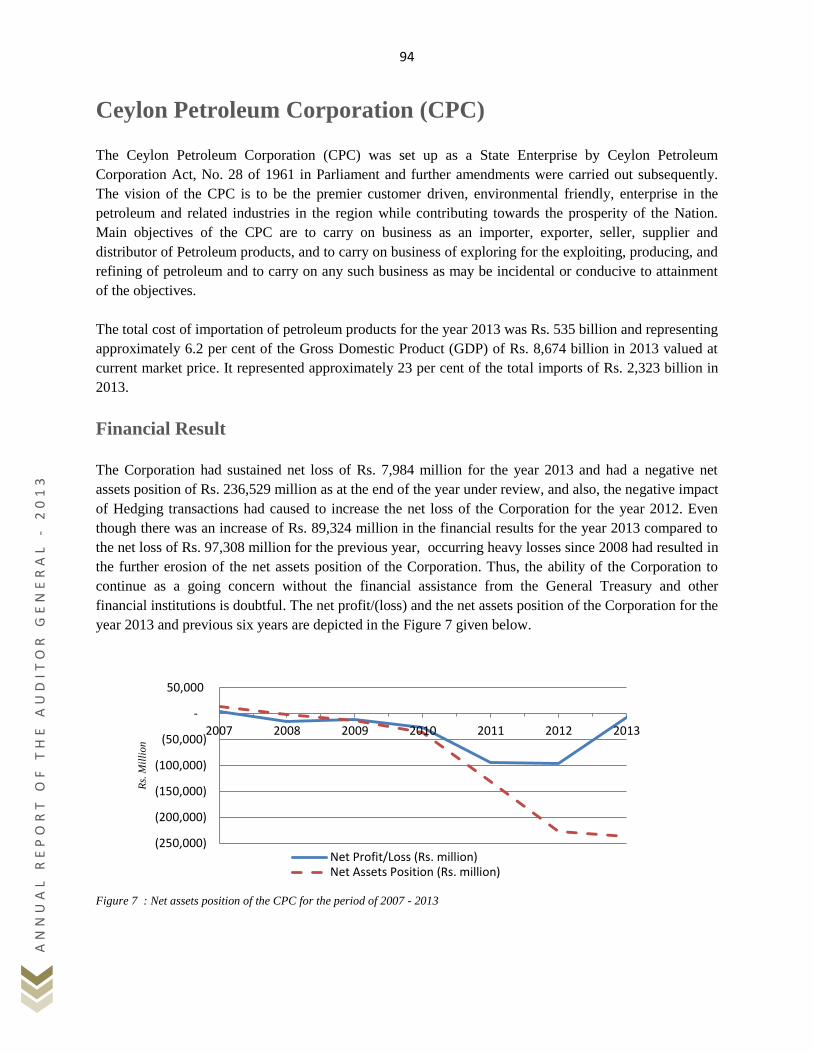
94
AN
NU
AL
RE
PO
RT
OF
TH
E A
UD
IT
OR
GE
NE
RA
L
- 2
01
3
Ceylon Petroleum Corporation (CPC)
The Ceylon Petroleum Corporation (CPC) was set up as a State Enterprise by Ceylon Petroleum
Corporation Act, No. 28 of 1961 in Parliament and further amendments were carried out subsequently.
The vision of the CPC is to be the premier customer driven, environmental friendly, enterprise in the
petroleum and related industries in the region while contributing towards the prosperity of the Nation.
Main objectives of the CPC are to carry on business as an importer, exporter, seller, supplier and
distributor of Petroleum products, and to carry on business of exploring for the exploiting, producing, and
refining of petroleum and to carry on any such business as may be incidental or conducive to attainment
of the objectives.
The total cost of importation of petroleum products for the year 2013 was Rs. 535 billion and representing
approximately 6.2 per cent of the Gross Domestic Product (GDP) of Rs. 8,674 billion in 2013 valued at
current market price. It represented approximately 23 per cent of the total imports of Rs. 2,323 billion in
2013.
Financial Result
The Corporation had sustained net loss of Rs. 7,984 million for the year 2013 and had a negative net
assets position of Rs. 236,529 million as at the end of the year under review, and also, the negative impact
of Hedging transactions had caused to increase the net loss of the Corporation for the year 2012. Even
though there was an increase of Rs. 89,324 million in the financial results for the year 2013 compared to
the net loss of Rs. 97,308 million for the previous year, occurring heavy losses since 2008 had resulted in
the further erosion of the net assets position of the Corporation. Thus, the ability of the Corporation to
continue as a going concern without the financial assistance from the General Treasury and other
financial institutions is doubtful. The net profit/(loss) and the net assets position of the Corporation for the
year 2013 and previous six years are depicted in the Figure 7 given below.
Figure 7 : Net assets position of the CPC for the period of 2007 - 2013
(250,000)
(200,000)
(150,000)
(100,000)
(50,000)
-
50,000
2007 2008 2009 2010 2011 2012 2013
Rs.
Mil
lio
n
Net Profit/Loss (Rs. million)Net Assets Position (Rs. million)
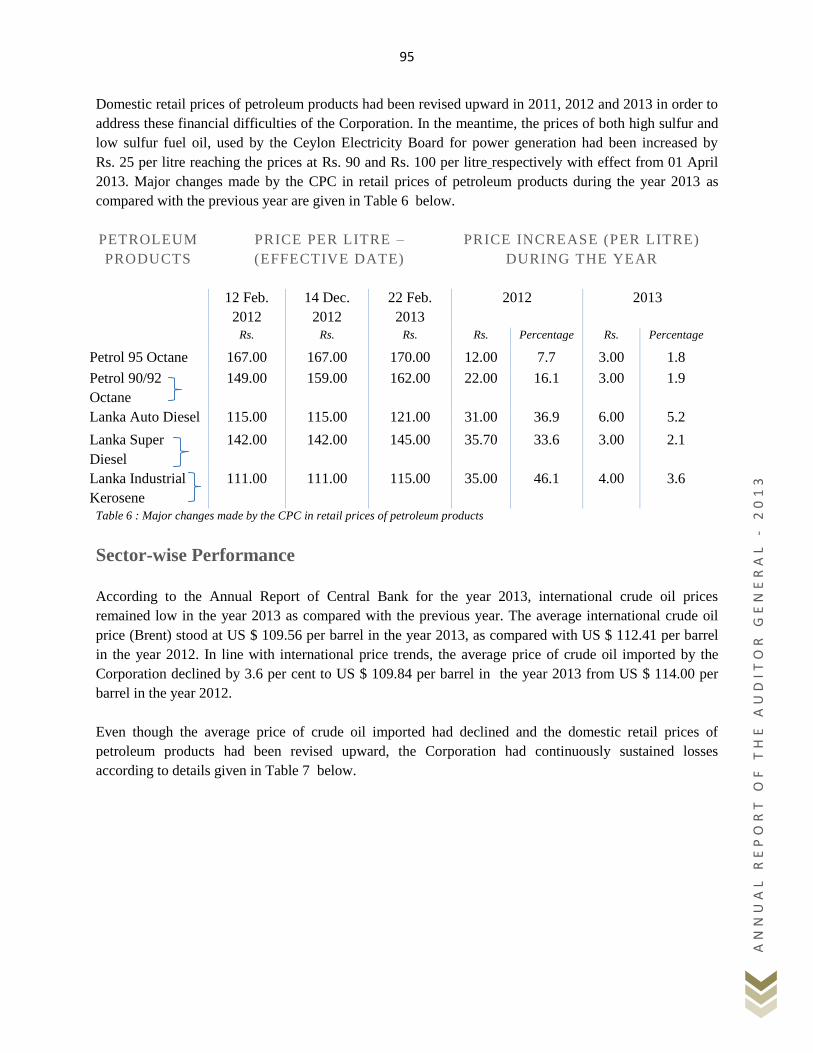
95
AN
NU
AL
RE
PO
RT
OF
TH
E A
UD
IT
OR
GE
NE
RA
L
- 2
01
3
Domestic retail prices of petroleum products had been revised upward in 2011, 2012 and 2013 in order to
address these financial difficulties of the Corporation. In the meantime, the prices of both high sulfur and
low sulfur fuel oil, used by the Ceylon Electricity Board for power generation had been increased by
Rs. 25 per litre reaching the prices at Rs. 90 and Rs. 100 per litre respectively with effect from 01 April
2013. Major changes made by the CPC in retail prices of petroleum products during the year 2013 as
compared with the previous year are given in Table 6 below.
PETROLEUM
PRODUCTS
PRICE PER LITRE –
(EFFECTIVE DATE)
PRICE INCREASE (PER LITRE)
DURING THE YEAR
12 Feb.
2012
14 Dec.
2012
22 Feb.
2013
2012 2013
Rs. Rs. Rs. Rs. Percentage Rs. Percentage
Petrol 95 Octane 167.00 167.00 170.00 12.00 7.7 3.00 1.8
Petrol 90/92
Octane
149.00 159.00 162.00 22.00 16.1 3.00 1.9
Lanka Auto Diesel 115.00 115.00 121.00 31.00 36.9 6.00 5.2
Lanka Super
Diesel
142.00 142.00 145.00 35.70 33.6 3.00 2.1
Lanka Industrial
Kerosene
111.00 111.00 115.00 35.00 46.1 4.00 3.6
Table 6 : Major changes made by the CPC in retail prices of petroleum products
Sector-wise Performance
According to the Annual Report of Central Bank for the year 2013, international crude oil prices
remained low in the year 2013 as compared with the previous year. The average international crude oil
price (Brent) stood at US $ 109.56 per barrel in the year 2013, as compared with US $ 112.41 per barrel
in the year 2012. In line with international price trends, the average price of crude oil imported by the
Corporation declined by 3.6 per cent to US $ 109.84 per barrel in the year 2013 from US $ 114.00 per
barrel in the year 2012.
Even though the average price of crude oil imported had declined and the domestic retail prices of
petroleum products had been revised upward, the Corporation had continuously sustained losses
according to details given in Table 7 below.
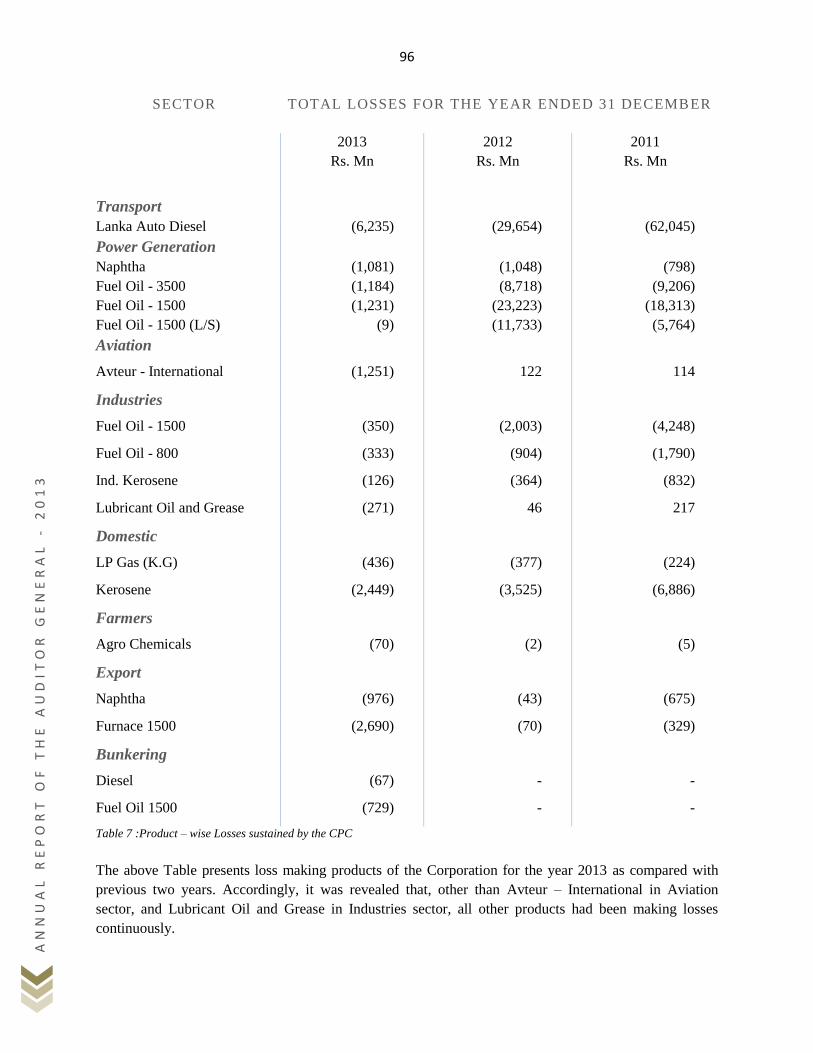
96
AN
NU
AL
RE
PO
RT
OF
TH
E A
UD
IT
OR
GE
NE
RA
L
- 2
01
3
SECTOR
TOTAL LOSSES FOR THE YEAR ENDED 31 DECEMBER
2013
Rs. Mn
2012
Rs. Mn
2011
Rs. Mn
Transport
Lanka Auto Diesel (6,235) (29,654) (62,045)
Power Generation
Naphtha (1,081) (1,048) (798)
Fuel Oil - 3500 (1,184) (8,718) (9,206)
Fuel Oil - 1500 (1,231) (23,223) (18,313)
Fuel Oil - 1500 (L/S) (9) (11,733) (5,764)
Aviation
Avteur - International (1,251) 122 114
Industries
Fuel Oil - 1500 (350) (2,003) (4,248)
Fuel Oil - 800 (333) (904) (1,790)
Ind. Kerosene (126) (364) (832)
Lubricant Oil and Grease (271) 46 217
Domestic
LP Gas (K.G) (436) (377) (224)
Kerosene (2,449) (3,525) (6,886)
Farmers
Agro Chemicals (70) (2) (5)
Export
Naphtha (976) (43) (675)
Furnace 1500 (2,690) (70) (329)
Bunkering
Diesel (67) - -
Fuel Oil 1500 (729) - -
Table 7 :Product – wise Losses sustained by the CPC
The above Table presents loss making products of the Corporation for the year 2013 as compared with
previous two years. Accordingly, it was revealed that, other than Avteur – International in Aviation
sector, and Lubricant Oil and Grease in Industries sector, all other products had been making losses
continuously.
97
AN
NU
AL
RE
PO
RT
OF
TH
E A
UD
IT
OR
GE
NE
RA
L
- 2
01
3
Contributory Factors for the continuous Financial Losses
The main contributory factors for the continuous financial losses of the Corporation were revealed as
inefficiency in refinery operations and falling refinery margins due to the change in sources of crude oil
due to US sanctions on Iran and as a result increasing importation of refined petroleum products to meet
the supply shortage, the provision of furnace oil at a highly subsidized rate to Ceylon Electricity Board
(CEB) prior to the price revision, selling aviation fuel to Srilankan Airlines Ltd and Mihin Lanka (Pvt.)
Ltd at concessionary rates which were lower than the contract customer price, heavy losses incurred on
Hedging settlement, CPC‟s increased borrowings from the Banking Sector to finance its oil bills and
inefficiencies in procurement process of petroleum products of the Corporation, etc.
Inefficiency of Refinery Operations
Out of the country‟s current petroleum products demand, approximately one third is expected to be met
from imported crude oil which undergoes the refining process locally in the refinery owned by the CPC at
Sapugaskanda. The lower refinery yields and operational failures associated with the delays in
modernization and lack of expansion of the refinery had negatively affected the financial performance of
the Corporation.
The quantity of crude oil imported by the Corporation had decreased from 2,070,000 metric tons in the
year 2011 to 1,486,720 metric tons in the year 2012 or by 28.2 per cent and as a result, the quantity of
refined petroleum products imported by the Corporation had increased by 460,000 metric tons from
3,501,000 metric tons in the year 2011 to 3,961,000 metric tons in the year 2012 or by 13.1 per cent.
Even though the volume of crude oil refined (intake) by the Corporation had increased to 1,643,218
metric tons in 2013 as compared with 1,596,058 metric tons in the year 2012, the processing levels had
not reached the production capacity of 6,900 metric tons per stream day or 2,415,000 metric tons in the
year 2013. The Crude Oil intake per annum for the year 2013 and previous ten years as compared with the
production capacity for the relevant years appear in the Figure 8 below.
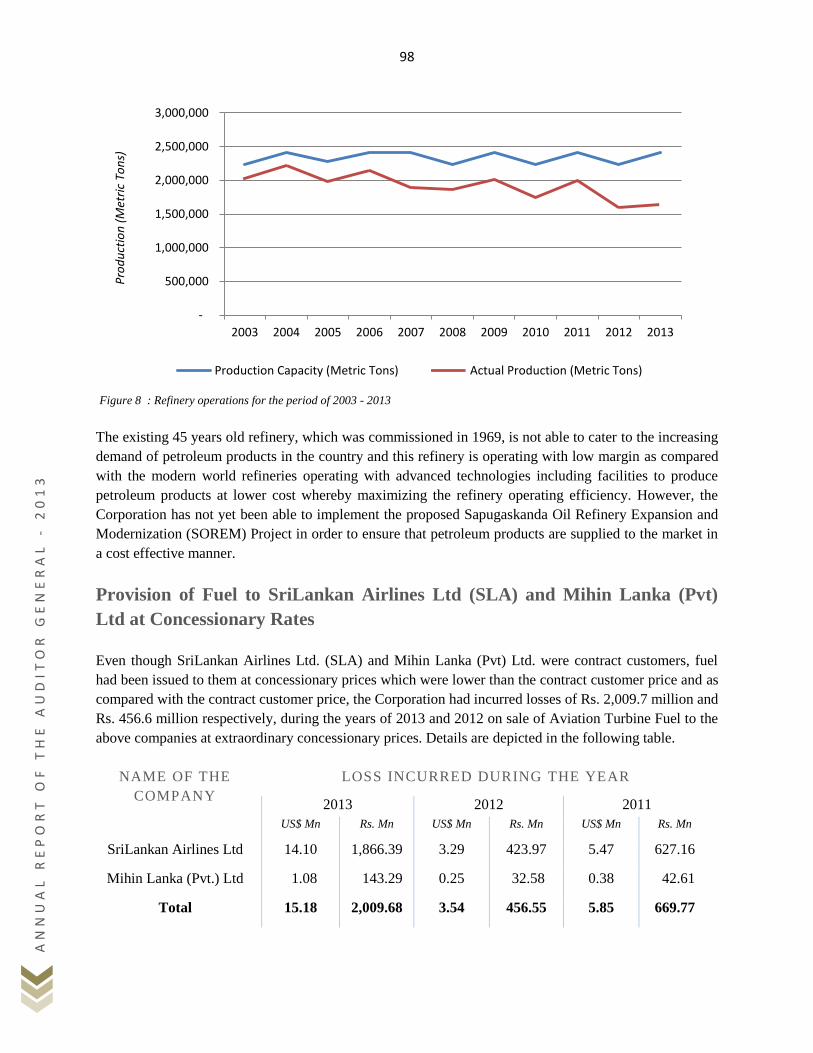
98
AN
NU
AL
RE
PO
RT
OF
TH
E A
UD
IT
OR
GE
NE
RA
L
- 2
01
3
Figure 8 : Refinery operations for the period of 2003 - 2013
The existing 45 years old refinery, which was commissioned in 1969, is not able to cater to the increasing
demand of petroleum products in the country and this refinery is operating with low margin as compared
with the modern world refineries operating with advanced technologies including facilities to produce
petroleum products at lower cost whereby maximizing the refinery operating efficiency. However, the
Corporation has not yet been able to implement the proposed Sapugaskanda Oil Refinery Expansion and
Modernization (SOREM) Project in order to ensure that petroleum products are supplied to the market in
a cost effective manner.
Provision of Fuel to SriLankan Airlines Ltd (SLA) and Mihin Lanka (Pvt)
Ltd at Concessionary Rates
Even though SriLankan Airlines Ltd. (SLA) and Mihin Lanka (Pvt) Ltd. were contract customers, fuel
had been issued to them at concessionary prices which were lower than the contract customer price and as
compared with the contract customer price, the Corporation had incurred losses of Rs. 2,009.7 million and
Rs. 456.6 million respectively, during the years of 2013 and 2012 on sale of Aviation Turbine Fuel to the
above companies at extraordinary concessionary prices. Details are depicted in the following table.
NAME OF THE
COMPANY
LOSS INCURRED DURING THE YEAR
2013 2012 2011
US$ Mn Rs. Mn US$ Mn Rs. Mn US$ Mn Rs. Mn
SriLankan Airlines Ltd 14.10 1,866.39 3.29 423.97 5.47 627.16
Mihin Lanka (Pvt.) Ltd 1.08 143.29 0.25 32.58 0.38 42.61
Total 15.18 2,009.68 3.54 456.55 5.85 669.77
-
500,000
1,000,000
1,500,000
2,000,000
2,500,000
3,000,000
2003 2004 2005 2006 2007 2008 2009 2010 2011 2012 2013
Pro
du
ctio
n (
Met
ric
Ton
s)
Production Capacity (Metric Tons) Actual Production (Metric Tons)
99
AN
NU
AL
RE
PO
RT
OF
TH
E A
UD
IT
OR
GE
NE
RA
L
- 2
01
3
Despite providing fuel at concessionary prices to these two companies, the settlement of outstanding fuel
bills were very poor due to their weak financial performance i.e. according to the Central Bank Annual
Report for the year 2013, SLA recorded an operational loss of Rs. 28.6 billion meanwhile Mihin Lanka
recorded an operating loss of Rs. 1.5 billion in 2013. The outstanding balances as at end of the year 2013
and preceding three years are given below.
NAME OF THE
COMPANY
OUTSTANDING BALANCE AS AT 31 DECEMBER
2013
Rs. Mn.
2012
Rs. Mn.
2011
Rs. Mn.
2010
Rs. Mn.
SriLankan Airlines Ltd 29,520 25,890 12,351 542
Mihin Lanka (Pvt.) Ltd 4,314 3,416 1,227 361
More than 63.6 per cent of total trade receivables of Rs. 53,190 million as at 31 December 2013 was
represented by trade receivables from above two companies, and it shows an increasing trend as
compared with the preceding three years.
Increase of Borrowings from the Banking Sector
The Corporation had increased its borrowings from the Banking Sector to finance its oil bills and it had
resulted in the increase of the sustained losses and to erode the net assets position of the Corporation.
Further, it was observed that the Corporation had incurred a huge finance cost for the year ended 31
December 2013 as compared with the preceding years as depicted in the Table below and which shows an
increasing trend.
YEAR
BANK
BORROWINGS
FOR THE YEAR
ENDED 31
DECEMBER
RS. MN.
FINANCE
COST
RS. MN
ANNUAL
LOSS
ON
ORDINARY
ACTIVITIES
RS. MN
FINANCE COST AS
A PERCENTAGE OF
LOSS FROM
ORDINARY
ACTIVITIES
2013 406,850 18,539.85 7,732.82 239.8
2012 399,520 18,359.68 89,569.18 20.5
2011 310,060 9,000.57 94,503.45 9.5
2010 168,020 6,858.90 26,922.82 25.5
The Corporation had exceeded the limits of the General Treasury indemnity issued to the Commercial
Banks on behalf of the Corporation to secure the foreign currency loans as shown in the details given
below.
100
AN
NU
AL
RE
PO
RT
OF
TH
E A
UD
IT
OR
GE
NE
RA
L
- 2
01
3
NAME OF THE
BANK
OUTSTANDING
AMOUNT AS AT 31
DECEMBER 2013
SECURITY –
GENERAL
TREASURY
INDEMNITY
EXCEEDED
AMOUNT OVER
THE SECURITY
US$ Mn. Rs. Mn. US$ Mn. Rs. Mn. US$ Mn. Rs. Mn.
Bank of Ceylon 1,810.62 239,617 900 119,106 910.34 120,512
People‟s Bank 1,318.16 174,415 650 86,021 668.16 88,424
Accounts Receivable
Total trade receivables as at 31 December 2013 amounted to Rs. 53,190 million with splitting of
Rs.15,416 million and Rs. 37,774 million due from Government institutions and private institutions
respectively, out of which a sum of Rs. 340 million had been outstanding for more than 2 years.
Hedging Transactions
According to the Hedging transactions of the Corporation, the Corporation was cited as a party in the
arbitration proceeding pertaining to Hedging contracts entered into with several commercial Banks. As
such a sum of US Dollars 60 million (Rs. 7,612 million) had been paid to the Standard Chartered Bank
(SCB) on 3 June 2013 under the Deed of Settlement entered between the parties. Further, a sum of US
Dollars 15.3 million had been incurred by the Corporation as legal and other charges. In the meantime, an
arbitration award given in favor of the Corporation amounted to US Dollars 1.3 million (Rs. 153 million)
with regard to the transaction with the Citi Bank.
Pipeline Network for Oil Transportation
Refined petroleum products are stored at Kolonnawa and Muthurajawela Terminals and there is a pipeline
network running between Colombo Port and the Kolonnawa to transfer imported petroleum products to
Ceylon Petroleum Storage Terminal Limited (CPSTL).
The pipelines installed several decades back for the transport of finished petroleum products such as
petrol, diesel, kerosene and furnace oil from the Colombo Port to the Kolonnawa Petroleum Installation
are in a state of disrepair and it was revealed that some of them have already been abandoned due to its‟
deteriorated condition beyond repairs. Renovation and modernization of those pipelines have been a very
urgent need, as a large quantity of the national requirement of the petroleum products is being carried into
Kolonnawa fuel storage terminal through those deteriorated pipelines. Due to country‟s demand for
finished petroleum products is mainly imported through those deteriorated pipelines, the risk of any
possibility to paralyze the whole country with a severe fuel crisis cannot be disregarded in audit.
The Muthurajawela installation is fed through a Single Point Buoy Mooring (SPBM) facility located in
the mid sea about 6 km from the shore and 7.2 km from Muthurajawela Terminal and there was no
alternative supply source in case of rough sea conditions or when the SPBM is under maintenance. At the
101
AN
NU
AL
RE
PO
RT
OF
TH
E A
UD
IT
OR
GE
NE
RA
L
- 2
01
3
same time there was no linkage between the Muthurajawela Terminal and Kolonnawa Installation for
inter-terminal product transfers and, which had also hampered the optimum utilization of those terminals
due to those constraints.
Even though, the approval of the Cabinet of Ministers for the implementation of “Cross Country Pipeline
Project” had been granted on 13 September 2012, such project had not yet been implemented.
Human Resource Management
Out of approved cadre of 3,284 of all categories of staff for the year 2013, vacancies in 713 posts of
different categories, including 153 vacancies in the senior staff category (comprising Manager Internal
Audit, Commercial Manager, DGM Marketing, etc.), were observed as at 31 December 2013. Meanwhile,
10 posts in all categories of the staff had been filled on contract basis and the Chief Internal Auditor has
been working as the Deputy General Manager Finance on acting basis since the mid of the year 2011.
102
AN
NU
AL
RE
PO
RT
OF
TH
E A
UD
IT
OR
GE
NE
RA
L
- 2
01
3
_____________________________________________________________________________________________________________________________________________________________
Education _____________________________________________________________________________________________________________________
Several institutions are affiliated to the Ministry of Education functioning with stated objectives of the
Ministry. They are the Provincial Departments of Education, the Department of Examinations, the
Department of Educational Publications, the National Institute of Education, the National Library and
Documentation Services Board, the Sri Lanka Book Development Board and the Sri Lanka National
UNESCO Commission. In addition the foreign funded Project had constructed to the discharge of the
functions of the Education Sector.
The recurrent expenditure of the Rs. 85,198 million and capital expenditure of Rs. 7,511 million provided
for the Education in the year 2009 had improved to Rs. 115,525 million and Rs. 39,135 million respectively
by the year 2013. In addition, a sum of Rs. 2,427 million by the Ministry of Economic development for the
5,000 Primary School Development Project, a sum of Rs. 1,373 million by the Education for a
Knowledgeable Society Project and a sum of Rs. 242 million by the Reconstruction of the schools system
as the Basics of the Knowledgeable Central Project had been spent for the development of education in the
year 2013.
Schools, Students and Teachers
The number of schools which had been 10,737 in the year 2012 had increased by 115 schools by the end of
the year 2013. The number of students in the Government Schools which had been 4,004,059 in the year
2012 had increased to 4,037,001 in the year 2013 and 342,450 new students had been admitted to
Government Schools in the year 2013.
The Ministry of Education and the Provincial Ministries of Education had recruited 36,616 Teachers from
the year 2009 to the year 2013 and the total number of Teachers in the Government Schools by the end of
the year 2013 had been 226,983 and as compared with the year 2009 indicated an increase of 16 per cent.
Transfer and Attachment of Teachers
Test checks revealed that 653 Teachers of 24 National Schools had been serving in the same school over
periods ranging from 10 years to 30 years due to the non-implementation of the National Policy on Teacher
Transfers in accordance with the provisions in the Circular No. 2007/20 dated 13 December 2007 of the
Secretary to the Ministry of Education.
In the attached of Teachers holding the Special Educational Teaching Diploma 176 such Teachers had been
attachmed to 162 schools without students needing special requirements whereas such Teachers had not
been attached to 128 Schools with 1,145 students needing special requirements.
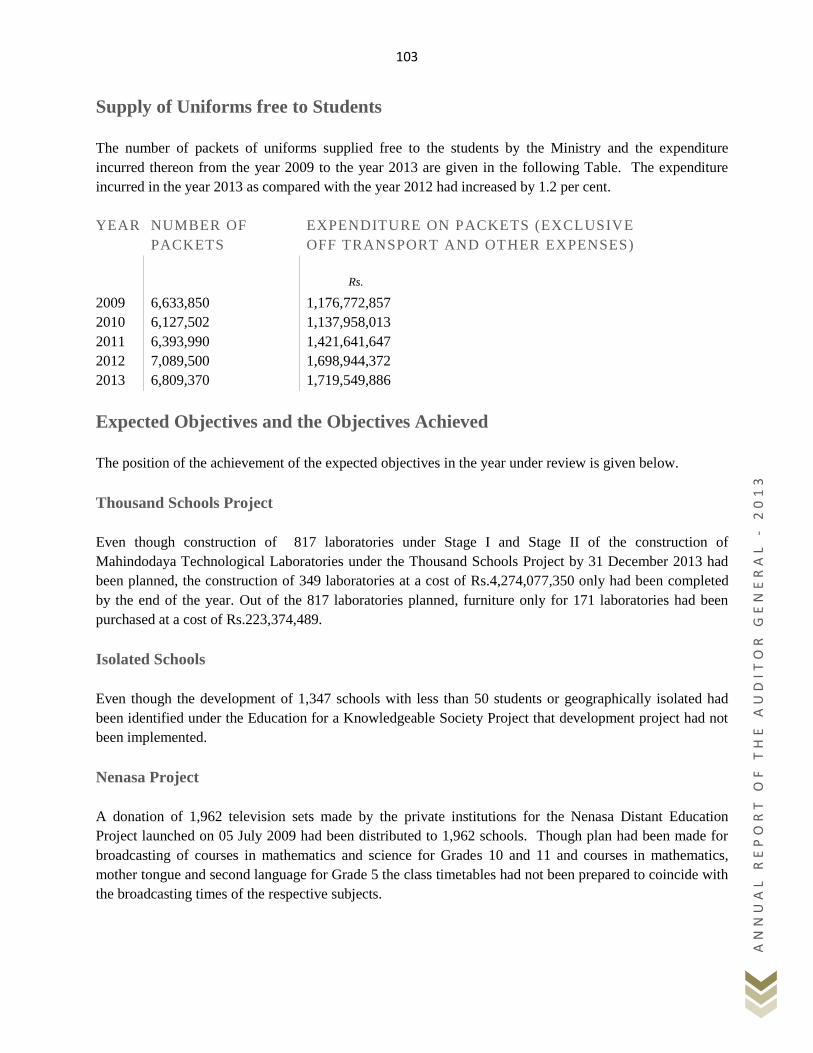
103
AN
NU
AL
RE
PO
RT
OF
TH
E A
UD
IT
OR
GE
NE
RA
L
- 2
01
3
Supply of Uniforms free to Students
The number of packets of uniforms supplied free to the students by the Ministry and the expenditure
incurred thereon from the year 2009 to the year 2013 are given in the following Table. The expenditure
incurred in the year 2013 as compared with the year 2012 had increased by 1.2 per cent.
YEAR NUMBER OF
PACKETS
EXPENDITURE ON PACKETS (EXCLUSIVE
OFF TRANSPORT AND OTHER EXPENSES)
Rs.
2009 6,633,850 1,176,772,857
2010 6,127,502 1,137,958,013
2011 6,393,990 1,421,641,647
2012 7,089,500 1,698,944,372
2013 6,809,370 1,719,549,886
Expected Objectives and the Objectives Achieved
The position of the achievement of the expected objectives in the year under review is given below.
Thousand Schools Project
Even though construction of 817 laboratories under Stage I and Stage II of the construction of
Mahindodaya Technological Laboratories under the Thousand Schools Project by 31 December 2013 had
been planned, the construction of 349 laboratories at a cost of Rs.4,274,077,350 only had been completed
by the end of the year. Out of the 817 laboratories planned, furniture only for 171 laboratories had been
purchased at a cost of Rs.223,374,489.
Isolated Schools
Even though the development of 1,347 schools with less than 50 students or geographically isolated had
been identified under the Education for a Knowledgeable Society Project that development project had not
been implemented.
Nenasa Project
A donation of 1,962 television sets made by the private institutions for the Nenasa Distant Education
Project launched on 05 July 2009 had been distributed to 1,962 schools. Though plan had been made for
broadcasting of courses in mathematics and science for Grades 10 and 11 and courses in mathematics,
mother tongue and second language for Grade 5 the class timetables had not been prepared to coincide with
the broadcasting times of the respective subjects.
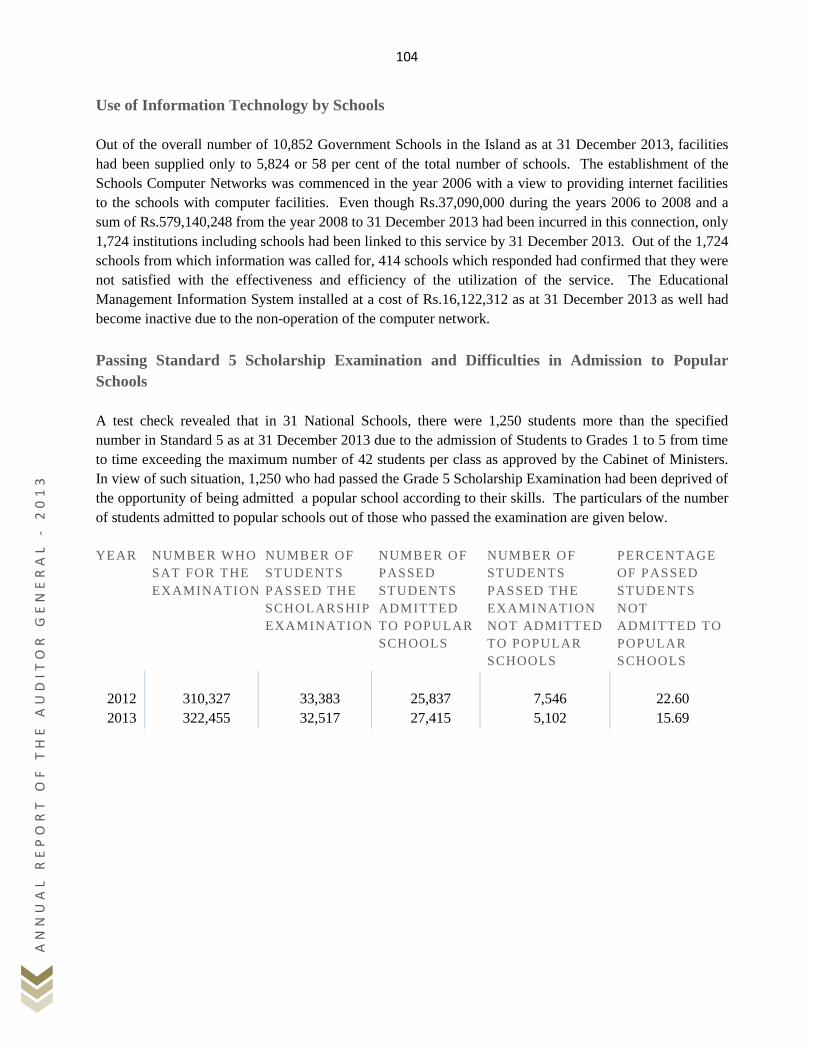
104
AN
NU
AL
RE
PO
RT
OF
TH
E A
UD
IT
OR
GE
NE
RA
L
- 2
01
3
Use of Information Technology by Schools
Out of the overall number of 10,852 Government Schools in the Island as at 31 December 2013, facilities
had been supplied only to 5,824 or 58 per cent of the total number of schools. The establishment of the
Schools Computer Networks was commenced in the year 2006 with a view to providing internet facilities
to the schools with computer facilities. Even though Rs.37,090,000 during the years 2006 to 2008 and a
sum of Rs.579,140,248 from the year 2008 to 31 December 2013 had been incurred in this connection, only
1,724 institutions including schools had been linked to this service by 31 December 2013. Out of the 1,724
schools from which information was called for, 414 schools which responded had confirmed that they were
not satisfied with the effectiveness and efficiency of the utilization of the service. The Educational
Management Information System installed at a cost of Rs.16,122,312 as at 31 December 2013 as well had
become inactive due to the non-operation of the computer network.
Passing Standard 5 Scholarship Examination and Difficulties in Admission to Popular
Schools
A test check revealed that in 31 National Schools, there were 1,250 students more than the specified
number in Standard 5 as at 31 December 2013 due to the admission of Students to Grades 1 to 5 from time
to time exceeding the maximum number of 42 students per class as approved by the Cabinet of Ministers.
In view of such situation, 1,250 who had passed the Grade 5 Scholarship Examination had been deprived of
the opportunity of being admitted a popular school according to their skills. The particulars of the number
of students admitted to popular schools out of those who passed the examination are given below.
YEAR NUMBER WHO
SAT FOR THE
EXAMINATION
NUMBER OF
STUDENTS
PASSED THE
SCHOLARSHIP
EXAMINATION
NUMBER OF
PASSED
STUDENTS
ADMITTED
TO POPULAR
SCHOOLS
NUMBER OF
STUDENTS
PASSED THE
EXAMINATION
NOT ADMITTED
TO POPULAR
SCHOOLS
PERCENTAGE
OF PASSED
STUDENTS
NOT
ADMITTED TO
POPULAR
SCHOOLS
2012 310,327 33,383 25,837 7,546 22.60
2013 322,455 32,517 27,415 5,102 15.69
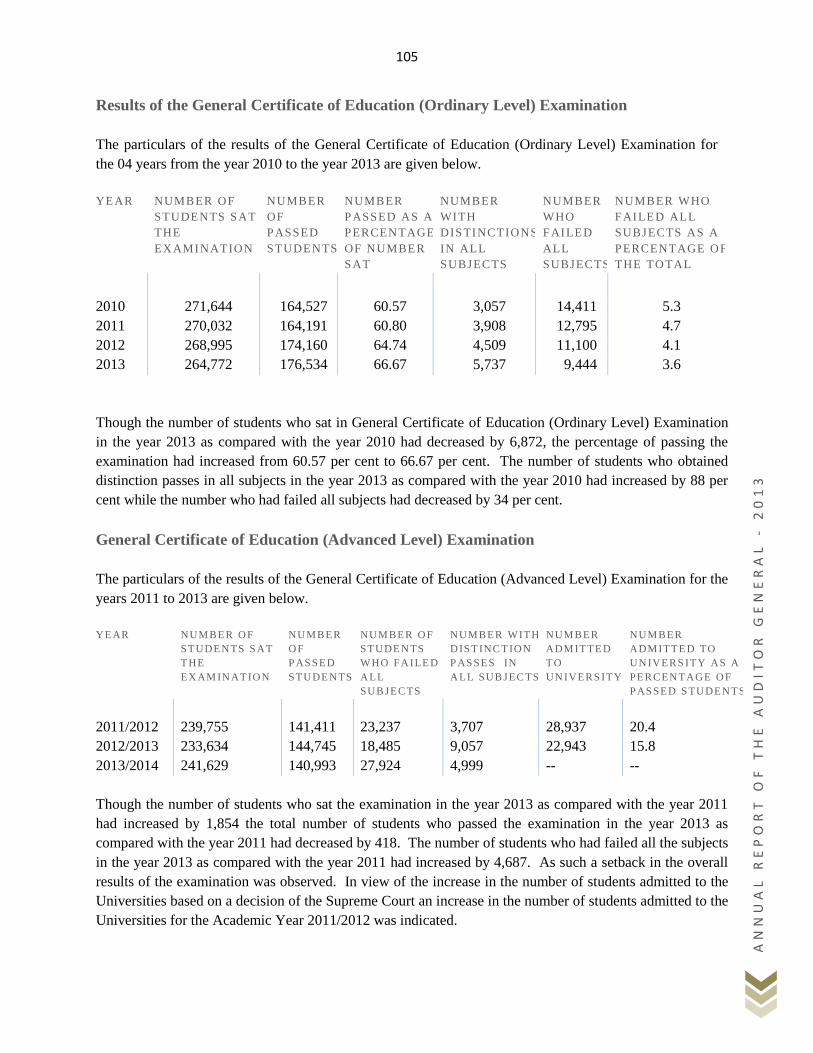
105
AN
NU
AL
RE
PO
RT
OF
TH
E A
UD
IT
OR
GE
NE
RA
L
- 2
01
3
Results of the General Certificate of Education (Ordinary Level) Examination
The particulars of the results of the General Certificate of Education (Ordinary Level) Examination for
the 04 years from the year 2010 to the year 2013 are given below.
YEAR NUMBER OF
STUDENTS SAT
THE
EXAMINATION
NUMBER
OF
PASSED
STUDENTS
NUMBER
PASSED AS A
PERCENTAGE
OF NUMBER
SAT
NUMBER
WITH
DISTINCTIONS
IN ALL
SUBJECTS
NUMBER
WHO
FAILED
ALL
SUBJECTS
NUMBER WHO
FAILED ALL
SUBJECTS AS A
PERCENTAGE OF
THE TO TAL
2010 271,644 164,527 60.57 3,057 14,411 5.3
2011 270,032 164,191 60.80 3,908 12,795 4.7
2012 268,995 174,160 64.74 4,509 11,100 4.1
2013 264,772 176,534 66.67 5,737 9,444 3.6
Though the number of students who sat in General Certificate of Education (Ordinary Level) Examination
in the year 2013 as compared with the year 2010 had decreased by 6,872, the percentage of passing the
examination had increased from 60.57 per cent to 66.67 per cent. The number of students who obtained
distinction passes in all subjects in the year 2013 as compared with the year 2010 had increased by 88 per
cent while the number who had failed all subjects had decreased by 34 per cent.
General Certificate of Education (Advanced Level) Examination
The particulars of the results of the General Certificate of Education (Advanced Level) Examination for the
years 2011 to 2013 are given below.
YE AR NUMBER O F
STUDE N TS S AT
THE
EX AM IN AT IO N
NUMBER
O F
P AS SED
STUDE N TS
NUMBER O F
STUDE N TS
WHO FA ILE D
A LL
SUBJEC TS
NUMBER WITH
D IS T INC T IO N
P AS SES IN
A LL SUB JEC TS
NUMBER
ADM ITTE D
TO
UN IVERS ITY
NUMBER
ADM ITTE D TO
UN IVERS ITY AS A
PERCEN TAGE O F
P AS SED S TU DEN TS
2011/2012 239,755 141,411 23,237 3,707 28,937 20.4
2012/2013 233,634 144,745 18,485 9,057 22,943 15.8
2013/2014 241,629 140,993 27,924 4,999 -- --
Though the number of students who sat the examination in the year 2013 as compared with the year 2011
had increased by 1,854 the total number of students who passed the examination in the year 2013 as
compared with the year 2011 had decreased by 418. The number of students who had failed all the subjects
in the year 2013 as compared with the year 2011 had increased by 4,687. As such a setback in the overall
results of the examination was observed. In view of the increase in the number of students admitted to the
Universities based on a decision of the Supreme Court an increase in the number of students admitted to the
Universities for the Academic Year 2011/2012 was indicated.
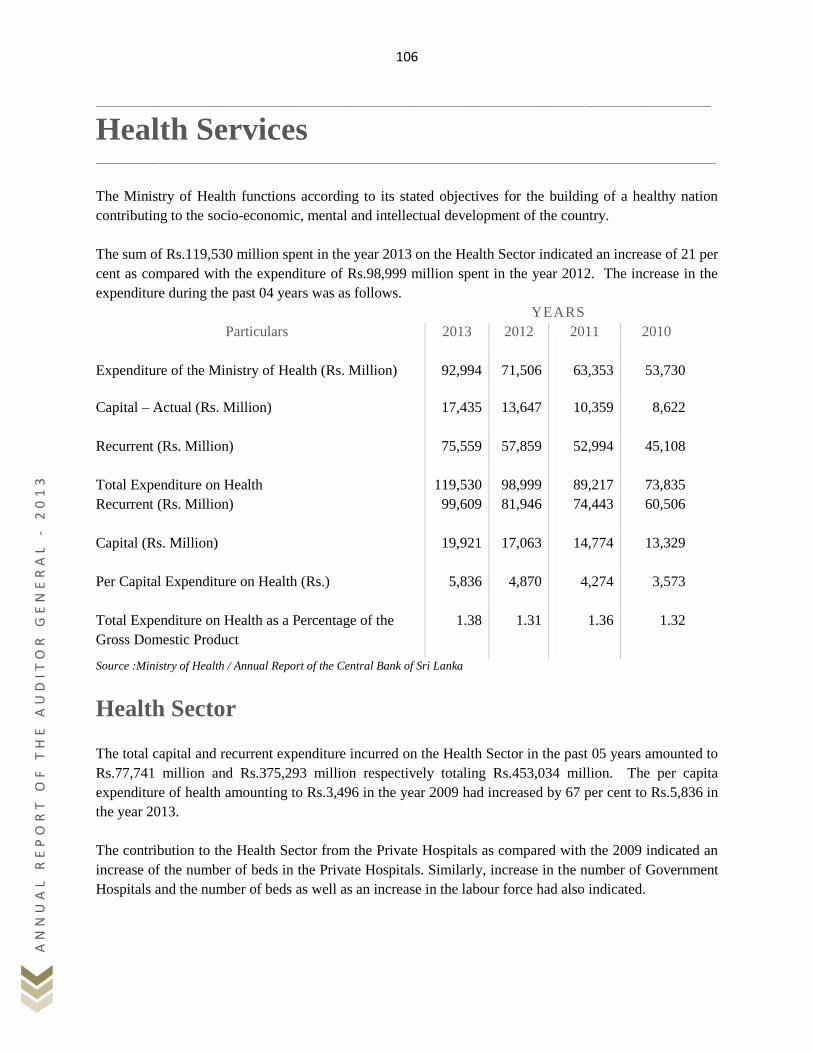
106
AN
NU
AL
RE
PO
RT
OF
TH
E A
UD
IT
OR
GE
NE
RA
L
- 2
01
3
____________________________________________________________________________________________________________________________________________________________
Health Services _____________________________________________________________________________________________________________________
The Ministry of Health functions according to its stated objectives for the building of a healthy nation
contributing to the socio-economic, mental and intellectual development of the country.
The sum of Rs.119,530 million spent in the year 2013 on the Health Sector indicated an increase of 21 per
cent as compared with the expenditure of Rs.98,999 million spent in the year 2012. The increase in the
expenditure during the past 04 years was as follows.
YEARS
Particulars 2013 2012 2011 2010
Expenditure of the Ministry of Health (Rs. Million) 92,994 71,506 63,353 53,730
Capital – Actual (Rs. Million)
17,435 13,647 10,359 8,622
Recurrent (Rs. Million)
75,559 57,859 52,994 45,108
Total Expenditure on Health 119,530 98,999 89,217 73,835
Recurrent (Rs. Million)
99,609 81,946 74,443 60,506
Capital (Rs. Million)
19,921 17,063 14,774 13,329
Per Capital Expenditure on Health (Rs.) 5,836 4,870 4,274 3,573
Total Expenditure on Health as a Percentage of the
Gross Domestic Product
1.38 1.31 1.36 1.32
Source :Ministry of Health / Annual Report of the Central Bank of Sri Lanka
Health Sector
The total capital and recurrent expenditure incurred on the Health Sector in the past 05 years amounted to
Rs.77,741 million and Rs.375,293 million respectively totaling Rs.453,034 million. The per capita
expenditure of health amounting to Rs.3,496 in the year 2009 had increased by 67 per cent to Rs.5,836 in
the year 2013.
The contribution to the Health Sector from the Private Hospitals as compared with the 2009 indicated an
increase of the number of beds in the Private Hospitals. Similarly, increase in the number of Government
Hospitals and the number of beds as well as an increase in the labour force had also indicated.
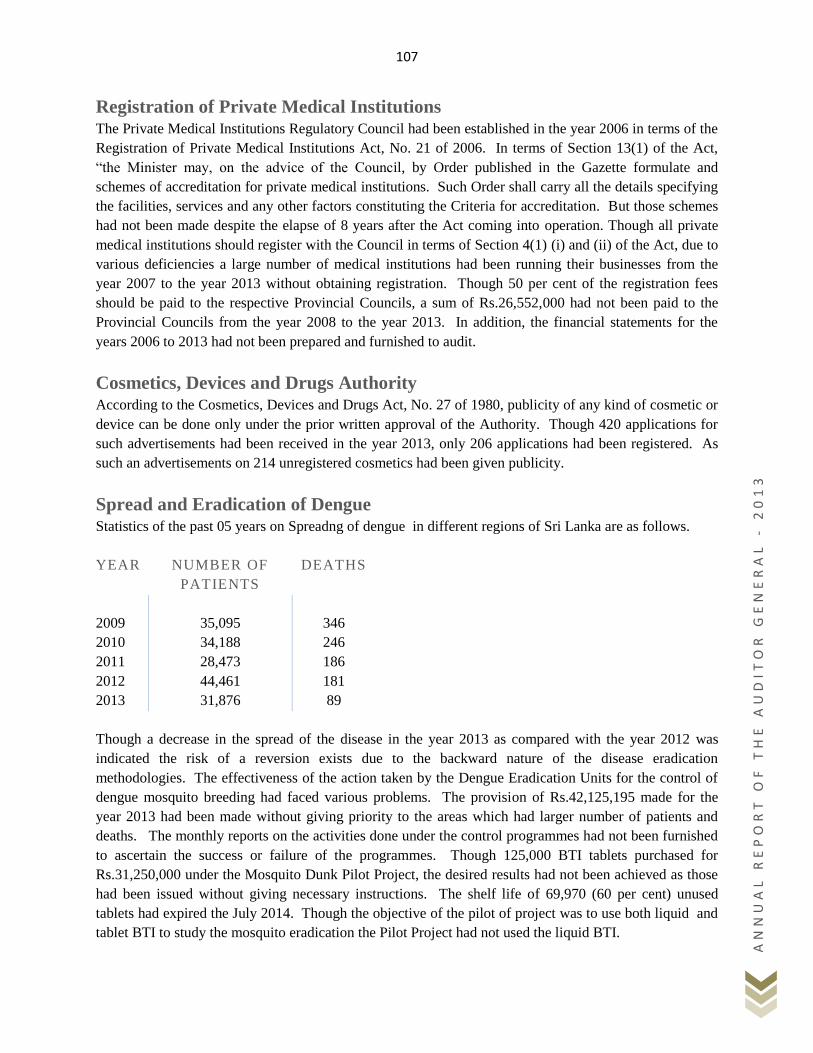
107
AN
NU
AL
RE
PO
RT
OF
TH
E A
UD
IT
OR
GE
NE
RA
L
- 2
01
3
Registration of Private Medical Institutions The Private Medical Institutions Regulatory Council had been established in the year 2006 in terms of the
Registration of Private Medical Institutions Act, No. 21 of 2006. In terms of Section 13(1) of the Act,
“the Minister may, on the advice of the Council, by Order published in the Gazette formulate and
schemes of accreditation for private medical institutions. Such Order shall carry all the details specifying
the facilities, services and any other factors constituting the Criteria for accreditation. But those schemes
had not been made despite the elapse of 8 years after the Act coming into operation. Though all private
medical institutions should register with the Council in terms of Section 4(1) (i) and (ii) of the Act, due to
various deficiencies a large number of medical institutions had been running their businesses from the
year 2007 to the year 2013 without obtaining registration. Though 50 per cent of the registration fees
should be paid to the respective Provincial Councils, a sum of Rs.26,552,000 had not been paid to the
Provincial Councils from the year 2008 to the year 2013. In addition, the financial statements for the
years 2006 to 2013 had not been prepared and furnished to audit.
Cosmetics, Devices and Drugs Authority According to the Cosmetics, Devices and Drugs Act, No. 27 of 1980, publicity of any kind of cosmetic or
device can be done only under the prior written approval of the Authority. Though 420 applications for
such advertisements had been received in the year 2013, only 206 applications had been registered. As
such an advertisements on 214 unregistered cosmetics had been given publicity.
Spread and Eradication of Dengue Statistics of the past 05 years on Spreadng of dengue in different regions of Sri Lanka are as follows.
YEAR NUMBER OF
PATIENTS
DEATHS
2009 35,095 346
2010 34,188 246
2011 28,473 186
2012 44,461 181
2013 31,876 89
Though a decrease in the spread of the disease in the year 2013 as compared with the year 2012 was
indicated the risk of a reversion exists due to the backward nature of the disease eradication
methodologies. The effectiveness of the action taken by the Dengue Eradication Units for the control of
dengue mosquito breeding had faced various problems. The provision of Rs.42,125,195 made for the
year 2013 had been made without giving priority to the areas which had larger number of patients and
deaths. The monthly reports on the activities done under the control programmes had not been furnished
to ascertain the success or failure of the programmes. Though 125,000 BTI tablets purchased for
Rs.31,250,000 under the Mosquito Dunk Pilot Project, the desired results had not been achieved as those
had been issued without giving necessary instructions. The shelf life of 69,970 (60 per cent) unused
tablets had expired the July 2014. Though the objective of the pilot of project was to use both liquid and
tablet BTI to study the mosquito eradication the Pilot Project had not used the liquid BTI.
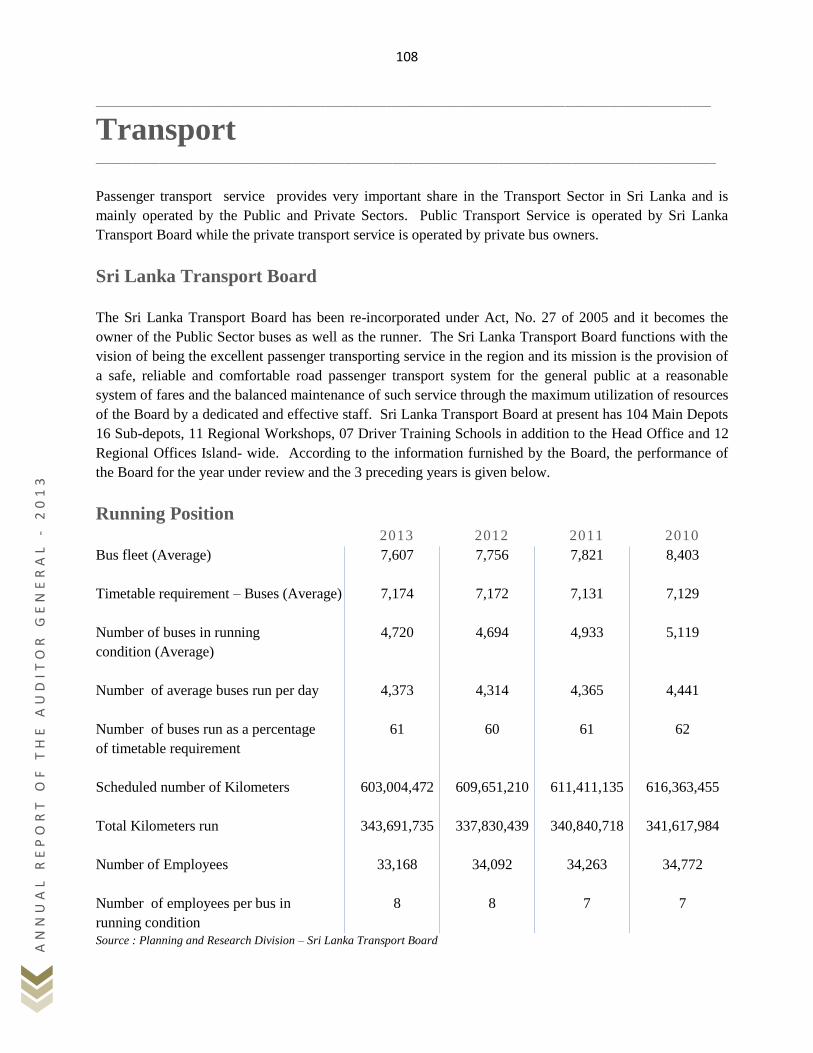
108
AN
NU
AL
RE
PO
RT
OF
TH
E A
UD
IT
OR
GE
NE
RA
L
- 2
01
3
____________________________________________________________________________________________________________________________________________________________
Transport _____________________________________________________________________________________________________________________
Passenger transport service provides very important share in the Transport Sector in Sri Lanka and is
mainly operated by the Public and Private Sectors. Public Transport Service is operated by Sri Lanka
Transport Board while the private transport service is operated by private bus owners.
Sri Lanka Transport Board
The Sri Lanka Transport Board has been re-incorporated under Act, No. 27 of 2005 and it becomes the
owner of the Public Sector buses as well as the runner. The Sri Lanka Transport Board functions with the
vision of being the excellent passenger transporting service in the region and its mission is the provision of
a safe, reliable and comfortable road passenger transport system for the general public at a reasonable
system of fares and the balanced maintenance of such service through the maximum utilization of resources
of the Board by a dedicated and effective staff. Sri Lanka Transport Board at present has 104 Main Depots
16 Sub-depots, 11 Regional Workshops, 07 Driver Training Schools in addition to the Head Office and 12
Regional Offices Island- wide. According to the information furnished by the Board, the performance of
the Board for the year under review and the 3 preceding years is given below.
Running Position 2013 2012 2011 2010
Bus fleet (Average) 7,607 7,756 7,821 8,403
Timetable requirement – Buses (Average)
7,174 7,172 7,131 7,129
Number of buses in running
condition (Average)
4,720 4,694 4,933 5,119
Number of average buses run per day 4,373 4,314 4,365 4,441
Number of buses run as a percentage
of timetable requirement
61 60 61 62
Scheduled number of Kilometers
603,004,472 609,651,210 611,411,135 616,363,455
Total Kilometers run
343,691,735 337,830,439 340,840,718 341,617,984
Number of Employees
33,168 34,092 34,263 34,772
Number of employees per bus in running condition
8 8 7 7
Source : Planning and Research Division – Sri Lanka Transport Board
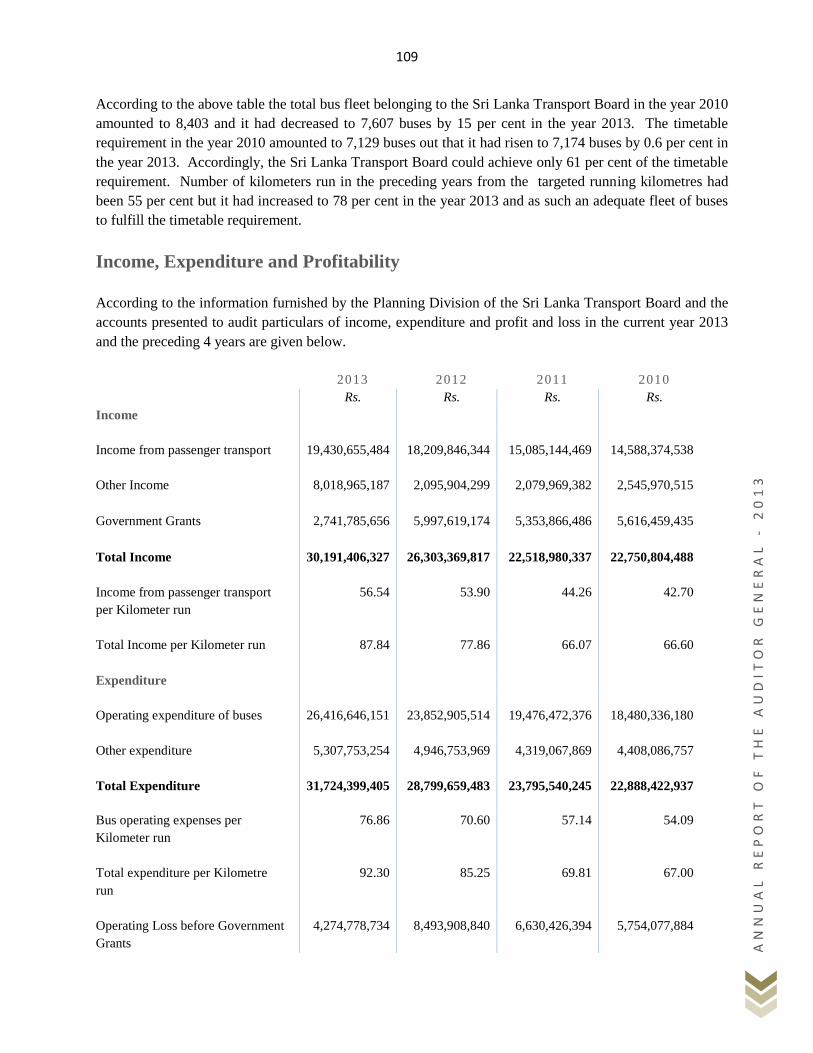
109
AN
NU
AL
RE
PO
RT
OF
TH
E A
UD
IT
OR
GE
NE
RA
L
- 2
01
3
According to the above table the total bus fleet belonging to the Sri Lanka Transport Board in the year 2010
amounted to 8,403 and it had decreased to 7,607 buses by 15 per cent in the year 2013. The timetable
requirement in the year 2010 amounted to 7,129 buses out that it had risen to 7,174 buses by 0.6 per cent in
the year 2013. Accordingly, the Sri Lanka Transport Board could achieve only 61 per cent of the timetable
requirement. Number of kilometers run in the preceding years from the targeted running kilometres had
been 55 per cent but it had increased to 78 per cent in the year 2013 and as such an adequate fleet of buses
to fulfill the timetable requirement.
Income, Expenditure and Profitability
According to the information furnished by the Planning Division of the Sri Lanka Transport Board and the
accounts presented to audit particulars of income, expenditure and profit and loss in the current year 2013
and the preceding 4 years are given below.
2013 2012 2011 2010
Rs. Rs. Rs. Rs.
Income
Income from passenger transport 19,430,655,484 18,209,846,344 15,085,144,469 14,588,374,538
Other Income
8,018,965,187 2,095,904,299 2,079,969,382 2,545,970,515
Government Grants
2,741,785,656 5,997,619,174 5,353,866,486 5,616,459,435
Total Income 30,191,406,327 26,303,369,817 22,518,980,337 22,750,804,488
Income from passenger transport
per Kilometer run
56.54 53.90 44.26 42.70
Total Income per Kilometer run
87.84 77.86 66.07 66.60
Expenditure
Operating expenditure of buses
26,416,646,151 23,852,905,514 19,476,472,376 18,480,336,180
Other expenditure
5,307,753,254 4,946,753,969 4,319,067,869 4,408,086,757
Total Expenditure 31,724,399,405 28,799,659,483 23,795,540,245 22,888,422,937
Bus operating expenses per
Kilometer run
76.86 70.60 57.14 54.09
Total expenditure per Kilometre
run
92.30 85.25 69.81 67.00
Operating Loss before Government
Grants
4,274,778,734 8,493,908,840 6,630,426,394 5,754,077,884
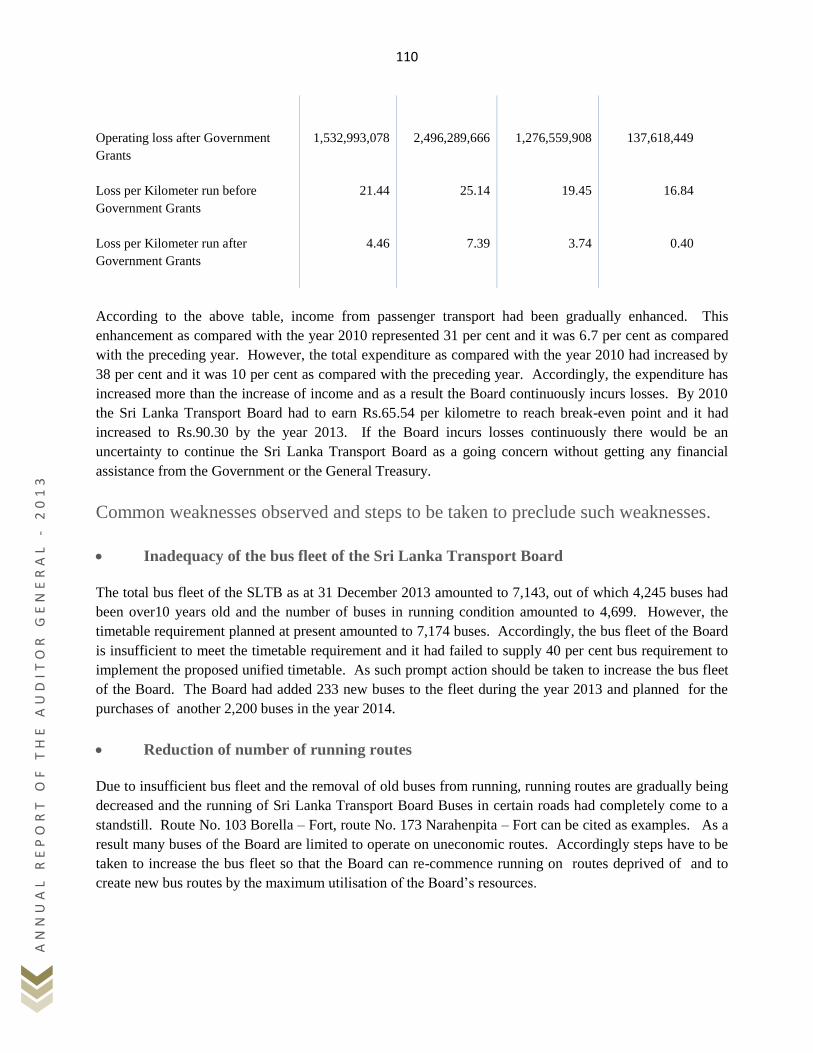
110
AN
NU
AL
RE
PO
RT
OF
TH
E A
UD
IT
OR
GE
NE
RA
L
- 2
01
3
Operating loss after Government
Grants
1,532,993,078 2,496,289,666 1,276,559,908 137,618,449
Loss per Kilometer run before
Government Grants
21.44 25.14 19.45 16.84
Loss per Kilometer run after
Government Grants
4.46 7.39 3.74 0.40
According to the above table, income from passenger transport had been gradually enhanced. This
enhancement as compared with the year 2010 represented 31 per cent and it was 6.7 per cent as compared
with the preceding year. However, the total expenditure as compared with the year 2010 had increased by
38 per cent and it was 10 per cent as compared with the preceding year. Accordingly, the expenditure has
increased more than the increase of income and as a result the Board continuously incurs losses. By 2010
the Sri Lanka Transport Board had to earn Rs.65.54 per kilometre to reach break-even point and it had
increased to Rs.90.30 by the year 2013. If the Board incurs losses continuously there would be an
uncertainty to continue the Sri Lanka Transport Board as a going concern without getting any financial
assistance from the Government or the General Treasury.
Common weaknesses observed and steps to be taken to preclude such weaknesses.
Inadequacy of the bus fleet of the Sri Lanka Transport Board
The total bus fleet of the SLTB as at 31 December 2013 amounted to 7,143, out of which 4,245 buses had
been over10 years old and the number of buses in running condition amounted to 4,699. However, the
timetable requirement planned at present amounted to 7,174 buses. Accordingly, the bus fleet of the Board
is insufficient to meet the timetable requirement and it had failed to supply 40 per cent bus requirement to
implement the proposed unified timetable. As such prompt action should be taken to increase the bus fleet
of the Board. The Board had added 233 new buses to the fleet during the year 2013 and planned for the
purchases of another 2,200 buses in the year 2014.
Reduction of number of running routes
Due to insufficient bus fleet and the removal of old buses from running, running routes are gradually being
decreased and the running of Sri Lanka Transport Board Buses in certain roads had completely come to a
standstill. Route No. 103 Borella – Fort, route No. 173 Narahenpita – Fort can be cited as examples. As a
result many buses of the Board are limited to operate on uneconomic routes. Accordingly steps have to be
taken to increase the bus fleet so that the Board can re-commence running on routes deprived of and to
create new bus routes by the maximum utilisation of the Board‟s resources.
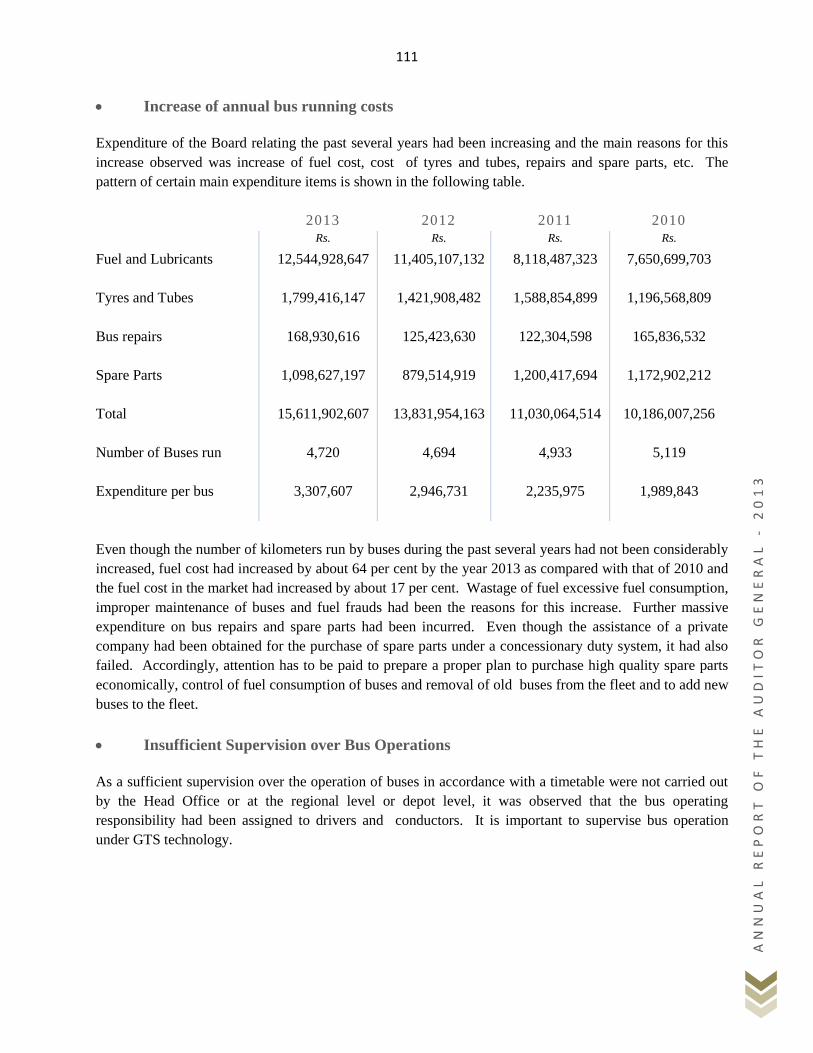
111
AN
NU
AL
RE
PO
RT
OF
TH
E A
UD
IT
OR
GE
NE
RA
L
- 2
01
3
Increase of annual bus running costs
Expenditure of the Board relating the past several years had been increasing and the main reasons for this
increase observed was increase of fuel cost, cost of tyres and tubes, repairs and spare parts, etc. The
pattern of certain main expenditure items is shown in the following table.
2013 2012 2011 2010
Rs. Rs. Rs. Rs.
Fuel and Lubricants 12,544,928,647 11,405,107,132 8,118,487,323 7,650,699,703
Tyres and Tubes
1,799,416,147 1,421,908,482 1,588,854,899 1,196,568,809
Bus repairs
168,930,616 125,423,630 122,304,598 165,836,532
Spare Parts 1,098,627,197 879,514,919 1,200,417,694 1,172,902,212
Total
15,611,902,607 13,831,954,163 11,030,064,514 10,186,007,256
Number of Buses run
4,720 4,694 4,933 5,119
Expenditure per bus 3,307,607 2,946,731 2,235,975 1,989,843
Even though the number of kilometers run by buses during the past several years had not been considerably
increased, fuel cost had increased by about 64 per cent by the year 2013 as compared with that of 2010 and
the fuel cost in the market had increased by about 17 per cent. Wastage of fuel excessive fuel consumption,
improper maintenance of buses and fuel frauds had been the reasons for this increase. Further massive
expenditure on bus repairs and spare parts had been incurred. Even though the assistance of a private
company had been obtained for the purchase of spare parts under a concessionary duty system, it had also
failed. Accordingly, attention has to be paid to prepare a proper plan to purchase high quality spare parts
economically, control of fuel consumption of buses and removal of old buses from the fleet and to add new
buses to the fleet.
Insufficient Supervision over Bus Operations
As a sufficient supervision over the operation of buses in accordance with a timetable were not carried out
by the Head Office or at the regional level or depot level, it was observed that the bus operating
responsibility had been assigned to drivers and conductors. It is important to supervise bus operation
under GTS technology.
112
AN
NU
AL
RE
PO
RT
OF
TH
E A
UD
IT
OR
GE
NE
RA
L
- 2
01
3
Handing over the daily income with shortages by conductors
As conductors handover daily revenue collections with shortages conductors‟ outstanding amount is
gradually increasing and there is a delay in recovering those outstanding amounts. As such, it is important
to supply ticket machines to every depot and to strengthen the flying squad in order to minimize cash
frauds from bus ticket cash collection.
Other course of action to be taken by the Board for its enhancement
Implementation of 60 to 40 per cent policy on private and public sector transport.
Introduction of a pre-paid card system for passengers.
Improvement of Drivers‟ Training Schools of the Board and creation of disciplined and
useful drivers to the country.
Increase the capacity of Ampara Tyre Factory to fulfill the tyre requirement of buses of the
Board.
Utilization of unutilized land and buildings belonging to the Board for effective purposes.
Reformation of the Internal Control Systems to suit the present situation after a revew of
the existing systems in operation.
Training of staff, motivate them and paying attention of the top management on the safety
of employees of the Board.
Preparation of annual financial statements in accordance with Sri Lanka Accounting
Standards, presentation of accounts for audit without delay and the introduction of a
Computerized Accounting System.
Strengthening the Internal Audit Division and intervention of the top management for the
rectification of deficiencies reported by the Internal Audit Division.
Compliance with internal and external laws, rules and regulations by all staff including top
management.
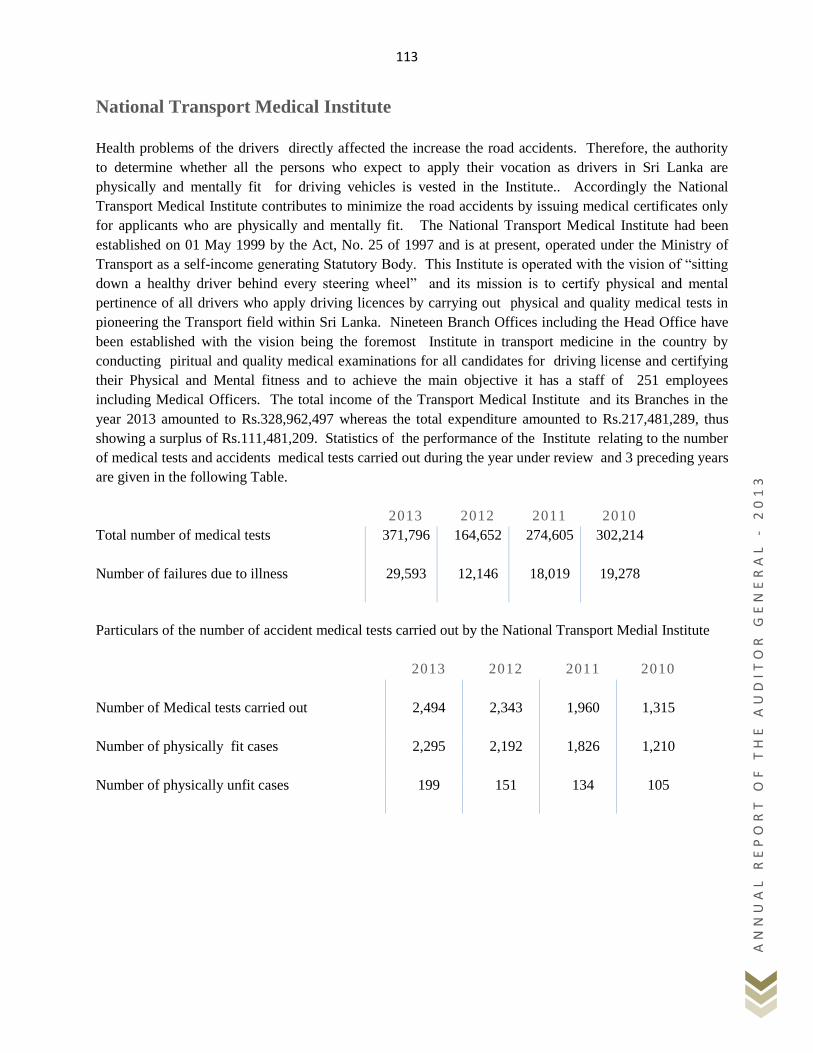
113
AN
NU
AL
RE
PO
RT
OF
TH
E A
UD
IT
OR
GE
NE
RA
L
- 2
01
3
National Transport Medical Institute
Health problems of the drivers directly affected the increase the road accidents. Therefore, the authority
to determine whether all the persons who expect to apply their vocation as drivers in Sri Lanka are
physically and mentally fit for driving vehicles is vested in the Institute.. Accordingly the National
Transport Medical Institute contributes to minimize the road accidents by issuing medical certificates only
for applicants who are physically and mentally fit. The National Transport Medical Institute had been
established on 01 May 1999 by the Act, No. 25 of 1997 and is at present, operated under the Ministry of
Transport as a self-income generating Statutory Body. This Institute is operated with the vision of “sitting
down a healthy driver behind every steering wheel” and its mission is to certify physical and mental
pertinence of all drivers who apply driving licences by carrying out physical and quality medical tests in
pioneering the Transport field within Sri Lanka. Nineteen Branch Offices including the Head Office have
been established with the vision being the foremost Institute in transport medicine in the country by
conducting piritual and quality medical examinations for all candidates for driving license and certifying
their Physical and Mental fitness and to achieve the main objective it has a staff of 251 employees
including Medical Officers. The total income of the Transport Medical Institute and its Branches in the
year 2013 amounted to Rs.328,962,497 whereas the total expenditure amounted to Rs.217,481,289, thus
showing a surplus of Rs.111,481,209. Statistics of the performance of the Institute relating to the number
of medical tests and accidents medical tests carried out during the year under review and 3 preceding years
are given in the following Table.
2013 2012 2011 2010
Total number of medical tests 371,796 164,652 274,605 302,214
Number of failures due to illness 29,593 12,146 18,019 19,278
Particulars of the number of accident medical tests carried out by the National Transport Medial Institute
2013 2012 2011 2010
Number of Medical tests carried out 2,494 2,343 1,960 1,315
Number of physically fit cases
2,295 2,192 1,826 1,210
Number of physically unfit cases 199 151 134 105
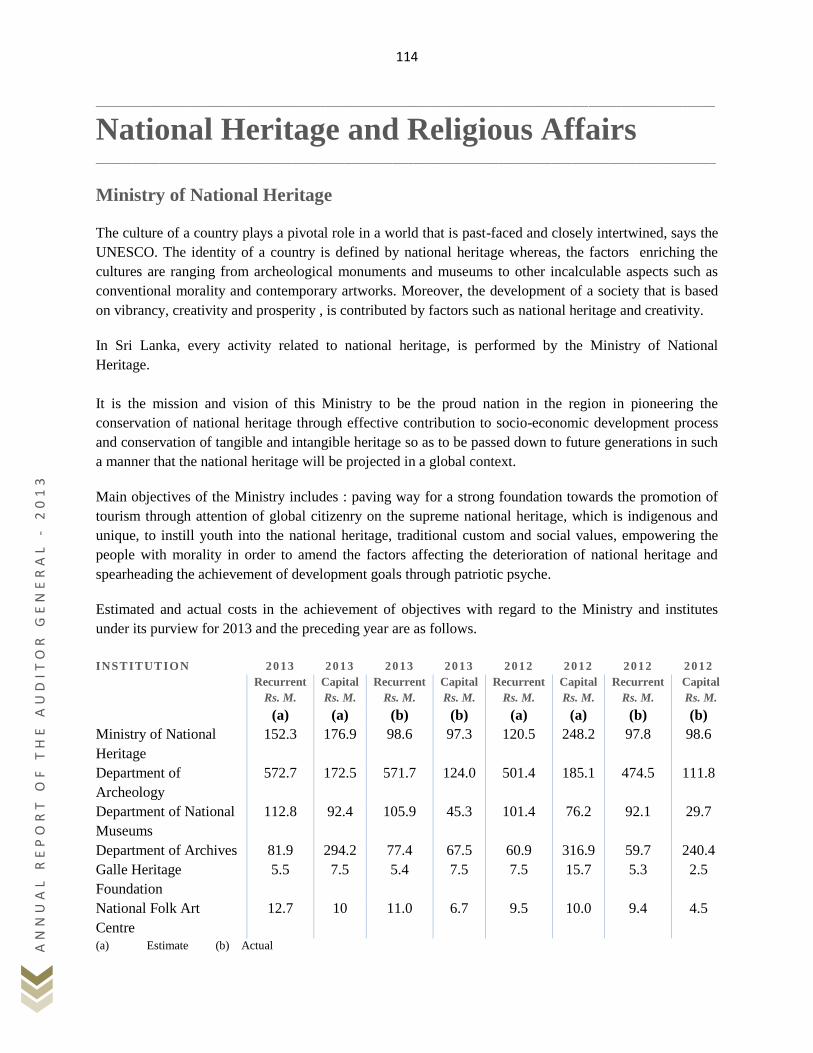
114
AN
NU
AL
RE
PO
RT
OF
TH
E A
UD
IT
OR
GE
NE
RA
L
- 2
01
3
_____________________________________________________________________________________________________________________________________________________________
National Heritage and Religious Affairs _____________________________________________________________________________________________________________________
Ministry of National Heritage
The culture of a country plays a pivotal role in a world that is past-faced and closely intertwined, says the
UNESCO. The identity of a country is defined by national heritage whereas, the factors enriching the
cultures are ranging from archeological monuments and museums to other incalculable aspects such as
conventional morality and contemporary artworks. Moreover, the development of a society that is based
on vibrancy, creativity and prosperity , is contributed by factors such as national heritage and creativity.
In Sri Lanka, every activity related to national heritage, is performed by the Ministry of National
Heritage.
It is the mission and vision of this Ministry to be the proud nation in the region in pioneering the
conservation of national heritage through effective contribution to socio-economic development process
and conservation of tangible and intangible heritage so as to be passed down to future generations in such
a manner that the national heritage will be projected in a global context.
Main objectives of the Ministry includes : paving way for a strong foundation towards the promotion of
tourism through attention of global citizenry on the supreme national heritage, which is indigenous and
unique, to instill youth into the national heritage, traditional custom and social values, empowering the
people with morality in order to amend the factors affecting the deterioration of national heritage and
spearheading the achievement of development goals through patriotic psyche.
Estimated and actual costs in the achievement of objectives with regard to the Ministry and institutes
under its purview for 2013 and the preceding year are as follows.
INSTITUTION 2013 2013 2013 2013 2012 2012 2012 2012
Recurrent
Rs. M.
Capital
Rs. M.
Recurrent
Rs. M.
Capital
Rs. M.
Recurrent
Rs. M.
Capital
Rs. M.
Recurrent
Rs. M.
Capital
Rs. M.
(a) (a) (b) (b) (a) (a) (b) (b)
Ministry of National
Heritage
152.3 176.9 98.6 97.3 120.5 248.2 97.8 98.6
Department of
Archeology
572.7 172.5 571.7 124.0 501.4 185.1 474.5 111.8
Department of National
Museums
112.8 92.4 105.9 45.3 101.4 76.2 92.1 29.7
Department of Archives 81.9 294.2 77.4 67.5 60.9 316.9 59.7 240.4
Galle Heritage
Foundation
5.5 7.5 5.4 7.5 7.5 15.7 5.3 2.5
National Folk Art
Centre
12.7 10 11.0 6.7 9.5 10.0 9.4 4.5
(a) Estimate (b) Actual
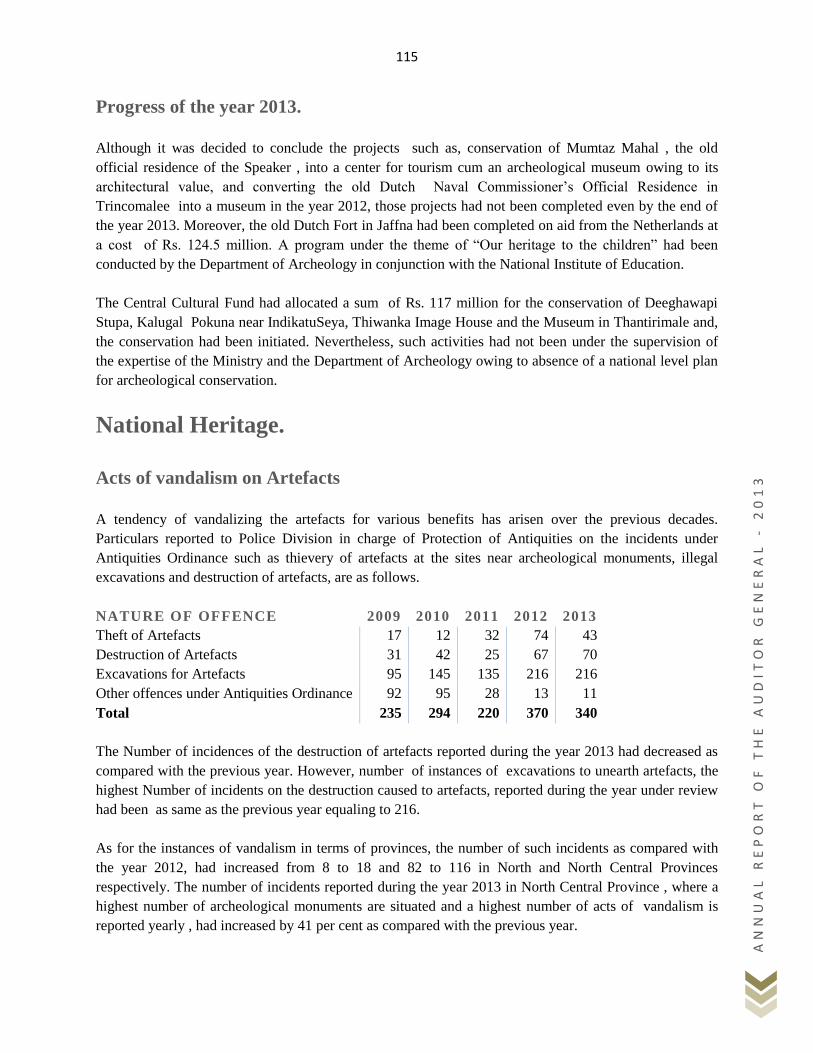
115
AN
NU
AL
RE
PO
RT
OF
TH
E A
UD
IT
OR
GE
NE
RA
L
- 2
01
3
Progress of the year 2013.
Although it was decided to conclude the projects such as, conservation of Mumtaz Mahal , the old
official residence of the Speaker , into a center for tourism cum an archeological museum owing to its
architectural value, and converting the old Dutch Naval Commissioner‟s Official Residence in
Trincomalee into a museum in the year 2012, those projects had not been completed even by the end of
the year 2013. Moreover, the old Dutch Fort in Jaffna had been completed on aid from the Netherlands at
a cost of Rs. 124.5 million. A program under the theme of “Our heritage to the children” had been
conducted by the Department of Archeology in conjunction with the National Institute of Education.
The Central Cultural Fund had allocated a sum of Rs. 117 million for the conservation of Deeghawapi
Stupa, Kalugal Pokuna near IndikatuSeya, Thiwanka Image House and the Museum in Thantirimale and,
the conservation had been initiated. Nevertheless, such activities had not been under the supervision of
the expertise of the Ministry and the Department of Archeology owing to absence of a national level plan
for archeological conservation.
National Heritage.
Acts of vandalism on Artefacts
A tendency of vandalizing the artefacts for various benefits has arisen over the previous decades.
Particulars reported to Police Division in charge of Protection of Antiquities on the incidents under
Antiquities Ordinance such as thievery of artefacts at the sites near archeological monuments, illegal
excavations and destruction of artefacts, are as follows.
NATURE OF OFFENCE 2009 2010 2011 2012 2013
Theft of Artefacts 17 12 32 74 43
Destruction of Artefacts 31 42 25 67 70
Excavations for Artefacts 95 145 135 216 216
Other offences under Antiquities Ordinance 92 95 28 13 11
Total 235 294 220 370 340
The Number of incidences of the destruction of artefacts reported during the year 2013 had decreased as
compared with the previous year. However, number of instances of excavations to unearth artefacts, the
highest Number of incidents on the destruction caused to artefacts, reported during the year under review
had been as same as the previous year equaling to 216.
As for the instances of vandalism in terms of provinces, the number of such incidents as compared with
the year 2012, had increased from 8 to 18 and 82 to 116 in North and North Central Provinces
respectively. The number of incidents reported during the year 2013 in North Central Province , where a
highest number of archeological monuments are situated and a highest number of acts of vandalism is
reported yearly , had increased by 41 per cent as compared with the previous year.
116
AN
NU
AL
RE
PO
RT
OF
TH
E A
UD
IT
OR
GE
NE
RA
L
- 2
01
3
Out of 1,459 incidents of damage reported from 2010 to 2013, investigations had been concluded for
1,060 incidents whereas, 399 cases were underway.
Non-encouragement of those who contribute to avert vandalism on artefacts.
Antiquities Reward Fund had been established under Antiquities Act (Amendment) No 24 of 1998 with
several objectives including rewarding the officers of the Department of Archeology, informants, and the
Police Officers who help protect artefacts. The balance of the fund being contributed by the fines sent to
the Director General of Archeology imposed by courts on the cases involving vandalism of artefacts,
amounted to Rs. 44,619,540 at the end of 2013 but ,nonetheless, the cash had not been spent on the
objectives of establishing the fund.
Damage caused to the Artefacts by Metal Quarries.
A sharp increase in issuing licenses for quarrying to obtain granite stone used in rapid development
process in the country had taken place. However, due to reasons such as, weaknesses in issuing licenses
and follow-up actions, failure to examine the archeological importance of those places and non-
coordination with the Department of Archeology prior to issuing licenses, the quarrymen had destroyed
the archeological monuments, as reported during the year 2013.
Archeological traces including 8 monuments dating back to 12th century that pertained to the Paludeniya
Monument in Siripura, Polonnaruwa and remnants of a foundation of a Stupa at the archeological
monument in Seenukgala, Hambanthota, had been destroyed.
Religious Affairs
Events related to Buddha Sasana and other religions are coordinated by the Ministry of Buddha Sasana
and Religious Affairs.
In becoming the pioneering facilitator to foster a society respecting moral values by centering around
places of religious worship under a long-drawn-out vision based on all religious doctrines including
Buddhism, the Ministry of Buddha Sasana and Religious Affairs functions under the mission of nurturing
a society that encourages ethics enabling a virtuous life style by compiling and implementing policies and
programs with the involvement of all stakeholders.
In order to achieve those objectives effectively, Departments representing all religions such as, Buddhist
Affairs, Muslim Religious and Cultural Affairs, Christian Religious Affairs, and Hindu Religious and
Cultural Affairs had been established under the purview of the Ministry. Additionally, the Public Trustees
Department also functions hereunder.
117
AN
NU
AL
RE
PO
RT
OF
TH
E A
UD
IT
OR
GE
NE
RA
L
- 2
01
3
Performance
In order to achieve the objectives by coordinating the Departments under its purview, the Ministry of
Buddha Sasana and Religious Affairs had implemented 13 programs in the year 2013 inclusive of, 5
programs on physical development, 5 programs on spiritual development , 2 clergy oriented programs,
and a program for sacred areas development at a cost of Rs. 344 million. However, the Ministry had
failed in achieving the progress of those programs as expected.
Even though it was necessary for the Ministry of Buddha Sasana and Religious Affairs to conduct certain
activities in proper coordination with Ministry of National Heritage and other institutions thereunder, such
a coordination had been unheeded.
Ministry of Buddha Sasana and Religious Affairs
Even though Rs. 451 million equivalent to 93 per cent of the provision for the year 2013 had been spent
on the development of places of religious worship attention had not been drawn to the inspection of
physical performance.
Plans had been made to conduct the program for promoting other languages with a view to encouraging
the unity among other ethnicities and disseminating Buddhist Philosophy locally and globally by
improving the knowledge of Buddhist monks on other languages. Despite the allocation of provisions
amounting to Rs. 5 million during the year under review, the program had not been implemented.
Furthermore, provisions amounting to Rs. 7.9 million allocated during 3 previous years , had not been
utilized.
According to the Section 6 of the Act governing the Buddha Sasana Fund established under the Ministry
of Buddha Sasana and Religious Affairs, cash received from whatever source , be it local or international,
should be accepted and action should be taken to protect and foster the Buddha Sasana according to the
most suitable way the Board reckons. Nevertheless, the Fund had not taken action under a well-planned
program with proper awareness of its main function. For instance, despite the receipt of income exceeding
Rs. 664 million in the years 2012 and 2013, Rs. 6 million only had been spent for the achievement of the
objection for which its find had been established.
118
AN
NU
AL
RE
PO
RT
OF
TH
E A
UD
IT
OR
GE
NE
RA
L
- 2
01
3
_____________________________________________________________________________________________________________________________________________________________
Tourism Industry _____________________________________________________________________________________________________________________
The programmes for the year under review had been launched for the achievement of tourism income of
US$ 2.75 billion by the year 2016 by attracting 2.5 million tourist arrivals as the main target of the Tourism
Industry. The Government had established four institutions, namely the Sri Lanka Tourism Development
Authority, the Sri Lanka Tourism Promotion Bureau, the Sri Lankan Institute of Tourism and Hotel
Management and the Sri Lanka Convention Bureau and the Government had spent a sum of Rs.2,560
million in the year 2013 for the maintenance of the four institutions. Large scale tourism promotion
programme had been held for the promotion of tourism in the People‟s Republic of China, India and Russia
at a cost of Rs.814 million and several trade promotion programmes had also been held at a cost of Rs.92.4
million. In addition, the opening of 04 permanent airline services and 5 temporary airline services with Sri
Lanka as the destination in the year 2013 has been instrumental in boosting in tourism industry. The
improvement of the tourism industry had been maintained unceasingly with the increase of tourist arrivals
from 1,005,605 in the year 2012 to 1,274,593 or an improvement of 26.75 per cent in the year 2013.
Concurrently the earnings of the tourism industry had recorded a substantial improvement of 65.1 per cent
as compared with the year 2012 and that had been a major factor for the surplus in the Services Account of
National Income of Sri Lanka.
Western Europe still continues to maintain the foremost place in the region-wise tourist arrivals with 33 per
cent of the total arrivals in the year 2013. In addition the highest arrivals had been form South Asia, East
Asia, Eastern Europe, Middle East Countries, North America Australia and Africa in that order. The
arrivals in Sri Lanka in the year 2013 from the Latin American Countries and the Caribbean Islands not
included in the above regions had been 3,166. Nevertheless, that number as compared with the year 2012
recorded and improvement of 94 per cent.
Investments are being made for increasing the facilities commensurate with the number of tourists arrivals
and the Government is committed make massive investments in the Tourism Zones located at Bentota,
Pasikuda, Kuchchiweli, Kalpitiya, Dedduwa and Yala Palatupana .Thirteen hotels with 854 rooms had been
constructed and opened for business at Pasikuda in the year under review and the preceding year. The new
programme of Tourist Hospitality Houses introduced by the Sri Lanka Tourism Development Authority
had received an immense response from the foreign tourist and 151 Tourist Hospitality Houses had been
registered by the end of the year 2013. Nevertheless, out of the lands transferred by the Government to the
Sri Lanka Tourism Development Authority and its predecessor since the year 1968 to date, the institutions
had not been able to utilize about 2,000 acres for the benefit of the tourism industry.
Several important observations made in the audit of the Sri Lanka Tourism Development Authority are as
follows.
Even though an extent of 15 acres belonging to the Bentora National Holiday Resort had
been occupied by a private institution, the Authority had no taken action for the recovery
of the possession of the land.
119
AN
NU
AL
RE
PO
RT
OF
TH
E A
UD
IT
OR
GE
NE
RA
L
- 2
01
3
The loss caused to the Authority from the bogus bills submitted for the water supplied to
two hotels in the Bentota Tourist Zone amounted to Rs.9,212,657.
The erronem payment made to the contractor for the maintenance of the Bentota Sewerage
System amounted to Rs. 6,608,749.
Even though Rs.200 million had been given to 04 Provincial Councils, the progress of the
projects had not been followed-up.
Action had not been taken for the recovery of taxes amounting to Rs.8,802,999 recoverable
from 48 institutions in the Bentota Tourist Resort.
An overpayment of Rs.2,428,613 had been made to the contractor in connection with the
construction of the Kataragama Rest House.
Even though a sum of Rs.3,255,750 had been paid as hire charges on bulldozers and motor
vehicles obtained for the construction of the Mohottuwarama Jetty, there was no evidence
of the procurement of such services.
An overpayment of Rs.824,000 for metal and an erroneous payment of Rs.2,549,000 for
metal, ABC and gravel had been made in connection with the construction of the Kalpitiya
Thoraidiya Jetty and tarring the area near the lagoon.
A sum of Rs.16,379,700 had been deprived of due to allowing the fee use of floor space of
4,952 square feet of the Sri Lanka Institute of Tourism and Hotel Management to an
unidentified person and other institutions.
120
AN
NU
AL
RE
PO
RT
OF
TH
E A
UD
IT
OR
GE
NE
RA
L
- 2
01
3
_____________________________________________________________________________________________________________________________________________________________
Diplomatic Relations _____________________________________________________________________________________________________________________
The primary objective of the Ministry of External Affairs and the Mission Offices is the promotion and
safeguarding of the Sri Lanka National Ambitions in foreign countries by following a non-aligned, free
and progressive foreign policy. The Democratic Socialist Republic of Sri Lanka maintain a network of 65
Missions in 50 countries of the World to maintain its Diplomatic Relations.
The home-based staff approved for the maintenance of the Diplamatic Relations by mid 2013 had been
463 and the vacancies had been 32 while the number of local staff had been 494 and the vacancies had
been 82.
Income and Expenditure of the Mission
The Foreign Missions of Sri Lanka had earned revenue amounting to Rs,1,352 million in
the year 2013 in the issue of Passports, Police Clearances on behalf of the Government of
Sri Lanka and the highest revenue amounting to Rs.181 million had been earned by the
Sri Lanka Mission in Italy which the lowest revenue of Rs.0.05 million had been earned
by the Mission Ramalla. The revenue earned by the Mission in Paris and London
exceeded Rs.100 million each.
The estimated and the actual recurrent and capital expenditure of the Ministry for the year
under review are given below.
NET
ALLOCATION
2013
ACTUAL
EXPENDITURE
2013
Rs.Millions Rs.Millions
Recurrent 7,718 7,702
Capital 2,421 2,303
According to the expenditure structure of the Ministry, the highest expenditure, that is,
78.6 per cent had been incurred on the Missions Abroad. The highest expenditure of
Rs.1,014 million in the year 2013 had been incurred by the Mission in Washington and
the lowest expenditure, other than the recently opened Mission in Uganda, amounting to
Rs. 20 million had been incurred by the Mission in Ramalla.
Out of the total expenditure, the capital expenditure and the recurrent expenditure of the Mission
for the year 2013 amounted to Rs.1,149 million and Rs.6,716 million respectively. About 50 per
cent of the recurrent expenditure had been spent on the staff and other allowances.
121
AN
NU
AL
RE
PO
RT
OF
TH
E A
UD
IT
OR
GE
NE
RA
L
- 2
01
3
A sum of Rs.1,047 million or 15.6 per cent of the recurrent expenditure had been incurred on the
rent of buildings. The attention of the authorities concerned had not been paid for the formulation
and implementation of the long term programme for the construction or the purchase of buildings
suitable for this purpose which will be beneficial to the Government to overcome this situation. It
was observed that certain action taken in this connection in the past had not yielded the expected
result due to different reasons.
Unsettled Advances
The unsettled advances of the Mission as at 31 December 2013 amounted to Rs.333,055,195 and the
Ministry had not taken action up to date to settle the advances. The advance balances exceeding Rs. 15
million each of the following Missions had not been settled. Those unsettled advances represented 36.6
per cent of the total unsettled advances.
MISSION UNSETTLED
ADVANCE
Rs.Millions
Tokyo 15.60
New York 20.08
Washington 20.06
London 36.60
Toronto 29.80
Total 122.14
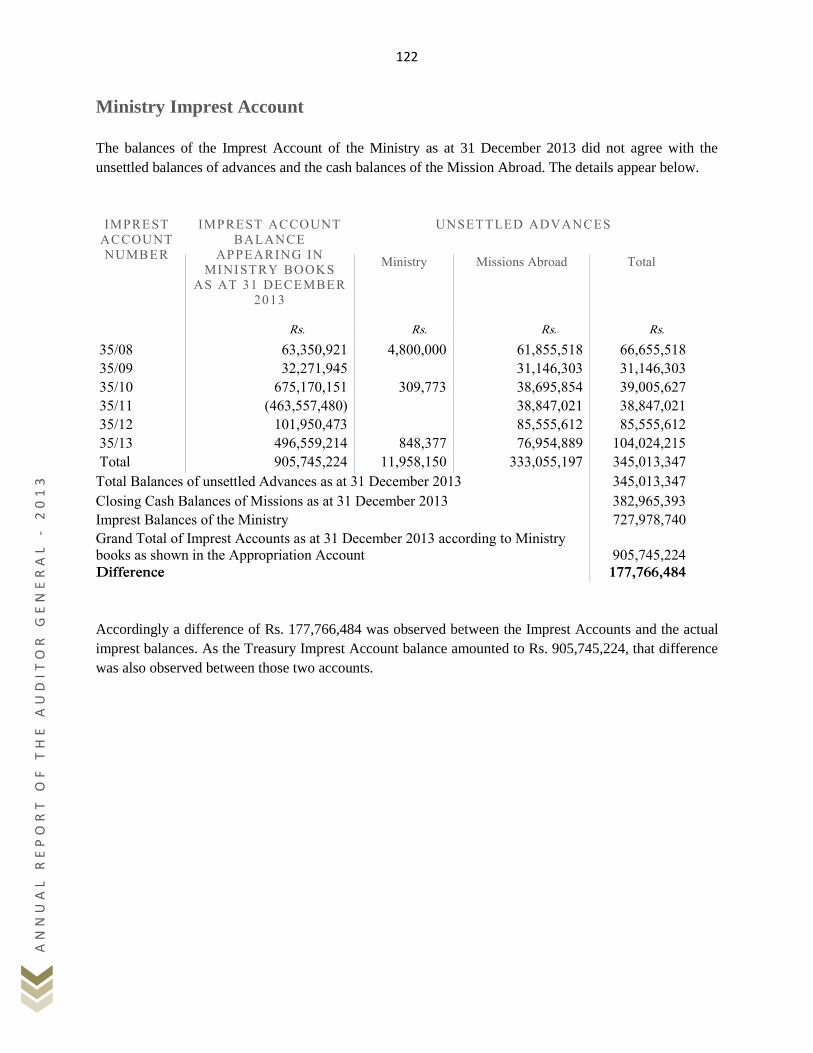
122
AN
NU
AL
RE
PO
RT
OF
TH
E A
UD
IT
OR
GE
NE
RA
L
- 2
01
3
Ministry Imprest Account
The balances of the Imprest Account of the Ministry as at 31 December 2013 did not agree with the
unsettled balances of advances and the cash balances of the Mission Abroad. The details appear below.
IMPREST ACCOUNT NUMBER
IMPREST ACCOUNT BALANCE
APPEARING IN MINISTRY BOOKS
AS AT 31 DECEMBER 2013
UNSETTLED ADVANCES
Ministry
Missions Abroad
Total
Rs. Rs. Rs. Rs.
35/08 63,350,921 4,800,000 61,855,518 66,655,518
35/09 32,271,945 31,146,303 31,146,303
35/10 675,170,151 309,773 38,695,854 39,005,627
35/11 (463,557,480) 38,847,021 38,847,021
35/12 101,950,473 85,555,612 85,555,612
35/13 496,559,214 848,377 76,954,889 104,024,215
Total 905,745,224 11,958,150 333,055,197 345,013,347
Total Balances of unsettled Advances as at 31 December 2013 345,013,347
Closing Cash Balances of Missions as at 31 December 2013 382,965,393
Imprest Balances of the Ministry 727,978,740
Grand Total of Imprest Accounts as at 31 December 2013 according to Ministry books as shown in the Appropriation Account
905,745,224
Difference 177,766,484
Accordingly a difference of Rs. 177,766,484 was observed between the Imprest Accounts and the actual
imprest balances. As the Treasury Imprest Account balance amounted to Rs. 905,745,224, that difference
was also observed between those two accounts.
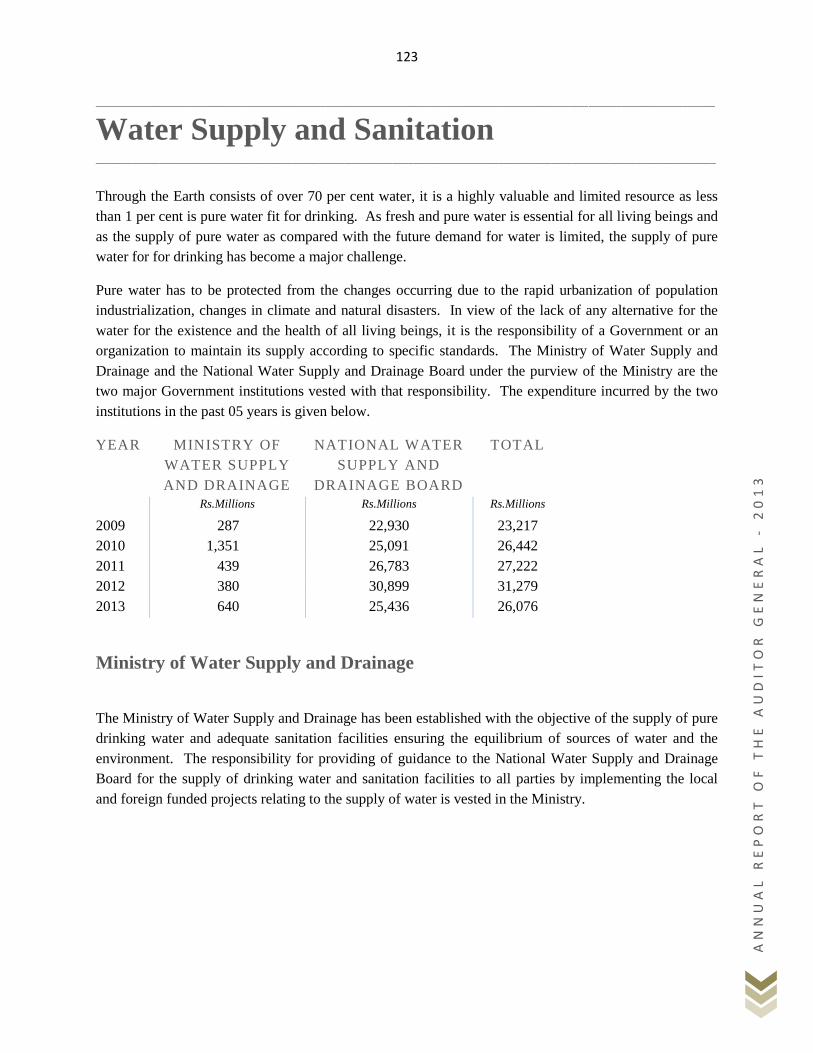
123
AN
NU
AL
RE
PO
RT
OF
TH
E A
UD
IT
OR
GE
NE
RA
L
- 2
01
3
_____________________________________________________________________________________________________________________________________________________________
Water Supply and Sanitation _____________________________________________________________________________________________________________________
Through the Earth consists of over 70 per cent water, it is a highly valuable and limited resource as less
than 1 per cent is pure water fit for drinking. As fresh and pure water is essential for all living beings and
as the supply of pure water as compared with the future demand for water is limited, the supply of pure
water for for drinking has become a major challenge.
Pure water has to be protected from the changes occurring due to the rapid urbanization of population
industrialization, changes in climate and natural disasters. In view of the lack of any alternative for the
water for the existence and the health of all living beings, it is the responsibility of a Government or an
organization to maintain its supply according to specific standards. The Ministry of Water Supply and
Drainage and the National Water Supply and Drainage Board under the purview of the Ministry are the
two major Government institutions vested with that responsibility. The expenditure incurred by the two
institutions in the past 05 years is given below.
YEAR MINISTRY OF
WATER SUPPLY
AND DRAINAGE
NATIONAL WATER
SUPPLY AND
DRAINAGE BOARD
TOTAL
Rs.Millions Rs.Millions Rs.Millions
2009 287 22,930 23,217
2010 1,351 25,091 26,442
2011 439 26,783 27,222
2012 380 30,899 31,279
2013 640 25,436 26,076
Ministry of Water Supply and Drainage
The Ministry of Water Supply and Drainage has been established with the objective of the supply of pure
drinking water and adequate sanitation facilities ensuring the equilibrium of sources of water and the
environment. The responsibility for providing of guidance to the National Water Supply and Drainage
Board for the supply of drinking water and sanitation facilities to all parties by implementing the local
and foreign funded projects relating to the supply of water is vested in the Ministry.
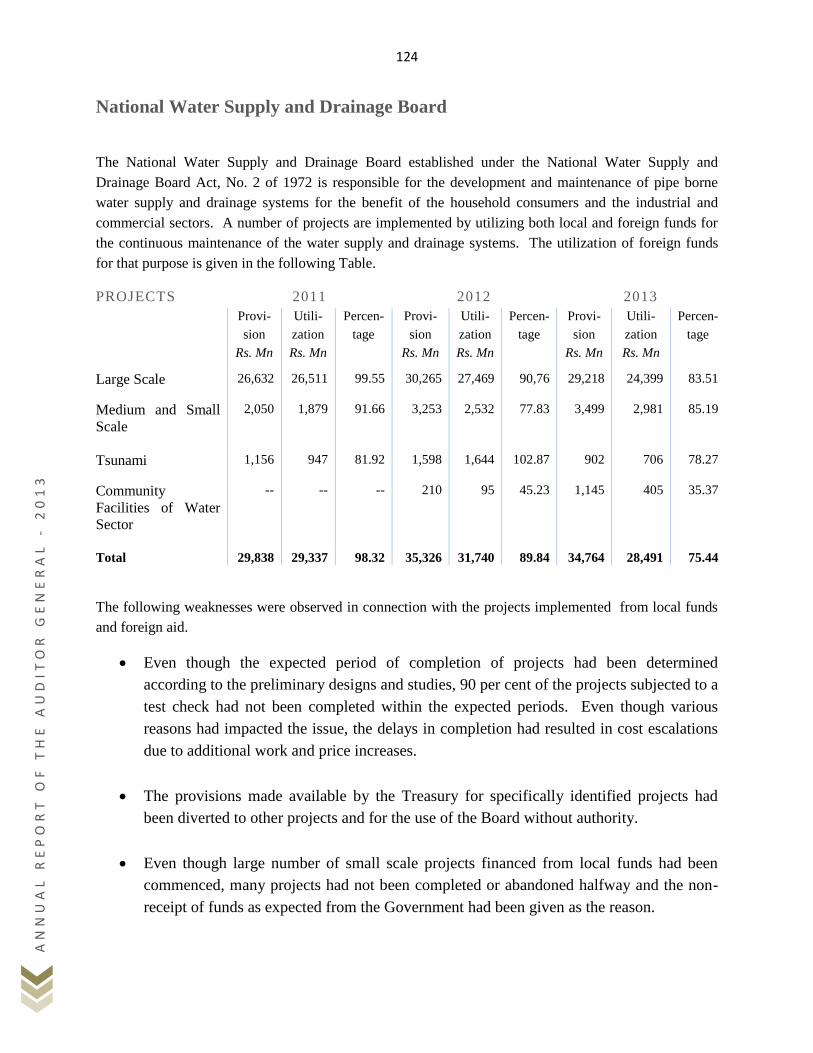
124
AN
NU
AL
RE
PO
RT
OF
TH
E A
UD
IT
OR
GE
NE
RA
L
- 2
01
3
National Water Supply and Drainage Board
The National Water Supply and Drainage Board established under the National Water Supply and
Drainage Board Act, No. 2 of 1972 is responsible for the development and maintenance of pipe borne
water supply and drainage systems for the benefit of the household consumers and the industrial and
commercial sectors. A number of projects are implemented by utilizing both local and foreign funds for
the continuous maintenance of the water supply and drainage systems. The utilization of foreign funds
for that purpose is given in the following Table.
PROJECTS 2011 2012 2013
Provi-
sion
Utili-
zation
Percen-
tage
Provi-
sion
Utili-
zation
Percen-
tage
Provi-
sion
Utili-
zation
Percen-
tage
Rs. Mn Rs. Mn Rs. Mn Rs. Mn Rs. Mn Rs. Mn
Large Scale 26,632 26,511 99.55 30,265 27,469 90,76 29,218 24,399 83.51
Medium and Small
Scale
2,050 1,879 91.66 3,253 2,532 77.83 3,499 2,981 85.19
Tsunami 1,156 947 81.92 1,598 1,644 102.87 902 706 78.27
Community
Facilities of Water
Sector
-- -- -- 210 95 45.23 1,145 405 35.37
Total 29,838 29,337 98.32 35,326 31,740 89.84 34,764 28,491 75.44
The following weaknesses were observed in connection with the projects implemented from local funds
and foreign aid.
Even though the expected period of completion of projects had been determined
according to the preliminary designs and studies, 90 per cent of the projects subjected to a
test check had not been completed within the expected periods. Even though various
reasons had impacted the issue, the delays in completion had resulted in cost escalations
due to additional work and price increases.
The provisions made available by the Treasury for specifically identified projects had
been diverted to other projects and for the use of the Board without authority.
Even though large number of small scale projects financed from local funds had been
commenced, many projects had not been completed or abandoned halfway and the non-
receipt of funds as expected from the Government had been given as the reason.
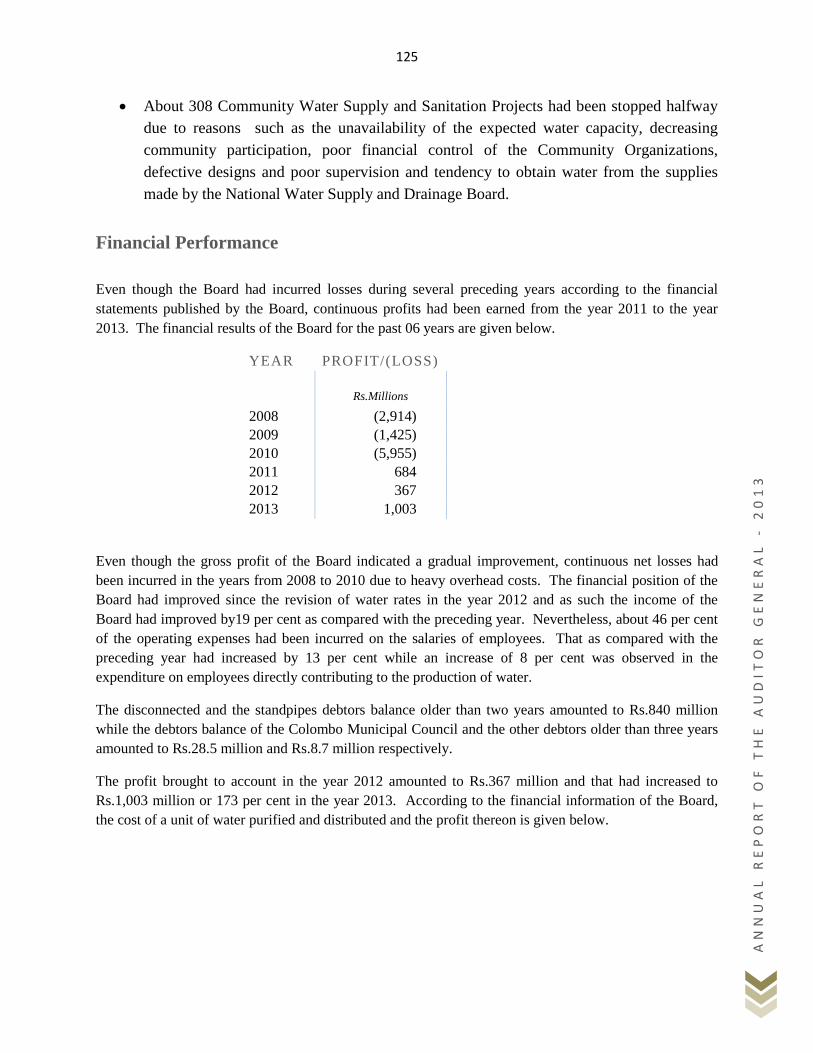
125
AN
NU
AL
RE
PO
RT
OF
TH
E A
UD
IT
OR
GE
NE
RA
L
- 2
01
3
About 308 Community Water Supply and Sanitation Projects had been stopped halfway
due to reasons such as the unavailability of the expected water capacity, decreasing
community participation, poor financial control of the Community Organizations,
defective designs and poor supervision and tendency to obtain water from the supplies
made by the National Water Supply and Drainage Board.
Financial Performance
Even though the Board had incurred losses during several preceding years according to the financial
statements published by the Board, continuous profits had been earned from the year 2011 to the year
2013. The financial results of the Board for the past 06 years are given below.
YEAR PROFIT/(LOSS)
Rs.Millions
2008 (2,914)
2009 (1,425)
2010 (5,955)
2011 684
2012 367
2013 1,003
Even though the gross profit of the Board indicated a gradual improvement, continuous net losses had
been incurred in the years from 2008 to 2010 due to heavy overhead costs. The financial position of the
Board had improved since the revision of water rates in the year 2012 and as such the income of the
Board had improved by19 per cent as compared with the preceding year. Nevertheless, about 46 per cent
of the operating expenses had been incurred on the salaries of employees. That as compared with the
preceding year had increased by 13 per cent while an increase of 8 per cent was observed in the
expenditure on employees directly contributing to the production of water.
The disconnected and the standpipes debtors balance older than two years amounted to Rs.840 million
while the debtors balance of the Colombo Municipal Council and the other debtors older than three years
amounted to Rs.28.5 million and Rs.8.7 million respectively.
The profit brought to account in the year 2012 amounted to Rs.367 million and that had increased to
Rs.1,003 million or 173 per cent in the year 2013. According to the financial information of the Board,
the cost of a unit of water purified and distributed and the profit thereon is given below.
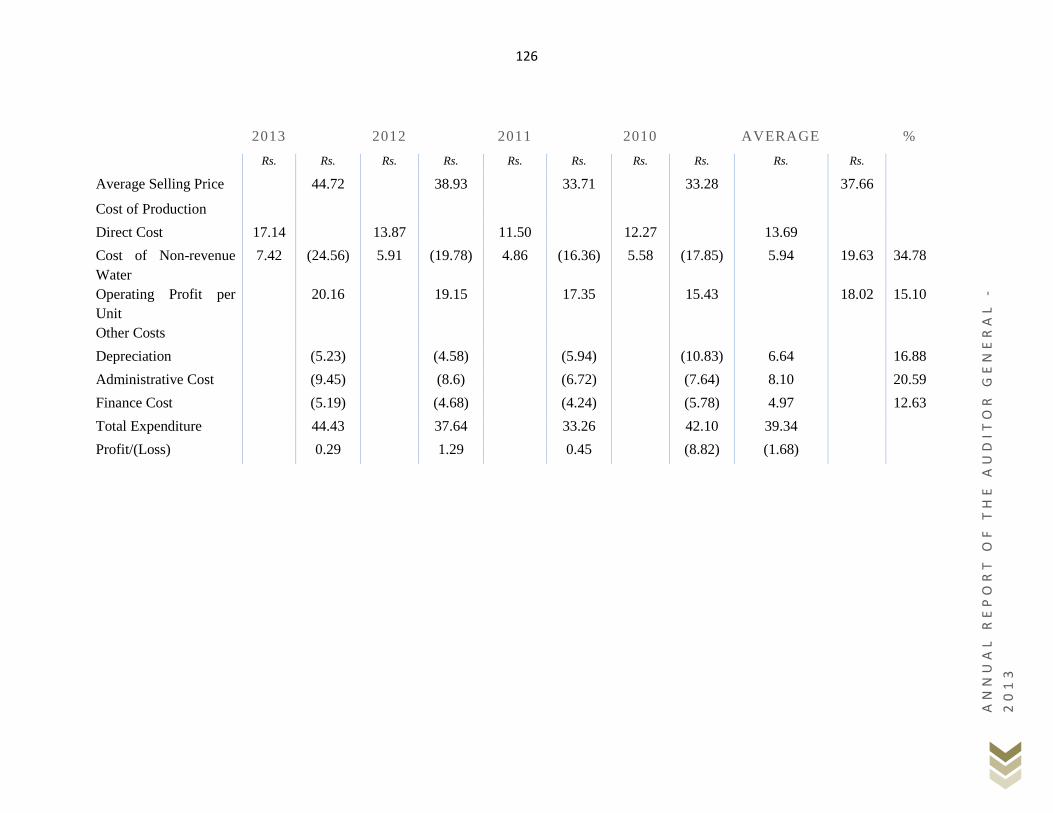
126
AN
NU
AL
RE
PO
RT
OF
TH
E A
UD
IT
OR
GE
NE
RA
L
-
20
13
2013 2012 2011 2010 AVERAGE %
Rs. Rs. Rs. Rs. Rs. Rs. Rs. Rs. Rs. Rs.
Average Selling Price 44.72 38.93 33.71 33.28 37.66
Cost of Production
Direct Cost 17.14 13.87 11.50 12.27 13.69
Cost of Non-revenue
Water
7.42 (24.56) 5.91 (19.78) 4.86 (16.36) 5.58 (17.85) 5.94 19.63 34.78
Operating Profit per
Unit
20.16 19.15 17.35 15.43 18.02 15.10
Other Costs
Depreciation (5.23) (4.58) (5.94) (10.83) 6.64 16.88
Administrative Cost (9.45) (8.6) (6.72) (7.64) 8.10 20.59
Finance Cost (5.19) (4.68) (4.24) (5.78) 4.97 12.63
Total Expenditure 44.43 37.64 33.26 42.10 39.34
Profit/(Loss) 0.29 1.29 0.45 (8.82) (1.68)
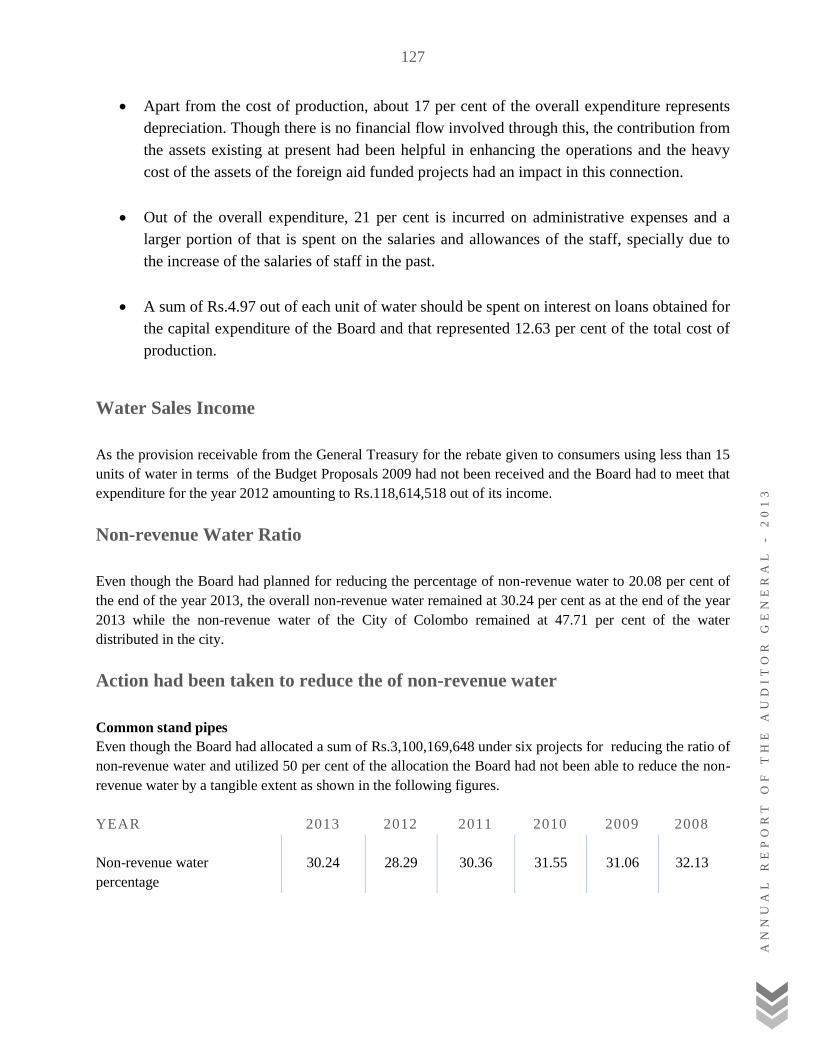
127
AN
NU
AL
R
EP
OR
T
OF
T
HE
A
UD
IT
OR
G
EN
ER
AL
-
2
01
3
Apart from the cost of production, about 17 per cent of the overall expenditure represents
depreciation. Though there is no financial flow involved through this, the contribution from
the assets existing at present had been helpful in enhancing the operations and the heavy
cost of the assets of the foreign aid funded projects had an impact in this connection.
Out of the overall expenditure, 21 per cent is incurred on administrative expenses and a
larger portion of that is spent on the salaries and allowances of the staff, specially due to
the increase of the salaries of staff in the past.
A sum of Rs.4.97 out of each unit of water should be spent on interest on loans obtained for
the capital expenditure of the Board and that represented 12.63 per cent of the total cost of
production.
Water Sales Income
As the provision receivable from the General Treasury for the rebate given to consumers using less than 15
units of water in terms of the Budget Proposals 2009 had not been received and the Board had to meet that
expenditure for the year 2012 amounting to Rs.118,614,518 out of its income.
Non-revenue Water Ratio
Even though the Board had planned for reducing the percentage of non-revenue water to 20.08 per cent of
the end of the year 2013, the overall non-revenue water remained at 30.24 per cent as at the end of the year
2013 while the non-revenue water of the City of Colombo remained at 47.71 per cent of the water
distributed in the city.
Action had been taken to reduce the of non-revenue water
Common stand pipes
Even though the Board had allocated a sum of Rs.3,100,169,648 under six projects for reducing the ratio of
non-revenue water and utilized 50 per cent of the allocation the Board had not been able to reduce the non-
revenue water by a tangible extent as shown in the following figures.
YEAR 2013 2012 2011 2010 2009 2008
Non-revenue water
percentage
30.24 28.29 30.36 31.55 31.06 32.13
128
AN
NU
AL
RE
PO
RT
OF
TH
E A
UD
IT
OR
GE
NE
RA
L
- 2
01
3
Community Water Supply and Sanitation
The Ministry and the National Water Supply and Drainage Board had commenced various projects for the
identification of the water and sanitation of the rural areas, and the implementation of Rural Water Supply
Schemes. Out of those projects, delays in the award of contracts for the projects relating to the Water for
Resettled Persons in the North and the East, the Pilot Project on Sanitation and Health, the Project for the
Improvement of Community Based Rural Water Supply and Sanitation in the Jaffna and Kilinochchi
Districts, the Project for the Development of Community Infrastructure Facilities in Batticaloa, Mannar and
Vavuniya and in Project for Improvement of Community Water Supply and Sanitation in Badulla and
Moneragala being implemented in the year 2013 had been delayed.
Quality of Water in the Dry Zone
Even though the irrigation reservoirs had been selected for obtaining drinking water in the Dry Zone of Sri
Lanka due to the scarcity of surface water sources throughout the year in those areas, contamination of the
water sources is a threat to the supply of safe drinking water. The chronic kidney disease in the North
Central Province of Sri Lanka has reached epidemic proportions and it has been found out that the disease
can be controlled by the supply of purified water through the pipe borne water schemes of the Board. In
view of the difficulties in the supply of pipe borne water to the Northern and the North Central Provinces
the Board had adopted short term courses of action such as the construction of rain water tanks, distribution
of pure drinking water by bowsers and the supply of water purification plants through community based
organizations to the villages.
Sewerage Systems
The Board had commenced the work on 07 sewerage systems receiving foreign aid by the year 2014. In
view of the delays in the award of contracts and carrying out the work, the foreign aid and grants received
for the Greater Colombo Waste Water Management Project the Moratuwa – Ratmalana – Ekala – Ja-Ela
Waste Water Disposal Project, the Kandy City Waste Water Disposal Project, and the Global Partnership on
Output Based Aid (GBOPA) Project for increasing the accessibility to the Sewerage Service for houses
with cost estimates amounting to Rs.36,018 million had been saved. The Board had not shown an adequate
progress in the supply of services through the sewerage systems. The work on the Moratuwa-Ratmalana-
Ekala – Ja-Ela Waste Water Disposal Project estimated at Rs.16,300 million had been delayed. As the
work had been stopped due to the bankruptcy of the contractor, the work had been further delayed.
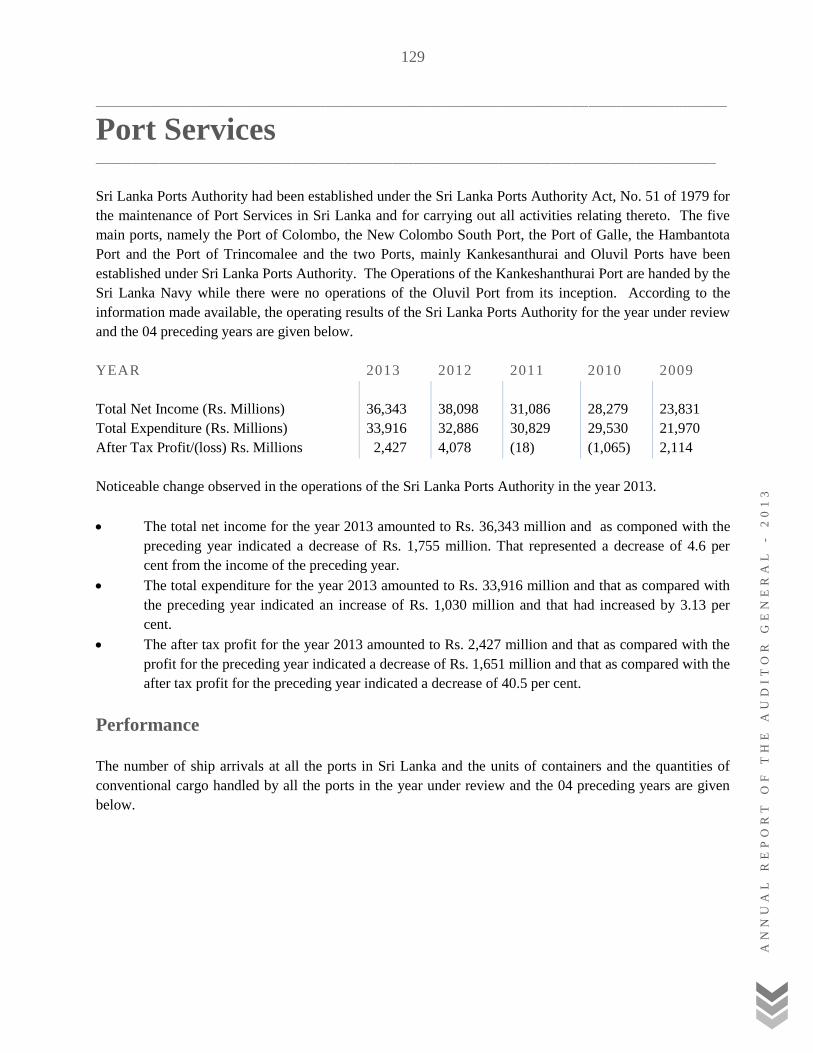
129
AN
NU
AL
R
EP
OR
T
OF
T
HE
A
UD
IT
OR
G
EN
ER
AL
-
2
01
3
________________________________________________________________________________________________________________________________________________________________
Port Services _____________________________________________________________________________________________________________________
Sri Lanka Ports Authority had been established under the Sri Lanka Ports Authority Act, No. 51 of 1979 for
the maintenance of Port Services in Sri Lanka and for carrying out all activities relating thereto. The five
main ports, namely the Port of Colombo, the New Colombo South Port, the Port of Galle, the Hambantota
Port and the Port of Trincomalee and the two Ports, mainly Kankesanthurai and Oluvil Ports have been
established under Sri Lanka Ports Authority. The Operations of the Kankeshanthurai Port are handed by the
Sri Lanka Navy while there were no operations of the Oluvil Port from its inception. According to the
information made available, the operating results of the Sri Lanka Ports Authority for the year under review
and the 04 preceding years are given below.
YEAR 2013 2012 2011 2010 2009
Total Net Income (Rs. Millions) 36,343 38,098 31,086 28,279 23,831
Total Expenditure (Rs. Millions) 33,916 32,886 30,829 29,530 21,970
After Tax Profit/(loss) Rs. Millions 2,427 4,078 (18) (1,065) 2,114
Noticeable change observed in the operations of the Sri Lanka Ports Authority in the year 2013.
The total net income for the year 2013 amounted to Rs. 36,343 million and as componed with the
preceding year indicated a decrease of Rs. 1,755 million. That represented a decrease of 4.6 per
cent from the income of the preceding year.
The total expenditure for the year 2013 amounted to Rs. 33,916 million and that as compared with
the preceding year indicated an increase of Rs. 1,030 million and that had increased by 3.13 per
cent.
The after tax profit for the year 2013 amounted to Rs. 2,427 million and that as compared with the
profit for the preceding year indicated a decrease of Rs. 1,651 million and that as compared with the
after tax profit for the preceding year indicated a decrease of 40.5 per cent.
Performance
The number of ship arrivals at all the ports in Sri Lanka and the units of containers and the quantities of
conventional cargo handled by all the ports in the year under review and the 04 preceding years are given
below.
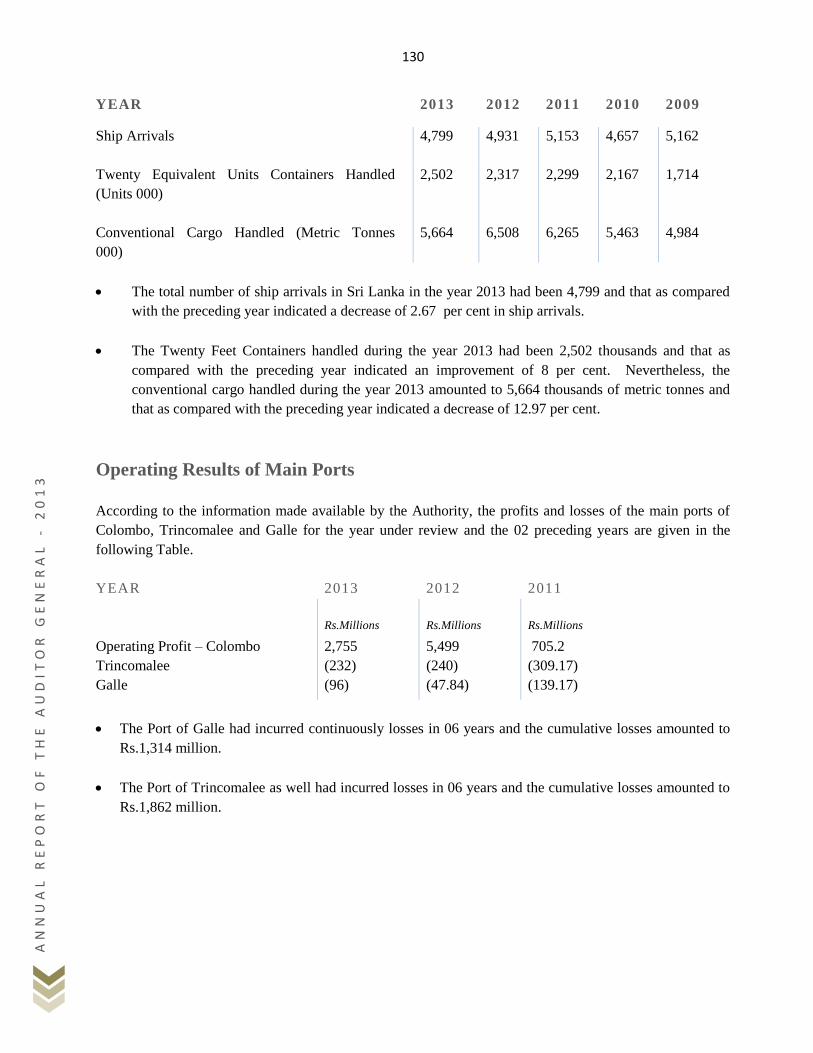
130
AN
NU
AL
RE
PO
RT
OF
TH
E A
UD
IT
OR
GE
NE
RA
L
- 2
01
3
YEAR 2013 2012 2011 2010 2009
Ship Arrivals 4,799 4,931 5,153 4,657 5,162
Twenty Equivalent Units Containers Handled
(Units 000)
2,502 2,317 2,299 2,167 1,714
Conventional Cargo Handled (Metric Tonnes
000)
5,664 6,508 6,265 5,463 4,984
The total number of ship arrivals in Sri Lanka in the year 2013 had been 4,799 and that as compared
with the preceding year indicated a decrease of 2.67 per cent in ship arrivals.
The Twenty Feet Containers handled during the year 2013 had been 2,502 thousands and that as
compared with the preceding year indicated an improvement of 8 per cent. Nevertheless, the
conventional cargo handled during the year 2013 amounted to 5,664 thousands of metric tonnes and
that as compared with the preceding year indicated a decrease of 12.97 per cent.
Operating Results of Main Ports
According to the information made available by the Authority, the profits and losses of the main ports of
Colombo, Trincomalee and Galle for the year under review and the 02 preceding years are given in the
following Table.
YEAR 2013 2012 2011
Rs.Millions Rs.Millions Rs.Millions
Operating Profit – Colombo 2,755 5,499 705.2
Trincomalee (232) (240) (309.17)
Galle (96) (47.84) (139.17)
The Port of Galle had incurred continuously losses in 06 years and the cumulative losses amounted to
Rs.1,314 million.
The Port of Trincomalee as well had incurred losses in 06 years and the cumulative losses amounted to
Rs.1,862 million.
131
AN
NU
AL
R
EP
OR
T
OF
T
HE
A
UD
IT
OR
G
EN
ER
AL
-
2
01
3
Important Audit Observations
Colombo South Port
The construction of the breakwater, the nautical approach channel and dredging of the Colombo South Port
had been done as a Port of Colombo Expansion Project under a loan from the Asian Development Bank and
the cost incurred amounted to Rs.42,055 million (Local Funds Rs.9,876 million and foreign funds
Rs.32,179 million). Nevertheless, the operations of the port constructions at a cost of Rs.42,055 million had
been given on the Build Operate and Transfer basis to a Company called Colombo International Container
Terminal Company for a period of 35 years.
According to the agreement entered into between the Sri Lanka Ports Authority and the Colombo
International Container Terminal Company, the Sri Lanka Ports Authority receives royalty of US$ 3.9 per
container during the initial 05 years. It is observed that even the minimum return for the expenditure
incurred on the Colombo Port Expansion Project is not received from the totally so received.
Port of Hambantota
The construction work of the first stage of the Port of Hambantota commenced on 15 February 2008 and the
total expenditure on the construction of the port up to the end of the year 2013 amounted to Rs.105,109
million. Even though the construction of the first stage of the Port of Hambantota had been completed by
31 December 2011, the arrival of ships in the port had been limited to the ships transporting motor vehicles
only due to the inability to handle containers as the gantry cranes had not been installed. Nevertheless, the
installation of the nautical operating equipment and the construction of the operating terminal of the Second
Stage of the Port of Hambantota Development Project had been commenced by utilizing a foreign loan of
US$ 808 million.
The project is expected for completion by 14 April 2015 and the funds for the Project had been obtained
from Exim Bank of China. The interest and loan installments payable on the loan obtained for this purpose
up to the year 2016 are as follows.
Year Interest Loan Installment
Rs. million Rs. million
2012 2,208 -
2013 2,479 -
2014 2,233 1,826
2015 1,987 1,827
2016 1,742 1,827
Accordingly, an income adequate for the payment of interest and installments on the loans obtained for the
construction of the port had not been earned. The losses incurred by the Port of Hambantota in the years
2011 and 2012 amounted to Rs.11.9 million and Rs.25.5 million respectively.
132
AN
NU
AL
RE
PO
RT
OF
TH
E A
UD
IT
OR
GE
NE
RA
L
- 2
01
3
Oluvil Port Construction Project
The construction of the Oluvil Port with a loan obtained from DANIDA Agency of the Government of
Denmark had been completed on 01 September 2013 and a sum of EURO 38.96 million (Rs.6,780 million
in Sri Lankan currency) had been spent in that connection. In addition, the Sri Lanka Ports Authority had
spent a sum of Rs.444 million. Even though the nautical port and the fisheries harbor had been separately
constructed, the operations of the port on the arrival of ships at the port had not materialized even up to the
end of the year 2013. The Oluvil Port is a very shallow port of a depth of 8 metres, only very small ships
can call at the port. Nevertheless, the foreign loan obtained for the construction of the Oluvil Port in the
ensuing 10 years. In view of the small income that could be earned by the port and the heavy expenditure
needed for the maintenance of the operations of the port, the possibility of the Ports Authority facing a
financial crisis cannot be ruled out.
133
AN
NU
AL
R
EP
OR
T
OF
T
HE
A
UD
IT
OR
G
EN
ER
AL
-
2
01
3
PART VI
AUDITOR GENERAL’S
COMMENTS ON SELECTED
AREAS
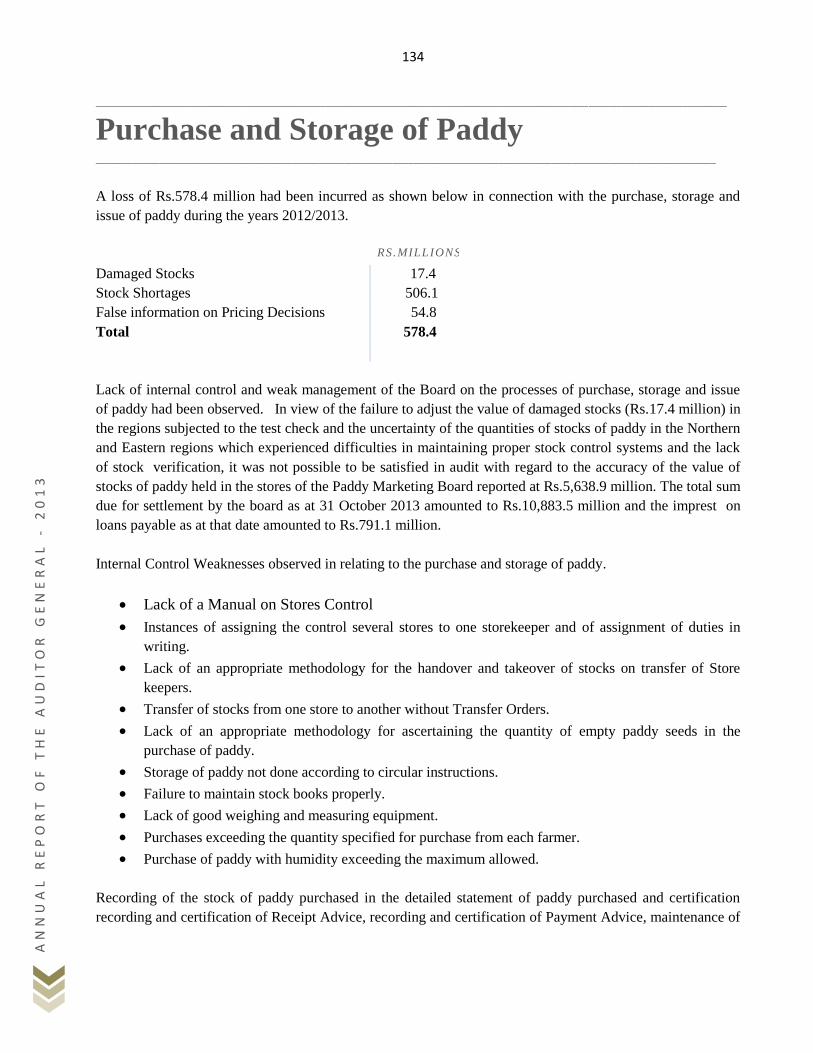
134
AN
NU
AL
RE
PO
RT
OF
TH
E A
UD
IT
OR
GE
NE
RA
L
- 2
01
3
________________________________________________________________________________________________________________________________________________________________
Purchase and Storage of Paddy _____________________________________________________________________________________________________________________
A loss of Rs.578.4 million had been incurred as shown below in connection with the purchase, storage and
issue of paddy during the years 2012/2013.
RS.MILLIONS
Damaged Stocks 17.4
Stock Shortages 506.1
False information on Pricing Decisions 54.8
Total 578.4
Lack of internal control and weak management of the Board on the processes of purchase, storage and issue
of paddy had been observed. In view of the failure to adjust the value of damaged stocks (Rs.17.4 million) in
the regions subjected to the test check and the uncertainty of the quantities of stocks of paddy in the Northern
and Eastern regions which experienced difficulties in maintaining proper stock control systems and the lack
of stock verification, it was not possible to be satisfied in audit with regard to the accuracy of the value of
stocks of paddy held in the stores of the Paddy Marketing Board reported at Rs.5,638.9 million. The total sum
due for settlement by the board as at 31 October 2013 amounted to Rs.10,883.5 million and the imprest on
loans payable as at that date amounted to Rs.791.1 million.
Internal Control Weaknesses observed in relating to the purchase and storage of paddy.
Lack of a Manual on Stores Control
Instances of assigning the control several stores to one storekeeper and of assignment of duties in
writing.
Lack of an appropriate methodology for the handover and takeover of stocks on transfer of Store
keepers.
Transfer of stocks from one store to another without Transfer Orders.
Lack of an appropriate methodology for ascertaining the quantity of empty paddy seeds in the
purchase of paddy.
Storage of paddy not done according to circular instructions.
Failure to maintain stock books properly.
Lack of good weighing and measuring equipment.
Purchases exceeding the quantity specified for purchase from each farmer.
Purchase of paddy with humidity exceeding the maximum allowed.
Recording of the stock of paddy purchased in the detailed statement of paddy purchased and certification
recording and certification of Receipt Advice, recording and certification of Payment Advice, maintenance of
135
AN
NU
AL
R
EP
OR
T
OF
T
HE
A
UD
IT
OR
G
EN
ER
AL
-
2
01
3
the Stock Book, checking of standards and weighing of paddy are being by the storekeeper himself without
any internal control had provided opportunities to commit malpractices.
Internal Control Weaknesses in the Issue of Stocks of Paddy and Marketing.
Issue of stocks of paddy without Issue Orders from the Head Office.
Stores other than those authorized by the Head Office to issue paddy had been issuing stocks of
paddy without informing the Head Office.
Weaknesses in Pricing of Paddy
In terms of Section 4(1) of the Paddy Marketing Board Act, No. 14 of 1971 all powers
relating to the purchase, sale, supply and distribution of paddy and rice are vested in the
Board of Directors. The Minister should, after being advised by the Board of Directors,
publish in the Gazette all provisions relating to his matter together with the effective dates.
Nevertheless, the provisions relating to this process had not been published in the Gazette by
the Paddy Marketing board since its revival in the year 2008.
Instead of publishing the Gazette Notification action had been taken to determine the prices
by a Pricing Committee. But the Committee had determined without considering the matters
relevant to pricing and without obtaining the information required for the purpose. The loss
caused by this practice amounted to Rs.54.86 million approximately.
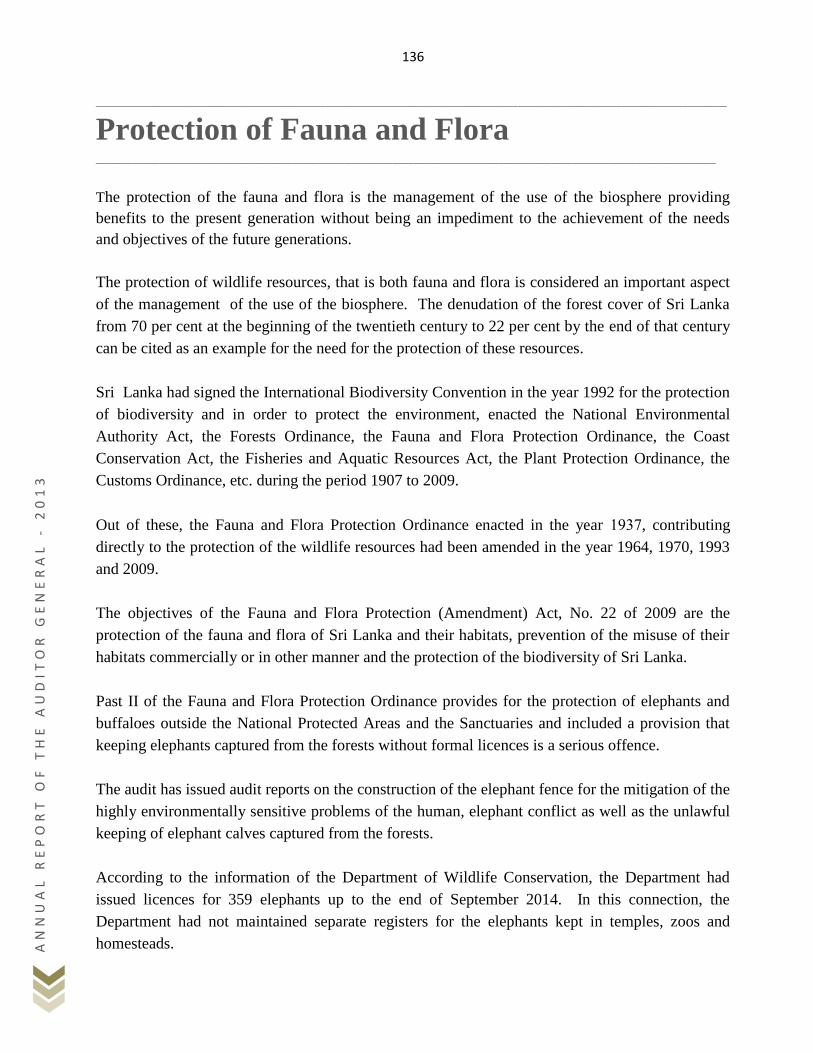
136
AN
NU
AL
RE
PO
RT
OF
TH
E A
UD
IT
OR
GE
NE
RA
L
- 2
01
3
________________________________________________________________________________________________________________________________________________________________
Protection of Fauna and Flora _____________________________________________________________________________________________________________________
The protection of the fauna and flora is the management of the use of the biosphere providing
benefits to the present generation without being an impediment to the achievement of the needs
and objectives of the future generations.
The protection of wildlife resources, that is both fauna and flora is considered an important aspect
of the management of the use of the biosphere. The denudation of the forest cover of Sri Lanka
from 70 per cent at the beginning of the twentieth century to 22 per cent by the end of that century
can be cited as an example for the need for the protection of these resources.
Sri Lanka had signed the International Biodiversity Convention in the year 1992 for the protection
of biodiversity and in order to protect the environment, enacted the National Environmental
Authority Act, the Forests Ordinance, the Fauna and Flora Protection Ordinance, the Coast
Conservation Act, the Fisheries and Aquatic Resources Act, the Plant Protection Ordinance, the
Customs Ordinance, etc. during the period 1907 to 2009.
Out of these, the Fauna and Flora Protection Ordinance enacted in the year 1937, contributing
directly to the protection of the wildlife resources had been amended in the year 1964, 1970, 1993
and 2009.
The objectives of the Fauna and Flora Protection (Amendment) Act, No. 22 of 2009 are the
protection of the fauna and flora of Sri Lanka and their habitats, prevention of the misuse of their
habitats commercially or in other manner and the protection of the biodiversity of Sri Lanka.
Past II of the Fauna and Flora Protection Ordinance provides for the protection of elephants and
buffaloes outside the National Protected Areas and the Sanctuaries and included a provision that
keeping elephants captured from the forests without formal licences is a serious offence.
The audit has issued audit reports on the construction of the elephant fence for the mitigation of the
highly environmentally sensitive problems of the human, elephant conflict as well as the unlawful
keeping of elephant calves captured from the forests.
According to the information of the Department of Wildlife Conservation, the Department had
issued licences for 359 elephants up to the end of September 2014. In this connection, the
Department had not maintained separate registers for the elephants kept in temples, zoos and
homesteads.
137
AN
NU
AL
R
EP
OR
T
OF
T
HE
A
UD
IT
OR
G
EN
ER
AL
-
2
01
3
Files relating to the registration of 14 elephants said to be kept in homesteads, maintained for the
purpose of the issue of licence were examined in audit and the major irregularities detected are as
follows.
The gestation of a she-elephant kept in a homestead had not been reported to the Director
General of Wildlife Conservation in terms of Section 10 and 22(9) of the Fauna and Flora
Protection (Amendment) Act, No. 22 of 2009.
The births of elephant calves had not been registered and the deaths of elephants had not
been reported to the Director General as specified in the Act.
The Certificates of Grama Niladharis confirming the birth of elephant calves had been
forged.
Forged affidavits and documents in support of ownership had been produced.
The Departmental Officers had not submitted reports by carrying out field inspections
while certain fraudulent reports had been submitted.
Formal and acceptable DNA Reports had not been produced.
Files relating previous registrations of elephants had been fraudulently altered for the
registration of elephant calves.
The particulars and the medical reports of the Veterinary Surgeon who attended to the birth
of elephant calves had not been produced.
According to the above matters, it was observed that the elephants relating to all the files had been
illegally captured from the forests and licences had been obtained by registering subsequently.
According to the advice of the Department of Attorney General (Writ 625/09) case and in
accordance with the provisions in the Ordinance, legal action should be taken against the persons
who keep elephants without being registered while guidelines should be formulated for keeping
domesticated elephants. Nevertheless, the internal control procedure implemented by the
Department for the registration of elephants, specifically the arrangements made for the
safekeeping of the registers and documents had been at a very weak level. In view of this
138
AN
NU
AL
RE
PO
RT
OF
TH
E A
UD
IT
OR
GE
NE
RA
L
- 2
01
3
situation, one of the 06 registers maintained for recording the registration of elephants had been
misplaced.
The weaknesses in the methodology for the registration of elephants are as follows.
A methodology for the issue of application forms for registration only after the payment of
fees had not been introduced.
The features required to be included in the photograph that should be produced, for the
identification of the elephant had not been specifically stated (Examples clear Identification
of the ears, tail and the trunks of the elephants)
Stamping or other safety measure on the photograph pasted on registration certificate and
the annual licence had not been followed to prevent the removal and substitution of another
photograph.
As a considerable time is taken for the issue of licences for the application submitted for
registration or the annual licence, the information on the application is included instead of
including the actual age, height and the girth of the front leg at the time of registration.
The names used for the elephants are not included in the registration certificate and the
annual licence.
The annual licence should be renewed annually on the payment of the licence fee. The
following weaknesses were observed in this connection.
- Action had not been taken to obtain an application form along with the information
on the height, age, the girth of the front leg and other noticeable features for the
annual renewal of licences. An application form for this purpose had not been
introduced.
- The receipt issued for the money collected for the renewal of annual licences or the
paying-in-voucher did not indicate the registration number of the particular elephant
for which payment is made for identification purposes.
- The documents that should be produced for the renewal of the licences had not been
specifically stated.
139
AN
NU
AL
R
EP
OR
T
OF
T
HE
A
UD
IT
OR
G
EN
ER
AL
-
2
01
3
Obtaining DNA Reports.
An appropriate methodology for obtaining the DNA Reports in the registration of elephants
on the renewal of licences had neither been introduced nor followed.
- Method of obtaining blood samples for DNA tests.
- Matters that should be included in the reports.
- Photograph of the elephant to be included in the report and the features of the
photograph.
- Information on the elephant to be included in the report (Height, Age, the girth of
the front leg, etc.)
A methodology as to whether a document or a certificate is issued for the renewal of
registration, whether it is noted in the annual licence itself, and the place of renewal had not
been introduced.