Embed Size (px)
Citation preview

Manitoba Hydro
2012/14 General Rate Application
PUB/MIPUG-I-1
November 30, 2012 Page 1 of 1
REFERENCE: Section 2.1 Pg. 2-1 1
MIPUG Membership 2
3
QUESTION: 4
5
a) Please provide the 2012 MIPUG Economic Impact Study. 6
7
b) Please identify the membership changes in MIPUG since the 2008 update. 8
9
ANSWER: 10
11
(a) 12
13
Please see PUB/MIPUG I-1(a) Attachment 1 for the 2012 MIPUG Economic Impact 14
Study. 15
16
For reference, MIPUG’s first economic impact assessment report was prepared in 2005, 17
and the first update was completed in 2008. The MIPUG members commissioned a 18
second update in 2012. The report is a MIPUG document. 19
20
(b) 21
22
At the time the 2008 MIPUG economic update report was completed, there were eleven 23
MIPUG members. Since 2008, Tembec Inc. has left MIPUG. The Tembec Pine Falls 24
facility ceased production in September 2009 and permanent closure of the mill was 25
announced in 2010. All ten of the current MIPUG members were members of the group 26
in 2008. 27


MANITOBA INDUSTRIAL POWER USERS GROUP
The Manitoba Industrial Power Users Group (MIPUG) is an association of major industrial companies operating in Manitoba. The members are: Vale Tolko Industries Ltd. HudBay Minerals Inc. Canexus Chemicals Koch Fertilizer Canada ULC Gerdau Long Steel North AmericaERCO Worldwide Amsted Rail - Griffin Wheel CompanyEnbridge Pipelines Inc. TransCanada Keystone Pipeline
THE ECONOMIC IMPACT OF THE
MANITOBA INDUSTRIAL POWER USERS GROUP
Spring 2012
The Manitoba Industrial Power Users Group (MIPUG) is ssociation of major industrial companies operating
North America - Manitoba Mill
Griffin Wheel Company
Manitoba Hydro 2012/14 General Rate Application PUB/MIPUG I-1(a) Attachment 1
November 30, 2012 Page 1 of 24

The Economic Impact of MIPUG, Spring 2012
EXECUTIVE SUMMARY
The Manitoba Industrial Power Users Group (MIPUG) is an association of major industrial companies operating in Manitoba. MIPUG’s key concerns related to electricity costs are: ensuring rates reflect the cost to provide electricity, stability and predictability.
MIPUG has participated as an intervener in each of the Public Utilities Board's reviews of electricity rates since December 1988 when the Board was first given the jurisdiction to approve electricity rates. MIPUG played a role in the Board’s review of Hydro’s Major Capital Projects in 1990 and the Centra Gas acquisition in 1999. MIPUG also made a presentation at the Clean Environment Commission Wuskwatim hearing. MIPUG was supportive of the Centra Gas acquisition and has been supportive of new capital projects that provide a long-term benefit to Manitoba ratepayers.
The MIPUG members are: Vale, Tolko Industries Ltd., HudBay Minerals Inc., Canexus Chemicals, Koch Fertilizer Canada ULC, Gerdau Long Steel North America – Manitoba Mill, ERCO Worldwide, Amsted Rail - Griffin Wheel Company, Enbridge Pipelines Inc. and TransCanada Keystone Pipeline.
MIPUG primarily represents members in the General Service Large >100 kV rate class. This customer class purchases in excess of five thousand gigawatt hours of electricity at an annual cost of over $200 million per year. This class of electricity users represent nearly a quarter of all the energy sold to Manitoba Hydro’s domestic customers.
MIPUG companies are significant contributors to Manitoba’s economy and to the communities where they are located, several of which are among the largest in the province after Winnipeg. This report examines the economic impact of MIPUG members on the Province of Manitoba.
MIPUG companies:
• Employ 4,306 people directly, and 1,274 contract workers;
• Have average employee salaries more than twice the Manitoba average;
• Have made capital investments in Manitoba in excess of $6.5 billion;
• Spend more than $260 million on goods and services in Manitoba each year, above and beyond the $200 million paid by industrial customers for electricity;
• Contribute almost $260 million to their respective municipal governments, and to the governments of Manitoba and Canada each year in taxes, fees and other revenue;
• In 2011, spent almost $700,000 on donations and community support;
• Contribute almost $2.3 billion to provincial GDP; and
• Have a GDP impact 5.4 times greater than Manitoba Hydro’s exports.
Manitoba Hydro 2012/14 General Rate Application PUB/MIPUG I-1(a) Attachment 1
November 30, 2012 Page 2 of 24

The Economic Impact of MIPUG, Spring 2012
Page i
TABLE OF CONTENTS
1.0 INTRODUCTION ...................................................................................... 1
1.1 Overview of Membership and Mandate .............................................................. 1
1.2 Approach and Methods ....................................................................................... 1
1.3 Cautions and Limitations .................................................................................... 2
1.4 Document Structure ........................................................................................... 2
2.0 ECONOMIC IMPACT OF MIPUG COMPANIES .......................................... 3
2.1 Employment Income ........................................................................................... 3
2.1.1 Direct Employment and Income ........................................................................................... 3
2.1.2 Contract Labour .................................................................................................................. 4
2.1.3 Training.............................................................................................................................. 4
2.2 Payments to Government ................................................................................... 4
2.3 Purchase of Good and Services .......................................................................... 4
2.4 Contribution to Community ................................................................................ 5
2.4.1 Donations and Scholarships and Bursaries ............................................................................ 5
2.4.2 Other Forms of Community Support ..................................................................................... 5
2.4.3 Capital Investment .............................................................................................................. 5
2.4.4 Infrastructure Support ......................................................................................................... 5
2.5 Economic Benefits .............................................................................................. 6
3.0 MIPUG MEMBERS AND THEIR ROLES IN THEIR COMMUNITIES ........... 8
3.1 Significance of MIPUG Companies to their Communities................................... 8
3.2 Northern Manitoba ............................................................................................. 8
3.2.1 Vale and Thompson ............................................................................................................ 8
3.2.2 Tolko Industries, Forestry and The Pas ............................................................................... 10
3.2.3 HudBay and Northern Manitoba ......................................................................................... 11
3.3 Southern Manitoba ........................................................................................... 12
3.3.1 Canexus Chemicals and Koch Fertilizer and Brandon ........................................................... 12
3.3.2 Gerdau Long Steel North America – Manitoba Mill and Selkirk .............................................. 13
3.3.3 ERCO and Virden .............................................................................................................. 14
3.3.4 Winnipeg and Other Southern Manitoba ............................................................................. 15
4.0 CONCLUSION ........................................................................................ 17
APPENDIX I: SOURCES CITED ........................................................................ 18
Manitoba Hydro 2012/14 General Rate Application PUB/MIPUG I-1(a) Attachment 1
November 30, 2012 Page 3 of 24

The Economic Impact of MIPUG, Spring 2012
1
1.0 INTRODUCTION
1.1 OVERVIEW OF MEMBERSHIP AND MANDATE
MIPUG is an association of major industrial companies operating in Manitoba (generally the GSL > 100 kV class). Industrial customers purchase over 5,000 gigawatt hours of electricity at a cost of well over $200 million dollars annually1. These companies represent 23% of the energy sold to the utility’s domestic customers2.
The purpose of the association is to work together on issues of common concern related to electricity supply and rates in Manitoba. The association’s key concerns related to electricity costs are: ensuring rates reflect the cost to provide electricity, stability and predictability. To that end, MIPUG intervened in each of the Board’s reviews of Hydro rates since 1988 and the recent risk review, as well as the Board’s 1990 review of Hydro’s Major Capital Projects and the Centra Gas acquisition in 1999. MIPUG also made a presentation at the Clean Environment Commission Wuskwatim hearing. MIPUG has been supportive of new capital projects that provide a long-term benefit to Manitoba ratepayers.
The MIPUG members are:
• Vale, Thompson;
• Tolko Industries Ltd., The Pas;
• HudBay Minerals Inc., Flin Flon;
• Canexus Chemicals, Brandon;
• Koch Fertilizer Canada ULC, Brandon;
• Gerdau Long Steel North America – Manitoba Mill, Selkirk;
• ERCO Worldwide, Virden;
• Amsted Rail - Griffin Wheel Company, Winnipeg;
• Enbridge Pipelines Inc., Southern Manitoba; and
• TransCanada Keystone Pipeline.
This report explores the benefits that MIPUG members bring to Manitoba, and the impact that these companies have on their respective communities.
1.2 APPROACH AND METHODS
A survey was distributed to MIPUG members in order to gain the following information: employment data, contributions to government, capital investment numbers and contributions to community. The most recent data was requested. The majority of firms provided data for fiscal 2011. Where follow-up or 1 Manitoba Hydro 2010/11 and 2011/12 GRA, Appendix 10.2 - Proof of Revenue For Year Ended March 31-2012, p. 1. 2 Manitoba Hydro 2010/11 and 2011/12 GRA, Tab 7: Load Forecast and Load Research, Schedule 7.2.1 (1) Load Research Summary by Customer Class (includes all GS Large > 100kV Total), p. 7.
Manitoba Hydro 2012/14 General Rate Application PUB/MIPUG I-1(a) Attachment 1
November 30, 2012 Page 4 of 24

The Economic Impact of MIPUG, Spring 2012
2
clarification was required, individual MIPUG members were contacted. Given the timeline for preparing the report, seven members were able to provide numbers for 2011. Data collected for an earlier report was used for the companies who were unable to provide 2011 numbers. For information on data collection, refer to Appendix I.
All employment and dollar figures presented in this report were provided by MIPUG members and are aggregate numbers.
Communities where MIPUG companies are located were examined in order to determine the impact of each MIPUG firm on their community. Community data was collected through an examination of: the communities section of the Manitoba Bureau of Statistics website; data from the 2006 and 2011 Statistics Canada Census; Internet sources; and studies and plans prepared for and by MIPUG communities. Employment data for each community was taken from the 2006 Census. Complete data for the 2011 Census was not available when this report was being drafted.
Information pertaining to economic impacts was taken from the Manitoba Bureau of Statistics (MBS): Manitoba Economic Multipliers 2004 report. This is the most recent MBS report with economic multipliers. Data in the report was derived from Statistics Canada’s Inter-Provincial Input-Output Tables for 1999. The multipliers were generated with the MBS Economic Impact Assessment Model. Direct effects are defined as the impact which expand or reduce production. Indirect effects are defined as the ripple effect, and induced effects are defined as the result of increased consumer spending in the economy, or the “household” or “consumer” effect. The figures shown in this report incorporate the direct, indirect and induced effects.
1.3 CAUTIONS AND LIMITATIONS
There were some challenges associated with researching the impact of MIPUG companies on Manitoba. Gaining a valid measure of the economic impacts involves applying models that represent typical scenarios rather than exact measures. In addition, it is assumed that there are no limits on productivity, and that the resources are available for consumption. Given that the majority of communities studied in this report are smaller in size, the resources might not always be readily available to fill a need. Conversely, the impact that these companies have on their communities are often greater than the estimates provided by the Manitoba Bureau of Statistics. The Manitoba economy is centred in Winnipeg, which has a diverse economy. In smaller communities that rely on a few key industries, each MIPUG firm’s impact on the economy varies from significant to integral.
1.4 DOCUMENT STRUCTURE
Section 2: Economic Impact of MIPUG Companies, summarizes the aggregate numbers collected from the survey sent to MIPUG members. Section 3: MIPUG Members and Their Role in Their Communities, provides an overview of each community, and the importance of the respective MIPUG firms. Section 4: Summary, summarizes the impact of MIPUG companies on Manitoba. Appendix I: Sources Cited, provides the list of the sources cited in the course of researching MIPUG’s impact.
Manitoba Hydro 2012/14 General Rate Application PUB/MIPUG I-1(a) Attachment 1
November 30, 2012 Page 5 of 24

The Economic Impact of MIPUG, Spring 2012
3
2.0 ECONOMIC IMPACT OF MIPUG COMPANIES
MIPUG companies are important contributors to the economy of Manitoba. This section summarizes information collected from the survey sent to MIPUG members which illustrates the economic impact of MIPUG companies.
2.1 EMPLOYMENT INCOME
Table 2.1-1 summarizes the employment, income and training contributions of MIPUG companies based on the survey results:
Table 2.1-1: Employment, Income and Training
2.1.1 Direct Employment and Income
Table 2.1-1 shows that based on the survey results, the total number full-time equivalent employees employed by MIPUG companies is 4,306. A full-time equivalent employee is generally defined as an employee who works 40 hours per week on a permanent basis. The combined salaries and benefits reported by MIPUG employers is $457 million. The Table shows that the average reported MIPUG employee salary is $106,161 if benefits are included. The $457 million combined salaries and benefits figure includes $394 million in salaries and $63 million in benefits. The average base salary is $91,433 for MIPUG employees. Based on the average weekly earnings reported by Statistics Canada, the average Manitoba salary was $42,348 in December of 20113. The survey results show that the average MIPUG employee earned more than twice the Manitoba average.
3 Statistics Canada, Average weekly earnings (including overtime) for all employees – Seasonally adjusted (December 2011) online, http://www.statcan.gc.ca/daily-quotidien/120223/t120223a1-eng.htm.
DIRECT EMPLOYMENT AND INCOME Total
1. Full-time Equivalent (FTE) Employees 4,306
2. Combined Salaries and Benefits ($ millions) $457
3. Average Salary and Benefits (actual dollars) $106,161
4. Salaries ($ millions) $394
5. Benefits ($ millions) $63
6. Average Salary (actual dollars) $91,433
7. MB Average Salary (actual dollars) $42,348
8. Salary Relative to the MB Average 216%
CONTRACT LABOUR
9. Contract Labour (FTEs) 1,274
10. Contract Costs ($ milllions) $72
TRAINING
11. Training Costs/FTE/year (actual dollars) $792
Manitoba Hydro 2012/14 General Rate Application PUB/MIPUG I-1(a) Attachment 1
November 30, 2012 Page 6 of 24

The Economic Impact of MIPUG, Spring 2012
4
Nine out of ten MIPUG companies are based outside of Winnipeg. Communities outside of Winnipeg tend to have higher unemployment rates. The unemployment rates as of March 2010 were: 5.7% for Winnipeg; 6.2% for Southern Manitoba; and 28.9% for Northern Manitoba4.
The value of MIPUG employment is particularly important in the north. The majority of MIPUG employees reside in Northern Manitoba where unemployment is five times greater than in Southern Manitoba. Companies such as Tolko Industries, Vale and HudBay are the key employers in their communities.
2.1.2 Contract Labour
Ongoing Contract Labour: As shown in Table 2.1-1, MIPUG firms reported employing a total of 1,274 contract workers and spending $72 million on contract labour. MIPUG companies employ contract workers to complement their permanent staff. For companies in the forestry sector such as Tolko Industries, contract workers are critical to their organization.
Contract Labour During Expansion: Contract labour is also used during periods of capital expansion. The employment impacts are significant. For example, during a 2004 expansion at Canexus Chemicals, 750 contract workers were used, translating into 480,000 person hours. In addition to the employment opportunities related to capital expansion, skills upgrades and skill transfers occur. Individuals who acquired or improved their skills during capital expansion projects can apply their skills to other capital projects in Manitoba.
2.1.3 Training
Table 2.1-1 shows that MIPUG companies spend an average of approximately $800 per year on training per employee5. MIPUG companies also offer apprenticeship positions. These training programs improve the skill set of Manitoba employees and make the province more competitive. Training opportunities created by MIPUG members are particularly important in smaller communities where such options are limited.
2.2 PAYMENTS TO GOVERNMENT
Combined MIPUG companies contributed an estimated $261 million to their municipal governments, the Province of Manitoba and Canada in 2011. These payments support government services.
2.3 PURCHASE OF GOOD AND SERVICES
In addition to being very significant customers of Manitoba Hydro, MIPUG companies make substantial purchases in Manitoba. MIPUG members estimated that they spent more than $260 million on goods and services in Manitoba each year.
4 Human Resources and Skills Development Canada, online: http://www.hrsdc.gc.ca/eng/employment/ei/reports/eimar_2010/annex/Annex1_1.shtml. 5 Based on the average training costs of the four MIPUG companies that provided this information for 2011.
Manitoba Hydro 2012/14 General Rate Application PUB/MIPUG I-1(a) Attachment 1
November 30, 2012 Page 7 of 24

The Economic Impact of MIPUG, Spring 2012
5
2.4 CONTRIBUTION TO COMMUNITY
In addition to economic contributions through salaries and wages and payments to government, MIPUG members make direct contributions to their communities.
2.4.1 Donations and Scholarships and Bursaries
Five of the ten MIPUG members provided the dollar value of their 2011 donations. These members spent $680,000 on donations. Some of the organizations that benefit from MIPUG companies’ charitable giving included:
• Various Manitoba schools;
• The University of Winnipeg;
• Brandon University;
• Red Cross for 2011 Flood Relief - $100,000;
• 4H Foundation Canada; and
• Morden Corn & Apple Festival.
MIPUG members also provide scholarships and bursaries in their communities, including annual scholarships to graduating high school students.
2.4.2 Other Forms of Community Support
MIPUG companies provide other forms of direct community support. As an example, Enbridge has contributed to the building of a bike path, and makes donations to community hospitals. Koch’s predecessor financially supported the Millennium Park, which is a baseball park located on the east end of Koch’s property. As another example, TransCanada provided funding for the new TransCanada Center in Île des Chênes.
2.4.3 Capital Investment
MIPUG companies have made considerable capital investments in Manitoba. The combined replacement value of MIPUG company assets is approximately $6.5 billion. The installation of this equipment brings revenue and jobs to Manitoba. There are further benefits in the cases where the equipment was purchased or financed in Manitoba.
2.4.4 Infrastructure Support
MIPUG companies bring the required critical mass to their communities to facilitate infrastructure and viable public transportation. In recent years the tenuous financial position of transportation carriers has been clearly demonstrated with Greyhound Canada. In September 2009, Greyhound Canada announced that it could not continue to provide passenger services without government support. The Province of Manitoba has been providing the company with monetary assistance to maintain services, including over
Manitoba Hydro 2012/14 General Rate Application PUB/MIPUG I-1(a) Attachment 1
November 30, 2012 Page 8 of 24

The Economic Impact of MIPUG, Spring 2012
6
$3 million in 20106. Communities with strong economies and a critical mass will be better able to sustain transportation infrastructure without government support.
As an example of the infrastructure benefits brought by industry, MIPUG companies rely on rail service to transport their products to market, and to transport inputs to their plants. A total of 14 railcars per day are required for shipping of chlorate and receiving of raw materials by Canexus Chemicals. MIPUG companies support the Hudson Bay Railway through shipments of their products, generating a regulated flow in and out of the north. The transportation link is vital to Manitoba’s north. Canexus Chemicals uses CN and CP Rail for shipping.
2.5 ECONOMIC BENEFITS
In order to gain an understanding of the total impact of MIPUG members on the provincial economy, MIPUG members were surveyed for information on their sales. The combined contribution of MIPUG firms to Manitoba’s GDP was determined by applying economic impact multipliers to each company’s sales figures, and then compiling the figures.
The economic multipliers were taken from the Manitoba Bureau of Statistics Economic Multipliers publication, released in September, 20047. The 2004 report is the most recent economic multiplier report published by the Manitoba Bureau of Statistics. Six relevant sectors were identified: mining & mineral extraction; natural gas distribution; paper manufacturing; chemical manufacturing; iron & steel mills & primary shapes; and transportation equipment manufacturing.
Applying economic multipliers does not result in an exact measure of GDP contribution. However, in the case of MIPUG, it is likely that the models underestimate rather than inflate the companies’ impact given their prominence in their respective communities.
Table 2.4-1 provides information on MIPUG sales and estimated contribution to GDP:
Table 2.4-1: Economic Benefits
Total Gross Expenditures: The total gross expenditures figure measures all of the direct, indirect, and induced impacts of MIPUG industry on Manitoba. The total gross expenditures in Manitoba as a result of MIPUG firms is estimated to be almost $4.2 billion. This is 8.2 times greater than Manitoba Hydro’s gross expenditures related to export sales.
6 Manitoba extends Greyhound agreement, CBC, March 31, 2011, online: http://www.cbc.ca/news/canada/manitoba/story/2011/03/31/mb-greyhound-service-agreement-manitoba.html. 7 The sales figures for the MIPUG firms were multiplied by the economic multipliers values for their respective industrial sectors. In order to protect commercially sensitive information regarding the sales figures for MIPUG firms, the GDP contributions have been rolled up. If the figures were presented separately, the sales figures for some of the MIPUG firms would be readily apparent to competitors.
Category (value in millions) MIPUGManitoba Hydro
Exports (2010/11)
MIPUG's Relative
Contribution
1. Sales $2,552 $398 6.4 times greater
2. Total Gross Expenditures $4,197 $515 8.2 times greater
3. Total GDP Impact $2,267 $423 5.4 times greater
Manitoba Hydro 2012/14 General Rate Application PUB/MIPUG I-1(a) Attachment 1
November 30, 2012 Page 9 of 24

The Economic Impact of MIPUG, Spring 2012
7
Contribution to Gross Domestic Product: MIPUG firms contribute an estimated $2.3 billion to the province’s GDP. This is 5.4 times greater than the contribution of Manitoba Hydro’s exports.8
Benefit of Exports: MIPUG firms export the majority of their product outside of Canada. In addition to providing an economic stimulus, the physical export of these goods supports Manitoba’s infrastructure, and provides employment and benefits to related industries such as transportation.
8 Manitoba Hydro’s export sales from The Manitoba Hydro-Electric Board 60th Annual Report, p. 69.
Manitoba Hydro 2012/14 General Rate Application PUB/MIPUG I-1(a) Attachment 1
November 30, 2012 Page 10 of 24

The Economic Impact of MIPUG, Spring 2012
8
3.0 MIPUG MEMBERS AND THEIR ROLES IN THEIR COMMUNITIES
MIPUG companies play important roles in their respective communities. This section provides background on MIPUG companies and their contributions to their communities.
3.1 SIGNIFICANCE OF MIPUG COMPANIES TO THEIR COMMUNITIES
The fact that many MIPUG member companies are located in communities outside of Winnipeg accentuates their relative importance to their communities.
Table 3.1-1 lists Manitoba’s nine largest communities outside of Winnipeg based on population numbers from the 2011 Census. MIPUG companies are located in five of the nine largest communities in Manitoba excluding Winnipeg.
Table 3.1-1: Manitoba’s Largest Communities Outside of Winnipeg
3.2 NORTHERN MANITOBA
3.2.1 Vale and Thompson
Thompson’s Population and Employment
The city Thompson had a population of 13,446 at the time of the 2006 Statistics Canada Census, and an active labour force of 7,490. The unemployment rate was 6.9% in Thompson in 2006, or 1.4% higher than the provincial average. Vale is the dominant employer. At the time of the 2011 Statistics Canada Census, the population was 12,829.
Thompson’s Economic Base
While Thompson began as a mining town, Thompson’s economy has since expanded. The degree of economic diversification is reflected in the new and unique activities taking place in the city. As an example, there is now cold weather testing for automobiles and snowmobiles taking place in the city9. Other exciting tourism and business initiatives are also being advanced. Vale, as a good corporate citizen, is helping the community in its diversification efforts. It is doing so by providing a $2.5 million economic
9 Thompson Unlimited, online: http://www.thompsonunlimited.ca/wp/winter-testing/.
Community Relative Size Population MIPUG PresenceBrandon Largest outside of Winnipeg (1st) 46,061 Canexus/Koch FertilizerMordon/Winkler 2nd 18,482Steinbach 3rd 13,524Portage la Prairie 4th 12,996Thomspon 5th 12,829 ValeSelkirk 6th 9,834 Gerdau Long SteelDauphin 7th 8,251The Pas 8th 5,513 TolkoFlin Flon 9th 5,363 HudBay
Manitoba Hydro 2012/14 General Rate Application PUB/MIPUG I-1(a) Attachment 1
November 30, 2012 Page 11 of 24

The Economic Impact of MIPUG, Spring 2012
9
development grant over 10 years that has led to the recent formation of the Thompson Community Development Corporation.
Ancillary industry has developed in Thompson as a result of mining. This includes heavy equipment sales and repair (e.g. Toromont CAT), hydraulic repair, large tire sale and repair (e.g. North Land Tire), safety and industrial outfitting, and fabrication.
Thompson’s Infrastructure
Thompson itself was developed to support Vale’s predecessor, and much of the infrastructure that is in place remains in place due to the critical mass that results from Vale’s operations10.
Vale/Inco and the Emergence and the City of Thompson
The International Nickel Company (Inco Ltd.) was responsible for the development of the City of Thompson. When Thompson was founded, Inco paid to construct the infrastructure. The company still owns the city’s water treatment plant, and provides $6,000,000 in grants in lieu of taxes to the city each year. The city that developed to support Inco’s mining operations, now acts as a service centre for 60,000 residents of Northern Manitoba.
In late 2006 Inco Ltd. was acquired by CVRD. In 2007 CVD was rebranded as Vale. At that point the company was operating as Vale Inco. Since 2010, the company has been known as Vale11. Historical references to the company’s operations in Thompson reference the influence of the former Inco Ltd.
Thompson was originally developed after Inco discovered a body of nickel ore outside of the present day city in 195612. Inco acquired the mining rights after making the discovery, and received an Order-in-Council granting Inco a region from Moak Lake to Setting Lake 120 kilometres long and 20 kilometres wide, known as the Thompson Nickel Belt. Thompson itself was named after an Inco employee, Dr. John F. Thompson, an Inco chairman who marked his 50th year with the company in 1956. The original mining site was opened at Cook Lake, and the town of Thompson was established on the Burntwood River.
Thompson was originally designed to accommodate a population of 12,000. During the development period, Inco committed to pay the government $8.5 million to begin development of the community that would eventually grow into the City of Thompson. The funds went to developing the townsite, including: the building of roads and sidewalks; sewers, a drainage system, and a water treatment plant; schools and a civic administration building which housed the jail and firehall. Inco also constructed a 32-bed hospital.
By 1961 Inco was producing its first nickel product from the refinery. By 1965 Thompson’s population was 8,500, and the community had a library, theatre and recreation complex. Provincial Trunk Highway #6 was completed to provide access from Grand Rapids to Thompson in 1966.
10 Wuskwatim Generation Project, Volume 8 – Socio-economic Environment. Environmental Impact Statement, April 2003 and Appendix 1: Socio-economic Baseline Setting Appendix – Project Region (City of Thompson & LGD of Mystery Lake) pp 135-246. 11 News Release: Vale Inco Announces Name Change to Vale, May 27, 2010. 12 Wuskwatim Generation Project, Volume 8 – Socio-economic Environment. Environmental Impact Statement, April 2003 and Appendix 1: Socio-economic Baseline Setting Appendix – Project Region (City of Thompson & LGD of Mystery Lake) pp 135-246.
Manitoba Hydro 2012/14 General Rate Application PUB/MIPUG I-1(a) Attachment 1
November 30, 2012 Page 12 of 24

The Economic Impact of MIPUG, Spring 2012
10
In 1967 Thompson was incorporated as a town, and Inco turned over the infrastructure that it had developed. The administrator of the local government district was jointly appointed by Inco and the Province. By 1970 the population had reached 20,000 and Thompson was incorporated as a city. It is now governed by an elected Mayor and Council. Thompson has become the largest community in Northern Manitoba.
In November of 2010, Vale announced that the company would be closing its Thompson smelter and refinery by 2015. While the smelter and refinery are closing, the company remains committed to northern Manitoba and will invest $150 million to update its tailings containment facilities. It is also continuing an aggressive exploration program in the Thompson Nickel Belt13. The nature of Vale’s operations will be changing, but its importance to Thompson and the north will remain.
3.2.2 Tolko Industries, Forestry and The Pas
The Pas’ Population and Employment
At the time of the 2006 Statistics Canada Census, the population of The Pas was 5,589. The active labour force stood at 2,880. The unemployment rate was 7.1%. This compares favourably with the high levels of unemployment common in Manitoba’s north. The unemployment rate as of June 2008 was 25.6% for Northern Manitoba14. At the time of the 2011 Statistics Canada Census, the population was 5,513.
Tolko Industries and the Pas’ Economic Base
The town is situated between the thick northern forests and southern farm lands of Manitoba. Both agriculture and forestry are important components of this community’s foundation. However, forestry is the largest industry in The Pas.
Forestry activities not only support workers in the pulp and paper mills, but also loggers and forestry harvesters throughout the region. Forestry is an important employer in Wabowden, Moose Lake and Cranberry Portage15.
The Pas’ Infrastructure
Tolko Industries and the forestry industry are important economic contributors to the town. The shipping and transportation needs of the industry have assisted in the development of the Town’s transportation services.
General Background
The Pas is located just east of the Saskatchewan border, 610 kilometres north of Winnipeg. First Nations communities have inhabited The Pas and the surrounding area for thousands of years. A permanent settlement was first established in The Pas in 1741. The Town also acts as a service centre for
13 News Release: Vale Outlines Investment Plans for Canadian Operations. In Excess of $10B Over Five Years, November 17, 2010. 14 Human Resources and Skills Development Canada, online: http://www.hrsdc.gc.ca/eng/employment/ei/reports/eimar_2010/annex/Annex1_1.shtml. 15 Repap Manitoba Forest Management Plan 1997-2009: Environmental Impact Statement, February 1997 Section 4.12.
Manitoba Hydro 2012/14 General Rate Application PUB/MIPUG I-1(a) Attachment 1
November 30, 2012 Page 13 of 24

The Economic Impact of MIPUG, Spring 2012
11
surrounding communities. This role naturally developed with the fur trade and the establishment of The Pas as a regional rail centre.
Tolko’s Contribution to The Pas and the Surrounding Area
Tolko Industries and its predecessors have been operating in northwestern Manitoba since 1969. The companies have historically supported the development of local logging businesses, and have played a supporting role in the development of entrepreneurs in Cross Lake, Norway House, Grand Rapids, Easterville, Duck Bay, and Cormorant. In the first five years of its Manitoba operations, Tolko spent $125 million on capital upgrades (1997-2002)16. The company estimates its annual capital spending ranges from $4 to $8 million.
Tolko’s Manitoba operations include two divisions, Kraft Papers and Solid Wood. Kraft Papers is an unbleached sack kraft paper mill. The mill produces product for the multi wall shipping sack market. The Solid Wood Division consists of Woodlands and a sawmill. Manitoba Woodlands has forest management responsibilities for Forest Management License Area No. 2. The sawmill produces kiln-dried spruce-pine-fir lumber. As a result of international lumber market conditions, sawmill production has been closed indefinitely17.
Tolko Industries has established partnerships and alliances with First Nations communities in Northern Manitoba. They include: the Mosakahiken Cree Nation (Moose Lake), Chemawain Cree Nation (Easterville), Marcel Colomb Cree Nation, and the Grand Rapids First Nation18. The relationships that Tolko has forged with First Nations communities centre around: the sharing of forest management knowledge, employee training, and planning collaboration. In addition to providing direct jobs, Tolko Industries supports local entrepreneurship. While the company does not monitor or regularly quantify contracts with contractors, in 2001 the company estimated that it awarded more than $16.5 million in contracts for woodland activities to First Nations Contractors.
Tolko is engaged in renewal activities to promote the sustainability of our woodlands and to ensure that an adequate supply of wood exists in the future.
3.2.3 HudBay and Northern Manitoba
Flin Flon’s Population and Employment
At the time of the 2006 Census, the Town had a population of 5,836 people. Of this total, 3,180 were in the labour force. The unemployment rate was 4.6%. At the time of the 2011 Statistics Canada Census, the population was 5,363.
Flin Flon’s Economic Base
Flin Flon has a balanced workforce, which supports the town and its trading area of over 15,000 people. HudBay is the dominant employer. However, there are other components of the town’s economy.
16 Tolko News Release: Tolko Pursues Long Term Vision in The Pas, June 19, 2002. 17 Tolko Background, online: http://www.tolkomanitoba.com/TolkoBackground.htm. 18 Tolko New Release: Tolko Pursues Long Term Vision in The Pas, June 19, 2002.
Manitoba Hydro 2012/14 General Rate Application PUB/MIPUG I-1(a) Attachment 1
November 30, 2012 Page 14 of 24

The Economic Impact of MIPUG, Spring 2012
12
Forestry, light manufacturing, agriculture, tourism and retail operations are also important contributors to the local economy.
Flin Flon’s Infrastructure
The town’s infrastructure was largely developed in response to the needs of the mining industry. Flin Flon is accessible by Highway 10 and Highway 106.
HudBay’s Contribution to Flin Flon and Northern Manitoba
HudBay operates a concentrator and a zinc plant in Flin Flon, Manitoba. In addition, it operates the 777 and Trout mines in the Flin Flon area. The company is also developing the Lalor project, Chisel North mine and Snow Lake concentrator. Lalor will be the next major underground mine for HudBay. It is scheduled to begin initial production in 2012.
HudBay’s primary operations are in Flin Flon. Mining is a defining part of the Town’s economy and way of life. In fact, the name was based on a character from a novel that the prospector was reading, Josiah Flintabbatey Flonatin. Flin Flon has grown to a town of almost 6,000 people, and serves as a trading centre for thousands of additional residents of Manitoba’s North19.
3.3 SOUTHERN MANITOBA
3.3.1 Canexus Chemicals and Koch Fertilizer and Brandon
Brandon’s Population and Employment
Brandon had a population of 41,511 at the time of the 2006 Statistics Canada Census, and an active labour force of 23,200. The unemployment rate was 5.5% in Brandon in 2006, or the same as the provincial average. At the time of the 2011 Statistics Canada Census, the population was 46,061.
Brandon’s Economy
As the second largest city in the Province, Brandon has developed as a service centre to smaller neighbouring communities and agricultural producers. Almost two-thirds of Manitoba’s arable farmland is within a 130 km radius of the city20. This service role is the result of both geography and a favourable environment for development.
There are a number of large private sector employers in Brandon, however Canexus Chemicals and Koch Fertilizers provide some of the better paying private sector jobs in the city.
Brandon’s Infrastructure
Brandon receives infrastructure benefits due to Canexus Chemicals and Koch Fertilizers’ presence in the city. CN and CP Rail transport Canexus Chemicals’ finished products. Canexus Chemicals uses CN and CP Rail for shipping. A total of 14 railcars per day are required for shipping of chlorate and receiving of raw
19 Manitoba Community Profiles, Online: http://www.gov.mb.ca/asset_library/en/statistics/demographics/communities/flin_flon_part_cy.pdf. 20 City of Brandon: Economic Strategic Action Plan, June 2002, p. 10.
Manitoba Hydro 2012/14 General Rate Application PUB/MIPUG I-1(a) Attachment 1
November 30, 2012 Page 15 of 24

The Economic Impact of MIPUG, Spring 2012
13
materials 365 days per year. This translates into 5,110 railcars per year. While the City of Brandon has programs and tax structures in place to attract business, the infrastructure must be in place to support that business. Companies such as Canexus Chemicals and Koch Fertilizers have helped to justify that infrastructure.
Canexus Chemicals and Koch Fertilizer’s Contributions to Brandon
Canexus Chemicals operates the world’s largest sodium chlorate plant in Brandon21. Koch Fertilizer’s Brandon plant produces a variety of products, including: anhydrous ammonia, urea, UAN solutions, nitric acid, ammonium nitrate solution, ammonium polyphosphate, and ammonium thiosulfate22.
The City of Brandon has not imposed a business tax, giving it a competitive advantage. This favourable environment has brought industry to Brandon. While the lack of a business tax is a significant benefit to business, the city requires other tax revenues to compensate for the lack of business tax. Companies such as Canexus Chemicals and Koch Fertilizer provide highly skilled, high paying jobs. As a result, their employees have the financial resources to be important contributors to the municipal tax pool.
3.3.2 Gerdau Long Steel North America – Manitoba Mill and Selkirk
Selkirk’s Population and Employment
At the time of the 2006 Statistics Canada Census, the population of Selkirk was 9,515. The active labour force stood at 4,640. The unemployment rate was 6.7%. At the time of the 2011 Statistics Canada Census, the population was 9,834.
Selkirk’s Economy
Selkirk has a diversified economy. A large component of Selkirk’s economy is represented by the service sector, specifically health care. One of the largest employers in the region is the Selkirk Mental Health Centre, which also houses a School of Psychiatric Nursing.
Gerdau Long Steel North America – Manitoba Mill is the largest private sector employer in Selkirk, and almost 800 jobs are tied directly to the mill. There is also significant ancillary economic activity in Selkirk related to Gerdau Manitoba Mill. Customers have relocated their operations to Manitoba to be close to the mill. These customers include: Black Cat Blades, which has two plants in Selkirk and 50 employees; ESCO plant in Steinbach, which has 35 employees; and TC Industries Selkirk which is Caterpillars largest blade manufacturing plants in the world and has 55 employees. A total of 789 jobs can be directly tied to the steel mill23.
Selkirk’s Infrastructure
Even though Selkirk is only located 34 miles north of Winnipeg, the city has the infrastructure of an independent centre. Selkirk is also conveniently located 145 kilometres north of the 24-hour U.S. border crossing at Emerson. Selkirk has rail connections, as well as freight terminal and trucking services. The
21 Canexus Operations, online: http://canexus.ca/operations/north-american-sodium-chlorate/our-operations. 22 Koch Fertilizer locations, online: http://www.kochfertilizer.com/locations.asp. 23 Gerdeau Ameristeel 2012 MIPUG Economic Impact Assessment Survey Response.
Manitoba Hydro 2012/14 General Rate Application PUB/MIPUG I-1(a) Attachment 1
November 30, 2012 Page 16 of 24

The Economic Impact of MIPUG, Spring 2012
14
first passenger train from Winnipeg to Selkirk was connected in 1904, and by 1911 rail service was firmly established in the city. The rail connection, coupled with tax exemptions and free industrial sites, lured industry24. The infrastructure development of the city has been largely prompted by the infrastructure needs of industry, including Gerdau Manitoba Mill and its ancillary economic activity.
General Background
Selkirk is located 34 kilometres north of Winnipeg and 145 miles north of the American border. Selkirk serves as a trading centre for the 53,500 residents of the city, St. Clements, St. Andrews and the surrounding region25.
Gerdau Manitoba Mill’s Contribution to Selkirk
Gerdau Manitoba Mill (formerly MRM) has played a prominent role in Selkirk’s history. Selkirk made a concerted effort to attract MRM almost 100 years ago. In 1913 the Selkirk Dominion Corporation Limited was formed with the purpose of bringing MRM to Selkirk. MRM had outgrown their St. Boniface site, and were looking for a new location. The Corporation was successful in its bid to attract MRM, and MRM moved to Selkirk in 1916. MRM expanded due to war-time need during both World Wars, and underwent a further expansion in 1951 that created an additional 100 jobs26. This employment expansion at MRM was part of an economic boom in Selkirk during the same period. Between 1948 and 1956, 50 new homes were built in the city each year to meet the growing housing needs.
Gerdau Manitoba Mill operates in a highly competitive industry. There are new realities facing the Selkirk facility that are serving to increase the competitive environment. Gerdau Manitoba Mill is now facing intra-company competition in addition to the competition it has always faced from external competitors. MRM began as an independent company. In 1995 MRM was acquired by Gerdau. In 2002, Gerdau merged with Ameristeel. The Selkirk plant is now owned by Gerdau S.A., one of the largest mini-mill steel producers in North America. Gerdau operates 20 steel mills in North American and 53 steel mills worldwide27.
3.3.3 ERCO and Virden
Virden’s Population and Employment
Virden had a population of 3,010 at the time of the 2006 Statistics Canada Census, and an active labour force of 1,485. The unemployment rate was 5.1% in Virden in 2006, or 0.4% less than the provincial average. Jobs at ERCO have contributed to Virden’s lower unemployment rate. At the time of the 2011 Statistics Canada Census, the population was 3,114.
24 Selkirk: History, online: http://www.cityofselkirk.com/index_1024.html. 25 Selkirk Generating Station, Environmental Impact Statement, Chapter 8, online: http://www.hydro.mb.ca/regulatory_affairs/selkirk/eis_pdfs/vol1_chapter8.pdf, p. 89. 26 Selkirk: History, online: http://www.cityofselkirk.com/index_1024.html. 27 Gerdau Locations, online: http://www.gerdau.com/longsteel/.
Manitoba Hydro 2012/14 General Rate Application PUB/MIPUG I-1(a) Attachment 1
November 30, 2012 Page 17 of 24

The Economic Impact of MIPUG, Spring 2012
15
Economy
The Town of Virden has a diverse economy. The largest sectors are the construction, retail and service sectors. There is also significant employment related to oil extraction in the area28. ERCO adds to the town’s diverse economy.
Infrastructure
Virden’s rail accessibility is complemented by its location at the junction between the Trans-Canada Highway and Highway 83. Highway 83 is a north-south highway that extends north to Swan River, Manitoba, and south to Mexico. It is also known as the "Palms to Pines" route. A 24 hour border crossing is available for the highway. The #10 Provincial Highway connects the Town with the northern centres of Flin Flon, The Pas and Swan River.
General Background
Virden is located 77 kilometres west of Brandon and 105 kilometres north of the US border. Settlement began in the Town of Virden in the later part of the last century with the arrival of the railway.
ERCO’s Contribution to Virden
ERCO is a producer of sodium chlorate. The company provides highly skilled, high paying jobs to the small rural community. In addition, the company creates economic spin off benefits as it relies on the services of the oil and gas sector, and local contractors for the supply of skilled tradesmen for plant shutdowns and maintenance.
3.3.4 Winnipeg and Other Southern Manitoba
MIPUG members not only help to create the critical mass required for transportation infrastructure in some of Manitoba’s largest communities outside of Winnipeg, MIPUG companies are literally connecting Manitobans to the rest of North America. MIPUG companies include a railcar wheel manufacturer and pipelines.
Amsted Rail - Griffin Wheel Company
Griffin Canada was founded in 1877 and began by producing chilled iron wheels for railcars. The prominence of rail transportation was critical to the development of Manitoba. Companies such as Griffin Canada made that development possible. The historical importance of the rail industry is still apparent today. Winnipeg is now the only major city between Vancouver and Thunder Bay with direct rail connections to the United States29.
Today Griffin is owned by Amsted Rail. The company continues to manufacture low-stress wheels, playing an ongoing role in railway transportation.
28 Town of Virden: Business Profile, online: http://www.virden.ca/page.aspx?page_id=19&title=Business. 29 The Manitoba Advantage 2005, p. 3.
Manitoba Hydro 2012/14 General Rate Application PUB/MIPUG I-1(a) Attachment 1
November 30, 2012 Page 18 of 24

The Economic Impact of MIPUG, Spring 2012
16
Enbridge and TransCanada Keystone Pipeline
The MIPUG membership includes companies that operate pipelines in southern Manitoba, Enbridge Inc. and TransCanada Keystone Pipeline.
The pipeline companies provide jobs outside of major centres in southern Manitoba. Jobs within these communities are harder to replace. Recent comparative data revealed that southern Manitoba’s unemployment rate was 6.2%, versus 5.7% for Winnipeg30. A large component of Southern Manitoba’s economy is represented by Brandon, the second largest centre in the province with an unemployment rate of 5%31. The unemployment rate for Southern Manitoba is higher than 6.2% if Brandon is excluded. In addition to permanent jobs, the construction of the companies’ pipelines created employment opportunities during the installation phase, as well as jobs related to maintenance and operations.
Given the physical structure of the pipelines, these companies contribute substantially to the property tax collected by Manitoba’s smaller communities. In addition, the capital replacement value of their Manitoba assets is sizeable.
Enbridge Pipelines: The company operates a crude oil liquids pipeline system through Manitoba. The pipeline crosses the Saskatchewan/Manitoba border at Cromer, Manitoba and traverse south directly into the United States at Gretna, Manitoba. Enbridge has created demand for electricity in smaller communities in Southern Manitoba, including Cromer, Souris, Glenboro, St. Leon, Manitou and Gretna. The presence of Enbridge enables the economical and reliable supply of electricity to these communities.
The pipeline supports the oil industry in Manitoba. In 2010 the total oil industry expenditures were approximately $894 million32. Without the significant capital investment by pipeline companies, Manitoba would not have the developed industry that exists today.
Enbridge also delivers all the refined products (gasoline, diesel and aviation fuel) to Manitoba. These activities are done more economically and reliably because the pipelines in Manitoba are part of a much larger Enbridge system.
The construction phase of pipeline development creates local jobs and economic spin-offs. Most recently Enbridge built a new 36 inch pipeline and a new 18 inch pipeline. Construction benefits are considerable and result in employment in parts of the province with higher unemployment rates than Manitoba’s urban centres.
TransCanada Keystone Pipeline (oil): TransCanada Keystone Pipeline completed Phase 1 of the Keystone Pipeline in 2010 (oil). The line runs from Hardisty, Alberta to Illinois33. Keystone operates pumping stations in southern Manitoba (Crandall, Rapid City, Wellwood, Portage la Prairie, Carman and Haskett). TransCanada Keystone Pipeline will remain as a significant Manitoba electricity customer, an employer and a contributor to the local economy.
30 Human Resources and Skills Development Canada, http://www.hrsdc.gc.ca/eng/employment/ei/reports/eimar_2010/annex/Annex1_1.shtml (data for June 2010). 31 Brandon Economic Development, online: http://notes.brandon.ca/main.nsf/Pages+by+ID/600 (data for 2010). 32 Manitoba Oil Facts, Province of Manitoba, online: www.manitoba.ca/iem/petroleum/oilfacts/index.html. 33 TransCanada Keystone Pipeline Map, online: http://www.transcanada.com/keystone_pipeline_map.html.
Manitoba Hydro 2012/14 General Rate Application PUB/MIPUG I-1(a) Attachment 1
November 30, 2012 Page 19 of 24

The Economic Impact of MIPUG, Spring 2012
17
4.0 CONCLUSION
MIPUG companies employ highly skilled and well-paid Manitobans. Based on the average weekly earnings reported by Statistics Canada, the average Manitoba salary was $42,348 in December of 2011. MIPUG companies paid their employees more than twice that figure. MIPUG jobs are valuable to the Manitobans who occupy them and to the communities where these individuals are employed. In total, MIPUG members employ almost 4,300 full-time equivalent (FTE) employees, and approximately 1,300 FTE contract workers. Additional benefits provided by MIPUG firms include:
• The replacement value of their assets is over $6.5 billion, and the combined sales of MIPUG companies total almost $2.6 billion;
• These companies spend approximately $200 million on electricity each year, and an additional $260 million on goods and services in Manitoba;
• MIPUG members contribute more than $260 million to their respective municipal governments, and to the governments of Manitoba and Canada each year; and
• MIPUG companies contribute almost $2.3 billion to provincial GDP.
Manitoba Hydro 2012/14 General Rate Application PUB/MIPUG I-1(a) Attachment 1
November 30, 2012 Page 20 of 24

The Economic Impact of MIPUG, Spring 2012
18
APPENDIX I: SOURCES CITED
1. Print and Internet Resources
AMSCO Cast Products (Canada) Inc., Facility, online: http://www.amscocast.com/amscocast_2012_all_pages_005.htm.
Bank of Canada, Monetary Policy Report, online: http://www.bankofcanada.ca.
Brandon Economic Development, online: http://notes.brandon.ca/main.nsf/Pages+by+ID/600.
Canexus Operations, online: http://canexus.ca/operations/north-american-sodium-chlorate/our-operations.
CCRA Income Statistics 2011 (2009-tax year), General statement by province and territory of taxation, online: http://www.cra-arc.gc.ca/gncy/stts/gb09/pst/fnl/tbhtml-eng.html.
City of Brandon, Brandon Investment Climate, January 13, 2005.
City of Brandon: Economic Strategic Action Plan, June 2002, p. 10.
Brandon Economic Development, online: http://www.econdev.brandon.ca/main.nsf/Pages+by+ID/641.
Canadian General Freight Index, “CGFI Rises 10% after 12th Consecutive Increase, online: http://www.nulogx.com/cgfi/results/?utm_source=February+2012+CGFI+Public+Results+Email&utm_campaign=feb-cgfi-pr&utm_medium=email, April 25, 2012.
Economic Impact of the Manitoba Industrial Power Users Group (The), August 2005.
Gerdau Locations, online: http://www.gerdau.com/longsteel/.
Human Resources and Skills Development Canada, online: http://www.hrsdc.gc.ca/eng/employment/ei/reports/eimar_2010/annex/Annex1_1.shtml.
Koch Fertilizer locations, online: http://www.kochfertilizer.com/locations.asp.
Manitoba Advantage 2005 (the), Province of Manitoba.
Manitoba Bureau of Statistics, Communities, online: http://www.gov.mb.ca/mbs/communities/index.html.
Manitoba Bureau of Statistics Economic Multipliers, September, 2004.
Manitoba Community Profiles, Online: http://www.gov.mb.ca/asset_library/en/statistics/demographics/communities/flin_flon_part_cy.pdf
“Manitoba extends Greyhound agreement”, CBC, March 31, 2011, online: http://www.cbc.ca/news/canada/manitoba/story/2011/03/31/mb-greyhound-service-agreement-manitoba.html.
Manitoba Hydro-Electric Board 60th Annual Report (The), p. 69.
Manitoba Hydro 2012/14 General Rate Application PUB/MIPUG I-1(a) Attachment 1
November 30, 2012 Page 21 of 24

The Economic Impact of MIPUG, Spring 2012
19
Manitoba Hydro 1996/97 General Rate Application.
Manitoba Hydro 2002 Status Update Filing.
Manitoba Hydro 2003/04 General Rate Application.
Manitoba Hydro 2008/09 General Rate Application.
Manitoba Hydro 2010/11 and 2011/12 General Rate Application.
Manitoba Hydro Capital Expenditure Forecast, November 2010.
Manitoba Hydro: Current Electricity Rates, online: http://www.hydro.mb.ca/regulatory_affairs/energy_rates/electricity/historical.shtml.
Manitoba NDP News Release: Selinger guarantees best-in-Canada utility bills, September 7, 2011.
Manitoba Oil Facts, Province of Manitoba, online: www.manitoba.ca/iem/petroleum/oilfacts/index.html
“Maple Leaf improves wages, pensions”, Western Producer, January 14, 2010, online: http://www.producer.com/2010/01/maple-leaf-improves-wages-pension/.
MTS Centre, Quick Facts, online, http://www.mtscentre.ca/arena/index.php.
Pre-filed Testimony of MIPUG in regard to Manitoba Hydro Capital Program Review, The Public Utilities Board of Manitoba Order No. 90/90, July 1990, pp. 32-33.
Province of Manitoba, Public Accounts 2010/11 For the Year Ended March 31, 2011, Volume 3, online: http://www.gov.mb.ca/finance/pdf/annualreports/pubacct_3_11.pdf.
Repap Manitoba Forest Management Plan 1997-2009: Environmental Impact Statement, February 1997.
Selkirk Generating Station, Environmental Impact Statement, Chapter 8, online: http://www.hydro.mb.ca/regulatory_affairs/selkirk/eis_pdfs/vol1_chapter8.pdf.
Selkirk: History, online: http://www.cityofselkirk.com/index_1024.html.
Statement of Bill Turner, Chair, Manitoba Industrial Power Users’ Group (MIPUG) To the Clean Environment Commission Regarding the Wuskwatim Generation and Transmission Projects Application, March 10, 2004.
Statistics Canada, 2006 Census
Statistics Canada, Average weekly earnings (including overtime) for all employees – Seasonally adjusted (December 2011) , online, http://www.statcan.gc.ca/daily-quotidien/120223/t120223a1-eng.htm.
Tembec aims to sell Pine Falls Mill, CBC, December 8, 2009, online: http://www.cbc.ca/news/canada/manitoba/story/2009/12/08/man-tembec-sale.htm.
Tembec News Release: Tembec shuts down permanently its Pine Falls newsprint mill, September 2, 2010.
Manitoba Hydro 2012/14 General Rate Application PUB/MIPUG I-1(a) Attachment 1
November 30, 2012 Page 22 of 24

The Economic Impact of MIPUG, Spring 2012
20
Thompson Unlimited, online: http://www.thompsonunlimited.ca/wp/winter-testing/.
Tolko Background, online: http://www.tolkomanitoba.com/TolkoBackground.htm.
Tolko New Release: Tolko Pursues Long Term Vision in The Pas, June 19, 2002.
Town of Virden: Business Profile, online: http://www.virden.ca/page.aspx?page_id=19&title=Business.
TransCanada Natural Gas, online: http://www.transcanada.com/99.html and 2011 Annual Report, online http://www.transcanada.com/docs/Investor_Centre/2011_TCC_AR_Eng.pdf, p. 3.
TransCanada Keystone Pipeline Map, online: http://www.transcanada.com/keystone_pipeline_map.html.
Vale News Release: Vale Inco Announces Name Change to Vale, May 27, 2010.
Vale News Release: Vale Outlines Investment Plans for Canadian Operations.
In Excess of $10B Over Five Years, November 17, 2010.
Vale News Release: Vale Outlines Investment Plans for Canadian Operations In Excess of $10B Over Five Years, November 17, 2010.
Wuskwatim Generation Project, Volume 8 – Socio-economic Environment, (Environmental Impact Statement, April 2003 and Appendix 1: Socio-economic Baseline Setting Appendix), NFAAT.
2. Member Data
Data from a prior MIPUG survey was used for Vale, Koch Fertilizers and Amsted Rail – Griffin Wheel. The data was from 2004. Vale provided confirmation that the figures for 2011 are not significantly different than the 2004 numbers. For Vale, Employment, taxes, and other operational statistics have remained fairly constant.
Communications with Members
Canexus Chemicals, Written survey response and follow-up with Bill Turner, Plant Manager.
Enbridge Pipelines Inc., Written survey response and follow-up with Kaare Svidal, Manager, Energy Management.
ERCO Worldwide, Written survey response from Terry Friske, Interim Plant Manager.
Gerdau Long Steel North America, Written survey response and follow-up with Dave Forsyth, Regional Energy Manager, Gerdau Long Steel North America.
HudBay Minerals Inc., Written survey response and follow-up with Duminda Epa, Superintendent, CSG and Engineering Services.
Tolko Industries Ltd., Written survey response and follow-up with Blair Rydberg, Site Manager.
TransCanada Pipelines Ltd. and Keystone Pipeline Limited Partnership, Written survey response and follow-up with Michael Cote, Manager, Power Marketing.
Manitoba Hydro 2012/14 General Rate Application PUB/MIPUG I-1(a) Attachment 1
November 30, 2012 Page 23 of 24

The Economic Impact of MIPUG, Spring 2012
21
Vale, Verbal communication with Wayne Schroeder, Chief Power Engineer.
Manitoba Hydro 2012/14 General Rate Application PUB/MIPUG I-1(a) Attachment 1
November 30, 2012 Page 24 of 24

Manitoba Hydro
2012/14 General Rate Application
PUB/MIPUG-I-2
November 30, 2012 Page 1 of 1
REFERENCE: Section 2.1 Pg. 2.1 1
Overview of MIPUG Membership 2
3
QUESTION: 4
5
a) For the fiscal years 2008, 2009, 2010, 2011 and 2012 please quantify the energy 6
consumed (GWh) collectively by MIPUG members in the > 100 kV sub class and 7
the 30-100 kV sub class. 8
9
b) For each sub class and fiscal year provided in (a) please provide MH’s total sub 10
class energy consumption. 11
12
c) For each sub class and fiscal year provided in (a) please provide MIPUG’s 13
energy consumption as a percentage of MH’s non-residential domestic energy 14
consumption as well as a percentage of MH’s total domestic energy 15
consumption. 16
17
ANSWER: 18
19
(a) and (b) 20
21
The framework for the MIPUG association is that detailed individual member data is not 22
routinely collected or shared with other members. 23
24
As noted in the attachment to PUB/MIPUG-I-1(a), the MIPUG member companies 25
consume approximately 5000 GW.h, as compared to a total 6000 GW.h in the GSL 30-26
100kV class and the GSL >100kV class (as per MIPUG/MH-I-20(a)). It is generally 27
understood that MIPUG members make up the vast majority of the GSL >100kV (but not 28
the entire class), and approximately one half of the GSL 30-100 kV class. 29
30
The above pattern is expected to hold relatively consistent for the years 2008-2012. 31
32
(c) 33
34
As a percentage of MH domestic sales, MIPUG members at approximately 5000 GW.h 35
make up approximately 44% of non-residential sales, and 27% of all domestic energy 36
sales, based on 2012/13 data from MIPUG/MH-I-20(a). 37


Manitoba Hydro
2012/14 General Rate Application
PUB/MIPUG-I-3
November 30, 2012 Page 1 of 2
REFERENCE: Section 2.1 Pg. 2-2 1
MIPUG Principles 2
3
QUESTION: 4
5
a) Please explain MIPUG’s specific concerns related to Hydro’s investments in: 6
• Subsidiaries; 7
• New export ventures; and 8
• Major new capital programs. 9
10
ANSWER: 11
12
(a) 13
14
The cited section of Mr. Bowman’s pre-filed testimony highlights the context for Mr. 15
Bowman’s review, as provided by his clients. The MIPUG clients specific concerns in 16
regards to this group of items is that, under one perspective regarding Manitoba’s 17
regulatory system, Hydro can spend as it sees fit (whether prudent or not, and whether 18
related to providing lowest-cost and efficient electricity service or not) and the only 19
decision available to the PUB is when ratepayers should pay for this spending. This is 20
true whether the spending is on providing essential utility service, or on unrelated 21
subsidiary operations, export ventures not aligned with ratepayer priorities, or major new 22
capital projects that may not be required to serve domestic customers or that may be 23
pursued in an uneconomic manner. 24
25
The MIPUG clients have expressed to Mr. Bowman their concerns on the above items 26
as follows: 27
28
• That Hydro’s investment in subsidiaries, if sufficiently large and imprudent, could 29
become a rate driver in and of itself, even if the purpose of the spending is not 30
directly (or perhaps even indirectly) related to providing electrical service. To date 31
this has not been a major concern for Manitoba Hydro, but it is an item that 32
requires ongoing diligence. 33
• In respect of new export ventures and major new capital programs, MIPUG has 34
expressed an ongoing concern that all such programs be properly assessed in 35
an open and transparent manner, and that the appropriate test for such reviews 36

Manitoba Hydro
2012/14 General Rate Application
PUB/MIPUG-I-3
November 30, 2012 Page 2 of 2
is that the plans should promote least-cost long-term rates for the utility’s 1
domestic electricity customers. This is particularly true given that it is the utility’s 2
ratepayers who ultimately bear the risks associated with the plans. On this basis, 3
MIPUG assessed the MH plans for Conawapa in the early 1990s and ultimately 4
supported the project. No such opportunity to assess Hydro’s current 5
development plans in any quantitative detail has yet been provided, so MIPUG 6
has not to date communicated a firm position in respect of these plans. 7

Manitoba Hydro
2012/14 General Rate Application
PUB/MIPUG-I-4
November 30, 2012 Page 1 of 3
REFERENCE: Section 2.2 Pg. 2-3 1
Rates vs. Costs 2
3
QUESTION: 4
5
a) Please provide examples where lowest published utility rates do not equate to 6
the lowest cost for power. 7
8
b) Please explain all significant rate options which provide MIPUG members in 9
other jurisdictions access to lower overall cost for energy that is not provided for 10
in Manitoba. 11
12
c) Please list the MIPUG identified deficiencies in achieving “lowest cost for power” 13
and the proposed process to address the deficiencies. 14
15
ANSWER: 16
17
(a) and (b) 18
19
The cited section of Mr. Bowman’s pre-filed testimony relates to the context for the 20
InterGroup assignment, and the views and concerns of industrial customers that have 21
been expressed to Mr. Bowman. As noted in PUB/MIPUG-2, detailed individual 22
company information is not shared within the MIPUG group. 23
24
At least 2 members have indicated that sister plants in other parts of North America can 25
achieve lower net costs for power than can be achieved in Manitoba. 26
27
As evidence before the board today, Mr. Bowman is aware of information that supports 28
the perspectives of the MIPUG members: 29
30
1) In 2006, MIPUG members presented to the Manitoba PUB as part of the Cost-of-31
Service hearing (May 9th, 2006). At that time, one of the MIPUG member 32
presentations included a chart that compared their Manitoba plant’s costs for 33
power with costs in other jurisdictions. While the presentation illustrated that at 34
that time Manitoba’s prices were the lowest for the all-in power cost comparison, 35
the costs were only slightly lower than a number of American jurisdictions. It is 36
worth noting that since that time, the change in the US Dollar exchange rate will 37

Manitoba Hydro
2012/14 General Rate Application
PUB/MIPUG-I-4
November 30, 2012 Page 2 of 3
have reduced the relative spread between Manitoba and these other plants by 1
10-15% (the Canadian dollar was in the range of 85-90 cents US$ during that 2
year) ignoring the effects of rate changes in each jurisdiction. 3
4
2) There is also a recent example of operations in Canada that receive power at a 5
lower cost than Manitoba, despite Manitoba Hydro’s claims that the jurisdiction 6
has higher rates than Manitoba Hydro. In this case, the Crown utility in 7
Newfoundland (Newfoundland and Labrador Hydro) offers regulated service to 8
industrial customers. Manitoba Hydro cites the Newfoundland Hydro rate as 9
averaging 3.968 cents/kW.h (including demand charges) as compared to 10
Manitoba Hydro’s average rate calculated on the same basis as 3.631 11
cents/kW.h (Appendix 10.10). This is incorrect, however, as the normal rate for 12
industrial service in Newfoundland Hydro’s island service area as established by 13
the Newfoundland Public Utilities Board, is 2.754 cents/kW.h1. This same rate is 14
applied to both a new customer2 and for a customer who has paid this same rate 15
since 2006. In practice, the only customers who pay the rate cited by Manitoba 16
Hydro (3.968 cents/kW.h) are those that existed on the system before 2006 and 17
which are being allocated an extra cost to repay for historical amounts that are 18
not relevant to all new customers since 2006. 19
20
InterGroup will make MIPUG members aware of the PUB’s interest in rate options and 21
utility cost comparisons. Individual MIPUG members may be able to provide additional 22
detail regarding utility cost comparisons during their PUB presentations. 23
24
(c) 25
26
The major deficiency that some of the MIPUG members expressed to Mr. Bowman is the 27
relative lack of rate options developed that provide a mutual benefit to MH and industrial 28
customers. Some MIPUG members have indicated that they would welcome the 29
opportunity to engage in discussions with Manitoba Hydro regarding options that exist in 30
other jurisdictions, and to discuss whether or not some of these options would work in 31
the Manitoba context. Examples include demand-response options that permit 32
customers to work with Hydro to curtail operations at times of high export market 33
1 1.676 cents per kilowatt hour and $6.68/kW of demand. Applied on the same loads as used by Manitoba Hydro, as per MIPUG/MH-I-6(a). 2 (Newfoundland Public Utilities Board Order P.U.6-2012, which approved the addition of a new industrial customer at 1.676 cents per kilowatt hour, http://www.nlh.nl.ca/hydroweb/nlhydroweb.nsf/SubContent/Customers-Electricity%20Rates-Current%20Rates?OpenDocument.

Manitoba Hydro
2012/14 General Rate Application
PUB/MIPUG-I-4
November 30, 2012 Page 3 of 3
potential, or for those customers who have an opportunity to co-generate power, having 1
Hydro eliminate its prohibition on providing domestic industrial customers the same 2
opportunity to access power supply agreements/IPP arrangements with Manitoba Hydro 3
that are provided to non-Manitoba based wind generators. 4


Manitoba Hydro
2012/14 General Rate Application
PUB/MIPUG-I-5
November 30, 2012 Page 1 of 1
REFERENCE: Page 2-4 1
MIPUG Load Forecast 2
3
QUESTION: 4
5
a) Please provide a chart comparing MIPUG’s aggregated load forecast for the next 6
ten and 20 years with that provided in the Application by MH for GSL sub classes 7
and explain the differences. 8
9
ANSWER: 10
11
(a) 12
13
As noted in PUB/MIPUG-I-2, MIPUG members do not share information regarding their 14
detailed loads, operational plans or respective load forecasts. As such, aggregated load 15
data for the group does not exist. 16
17
It should also be noted that MIPUG does not represent all customers in either the >100 18
kV class or the 30-100 kV class, and such any aggregated MIPUG data would not 19
capture the load forecasts of non-members or of potential new companies that have yet 20
to begin operation in Manitoba. 21
22
MIPUG does not have any reason to dispute Manitoba Hydro’s current (2011) load 23
forecast as set out in MIPUG/MH-I-40(a). This is a change from 2007 and 2008, where 24
MIPUG members noted a degree of skepticism about Manitoba Hydro’s then very high 25
long-term load forecasts for industrial customers. For example, note that the forecast 26
prepared in 2007 for the year 2020 showed industrial (GSL>100kV) load at 7,255 GW.h, 27
as compared to the 2011 forecast for that same year (2020) of 5,049 GW.h. 28


Manitoba Hydro
2012/14 General Rate Application
PUB/MIPUG-I-6
November 30, 2012 Page 1 of 1
REFERENCE: Section 2.2.2 Pg. 2-6 Bonbright 1
2
QUESTION: 3
4
a) Please list and quantify the specific items on which MIPUG suggests there is an 5
“over focus on short run costs”. 6
7
ANSWER: 8
9
(a) 10
11
The section in question (2.2) sets out important ratemaking principles that guided the 12
InterGroup assignment. One caution for ratemaking, as set out in the literature and 13
established principles, warns against designing rates that are excessively focused on 14
short-run costs and not sufficiently attentive to longer-term rate stability. 15
16
In the case of Manitoba Hydro, the strength of the established regulatory regime is that 17
there is a tendency away from specific annual “revenue requirement” items, with instead 18
a perspective that it is important to look at where costs are going in the coming years. 19
This results in a number of positive benefits for customers; for example that during some 20
extreme event like a drought, rates do not have to be dramatically raised (nor 21
dramatically lowered during a future high water event). 22
23
In this proceeding, however, despite the above regulatory framework which is 24
successfully designed to help promote stable rates and a long-term focus, Manitoba 25
Hydro has proposed changes that do drive immediate impacts from short-term changes. 26
This is mostly related to proposed changes to excessively expense overhead amounts 27
that are better accounted for as part of the capital program, and to change depreciation 28
to an ELG approach. The quantification of these changes is set out in the response to 29
PUB/MIPUG-11(a). 30


Manitoba Hydro
2012/14 General Rate Application
PUB/MIPUG-I-7
November 30, 2012 Page 1 of 7
REFERENCE: Section 2.2.4 Pg. 2-9 1
2
QUESTION: 3
4
a) Has MH has developed Wuskwatim with ‘no near-term adverse impacts’? 5
6
ANSWER: 7
8
(a) 9
10
No. Wuskwatim is having an adverse impact on Hydro’s financial performance over the 11
first decade of the IFF, as set out within this response. However, this does not 12
necessarily mean constructing Wuskwatim was a poor decision, as (1) many of the 13
benefits of the plant (e.g., protection from unexpected load growth) cannot be easily 14
quantified, and (2) the long-term benefits of advancing the plant are not apparent in this 15
simple comparison (i.e., what would it have cost to build Wuskwatim for 2019, when 16
needed for domestic service?). 17
18
Further, so long as Hydro is not excessively focused on aggressively maintaining or 19
raising near-term debt ratios, or in front-end loading recognition of Wuskwatim costs, it is 20
likely that the rate system can mostly absorb this adverse financial effect without a 21
notable increase to rates in the near-term. However, it is unlikely this project can be 22
entirely absorbed with no impact on rates over the period to 2019/20. 23
24
In completing this assessment, a number of variables need to be considered. 25
26
Need and Timing 27
28
The first matter that must be addressed is the need for Wuskwatim. This is because the 29
appropriate baseline for comparison of the Wuskwatim effects on a given year is 30
different if it is being required for domestic service than if solely serving exports. In 31
particular, if the plant is solely serving exports, then the relevant comparator on a 32
“with/without basis” is the situation absent the plant. If however the plant is serving 33
domestic ratepayers then it is not possible to do a simple “with/without” comparator as 34
there is no way to simply do “without”. 35

Manitoba Hydro
2012/14 General Rate Application
PUB/MIPUG-I-7
November 30, 2012 Page 2 of 7
At the time of the Wuskwatim Need for and Alternatives To (NFAAT) proceeding before 1
the Clean Environment Commission, Manitoba Hydro indicated that the next power 2
resource required for domestic load would be needed in 20191. Under the then current 3
planning assumptions, that plant would have been Wuskwatim. Instead the project was 4
“advanced” from a 2019 in-service date to an earlier in-service date based on a number 5
of premises, such as that: (a) this would provide more flexibility to Hydro if loads grew 6
faster than expected, (b) this would permit Wuskwatim to be placed into service at a 7
lower cost (due to inflation) and to be partially paid down by export sales in advance of 8
being needed for domestic service, and (c) this would permit Manitoba Hydro, the 9
Manitoba Government and the First Nation partners to secure earlier benefits (such as 10
jobs, water rentals) than by waiting until 2019. 11
12
In the previous GRA, Hydro confirmed in Exhibit MH-35 that the date when Wuskwatim 13
would be required for domestic service, based on the 2010/11 load forecast, remained 14
20192. 15
16
In this GRA, Manitoba Hydro has taken a very different approach to determining the data 17
for when Wuskwatim is needed. For example, in PUB/MH I-25(b) the Board asked 18
Manitoba Hydro to remove the impacts of Wuskwatim from the IFF11-2 for the years 19
2012/13 to 2015/16, to which Manitoba Hydro responded that it was not practical to 20
remove Wuskwatim as it is now required to meet firm load commitments. In MIPUG/MH 21
I-4(a) Manitoba Hydro was asked to confirm if, based on the 2011/12 Power Resource 22
Plan, Wuskwatim supply is not needed to meet domestic supply until 2019/20. Manitoba 23
Hydro rejected this notion, despite the fact that it was based on the exact same 24
mathematics as used in Hydro’s exhibit MH-35 from the previous GRA. Instead Hydro 25
indicated that the need for Wuskwatim generation has changed as load forecasts have 26
been updated and 250 MW of wind power has been purchased under Power Purchase 27
Agreements. When asked specifically in MIPUG/MH II-3(c) about the simple 28
mathematics of subtracting the Wuskwatim (1250 GWh) from the total system surplus of 29
1666 GWh in 2018/19 yielding a positive result (and therefore no “need” for Wuskwatim 30
until after that year), Hydro instead focused on the fact that without “Wuskwatim and 31
wind” there is a system deficit starting in 2011/12. It is not apparent why Hydro has 32
adopted this new approach, in contrast to exhibit MH-35 from the previous GRA, to 33
effectively package Wuskwatim and wind as a single resource. It would appear that the 34
1 http://www.cecmanitoba.ca/resource/reports/Commissioned-Reports-2004-2005-Wuskwatim_Generation_Transmission_Projects_Full_Report.pdf page 19. 2 Undertaking #22 (Exhibit MH-35) of the 2010 GRA.

Manitoba Hydro
2012/14 General Rate Application
PUB/MIPUG-I-7
November 30, 2012 Page 3 of 7
Wuskwatim and wind commitments are independent decisions and can each be 1
assessed on their own merits3. 2
3
In short, in the current GRA, it appears despite Hydro’s claims to the contrary, it is 4
reasonable to assume that Wuskwatim is not required for domestic service in the test 5
years, but remains a required resource starting approximately 2019/20. This means that 6
the reasonable comparison for Wuskwatim’s effect on ratepayers for the test years is the 7
situation with Wuskwatim (as set out in the IFF11-2) versus the situation without 8
Wuskwatim. 9
10
Impacts on Test Years 11
12
Focusing on the 2013/14 year, the best estimates available as to the costs and revenues 13
of the Wuskwatim project are set out below. It is difficult to confirm that this fully captures 14
the incremental impact of the Wuskwatim Generation and Transmission, as some values 15
solely reference “Wuskwatim” without clarity as to whether transmission is included or 16
only generation4. Further, some small impacts of the project, such as the effects of 17
financing the First Nation partner equity, or payments from the WPLP to Manitoba Hydro 18
as the General Partner, are difficult to track. 19
20
Capital cost: The total Project cost for Wuskwatim Generating Station is $1.375 21
billion, and the total cost for the Transmission Station is $0.297 billion5. The 22
Wuskwatim Generating Station was to come fully in-service by October, 20126, 23
such that it was to be in full service for the entire 2013/14 year. 24
25
OM&A: Total 2013/14 at $9.635 million per Appendix 5.6, page 7. 26
3 Further, at the CEC hearings on Wuskwatim, Manitoba Hydro was already “…currently planning to develop 250 MW of wind generation during the next ten years, providing further testing establishes that it is viable.” per page 58 of the CEC report on Wuskwatim http://www.cecmanitoba.ca/resource/reports/Commissioned-Reports-2004-2005-Wuskwatim_Generation_Transmission_Projects_Full_Report.pdf . Further: “MH indicated that it has been demonstrated that even if a wind project significantly larger than the Projects were to be adopted first, it would have a very small effect on the economics of the Projects.” At page 59-60. 4 For example, MIPUG/MH-I-16(a) asks for the depreciation expense for Wuskwatim generation and transmission. The value provided ($24.8 million) for 2013/14 is the same value reported in PUB/MH-I-134(a) for the WPLP forecasts, which would be understood to own only generation. 5 Appendix 6.1: Capital Expenditure Forecast (CEF11); p. 14. 6 PUB/MH I-39(c).

Manitoba Hydro
2012/14 General Rate Application
PUB/MIPUG-I-7
November 30, 2012 Page 4 of 7
Finance Expense: Cited at $71 million per the WPLP statements in PUB/MH-I-1
134. However, this value understates the true impact of the Wuskwatim 2
borrowings, as the WPLP partnership is structured to assume 25% of the capital 3
is provided through “equity”. In practice, Manitoba Hydro has generated no 4
incremental equity from the Wuskwatim investment to date (i.e., retained 5
earnings would have been approximately equal up to 2013/14 with or without 6
Wuskwatim) and the project has provided effectively no new cash flow sources. 7
In short, absent Wuskwatim, Hydro would have almost the exact same amount of 8
retained earnings in 2013/14 as it does in the IFF11-2 scenario, but have 9
significant less long-term debt. As an approximation of the finance cost of 10
Wuskwatim, it is necessary to adjust the $71 million to reflect the full balance of 11
the project (i.e., 100%, not 75% of debt financing), for a total finance cost of 12
approximately $95 million. 13
14
Depreciation: For 2013/14, the forecast depreciation and amortization expense 15
is cited as 24.8 million7. 16
17
Water Rentals: The WPLP statements at PUB/MH-I-134 indicate $5 million per 18
year. This may ignore small effects on generation changes on the remainder of 19
Hydro’s system, but those are expected to be small. 20
21
Capital Taxes: As per CAC/MH-I-15(a), the combined Capital Tax and Water 22
Rentals are cited as $11 million. As noted above, Water Rentals are projected at 23
$5 million, leaving $6 million as the approximate Capital Tax impact. 24
25
Total 2013/14 Cost: From the above – approximately $141 million. This ignores 26
smaller effects such as impacts on Sinking Fund balances and charges, etc. 27
28
Revenue for Wuskwatim is difficult to isolate from overall Hydro operations in the test 29
years. A good proxy however is the revenue attributed to the WPLP, which is based on 30
average prices received by Hydro on long-term export sales (for on-peak Wuskwatim 31
energy) and opportunity sales (for off-peak Wuskwatim energy). In the case of 2013/14, 32
this value is $57 million. 33
7 MIPUG/MH I-16(a).

Manitoba Hydro
2012/14 General Rate Application
PUB/MIPUG-I-7
November 30, 2012 Page 5 of 7
In sum, the one-year impacts on Manitoba Hydro’s financial position in 2013/14 from the 1
Wuskwatim project is approximately negative $83 million. Using the same approach as 2
set out above, the forecasts for the next 10 years is shown in Table 1. 3

Manitoba Hydro
2012/14 General Rate Application
PUB/MIPUG-I-7
November 30, 2012 Page 6 of 7
Table 1: Estimated Wuskwatim Operating Statement ($ Millions)8 1
2 3
8 Revenues and Water Rentals from PUB/MH I-134. OM&A for 2012/13 and 2013/14 from Appendix 5.6, page 7 with remaining years from PUB/MH I-134. Finance Expense calculated based on amounts in PUB/MH I-134 representing 75% of total expense. Depreciation and Amortization Expense from MIPUG/MH I-16(a) and PUB/MH I-134.Capital Tax for 2012/13 and 2013/14 from CAC/MH I-15(a) less Water Rentals with remaining years set equal to 2013/14.
2012/13 2013/14 2014/15 2015/16 2016/17 2017/18 2018/19 2019/20 2020/21 2021/22
REVENUESRevenue Attributed to WPLP 57 57 69 90 99 108 117 124 125 133
57 57 69 90 99 108 117 124 125 133
EXPENSES
Operating and Administrative 8 10 10 10 10 10 10 10 11 11Finance Expense 83 95 97 100 99 97 96 93 91 88Depreciation and Amortization 23 25 25 25 25 25 25 25 25 25Water Rentals and Assessment 5 5 5 5 5 5 5 5 5 5Capital Tax 5 6 6 6 6 6 6 6 6 6
124 140 143 146 144 143 142 139 137 135
Net Income (67) (83) (74) (56) (45) (35) (25) (15) (12) (2)

Manitoba Hydro
2012/14 General Rate Application
PUB/MIPUG-I-7
November 30, 2012 Page 7 of 7
In terms of the impacts on ratepayers in the near-term and the longer-term (as per 1
PUB/MIPUG-16), as shown in Table 1 above, it is reasonable to expect that Wuskwatim 2
will not contribute positively to domestic ratepayers until approximately 2021, roughly the 3
same time frame that it is started to be required for domestic service. During this time 4
frame the adverse impact on retained earnings could be as high as $400 million as per 5
the net losses in Table 1. Also note that Table 1 does not take into account cumulative 6
debt impacts from any cash shortfalls in the years noted. 7
8
Shortly after the years shown in Table 1, it can be expected that Wuskwatim would begin 9
making a positive contribution to net income. Retained earnings will remain lower than 10
they would have been absent Wuskwatim for a longer-term period of time, until the $400 11
million in net losses from the early years has been fully offset. 12


Manitoba Hydro
2012/14 General Rate Application
PUB/MIPUG-I-8
November 30, 2012 Page 1 of 5
REFERENCE: Page 2-9, 3-3 The Role of Reserve – Equity Levels 1
2
QUESTION: 3
4
a) Please provide Mr. Bowman’s understanding of the position of Credit Rating 5
Agencies (in the current market environment) in the evaluation of MH and what 6
considerations are made by those Credit Rating Agencies related to MH’s equity 7
balances. 8
9
b) Please provide the historic and current debt to equity ratios of other Crown-10
owned utilities, including those who have operated for an extended period of time 11
with little or no equity. For each of the crown-owned utilities quantify the major 12
capital projects and the years such projects were undertaken. 13
14
c) Please provide Mr. Bowman’s perspective and supporting calculations on what 15
the cost of a five-year drought will be in 2022, 2027 and 2032 and comment on 16
the adequacy of retained earnings at those dates. 17
18
ANSWER: 19
20
(a) 21
22
Mr. Bowman does not have any direct experience working with Credit Rating Agencies. 23
Mr. Bowman’s only experience with the perspectives of these agencies is evidence 24
provided by utilities and financial experts, including Manitoba Hydro, in past GRA 25
proceedings. 26
27
Mr. Bowman understands that the primary concern of the agencies is the expectation of 28
a borrower being able to fulfill their debt interest payment and principal repayment in full 29
and on time. In the 2004 GRA, Hydro’s witnesses stated that “they (Credit Rating 30
Agencies) understand that drought is a part of our business and we were able to satisfy 31
them that we will recover from that drought” (June 22, 2004, p. 903, lines 17-19). In 2004 32
Hydro’s debt:equity ratio was 87:13 (Manitoba Hydro 2011/12 Annual Report, p. 86). 33
Since the 2004 GRA, Manitoba Hydro reached a 75:25 debt:equity ratio ahead of its 34
2011/12 target. 35

Manitoba Hydro
2012/14 General Rate Application
PUB/MIPUG-I-8
November 30, 2012 Page 2 of 5
Further, in the 2004 GRA, Hydro’s witnesses stated that bond rating agencies take 1
comfort in the fact that Hydro could raise additional money through rate increases, “(W)e 2
do know that the bond rating agencies take a very close look at Manitoba Hydro and 3
have always taken comfort from the fact that Manitoba Hydro has the lowest rates in 4
North America and therefore has the capacity to increase rates should that need occur in 5
the future” (June 15, 2004, transcript p. 352, lines 15-20). 6
7
In the 2010/12 GRA, Hydro’s witnesses commented on MH’s debt:equity ratio which 8
reached 94:6 in 1992 as Limestone was coming into service. The Hydro panel stated, 9
“Similar to where we are today, 75:25 is a much stronger debt-equity ratio, but we still 10
look to the future to see whether that will be going up or down, and the direction we – 11
whether we’re going to be as strong as we are today in the future” (January 7, 2011, p. 12
1098, lines 15-20). Hydro’s witnesses went on to note that during times of capital 13
expansion, it is expected that there will be a deterioration in the debt:equity ratio. 14
Further, in light of Hydro’s capital investment plan, witnesses stated, “…we review our 15
capital plans with the rating agencies. They are aware that the ratios will weaken during 16
the decade of investment. They understand why we’re doing it. They understand that we 17
have a solid business plan are accepting of that” (March 21, 2011, p. 4456, lines 5-10). 18
19
In short, it is Mr. Bowman’s understanding that Credit Rating agencies review Manitoba 20
Hydro’s equity balances, and that the primary consideration is the ability of the 21
corporation to cover its risks, recover from adverse events, and fulfill all required 22
payments on debt (including through raising rates if needed). 23
24
(b) 25
26
Examples of Crown utilities that have operated with very little to no “equity” for extended 27
periods of time include Manitoba Hydro, NB Power and Newfoundland and Labrador 28
Hydro. 29
30
For Manitoba Hydro, the utility operated with 4-6% equity ratios from 1984 to 19931. NB 31
Power’s debt ratios are set out in the below table back to 1996/97. 32
1 See MIPUG Exhibit 12 from the 2010 GRA, Tab 1B, page 2.

Manitoba Hydro
2012/14 General Rate Application
PUB/MIPUG-I-8
November 30, 2012 Page 3 of 5
Table 1: Debt Level of NB Power by Year2 1
2 3
For Newfoundland and Labrador Hydro (NLH) the utility had a debt:equity ratio of 97:03 4
in the late 1970s, increasing by 1989 to 83:173.By the time of the 2002 test year, NLH’s 5
debt ratio remained at 83:17, expected to increase to 82:18 by 20054. 6
7
It is important to note that Mr. Bowman is not advocating that Manitoba Hydro operate 8
with little to no reserves. The section referenced was simply noting that the entire 9
premise for Hydro maintaining some form of financial protection (“equity” or “retained 10
earnings” or “reserves”) is premised on the benefits these reserves provide to ratepayers 11
in the form of protection from major rate increases when adverse events (such as 12
droughts) occur and not on financial market considerations, for example. In particular, a 13
lower level of equity does not inherently put bondholders at risk, so long as Hydro can 14
ensure prompt payment based on (a) power rates are sufficiently low that they can be 15
raised when adverse events occur without massively collapsing the demand, or (b) 16 2 NB Power Ratios: 1996/97 - 1998/99 from 1999/2000 Annual Report; 1999/00 - 2001/02 from 2001/2002 Annual Report; 2002/03 - 2004/05 from 2004/2005 Annual Report; 2004/05 - 2008/09 from 2008/09 Statistical Overview Tables; 2009/10 from 2010/2011 Annual Report; and 2010/11 - 2011/12 from 2011/2012 Annual Report. A deferred charge or write-off of $450 million was recorded in 1998/99. The Corporation’s debt decreased by $204 million in 2004/05 due to the net reduction of debt from financial reorganization of NB Power and principal repayments made during the year, offset by a new debt issue to fund capital spending at Coleson Cove Generating Station. (2004/05 Annual Report, page 26) 3 Board of Commissioners of Public Utilities, Report on a Referral by Newfoundland and Labrador Hydro for Proposed Rates to be Charged to Newfoundland Light and Power Co. Limited, 1990-1992. Page 55. 4 http://www.pub.nf.ca/hyd01gra/order/pu7-03.pdf; page 43.
Year Debt (%)1996/1997 891997/1998 891998/1999 1001999/2000 1032000/2001 1062001/2002 1052002/2003 1062003/2004 1062004/2005 962005/2006 932006/2007 932007/2008 912008/2009 932009/2010 952010/2011 942011/2012 91
NB Power

Manitoba Hydro
2012/14 General Rate Application
PUB/MIPUG-I-8
November 30, 2012 Page 4 of 5
Hydro is able to access financial markets, or (c) the bondholders have recourse to the 1
provincial government – all three of which exist today (and ratepayers pay a substantial 2
annual debt guarantee fee for this privilege). Similarly a low level of equity for Hydro 3
does not put the provincial government at risk of payouts when Hydro’s long-term 4
financial picture remains positive and periodic events such as droughts are generally 5
offset in future by events such as higher water. The main benefactor of higher equity 6
levels is in fact ratepayers, but then only when levels are sufficiently high to help aid in 7
rate stability (and not higher). 8
9
(c) 10
11
It is difficult for Mr. Bowman to fully model an IFF scenario for the noted events. In order 12
to be responsive, Mr. Bowman has prepared the following analysis. 13
14
The latest estimates of a five-year drought occurring later in the IFF horizon were 15
provided by Manitoba Hydro in the previous GRA, via the KPMG report and 16
Appendices5. 17
18
It is important to note at the outset that Hydro has effectively decreased its forecast 19
drought costs by 33%6 in the near-term, to 45% in the long-term7 since IFF09-1. As a 20
result all values from the KPMG report would need to be reduced by this approximate 21
amount. 22
23
The costs for a five year drought commencing in 2011, 2013, 2019 and 2025 were 24
provided in Appendix J. The drought costs for a five-year drought beginning in 2019 or 25
2025 provide the most relevant comparisons the future comparisons. 26
27
Drought Commencing in 2019: The Five Year Drought Sale Scenario 2 assumed a 28
recurrence of the worst five year drought on record (1937 to 1941) commencing in 2019, 29
coinciding with the in service date for Keeyask and the construction stage of Conawapa. 30
It assumed a return to average revenues for all 94 flow conditions the period preceding 31
and following the drought period (and in this sense was pessimistic, as the average 32
already includes the probabilities of droughts). Five year drought impacts for then 33
expected prices were $3.752 billion excluding financing costs (p. J-5). Using the lowest 34
5 Manitoba Hydro – External Quality Review Main Report dated April 15, 2010 was provided as Exhibit #MH-4-7. 6 2010/12 GRA, Tab 9, page 25 and 2012/14 GRA, Tab 8, page 19. 7 PUB/MH-I-33(c) shows the worst one year drought impacts for 2030. The IFF09-1 bar shows a net loss of approximately $2.25 billion as compared to IFF 11-2 of approximately $1.8 billion.

Manitoba Hydro
2012/14 General Rate Application
PUB/MIPUG-I-8
November 30, 2012 Page 5 of 5
of the export price scaling factors from above (33%), this would equate to a $2.5 billion 1
reduction in financial performance. As compared to the current IFF11-2, Hydro projects 2
to enter that specified drought period with approximately $2.7 billion in retained earnings, 3
and over the 5 year period expects to secure a further $0.6 billion in net income. As a 4
result, based on current projections, Hydro would end this drought with approximately 5
$0.8 billion in retained earnings (and as high as $1.0 billion if assumptions regarding full 6
DSM write-offs in IFF11-2 do not come to pass). Without additional rate increases 7
beyond those projected in IFF11-2, the $2.7 billion in retained earnings would be re-8
achieved within approximately 4 years of the end of the drought8. 9
10
Drought Commencing in 2025: The Five Year Drought Sale Scenario 3 assumed a 11
recurrence of the worst five year drought on record (1937 to 1941) commencing in 2025, 12
coinciding with the in service date of Conawapa. Similar to the above, it assumed a 13
return to average revenues for all 94 flow conditions the period preceding and following 14
the drought period. Drought impacts for then expected prices were $5.156 billion (p. J-5). 15
As above, this would equate to $3.5 billion in net impacts at updated pricing. Based on 16
IFF11-2, Hydro would enter this drought with $3.7 billion in retained earnings, and 17
project a further $2.4 billion in net income over the period. As a result, the projected 18
retained earnings at the end of the drought would be $2.6 billion based on IFF11-2 19
assumptions. Without additional rate increases beyond those projected in IFF11-2, the 20
$3.7 billion in retained earnings would be re-achieved within less than 2 years of the end 21
of the drought. 22
23
In each case, it would appear that the retained earnings expected are more than 24
sufficient for the protections desired. 25
8 2025/26 to 2028/29.


Manitoba Hydro
2012/14 General Rate Application
PUB/MIPUG-I-10
November 30, 2012 Page 1 of 1
REFERENCE: Section 4.0 Pg. 4-1 Ln 8 1
2
QUESTION: 3
4
a) Please comment on and quantify the impact of the change in MH’s financial 5
targets since 2007. 6
7
ANSWER: 8
9
(a) 10
11
Manitoba Hydro’s financial targets were last changed in 2007. No changes to the targets 12
have been approved since 2007 (PUB Order 5/12, p. 109). 13
14
In the response to PUB/MH-I-133(c), Manitoba Hydro indicated that its financial targets 15
are currently under review. Hydro indicated that the results of the review will be 16
presented to the Manitoba Hydro Board in conjunction with the presentation of IFF12, 17
which is expected to be presented in November 2012. 18
19
If any changes to the financial targets are adopted, Mr. Bowman will provide comments 20
as part of the response to PUB/MIPUG-I-9, after review of IFF12. 21


Manitoba Hydro
2012/14 General Rate Application
PUB/MIPUG-I-11
November 30, 2012 Page 1 of 6
REFERENCE: Pages 4-2 & 4-7 Section 5.0 1
Level of Rates and Rate Options; Test Years Adjusted IFF 2
3
QUESTION: 4
5
a) Please provide a table for each of the two test years including a column 6
containing the IFF11-2 (income statement and retained earnings) as filed; a 7
column which reflects detail of all adjustments that MIPUG suggests need not be 8
made; a column that identifies adjustments that MIPUG suggests that can be 9
deferred to other years; and a column with the resulting adjusted IFF. 10
11
b) Please comment on the rate implications of the adjusted IFF in (a) for the test 12
years and for the subsequent “15 sustained years of massive capital investment”. 13
14
c) Please provide Mr. Bowman’s schedule of a “status quo utility” IFF for the test 15
years and beyond, with all major assumptions detailed. 16
17
ANSWER: 18
19
(a) and (b) 20
21
Table 1 below shows the Electric Operations Projected Operating Statement for the 22
years 2011/12 to 2015/16 adjusted for the proposed changes proposed by Mr. Bowman 23
in the Pre-filed Testimony on pages 1-5 and 1-6. 24
25
Note that it is difficult for any party other than Hydro to model the intricacies of some 26
aspects of the IFF; however, at a coarse level the attached table gives a good 27
approximation of the effects of the recommendations. 28
29
Table 1 below does not yet complete any quantified adjustment for Mr. Bowman’s 30
recommendations on Hydro’s continued need to focus on containing operating cost 31
escalation and normal capital spending, nor for potential adjustments to asset lives as 32
noted at page 4-14 to 4-15 of the pre-filed testimony. 33

Manitoba Hydro
2012/14 General Rate Application
PUB/MIPUG-I-11
November 30, 2012 Page 2 of 6
Table 1: Electric Operations Projected Operating Statement Adjusted for 1
Initial Recommendations based on IFF 11-2 ($ Millions)1 2
3
1 Reduction of 1% Rate Deferral as per PUB/MH I-1 and MIPUG/MH I-20(c) where the 2012/13 first quarter balance is multiplied by four as an estimate for the total year and all subsequent years are set equal. Reduction to Additional rates calculated as a reduction from Manitoba Hydro proposed cumulative increase of 8.16% in MH11-2 to 4.5%. Interest Expense calculated as difference between MH and MIPUG net revenues multiplied by CAD dollar Long-term debt rate on page 7 of IFF11-2 where 2015/16 is set equal to the 2014/15 amount. Changes to OM&A and Depreciation and Amortization from PUB/MH I-42.Adjusted Equity calculated as Retained Earnings from IFF11-2 less difference between Manitoba Hydro and MIPUG proposed Net Income, less the deduction of Power Smart Write-Off in 2013/14 as per PUB/MH I-42, does not include AOCI, Does not include Long-Term debt from Keeyask and Conawapa calculated from CEF11 (page 2) Total Spending less all remaining spending to incur after the year in question. Proposed Net Income with Potential Increased Water flow adds $32 million to 2012/13 as explained in IFF11-2 pg. 3.
REVENUES
2012 2013 2014 2015 2016Manitoba Hydro Proposed General Consumer at approved rates 1,186 1,290 1,294 1,306 1,313
1% Rate Deferral Reinstated (26) MIPUG Proposed General Consumer at Approved Rates 1,186 1,264 1,294 1,306 1,313 Manitoba Hydro Proposed Additional - 45 106 156 208
Reduced by 3.5% from 2014 onward for not approved rate adjustment in 2013/14 - - (45) (46) (46) MIPUG Proposed Additional* Rates - 45 61 110 162 Extraprovincial 363 341 363 394 469Other 7 16 16 16 17
1556 1666 1734 1826 1961
EXPENSES
Manitoba Hydro Proposed Operating and Administrative 398 447 532 542 548Less Change in Capitalized Overhead (56) (58) (59) (60) Less IFRS Changes - DSM - - (32) (29) (29) Less IFRS Changes - Admin and General - - (36) (37) (37)
MIPUG Proposed Operating and Administrative 398 391 406 417 422 Manitoba Hydro Proposed Finance Expense 385 440 452 504 537
Add Interest Expense Adjustment for difference from MH proposed Revenues - 1 3 6 8MIPUG Proposed Finance Expense 385 441 455 510 545 Manitoba Hydro Proposed Depreciation and Amortization 353 401 354 358 375
Less Reduction in Amortization of Rate Regulated Assets - - 37 39 40Less Administrative and General Overhead Capitalized (CGAAPS and IFRS) - - 1 3 4 Less Change to Equal Life Group Depreciation Method - - (32) (33) (35) Less Early Adoption of Net Salvage (53)
MIPUG Proposed Depreciation and Amortization 353 348 360 367 384
Water Rentals and Assessments 119 106 112 113 113Fuel and Power Purchased 146 182 158 187 193Capital and Other Taxes 82 87 92 99 107Corporate Allocation 9 9 8 8 8
1,492 1,564 1,591 1,701 1,772
Non-controlling Interest 0 (1) (1) (1) (2)
Manitoba Hydro Proposed Net Income 64 19 70 60 124Increase (Decrease) from Proposed Changes 0 82 72 65 63
MIPUG Proposed Net Income 64 101 142 125 187
MIPUG Proposed Net Income with Potential Increased Water Flows 64 133 142 125 187
*Additional General Consumer Revenue
Percent Increase (as per Rate Outcome point 1 - finalize rates at current levels) 0.00% 3.57% 0.00% 3.50% 3.50%Cumulative Percent Increase 0.00% 4.50% 4.50% 8.16% 11.94%
Manitoba Hydro Proposed Equity Ratio 25% 24% 18% 16% 15%MIPUG Proposed Adjusted Equity Ratio 26% 25% 24% 23% 23%

Manitoba Hydro
2012/14 General Rate Application
PUB/MIPUG-I-11
November 30, 2012 Page 3 of 6
Table 2 below shows Mr. Bowman’s proposed changes to Electric Retained Earnings 1
and Table 3 uses the Adjusted Electric Retained Earnings to calculate the Debt Ratio for 2
the forecast years 2011/12 to 2015/16. 3
4
Table 2: Proposed Electric Retained Earnings for Forecast Years 2011/12 to 5
2015/16 ($ Millions)2 6
7 8
The adjustments not included to Retained Earnings that Manitoba Hydro has proposed 9
for 2013/14 as a result of IFRS conversion include: 10
11
Write Off to Power Smart Programs of $183 million; 12
13
Write Off to Regulatory Costs of $2 million; 14
15
Write Off to Administrative Overhead of $36 million; and 16
17
Change to Equal Life Group Depreciation Write Off of $31 million. 18
19
Mr. Bowman also proposes to adopt the removal of net salvage in 2012/13 as per page 20
1-6 of the Pre-Filed Testimony. 21
2 2011/12 Retained Earnings Amount from IFF11-2 page 33. Adjustments that MIPUG agrees with deducted from Retained Earnings as per PUB/MH I-42. MIPUG Proposed Net Income from Table 1 above.
Fiscal Year
Ended
Opening Electric
Retained Earnings
IFRS Write Off to Site
Remediation
IFRS Write Off to Acquisition
(Centra & Manitoba
Hydro)
IFRS Write Off for
Employee Benefits
MIPUG Proposed
Net Income
Adjusted Electric
Retained Earnings
2012 2,391 64 2,455
2013 2,455 101 2,556
2014 2,556 (36) (20) (22) 142 2,620
2015 2,620 125 2,745
2016 2,745 187 2,931

Manitoba Hydro
2012/14 General Rate Application
PUB/MIPUG-I-11
November 30, 2012 Page 4 of 6
Table 3: Adjusted Electric Operations Debt Ratio Calculation ($ Millions)3 1
2
3 Debt - Equity Calculation from MIPUG/MH I-11(c). Adjusted Retained Earnings from Table 2 above. Keeyask and Conawapa Capital Spending to Date Calculated from CEF11 (page 2) as Total Project Costs less costs not yet incurred.
A B C D E F G = D - E - F H I J(G+H+I+J)/(A+B+C+
G+H+I+J)
Fiscal Year
Ended
Adjusted Retained Earnings
Contributions in Aid Construction
Non-Controlling
InterestLong-Term
Debt
Keeyask Capital
Spending To Date
Conawapa Capital
Spending To Date
Adjusted Long-Term
DebtSinking Fund Investment Short-Term Debt
Short-Term Investments
Debt Ratio w/ Retained Earnings Deduction and no
AOCI
2012 2,455 318 100 9,382 590 306 8,486 (372) - (50) 0.74
2013 2,556 332 - 10,295 754 411 9,130 (327) 41 - 0.75
2014 2,620 345 - 11,140 952 477 9,711 (137) 58 - 0.76
2015 2,745 352 - 12,498 1,353 545 10,600 (160) 8 - 0.77
2016 2,931 359 - 14,214 2,016 733 11,465 (325) - (98) 0.77

Manitoba Hydro
2012/14 General Rate Application
PUB/MIPUG-I-11
November 30, 2012 Page 5 of 6
The implications of the above adjusted scenario is that Hydro maintains a net income 1
greater than forecast in the IFF11-2, while rate levels for customers are reduced. The 2
cost levels better track the assets in service, and there is also recognition in the 3
debt:equity calculation that Bipole III is expected to be in service for domestic ratepayer 4
benefits in the next few years following this scenario (i.e., Bipole III spending is not 5
removed from the debt:equity calculation above). 6
7
This approach reasonably reflects continuity with Hydro’s forecasts over the last decade 8
as to capitalization approaches, and ensure current domestic ratepayers are not 9
burdened by capital costs associated with plant not yet in service (i.e., Conawapa and 10
Keeyask) at the same time that finances are challenged by the effects of Wuskwatim 11
coming on-line. 12
13
Given the higher overall equity levels, this approach also better positions Hydro for the 14
capital investment over the coming 15 years, and provides the opportunity to have the 15
costs that are properly associated with Conawapa and Keeyask be aggregated into the 16
overall project costs, for future amortization/depreciation once those projects are in 17
service and providing long-lived value to ratepayers. 18
19
(c) 20
21
Mr. Bowman does not have the information required to prepare an IFF for a “status quo” 22
perspective on Manitoba Hydro. A reasonable approach to such a forecast would be to 23
provide an IFF that reflects the simplest set of planning assumptions available to MH – 24
likely a mixture of SCCT and CCCTs being constructed as required for capacity and 25
energy shortfall purposes in the year in which shortfalls arise (other than capacity and 26
energy being made available from base case DSM and committed resources) or 27
alternatively the least cost new hydraulic generation planning sequence. This simple 28
baseline IFF would then become the main basis for rate regulation prior to specific new 29
capital-intensive resources being committed (e.g., receiving the necessary approvals 30
such as an Order-in-Council or some other milestone decisions confirming a very high 31
likelihood of the project proceeding). 32
33
When the time comes for major new project assessment, such as for the NFAAT, 34
Manitoba Hydro can provide data that is contrasted to this simple IFF, looking at an IFF 35
scenario that includes the optional but recommended plans comprised of larger capital 36
cost commitments and other attendant changes to the baseline IFF. This is generally 37

Manitoba Hydro
2012/14 General Rate Application
PUB/MIPUG-I-11
November 30, 2012 Page 6 of 6
similar to what was done in the Wuskwatim NFAAT hearing, where a baseline IFF 1
consisting of Wuskwatim 2020 was compared to an “advancement” scenario with 2
Wuskwatim in-service for 2009. 3

Manitoba Hydro
2012/14 General Rate Application
PUB/MIPUG-I-12
November 30, 2012 Page 1 of 2
REFERENCE: Page 4-9 Ln 8 1
Accounting Changes 2
3
QUESTION: 4
5
a) Should the overhead costs determined not to meet capitalization criteria under 6
IFRS continue to be deferred for rate-setting purposes once IFRS is 7
implemented? If so, on what basis should those costs be capitalized? 8
9
b) Does Mr. Bowman propose that MH not implement IFRS compliant accounting 10
policies when IFRS is implemented? 11
12
ANSWER: 13
14
(a) 15
16
In fulfilling its legislatively-defined role, the Board must make a determination as to the 17
fairness and reasonableness of charging each item of costs through today’s rates. In the 18
event the Board agrees that it is not reasonable to include these costs in current OM&A, 19
but rather concludes that it is appropriate to include these costs with the costs of capital 20
projects (as recommended by Mr. Bowman), then at one level it is irrelevant whether the 21
International Accounting Standards Board in London England concludes otherwise – put 22
simply, rates ought not include these costs today. The IASB has no role or obligations 23
under the Manitoba legislation. 24
25
The Board should determine which costs are appropriately capitalized for the purposes 26
of setting rates, and on the basis of this determination these costs should not be 27
included in current period costs for the purposes of setting rates, but rather in future 28
costs (via being included in the regulatory capital cost of a project). 29
30
If IFRS is determined to provide no option but to reflect capital-related costs in the 31
current period, at the same time the Board has determined, under its legislatively defined 32
role, that the same costs should not be in current rates, the Board should continue to 33
use its own determinations, not IFRS. 34
35
To use a specific example, as shown in Figure 4-2 of Mr. Bowman’s evidence, at page 36
4-5, Hydro has added 800 employees from 2007/08 to 2013/14 (forecast). Note also that 37

Manitoba Hydro
2012/14 General Rate Application
PUB/MIPUG-I-12
November 30, 2012 Page 2 of 2
this follows a further period of adding employees leading up to 2007/08 (over 1,000 1
since 2004). The Board has previously noted that most of these positions relate to major 2
capital. However, as noted in PUB/MIPUG-15, it appears Hydro plans on capitalizing 3
less employees in the test years than it was in 2007/08. Further, on overheads, there is 4
an indisputable indirect cost associated with carrying 1,000 extra employees in terms of 5
office space, human resource functions, information technology, and many other areas. 6
Absent planning for major new projects, none of which are in-service today, and some of 7
which will not be required for service to domestic ratepayers for many, many years, 8
these costs would not have to be incurred (e.g., less office space, smaller human 9
resources department, etc.). 10
11
Hydro’s response to CAC/MH I-36(g) also notes that for a number of Canadian 12
jurisdictions (including BC, Alberta, Ontario, Newfoundland) the regulators have adopted 13
measures to ensure the more onerous effects of IFRS accounting do not become driving 14
factors in setting rates, and notes that many utilities have in fact rejected IFRS entirely 15
where the option exists to use US GAAP which, permits regulatory accounting 16
(unfortunately the approach used by these other utilities is often linked to their traded 17
securities, which is not an option available to Manitoba Hydro – note however that it 18
appears Ontario Power Generation and Hydro One have both elected to transition to US 19
GAAP rather than IFRS1, but it is not known what permissions were required for these 20
non-traded companies to use this option). 21
22
(b) 23
24
Mr. Bowman’s evidence does not contain specific recommendations on whether 25
Manitoba Hydro should convert to IFRS for financial reporting, or seek other alternatives. 26
27
It is clear that many utilities, including some in similar positions to Manitoba Hydro, have 28
pursued other alternatives. It is also clear that where such alternatives have been 29
secured, the situation with respect to rate regulation (i.e., retention of regulatory assets) 30
has been made easier. However, none of Mr. Bowman’s recommendations for rate-31
setting are premised on Manitoba Hydro securing such an alternative for its own 32
financial reporting. 33
1http://www.opg.com/about/reg/filings/AccountingOrders/files/OPG_APPL_AO_US%20GAAP_20111229.pdf.

Manitoba Hydro
2012/14 General Rate Application
PUB/MIPUG-I-13
November 30, 2012 Page 1 of 3
REFERENCE: Section 4.1, Pg. 4-4 to 4-7 1
Staffing Levels 2
3
QUESTION: 4
5
a) Please provide the comparable staffing levels for BC Hydro for the years 2004 to 6
2012. 7
8
b) Please indicate the staffing levels per customer and per GWh of energy for MH 9
and for BC Hydro. 10
11
ANSWER: 12
13
(a) and (b) 14
15
Table 1 below shows the FTE (full-time equivalent also known as “EFT”) numbers for BC 16
Hydro (net of subsidiaries) for 2006/07 to 2011/12. This data is largely drawn from the 17
2011 and 2012 Annual Reports. Before 2006/07, BC Hydro subsidiary employment was 18
included and a headcount method of reporting was used so it is not comparable to 19
Manitoba Hydro calculations, which used the full-time equivalent method in those years. 20
Additionally, British Columbia Transmission Corporation (BCTC) was re-integrated back 21
into the BC Hydro Corporation for Fiscal 2011. Before this it was a separate entity. For 22
comparison purposes the Number of Employees (including full-time and temporary) from 23
the BCTC 2010 Annual Report are included. While this headcount approach is not exact 24
to the FTE calculation1 it provides a reasonable estimation. 25
26
Table 1: BC Hydro and BCTC Actual FTE and Number of Employees2 27
28
1 Note: BC Hydro changed their FTE calculation from 1 FTE = 1,537.5 labour hours to 1 FTE = 1,566 labour hours in the F2012 to F2014 Revenue Requirement Application. By comparison, Manitoba Hydro uses 1,916 hours per year in to represent one EFT as per MIPUG/MH I-29(b). It is not clear how “labour hours” in BC compares to “hours per year” in Manitoba. 2 BC Hydro FTE from 2011 and 2012 Annual Reports (page 87 and 93 respectively). BCTC from 2010 Annual Report. BCTC Number of Employees Includes Full-Time and Temporary Employees. 2010/11 and 2011/12 BC Hydro FTE includes BCTC FTEs.
2006/07 2007/08 2008/09 2009/10 2010/11 2011/12BC Hydro FTE 4,163 4,677 5,417 5,687 5,805 5,875 BCTC Number of Employees 397 424 448 474 Total FTE/Employees 4,560 5,101 5,865 6,161 5,805 5,875

Manitoba Hydro
2012/14 General Rate Application
PUB/MIPUG-I-13
November 30, 2012 Page 2 of 3
Also note that a considerable portion of BC Hydro’s business services are outsourced to 1
a third party firm (Accenture) which results in a substantial number of FTE equivalent 2
services (originally 1540 employees3) not showing up in BC Hydro’s employee numbers. 3
These employees are not included in the above Table 1. 4
5
The most reliable recently compared analysis of BC Hydro and Manitoba Hydro was 6
prepared by the BC Hydro Review panel in June 2011, as they had ready access to both 7
BC Hydro and related Accenture data. Their comparison of the GW.h produced per FTE 8
is shown in Figure 1 below, which was provided as Figure 2.2.5 in their report4. 9
10
Figure 1: GW.h Produced per FTE for BC Hydro, Manitoba Hydro and Hydro 11
Quebec – per the BC Hydro Review Panel 12
13 14
As shown in Figure 1 above, the energy produced per FTE has remained relatively 15
constant at Hydro Quebec over the period 2006-2010, but has declined for both BC 16
Hydro and Manitoba Hydro. In this metric, lower or declining values reflect lower 17
performance. The BC Hydro values are understood to be prior to the panel’s 18
recommendation to reduce staffing by over 1000 positions. 19
3 http://www.llbc.leg.bc.ca/public/pubdocs/bcdocs/359905/backgrounder.pdf. 4 http://www.newsroom.gov.bc.ca/downloads/bchydroreview.pdf.

Manitoba Hydro
2012/14 General Rate Application
PUB/MIPUG-I-13
November 30, 2012 Page 3 of 3
In terms of employees per customer, it is assumed that the values in Table 1 must be 1
increased by approximately 1540 to yield the full BC Hydro complement equivalent to 2
Manitoba Hydro (due to the Accenture outsourcing). Table 2 below compares staffing 3
levels for BC Hydro (with and without the Accenture employees) and Manitoba Hydro on 4
a per customer basis. Staffing levels for Manitoba Hydro includes standard time and 5
overtime as per their response to PUB/MH II-48(a). 6
7
Table 2: Comparison of Manitoba Hydro and BC Hydro EFTs per Domestic 8
Customer5 9
10 11
Customer data used in the Table 2 comparison is provided in Table 3 below. 12
13
Table 3: BC Hydro and Manitoba Hydro Customer Numbers used in FTE 14
Calculations6 15
16
5 EFTs from Manitoba Hydro as per PUB/MH II-48(a). BC Hydro FTEs as per part (a) above. 6 Customer numbers from Manitoba Hydro as per PUB/MH II-48(a). Customer numbers for BC Hydro as per from 2011 and 2012 BC Hydro Annual Reports (page 86 and 92 respectfully).
2007 2008 2009 2010 2011 2012
Manitoba Hydro 0.0116 0.0116 0.0119 0.0121 0.0123 0.0122 BC Hydro with Accenture 0.0035 0.0038 0.0041 0.0042 0.0040 0.0040 BC Hydro without Accenture 0.0026 0.0029 0.0033 0.0034 0.0031 0.0031
2007 2008 2009 2010 2011 2012
CustomersManitoba Hydro 516,861 521,599 527,472 532,359 537,299 542,681BC Hydro 1,736,987 1,767,194 1,801,328 1,830,985 1,853,406 1,873,155


Manitoba Hydro
2012/14 General Rate Application
PUB/MIPUG-I-14
November 30, 2012 Page 1 of 2
REFERENCE: Pg. 4-7 1
Net Salvage Costs 2
3
QUESTION: 4
5
a) Please indicate which hydro electric utilities have adopted the approach of 6
removing Net Salvage Cost from depreciation rates. 7
8
b) Please elaborate on the differences between the impacts of this accounting 9
policy on a hydro versus thermal generation facility. 10
11
ANSWER: 12
13
(a) 14
15
Please see Table C-1 at page C-3 of Mr. Bowman’s pre-filed testimony. The following 16
are utilities where Mr. Bowman is aware that there are no net salvage amounts or 17
“Future Removal and Site Restoration” amounts accrued: 18
19
• Yukon Energy: No further net salvage amounts are built into rates since 20051. 20
Amounts set aside prior to 2005 continue to be used to fund ongoing removals. 21
22
• Qulliq Energy: All net salvage accounts have been terminated2 as of 2011. 23
24
• BC Hydro: No further amounts are set aside from rates for net salvage3. 25
Amounts set aside prior to the implementation of this change in the early 2000s 26
continue to be used to fund ongoing removals4. 27
28
• Newfoundland Hydro: No amounts are set aside for net salvage or future 29
removal costs5. 30
1 http://yukonutilitiesboard.yk.ca/pdf/109_boardorder2005_12.pdf at Item 18.
2 http://www.nunavutpower.com/home/index.php?option=com_docman&task=doc_download&gid=868 at page 33, item
3(e). 3 Except in the limited cases of specific Asset Retirement Obligations.
4 http://www.bchydro.com/etc/medialib/internet/documents/annual_report/2012_BCH_AnnualReport.Par.0001.File.2012-
BCH-Annual-Report.pdf at page 67. 5 http://www.pub.nf.ca/applications/NLH2012Depreciation/files/reports/IC-ExpertReport-Oct3-12.pdf at page 5.

Manitoba Hydro
2012/14 General Rate Application
PUB/MIPUG-I-14
November 30, 2012 Page 2 of 2
(b) 1
2
The concept of future removal and site restoration costs are generally more tangible and 3
relevant to a thermal generation facility than a hydro generation facility for a number of 4
reasons: 5
6
1) The retirement dates for hydro facilities can be very far into the future, making it 7
very subjective to develop removal cost estimates. Thermal plants, or major 8
components of the plants, typically have shorter lives and relatively tangible 9
retirement costs, such as the restoration and rehabilitation of a coal storage area, 10
or final closure of ash lagoons. 11
12
2) Hydro facilities are typically constructed at sites that have favourable geographic 13
conditions that are not found in many locations. As a result, total hydro plant 14
removal and site abandonment is very rare, particularly in Canada and for major 15
hydro facilities. In contrast, thermal plants are subject to retirement and 16
abandonment of parts of the local generating station site, and occasionally to the 17
full thermal generating complex. 18
19
3) Where there will be aspects of hydro plant facility removal (such as the planned 20
Pointe du Bois spillway project), the project will also typically entail a rebuilding of 21
a new asset on the same general site, so it is very hard to properly disentangle 22
the costs of taking down the old asset versus constructing the new asset (this is 23
also true of transmission and even major components of the distribution system). 24
Further, the costs of constructing the new asset are often materially aided by the 25
presence of the old asset (such as site preparation, clearing, existing access, 26
etc) such that the old asset in effect continues to provide ongoing value to the 27
new project. As such the cost of the new project can readily incorporate many of 28
the overall project costs that are “common” to both parts, and are not specifically 29
and directly linked to simple removal and disposal of the old asset. 30

Manitoba Hydro
2012/14 General Rate Application
PUB/MIPUG-I-15
November 30, 2012 Page 1 of 3
REFERENCE: Section 4.2.1, Pg. 4-10 Ln 24 1
2
QUESTION: 3
4
a) Please elaborate on how Mr. Bowman reached the conclusion that MH has “in 5
practice” not capitalized the EFT additions since 2004. 6
7
ANSWER: 8
9
(a) 10
11
Please see Figure 1 below which sets out how Mr. Bowman concluded that ‘MH has in 12
practice not capitalized the EFT additions since 2004’. Figure 1 includes Hydro’s data for 13
all columns up to 2013/14 forecast, and calculated data for 2013/14 “adjusted” as 14
described below. Based on this analysis, the 2013/14 Adjusted Calculation shows 15
capitalized EFTs at 2,194 which is the lowest level since the 2004/05 year where 16
Capitalized EFTs was 2,1351. In short, in practice all employees added since 2004/05 17
are effectively being included in annual OM&A in the test years, rather than capital. 18
1 PUB/MH II-49(a) of the 2012 GRA.

Manitoba Hydro
2012/14 General Rate Application
PUB/MIPUG-I-15
November 30, 2012 Page 2 of 3
Figure 1: Capitalized and Uncapitalized EFT 2007/08 to 2013/14 with Adjusted 1
2013/14 for changes to Capitalization2 2
3 4
The value for 2013/14 Forecast (per MH; 2825 employees capitalized) is based on the 5
capitalization ratio prior to the proposed IFRS changes, as follows: 6
7
In PUB/MH I-38(e), Manitoba Hydro states that Capitalized EFTs are forecast to 8
be 41% of total EFTs in 2013/14. The 41% of 6,841 is reported at 2,825. 9
10
This 41% value appears to be originally derived from the data in Appendix 5.6 11
Operating, Maintenance and Administrative Costs (page 7) by dividing the sum of 12
Capital Order Activities and Capitalized Overhead in 2013/14 by Total Costs less 13
Operating and Administration Charged to Centra [in thousands of dollars: 14
(250,986+70,823)/(848,951-68,646) = 41.24%]. 15
2 From PUB/MH I-38(e) and PUB/MH II-49(a).
2,369 2,397 2,479 2,566 2,678 2,825 2,825 2,194
3,702 3,879 3,951 4,028 3,930 4,016 4,016 4,647
-
1,000
2,000
3,000
4,000
5,000
6,000
7,000
8,000
2007/08 Actual
2008/09 Actual
2009/10 Actual
2010/11 Actual
2011/12 Actual
2012/13 Forecast
2013/14 Forecast
2013/14 Adjusted
Num
ber
of E
mpl
oyee
s
Capitalized EFTs (S/T and O/T) Uncapitalized EFTs
6,276 6,430 6,594 6,608 6,841 6,8416,071 6,841

Manitoba Hydro
2012/14 General Rate Application
PUB/MIPUG-I-15
November 30, 2012 Page 3 of 3
However, the above calculation ignores that a further $71.574 million will no longer be 1
capitalized due to IFRS changes. Taking into account the impact of the IFRS changes, 2
the result is as follows: 3
4
As seen on page 7 of Appendix 5.6 there is a separate line for IFRS Changes 5
($71,574k) that is required to be added-back to the values in the table to reach 6
the proper 2013/143 OM&A Attributable to Electric Operations per Annual Report. 7
Subtracting this item from the capital costs used in the calculation above derives 8
the Capitalized EFT percentage after IFRS changes for 2013/14 [in thousands of 9
dollars: (250,986+70,823-71,574)/(848,951-68,646) = 32.07%]. 10
11
Multiplying 32.07% (the new Capitalization percent) and 6,841 (total forecast 12
EFTs) totals 2,1944 Capitalized EFTs. 13
14
As can be seen by the dotted line in Figure 1, the forecast of 2,194 EFTs is substantially 15
lower than all actual years from 2007/08 to 2013/14. 16
3 Operating and Administration Charged to Centra and Subsidiaries are left out of the calculation to focus on electricity only costs. 4 The number in the evidence was reported at 2,189 on page 4-5 due to rounding the percentage value.


Manitoba Hydro
2012/14 General Rate Application
PUB/MIPUG-I-16
November 30, 2012 Page 1 of 1
REFERENCE: Pg. 4-12 1
Economic Benefit of Wuskwatim 2
3
QUESTION: 4
5
a) Please indicate and quantify Mr. Bowman’s understanding as to when MH 6
ratepayers will be deriving an economic benefit from Wuskwatim generation. 7
8
ANSWER: 9
10
(a) 11
12
Please see PUB/MIPUG-7. 13


Manitoba Hydro
2012/14 General Rate Application
PUB/MIPUG-I-17
November 30, 2012 Page 1 of 2
REFERENCE: Pg. 4-13 1
Amortization Reserve Variance 2
3
QUESTION: 4
5
a) What is Mr. Bowman’s view on the proposed time frame that the $594 million 6
reserve variance be “refunded” to ratepayers as an alternative to that provided by 7
MH, and specifically address concerns of intergenerational inequity. 8
9
ANSWER: 10
11
(a) 12
13
Mr. Bowman’s view is that the $594 million reserve variance should likely be “refunded” 14
as proposed by Hydro, so long as the other approaches to recognition of capital-related 15
costs in Mr. Bowman’s evidence (e.g., the ASL approach, with no net salvage, and full 16
cost accounting overhead allocations) are adopted. This approach to amortizing reserve 17
variances reflects a fairly typical regulatory approach, and provides some further limited 18
future benefits (as noted by Hydro in the response to MIPUG/MH-I-15(j)) such as future 19
flexibility. 20
21
The main concern raised by Mr. Bowman in the pre-filed testimony is the confluence of 22
an excessive number of ways Hydro is “front end loading” the costs related to new and 23
existing capital assets, as follows: 24
25
Adopt the more aggressive ELG depreciation approach; 26
27
Narrow the scope of overhead allocations; 28
29
Eliminate the recording of PowerSmart costs as an asset; and 30
31
Continue to target 75:25 debt:equity ratios including as soon as possible after 32
major new plants (including export-oriented plants) are put into service. 33
34
At the same time, where there are capital-cost related variances that act to the benefit of 35
ratepayers (i.e., this depreciation variance) Hydro proposes to amortize these to the 36
benefit of customers over a very lengthy period. Overall, the combined effect serves to 37

Manitoba Hydro
2012/14 General Rate Application
PUB/MIPUG-I-17
November 30, 2012 Page 2 of 2
compounds the impact on ratepayers, and leads to an excessive front-end loading of the 1
costs of capital projects (both direct costs and indirects). 2
3
Mr. Bowman also cautions, on further review of the depreciation study tables, that a 4
substantial portion of the variance (1/3 to 1/2) arises in two categories where Mr. 5
Bowman has expressed concern over a possible over-estimation of lives – 4000J and 6
4000L. If these lives were adopted at a level more consistent with Hydro’s own 7
experience (rather than the very optimistic assumptions made in the depreciation study), 8
the reserve variance would be far lower. 9

Manitoba Hydro
2012/14 General Rate Application
PUB/MIPUG-I-18
November 30, 2012 Page 1 of 2
REFERENCE: Pg. 4-17 1
Net Salvage Removal from Depreciation 2
3
QUESTION: 4
5
a) If the approach advanced by MH is not related to, or required by, IFRS, when 6
does Mr. Bowman believe MH should implement the change, and indicate how 7
an early adoption of such a policy change would impact the rates in the 8
Application. 9
10
b) Please indicate which of the prescribed approaches put forward by KPMG are 11
allowed under IFRS. 12
13
ANSWER: 14
15
(a) 16
17
Mr. Bowman considers that the change to remove net salvage from depreciation is a 18
reasonable approach that should be implemented as soon as possible. Adoption of this 19
measure would reduce depreciation costs by approximately $55 million for each year 20
implemented, as per MIPUG/MH-I-15(p). This is understood to include both the effects of 21
eliminating annual accruals to the provision, and to amortize the accumulated 22
amortization reserve variance, as this variance value is sensitive to the assumptions 23
regarding net salvage. 24
25
(b) 26
27
It has been Mr. Bowman’s experience that utilities referencing the application of IFRS to 28
their operations indicate an approach roughly comparable to #(1) is the normal 29
assumption for most of an asset’s life, although as these costs are difficult to disentangle 30
from the costs of building the replacement asset, in practice approach #(2) may in effect 31
cover a substantial part of the costs which otherwise would have been included in a 32
utility’s “net salvage” or “future removal and site restoration” provision. Approaches #(3) 33
through #(5) are typically cited as being unavailable for utilities for financial reporting 34
under IFRS. 35

Manitoba Hydro
2012/14 General Rate Application
PUB/MIPUG-I-18
November 30, 2012 Page 2 of 2
For ease of reference, the five approaches described by KPMG from pages 4-15 and 4-1
16 of Mr. Bowman’s Pre-filed Testimony are: 2
3
1) Ignore salvage values in the calculation of the asset's depreciation rate. 4
Recognize gross salvage revenue as income and retirement costs as an 5
expense at the time the asset is retired. 6
7
2) Ignore salvage values in the calculation of the asset's depreciation rate 8
and include the net salvage incurred on the retirement of the asset in the 9
depreciable cost base of the asset that replaces the retired asset. 10
11
3) Ignore salvage values in the calculation of the asset's depreciation rate 12
and amortize the net salvage incurred on the retirement of the asset over 13
a period following the retirement. 14
15
4) Alternatively, incorporate the asset's predicted net salvage value in the 16
calculation of its depreciation rate. 17
18
5) Establish a separate reserve (or allowance) for net salvage for each 19
account that is expected to have negative net salvage. Calculate and 20
display this reserve separately from accumulated depreciation. 21

Manitoba Hydro
2012/14 General Rate Application
PUB/MIPUG-I-19
November 30, 2012 Page 1 of 1
REFERENCE: Pg. 5-1 1
Annual Contributions to Reserves 2
3
QUESTION: 4
5
a) Please provide a schedule that demonstrates the annual contribution to retained 6
earnings proposed, in your evidence, by test year. Please extend the schedule to 7
include 2015 & 2016 and provide any assumptions. 8
9
b) Please clarify (and quantify) whether Mr. Bowman’s calculations reflect improved 10
hydraulic flows for 2012/13 from that depicted in IFF11-2. 11
12
ANSWER: 13
14
(a) and (b) 15
16
Please see PUB/MIPUG 11. 17


Manitoba Hydro
2012/14 General Rate Application
PUB/MIPUG-I-21
November 30, 2012 Page 1 of 3
REFERENCE: Curtailable Rate Program 1
2
QUESTION: 3
4
a) Please define the short-term issue related to MH’s proposal to eliminate Option C 5
and put caps on Options A and R. 6
7
b) Quantify the annual dollar impact on the customer and MH if the customer under 8
Option C switches to Option A. 9
10
c) Quantify the annual dollar impact on the customer and MH if the customer under 11
Options C switches to firm service. 12
13
d) Quantify the impact on customers with the proposed load caps versus the current 14
program approved caps. 15
16
e) Please provide a schedule demonstrating your calculation of financial impacts 17
described in footnote 127. 18
19
ANSWER: 20
21
(a) 22
23
The short-term issue is that no new customers will be allowed to access the Curtailable 24
Rate Program under Options A or R, and no customers will be permitted to use Option 25
C. 26
27
The rationale provided by Hydro in respect of closing Option C appears reasonable. The 28
rationale provided to lower the caps on Options A and R is not compelling. In short, 29
Hydro appears to under-value the longer term contribution that customers in this 30
program can make to serving capacity requirements. 31
32
(b) 33
34
The only difference between Options A and C are the discount percentage used in 35
calculating the CRP credit each month. Option A uses 70% and Option C uses 40%. 36
Assuming no change to the Option C customer load profile, the customer switching from 37

Manitoba Hydro
2012/14 General Rate Application
PUB/MIPUG-I-21
November 30, 2012 Page 2 of 3
Option C to Option A would increase Hydro’s credit to this customer by 75%. Based on 1
the information in Appendix 10.5, and MIPUG/MH-I-44(d) Attachments I and II, this 2
customer’s average monthly credit for 2009/10 was $22,794, for 2010/11 was $7,798 3
and for 2011/12 was $844. Increasing these amounts by 75%, Hydro’s total added 3 4
year cost would be $283,000 for the three years. 5
6
This does not take into account the cost savings in terms of system benefits gained from 7
having the customer’s load available on a 5 minute notice versus a 1 hour notice. The 8
intent of the program is that the credit tracks the benefit, and as such, it is expected 9
there would be no effective cost to Hydro over this period from the customer switching 10
from Option C to Option A. 11
12
(c) 13
14
If the customer left the Curtailable program, Hydro would eliminate monthly credits to the 15
customer which in recent years have totaled $377,000 over the past 3 years (average of 16
$10,500 per month). 17
18
This does not take into account the lost system benefits from having the customer’s load 19
available on the CRP program. As the intent of the program is that the credit tracks the 20
benefit, as such it is expected there would be limited or no effective savings to Hydro 21
over this period from the customer switching from Option C to firm service. 22
23
(d) 24
25
It is not clear if there would be any practical effect of lowering the caps versus retaining 26
them at the current levels, as the current caps have been in place for some time and no 27
new customers have signed on to the program for at least 3 years (and one customer 28
has left the program – in the 2009/10 report there were 4 customers on the program). 29
However, for a customer who could participate in the program, but would be prevented 30
due to the caps, they would lose the opportunity to secure bill savings of approximately 31
$2/kW (if they operate at a high load factor; at a lower load factor the savings would be 32
less) which can be a material factor in the cost of power for some facilities. 33

Manitoba Hydro
2012/14 General Rate Application
PUB/MIPUG-I-21
November 30, 2012 Page 3 of 3
(e) 1
2
Hydro cites the current maximum Option R load at 100 MW, and Option A and C at 230 3
MW. Option A is higher value than Option C, so the maximums are based on this load 4
being entirely Option A. 5
6
The customer is paid a credit that can also be de-rated by their load factor, if their load 7
factor on the curtailable portion of their load is below 100%. The maximum calculations 8
are based on 100% load factor (or what is called “Guaranteed Curtailable Load”). 9
10
The credit is $3.17/kW/month for the last year of reporting (2011/12) and is adjusted by 11
70% for Option A or R participation. 12
13
In short, the maximum monthly credit is $3.17 x (100,000 kW + 230,000 kW) x 70%, 14
which totals $733,000. 15
16
Under the revised program, the maximum monthly credit is $3.17 x (50,000 kW + 17
180,000 kW) x 70%, which totals $510,000 if the Option C customer converts to Option 18
A, and $3.17 x (50,000 kW + 150,000 kW) x 70%, which is $444,000 if the Option C 19
customer does not convert. 20

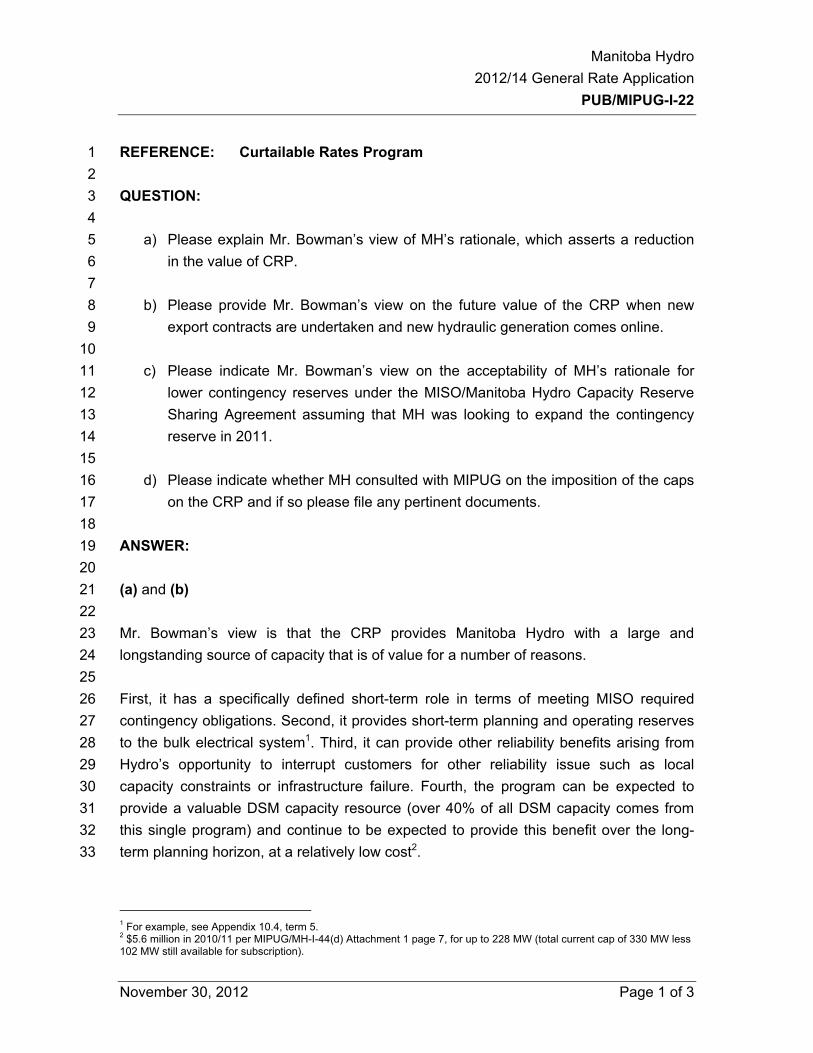
Manitoba Hydro
2012/14 General Rate Application
PUB/MIPUG-I-22
November 30, 2012 Page 1 of 3
REFERENCE: Curtailable Rates Program 1
2
QUESTION: 3
4
a) Please explain Mr. Bowman’s view of MH’s rationale, which asserts a reduction 5
in the value of CRP. 6
7
b) Please provide Mr. Bowman’s view on the future value of the CRP when new 8
export contracts are undertaken and new hydraulic generation comes online. 9
10
c) Please indicate Mr. Bowman’s view on the acceptability of MH’s rationale for 11
lower contingency reserves under the MISO/Manitoba Hydro Capacity Reserve 12
Sharing Agreement assuming that MH was looking to expand the contingency 13
reserve in 2011. 14
15
d) Please indicate whether MH consulted with MIPUG on the imposition of the caps 16
on the CRP and if so please file any pertinent documents. 17
18
ANSWER: 19
20
(a) and (b) 21
22
Mr. Bowman’s view is that the CRP provides Manitoba Hydro with a large and 23
longstanding source of capacity that is of value for a number of reasons. 24
25
First, it has a specifically defined short-term role in terms of meeting MISO required 26
contingency obligations. Second, it provides short-term planning and operating reserves 27
to the bulk electrical system1. Third, it can provide other reliability benefits arising from 28
Hydro’s opportunity to interrupt customers for other reliability issue such as local 29
capacity constraints or infrastructure failure. Fourth, the program can be expected to 30
provide a valuable DSM capacity resource (over 40% of all DSM capacity comes from 31
this single program) and continue to be expected to provide this benefit over the long-32
term planning horizon, at a relatively low cost2. 33
1 For example, see Appendix 10.4, term 5. 2 $5.6 million in 2010/11 per MIPUG/MH-I-44(d) Attachment 1 page 7, for up to 228 MW (total current cap of 330 MW less 102 MW still available for subscription).

Manitoba Hydro
2012/14 General Rate Application
PUB/MIPUG-I-22
November 30, 2012 Page 2 of 3
With respect to new generation projects, the projects being pursued in Manitoba provide 1
both energy and capacity. Hydro’s system is generally equally constrained on both fronts 2
– the system presently experiences capacity shortfalls in approximately the same year 3
that it experiences energy shortfalls (2021/22 as compared 2020/21 per the 2011/12 4
Power Resource Plan3). However, these balances can change with changes in loads or 5
system supplies; for example added wind or other self-generation can bring added 6
energy but not capacity. An example of this is presently occurring BC, where after many 7
years of planning for an energy resource shortfall, the current Integrated Resource Plan 8
highlights capacity shortfalls as now being acute in the near-term4. As such, the flexibility 9
provided by a core dependable group of CRP participants can be of value, although 10
difficult to quantify. 11
12
The caution with regard to Manitoba Hydro’s rationale on valuing the CRP is that the 13
utility places no value on the long-term or relationship aspects of the program. The 14
program has had continual participation since it was created in 1994, and most 15
participants remain on the program for long periods of time. While there is no long-term 16
contract with the participants, this is no different than most other DSM programs. The 17
best way to ensure that the customer will be there over the long-term, however, is to 18
secure their participation when the customer interest is present, and aid the customer in 19
implementing the necessary internal systems and training, etc. that is required to 20
participate in the program. Capping the program eligibility at this time would appear to 21
potentially forego this option for customers who may want participate but will no longer 22
be provided the option. 23
24
(c) 25
26
It is not clear to Mr. Bowman that Manitoba Hydro was looking to expand the 27
“contingency reserve” in 2011. It is Mr. Bowman’s understanding that Manitoba Hydro 28
agreements or negotiations with MISO for reserve sharing are based on Manitoba Hydro 29
seeking to be responsible for as small a share of contingency reserve obligation as 30
possible, consistent with system reliability and reasonable system management. 31
3 Attachment 3 of the September 1, 2012 Rate Increase filing. 4http://www.bcenergyblog.com/uploads/file/draft_2012_irp_executive_Par_0001_File_DRAFT_2012_IRP_ExecutiveSummary[1].pdf.

Manitoba Hydro
2012/14 General Rate Application
PUB/MIPUG-I-22
November 30, 2012 Page 3 of 3
It is Mr. Bowman’s understanding that despite negotiating what appears to be a 1
successful agreement with MISO in October 2009 to maintain a relatively small Manitoba 2
Hydro obligation for pooled contingency reserves, Manitoba Hydro was still as of 3
October, 2011 indicating in its CRP reporting that it may want to expand the program. It 4
is possible the CRP report was an oversight by Hydro and that in fact the necessity of 5
further curtailable load had vanished as of October 2009 when the MISO agreement was 6
finalized, but given the cited CRP report was a full 2 years later, this seems unlikely. 7
8
Manitoba Hydro has not provided sufficient information to fully assess their October 9
2011 statement that “In order to meet the capacity obligations resulting from a Maximum 10
Generation Event, Manitoba Hydro may need to have approximately 400 MW of Option 11
A load available for curtailment. In addition, there is an opportunity for additional Option 12
R curtailable load to be used to meet Manitoba Hydro’s Supplemental Contingency 13
Reserves obligation to the MISO-MBHydro Contingency Reserve Sharing Group”5. 14
15
Mr. Bowman’s conclusion was that the information filed to justify the lowering of the CRP 16
caps was not sufficient to explain the change from the October 2011 statement quoted 17
above, nor to address what Mr. Bowman views as an excessively short-term focus on 18
the CRP role by not crediting any long-term capacity DSM value to the program. 19
20
(d) 21
22
Manitoba Hydro did not consult with the MIPUG group regarding the reduction of the 23
caps on the CRP. It is possible that Manitoba Hydro had discussions with individual 24
MIPUG members. 25
26
Since the decision was made to lower the CRP caps (after filing of the GRA), Manitoba 27
Hydro did discuss with MIPUG the rationale for the lowering of the caps as part of 28
broader discussions regarding overall system planning, on October 4, 2012. 29
5 MIPUG/MH-I-44(d), Attachment 1, page 8.


Manitoba Hydro
2012/14 General Rate Application
PUB/MIPUG-I-23
November 30, 2012 Page 1 of 4
REFERENCE: Attachment B, Figure B.4.1 1
OM&A Trend 2
QUESTION: 3
4
a) Please provide a table of data points for the chart. 5
6
b) Please provide any observations of the annual increases in OM&A experienced 7
actually relative to CPI. 8
9
ANSWER: 10
11
(a) 12
13
Table 1 below provides the information used in Figure B.4.1 from Appendix B of Mr. 14
Bowman’s pre-filed testimony. Actual expenses from 2002/03 to 2006/07 contain 15
subsidiary costs as a comparison to the IFF02-1, IFF05-1 and IFF07-1 which include 16
OM&A for subsidiaries. For each subsequent IFF after IFF07-1 Manitoba Hydro has 17
excluded OM&A for subsidiaries1. 18
19
Table 1: Comparison of Electricity Operations, Maintenance & 20
Administration Expense ($ millions)2 21
22 23
(b) 24
25
As noted in Figure 4-1 of Mr. Bowman’s pre-filed testimony, there are two relevant 26
values for assessing cost growth – total annual spending (before capitalization) and the 27
proportion of this spending that is recorded in OM&A in the given year. 28
1 CAC/MSOS/MH II-6(e). 2 Forecasts taken from each of the referenced IFFs, Projected Operating Statements. Forecast OM&A electric expense from IFF02-1 to IFF07-1 includes the OM&A expense for electric subsidiaries. Forecast OM&A expense for IFF08-1 to IFF11-2 does not include the electric subsidiary OM&A portion. 2002/03-2006/07 actual Electric OM&A data taken from Coalition/MH II-18a from the 2008 GRA and includes the OM&A expense from electric subsidiaries. 2007/08 to 2011/12. data as per PUB/MH I-51 from the 2012/14 GRA and does not include the electric subsidiary portion of OM&A. IFF11-2 includes addition of annual DSM expense as a result of IFRS conversion, beginning in 2013/14.
Fis. Year 02/03 03/04 04/05 05/06 06/07 07/08 08/09 09/10 10/11 11/12 12/13 13/14 14/15 15/16 16/17 17/18 18/19 19/20 20/21 21/22IFF02-1 $283 $303 $304 $307 $313 $319 $326 $332 $340 $347 $353IFF05-1 $322 $332 $339 $338 $345 $352 $365 $372 $380 $387 $395IFF07-1 $351 $360 $369 $377 $389 $398 $406 $415 $423 $431 $453IFF09-1 $372 $380 $403 $411 $420 $428 $437 $445 $467 $478 $497IFF10-1 $398 $402 $414 $422 $430 $439 $448 $469 $478 $495IFF11-2 $398 $447 $532 $542 $548 $554 $571 $580 $595 $611 $622Actuals $272 $293 $308 $322 $332 $323 $364 $378 $397 $403

Manitoba Hydro
2012/14 General Rate Application
PUB/MIPUG-I-23
November 30, 2012 Page 2 of 4
Table 2 compares Hydro’s actual OM&A annual increases with Manitoba CPI changes 1
for 2003/04-2011/12 (i.e., after capitalization of costs). Subsidiary spending is deducted 2
from the OM&A actual amounts for years 2002/03 to 2006/07 to correlate with the 3
adjustment made by Manitoba Hydro to show OM&A net of subsidiary spending in 4
2007/08. 5
6
Table 2: Comparison of Hydro’s Actual OM&A after Capitalization and Manitoba 7
CPI Annual Change (% and $ Millions)3 8
9 10
Please see Figure 1 below for a graphed comparison of OM&A after capitalization (net of 11
subsidiaries) with what OM&A after capitalization (and net of subsidiaries) would have 12
been if it had tracked Manitoba CPI. 13
3 OM&A After Capitalization (net of subsidiaries) calculated as Total Costs less Centra Gas Costs and Capitalized costs. 2002/03 to 2006/07 OM&A data taken from Appendix 12.11: O&A Expenses; Variance, from 2008 GRA, page 2. 2007/08 to 2008/09 actual data taken from Appendix 4.4 of 2010 GRA, page 14. 2009/10 to 2011/12 data taken from Appendix 5.6 of 2012 GRA, page 7. CPI% Change data as per Attachment 4: Manitoba Hydro Economic Outlook 12, page 23 out of 33. OM&A if Growth Maintained at CPI % Levels calculated as 2002/03 MH Actual OM&A multiplied by CPI % Change with each subsequent year using the amount calculated for OM&A if Growth Maintained at CPI % Levels as the basis before CPI % Growth. Excess OM&A Growth calculated as MH Actual OM&A less OM&A if Growth Maintained at CPI % Levels.
Fis. Year 02/03 03/04 04/05 05/06 06/07 07/08 08/09 09/10 10/11 11/12Cumulative
Change
MH Actual OM&A After Capitalization (net of subsidiaries) $277 $283 $299 $311 $323 $323 $364 $378 $397 $403 126$
MH Actual OM&A After Capitalization % Change - 2.3% 5.4% 4.0% 4.1% -0.2% 12.8% 3.8% 5.0% 1.5% 45.5%
Man. CPI % change 2.3% 0.9% 2.7% 2.4% 2.0% 1.9% 2.2% 0.6% 1.0% 2.8% 16.7%OM&A After Capitalization if Growth Maintained at CPI % Levels $277 279$ 287$ 294$ 300$ 305$ 312$ 314$ 317$ 326$ 49$
Excess OM&A Growth - 14$ 21$ 28$ 32$ 17$ 52$ 64$ 80$ 77$ 77$

Manitoba Hydro
2012/14 General Rate Application
PUB/MIPUG-I-23
November 30, 2012 Page 3 of 4
Figure 1: Actual OM&A After Capitalization (net of subsidiaries) Comparison to 1
Manitoba CPI Inflation ($ Millions) 2
3 4
For comparison, Table 3 below shows the same table using spending/costs before 5
capitalization. Table 3 has deducted subsidiary costs out for each year. 6
$200
$250
$300
$350
$400
$450
OM
&A
in $
Mill
ions
MH Actual OM&A After Capitalization (net of subsidiaries)
OM&A After Capitalization if Growth Maintained at CPI % Levels

Manitoba Hydro
2012/14 General Rate Application
PUB/MIPUG-I-23
November 30, 2012 Page 4 of 4
Table 3: Comparison of Hydro’s Actual OM&A before Capitalization and Manitoba 1
CPI Annual Change (% and $ Millions)4 2
3 4
Note that this analysis approach, however, suffers from the same weaknesses that arise 5
for many regulators completing operating cost reviews of utilities in an adversarial quasi-6
judicial environment. As a good contrast, the BC Utilities Commission completed 7
repeated reviews of BC Hydro costs over the period since that utility was re-regulated in 8
the early 2000s. Despite this regulatory review framework, which similarly was able to 9
focus on high-level or top-down analysis of OM&A expenditures, a more detailed internal 10
review of BC Hydro by a committee of Deputy Ministers identified significant potential 11
savings as described at page 4-6 to 4-7 of Mr. Bowman’s pre-filed testimony. 12
4 MH OM&A Before Capitalization calculated as Total Costs less Centra Gas OM&A. 2002/03 to 2006/07 numbers from Appendix 12.11: O&A Expenses; Variance from 2008 GRA, Page 2. 2007/08 to 2008/09 numbers from Appendix 4.4 of 2010 GRA. Page 14. 2009/10 to 2013/14 numbers from Appendix 5.6 of 2012 GRA. Page 7. Man. CPI % change data as per Attachment 4: Manitoba Hydro Economic Outlook 12, page 23 out of 33. OM&A if Growth Maintained at CPI % Levels calculated as 2002/03 MH Actual OM&A multiplied by CPI % Change with each subsequent year using the amount calculated for OM&A if Growth Maintained at CPI % Levels as the basis before CPI % Growth. Excess OM&A Growth calculated as MH Actual OM&A less OM&A if Growth Maintained at CPI % Levels.
Fis. Year 02/03 03/04 04/05 05/06 06/07 07/08 08/09 09/10 10/11 11/12Cumulative
Change
MH Actual OM&A Before Capitalization 464$ 490$ 515$ 543$ 562$ 582$ 626$ 662$ 688$ 725$ 261$
MH Actual OM&A Before Capitalization % Change 5.5% 5.0% 5.6% 3.5% 3.6% 7.5% 5.7% 3.9% 5.4% 56.2%
Man. CPI % change 2.3% 0.9% 2.7% 2.4% 2.0% 1.9% 2.2% 0.6% 1.0% 2.8% 16.7%
OM&A Before Capitalization if Growth Maintained at CPI % Levels 464$ 468$ 481$ 493$ 502$ 512$ 523$ 527$ 532$ 547$ 83$
Excess OM&A Growth -$ 21$ 34$ 50$ 60$ 70$ 103$ 135$ 156$ 178$ 178$

Manitoba Hydro
2012/14 General Rate Application
PUB/MIPUG-I-25
November 30, 2012 Page 1 of 2
REFERENCE: Attachment A Resume 1
2
QUESTION: 3
4
a) Please detail InterGroup’s retainers, engagements, and assignments, with MH, 5
and its Affiliated Companies related to Manitoba Hydro’s new major capital 6
projects since 2002 describing each engagement and indicating to what extent 7
InterGroup was involved. 8
9
ANSWER: 10
11
(a) 12
13
While InterGroup provides a variety of consulting services to a broad range of clients, in 14
general terms, the majority of InterGroup’s work falls into one of two practice areas that 15
operate relatively independently. These practice areas are environmental assessment 16
services, and services related to utility rate-setting. 17
18
Mr. Bowman noted during his testimony in June 2011 at the 2010/11 and 2011/12 GRA 19
proceeding that InterGroup has been retained by Manitoba Hydro to undertake 20
environmental assessment studies related to the Wuskwatim, Keeyask and Conawapa 21
generation projects, in particular related to socio-economic effects (i.e. assessing 22
potential effects of the projects on people and communities), public involvement and 23
overall environmental assessment approach and methodology. InterGroup had not been 24
retained to provide any rate-related work on these projects. 25
26
In the case of the Bipole III transmission project, prior to June 2011, InterGroup had not 27
been retained to provide Environmental Assessment services in respect of that project. 28
InterGroup did provide services to Manitoba Hydro aimed at ensuring that Gillam-area 29
socio-economic information developed for the Keeyask Generation Project 30
environmental impact statement (EIS) was also made available for the study teams for 31
the Bipole III EIS. 32
33
Subsequent to Mr. Bowman’s testimony in 2011, InterGroup was retained by Manitoba 34
Hydro to provide services related to the Bipole III project including advice regarding the 35
environmental assessment approach and finalization of the EIS documentation process. 36

Manitoba Hydro
2012/14 General Rate Application
PUB/MIPUG-I-25
November 30, 2012 Page 2 of 2
InterGroup has also provided regulatory support services to Manitoba Hydro during the 1
Bipole III Clean Environment Commission hearing. 2
3
Mr. Bowman’s work is primarily focused on InterGroup’s rate-related practice area. Mr. 4
Bowman provides services to intervenors, utilities and governments on rate-related 5
issues in a number of jurisdictions in Canada. Mr. Bowman has not provided services to 6
Manitoba Hydro on InterGroup’s environmental assessment assignments since 7
approximately 2002. 8
9
MIPUG was formed in the late 1980s to address matters of unique importance to 10
industrial customers and has intervened in every rate hearing since 1988. InterGroup 11
has been retained separately by both Manitoba Hydro and MIPUG since MIPUG’s 12
inception. Manitoba Hydro and MIPUG have retained InterGroup with the full knowledge 13
of both clients regarding InterGroup’s work for the other party. 14
15
InterGroup’s work for Manitoba Hydro has not been in areas related to the PUB, rates, 16
cost of service, or terms and conditions of service. 17


![ARTICLE.Duarte - Formatted for Pub - DP[1][1]](https://img.pdfslide.us/doc/110x75/62d82391e74acd3f966f74ec/-formatted-for-pub-dp11.jpg)


![Traffic Pub Fisheries11[1]](https://img.pdfslide.us/doc/110x75/577d2e631a28ab4e1eaee215/traffic-pub-fisheries111.jpg)


![November Newsletter 2010.Pub[1]](https://img.pdfslide.us/doc/110x75/5524a4504a795968498b47e6/november-newsletter-2010pub1.jpg)