Embed Size (px)
DESCRIPTION
http://www.excellence-in-insulation.eu/site/fileadmin/user_upload/PDF/library/reports/PU_12-093_ISOPA_Eco-profile_Polyether_Polyols_2012-04.pdf
Citation preview
1
Eco profiles and Environmental Product Declarations of the European Plastics Manufacturers
Long and Short chain Polyether Polyols for Polyurethane Products ISOPA April 2012
2
Table of Content
Table of ContentTable of ContentTable of ContentTable of Content .................................................................................................................................................................................................................................................................................................................................................................................................................................................................................................................................................................... 2222 Environmental ProducEnvironmental ProducEnvironmental ProducEnvironmental Productttt De De De Decccclarationlarationlarationlaration ............................................................................................................................................................................................................................................................................................................................................................................................................................................................3333
Introduction .................................................................................................................................................. 3 Meta Data ..................................................................................................................................................... 3 Description of the Product and the Production Process .................................................................................. 3 Environmental Performance ........................................................................................................................... 4 Additional Environmental and Health Information ......................................................................................... 5 Additional Technical Information ................................................................................................................... 5 Additional Economic Information ................................................................................................................... 5 Information ................................................................................................................................................... 6
Goal & ScopeGoal & ScopeGoal & ScopeGoal & Scope ........................................................................................................................................................................................................................................................................................................................................................................................................................................................................................................................................................................................7777 Intended Use & Target Audience .................................................................................................................... 7 Product Category and Declared Unit ............................................................................................................... 7 Product and Producer Description.................................................................................................................. 8
Life Cycle InventoryLife Cycle InventoryLife Cycle InventoryLife Cycle Inventory................................................................................................................................................................................................................................................................................................................................................................................................................................................................................................................................................ 10101010 System Boundaries...................................................................................................................................... 10 Cut off Rules.................................................................................................................................................12 Data Quality Requirements ...........................................................................................................................12 Calculation Rules..........................................................................................................................................14 Life Cycle Inventory (LCI) Results ...................................................................................................................15
Life Cycle Impact AssessmentLife Cycle Impact AssessmentLife Cycle Impact AssessmentLife Cycle Impact Assessment....................................................................................................................................................................................................................................................................................................................................................................................................................................................................................23232323 Input ........................................................................................................................................................... 23 Output ........................................................................................................................................................ 23
ReviReviReviReviewewewew........................................................................................................................................................................................................................................................................................................................................................................................................................................................................................................................................................................................................................27272727 Review Details ............................................................................................................................................. 27 Review Summary ......................................................................................................................................... 27
ReferencesReferencesReferencesReferences............................................................................................................................................................................................................................................................................................................................................................................................................................................................................................................................................................................................ 28282828
3
Environmental Product Declaration
Introduction
This Environmental Product Declaration (EPD) is
based upon life cycle inventory (LCI) data from
PlasticsEurope’s Eco profile programme. It has been
prepared according to PlasticsEurope’s EcoPlasticsEurope’s EcoPlasticsEurope’s EcoPlasticsEurope’s Eco prprprproooofiles files files files
and Environmental Declarations and Environmental Declarations and Environmental Declarations and Environmental Declarations –––– LCI Methodology LCI Methodology LCI Methodology LCI Methodology
and PCR for Uncompounded Polymer Resins and Rand PCR for Uncompounded Polymer Resins and Rand PCR for Uncompounded Polymer Resins and Rand PCR for Uncompounded Polymer Resins and Reeee
active Polymer Precursors active Polymer Precursors active Polymer Precursors active Polymer Precursors (PCR version 2.0, April
2011). EPDs provide environmental performance
data, but no information on the economic and social
aspects which would be necessary for a complete
sustainability assessment. Further, they do not im
ply a value judgment between environmental crite
ria.
This EPD describes the production of polyether poly
ols from cradle to gate (from crude oil extraction to
granules or resin at plant). Please keep in mind that Please keep in mind that Please keep in mind that Please keep in mind that
comparisons comparisons comparisons comparisons cannotcannotcannotcannot be made on the level of the be made on the level of the be made on the level of the be made on the level of the
polyether polyether polyether polyether polypolypolypolyololololssss alone alone alone alone: it is necessary to consider
the full life cycle of an application in order to com
pare the performance of different materials and the
effects of relevant life cycle parameters. This EPD is
intended to be used by member companies, to sup
port product orientated environmental manage
ment; by users of plastics, as a building block of life
cycle assessment (LCA) studies of individual prod
ucts; and by other interested parties, as a source of
life cycle information.
Meta Data Data owner ISOPA
LCA practitioner PE International AG
Programme owner PlasticsEurope
Programme manager, reviewer, database manager
DEKRA Industrial GmbH
Number of plants included in data collection
7 (long chain polyether polyols) 4 (short chain polyether polyols)
Representativeness 90% coverage in terms of production volumes
Reference year 2010
Year of data collection and calculation
2011
Expected temporal validity
2022
Cut offs No significant cut offs
Data quality Very good
Allocation method Varies, see chapter “Allocation Rules”
Description of the Product and the
Production Process
This EPD is for long chain polyether polyols (MW >
1000 g/mol) and short chain polyether polyols (MW
< 1000 g/mol), polyether polyols used in the produc
tion of flexible and rigid polyurethanes (PU).
Polyether polyols are polymeric compounds contain
ing ether groups (R O R) an OH groups. They are liq
uids at short chain lengths and when chains are
longer, they are waxy solids.
Polyether polyols are one of the precursors of poly
urethane foam. There are two types of polyether
polyols; short chain polyether polyols and long
chain polyether polyols. Short chain polyether poly
ols are used to produce rigid PU foams while long
chain polyether polyols are used to produce flexible
PU foams.
A combination of the different building blocks can
be used for a variety of other polyurethane applica
tions. (see Eco profile Toluene diisocyanate (TDI) &
Methylenediphenyl diisocyanate (MDI))
The reference flows, to which all data given in this
EPD refer, is 1 kg of long chain and 1 kg of short
chain polyether polyols.
Production ProcessProduction ProcessProduction ProcessProduction Process
Polyether polyols are produced by the alkoxylation
process. An addition reaction takes place where eth
ylene oxide or propylene oxide reacts with an initia
tor containing OH groups like glycerine, saccharose
and other carbohydrates. A base like KOH is needed
as a catalyst and fed into the solution. The reaction
runs under elevated temperature and pressure and
is strongly exothermic. The process takes place in a
batch reactor. When the reaction is complete, the
polyether polyol products are separated from by
products and water by means of precipitation and
distillation. The amount of alkoxylation species can
be varied to achieve different chain lengths and mo
lecular weights.
4
Data Sources and AllocationData Sources and AllocationData Sources and AllocationData Sources and Allocation
The main data source was a data collection from
European producers of polyether polyol. Primary
data on gate to gate polyether polyol production is
derived from site specific information for processes
under operational control supplied by the participat
ing companies of this study.
Six different producers of long chain polyether poly
ols with seven plants in three European countries
participated in the primary data collection. They
cover 90% polyether polyol producers in Europe
(EU27) in 2010.
Three different producers of short chain polyether
polyols with four plants in three European countries
participated in the primary data collection. They
cover 90% polyether polyol producers in Europe
(EU27) in 2010.
The data for the upstream supply chain until the
precursors are taken from the database of the soft
ware system GaBi 5 [GaBi 5 2011]. All relevant back
ground data such as energy and auxiliary material
are also taken from the GaBi databases 2011. Most
of the background data used is publicly available
and public documentation exists [GaBi 5 2011].
For the main precursor propylene oxide primary data
was collected.
Allocation was applied for the production process of
single cases, as minor by products result from these
specific polyether polyol production processes. The
by products had lower assignments than the main
product polyether polyol. The process intention is
the production of polyether polyol only and in case
the by product is sold, price allocation was applied.
Nevertheless, for these single cases, mass and price
allocation led to differences of less than 1% in the
results.
For the main precursor propylene oxide mainly price
allocation was applied based on feedback from the
producers. The sensitivity analysis has shown that
even if mass allocation was applied the differences
in the results would be 2 3 %.
Use Phase and EndUse Phase and EndUse Phase and EndUse Phase and End ofofofof Life ManagementLife ManagementLife ManagementLife Management
Polyether polyols produced from glycerine and pro
pylene oxide are typically used in polyurethane foam
production.
Flexible polyurethane foams produced from TDI or
MDI and polyether polyols are typically used in up
holstery, mattresses and automotive seats.
Rigid polyurethane foams produced from MDI and
polyether polyols have good thermal insulation
properties and are used in the manufacture of freez
ers and refrigerators, and in building and automotive
applications.
Post consumer recycling of polyurethane products is
common for applications where high volumes are
available and no, or limited, sorting is necessary. A
range of mechanical (regrinding, bonding, pressing,
and moulding) and chemical (glycolysis, hydrolysis,
pyrolysis) recycling technologies are available to
produce alternative products and chemical com
pounds for subsequent domestic, industrial and
chemical applications.
For all post consumer polyurethane waste, for which
recycling has not proven to be economically feasible
due to complex collection and/or dismantling steps
(e.g. automotive shredding), energy recovery is the
option of choice.
Environmental Performance
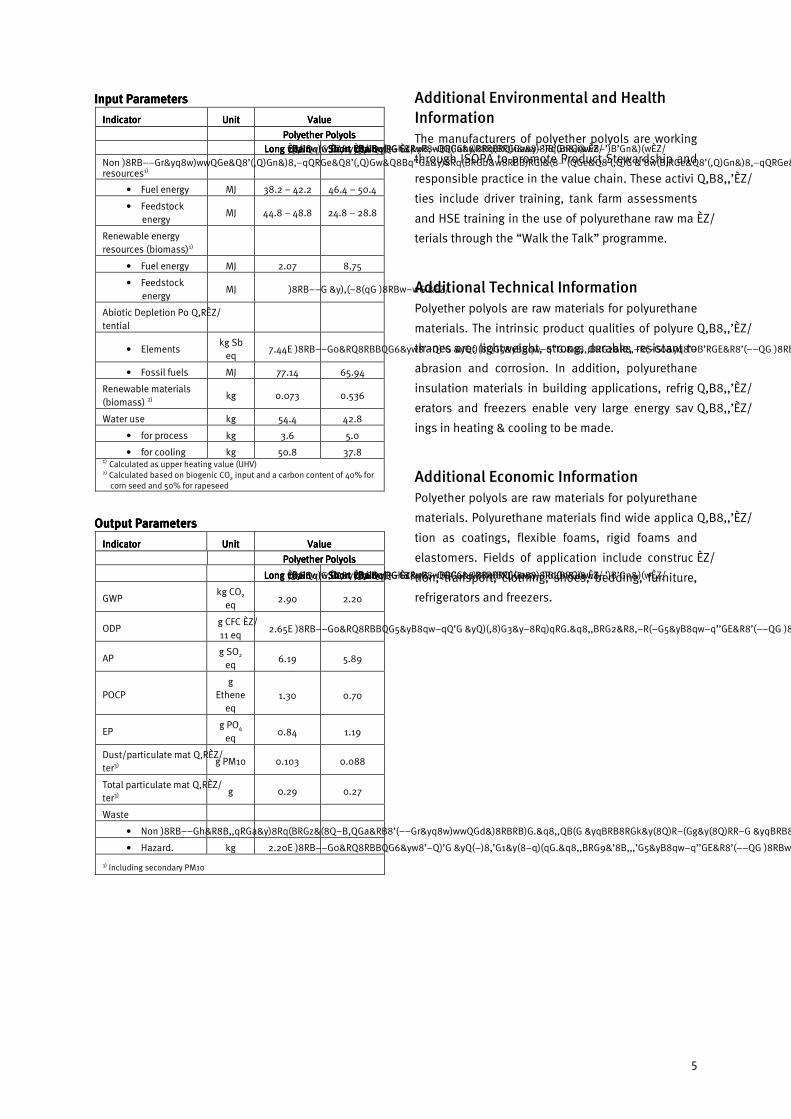
The tables below show the environmental perform
ance indicators associated with the production of 1
kg of long chain and short chain polyether polyol.
Please note that considering the uncertainty of the
exact division of the process energy as originating
from either fuels or feedstocks, as well as the use of
average data (secondary data) in the modelling with
different country specific grades of crude oil and
natural gas, the feedstock and fuel energy are pre
sented as a range.
5
Input ParametersInput ParametersInput ParametersInput Parameters
IndicatorIndicatorIndicatorIndicator UnitUnitUnitUnit ValueValueValueValue
Polyether PolyolsPolyether PolyolsPolyether PolyolsPolyether Polyols
LongLongLongLong chainchainchainchain ShortShortShortShort chainchainchainchain Non renewable energy resources1)
• Fuel energy MJ 38.2 – 42.2 46.4 – 50.4
• Feedstock energy
MJ 44.8 – 48.8 24.8 – 28.8
Renewable energy resources (biomass)1)
• Fuel energy MJ 2.07 8.75
• Feedstock energy
MJ
Abiotic Depletion Potential
• Elements kg Sb
eq 7.44E 06 5.20E 06
• Fossil fuels MJ 77.14 65.94
Renewable materials (biomass) 2)
kg 0.073 0.536
Water use kg 54.4 42.8
• for process kg 3.6 5.0
• for cooling kg 50.8 37.8 1) Calculated as upper heating value (UHV) 2) Calculated based on biogenic CO2 input and a carbon content of 40% for corn seed and 50% for rapeseed
Output ParametersOutput ParametersOutput ParametersOutput Parameters
IndicatorIndicatorIndicatorIndicator UnitUnitUnitUnit ValueValueValueValue
Polyether PolyolsPolyether PolyolsPolyether PolyolsPolyether Polyols
LongLongLongLong chainchainchainchain ShortShortShortShort chainchainchainchain
GWP kg CO2
eq 2.90 2.20
ODP g CFC11 eq
2.65E 05 3.25E 05
AP g SO2
eq 6.19 5.89
POCP g
Ethene eq
1.30 0.70
EP g PO4
eq 0.84 1.19
Dust/particulate matter3)
g PM10 0.103 0.088
Total particulate matter3)
g 0.29 0.27
Waste
• Non hazard. kg 3.98E 03 1.45E 02
• Hazard. kg 2.20E 06 1.95E 06
3) Including secondary PM10
Additional Environmental and Health
Information
The manufacturers of polyether polyols are working
through ISOPA to promote Product Stewardship and
responsible practice in the value chain. These activi
ties include driver training, tank farm assessments
and HSE training in the use of polyurethane raw ma
terials through the “Walk the Talk” programme.
Additional Technical Information
Polyether polyols are raw materials for polyurethane
materials. The intrinsic product qualities of polyure
thanes are: lightweight, strong, durable, resistant to
abrasion and corrosion. In addition, polyurethane
insulation materials in building applications, refrig
erators and freezers enable very large energy sav
ings in heating & cooling to be made.
Additional Economic Information
Polyether polyols are raw materials for polyurethane
materials. Polyurethane materials find wide applica
tion as coatings, flexible foams, rigid foams and
elastomers. Fields of application include construc
tion, transport, clothing, shoes, bedding, furniture,
refrigerators and freezers.
Information
Data OwnerData OwnerData OwnerData Owner
ISOPAISOPAISOPAISOPA
Avenue E. van Nieuwenhuyse Laan 4, Box 9
B 1160 Brussels, Belgium
Tel.: +32 (2) 676 74 75, Fax: +32 (2) 676 74 79
E mail: [email protected].
Programme ManagerProgramme ManagerProgramme ManagerProgramme Manager & Reviewer & Reviewer & Reviewer & Reviewer
DEKRA Industrial GmbHDEKRA Industrial GmbHDEKRA Industrial GmbHDEKRA Industrial GmbH
This Environmental Product Declaration has been
reviewed by DEKRA Industrial GmbH. It was ap
proved according to the Product Category Rules PCR
version 2.0 (2011 04) and ISO 14025:2006.
Registration number: PlasticsEurope 2012 0002,
valid until 30 April 2015 (date of next revalidation
review).
Programme OwnerProgramme OwnerProgramme OwnerProgramme Owner
PlasticsEuropePlasticsEuropePlasticsEuropePlasticsEurope
Avenue E van Nieuwenhuyse 4, Box 3
B 1160 Brussels, Belgium
Tel.: +32 (2) 675 32 97, Fax: +32 (2) 675 39 35
E mail: [email protected].
For copies of this EPD, for the underlying LCI data
(Eco profile); and for additional information, please
refer to http://www.plasticseurope.org/.
ReferencesReferencesReferencesReferences
• Product photographs on cover with kind per
mission by BASF SE.
• PlasticsEurope: Eco profiles and environmental
declarations – LCI methodology and PCR for un
compounded polymer resins and reactive poly
mer precursor (version 2.0, April 2011).
7
Goal & Scope
Intended Use & Target Audience
Eco profiles (LCIs) and EPDs from this programme are intended to be used as »cradle to gate« building blocks
of life cycle assessment (LCA) studies of defined applications or products. LCA studies considering the full life
cycle (»cradle to grave«) of an application or product allow for comparative assertions to be derived. It is essen
tial to note that comparisons cannot be made at the level of the polymer or its precursors. In order to compare
the performance of different materials, the whole life cycle and the effects of relevant life cycle parameters must
be considered.
PlasticsEurope Eco profiles and EPDs represent polymer production systems with a defined output. They can be
used as modular building blocks in LCA studies. However, these integrated industrial systems cannot be disag
gregated further into single unit processes, such as polymerisation, because this would neglect the interde
pendence of the elements, e.g. the internal recycling of feedstocks and precursors between different parts of the
integrated production sites.
PlasticsEurope Eco profiles and EPDs are prepared in accordance with the stringent ISO 14040–44 requirements.
Since the system boundary is »cradle to gate«, however, their respective reference flows are disparate, namely
referring to a broad variety of polymers and precursors. This implies that, in accordance with ISO 14040–44, a
direct comparison of Eco profiles is impossible. While ISO 14025, Clause 5.2.2 does allow EPDs to be used in
comparison, PlasticsEurope EPDs are derived from Eco profiles, i.e. with the same »cradle to gate« system
boundaries.
As a consequence, a direct comparison of Eco profiles or EPDs makes no sense because 1 kg of different poly
mers are not functionally equivalent.
Once a full life cycle model for a defined polymer application among several functionally equivalent systems is
established, and only then, can comparative assertions be derived. The same goes for EPDs, for instance, of
building product where PlasticsEurope EPDs can serve as building blocks.
Eco profiles and EPDs are intended for use by the following target audiences:
• member companies, to support product orientated environmental management and continuous improve
ment of production processes (benchmarking);
• downstream users of plastics, as a building block of life cycle assessment (LCA) studies of plastics applica
tions and products; and
• other interested parties, as a source of life cycle information.
Product Category and Declared Unit
Product CategoryProduct CategoryProduct CategoryProduct Category
The core product category is defined as uncompounded polymer resins, or reactive polymer pruncompounded polymer resins, or reactive polymer pruncompounded polymer resins, or reactive polymer pruncompounded polymer resins, or reactive polymer preeeecursorscursorscursorscursors. This
product category is defined »at gate« of the polymer or precursor production and is thus fully within the scope of
PlasticsEurope as a federation. In some cases, it may be necessary to include one or several additives in the Eco
profile to represent the polymer or precursor »at gate«. For instance, some polymers may require a heat stabi
liser, or a reactive precursor may require a flame retardant. This special case is distinguished from a subsequent
compounding step conducted by a third party downstream user (outside PlasticsEurope’s core scope).
8
Functional Unit and Declared UnitFunctional Unit and Declared UnitFunctional Unit and Declared UnitFunctional Unit and Declared Unit
The default Functional Unit and Declared Unit of PlasticsEurope Eco profiles and EPDs are (unless otherwise
specified1):
1 kg of primary long chain respectively short chain polyether polyol »at gate« (production site output) represent
ing a European industry production average.
Product and Producer Description
Product Product Product Product DDDDescriptionescriptionescriptionescription
• IUPAC name: Polyether Polyol
• chemical formula: HO (AO)m ZO (BO)n –H (A, Z, B…organic rest)
Polyether polyols are polymeric organic compounds including ether groups (R O R) and hydroxyl groups (OH).
They are liquids at short chain lengths (short chain polyether polyols, MW < 1000 g/mol) and when chains are
longer (long chain polyether polyols, MW > 1000 g/mol), they are waxy solids. The following picture shows the
polypropylene oxide triol as an example.
Polyether polyols are one of the pre cursors of polyurethane foam. There are two main types of polyether polyols,
short chain polyether polyols and long chain polyether polyols. Short chain polyether polyols combined with
MDI are used to produce rigid foams, while long chain polyether polyols combined with TDI resulting in flexible
foams. Later in this report, short chain and long chain polyether polyols are discussed separately. For this de
scription an average of all polyether polyols is shown.
Production Production Production Production PPPProcessrocessrocessrocess
Polyether polyols are produced by alkoxylation process. This is an addition reaction where ethylene oxide or
propylene oxide reacts with an initiator containing OH groups. Glycerine is a common initiator but other carbo
hydrates such as saccharose can be used as well. The alkoxylation process requires a catalyst and in this case, a
base like KOH is used for catalysis. The amount of alkoxylation species can be varied to achieve different chain
lengths and molecular weights.
The reaction mechanism is shown below. In the first step, the initiator is turned into an alcoholate anion by the
base. In the second step, the epoxide (propylene oxide) is added to the anion by ring opening. The resulting ep
oxide based monomer then combines with other resulting monomers to achieve longer polymer chains.
1 Exceptions can occur when reporting Eco profiles of, for instance, process energy, such as on site steam, or conversion processes, such as extrusion.
9
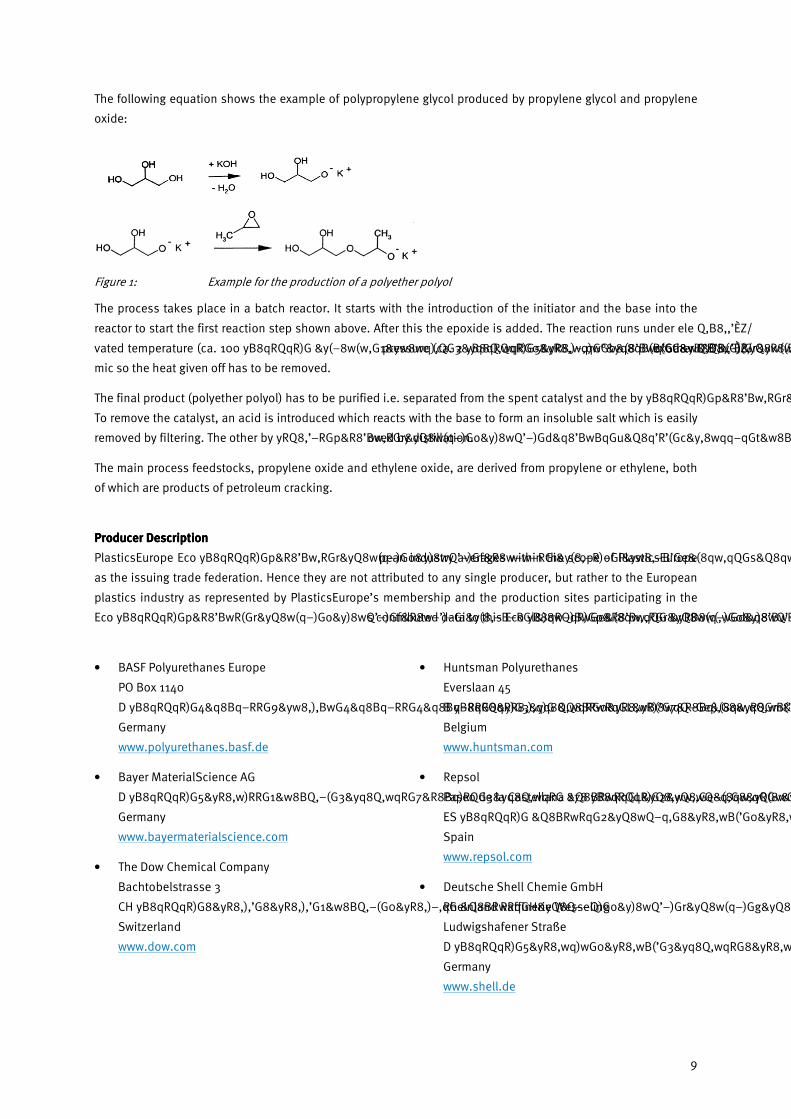
The following equation shows the example of polypropylene glycol produced by propylene glycol and propylene
oxide:
Figure 1: Example for the production of a polyether polyol
The process takes place in a batch reactor. It starts with the introduction of the initiator and the base into the
reactor to start the first reaction step shown above. After this the epoxide is added. The reaction runs under ele
vated temperature (ca. 100 130°C) [SCIEN 2001] and pressure (ca. 2 5bar) [SCIEN 2001] and is strongly exother
mic so the heat given off has to be removed.
The final product (polyether polyol) has to be purified i.e. separated from the spent catalyst and the by products.
To remove the catalyst, an acid is introduced which reacts with the base to form an insoluble salt which is easily
removed by filtering. The other by products are removed by distillation.
The main process feedstocks, propylene oxide and ethylene oxide, are derived from propylene or ethylene, both
of which are products of petroleum cracking.
Producer DescriptionProducer DescriptionProducer DescriptionProducer Description
PlasticsEurope Eco profiles and EPDs represent European industry averages within the scope of PlasticsEurope
as the issuing trade federation. Hence they are not attributed to any single producer, but rather to the European
plastics industry as represented by PlasticsEurope’s membership and the production sites participating in the
Eco profile data collection. The following companies contributed data to this Eco profile and EPD:
• BASF Polyurethanes Europe
PO Box 1140
D 49448 Lemfoerde
Germany
www.polyurethanes.basf.de
• Bayer MaterialScience AG
D 51373 Leverkusen
Germany
www.bayermaterialscience.com
• The Dow Chemical Company
Bachtobelstrasse 3
CH 8810 Horgen
Switzerland
www.dow.com
• Huntsman Polyurethanes
Everslaan 45
B 3078 Everberg
Belgium
www.huntsman.com
• Repsol
Paseo de la Castellana 278 280
ES 28046, Madrid
Spain
www.repsol.com
• Deutsche Shell Chemie GmbH
Rheinland Raffinerie Wesseling
Ludwigshafener Straße
D 50389 Wesseling
Germany
www.shell.de
10
Life Cycle Inventory
System Boundaries
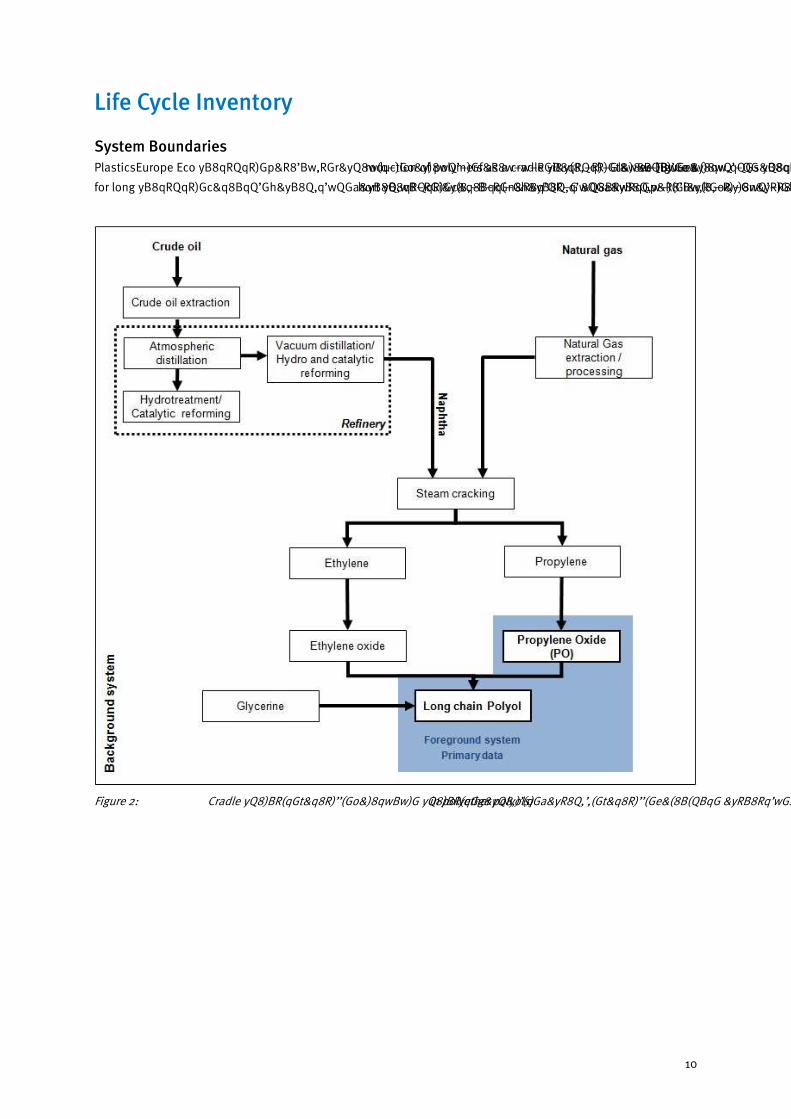
PlasticsEurope Eco profiles and EPDs refer to the production of polymers as a cradle to gate system (see Figure 2
for long chain polyether polyols and Figure 3 for short chain polyether polyols).
Figure 2: Cradle to gate system boundaries (long chain polyether polyols)
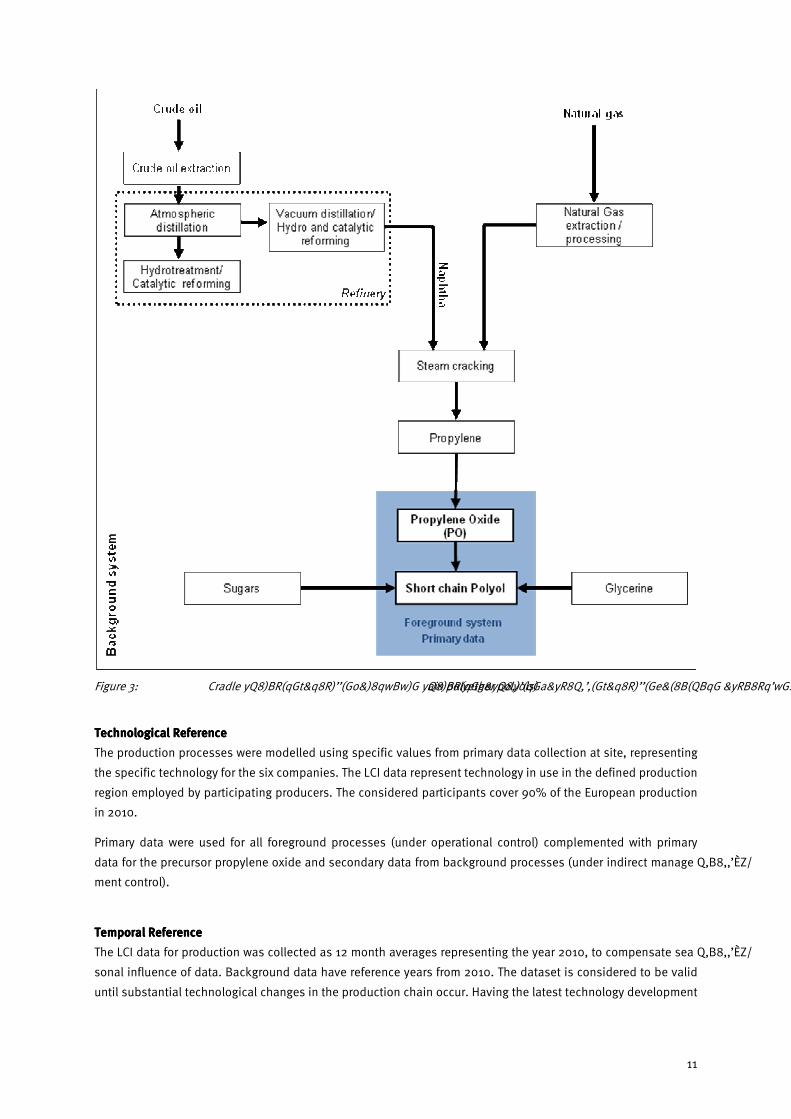
11
Figure 3: Cradle to gate system boundaries (short chain polyether polyols)
TechnoTechnoTechnoTechnological Referencelogical Referencelogical Referencelogical Reference
The production processes were modelled using specific values from primary data collection at site, representing
the specific technology for the six companies. The LCI data represent technology in use in the defined production
region employed by participating producers. The considered participants cover 90% of the European production
in 2010.
Primary data were used for all foreground processes (under operational control) complemented with primary
data for the precursor propylene oxide and secondary data from background processes (under indirect manage
ment control).
Temporal ReferenceTemporal ReferenceTemporal ReferenceTemporal Reference
The LCI data for production was collected as 12 month averages representing the year 2010, to compensate sea
sonal influence of data. Background data have reference years from 2010. The dataset is considered to be valid
until substantial technological changes in the production chain occur. Having the latest technology development
12
in mind, the companies participating in this Eco profile defines as temporal reference: the overall reference year
for this Eco profile is 2010 with a maximal temporal validity until 2022.
Geographical ReferenceGeographical ReferenceGeographical ReferenceGeographical Reference
Primary production data for flexible polyether polyol production is from six different suppliers in the EU. For rigid
polyether polyol production data is from three different European suppliers. Fuel and energy inputs in the system
reflect average European conditions and whenever applicable, site specific conditions were applied, to reflect
representative situations. Therefore, the study results are intended to be applicable within EU boundaries and in
order to be applied in other regions adjustments might be required. Polyether polyol imported into Europe was
not considered in this Eco profile.
Cut off Rules
In the foreground processes all relevant flows were considered, trying to avoid any cut off of material and energy
flows. In single cases additives used in the polyether polyols unit process (<0.1 % m/m of product output) were
neglected. In all cases it was assured that no hazardous substances or metals were present in this neglected
part.
According to the GaBi Databases 2011 [GaBi 5 2011], used in the background processes at least 95 % of mass
and energy of the input and output flows were covered and 98 % of their environmental relevance (according to
expert judgment) was considered, hence an influence of cut offs less than 1 % on the total is expected. All trans
ports in the pre chain contribute maximum 0.2 % to the overall environmental burden. Including production the
contribution of all transports is expected to be less than 1 %, thus transports are excluded from this investiga
tion.
Data Quality Requirements
Data SourcesData SourcesData SourcesData Sources
Eco profile and EPDs developed by ISOPA use average data representative of the respective foreground produc
tion process, both in terms of technology and market share. The primary data are derived from site specific in
formation for processes under operational control supplied by the participating member companies of ISOPA
(see Producer Description). The data for the upstream supply chain are taken from the life cycle database of the
software system GaBi 5 [GaBi 5 2011]. For the most relevant intermediate to the polyether polyol processes, pro
pylene oxide, primary data for the production was provided.
All relevant background data such as energy and auxiliary material are also taken from the GaBi databases 2011.
Most of the background data used is publicly available and public documentation exists. The dominance analy
sis (Table 35 and Table 36) showed that the contribution of these background datasets on impact indicators is
limited, with the exception of the indicators ADP elements and EP.
RelevanceRelevanceRelevanceRelevance
With regard to the goal and scope of this Eco profile, the collected primary data of foreground processes are of
high relevance, i.e. data was sourced from the most important polyether polyol producers in Europe in order to
generate a European industry average. The environmental contributions of each process to the overall LCI results
are included in the Chapter ‘Life Cycle Impact Assessment’.
13
RepresentativenessRepresentativenessRepresentativenessRepresentativeness
The considered participants covered 90% of the polyether polyol production in Europe in 2010. The selected
background data can be regarded as representative for the intended purpose, as it is average data and not in the
focus of the analysis.
ConsistencyConsistencyConsistencyConsistency
To ensure consistency only primary data of the same level of detail and background data from the GaBi data
bases 2011 [GaBi 5 2011] were used. While building up the model, cross checks concerning the plausibility of
mass and energy flows were continuously conducted. The methodological framework is consistent throughout
the whole model as the same methodological principles are used both in foreground and background system.
ReliabilityReliabilityReliabilityReliability
Data reliability ranges from measured to estimated data. Data of foreground processes provided directly by pro
ducers were predominantly measured. Data of relevant background processes were measured at several sites or
determined by literature data or estimated for some flows, which usually have been reviewed and checked for its
quality.
CompletenessCompletenessCompletenessCompleteness
Primary data used for the gate to gate production of polyether polyol covers all related flows in accordance with
the cut off criteria. In this way all relevant flows were quantified and data is considered complete.
Precision and AccuracyPrecision and AccuracyPrecision and AccuracyPrecision and Accuracy
As the relevant foreground data is primary data or modelled based on primary information sources of the owner
of the technology, better precision is not reachable within this goal and scope. All background data is consis
tently GaBi professional data with related public documentation.
ReproducibilityReproducibilityReproducibilityReproducibility
All data and information used are either documented in this report or they are available from the processes and
process plans designed within the GaBi 5 software. The reproducibility is given for internal use since the owners
of the technology provided the data and the models are stored and available in a database. Sub systems are
modelled by ´state of art´ technology using data from a publicly available and internationally used database. It is
worth noting that for external audiences, it may be the case that full reproducibility in any degree of detail will
not be available for confidentiality reasons. However, experienced experts would easily be able to recalculate
and reproduce suitable parts of the system as well as key indicators in a certain confidence range.
Data ValidationData ValidationData ValidationData Validation
The data on production collected from the project partners and the data providing companies was validated in
an iterative process several times. The collected data was validated using existing data from published sources
or expert knowledge.
The background information from the GaBi databases 2011 is updated regularly and validated and benchmarked
daily by its various users worldwide.
14
Life Cycle ModelLife Cycle ModelLife Cycle ModelLife Cycle Model
The study has been performed with the LCA software GaBi 5 [GaBi 5 2011]. The associated databases integrate
ISO 14040/44 requirements. Due to confidentiality reasons details on software modelling and methods used
cannot be shown here. However in principle the model can be reviewed in detail if the data owners agree. The
calculation follows the vertical calculation methodology, i.e. that the averaging is done after modelling the spe
cific processes.
Calculation Rules
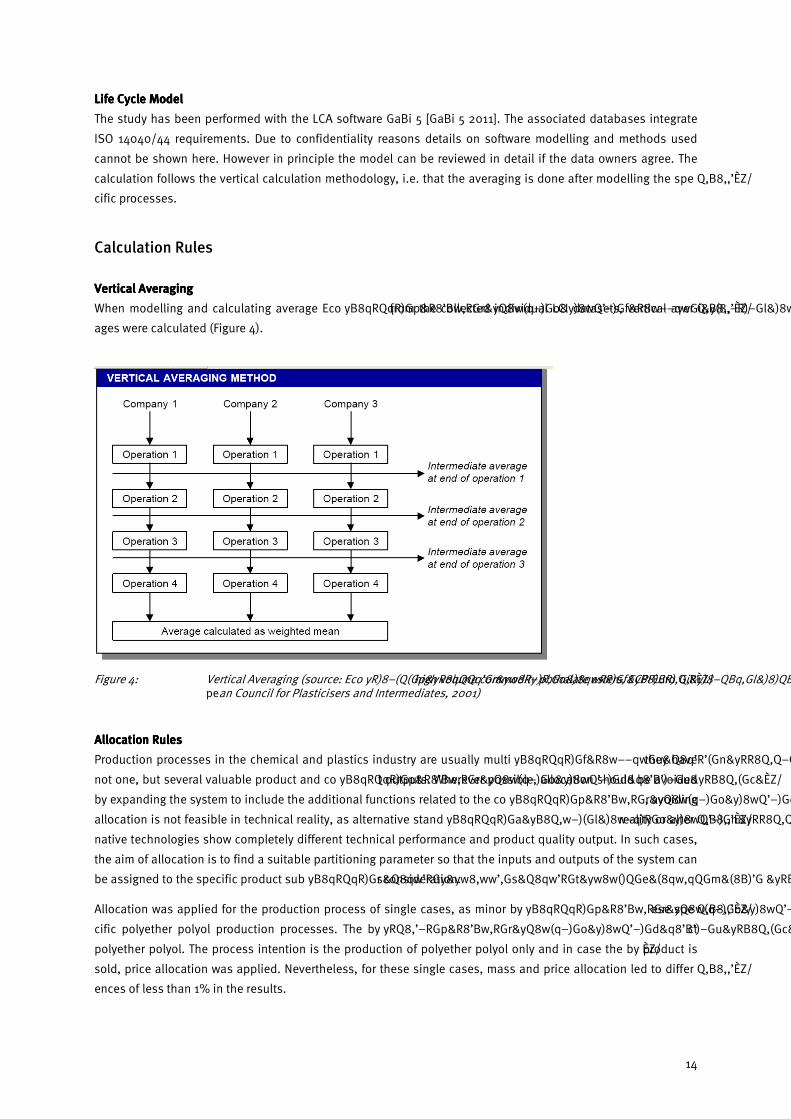
Vertical AveragingVertical AveragingVertical AveragingVertical Averaging
When modelling and calculating average Eco profiles from the collected individual LCI datasets, vertical aver
ages were calculated (Figure 4).
Figure 4: Vertical Averaging (source: Eco profile of high volume commodity phthalate esters, ECPI European Council for Plasticisers and Intermediates, 2001)
Allocation RulesAllocation RulesAllocation RulesAllocation Rules
Production processes in the chemical and plastics industry are usually multi functional systems, i.e. they have
not one, but several valuable product and co product outputs. Wherever possible, allocation should be avoided
by expanding the system to include the additional functions related to the co products. Often, however, avoiding
allocation is not feasible in technical reality, as alternative stand alone processes do not exist in reality or alter
native technologies show completely different technical performance and product quality output. In such cases,
the aim of allocation is to find a suitable partitioning parameter so that the inputs and outputs of the system can
be assigned to the specific product sub system under consideration.
Allocation was applied for the production process of single cases, as minor by products result from these spe
cific polyether polyol production processes. The by products had lower assignments than the main product
polyether polyol. The process intention is the production of polyether polyol only and in case the by product is
sold, price allocation was applied. Nevertheless, for these single cases, mass and price allocation led to differ
ences of less than 1% in the results.
15
For the main precursor propylene oxide mainly price allocation was applied based on feedback from the produc
ers. The sensitivity analysis has shown that even if mass allocation was applied the differences in the results
would be 2–3 %.
In the refinery operations, co production was addressed by applying allocation based on mass and net calorific
value [GaBi 5 2011]. The chosen allocation in refinery is based on several sensitivity analyses, which was accom
panied by petrochemical experts. The relevance and influence of possible other allocation keys in this context is
small. In steam cracking allocation according to net calorific value is applied. Relevance of other allocation rules
(mass) is below 2 %.
Life Cycle Inventory (LCI) Results
Formats of LCI DatasetFormats of LCI DatasetFormats of LCI DatasetFormats of LCI Dataset
The Eco profile is provided in three electronic formats:
• As input/output table in Excel®
• As XML document in EcoSpold format (www.ecoinvent.org)
• As XML document in ILCD format (http://lct.jrc.ec.europa.eu)
Key results are summarised below.
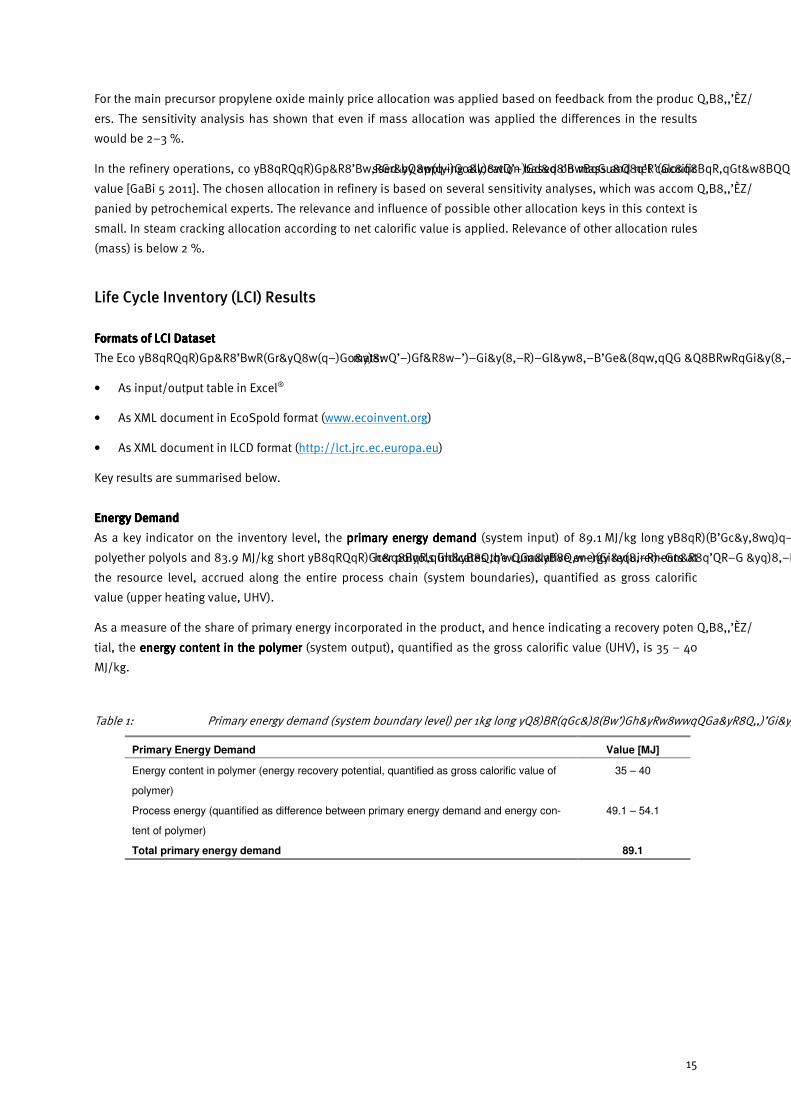
Energy DEnergy DEnergy DEnergy Demandemandemandemand
As a key indicator on the inventory level, the primary energyprimary energyprimary energyprimary energy demand demand demand demand (system input) of 89.1 MJ/kg long chain
polyether polyols and 83.9 MJ/kg short chain polyether polyols indicates the cumulative energy requirements at
the resource level, accrued along the entire process chain (system boundaries), quantified as gross calorific
value (upper heating value, UHV).
As a measure of the share of primary energy incorporated in the product, and hence indicating a recovery poten
tial, the energyenergyenergyenergy content incontent incontent incontent in thethethethe polymerpolymerpolymerpolymer (system output), quantified as the gross calorific value (UHV), is 35 – 40
MJ/kg.
Table 1: Primary energy demand (system boundary level) per 1kg long chain polyether polyols
Primary Energy Demand Value [MJ]
Energy content in polymer (energy recovery potential, quantified as gross calorific value of
polymer)
35 – 40
Process energy (quantified as difference between primary energy demand and energy con-
tent of polymer)
49.1 – 54.1
Total primary energy demand 89.1
16
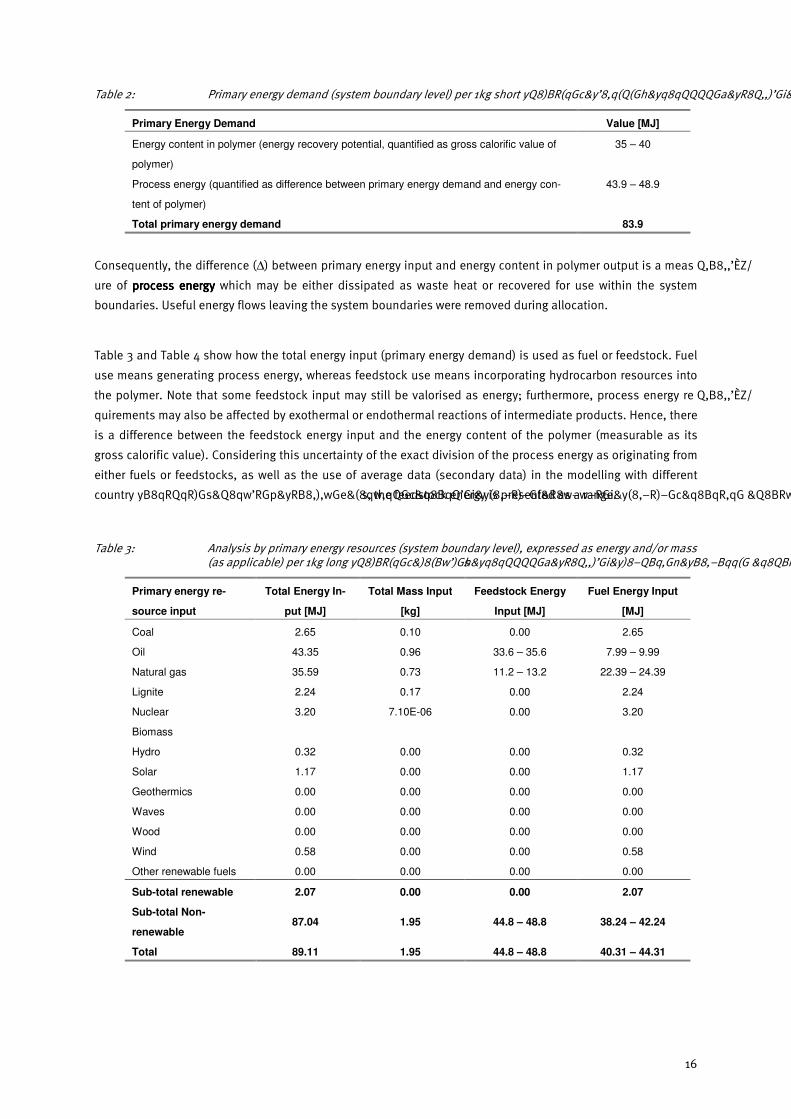
Table 2: Primary energy demand (system boundary level) per 1kg short chain polyether polyols
Primary Energy Demand Value [MJ]
Energy content in polymer (energy recovery potential, quantified as gross calorific value of
polymer)
35 – 40
Process energy (quantified as difference between primary energy demand and energy con-
tent of polymer)
43.9 – 48.9
Total primary energy demand 83.9
Consequently, the difference (∆) between primary energy input and energy content in polymer output is a meas
ure of process energyprocess energyprocess energyprocess energy which may be either dissipated as waste heat or recovered for use within the system
boundaries. Useful energy flows leaving the system boundaries were removed during allocation.
Table 3 and Table 4 show how the total energy input (primary energy demand) is used as fuel or feedstock. Fuel
use means generating process energy, whereas feedstock use means incorporating hydrocarbon resources into
the polymer. Note that some feedstock input may still be valorised as energy; furthermore, process energy re
quirements may also be affected by exothermal or endothermal reactions of intermediate products. Hence, there
is a difference between the feedstock energy input and the energy content of the polymer (measurable as its
gross calorific value). Considering this uncertainty of the exact division of the process energy as originating from
either fuels or feedstocks, as well as the use of average data (secondary data) in the modelling with different
country specific grades of crude oil and natural gas, the feedstock energy is presented as a range.
Table 3: Analysis by primary energy resources (system boundary level), expressed as energy and/or mass (as applicable) per 1kg long chain polyether polyols
Primary energy re-
source input
Total Energy In-
put [MJ]
Total Mass Input
[kg]
Feedstock Energy
Input [MJ]
Fuel Energy Input
[MJ]
Coal 2.65 0.10 0.00 2.65
Oil 43.35 0.96 33.6 – 35.6 7.99 – 9.99
Natural gas 35.59 0.73 11.2 – 13.2 22.39 – 24.39
Lignite 2.24 0.17 0.00 2.24
Nuclear 3.20 7.10E-06 0.00 3.20
Biomass
Hydro 0.32 0.00 0.00 0.32
Solar 1.17 0.00 0.00 1.17
Geothermics 0.00 0.00 0.00 0.00
Waves 0.00 0.00 0.00 0.00
Wood 0.00 0.00 0.00 0.00
Wind 0.58 0.00 0.00 0.58
Other renewable fuels 0.00 0.00 0.00 0.00
Sub-total renewable 2.07 0.00 0.00 2.07
Sub-total Non-
renewable 87.04 1.95 44.8 – 48.8 38.24 – 42.24
Total 89.11 1.95 44.8 – 48.8 40.31 – 44.31
17
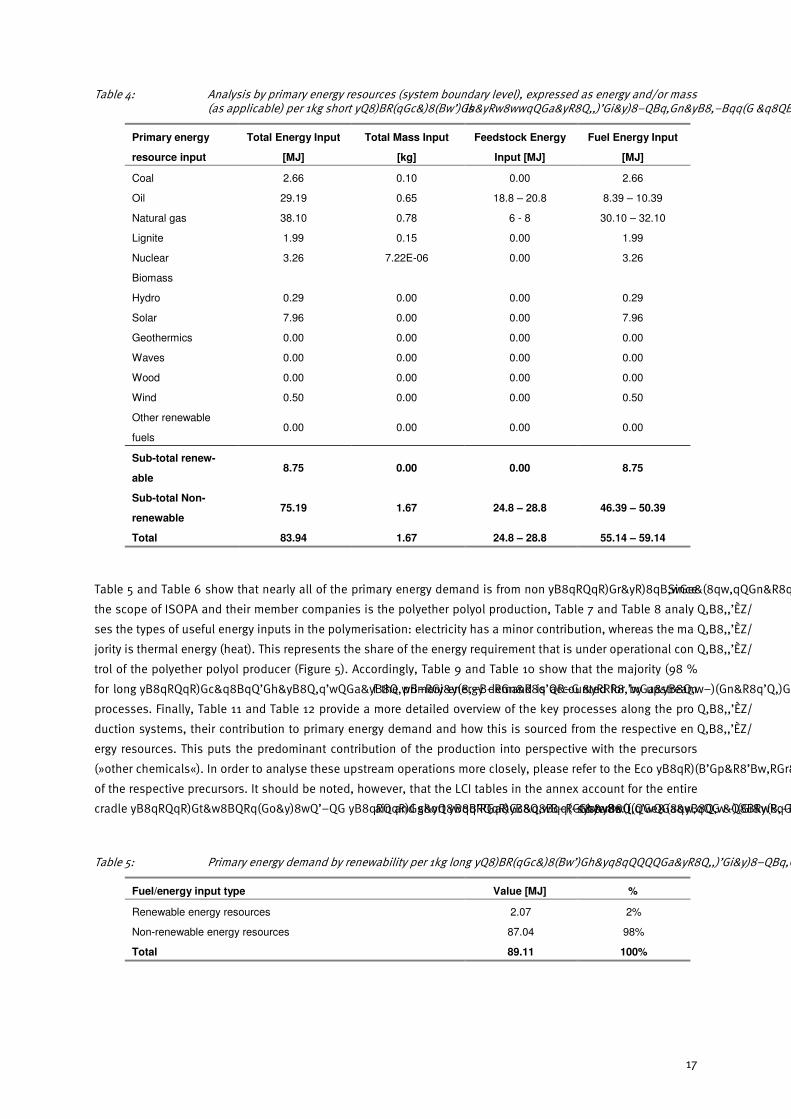
Table 4: Analysis by primary energy resources (system boundary level), expressed as energy and/or mass (as applicable) per 1kg short chain polyether polyols
Primary energy
resource input
Total Energy Input
[MJ]
Total Mass Input
[kg]
Feedstock Energy
Input [MJ]
Fuel Energy Input
[MJ]
Coal 2.66 0.10 0.00 2.66
Oil 29.19 0.65 18.8 – 20.8 8.39 – 10.39
Natural gas 38.10 0.78 6 - 8 30.10 – 32.10
Lignite 1.99 0.15 0.00 1.99
Nuclear 3.26 7.22E-06 0.00 3.26
Biomass
Hydro 0.29 0.00 0.00 0.29
Solar 7.96 0.00 0.00 7.96
Geothermics 0.00 0.00 0.00 0.00
Waves 0.00 0.00 0.00 0.00
Wood 0.00 0.00 0.00 0.00
Wind 0.50 0.00 0.00 0.50
Other renewable
fuels 0.00 0.00 0.00 0.00
Sub-total renew-
able 8.75 0.00 0.00 8.75
Sub-total Non-
renewable 75.19 1.67 24.8 – 28.8 46.39 – 50.39
Total 83.94 1.67 24.8 – 28.8 55.14 – 59.14
Table 5 and Table 6 show that nearly all of the primary energy demand is from non renewable resources. Since
the scope of ISOPA and their member companies is the polyether polyol production, Table 7 and Table 8 analy
ses the types of useful energy inputs in the polymerisation: electricity has a minor contribution, whereas the ma
jority is thermal energy (heat). This represents the share of the energy requirement that is under operational con
trol of the polyether polyol producer (Figure 5). Accordingly, Table 9 and Table 10 show that the majority (98 %
for long chain and short chain polyether polyols) of the primary energy demand is accounted for by upstream
processes. Finally, Table 11 and Table 12 provide a more detailed overview of the key processes along the pro
duction systems, their contribution to primary energy demand and how this is sourced from the respective en
ergy resources. This puts the predominant contribution of the production into perspective with the precursors
(»other chemicals«). In order to analyse these upstream operations more closely, please refer to the Eco profiles
of the respective precursors. It should be noted, however, that the LCI tables in the annex account for the entire
cradle to gate primary energy demand of the long chain and short chain polyether polyols systems.
Table 5: Primary energy demand by renewability per 1kg long chain polyether polyols
Fuel/energy input type Value [MJ] %
Renewable energy resources 2.07 2%
Non-renewable energy resources 87.04 98%
Total 89.11 100%
18
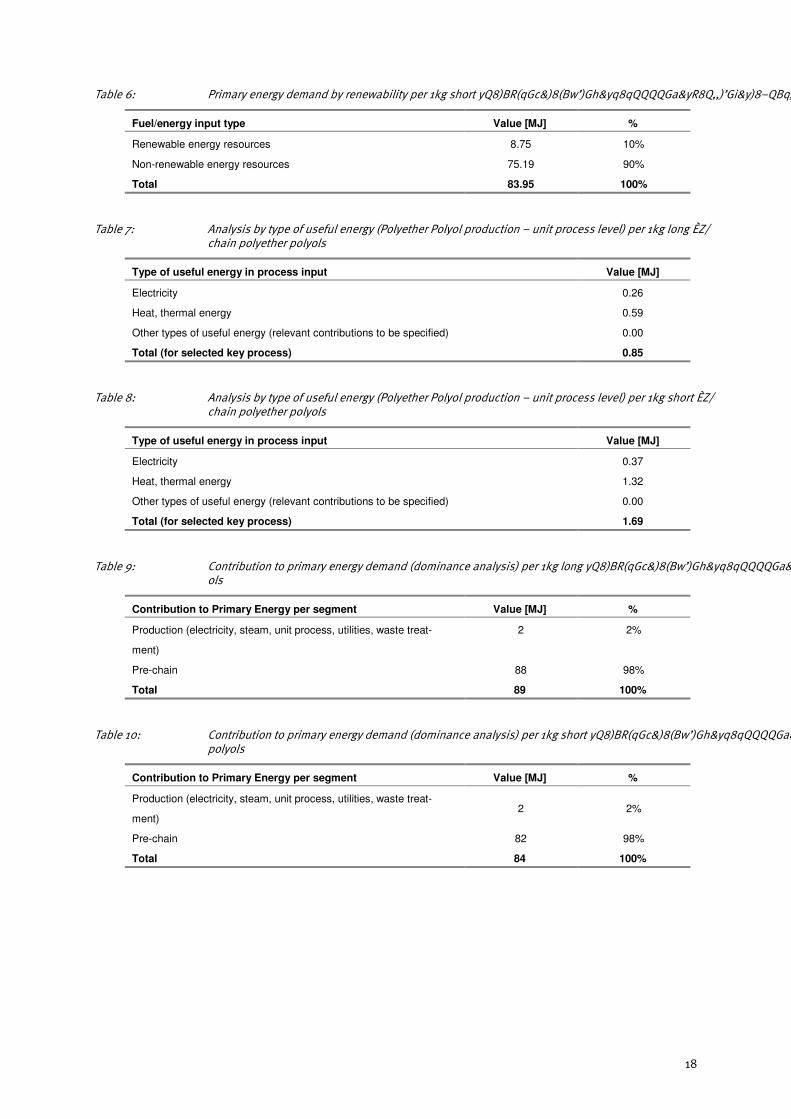
Table 6: Primary energy demand by renewability per 1kg short chain polyether polyols
Fuel/energy input type Value [MJ] %
Renewable energy resources 8.75 10%
Non-renewable energy resources 75.19 90%
Total 83.95 100%
Table 7: Analysis by type of useful energy (Polyether Polyol production – unit process level) per 1kg longchain polyether polyols
Type of useful energy in process input Value [MJ]
Electricity 0.26
Heat, thermal energy 0.59
Other types of useful energy (relevant contributions to be specified) 0.00
Total (for selected key process) 0.85
Table 8: Analysis by type of useful energy (Polyether Polyol production – unit process level) per 1kg shortchain polyether polyols
Type of useful energy in process input Value [MJ]
Electricity 0.37
Heat, thermal energy 1.32
Other types of useful energy (relevant contributions to be specified) 0.00
Total (for selected key process) 1.69
Table 9: Contribution to primary energy demand (dominance analysis) per 1kg long chain polyether polyols
Contribution to Primary Energy per segment Value [MJ] %
Production (electricity, steam, unit process, utilities, waste treat-
ment)
2 2%
Pre-chain 88 98%
Total 89 100%
Table 10: Contribution to primary energy demand (dominance analysis) per 1kg short chain polyether polyols
Contribution to Primary Energy per segment Value [MJ] %
Production (electricity, steam, unit process, utilities, waste treat-
ment) 2 2%
Pre-chain 82 98%
Total 84 100%
19
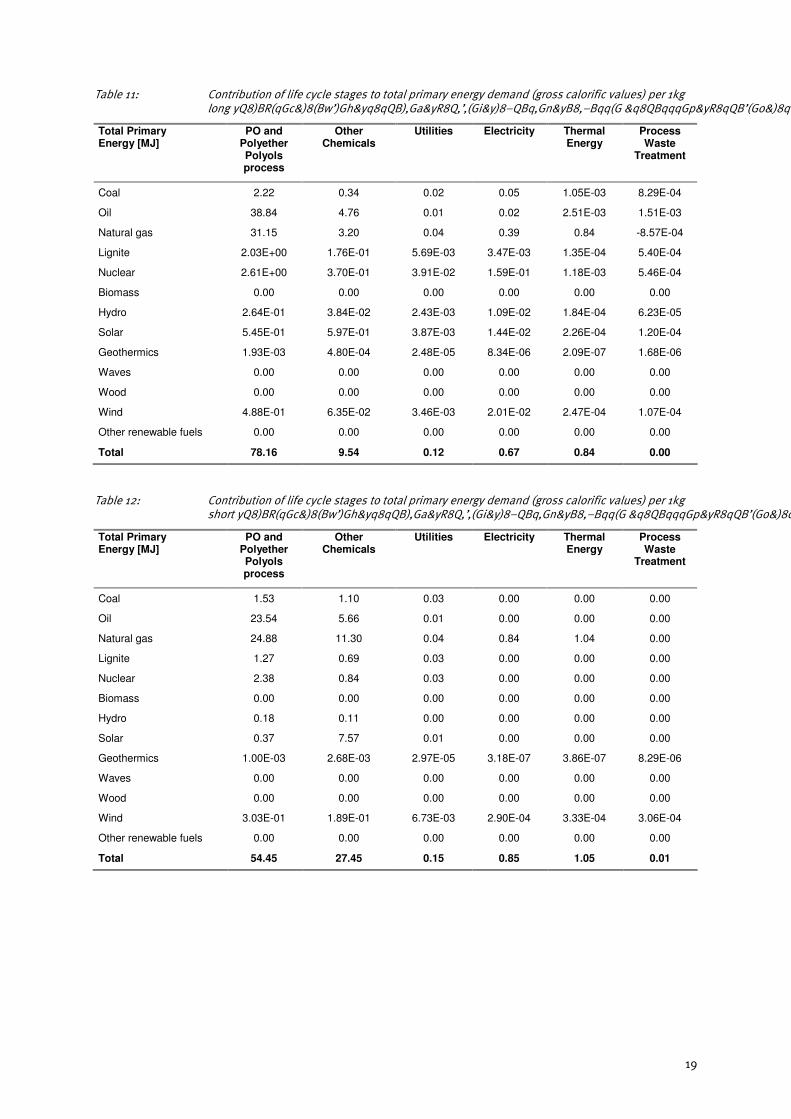
Table 11: Contribution of life cycle stages to total primary energy demand (gross calorific values) per 1kg long chain polyether polyols, see Figure 5
Total Primary Energy [MJ]
PO and Polyether Polyols process
Other Chemicals
Utilities Electricity Thermal Energy
Process Waste
Treatment
Coal 2.22 0.34 0.02 0.05 1.05E-03 8.29E-04
Oil 38.84 4.76 0.01 0.02 2.51E-03 1.51E-03
Natural gas 31.15 3.20 0.04 0.39 0.84 -8.57E-04
Lignite 2.03E+00 1.76E-01 5.69E-03 3.47E-03 1.35E-04 5.40E-04
Nuclear 2.61E+00 3.70E-01 3.91E-02 1.59E-01 1.18E-03 5.46E-04
Biomass 0.00 0.00 0.00 0.00 0.00 0.00
Hydro 2.64E-01 3.84E-02 2.43E-03 1.09E-02 1.84E-04 6.23E-05
Solar 5.45E-01 5.97E-01 3.87E-03 1.44E-02 2.26E-04 1.20E-04
Geothermics 1.93E-03 4.80E-04 2.48E-05 8.34E-06 2.09E-07 1.68E-06
Waves 0.00 0.00 0.00 0.00 0.00 0.00
Wood 0.00 0.00 0.00 0.00 0.00 0.00
Wind 4.88E-01 6.35E-02 3.46E-03 2.01E-02 2.47E-04 1.07E-04
Other renewable fuels 0.00 0.00 0.00 0.00 0.00 0.00
Total 78.16 9.54 0.12 0.67 0.84 0.00
Table 12: Contribution of life cycle stages to total primary energy demand (gross calorific values) per 1kg short chain polyether polyols, see Figure 5
Total Primary Energy [MJ]
PO and Polyether Polyols process
Other Chemicals
Utilities Electricity Thermal Energy
Process Waste
Treatment
Coal 1.53 1.10 0.03 0.00 0.00 0.00
Oil 23.54 5.66 0.01 0.00 0.00 0.00
Natural gas 24.88 11.30 0.04 0.84 1.04 0.00
Lignite 1.27 0.69 0.03 0.00 0.00 0.00
Nuclear 2.38 0.84 0.03 0.00 0.00 0.00
Biomass 0.00 0.00 0.00 0.00 0.00 0.00
Hydro 0.18 0.11 0.00 0.00 0.00 0.00
Solar 0.37 7.57 0.01 0.00 0.00 0.00
Geothermics 1.00E-03 2.68E-03 2.97E-05 3.18E-07 3.86E-07 8.29E-06
Waves 0.00 0.00 0.00 0.00 0.00 0.00
Wood 0.00 0.00 0.00 0.00 0.00 0.00
Wind 3.03E-01 1.89E-01 6.73E-03 2.90E-04 3.33E-04 3.06E-04
Other renewable fuels 0.00 0.00 0.00 0.00 0.00 0.00
Total 54.45 27.45 0.15 0.85 1.05 0.01
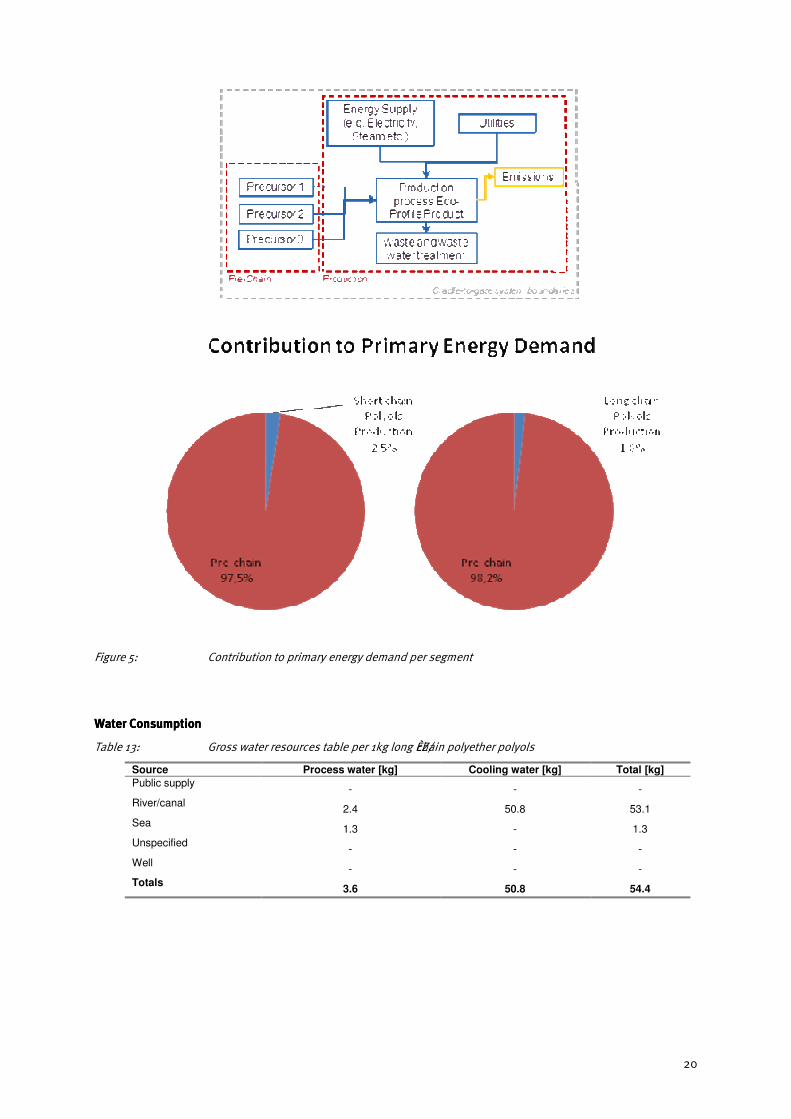
20
Figure 5: Contribution to primary energy demand per segment
Water ConsumptionWater ConsumptionWater ConsumptionWater Consumption
Table 13: Gross water resources table per 1kg long chain polyether polyols
Source Process water [kg] Cooling water [kg] Total [kg]
Public supply - - -
River/canal 2.4 50.8 53.1
Sea 1.3 - 1.3
Unspecified - - -
Well - - -
Totals 3.6 50.8 54.4
21
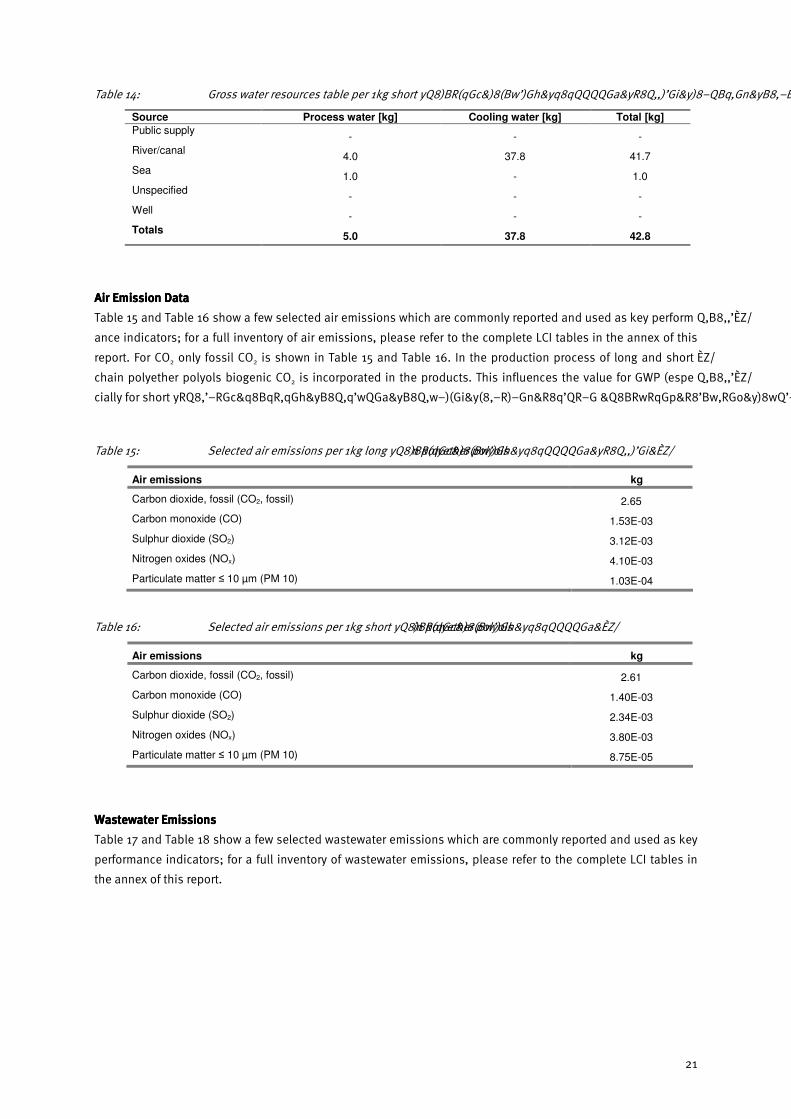
Table 14: Gross water resources table per 1kg short chain polyether polyols
Source Process water [kg] Cooling water [kg] Total [kg]
Public supply - - -
River/canal 4.0 37.8 41.7
Sea 1.0 - 1.0
Unspecified - - -
Well - - -
Totals 5.0 37.8 42.8
Air Emission DataAir Emission DataAir Emission DataAir Emission Data
Table 15 and Table 16 show a few selected air emissions which are commonly reported and used as key perform
ance indicators; for a full inventory of air emissions, please refer to the complete LCI tables in the annex of this
report. For CO2 only fossil CO2 is shown in Table 15 and Table 16. In the production process of long and short
chain polyether polyols biogenic CO2 is incorporated in the products. This influences the value for GWP (espe
cially for short chain polyether polyols).
Table 15: Selected air emissions per 1kg long chain polyether polyols
Air emissions kg
Carbon dioxide, fossil (CO2, fossil) 2.65
Carbon monoxide (CO) 1.53E-03
Sulphur dioxide (SO2) 3.12E-03
Nitrogen oxides (NOx) 4.10E-03
Particulate matter ≤ 10 µm (PM 10) 1.03E-04
Table 16: Selected air emissions per 1kg short chain polyether polyols
Air emissions kg
Carbon dioxide, fossil (CO2, fossil) 2.61
Carbon monoxide (CO) 1.40E-03
Sulphur dioxide (SO2) 2.34E-03
Nitrogen oxides (NOx) 3.80E-03
Particulate matter ≤ 10 µm (PM 10) 8.75E-05
Wastewater EmissionsWastewater EmissionsWastewater EmissionsWastewater Emissions
Table 17 and Table 18 show a few selected wastewater emissions which are commonly reported and used as key
performance indicators; for a full inventory of wastewater emissions, please refer to the complete LCI tables in
the annex of this report.

22
Table 17: Selected water emissions per 1kg long chain polyether polyols
Water emissions kg
Biological oxygen demand after 5 days (BOD 5) 1.96E-04
Chemical oxygen demand (COD) 7.25E-04
Total organic carbon (TOC) 2.17E-05
Table 18: Selected water emissions per 1kg short chain polyether polyols
Water emissions kg
Biological oxygen demand after 5 days (BOD 5) 1.56E-04
Chemical oxygen demand (COD) 5.72E-04
Total organic carbon (TOC) 1.70E-05
Solid WasteSolid WasteSolid WasteSolid Waste
Table 19: Solid waste generation per 1kg long chain polyether polyols (key foreground process level)
Waste for – Incineration Landfill Recovery Unspecified Total
kg kg kg kg kg
Non-hazardous 3.56E-03 4.19E-04 - - 3.98E-03
Hazardous 2.20E-06 - - - 2.20E-06
Unspecified - - - - -
Total 3.56E-03 4.19E-04 - - 3.98E-03
Table 20: Solid waste generation per 1kg short chain polyether polyols (key foreground process level)
Waste for – Incineration Landfill Recovery Unspecified Total
kg kg kg kg kg
Non-hazardous 1.41E-02 3.72E-04 - - 1.45E-02
Hazardous 1.95E-06 - - - 1.95E-06
Unspecified - - - - -
Total 1,41E-02 3,72E-04 - - 1,45E-02
23
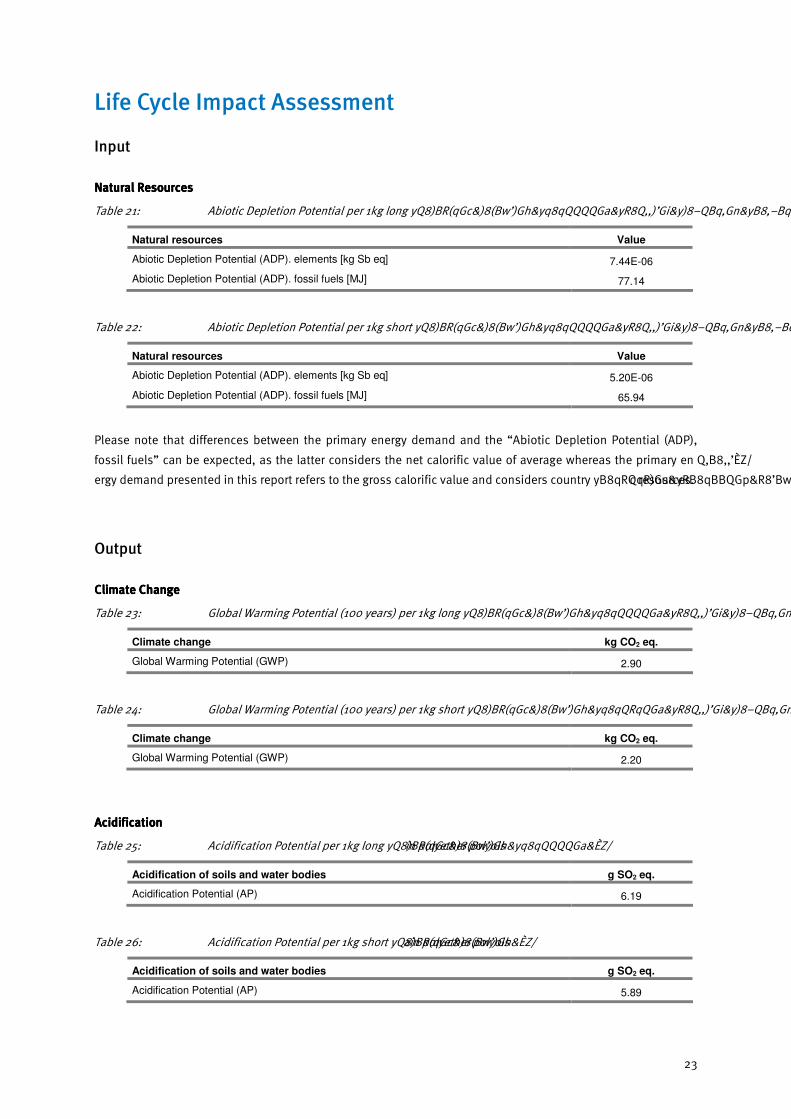
Life Cycle Impact Assessment
Input
Natural ResourcesNatural ResourcesNatural ResourcesNatural Resources
Table 21: Abiotic Depletion Potential per 1kg long chain polyether polyols
Natural resources Value
Abiotic Depletion Potential (ADP). elements [kg Sb eq] 7.44E-06
Abiotic Depletion Potential (ADP). fossil fuels [MJ] 77.14
Table 22: Abiotic Depletion Potential per 1kg short chain polyether polyols
Natural resources Value
Abiotic Depletion Potential (ADP). elements [kg Sb eq] 5.20E-06
Abiotic Depletion Potential (ADP). fossil fuels [MJ] 65.94
Please note that differences between the primary energy demand and the “Abiotic Depletion Potential (ADP),
fossil fuels” can be expected, as the latter considers the net calorific value of average whereas the primary en
ergy demand presented in this report refers to the gross calorific value and considers country specific resources.
Output
Climate ChangeClimate ChangeClimate ChangeClimate Change
Table 23: Global Warming Potential (100 years) per 1kg long chain polyether polyols
Climate change kg CO2 eq.
Global Warming Potential (GWP) 2.90
Table 24: Global Warming Potential (100 years) per 1kg short chain polyether polyols
Climate change kg CO2 eq.
Global Warming Potential (GWP) 2.20
AcidificationAcidificationAcidificationAcidification
Table 25: Acidification Potential per 1kg long chain polyether polyols
Acidification of soils and water bodies g SO2 eq.
Acidification Potential (AP) 6.19
Table 26: Acidification Potential per 1kg short chain polyether polyols
Acidification of soils and water bodies g SO2 eq.
Acidification Potential (AP) 5.89
24
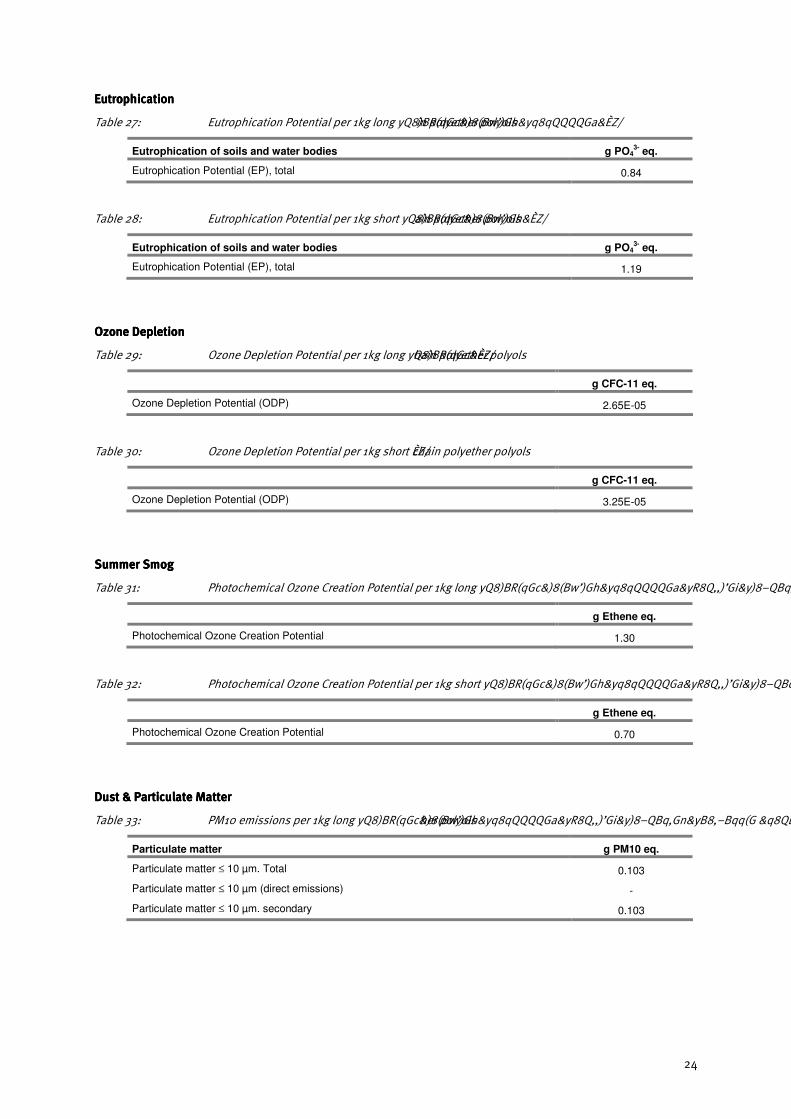
EutrophicationEutrophicationEutrophicationEutrophication
Table 27: Eutrophication Potential per 1kg long chain polyether polyols
Eutrophication of soils and water bodies g PO43- eq.
Eutrophication Potential (EP), total 0.84
Table 28: Eutrophication Potential per 1kg short chain polyether polyols
Eutrophication of soils and water bodies g PO43- eq.
Eutrophication Potential (EP), total 1.19
Ozone DepletionOzone DepletionOzone DepletionOzone Depletion
Table 29: Ozone Depletion Potential per 1kg long chain polyether polyols
g CFC-11 eq.
Ozone Depletion Potential (ODP) 2.65E-05
Table 30: Ozone Depletion Potential per 1kg short chain polyether polyols
g CFC-11 eq.
Ozone Depletion Potential (ODP) 3.25E-05
SSSSummer Smogummer Smogummer Smogummer Smog
Table 31: Photochemical Ozone Creation Potential per 1kg long chain polyether polyols
g Ethene eq.
Photochemical Ozone Creation Potential 1.30
Table 32: Photochemical Ozone Creation Potential per 1kg short chain polyether polyols
g Ethene eq.
Photochemical Ozone Creation Potential 0.70
Dust & Particulate MatterDust & Particulate MatterDust & Particulate MatterDust & Particulate Matter
Table 33: PM10 emissions per 1kg long chain polyether polyols
Particulate matter g PM10 eq.
Particulate matter ≤ 10 µm. Total 0.103
Particulate matter ≤ 10 µm (direct emissions) -
Particulate matter ≤ 10 µm. secondary 0.103
25
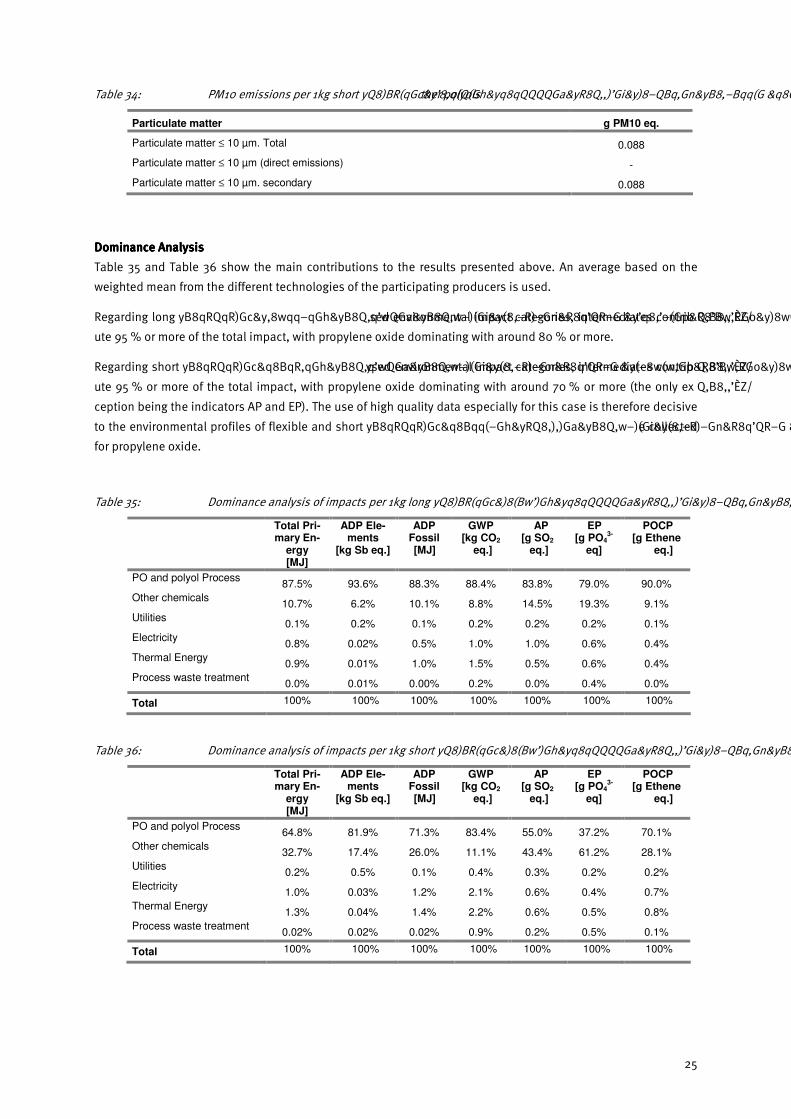
Table 34: PM10 emissions per 1kg short chain polyether polyols
Particulate matter g PM10 eq.
Particulate matter ≤ 10 µm. Total 0.088
Particulate matter ≤ 10 µm (direct emissions) -
Particulate matter ≤ 10 µm. secondary 0.088
DominanceDominanceDominanceDominance Analysis Analysis Analysis Analysis
Table 35 and Table 36 show the main contributions to the results presented above. An average based on the
weighted mean from the different technologies of the participating producers is used.
Regarding long chain polyether polyols in all analysed environmental impact categories, intermediates contrib
ute 95 % or more of the total impact, with propylene oxide dominating with around 80 % or more.
Regarding short chain polyether polyols in all analysed environmental impact categories, intermediates contrib
ute 95 % or more of the total impact, with propylene oxide dominating with around 70 % or more (the only ex
ception being the indicators AP and EP). The use of high quality data especially for this case is therefore decisive
to the environmental profiles of flexible and short chain polyether polyols. Primary data was therefore collected
for propylene oxide.
Table 35: Dominance analysis of impacts per 1kg long chain polyether polyols
Total Pri-mary En-
ergy [MJ]
ADP Ele-ments
[kg Sb eq.]
ADP Fossil [MJ]
GWP [kg CO2
eq.]
AP [g SO2
eq.]
EP [g PO4
3-
eq]
POCP [g Ethene
eq.]
PO and polyol Process 87.5% 93.6% 88.3% 88.4% 83.8% 79.0% 90.0%
Other chemicals 10.7% 6.2% 10.1% 8.8% 14.5% 19.3% 9.1%
Utilities 0.1% 0.2% 0.1% 0.2% 0.2% 0.2% 0.1%
Electricity 0.8% 0.02% 0.5% 1.0% 1.0% 0.6% 0.4%
Thermal Energy 0.9% 0.01% 1.0% 1.5% 0.5% 0.6% 0.4%
Process waste treatment 0.0% 0.01% 0.00% 0.2% 0.0% 0.4% 0.0%
Total 100% 100% 100% 100% 100% 100% 100%
Table 36: Dominance analysis of impacts per 1kg short chain polyether polyols
Total Pri-mary En-
ergy [MJ]
ADP Ele-ments
[kg Sb eq.]
ADP Fossil [MJ]
GWP [kg CO2
eq.]
AP [g SO2
eq.]
EP [g PO4
3-
eq]
POCP [g Ethene
eq.]
PO and polyol Process 64.8% 81.9% 71.3% 83.4% 55.0% 37.2% 70.1%
Other chemicals 32.7% 17.4% 26.0% 11.1% 43.4% 61.2% 28.1%
Utilities 0.2% 0.5% 0.1% 0.4% 0.3% 0.2% 0.2%
Electricity 1.0% 0.03% 1.2% 2.1% 0.6% 0.4% 0.7%
Thermal Energy 1.3% 0.04% 1.4% 2.2% 0.6% 0.5% 0.8%
Process waste treatment 0.02% 0.02% 0.02% 0.9% 0.2% 0.5% 0.1%
Total 100% 100% 100% 100% 100% 100% 100%
26
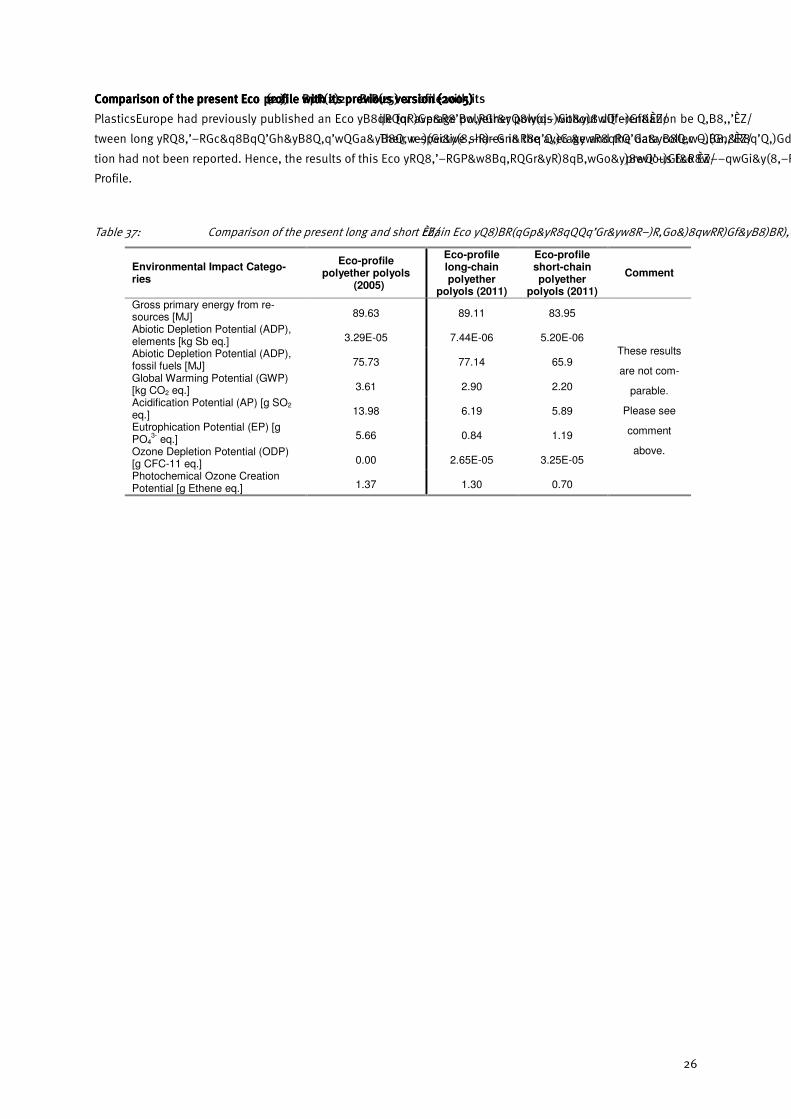
Comparison Comparison Comparison Comparison of the present Ecoof the present Ecoof the present Ecoof the present Eco profile with its profile with its profile with its profile with its previous version (previous version (previous version (previous version (2020202005050505))))
PlasticsEurope had previously published an Eco profile for average polyether polyols without differentiation be
tween long chain and short chain polyether polyols. Their respective shares in the average and the data collec
tion had not been reported. Hence, the results of this Eco Profile are not directly comparable to the previous Eco
Profile.
Table 37: Comparison of the present long and short chain Eco profile with its previous version (2005)
Environmental Impact Catego-ries
Eco-profile polyether polyols
(2005)
Eco-profile long-chain polyether
polyols (2011)
Eco-profile short-chain polyether
polyols (2011)
Comment
Gross primary energy from re-sources [MJ] 89.63 89.11 83.95
Abiotic Depletion Potential (ADP), elements [kg Sb eq.] 3.29E-05 7.44E-06 5.20E-06
Abiotic Depletion Potential (ADP), fossil fuels [MJ] 75.73 77.14 65.9
Global Warming Potential (GWP) [kg CO2 eq.] 3.61 2.90 2.20
Acidification Potential (AP) [g SO2 eq.] 13.98 6.19 5.89
Eutrophication Potential (EP) [g PO4
3- eq.] 5.66 0.84 1.19
Ozone Depletion Potential (ODP) [g CFC-11 eq.] 0.00 2.65E-05 3.25E-05
Photochemical Ozone Creation Potential [g Ethene eq.] 1.37 1.30 0.70
These results
are not com-
parable.
Please see
comment
above.
27
Review
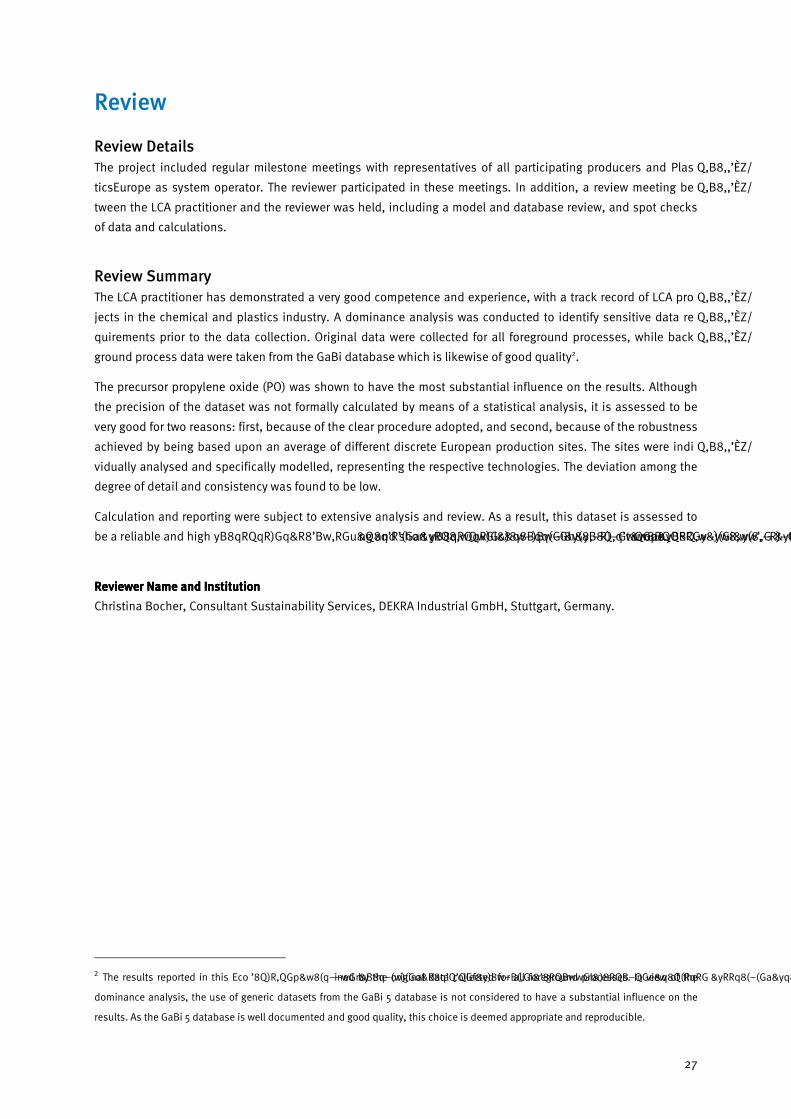
Review Details
The project included regular milestone meetings with representatives of all participating producers and Plas
ticsEurope as system operator. The reviewer participated in these meetings. In addition, a review meeting be
tween the LCA practitioner and the reviewer was held, including a model and database review, and spot checks
of data and calculations.
Review Summary
The LCA practitioner has demonstrated a very good competence and experience, with a track record of LCA pro
jects in the chemical and plastics industry. A dominance analysis was conducted to identify sensitive data re
quirements prior to the data collection. Original data were collected for all foreground processes, while back
ground process data were taken from the GaBi database which is likewise of good quality2.
The precursor propylene oxide (PO) was shown to have the most substantial influence on the results. Although
the precision of the dataset was not formally calculated by means of a statistical analysis, it is assessed to be
very good for two reasons: first, because of the clear procedure adopted, and second, because of the robustness
achieved by being based upon an average of different discrete European production sites. The sites were indi
vidually analysed and specifically modelled, representing the respective technologies. The deviation among the
degree of detail and consistency was found to be low.
Calculation and reporting were subject to extensive analysis and review. As a result, this dataset is assessed to
be a reliable and high quality representation of long and short chain polyether polyol production in Europe.
Reviewer Reviewer Reviewer Reviewer NNNName and ame and ame and ame and IIIInstitutionnstitutionnstitutionnstitution
Christina Bocher, Consultant Sustainability Services, DEKRA Industrial GmbH, Stuttgart, Germany.
2 The results reported in this Eco profile are determined by the original data collected for all foreground processes. In view of the
dominance analysis, the use of generic datasets from the GaBi 5 database is not considered to have a substantial influence on the
results. As the GaBi 5 database is well documented and good quality, this choice is deemed appropriate and reproducible.
28
References
BOUSTEAD 2005 Boustead, I., Eco profiles of the European Plastics Industry: Polyether Polyol,
Plastics Europe, March 2005
EYERER 1996 Ganzheitliche Bilanzierung – Werkzeug zum Planen und Wirtschaften in
Kreisläufen, 1996
GABI 5 2011 GaBi 5 Software System and Databases for Life Cycle Engineering, Stuttgart,
Echterdingen, 1992 2011
GUINÈE ET AL. 2001 Guinée, J. et. al. Handbook on Life Cycle Assessment Operational Guide to
the ISO Standards. Centre of Environmental Science, Leiden University
(CML); The Netherlands, 2001.
GUINÉE ET AL. 2002 Handbook on Life Cycle Assessment: An operational Guide to the ISO Stan
dards; Dordrecht: Kluwer Academic Publishers, 2002.
HEIJUNGS 1992 Heijungs, R., J. Guinée, G. Huppes, R.M. Lankreijer, H.A. Udo de Haes, A.
Wegener Sleeswijk, A.M.M. Ansems, P.G. Eggels, R. van Duin, H.P. de Goede,
1992: Environmental Life Cycle Assessment of products. Guide and Back
grounds. Centre of Environmental Science (CML), Leiden University, Leiden.
HUIJBREGTS 1999 Huijbregts, M., 1999b: Life cycle impact assessment of acidifying and eutro
phying air pollutants. Calculation of equivalency factors with RAINS LCA. In
terfaculty Department of Environmental Science, Faculty of Environmental
Science, University of Amsterdam, The Netherlands. Forthcoming.
HUIJBREGTS 2000 Huijbregts, M.A.J., 2000. Priority Assessment of Toxic Substances in the
frame of LCA. Time horizon dependency of toxicity potentials calculated with
the multi media fate, exposure and effects model USES LCA. Institute for
Biodiversity and Ecosystem Dynamics, University of Amsterdam, Amsterdam,
The Netherlands. (http://www.leidenuniv.nl/interfac/cml/lca2/).
IFS 95 Ifs Group, Envirofoam Chemicals Ltd.; U.K., B.G. Colvin; Low Cost Polyether
polyols from Natural Oils
IPCC 2007 IPCC, 2007: Climate Change 2007: The Physical Science Basis. Contribution
of Working Group I to the Fourth Assessment. Report of the Intergovernmen
tal Panel on Climate Change. [Solomon, S., D. Qin, M. Manning, Z. Chen, M.
Marquis, K.B. Averyt, M. Tignor and H.L. Miller (eds.)]. Cambridge University
Press, Cambridge, United Kingdom and New York, NY, USA, 996 pp.
ISO 14040: 2006 ISO 14040 Environmental Management – Life Cycle Assessment – Principles
and Framework. Geneva, 2006
ISO 14044: 2006 ISO 14044 Environmental management Life cycle assessment Require
ments and guidelines. Geneva, 2006
ILCD 2010 European Commission (2010): ILCD Handbook – General guide for Life Cycle
Assessment (LCA) – Detailed guidance
NREL 2007 National Renewable Energy Laboratory: U.S. LCI Database Project
Data Module Report, April 18, 2007; Polyether Polyether polyol for rigid foam
polyurethane
PLASTICSEUROPE 2010 Life Cycle Inventory (LCI) Methodology and Product Category Rules (PCR) for
Uncompounded Polymer Resins and Reactive Polymer Precursors. Version
2.0, April 2011.

29
SCIEN 2001 Scienzechimische.unipr.it; Trends in industrial catalysis in the polyurethane
industry; Gerhard Wegener, Matthias Brandt
ULLMANN 2010 Ullmann's Encyclopaedia of Industrial Chemistry, John Wiley & Sons, Inc. ,
Hoboken / USA, 2010
WMO 2003
WMO (World Meteorological Organisation), 2003: Scientific assessment of
ozone depletion: 2002. Global Ozone Research and Monitoring Project Re
port no. 47. Geneva.

30
2012
04
ISOPAISOPAISOPAISOPA
Avenue E. van Nieuwenhuyse 4
B 1160 Brussels ∙ Belgium
Tel.: +32 (2) 676 74 75
Fax: +32 (2) 676 74 79
www. Isopa.org


