Embed Size (px)
Citation preview
P t ti M t i lP t ti M t i lPresentation MaterialsPresentation Materialsfor IR Meetingfor IR Meetingfor IR Meetingfor IR Meeting
May 11, 2010(Tue)
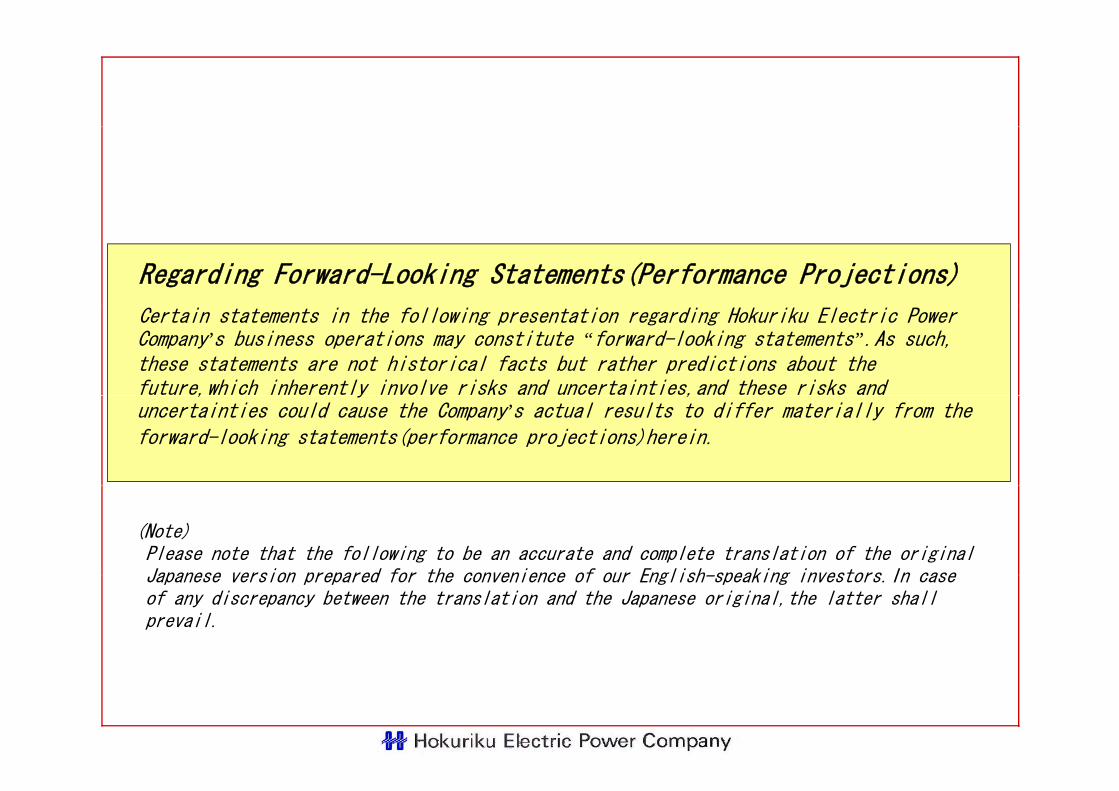
Regarding Forward-Looking Statements(Performance Projections)
Certain statements in the following presentation regarding Hokuriku Electric Power Company’s business operations may constitute “forward-looking statements”.As such, these statements are not historical facts but rather predictions about the future,which inherently involve risks and uncertainties,and these risks and , y ,uncertainties could cause the Company’s actual results to differ materially from the forward-looking statements(performance projections)herein.
(Note) Please note that the following to be an accurate and complete translation of the originalJapanese version prepared for the convenience of our English speaking investors In caseJapanese version prepared for the convenience of our English-speaking investors.In case of any discrepancy between the translation and the Japanese original,the latter shallprevail.
ContentsContents1.1. Summary of FY 2009 Financial Results Summary of FY 2009 Financial Results ・・
Forecast of FY 2010Forecast of FY 2010
22 Hokuriku Electric Power Group EffortsHokuriku Electric Power Group Efforts2.2.Hokuriku Electric Power Group EffortsHokuriku Electric Power Group Efforts
◇◇ Business Environment ChangesBusiness Environment Changes
◇◇ N M diN M di M P liM P li◇◇ New MediumNew Medium--term Management Policyterm Management Policy
◇◇ Four Basic Management Policies Four Basic Management Policies
◇◇ Toward Continuous Growth and Progress Toward Continuous Growth and Progress
◆ Details of Financial Results and Forecast
1.1. Summary of FY 2009Summary of FY 2009
Financial ResultsFinancial Results・・
Forecast of FY 2010 Forecast of FY 2010
11
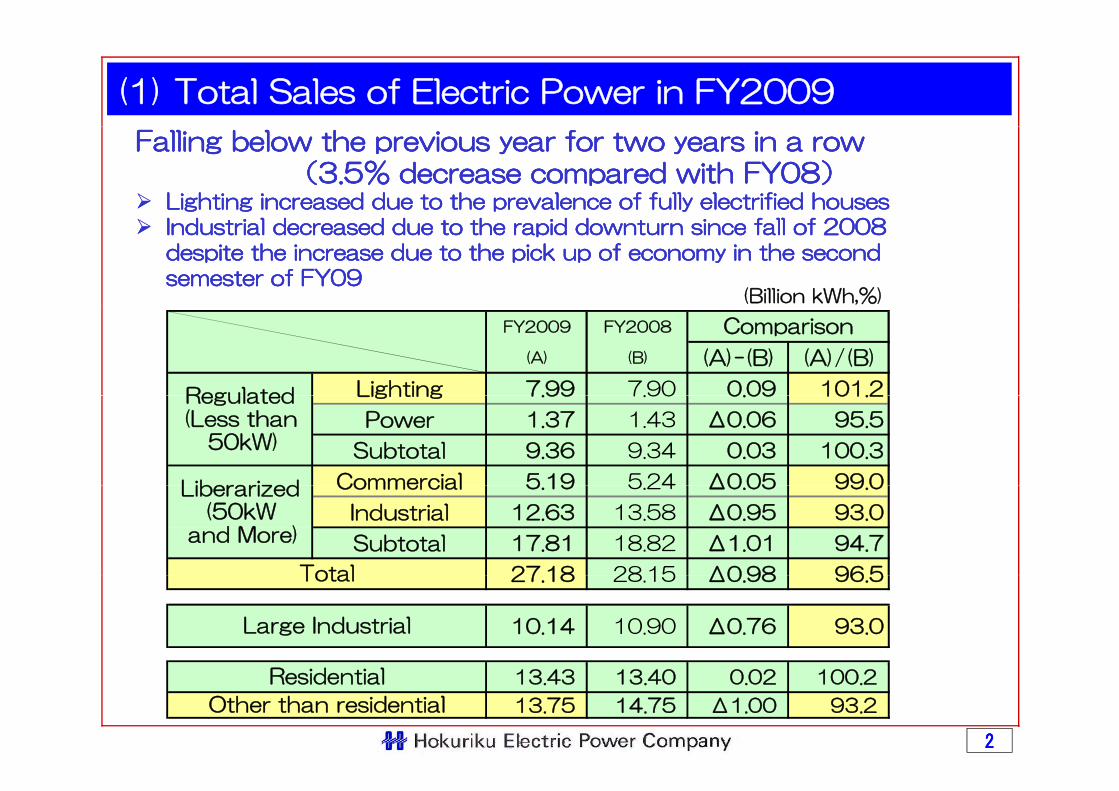
(1) Total Sales of Electric Power in FY2009
Falling below the previous year for two years in a rowFalling below the previous year for two years in a row((3.53.5%% decrease compared with FY08decrease compared with FY08))
Lighting increased due to the prevalence of fully electrified housesLighting increased due to the prevalence of fully electrified housesIndustrial decreased due to the rapid downturn since fall of 2008 Industrial decreased due to the rapid downturn since fall of 2008 despite the increase due to the pick up of economy in the second despite the increase due to the pick up of economy in the second semester of FY09semester of FY09
(Billion kWh,%)
FY2009 FY2008
(A) (B) (A)-(B) (A)/(B)
Lighting 7.99 7.90 0.09 101.2
Comparison
Regulated Lighting 7.99 7.90 0.09 101.2
Power 1.37 1.43 Δ0.06 95.5
Subtotal 9.36 9.34 0.03 100.3
Commercial 5 19 5 24 Δ0 05 99 0
Regulated(Less than
50kW)
Liberarized Commercial 5.19 5.24 Δ0.05 99.0
Industrial 12.63 13.58 Δ0.95 93.0
Subtotal 17.81 18.82 Δ1.01 94.7
27 18 28 15 Δ0 98 96 5Total
Liberarized(50kW
and More)
27.18 28.15 Δ0.98 96.5
10.14 10.90 Δ0.76 93.0
Total
Large Industrial
22
13.43 13.40 0.02 100.2
13.75 14.75 Δ1.00 93.2 Other than residential
Residential
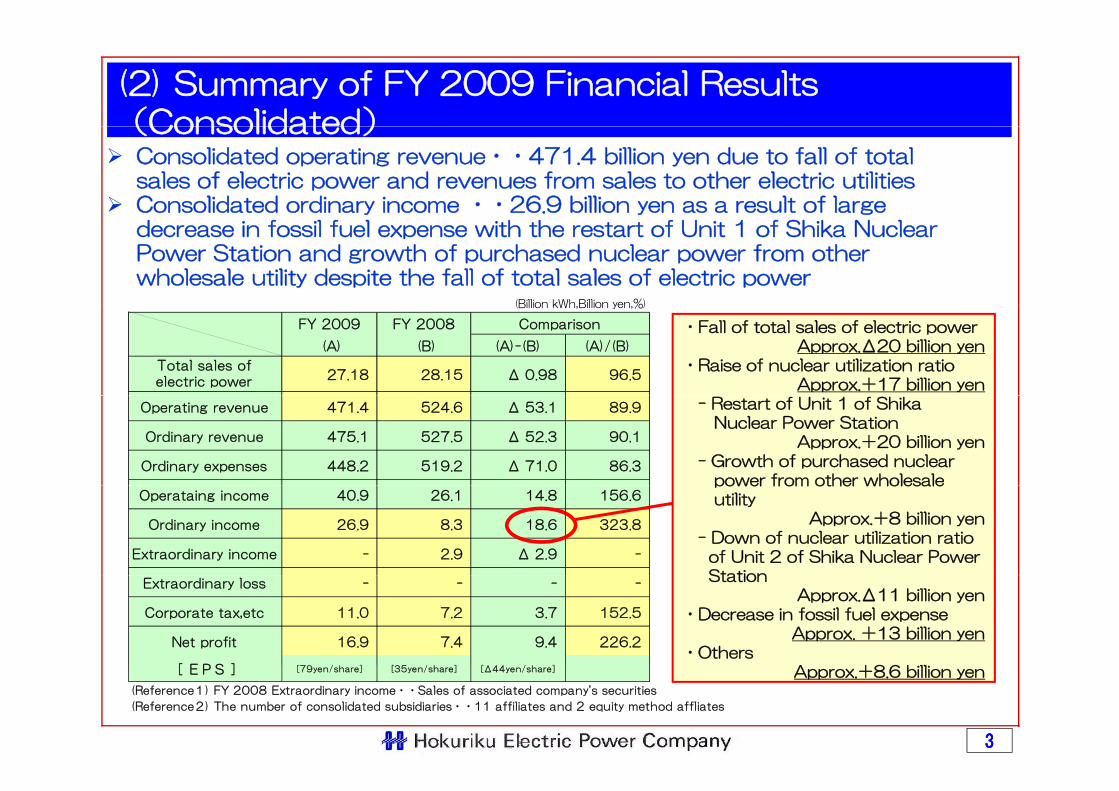
(2) Summary of FY 2009 Financial Results (Consolidated)(Consolidated)
Consolidated operating revenue・・471.4 billion yen due to fall of totalsales of electric power and revenues from sales to other electric utilitiesConsolidated ordinary income ・・26.9 billion yen as a result of large
(Billion kWh Billion yen %)
decrease in fossil fuel expense with the restart of Unit 1 of Shika Nuclear Power Station and growth of purchased nuclear power from other wholesale utility despite the fall of total sales of electric power
(Billion kWh,Billion yen,%)
FY 2009 FY 2008
(A) (B) (A)-(B) (A)/(B)
Total sales ofelectric power
27.18 28.15 Δ 0.98 96.5
Comparison ・Fall of total sales of electric powerApprox.Δ20 billion yen
・Raise of nuclear utilization ratioApprox.+17 billion yen
Operating revenue 471.4 524.6 Δ 53.1 89.9
Ordinary revenue 475.1 527.5 Δ 52.3 90.1
Ordinary expenses 448.2 519.2 Δ 71.0 86.3
- Restart of Unit 1 of ShikaNuclear Power Station
Approx.+20 billion yen- Growth of purchased nuclear
power from other wholesaleOperataing income 40.9 26.1 14.8 156.6
Ordinary income 26.9 8.3 18.6 323.8
Extraordinary income - 2.9 Δ 2.9 -
power from other wholesaleutility
Approx.+8 billion yen- Down of nuclear utilization ratio
of Unit 2 of Shika Nuclear PowerStationExtraordinary loss - - - -
Corporate tax,etc 11.0 7.2 3.7 152.5
Net profit 16.9 7.4 9.4 226.2
[ EPS ] [ / ] [ / ] [ / ]
StationApprox.Δ11 billion yen
・Decrease in fossil fuel expenseApprox. +13 billion yen
・Others+[ EPS ] [79yen/share] [35yen/share] [Δ44yen/share]
(Reference1) FY 2008 Extraordinary income・・Sales of associated company's securities
(Reference2) The number of consolidated subsidiaries・・11 affiliates and 2 equity method affliates
33
Approx.+8.6 billion yen

(3) Forecast of Total Sales of Electric Poweri FY2010in FY2010
Approx. 27.4 billion kWh due to the prevalence of fullyelectrified houses and gradual economic recoveryelectrified houses and gradual economic recovery(1% increase compared with FY 2009)
(Billion kWh,%)
FY2009
(B)
Comparison
(A)/(B)(A)-(B)
FY2010[E]
(A)
0.2 101
100
13.43 13.6Residential
Other thanresidential
13.8 13.75 The same levelas the previous
Approx.
Approx.
Approx. Approx.
Approx.
0.2 101
residential year
27.18 Total sales ofelectric power
27.4Approx. Approx.
pp
Approx.electric power
44
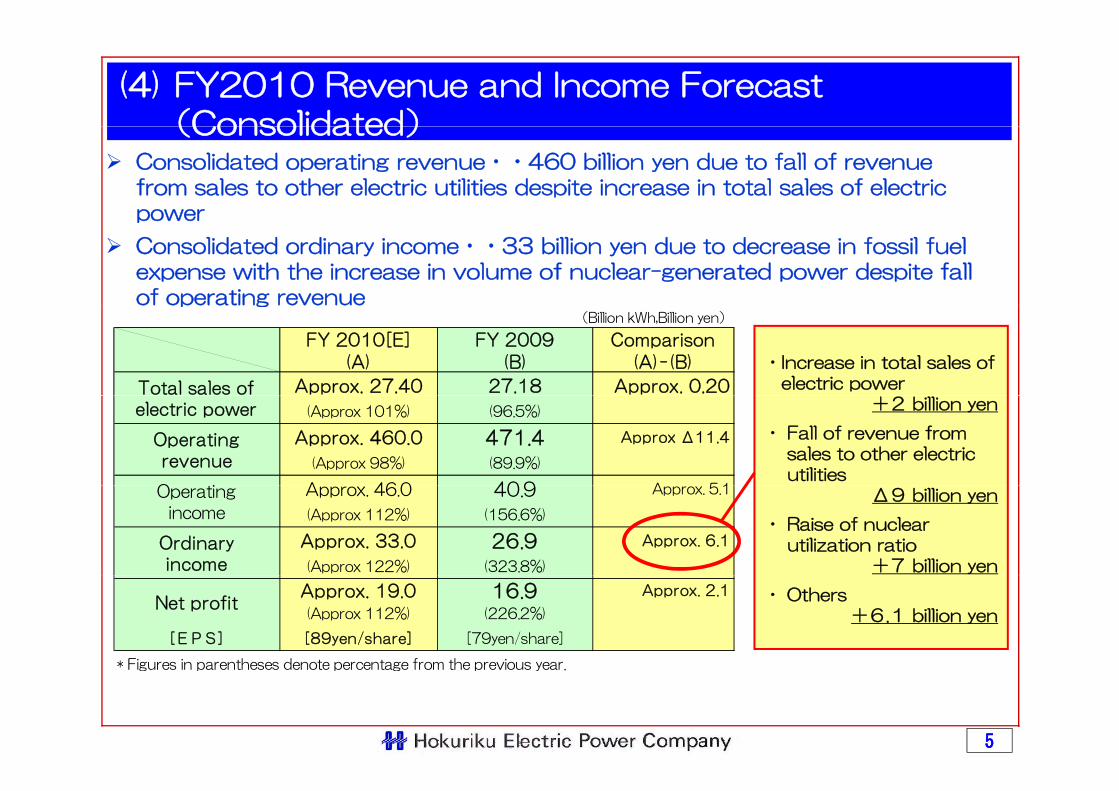
(4) FY2010 Revenue and Income Forecast(Consolidated)(Consolidated)
Consolidated operating revenue・・460 billion yen due to fall of revenue from sales to other electric utilities despite increase in total sales of electric powerpower
Consolidated ordinary income・・33 billion yen due to decrease in fossil fuel expense with the increase in volume of nuclear-generated power despite fall of operating revenue
(Billion kWh,Billion yen)
Approx. 0.20Approx. 27.40Total sales of
(B)
27.18
Comparison
(A)-(B)
FY 2010[E] FY 2009
(A)
p g
・Increase in total sales ofelectric power
Approx Δ11.4
A 5 1
Approx. 460.0
A 46 0
(Approx 101%)
(Approx 98%) (89.9%)
40 9
electric power
Operatingrevenue
O i
471.4
(96.5%) +2 billion yen
・ Fall of revenue fromsales to other electricutilities
Approx. 5.1Approx. 46.0
Approx. 33.0 Approx. 6.1
40.9Operatingincome
Ordinaryincome
(156.6%)
(323.8%)
26.9
(Approx 112%)
(Approx 122%)
Δ9 billion yen
・ Raise of nuclearutilization ratio
+7 billion yen
[EPS]
* Figures in parentheses denote percentage from the previous year
Approx. 19.0 Approx. 2.1Net profit
16.9
[79yen/share][89yen/share]
(Approx 112%) (226.2%)・ Others
+6.1 billion yen
* Figures in parentheses denote percentage from the previous year.
55
2.2. Hokuriku Electric PowerHokuriku Electric PowerGroup EffortsGroup Efforts
66
◇ Business Environment Changes
77
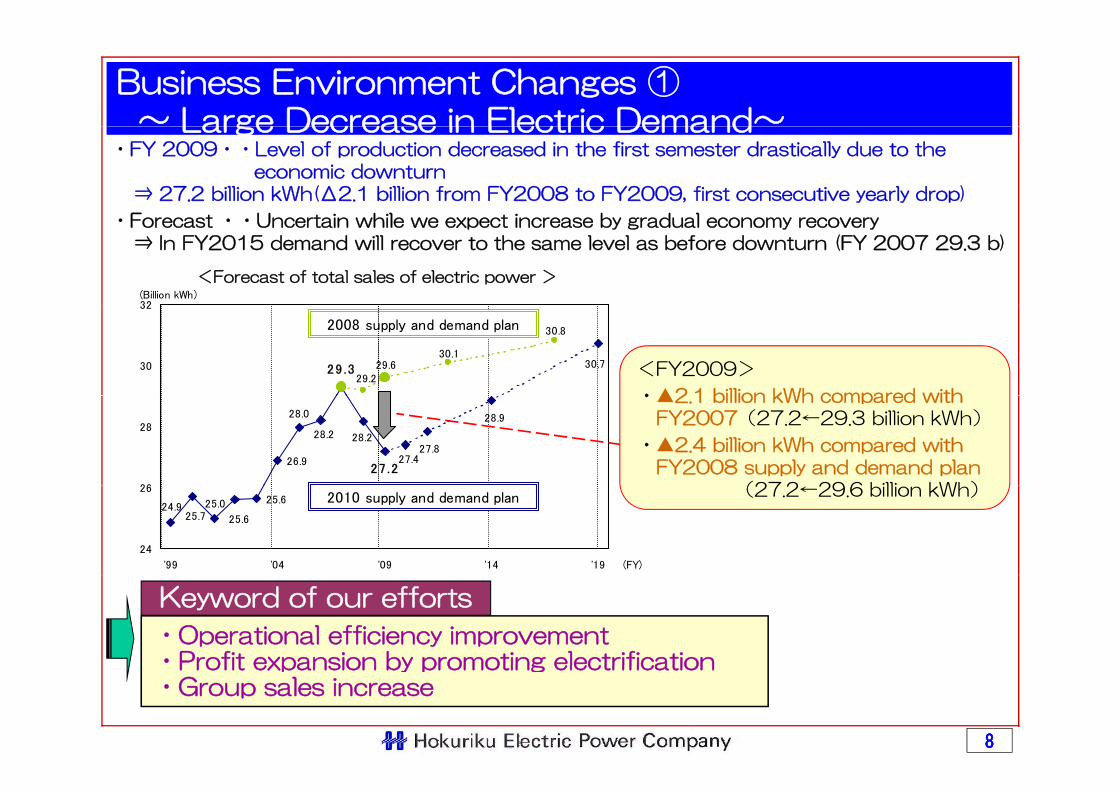
Business Environment Changes ①~ Large Decrease in Electric Demand~Large Decrease in Electric Demand
・FY 2009・・Level of production decreased in the first semester drastically due to theeconomic downturn
⇒ 27.2 billion kWh(Δ2.1 billion from FY2008 to FY2009, first consecutive yearly drop)
F t U t i hil t i b d l
32(Billion kWh)
・Forecast ・・Uncertain while we expect increase by gradual economy recovery⇒ In FY2015 demand will recover to the same level as before downturn (FY 2007 29.3 b)
<Forecast of total sales of electric power >
29 .3 30.7
30.8
30.129.6
29.230
32
2008 supply and demand plan
<FY2009>
・▲2 1 billion kWh compared with
26.9
28.0
27 .2
28.9
27.427.8
28.228.2
26
28
・▲2.1 billion kWh compared withFY2007(27.2←29.3 billion kWh)
・▲2.4 billion kWh compared withFY2008 supply and demand plan
(27 2 29 6 billi kWh)25.6
24.925.7
25.0
25.6
24
26
'99 '04 '09 '14 '19 (FY)
2010 supply and demand plan (27.2←29.6 billion kWh)
Keyword of our efforts
・Operational efficiency improvement・Profit expansion by promoting electrification
88
Profit expansion by promoting electrification ・Group sales increase
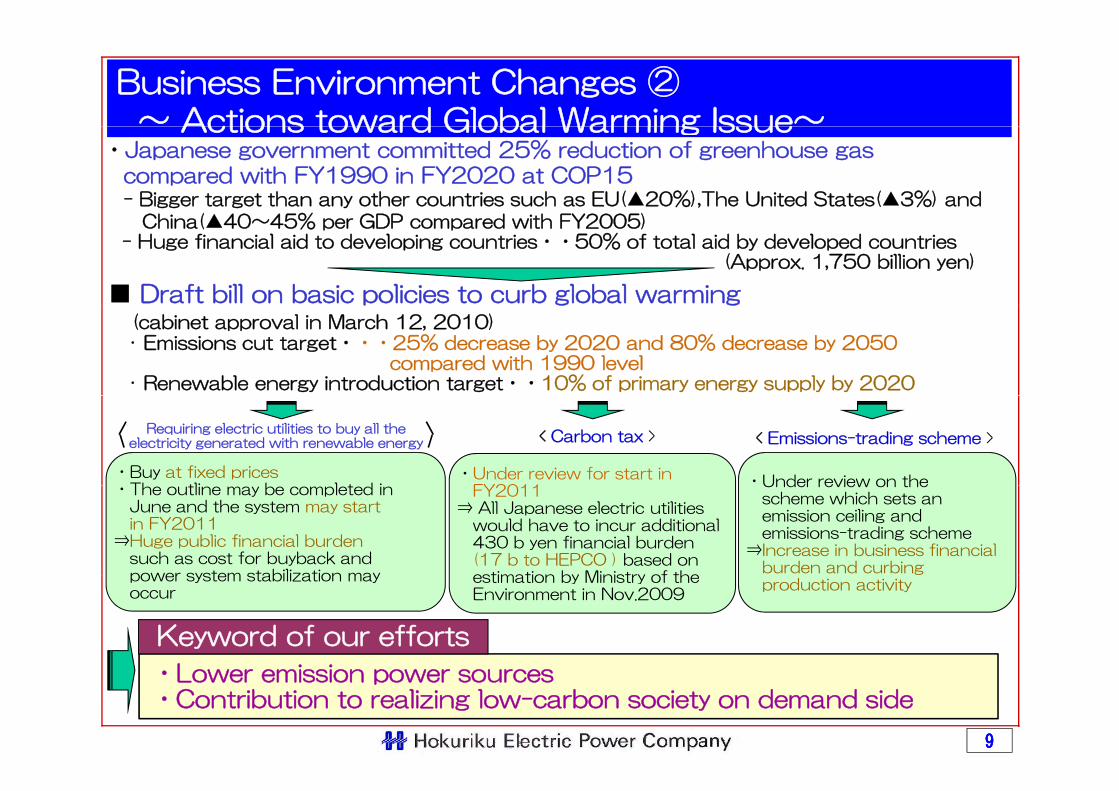
Business Environment Changes ②~ Actions toward Global Warming Issue~Actions toward Global Warming Issue
・Japanese government committed 25% reduction of greenhouse gas compared with FY1990 in FY2020 at COP15- Bigger target than any other countries such as EU(▲20%),The United States(▲3%) and
Chi (▲40 45% GDP d ith FY2005)China(▲40~45% per GDP compared with FY2005)- Huge financial aid to developing countries・・50% of total aid by developed countries
(Approx. 1,750 billion yen)
■ Draft bill on basic policies to curb global warming
・ Emissions cut target・・・25% decrease by 2020 and 80% decrease by 2050 compared with 1990 level
・ Renewable energy introduction target・・10% of primary energy supply by 2020
(cabinet approval in March 12, 2010)
Requiring electric utilities to buy all the electricity generated with renewable energy < Carbon tax > < Emissions-trading scheme >
・Under review on the・Buy at fixed prices
Th tli b l t d i・Under review for start in
FY2011Under review on thescheme which sets anemission ceiling andemissions-trading scheme
⇒Increase in business financialburden and curbing
・The outline may be completed in June and the system may start in FY2011
⇒Huge public financial burdensuch as cost for buyback and power system stabilization may
FY2011⇒ All Japanese electric utilities
would have to incur additional430 b yen financial burden(17 b to HEPCO ) based onestimation by Ministry of the
L i i
Keyword of our efforts
production activitypower system stabilization may occur
estimation by Ministry of theEnvironment in Nov.2009
99
・Lower emission power sources・Contribution to realizing low-carbon society on demand side
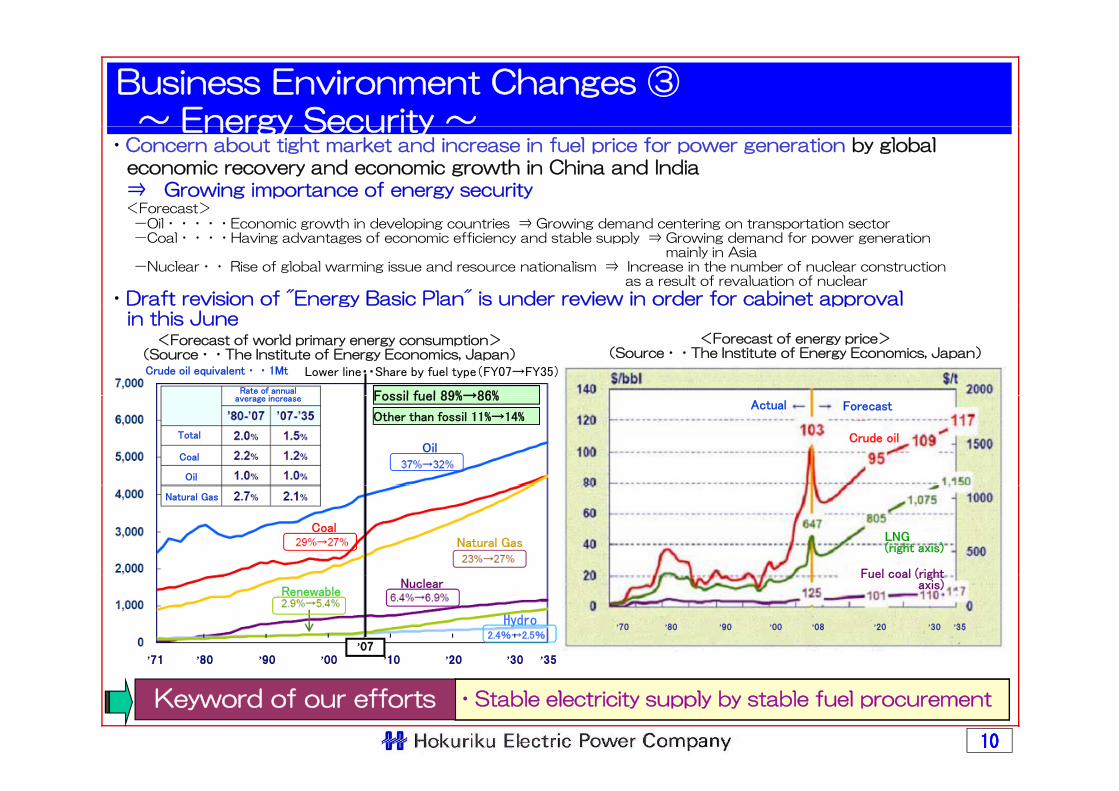
Business Environment Changes ③~ Energy Security ~Energy Security
・Concern about tight market and increase in fuel price for power generation by global economic recovery and economic growth in China and India⇒ Growing importance of energy security<Forecast>-Oil・・・・・Economic growth in developing countries ⇒ Growing demand centering on transportation sector-Coal・・・・Having advantages of economic efficiency and stable supply ⇒ Growing demand for power generation
mainly in Asia-Nuclear・・ Rise of global warming issue and resource nationalism ⇒ Increase in the number of nuclear construction
as a result of revaluation of nuclear
・Draft revision of "Energy Basic Plan" is under review in order for cabinet approval gy ppin this June
<Forecast of energy price>(Source・・The Institute of Energy Economics, Japan)
<Forecast of world primary energy consumption>(Source・・The Institute of Energy Economics, Japan)
Lower line・・Share by fuel type(FY07→FY35)
Fossil fuel 89%→86%Rate of annuali
Crude oil equivalent・・1Mt
Other than fossil 11%→14%
Fossil fuel 89%→86%
Oil
average increase
Total
Coal
Oil
Actual Forecast
Crude oil
Natural GasCoal
Natural Gas
Fuel coal (right
LNG(right axis)
Hydro2.4%→2.5%
’00 ’10 ’20 ’30 ’35’90’80’71
’70 ’80 ’90 ’00 ’08 ’20 ’30 ’35
NuclearRenewable
Fuel coal (right axis)
’07
1010
・Stable electricity supply by stable fuel procurementKeyword of our efforts
◇ N M di t◇ New Medium-term Management Policy
1111
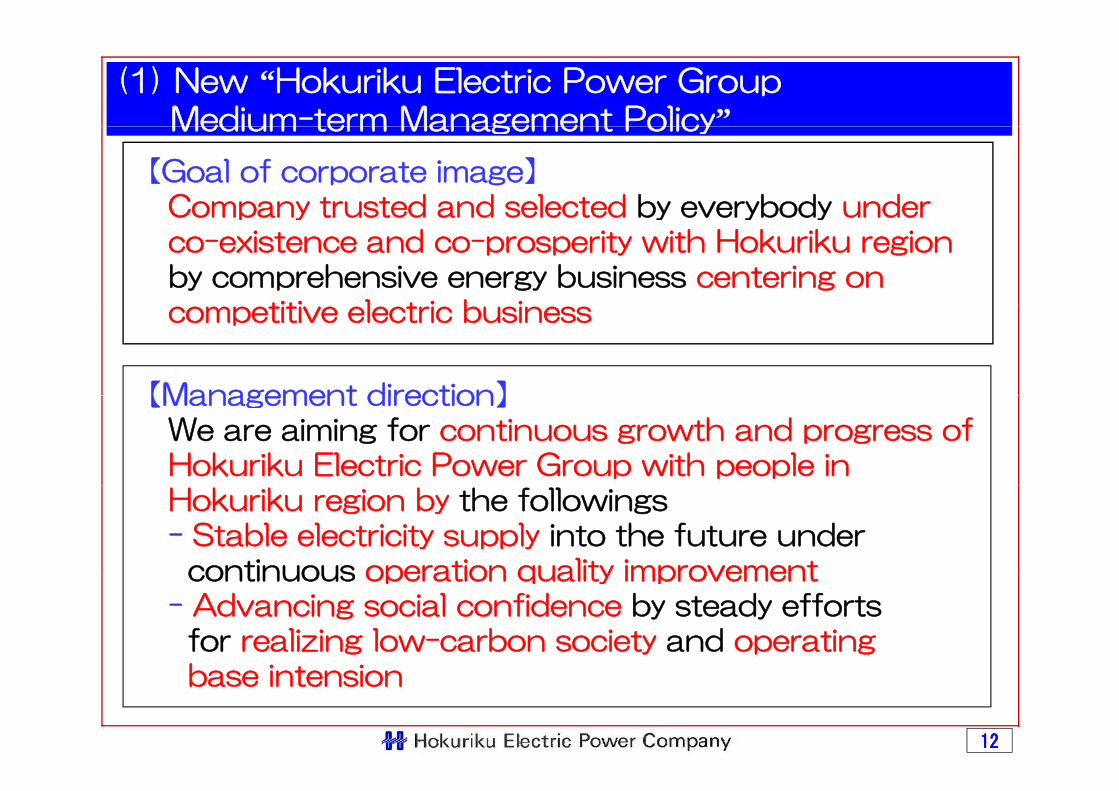
(1) New “Hokuriku Electric Power Group Medium-term Management Policy”Medium term Management Policy
【Goal of corporate image】Company trusted and selected by everybody underCompany trusted and selected by everybody under co-existence and co-prosperity with Hokuriku regionby comprehensive energy business centering on
titi l t i b i
【Management direction】
competitive electric business
【Management direction】We are aiming for continuous growth and progress of Hokuriku Electric Power Group with people in Hokuriku region by the followings- Stable electricity supply into the future under
continuous operation quality improvementcontinuous operation quality improvement - Advancing social confidence by steady efforts
for realizing low-carbon society and operating b i i
1212
base intension
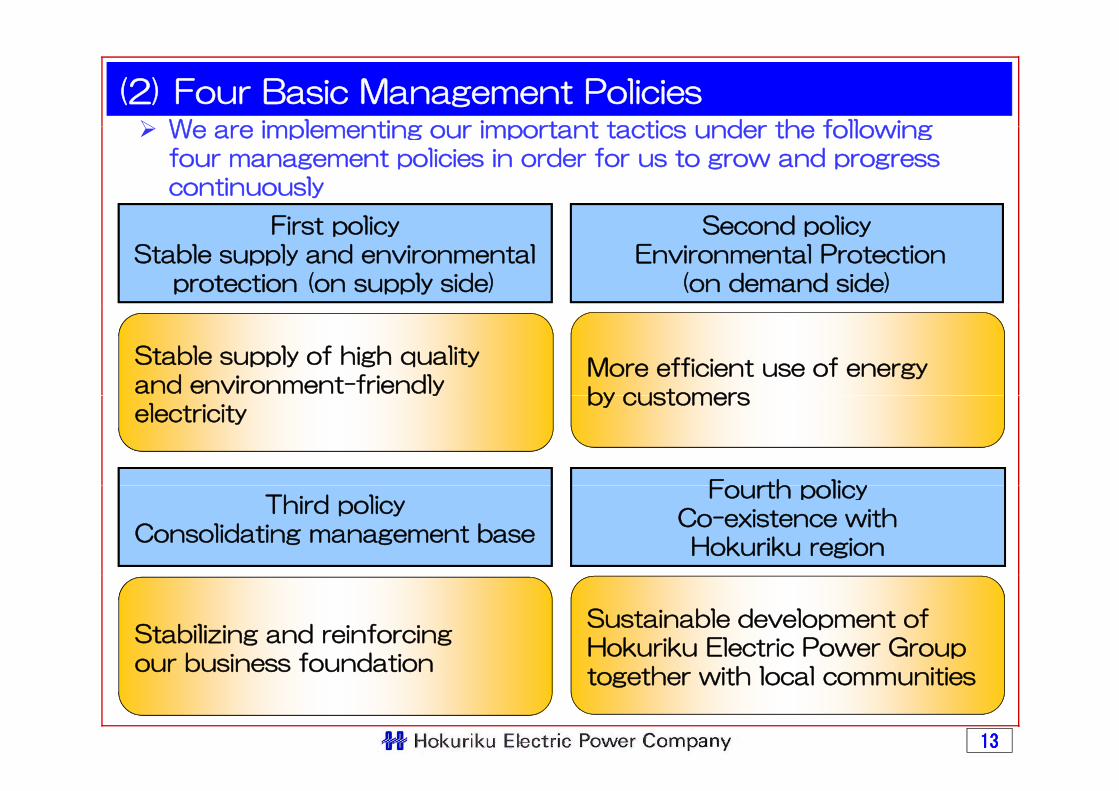
(2) Four Basic Management PoliciesWe are implementing our important tactics under the following
F l S d l
We are implementing our important tactics under the following four management policies in order for us to grow and progress continuously
First policyStable supply and environmental
protection (on supply side)
Second policyEnvironmental Protection
(on demand side)
Stable supply of high quality and environment-friendly
More efficient use of energyby customersy
electricityby customers
Fourth policyThird policy
Consolidating management base
Fourth policyCo-existence with Hokuriku region
Stabilizing and reinforcingour business foundation
Sustainable development ofHokuriku Electric Power Group
1313
our business foundationtogether with local communities
◇ Four Basic Management Policies
1414
【First Policy】
Stable supply of high quality and
【 y】
environment-friendly electricity
■ Safe and stable operation of Shika Nuclear Power StationShika Nuclear Power Station
■ Efforts to secure stable supply
■ Efforts to realize low-carbon societyon supply side
1515
on supply side
■ Safe and stable operation of■ Safe and stable operation of Shika Nuclear Power Station
1616
Safe and Stable Operation of Shika Nuclear Power Station ① ~ Importance of Nuclear Power~Station ① Importance of Nuclear Power
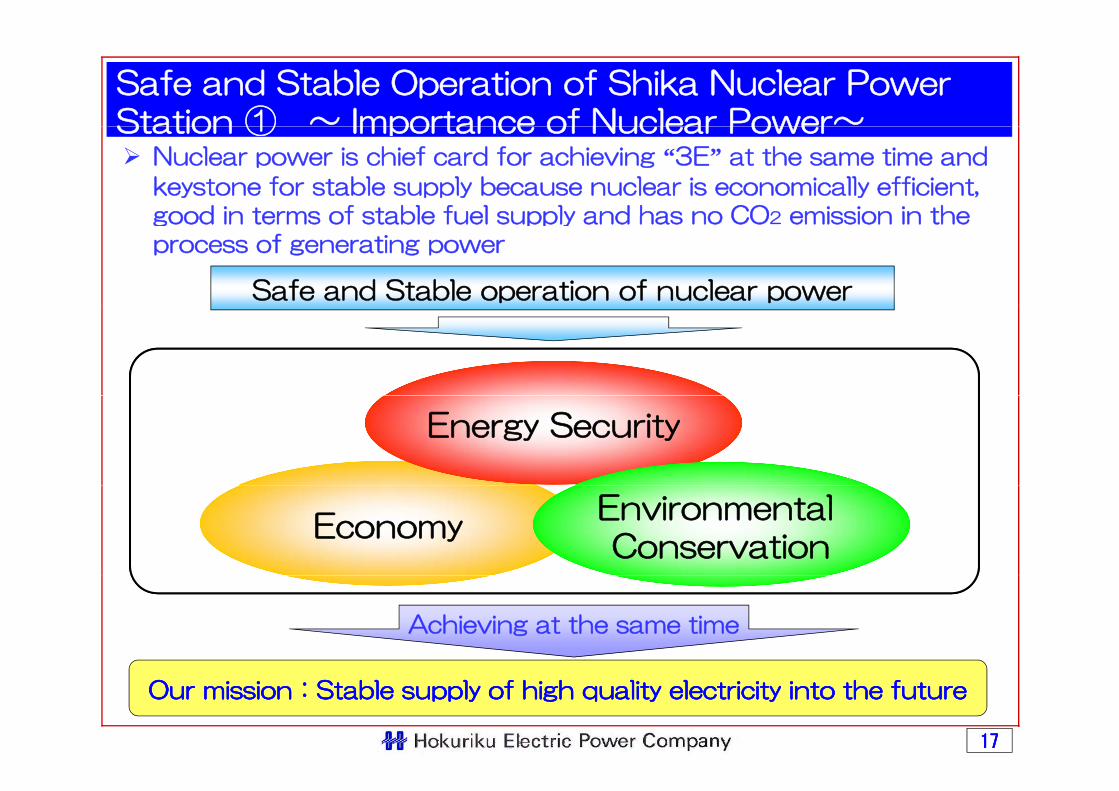
Nuclear power is chief card for achieving “3E” at the same time and
keystone for stable supply because nuclear is economically efficient, good in terms of stable fuel supply and has no CO2 emission in thegood in terms of stable fuel supply and has no CO2 emission in the process of generating power
Safe and Stable operation of nuclear power
Energy Security
EconomyEnvironmental Conservation
Achieving at the same time
1717
Our missionOur mission::Stable supply of high quality electricity into the futureStable supply of high quality electricity into the future
Safe and Stable Operation of Shika Nuclear Power Station ② ~ Improvement of Operational Quality~Station ② Improvement of Operational Quality
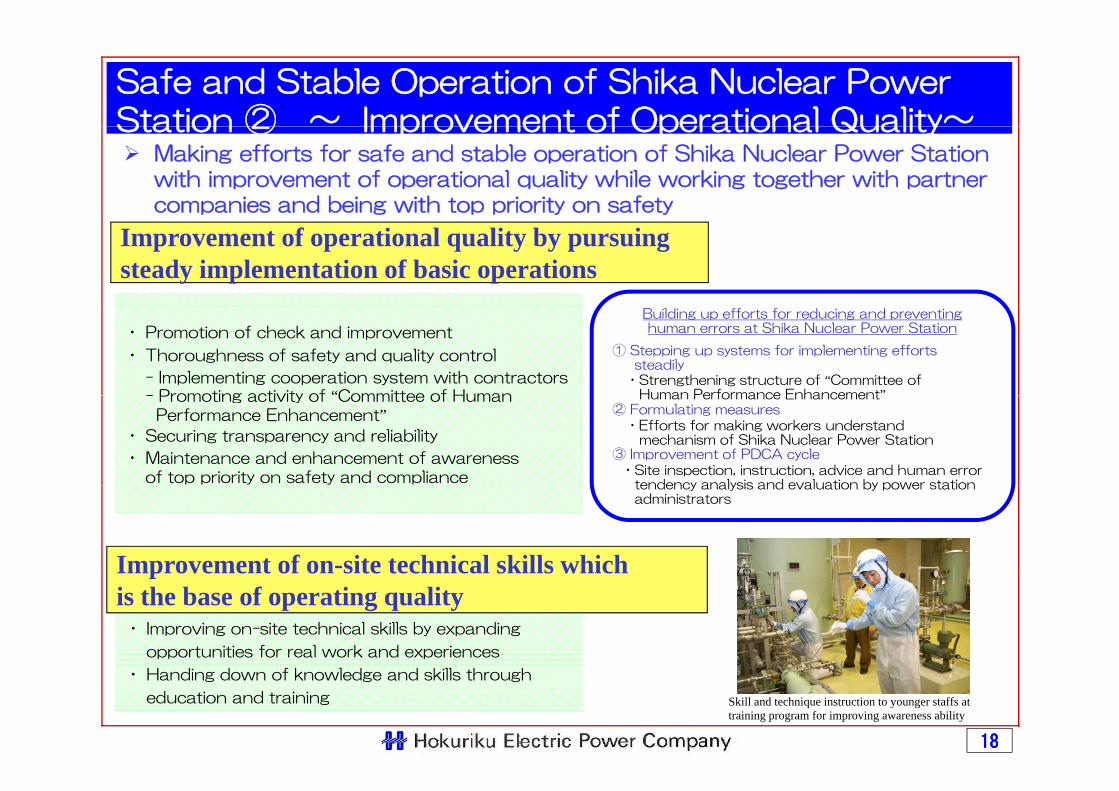
Making efforts for safe and stable operation of Shika Nuclear Power Station with improvement of operational quality while working together with partner companies and being with top priority on safety
Improvement of operational quality by pursuing steady implementation of basic operations
Building up efforts for reducing and preventing human errors at Shika Nuclear Power Station
① Stepping up systems for implementing effortssteadily
・Strengthening structure of “Committee ofHuman Performance Enhancement”
・ Promotion of check and improvement
・ Thoroughness of safety and quality control
- Implementing cooperation system with contractors- Promoting activity of “Committee of Human Human Performance Enhancement
② Formulating measures・Efforts for making workers understand
mechanism of Shika Nuclear Power Station ③ Improvement of PDCA cycle
・Site inspection, instruction, advice and human errortendency analysis and evaluation by power station
- Promoting activity of Committee of HumanPerformance Enhancement”
・ Securing transparency and reliability
・ Maintenance and enhancement of awareness of top priority on safety and compliance tendency analysis and evaluation by power station
administrators
Improvement of on-site technical skills which
・ Improving on-site technical skills by expanding
opportunities for real work and experiences
pis the base of operating quality
1818
・ Handing down of knowledge and skills through
education and training Skill and technique instruction to younger staffs at training program for improving awareness ability
Safe and Stable Operation of Shika Nuclear Power Station③ ~ Earthquake Resistance Safety~Station③ Earthquake Resistance Safety
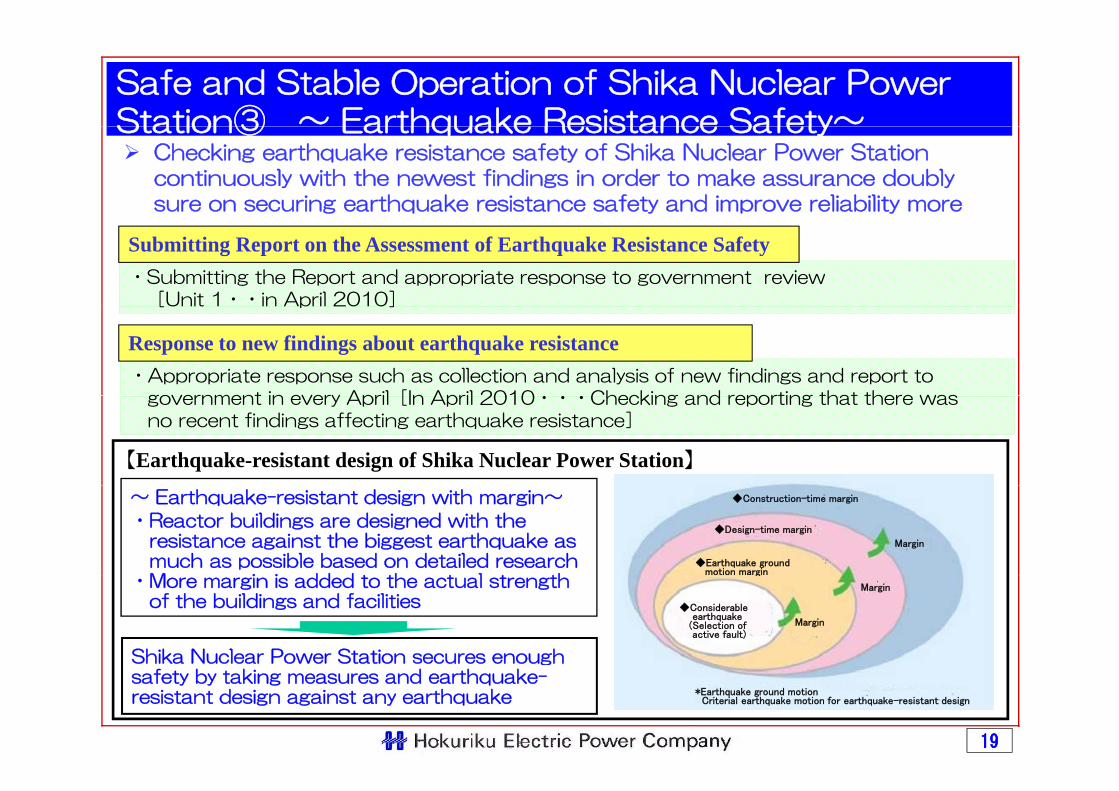
Checking earthquake resistance safety of Shika Nuclear Power Station continuously with the newest findings in order to make assurance doubly sure on securing earthquake resistance safety and improve reliability more
・Submitting the Report and appropriate response to government review [Unit 1・・in April 2010]
Submitting Report on the Assessment of Earthquake Resistance Safety
[Unit 1 in April 2010]
・Appropriate response such as collection and analysis of new findings and report togovernment in every April[In April 2010 Checking and reporting that there was
Response to new findings about earthquake resistance
government in every April[In April 2010・・・Checking and reporting that there was no recent findings affecting earthquake resistance]
【Earthquake-resistant design of Shika Nuclear Power Station】
~ Earthquake-resistant design with margin~
・Reactor buildings are designed with theresistance against the biggest earthquake as much as possible based on detailed research M i i dd d t th t l t th
◆Construction-time margin
◆Design-time margin
◆Earthquake ground motion margin
Margin
・More margin is added to the actual strengthof the buildings and facilities
Shika Nuclear Power Station secures enough
g
◆Considerableearthquake
(Selection of active fault)
Margin
Margin
1919
gsafety by taking measures and earthquake-resistant design against any earthquake *Earthquake ground motion
Criterial earthquake motion for earthquake-resistant design
Safe and Stable Operation of Shika Nuclear Power Station④ ~ Future Efforts ~Station④ Future Efforts
Dealing with the following efforts with the priority on safety and stable operation
F ll t ti f l t bi bl d f U it 2Full restoration of low-pressure turbine blade of Unit 2・ Exchange of low-pressure turbine blade is planned on the third
periodical inspection from the mid-March of next year
・Taking our utmost effort in order for local people’s understandings aiming
p p y
Promoting efforts toward recycling of uranium fuelTaking our utmost effort in order for local people s understandings aiming
at introduction of recycling of uranium fuel at one of Shika Nuclear PowerStation by FY2015
Efforts toward raising nuclear utilization ratio・ Thoroughness of steady implementation of periodical inspection process
by inspection quality improvement firstby inspection quality improvement first・ Discussing rated heat output constant at Unit 2 of Shika Nuclear Power
Station・ Appropriate actions toward prolonged operation by building up a track
d f f d t bl ti d l i d l ti th d t
2020
record of safe and stable operation and analyzing and evaluating the dataof facility inspection and maintenance
■ Efforts to Secure Stable Supply
2121
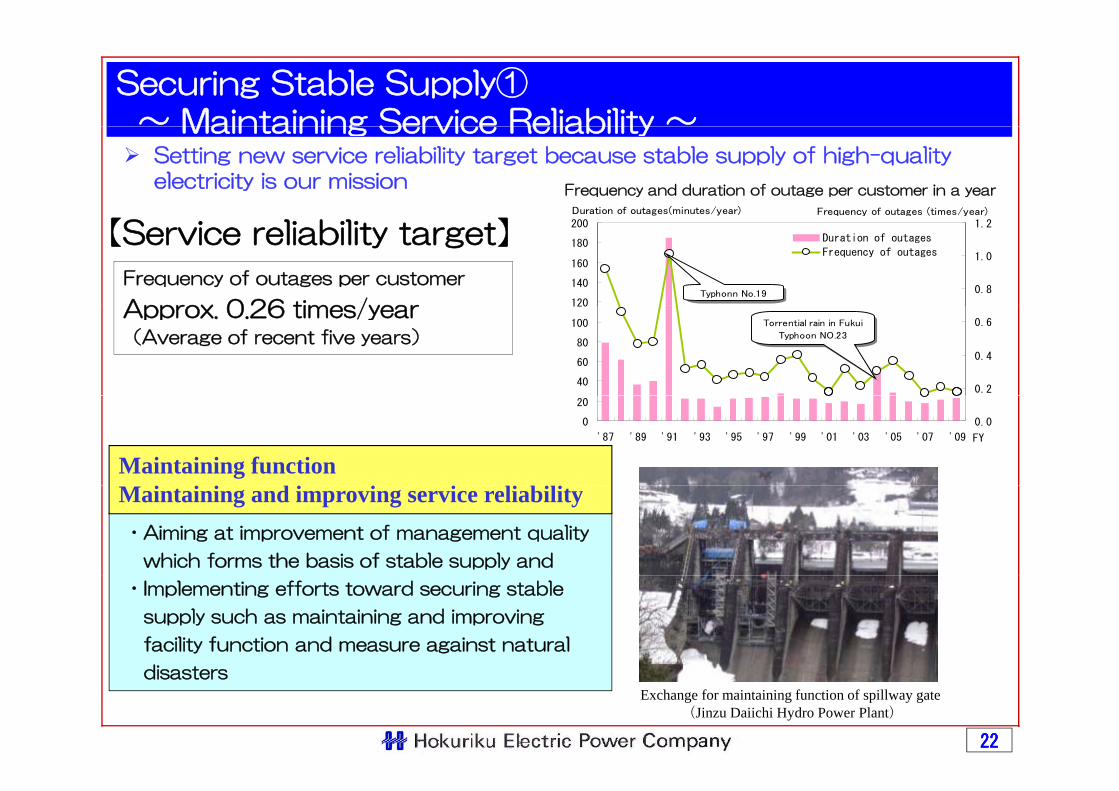
Securing Stable Supply①~ Maintaining Service Reliability ~
Duration of outages(minutes/year) Frequency of outages (times/year)
Maintaining Service Reliability Setting new service reliability target because stable supply of high-quality electricity is our mission Frequency and duration of outage per customer in a year
120
140
160
180
200
0.8
1.0
1.2
Duration of outages
Frequency of outages
Typhonn No.19
q y g y
【Service reliability target】
Frequency of outages per customer
Approx 0 26 times/year
40
60
80
100
120
0.2
0.4
0.6Torrential rain in Fukui
Typhoon NO.23
Approx. 0.26 times/year(Average of recent five years)
0
20
'87 '89 '91 '93 '95 '97 '99 '01 '03 '05 '07 '09
0.0
FY
Maintaining function
・Aiming at improvement of management quality
which forms the basis of stable supply and
Maintaining and improving service reliability
・Implementing efforts toward securing stable
supply such as maintaining and improving
facility function and measure against natural
d
2222
disastersExchange for maintaining function of spillway gate
(Jinzu Daiichi Hydro Power Plant)
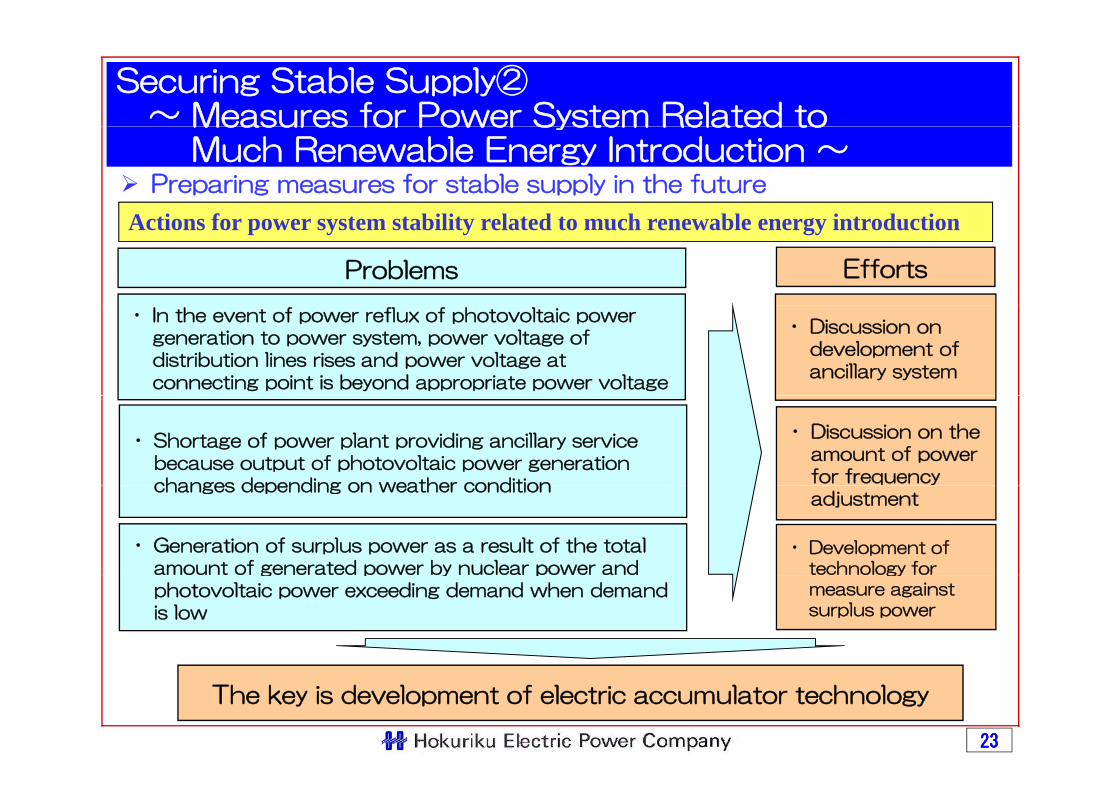
Securing Stable Supply②~ Measures for Power System Related to Measures for Power System Related to
Much Renewable Energy Introduction ~Preparing measures for stable supply in the future
A ti f t t bilit l t d t h bl i t d tiActions for power system stability related to much renewable energy introduction
Problems Efforts
・ In the event of power reflux of photovoltaic powergeneration to power system, power voltage of distribution lines rises and power voltage atconnecting point is beyond appropriate power voltage
・ Discussion ondevelopment of ancillary system
・ Shortage of power plant providing ancillary servicebecause output of photovoltaic power generationchanges depending on weather condition
・ Discussion on theamount of powerfor frequency
・ Generation of surplus power as a result of the total amount of generated power by nuclear power and
changes depending on weather conditionadjustment
・ Development oftechnology forg p y p
photovoltaic power exceeding demand when demandis low
gymeasure againstsurplus power
2323
The key is development of electric accumulator technology
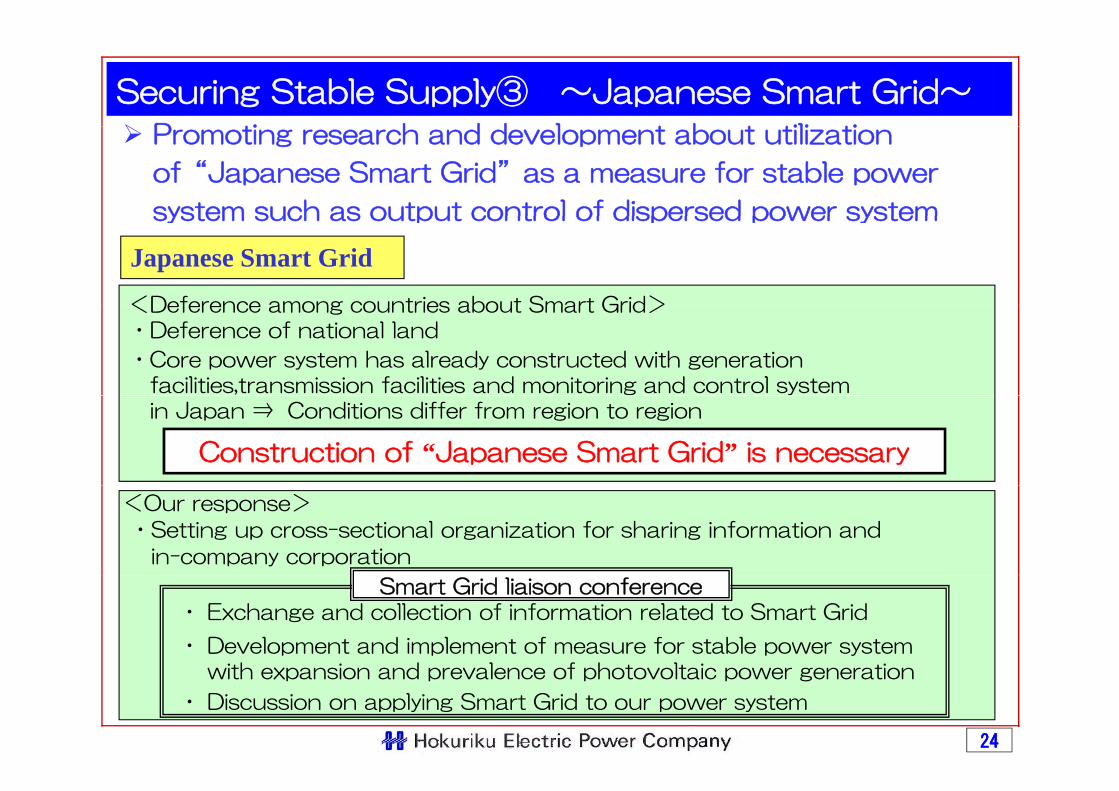
Securing Stable Supply③ ~Japanese Smart Grid~
P ti h d d l t b t tili tiPromoting research and development about utilization
of“Japanese Smart Grid”as a measure for stable power
system such as output control of dispersed power systemsystem such as output control of dispersed power system
Japanese Smart Grid
<Deference among countries about Smart Grid><Deference among countries about Smart Grid>・Deference of national land
・Core power system has already constructed with generationfacilities,transmission facilities and monitoring and control systemin Japan ⇒ Conditions differ from region to region
Construction of “Japanese Smart Grid” is necessary
<Our response>
・Setting up cross-sectional organization for sharing information andin-company corporation
・ Exchange and collection of information related to Smart Grid
・ Development and implement of measure for stable power systemith i d l f h t lt i ti
Smart Grid liaison conference
2424
with expansion and prevalence of photovoltaic power generation
・ Discussion on applying Smart Grid to our power system
■ Eff t S l id t■ Efforts on Supply side to realize Low-Carbon Society
2525
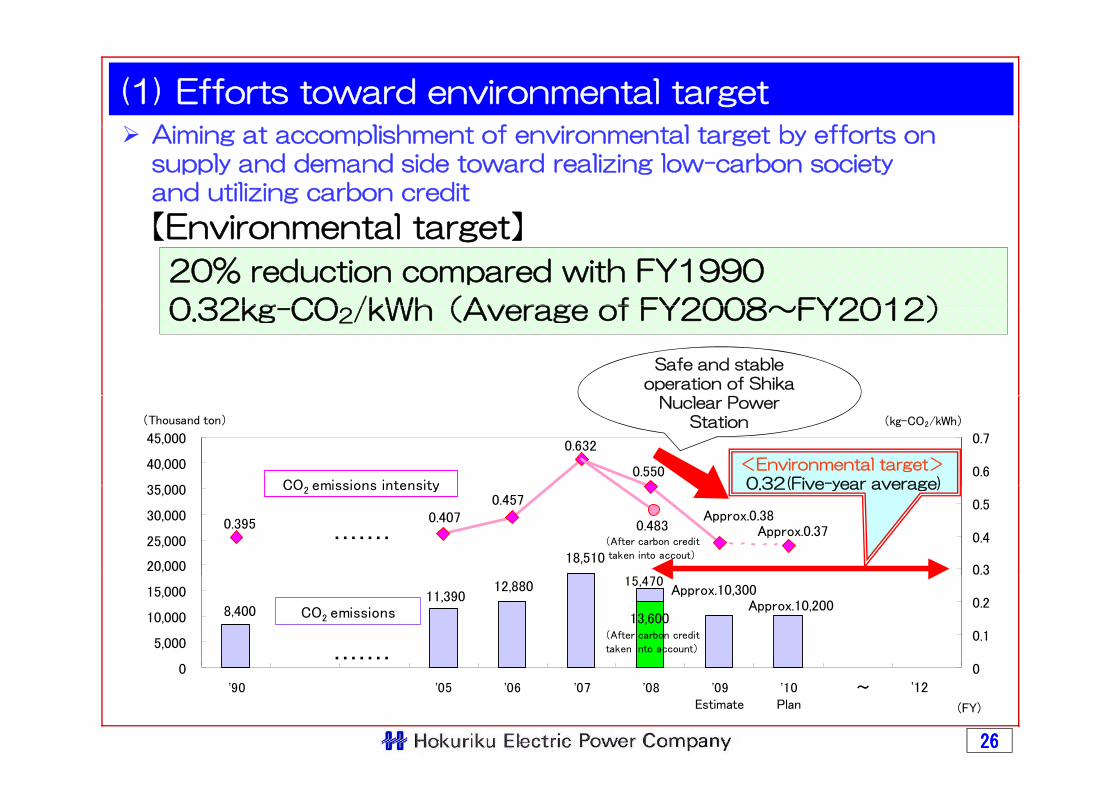
(1) Efforts toward environmental target
Ai i li h f i l b ffAiming at accomplishment of environmental target by efforts on supply and demand side toward realizing low-carbon society and utilizing carbon credit
【E i l 】【Environmental target】
20% reduction compared with FY1990
0 32kg CO /kWh(Average of FY2008~FY2012)0.32kg-CO2/kWh(Average of FY2008~FY2012)
Safe and stable operation of Shika
0.550
0.632
35 000
40,000
45,000
(Thousand ton)
0.6
0.7(kg-CO2/kWh)
CO emissions intensity
<Environmental target>0 32(Five-year average)
Nuclear Power Station
18,510
Approx.0.37Approx.0.38
0.4570.4070.395
20,000
25,000
30,000
35,000
0.3
0.4
0.5
CO2 emissions intensity
・・・・・・・0.483
(After carbon credit
taken into accout)
0.32(Five year average)
8,40011,390
12,880 Approx.10,300 Approx.10,200
13,600
0
5,000
10,000
15,000
0
0.1
0.2CO2 emissions
・・・・・・・
(After carbon credit
taken into account)
15,470
~ '12
0
'90 '05 '06 '07 '08 '09Estimate
'10Plan
0
2626
(FY)
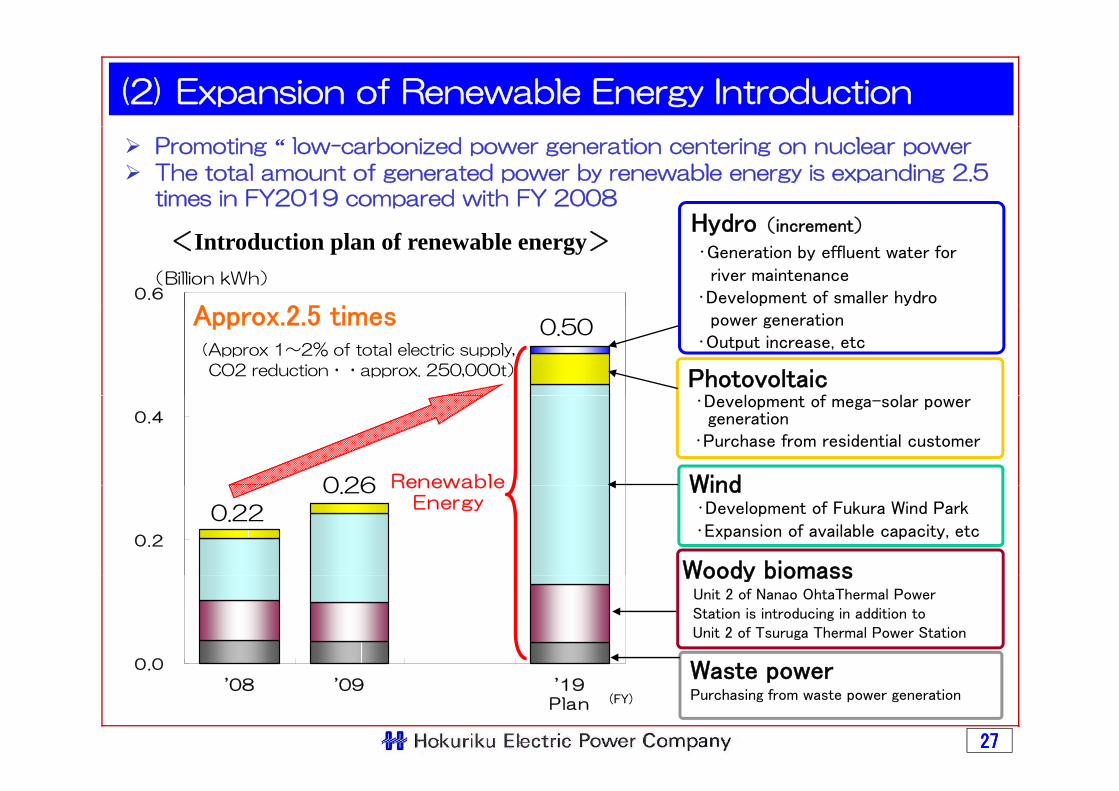
(2) Expansion of Renewable Energy Introduction
H d
Promoting “ low-carbonized power generation centering on nuclear power
The total amount of generated power by renewable energy is expanding 2.5 times in FY2019 compared with FY 2008
0.6(Billion kWh)
Hydro(increment)
・Generation by effluent water forriver maintenance
・Development of smaller hydro
<Introduction plan of renewable energy>
A 2 5 i 0.50
p ypower generation
・Output increase, etc
PhotovoltaicD l f l
Approx.2.5 times(Approx 1~2% of total electric supply,
CO2 reduction・・approx. 250,000t)
0.4
Renewable0 26
・Development of mega-solar powergeneration
・Purchase from residential customer
Wind
0.2
RenewableEnergy
0.22
0.26 Wind・Development of Fukura Wind Park・Expansion of available capacity, etc
Woody biomass
0 0
Woody biomassUnit 2 of Nanao OhtaThermal Power Station is introducing in addition to Unit 2 of Tsuruga Thermal Power Station
W t0.0
'08 '09 '19Plan
2727
Waste powerPurchasing from waste power generation(FY)
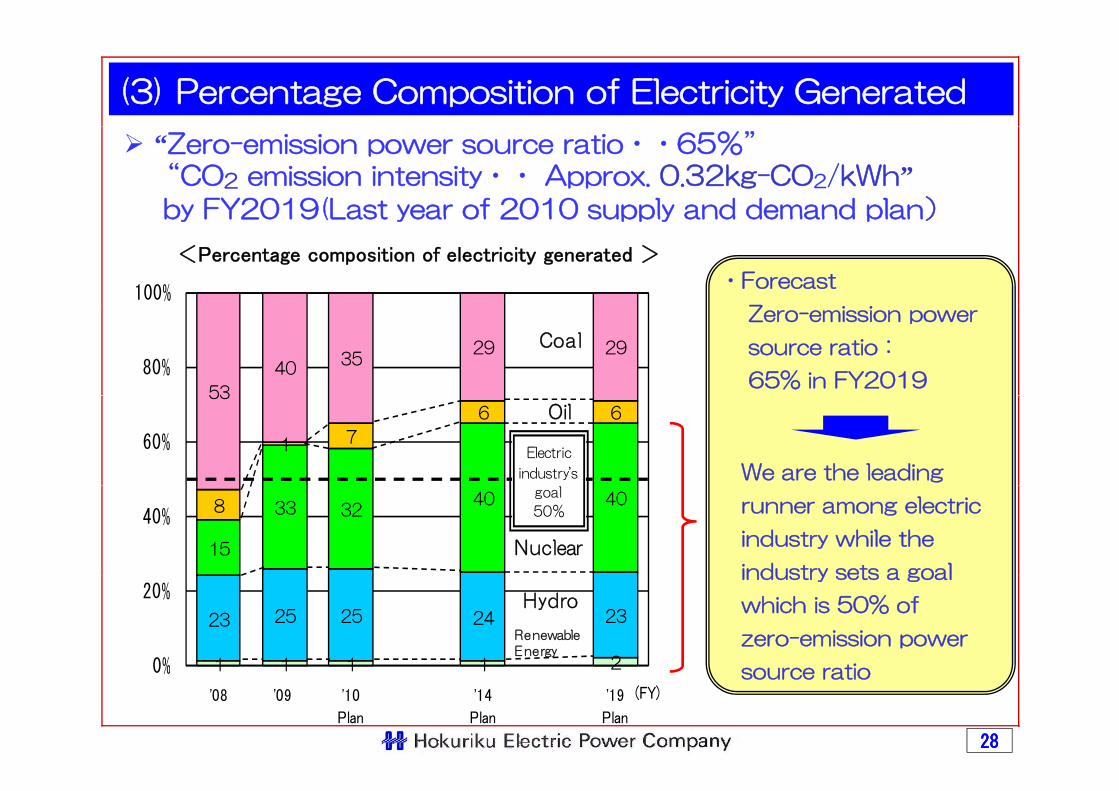
(3) Percentage Composition of Electricity Generated
“Zero-emission power source ratio・・65%”“CO2 emission intensity・・ Approx. 0.32kg-CO2/kWh”by FY2019(Last year of 2010 supply and demand plan)
100%・Forecast
Z
<Percentage composition of electricity generated >
by FY2019(Last year of 2010 supply and demand plan)
53
4035
29 2980%
Zero-emission power
source ratio:
65% in FY2019
Coal
1 7
6 653
60%Electric
industry's We are the leading
Oil
15
33 3240 408
40%
goal
50% runner among electric
industry while the
industry sets a goalNuclear
1 1 1 1 2
23 25 25 24 23
0%
20%industry sets a goal
which is 50% of
zero-emission power
ti
Re newable
E ne rgy
Hydro
1 1 1 1 20%
'08 '09 '10
Plan
'14
Plan
'19
Plan
source ratio
2828
(FY)
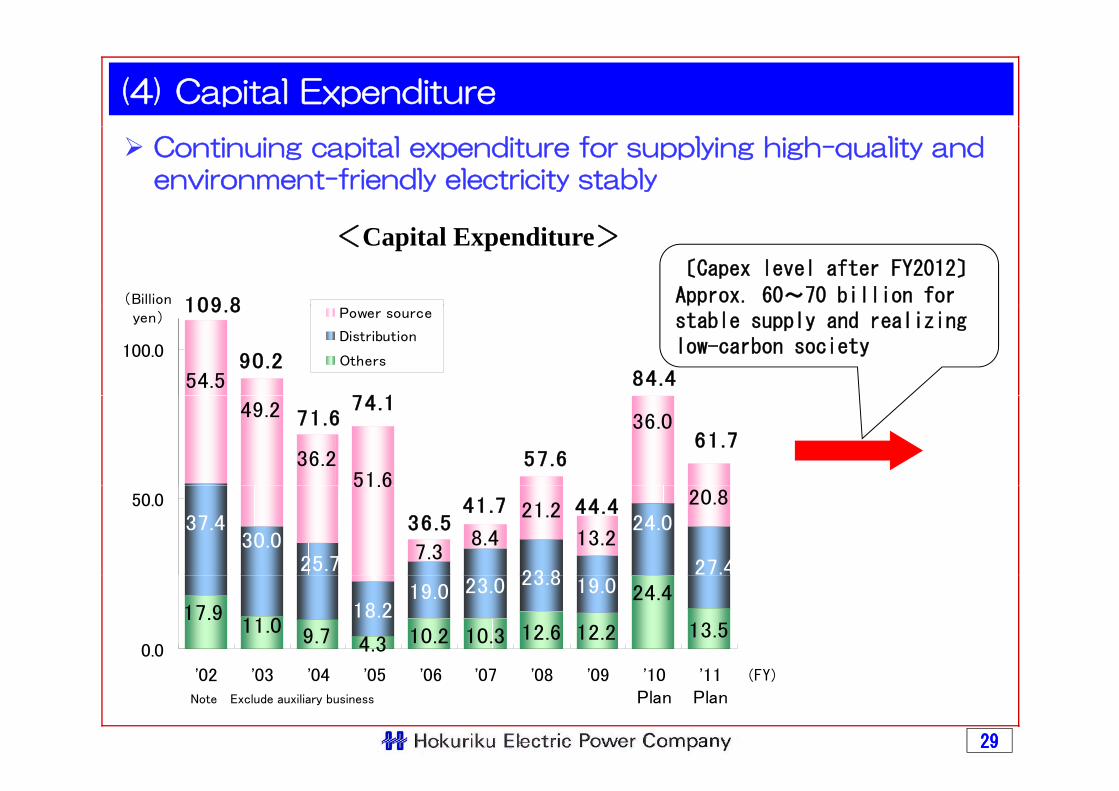
(4) Capital Expenditure
Continuing capital expenditure for supplying high-quality and environment-friendly electricity stably
109 8(Billion
〔Capex level after FY2012〕
Approx. 60~70 billion for
<Capital Expenditure>
54.574 1
90.284.4
109.8
100.0
Power source
Distribution
Others
yen) stable supply and realizing low-carbon society
36.0
51.6
49.2
36.2
74.171.6
61.757.6
23 87.3
21.2
13.2
20.8
27.4
24.0
25.7
37.430.0
51.6
8.4
41.736.5
44.450.0
9.7 4.3 10.2 10.3 12.6 12.2 13.518.2
19.023.8 19.0 24.4
17.911.0
23.0
0.0
'02 '03 '04 '05 '06 '07 '08 '09 '10Plan
'11Plan
(FY)
2929
Note Exclude auxiliary business
More Efficient Use of Energy
【Second Policy】
More Efficient Use of Energy by customers
3030
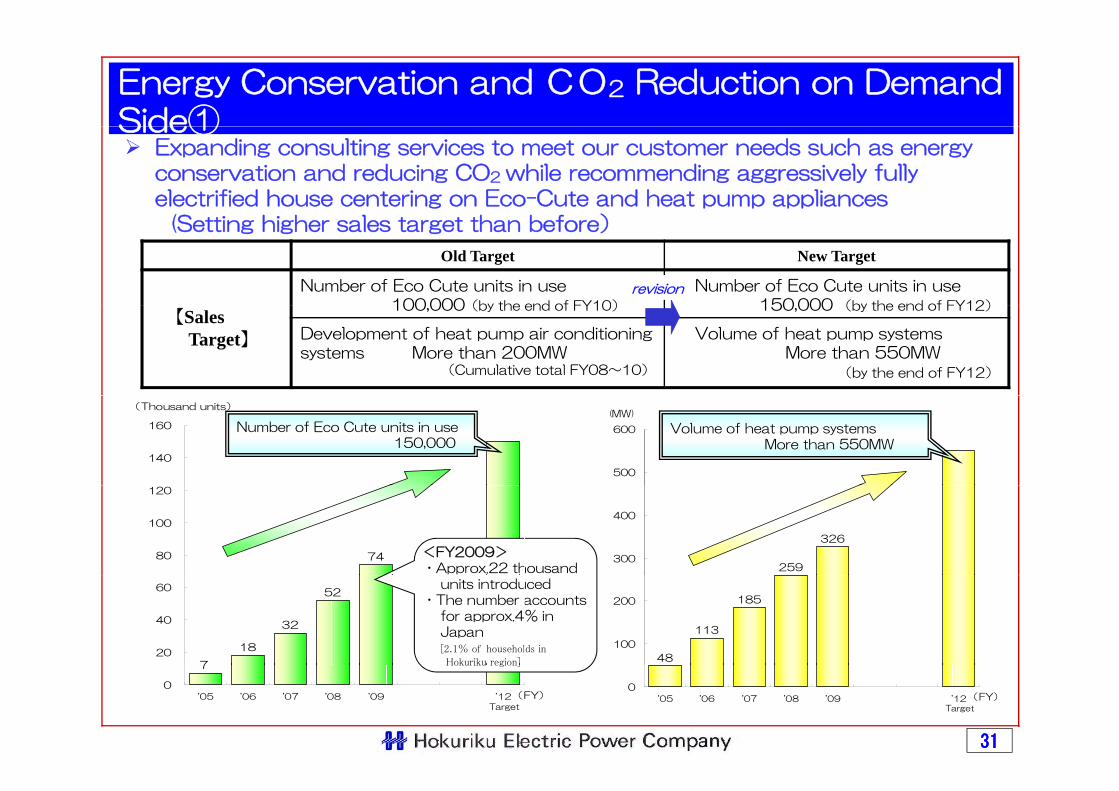
Energy Conservation and CO2 Reduction on Demand Side①Side①
Expanding consulting services to meet our customer needs such as energy conservation and reducing CO2 while recommending aggressively fully electrified house centering on Eco-Cute and heat pump appliances
(S i hi h l h b f )(Setting higher sales target than before)
Old Target New Target
Number of Eco Cute units in use 100 000(by the end of FY10)
Number of Eco Cute units in use 150 000 (by the end of FY12)
revision
【SalesTarget】
100,000(by the end of FY10) 150,000 (by the end of FY12)
Development of heat pump air conditioning systems More than 200MW
(Cumulative total FY08~10)
Volume of heat pump systemsMore than 550MW
(by the end of FY12)
500
600
(MW)
140
160
(Thousand units)
Number of Eco Cute units in use150,000
Volume of heat pump systemsMore than 550MW
259
326
300
400
7480
100
120
<FY2009>・Approx.22 thousand
113
185
48
100
20052
32
18
720
40
60 units introduced・The number accounts
for approx.4% inJapan[2.1% of households in
Hokuriku region]
0'05 '06 '07 '08 '09 '12
目標
(FY)Target
7
0'05 '06 '07 '08 '09 '12
目標
(FY)Target
3131
Hokuriku region]
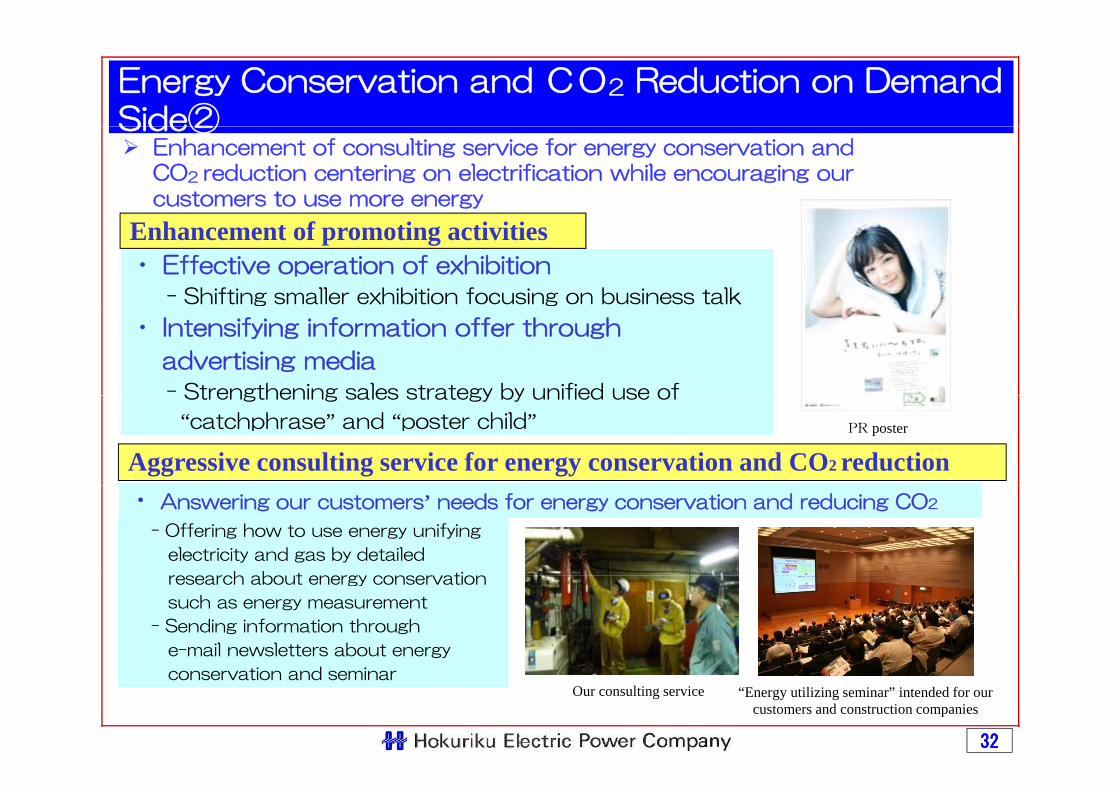
Energy Conservation and CO2 Reduction on Demand Side②Side②
Enhancement of consulting service for energy conservation and CO2 reduction centering on electrification while encouraging our customers to use more energy
Enhancement of promoting activities・ Effective operation of exhibition
- Shifting smaller exhibition focusing on business talkg g
・ Intensifying information offer through
advertising media
- Strengthening sales strategy by unified use ofStrengthening sales strategy by unified use of
“catchphrase” and “poster child”
Aggressive consulting service for energy conservation and CO2 reductionPR poster
- Offering how to use energy unifying
electricity and gas by detailed
h b t gy v ti
・ Answering our customers’ needs for energy conservation and reducing CO2
research about energy conservation
such as energy measurement
- Sending information through
e-mail newsletters about energy
3232
Our consulting service “Energy utilizing seminar” intended for our customers and construction companies
conservation and seminar
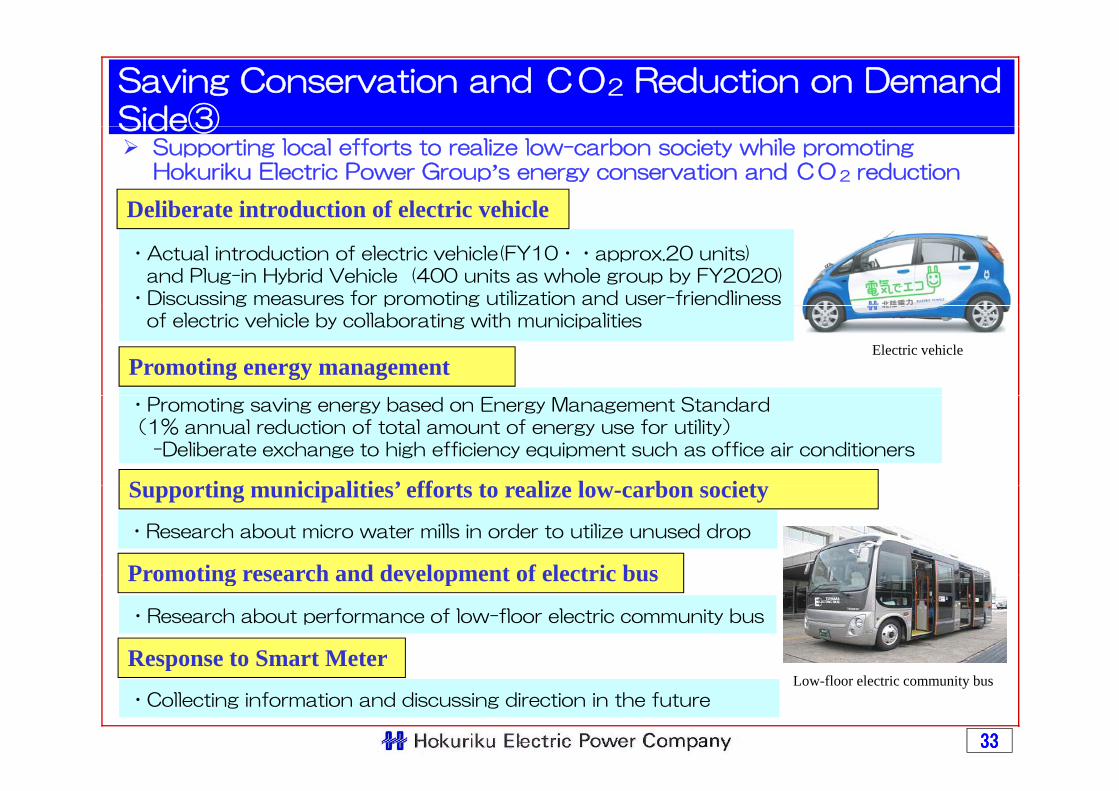
Saving Conservation and CO2 Reduction on Demand Side③Side③
Supporting local efforts to realize low-carbon society while promoting Hokuriku Electric Power Group’s energy conservation and CO2 reduction
Deliberate introduction of electric vehicle
・Actual introduction of electric vehicle(FY10・・approx.20 units) and Plug-in Hybrid Vehicle (400 units as whole group by FY2020)
・Discussing measures for promoting utilization and user-friendliness
Deliberate introduction of electric vehicle
g p gof electric vehicle by collaborating with municipalities
Promoting energy managementElectric vehicle
S ti i i liti ’ ff t t li l b i t
・Promoting saving energy based on Energy Management Standard(1% annual reduction of total amount of energy use for utility)
-Deliberate exchange to high efficiency equipment such as office air conditioners
Promoting research and development of electric bus
Supporting municipalities’ efforts to realize low-carbon society
・Research about micro water mills in order to utilize unused drop
Promoting research and development of electric bus
・Research about performance of low-floor electric community bus
Response to Smart Meter
3333
Response to Smart Meter
・Collecting information and discussing direction in the future Low-floor electric community bus
【Third Policy】
Stabilizing and Reinforcing
【Third Policy】
Stabilizing and Reinforcing Our Business Foundation
3434
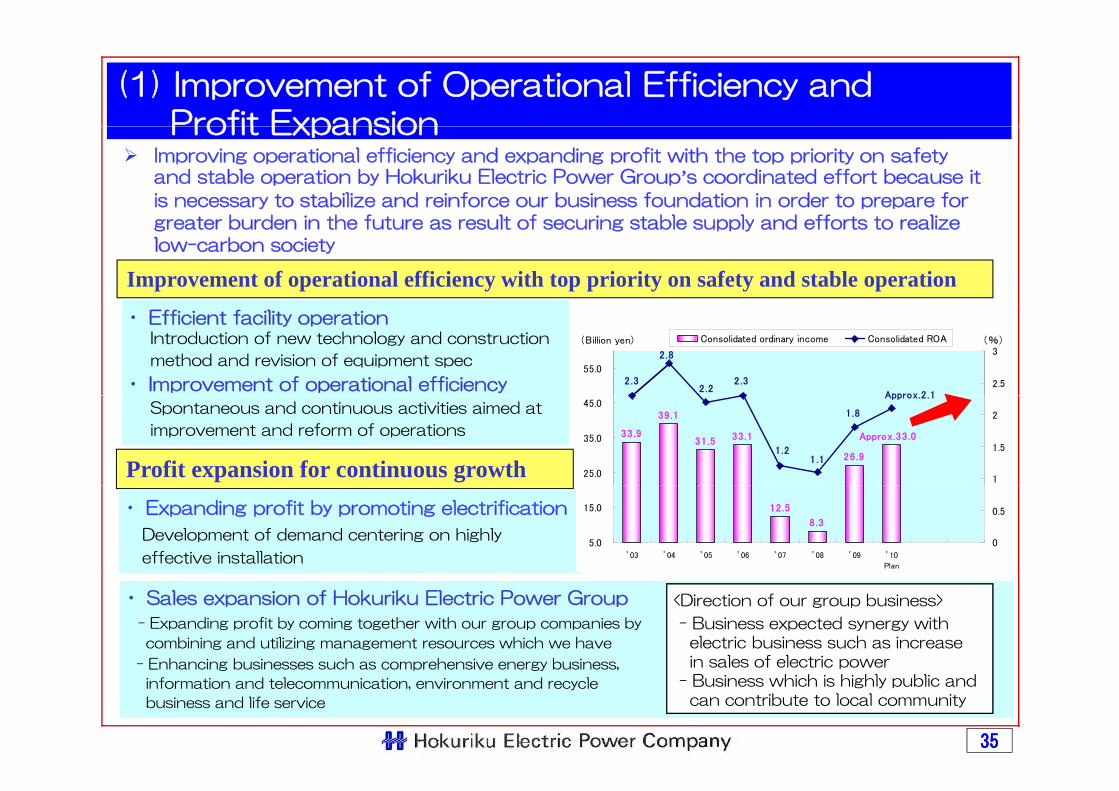
(1) Improvement of Operational Efficiency andProfit ExpansionProfit Expansion
Improving operational efficiency and expanding profit with the top priority on safety and stable operation by Hokuriku Electric Power Group’s coordinated effort because it
is necessary to stabilize and reinforce our business foundation in order to prepare for b d i h f l f i bl l d ff ligreater burden in the future as result of securing stable supply and efforts to realize
low-carbon society
Improvement of operational efficiency with top priority on safety and stable operation
・ Efficient facility operationIntroduction of new technology and construction
method and revision of equipment spec
・ Improvement of operational efficiencyApprox 2 1
2 .32.2
2.8
2.355.0
2.5
3Consolidated ordinary income Consolidated ROA(Billion yen) (%)
Profit expansion for continuous growth
Spontaneous and continuous activities aimed at
improvement and reform of operations 33.9
39.1
31.5 33.1 Approx.33.0
26 .9
Approx.2 .1
1.21 .1
1.8
25.0
35.0
45.0
1
1.5
2
・ Expanding profit by promoting electrification
Development of demand centering on highly
effective installation
12 .5
8.3
5.0
15.0
’03 ’04 ’05 ’06 ’07 ’08 ’09 ’10
Plan
0
0.5
・ Sales expansion of Hokuriku Electric Power Group
- Expanding profit by coming together with our group companies by
combining and utilizing management resources which we have
- Enhancing businesses such as comprehensive energy business
<Direction of our group business>
- Business expected synergy withelectric business such as increase in sales of electric power
3535
Enhancing businesses such as comprehensive energy business,
information and telecommunication, environment and recycle
business and life service
in sales of electric power- Business which is highly public and
can contribute to local community
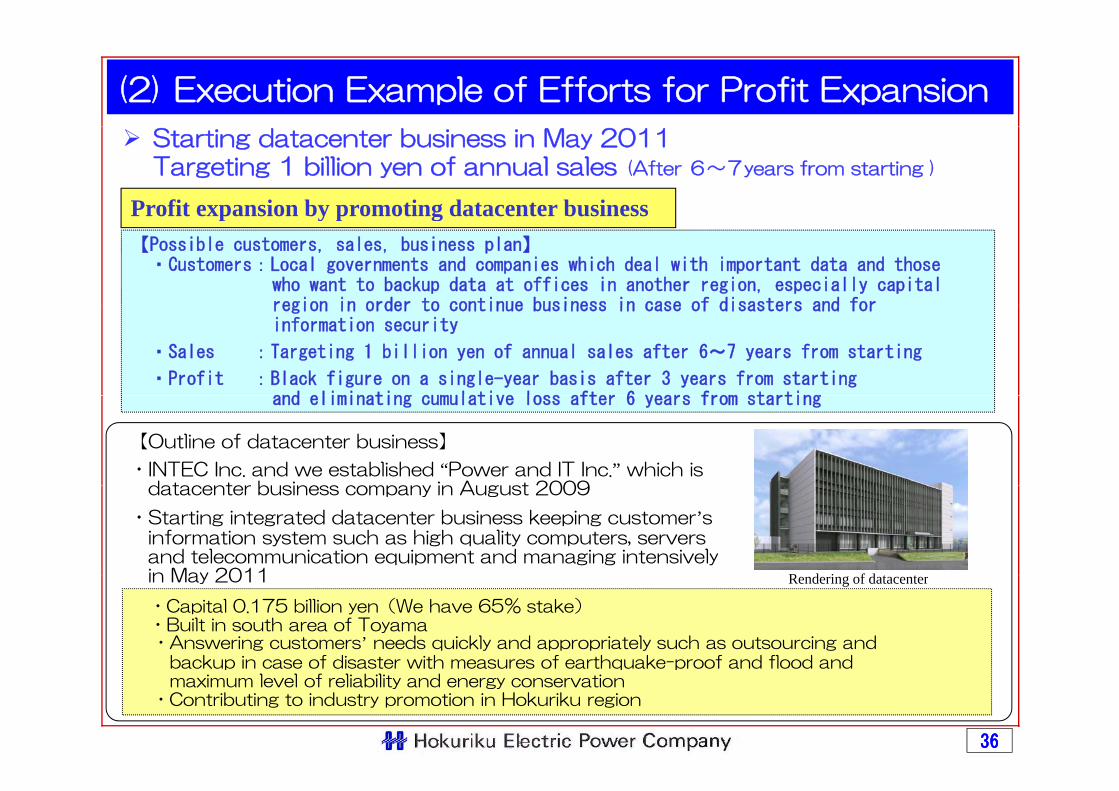
(2) Execution Example of Efforts for Profit Expansion
Starting datacenter business in May 2011Targeting 1 billion yen of annual sales (After 6~7years from starting )
Profit expansion by promoting datacenter business【Possible customers, sales, business plan】
・Customers:Local governments and companies which deal with important data and those who want to backup data at offices in another region, especially capitalregion in order to continue business in case of disasters and for
Profit expansion by promoting datacenter business
region in order to continue business in case of disasters and forinformation security
・Sales :Targeting 1 billion yen of annual sales after 6~7 years from starting
・Profit :Black figure on a single-year basis after 3 years from startingand eliminating cumulative loss after 6 years from startingand eliminating cumulative loss after 6 years from starting
【Outline of datacenter business】
・INTEC Inc. and we established “Power and IT Inc.” which is datacenter business company in August 2009datacenter business company in August 2009
・Starting integrated datacenter business keeping customer’sinformation system such as high quality computers, serversand telecommunication equipment and managing intensively in May 2011 R d i f d t tin May 2011 Rendering of datacenter
・Capital 0.175 billion yen(We have 65% stake)・Built in south area of Toyama・Answering customers’ needs quickly and appropriately such as outsourcing and
backup in case of disaster with measures of earthquake-proof and flood and
3636
backup in case of disaster with measures of earthquake proof and flood andmaximum level of reliability and energy conservation
・Contributing to industry promotion in Hokuriku region
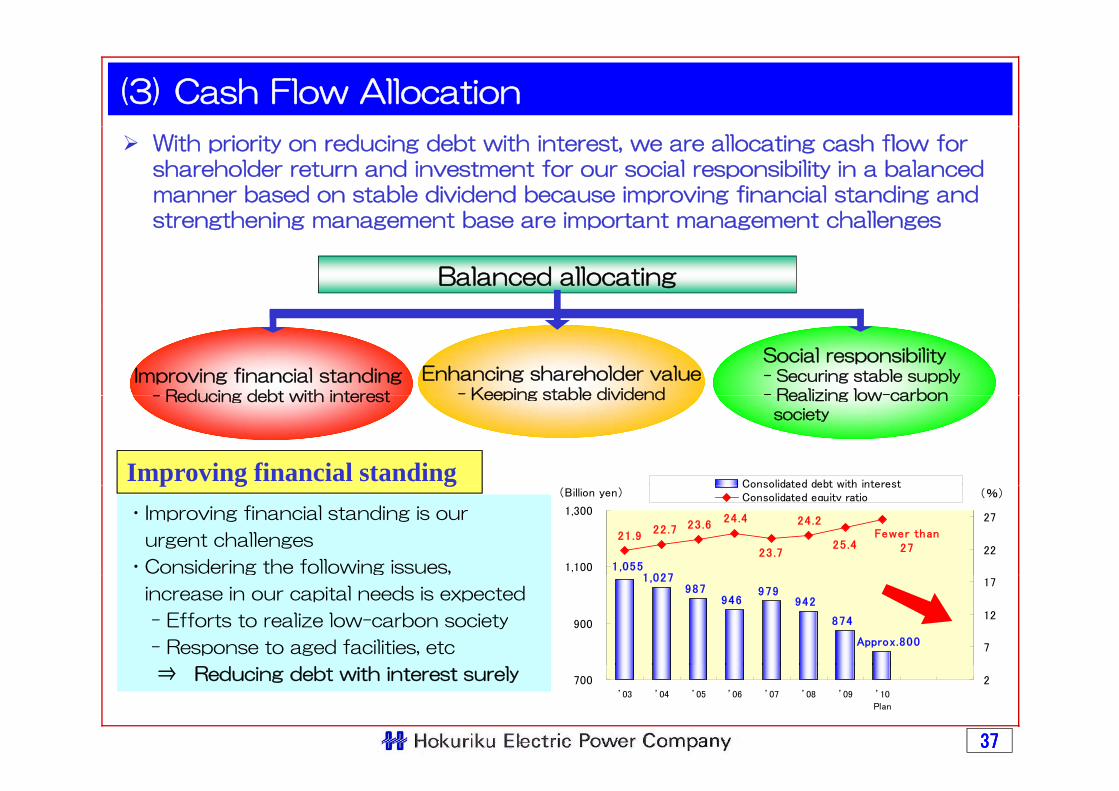
(3) Cash Flow Allocation
With priority on reducing debt with interest, we are allocating cash flow for shareholder return and investment for our social responsibility in a balancedmanner based on stable dividend because improving financial standing andt th i t b i t t t h llstrengthening management base are important management challenges
Balanced allocating
Improving financial standing - Reducing debt with interest
Enhancing shareholder value- Keeping stable dividend
Social responsibility- Securing stable supply- Realizing low-carbon
Improving financial standing
- Reducing debt with interest Keeping stable dividend Realizing low carbonsociety
Consolidated debt with interestp g g
・Improving financial standing is our
urgent challenges
・Considering the following issues,1 027
1,055
Fewer than2725.4
24 .2
23.7
24 .423.622.7
21 .9
1,100
1,300
22
27
Consolidated debt with interestConsolidated equity ratio(Billion yen) (%)
g g
increase in our capital needs is expected
- Efforts to realize low-carbon society
- Response to aged facilities, etc
1,027987
946 942
874
Approx.800
979
900
7
12
17
3737
⇒ Reducing debt with interest surely 700’03 ’04 ’05 ’06 ’07 ’08 ’09 ’10
Plan
2
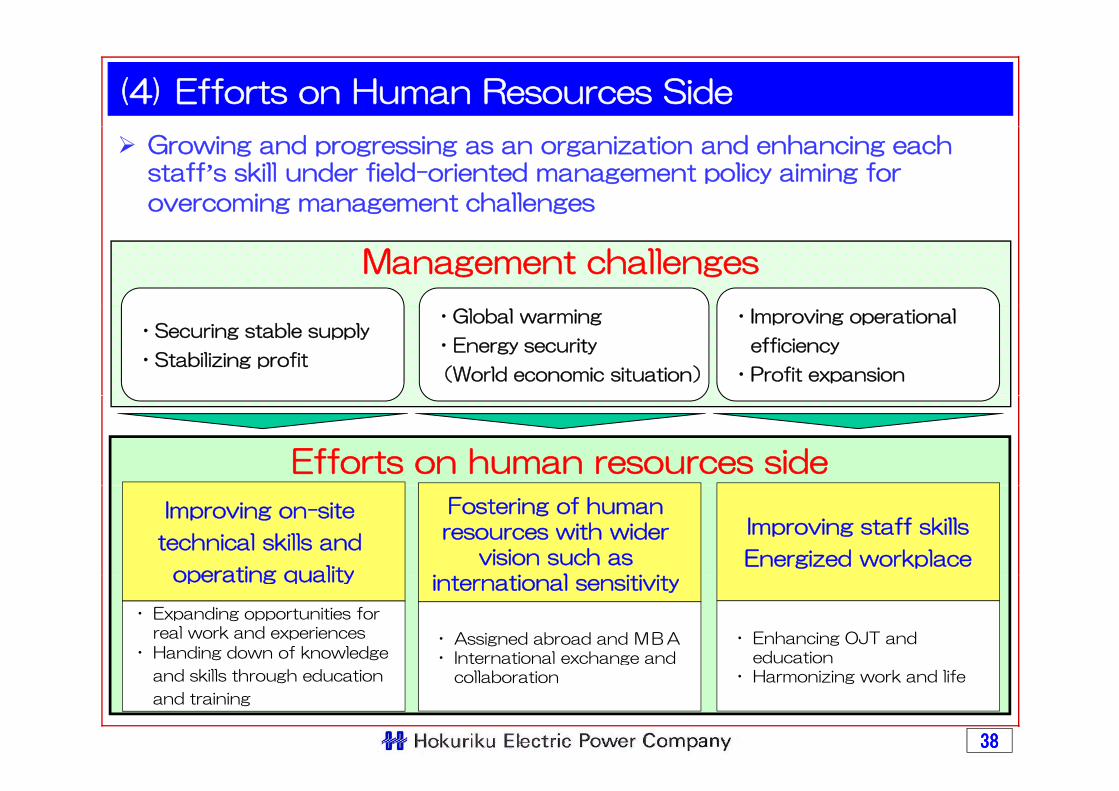
(4) Efforts on Human Resources Side
Growing and progressing as an organization and enhancing each staff’s skill under field-oriented management policy aiming for
overcoming management challenges
Management challenges
・Securing stable supply
・Stabilizing profit
・Global warming
・Energy security
(World economic situation)
・Improving operational
efficiency
・Profit expansion
Efforts on human resources side
Improving on-site
technical skills and
operating quality
Fostering of human resources with wider
vision such as i i l i i i
Improving staff skills
Energized workplaceoperating quality international sensitivity
・ Expanding opportunities forreal work and experiences
・ Handing down of knowledge ・ Assigned abroad and MBA・ International exchange and
・ Enhancing OJT and education
3838
and skills through education
and training
gcollaboration ・ Harmonizing work and life
【Fourth Policy】
Sustainable Development of
【Fourth Policy】
Sustainable Development ofHokuriku Electric Power Group
h L l Cwith Local Communities
3939
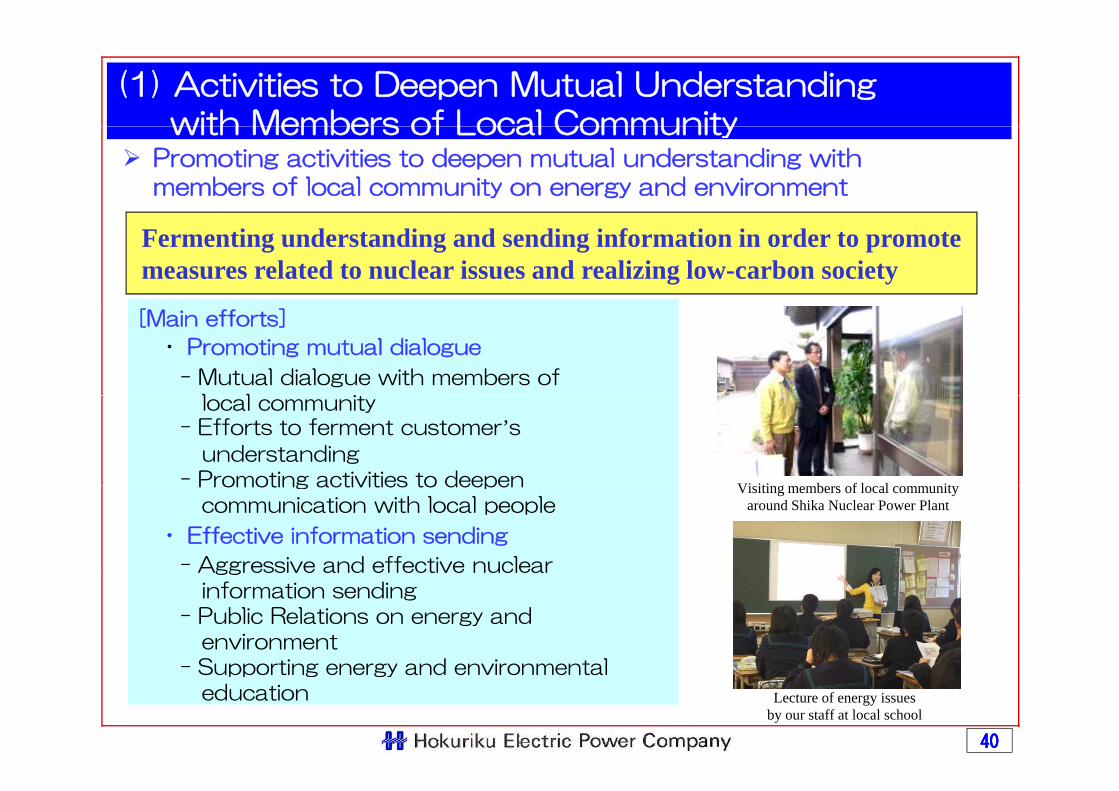
(1) Activities to Deepen Mutual Understanding with Members of Local Communitywith Members of Local Community
Promoting activities to deepen mutual understanding with members of local community on energy and environment
Fermenting understanding and sending information in order to promote measures related to nuclear issues and realizing low-carbon society
[Main efforts]
・ Promoting mutual dialogue
- Mutual dialogue with members of l l ilocal community
- Efforts to ferment customer’sunderstanding
- Promoting activities to deepen Vi iti b f l l itPromoting activities to deepencommunication with local people
・ Effective information sending
- Aggressive and effective nuclear
Visiting members of local communityaround Shika Nuclear Power Plant
information sending - Public Relations on energy and
environmentSupporting energy and environmental
4040
- Supporting energy and environmentaleducation Lecture of energy issues
by our staff at local school
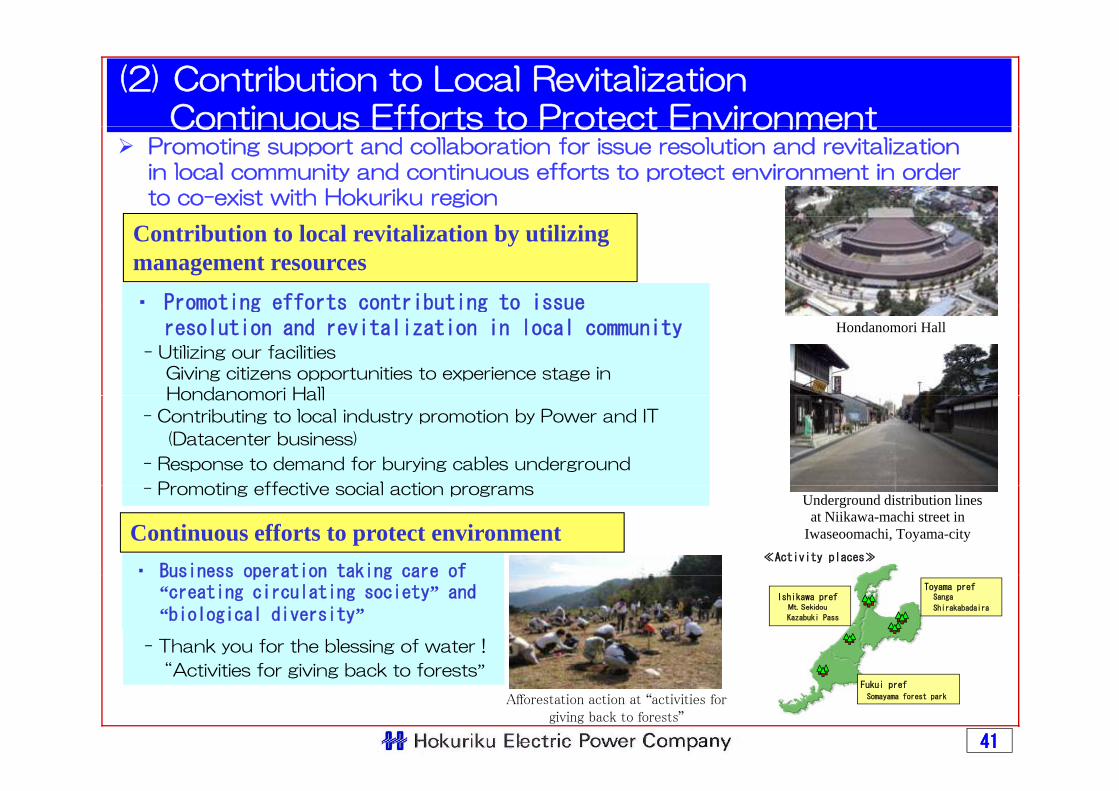
(2) Contribution to Local RevitalizationContinuous Efforts to Protect EnvironmentContinuous Efforts to Protect Environment
Promoting support and collaboration for issue resolution and revitalization in local community and continuous efforts to protect environment in order to co-exist with Hokuriku region
Contribution to local revitalization by utilizing management resources
・ Promoting efforts contributing to issuePromoting efforts contributing to issueresolution and revitalization in local community
- Utilizing our facilitiesGiving citizens opportunities to experience stage inHondanomori Hall
Hondanomori Hall
Hondanomori Hall
- Contributing to local industry promotion by Power and IT
(Datacenter business)
- Response to demand for burying cables underground
P ti ff ti i l ti
Continuous efforts to protect environment
- Promoting effective social action programs
・ Business operation taking care of
Underground distribution lines at Niikawa-machi street in
Iwaseoomachi, Toyama-city≪Activity places≫
Business operation taking care of “creating circulating society” and“biological diversity”
- Thank you for the blessing of water !
“A ti iti f i i b k t f t ”
Toyama pref
Mt. Sekidou
Kazabuki Pass
Sanga
Shirakabadaira
Ishikawa pref
4141
Afforestation action at “activities for giving back to forests”
“Activities for giving back to forests”Somayama forest park
Fukui pref
◇ Toward Continuous Growth◇ Toward Continuous Growth and Progress
4242
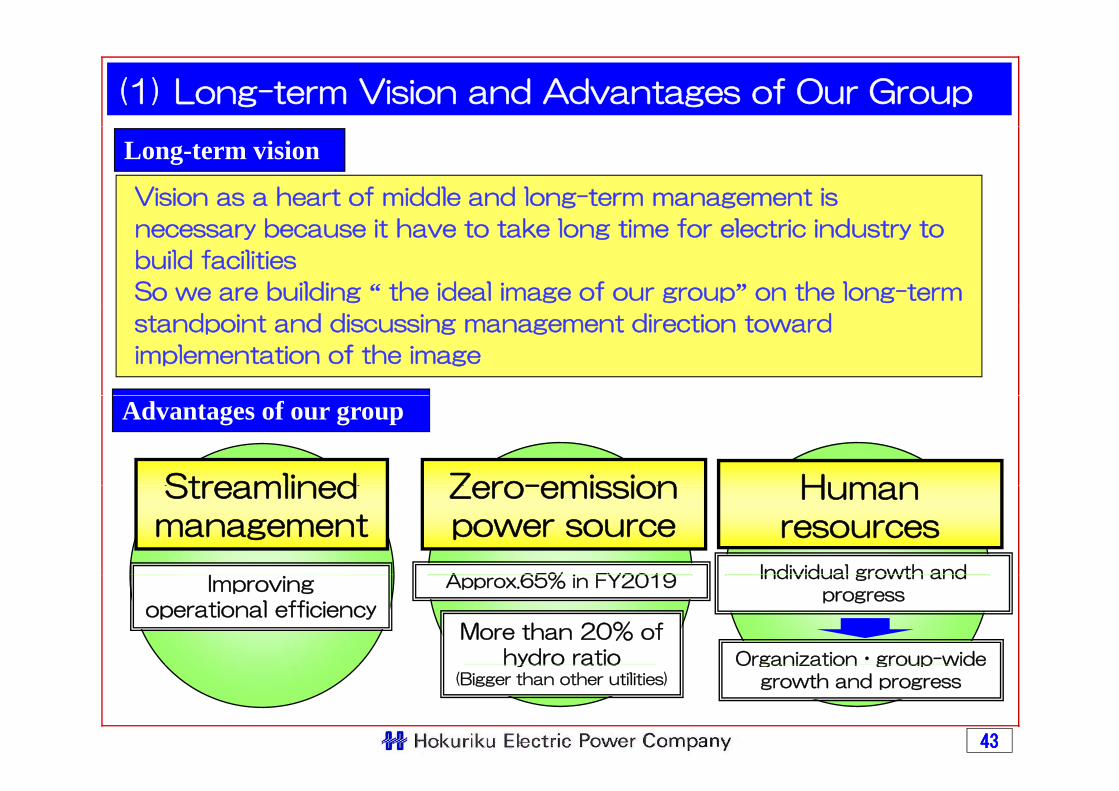
(1) Long-term Vision and Advantages of Our Group
Long-term vision
Vision as a heart of middle and long-term management is
necessary because it have to take long time for electric industry to
build facilities
So we are building “ the ideal image of our group” on the long-term
standpoint and discussing management direction toward
implementation of the image
Streamlined Zero-emission Human
Advantages of our group
A 65% i FY2019
Streamlinedmanagement
I
Zero-emissionpower source
Human resources
Individual growth and
More than 20% of hydro ratio
Approx.65% in FY2019Improving operational efficiency
Organization・group-wide
Individual growth and progress
4343
hydro ratio(Bigger than other utilities)
Organization group wide growth and progress
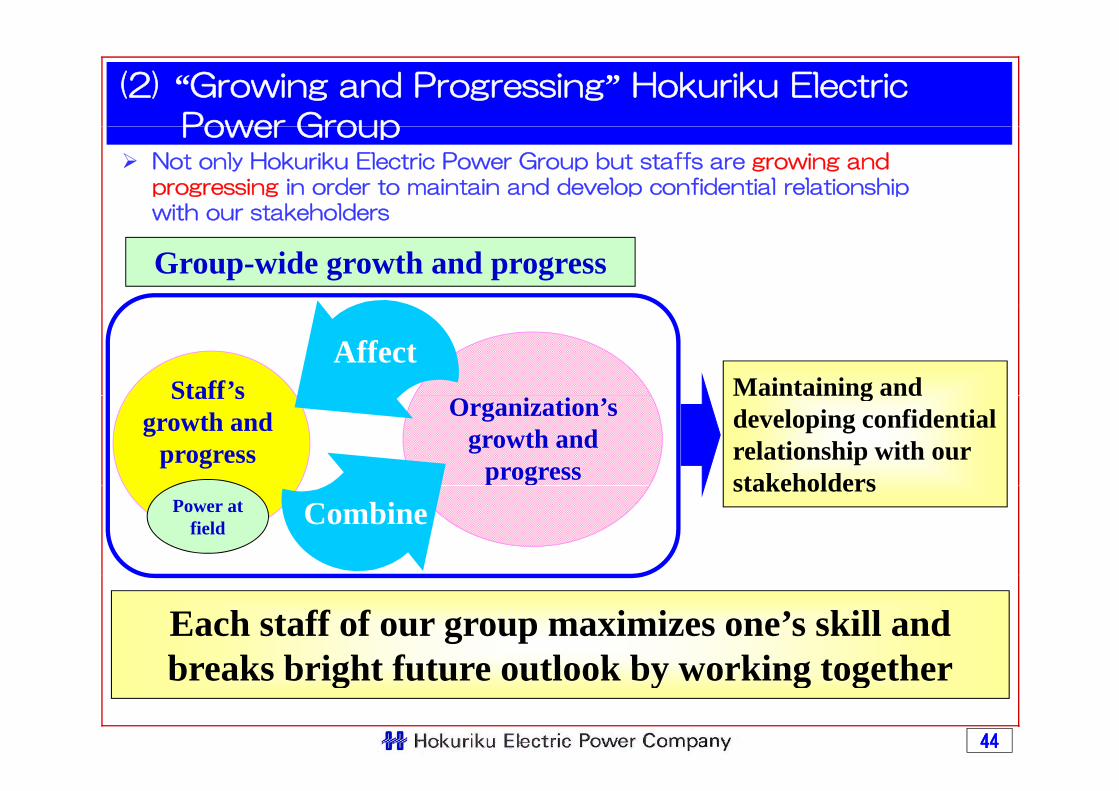
(2) “Growing and Progressing” Hokuriku Electric
Power GroupPower GroupNot only Hokuriku Electric Power Group but staffs are growing and progressing in order to maintain and develop confidential relationship with our stakeholderswith our stakeholders
Group-wide growth and progress
Maintaining andStaff’sAffect
Organization’sgrowth and
progress
Maintaining anddeveloping confidential relationship with our stakeholders
Staff sgrowth and
progressstakeholders
Power at field Combine
Each staff of our group maximizes one’s skill and breaks bright future outlook by working together
4444
breaks bright future outlook by working together
Financial Results Financial Results for FY 2009for FY 2009
Detailed DescriptionDetailed Description
May 11, 2010(Tue)
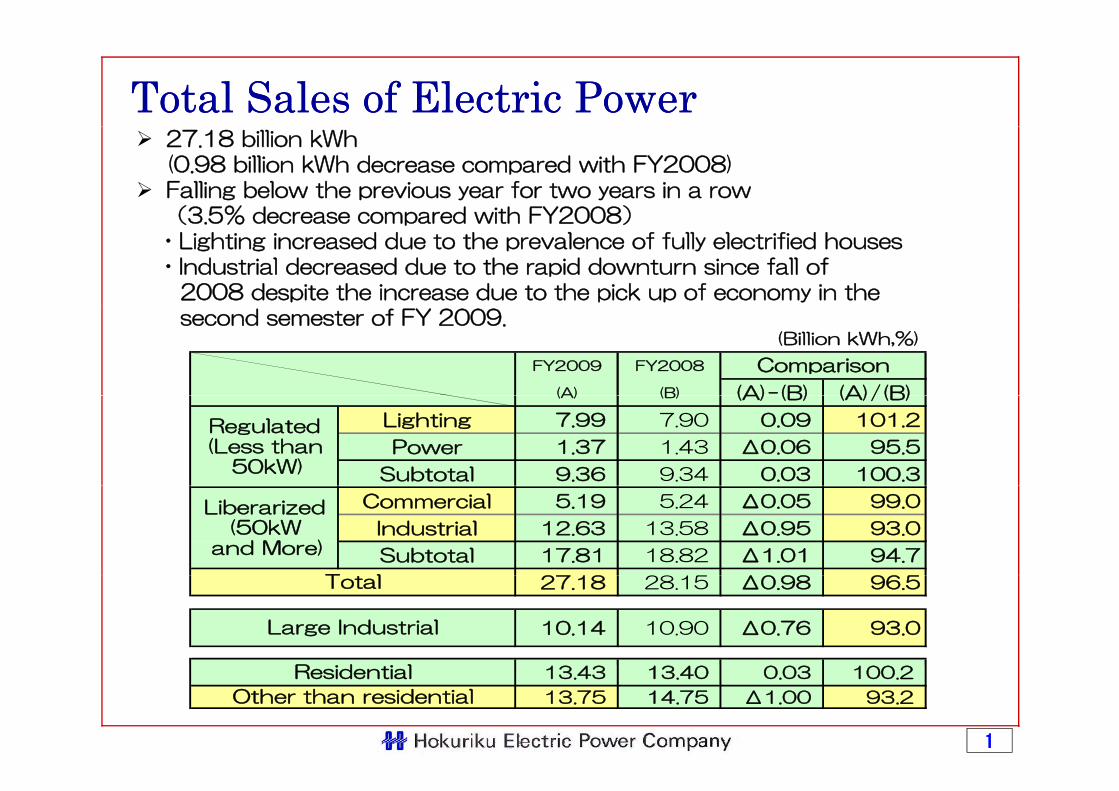
Total Sales of Electric PowerTotal Sales of Electric Power27.18 billion kWh (0.98 billion kWh decrease compared with FY2008)Falling below the previous year for two years in a row(3 5% decrease compared with FY2008)(3.5% decrease compared with FY2008)
・Lighting increased due to the prevalence of fully electrified houses ・Industrial decreased due to the rapid downturn since fall of
2008 despite the increase due to the pick up of economy in the second semester of FY 2009.
(Billion kWh,%)
FY2009 FY2008
(A) (B) (A)-(B) (A)/(B)
Comparison
(A) (B) (A) (B) (A)/(B)
Lighting 7.99 7.90 0.09 101.2
Power 1.37 1.43 Δ0.06 95.5
Subtotal 9.36 9.34 0.03 100.3
Regulated(Less than
50kW)
Commercial 5.19 5.24 Δ0.05 99.0
Industrial 12.63 13.58 Δ0.95 93.0
Subtotal 17.81 18.82 Δ1.01 94.7
T l
Liberarized(50kW
and More)
27.18 28.15 Δ0.98 96.5
10.14 10.90 Δ0.76 93.0
Total
Large Industrial
R d l
11
13.43 13.40 0.03 100.2
13.75 14.75 Δ1.00 93.2 Other than residential
Residential
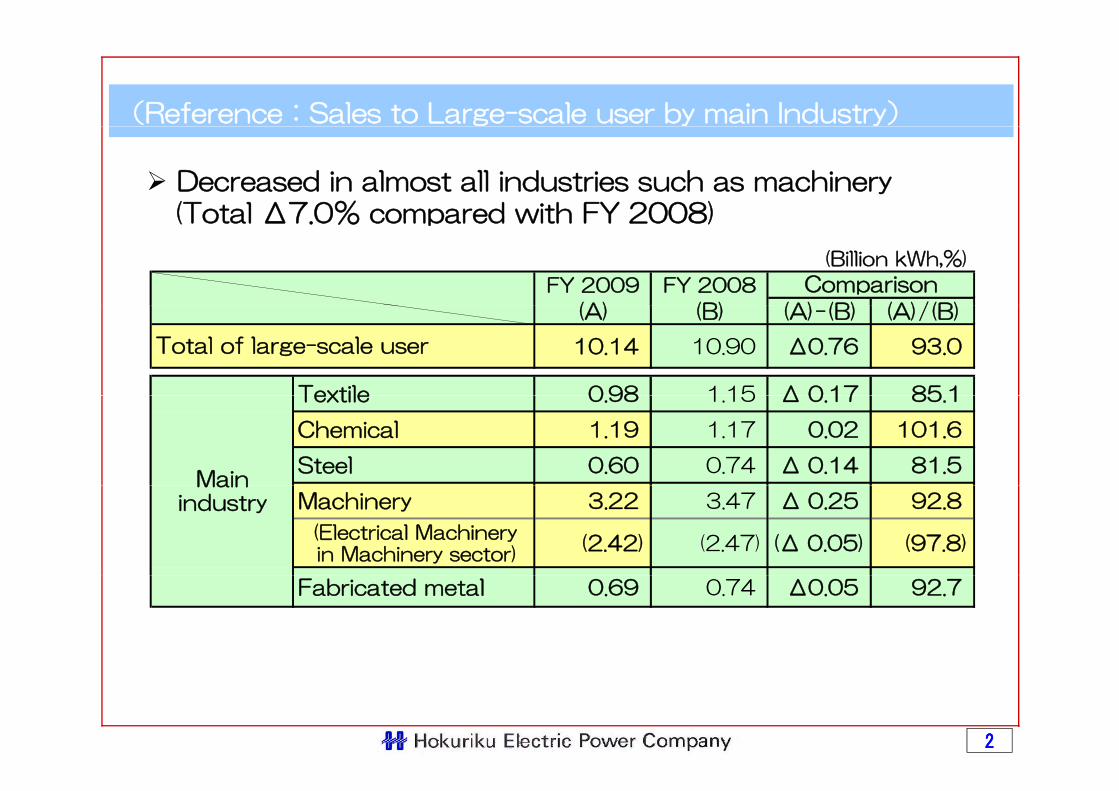
(Reference:Sales to Large-scale user by main Industry)
Decreased in almost all industries such as machinery(Total Δ7 0% compared with FY 2008)(Total Δ7.0% compared with FY 2008)
(Billion kWh,%)
FY 2009 FY 2008
(A) (B) (A) (B) (A)/(B)
Comparison
(A) (B) (A)-(B) (A)/(B)
10.14 10.90 Δ0.76 93.0
Textile 0 98 1 15 Δ 0 17 85 1
Total of large-scale user
Textile 0.98 1.15 Δ 0.17 85.1
Chemical 1.19 1.17 0.02 101.6
Steel 0.60 0.74 Δ 0.14 81.5 Main
Machinery 3.22 3.47 Δ 0.25 92.8
(Electrical Machinery in Machinery sector)
(2.42) (2.47) (Δ 0.05) (97.8)
Mainindustry
Fabricated metal 0.69 0.74 Δ0.05 92.7
22
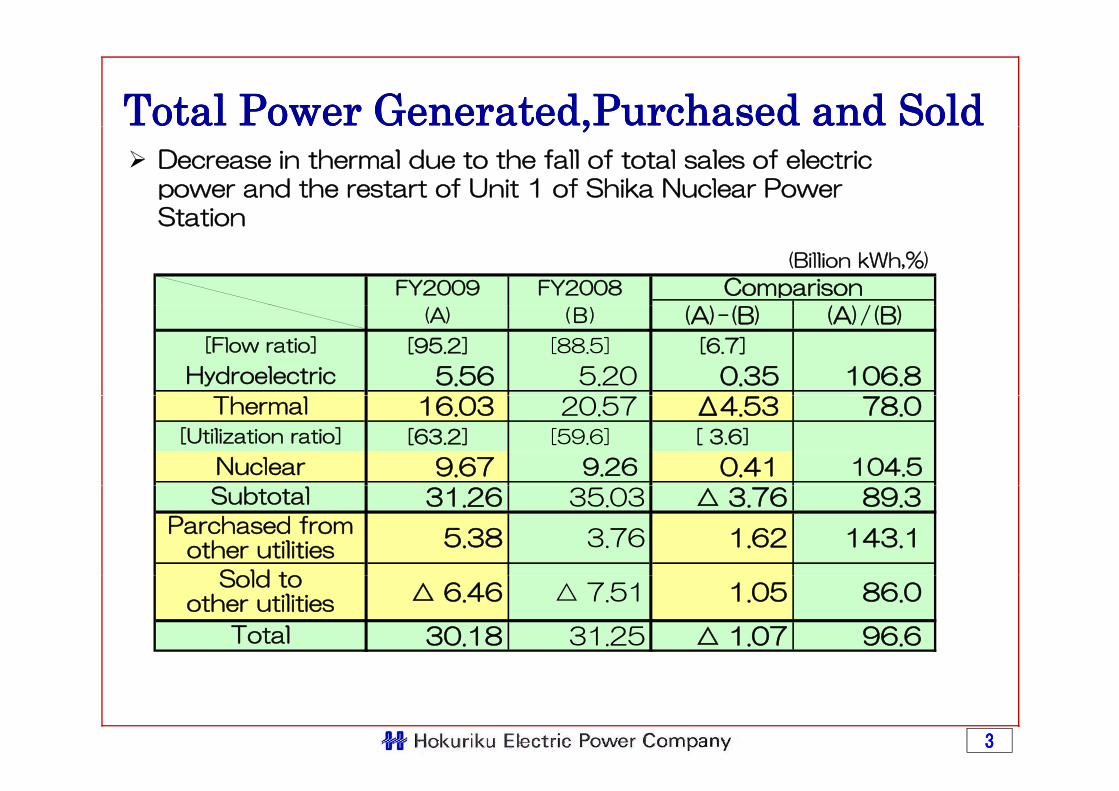
Total Power Generated,Purchased and SoldTotal Power Generated,Purchased and SoldDecrease in thermal due to the fall of total sales of electric power and the restart of Unit 1 of Shika Nuclear Power Station
,,
Station
(Billion kWh,%)
FY2009 FY2008
( ) ( ) ( )/( )
Comparison(A) (B) (A)-(B) (A)/(B)
[95.2] [88.5] [6.7]
5.56 5.20 0.35 106.8 Hydroelectric
[Flow ratio]
16.03 20.57 Δ4.53 78.0 [63.2] [59.6] [ 3.6]
9.67 9.26 0.41 104.5
Thermal
[Utilization ratio]
Nuclear
31.26 35.03 △ 3.76 89.3
5.38 3.76 1.62 143.1
S ld t
Subtotal
Parchased fromother utilities
△ 6.46 △ 7.51 1.05 86.0
30.18 31.25 △ 1.07 96.6
Sold toother utilities
Total
33
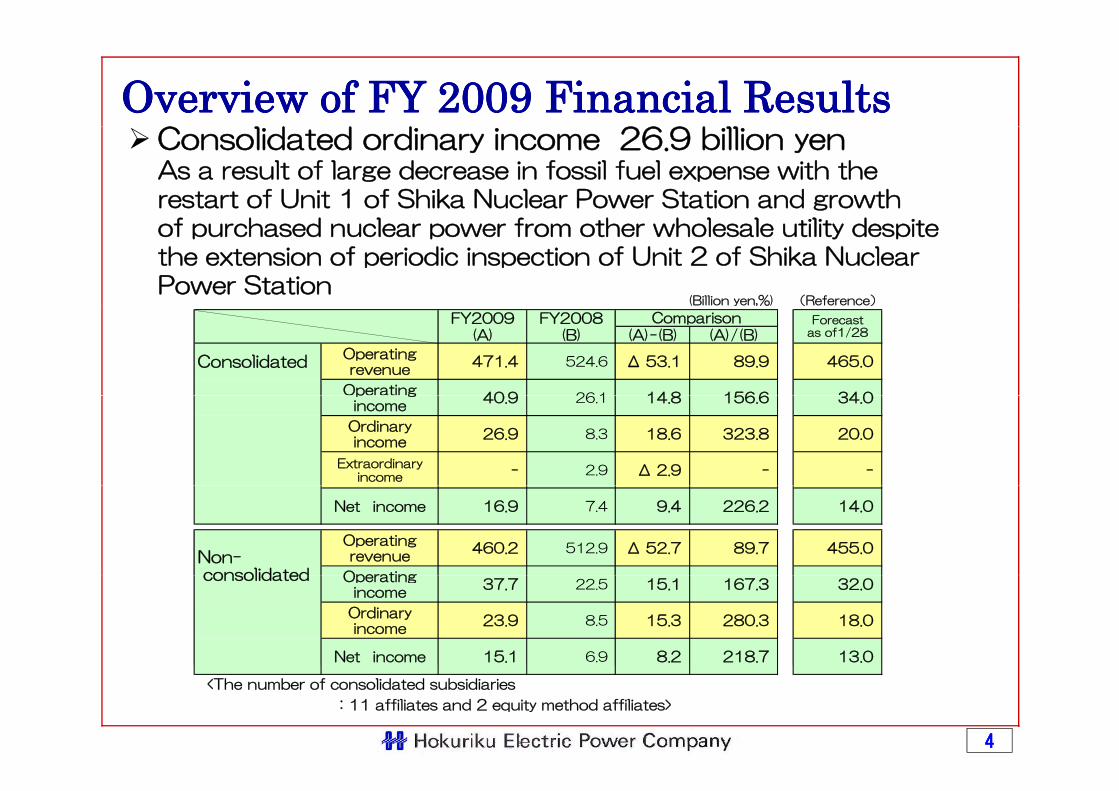
Overview of FY 2009 Financial ResultsOverview of FY 2009 Financial ResultsConsolidated ordinary income 26.9 billion yenAs a result of large decrease in fossil fuel expense with the restart of Unit 1 of Shika Nuclear Power Station and growth of purchased nuclear power from other wholesale utility despite the extension of periodic inspection of Unit 2 of Shika Nuclear Power Station
(Billion yen,%) (Reference)y ,% ( )
FY2009 FY2008(A) (B) (A)-(B) (A)/(B)
ConsolidatedOperatingrevenue
471.4 524.6 Δ 53.1 89.9 465.0
Operating40 9 26 1 14 8 156 6 34 0
Forecastas of1/28
Comparison
p gincome
40.9 26.1 14.8 156.6 34.0
Ordinaryincome
26.9 8.3 18.6 323.8 20.0
Extraordinaryincome - 2.9 Δ 2.9 - -
Net income 16.9 7.4 9.4 226.2 14.0
Operatingrevenue
460.2 512.9 Δ 52.7 89.7 455.0
Operating
Non-consolidated Operating
income37.7 22.5 15.1 167.3 32.0
Ordinaryincome
23.9 8.5 15.3 280.3 18.0
Net income 15.1 6.9 8.2 218.7 13.0
consolidated
44
<The number of consolidated subsidiaries
:11 affiliates and 2 equity method affiliates>
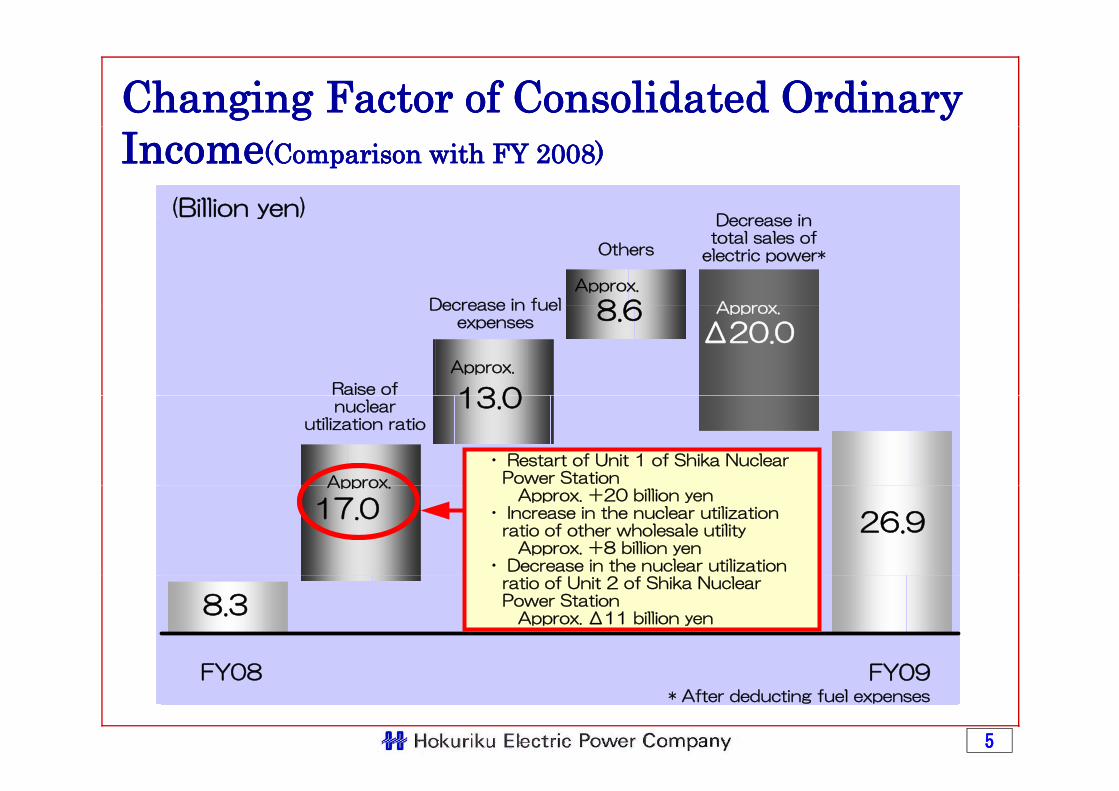
Changing Factor of Consolidated OrdinaryChanging Factor of Consolidated Ordinary
(Billion yen)D i
IncomeIncome(Comparison with FY 2008)(Comparison with FY 2008)
「*」は燃料費控除後
8 6
(Billion yen)
Decrease in fuel Approx
Approx.
Others
Decrease intotal sales of
electric power*
Δ20.0
13 0
8.6Decrease in fuelexpenses
Approx.
Approx.
Raise of 13.0nuclearutilization ratio
Approx
・ Restart of Unit 1 of Shika Nuclear Power Station
程度 26.917.0
Approx. Approx. +20 billion yen ・ Increase in the nuclear utilization ratio of other wholesale utility Approx. +8 billion yen ・ Decrease in the nuclear utilization
8.3
FY08 FY09
ratio of Unit 2 of Shika Nuclear Power Station Approx. Δ11 billion yen
FY08 FY09* After deducting fuel expenses
55
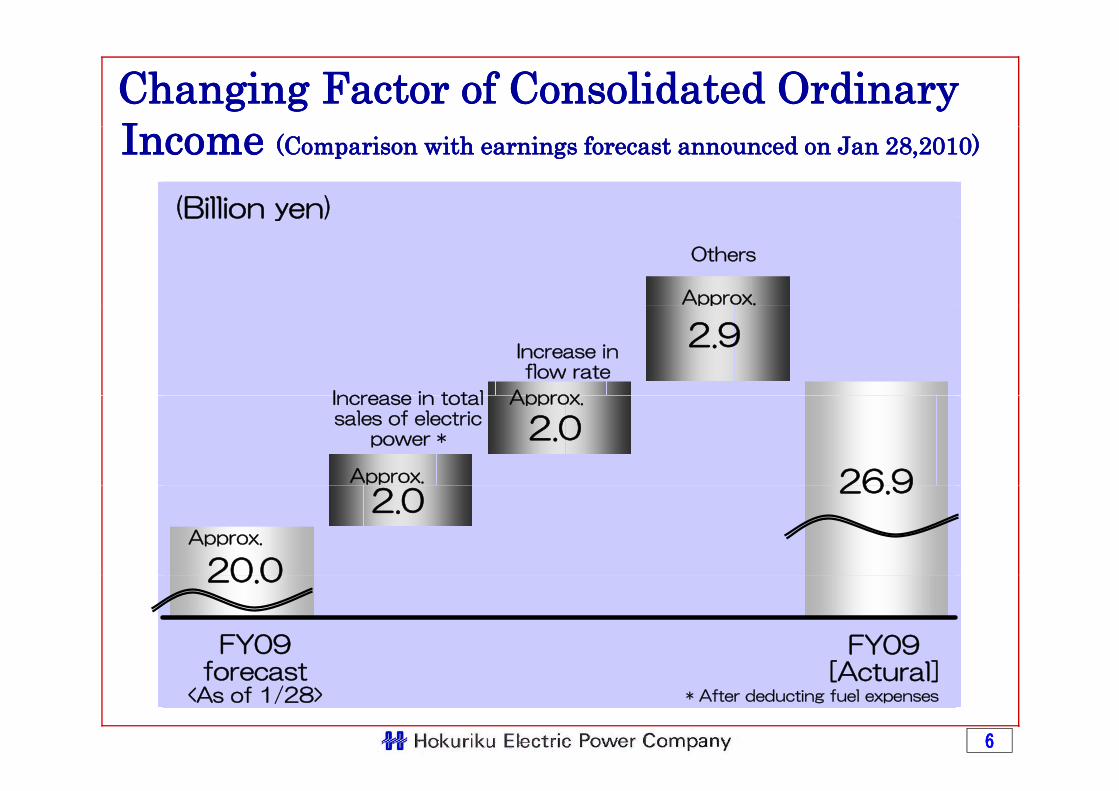
Changing Factor of Consolidated OrdinaryChanging Factor of Consolidated OrdinaryIIIncome Income (Comparison with earnings forecast announced on Jan 28,2010)(Comparison with earnings forecast announced on Jan 28,2010)
(Billion yen)(Billion yen)
Others
Approx.
2.9Increase inflow rate
ApproxIncrease in total
pp
26 9
2.0Approx.Increase in total
sales of electricpower *
Approx. 26.92.0
20 0Approx.
20.0
FY09f t
FY09[A t l]
66
forecast<As of 1/28>
[Actural]* After deducting fuel expenses
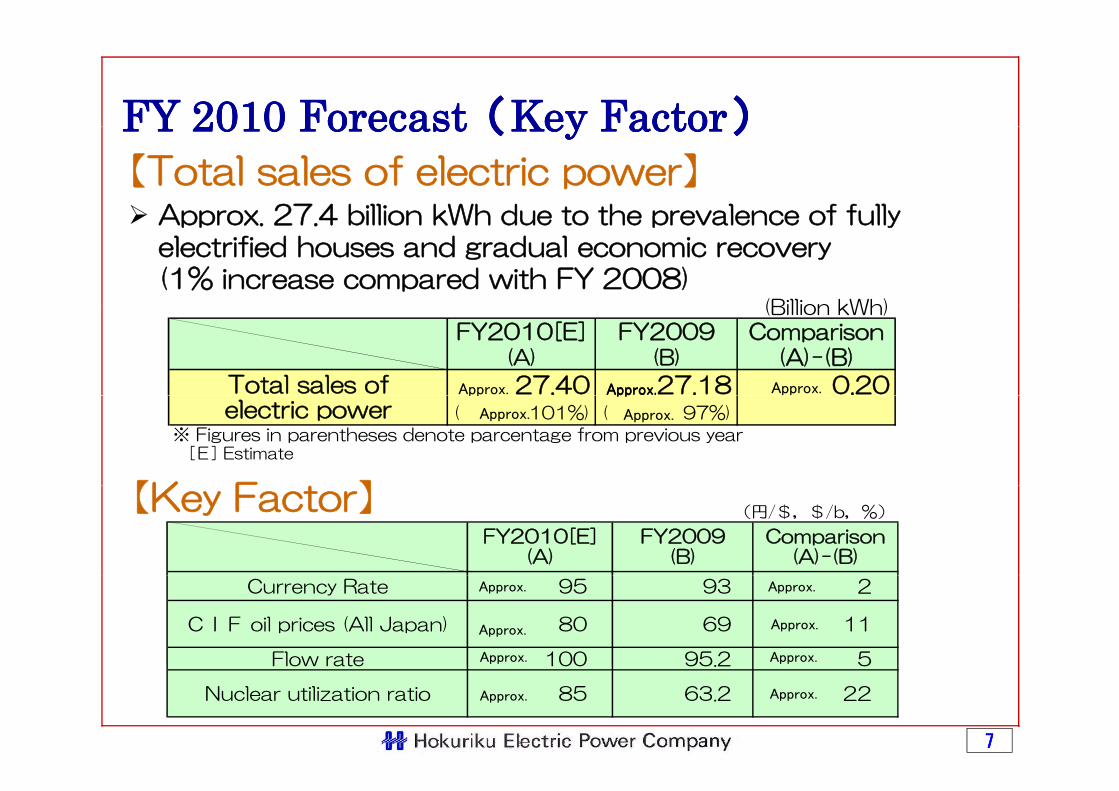
FY 2010 ForecastFY 2010 Forecast((Key FactorKey Factor))
Approx 27 4 billion kWh due to the prevalence of fully
FY 2010 ForecastFY 2010 Forecast((Key FactorKey Factor))【Total sales of electric power】
Approx. 27.4 billion kWh due to the prevalence of fully electrified houses and gradual economic recovery (1% increase compared with FY 2008)
(Billion kWh)(Billion kWh)
(B)(A)Comparison
(A)-(B)FY2010[E] FY2009
Total sales of 27.40 27.18 0.20Approx. Approx. Approx.Approx.
【K F 】
※ Figures in parentheses denote parcentage from previous year [E] Estimate
( 97%)( 101%)electric powerpp pppp
Approx. Approx.
【Key Factor】 (円/$,$/b,%)
FY2010[E](A)
Comparison(A)-(B)
FY2009(B)
Currency Rate 95 93 2
CIF oil prices (All Japan) 80 69 11
Flow rate 100 95.2 5
Approx.
Approx.
Approx.
Approx.
Approx. Approx.
77
Flow rate 100 95.2 5
Nuclear utilization ratio 85 63.2 22Approx. Approx.
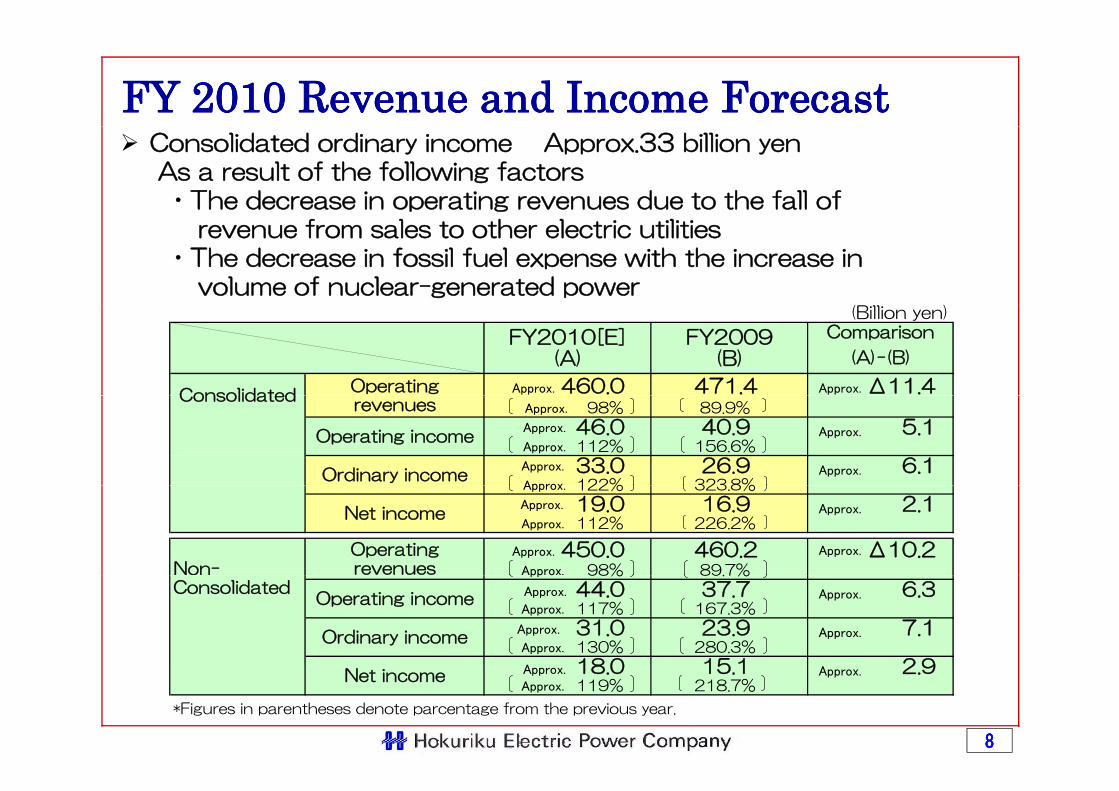
FY 2010 Revenue and Income ForecastFY 2010 Revenue and Income ForecastConsolidated ordinary income Approx.33 billion yen As a result of the following factors・The decrease in operating revenues due to the fall of
revenue from sales to other electric utilities ・The decrease in fossil fuel expense with the increase in
volume of nuclear-generated power (B ll )(Billion yen)
460.0 471.4 Δ11.4OperatingConsolidated
(A)-(B)FY2010[E]
(A)FY2009
(B)
Comparison
Approx. Approx.
98% 89.9%
46.0 40.9 5.1112% 156.6%
33.0 26.9 6.1122% 323 8%
revenues
Operating income
Ordinary income
ConsolidatedApprox.
Approx.
Approx.
Approx.
Approx
Approx.
Approx.122% 323.8%
19.0 16.9 2.1112% 226.2%
450.0 460.2 Δ10.298% 89.7%
OperatingrevenuesNon-
Net incomeApprox.
Approx.
Approx.
Approx.
Approx.
Approx.Approx.
98% 89.7%
44.0 37.7 6.3117% 167.3%
31.0 23.9 7.1130% 280.3%
18 0 15 1 2 9
Operating income
Ordinary income
Consolidatedpp o
Approx.
Approx.
Approx.
A
Approx.
Approx.
Approx.
88
18.0 15.1 2.9119% 218.7%
*Figures in parentheses denote parcentage from the previous year.
Net income Approx.Approx.
Approx.
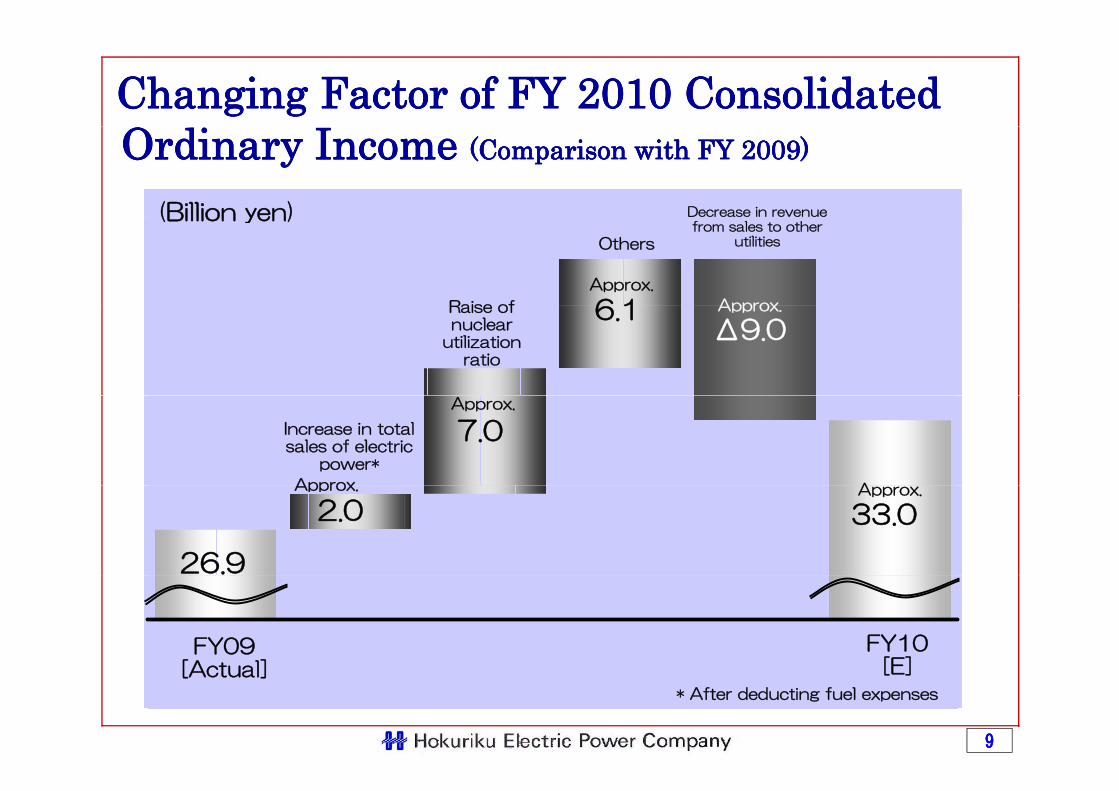
Changing Factor of FY 2010 ConsolidatedChanging Factor of FY 2010 ConsolidatedOrdinary Income Ordinary Income (Comparison with FY 2009)(Comparison with FY 2009)
(Billion yen) Decrease in revenue
6 1
(Billion yen)
Approx
Others
Approx.
Decrease in revenuefrom sales to other
utilities
Raise of
Δ9.06.1 Approx.Raise of
nuclearutilization
ratio
7.0
A
Approx.
Increase in totalsales of electric
power*
Approx
33.02.0
26.9
Approx.Approx.
FY09[A t l]
FY10[E]
99
[Actual] [E] * After deducting fuel expenses
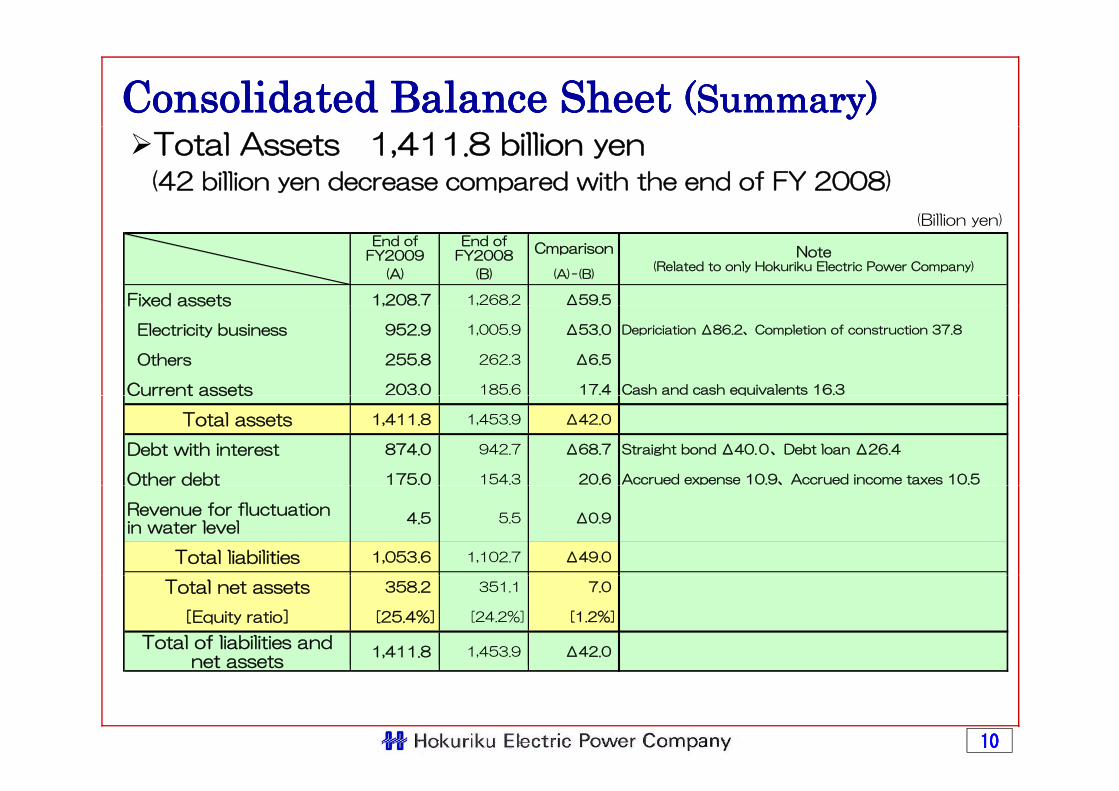
Consolidated Balance Sheet Consolidated Balance Sheet (Summary)(Summary)Total Assets 1,411.8 billion yen(42 billion yen decrease compared with the end of FY 2008)
(Billi )(Billion yen)
End ofFY2009
End ofFY2008
Cmparison
(A) (B) (A)-(B)
Fixed assets 1,208.7 1,268.2 Δ59.5
Note(Related to only Hokuriku Electric Power Company)
Fixed assets , . ,
Electricity business 952.9 1,005.9 Δ53.0 Depriciation Δ86.2、Completion of construction 37.8
Others 255.8 262.3 Δ6.5
Current assets 203.0 185.6 17.4 Cash and cash equivalents 16.3Current assets q
Total assets 1,411.8 1,453.9 Δ42.0
Debt with interest 874.0 942.7 Δ68.7 Straight bond Δ40.0、Debt loan Δ26.4
Other debt 175.0 154.3 20.6 Accrued expense 10.9、Accrued income taxes 10.5Other debt p
Revenue for fluctuationin water level
4.5 5.5 Δ0.9
Total liabilities 1,053.6 1,102.7 Δ49.0
Total net assets 358.2 351.1 7.0
[Equity ratio] [25.4%] [24.2%] [1.2%]
Total of liabilities andnet assets
1,411.8 1,453.9 Δ42.0
1010
net assets
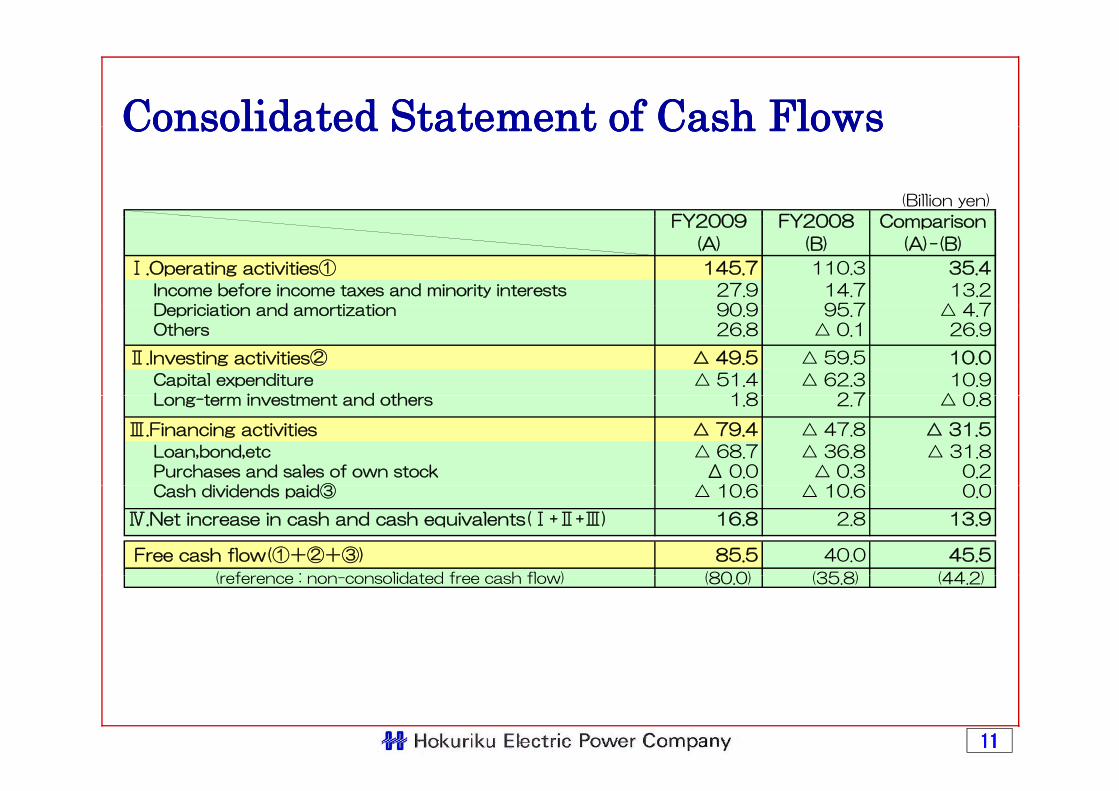
Consolidated Statement of Cash FlowsConsolidated Statement of Cash FlowsConsolidated Statement of Cash FlowsConsolidated Statement of Cash Flows(Billion yen)
FY2009 FY2008 C iFY2009 FY2008 Comparison
(A) (B) (A)-(B)
Ⅰ.Operating activities① 145.7 110.3 35.4
Income before income taxes and minority interests 27.9 14.7 13.2D i i ti d ti ti 90 9 95 7 △ 4 7
Depriciation and amortization 90.9 95.7 △ 4.7Others 26.8 △ 0.1 26.9
Ⅱ.Investing activities② △ 49.5 △ 59.5 10.0
Capital expenditure △ 51.4 △ 62.3 10.9L t i t t d th 1 8 2 7 △ 0 8Long-term investment and others 1.8 2.7 △ 0.8
Ⅲ.Financing activities △ 79.4 △ 47.8 △ 31.5
Loan,bond,etc △ 68.7 △ 36.8 △ 31.8Purchases and sales of own stock Δ 0.0 △ 0.3 0.2C h di id d id③ △ 10 6 △ 10 6 0 0Cash dividends paid③ △ 10.6 △ 10.6 0.0
Ⅳ.Net increase in cash and cash equivalents(Ⅰ+Ⅱ+Ⅲ) 16.8 2.8 13.9
Free cash flow(①+②+③) 85.5 40.0 45.5
( f : lid t d f h fl ) (80 0) (35 8) (44 2)(reference : non-consolidated free cash flow) (80.0) (35.8) (44.2)
1111
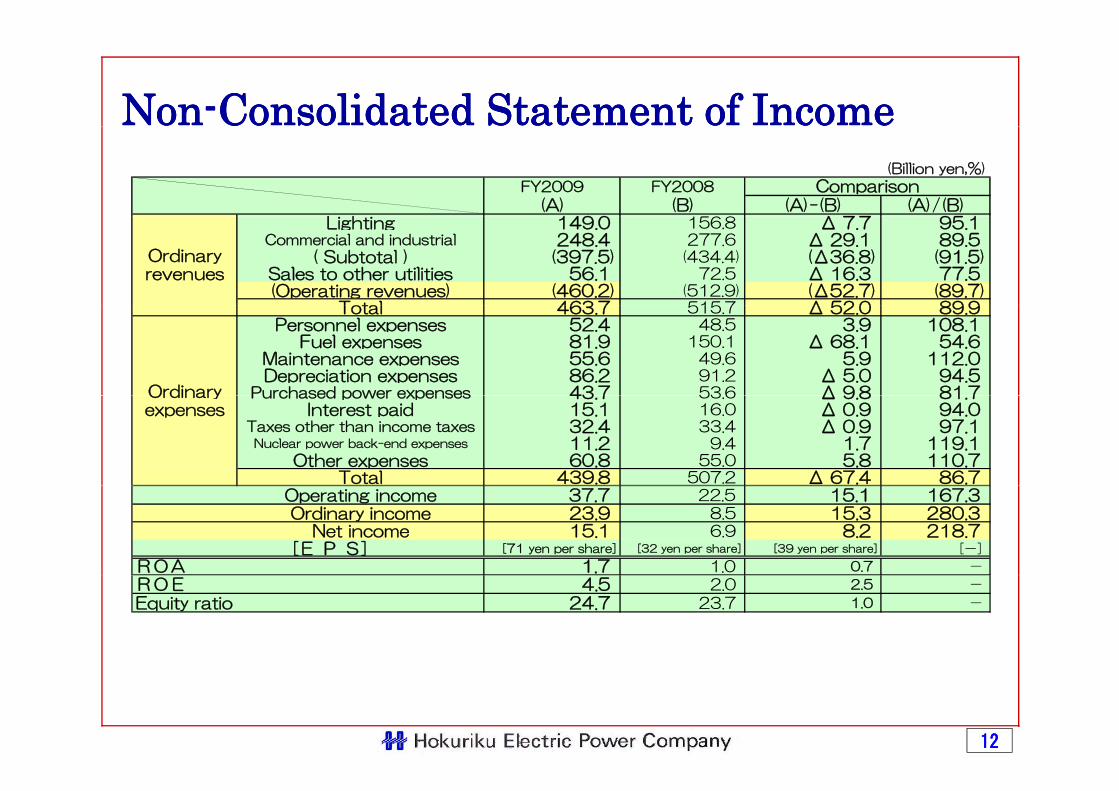
NonNon--Consolidated Statement of IncomeConsolidated Statement of Income(Billion yen,%)
FY2009 FY2008
(A) (B) (A)-(B) (A)/(B)L h 149 0 Δ 7 7 95 1
Comparison
Lighting 149.0 156.8 Δ 7.7 95.1 Commercial and industrial 248.4 277.6 Δ 29.1 89.5
( Subtotal ) (397.5) (434.4) (Δ36.8) (91.5)Sales to other utilities 56.1 72.5 Δ 16.3 77.5 (Operating revenues) (460.2) (512.9) (Δ52.7) (89.7)
Total 463 7 515 7 Δ 52 0 89 9
Ordinaryrevenues
Total 463.7 515.7 Δ 52.0 89.9 Personnel expenses 52.4 48.5 3.9 108.1
Fuel expenses 81.9 150.1 Δ 68.1 54.6 Maintenance expenses 55.6 49.6 5.9 112.0 Depreciation expenses 86.2 91.2 Δ 5.0 94.5
Purchased power expenses 43 7 53 6 Δ 9 8 81 7Ordinary Purchased power expenses 43.7 53.6 Δ 9.8 81.7 Interest paid 15.1 16.0 Δ 0.9 94.0
Taxes other than income taxes 32.4 33.4 Δ 0.9 97.1 Nuclear power back-end expenses 11.2 9.4 1.7 119.1
Other expenses 60.8 55.0 5.8 110.7 Total 439.8 507.2 Δ 67.4 86.7
Ordinaryexpenses
Operating income 37.7 22.5 15.1 167.3 Ordinary income 23.9 8.5 15.3 280.3 Net income 15.1 6.9 8.2 218.7
[E P S] [71 yen per share] [32 yen per share] [39 yen per share] [-]
ROA 1.7 1.0 0.7 -
ROE 4.5 2.0 2.5 -
Equity ratio 24.7 23.7 1.0 -
1212

Revenue statementRevenue statementOperating revenue 460.2 billion yen52.7 billion yen decrease due to the fall of total sales of
Revenue statementRevenue statement
yelectric power and revenues from sales to other electric utilities
(Billion yen, %)
FY2009 FY2008
(A) (B) (A)-(B) (A)/(B)
Lighting 149 0 156 8 Δ 7 7 95 1
Comparison
Lighting 149.0 156.8 Δ 7.7 95.1
Commercial and industrial 248.4 277.6 Δ 29.1 89.5
( Subtotal ) (397 5) (434 4) (Δ36 8) (91 5) ( Subtotal ) (397.5) (434.4) (Δ36.8) (91.5)
Sales to other utilities 56.1 72.5 Δ 16.3 77.5
(Operating revenues) (460 2) (512 9) (Δ52 7) (89 7)
Ordinaryrevenue
(Operating revenues) (460.2) (512.9) (Δ52.7) (89.7)
Total 463.7 515.7 Δ 52.0 89.9
1313
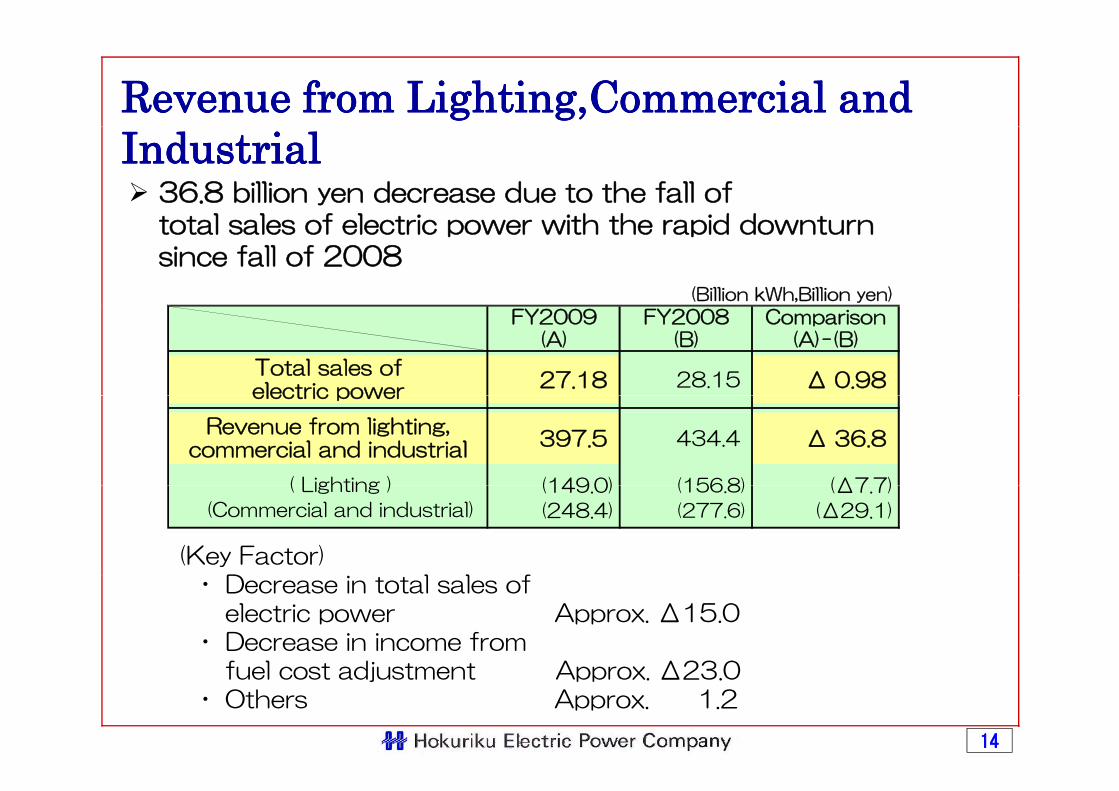
Revenue from Lighting,Commercial andRevenue from Lighting,Commercial and
36.8 billion yen decrease due to the fall of t t l l f l t i ith th id d t
IndustrialIndustrialtotal sales of electric power with the rapid downturnsince fall of 2008
(Billion kWh,Billion yen)
FY2009 FY2008 Comparison(A) (B) (A)-(B)
27.18 28.15 Δ 0.98 Total sales ofelectric power
397.5 434.4 Δ 36.8
(149 0) (156 8) (Δ7 7)
electric power
Revenue from lighting,commercial and industrial
( Lighting )
(Key Factor)D l l f
(149.0) (156.8) (Δ7.7)
(248.4) (277.6) (Δ29.1)(Commercial and industrial)
( Lighting )
・ Decrease in total sales of electric power Approx. Δ15.0
・ Decrease in income from f l t dj t t A Δ23 0
1414
fuel cost adjustment Approx. Δ23.0 ・ Others Approx. 1.2
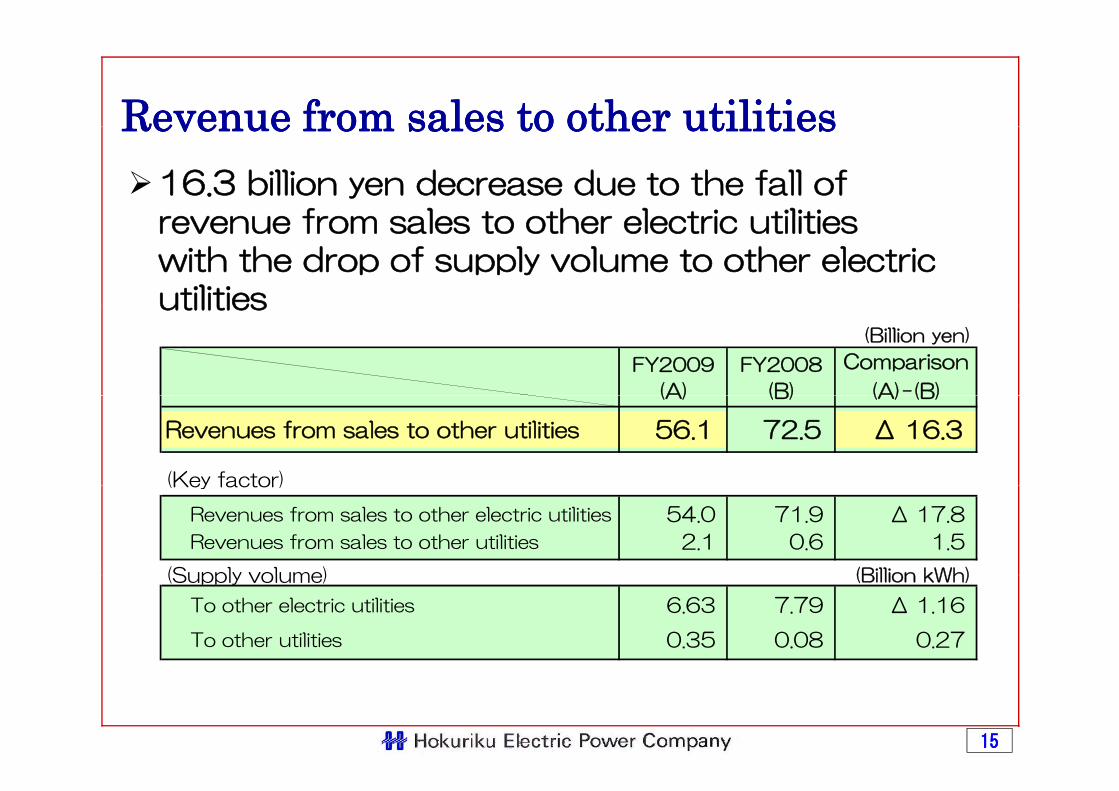
Revenue from sales to other utilitiesRevenue from sales to other utilities16.3 billion yen decrease due to the fall of
v f l t th l t i tiliti
Revenue from sales to other utilitiesRevenue from sales to other utilities
revenue from sales to other electric utilities with the drop of supply volume to other electric utilitiesutilities
(Billion yen)
FY2009 FY2008 Comparison
(A) (B) (A)-(B)(A) (B) (A) (B)
Revenues from sales to other utilities 56.1 72.5 Δ 16.3
(Key factor)(Key factor)
Revenues from sales to other electric utilities 54.0 71.9 Δ 17.8
Revenues from sales to other utilities 2.1 0.6 1.5
(Supply volume) (Billion kWh)(Supply volume) (Billion kWh)
To other electric utilities 6.63 7.79 Δ 1.16
To other utilities 0.35 0.08 0.27
1515
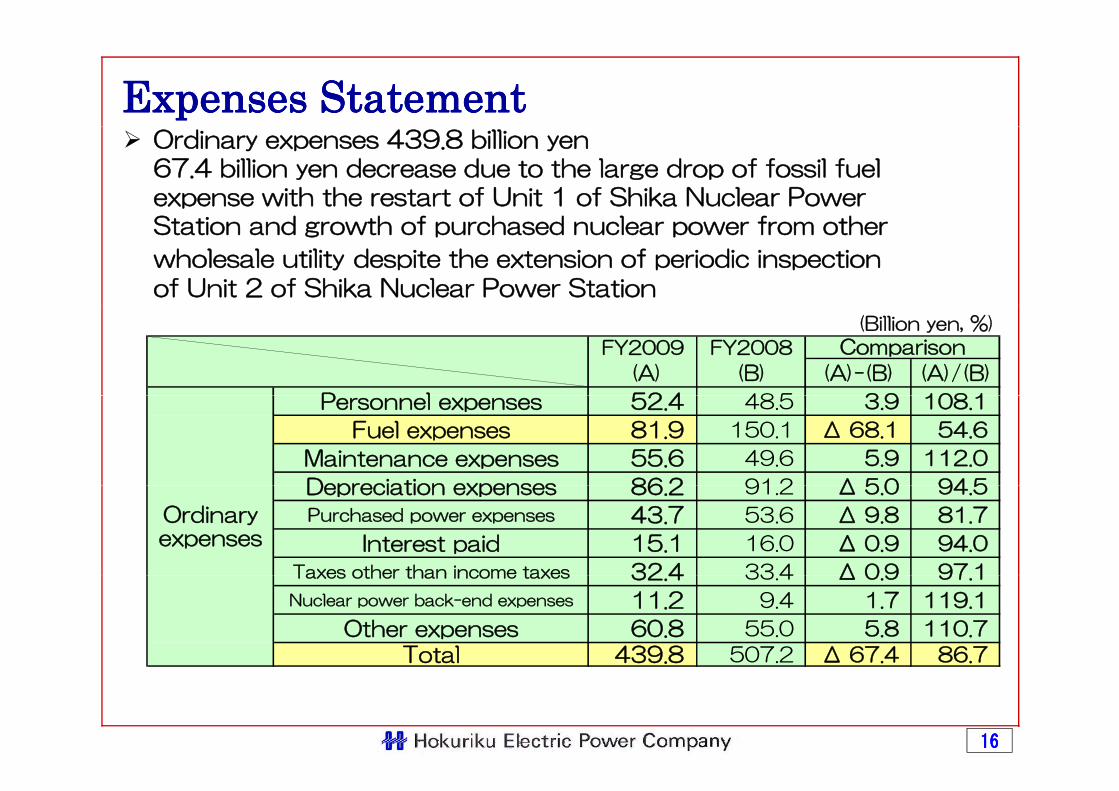
Expenses StatementExpenses StatementOrdinary expenses 439.8 billion yen67.4 billion yen decrease due to the large drop of fossil fuel expense with the restart of Unit 1 of Shika Nuclear Power S d h f h d l f hStation and growth of purchased nuclear power from other
wholesale utility despite the extension of periodic inspection of Unit 2 of Shika Nuclear Power Station
(Billion yen, %)
FY2009 FY2008
(A) (B) (A)-(B) (A)/(B)
P l 52 4 48 5 3 9 108 1
Comparison
Personnel expenses 52.4 48.5 3.9 108.1
Fuel expenses 81.9 150.1 Δ 68.1 54.6
Maintenance expenses 55.6 49.6 5.9 112.0
Depreciation expenses 86 2 91 2 Δ 5 0 94 5 Depreciation expenses 86.2 91.2 Δ 5.0 94.5
Purchased power expenses 43.7 53.6 Δ 9.8 81.7
Interest paid 15.1 16.0 Δ 0.9 94.0
Taxes other than income taxes 32 4 33 4 Δ 0 9 97 1
Ordinaryexpenses
Taxes other than income taxes 32.4 33.4 Δ 0.9 97.1
Nuclear power back-end expenses 11.2 9.4 1.7 119.1
Other expenses 60.8 55.0 5.8 110.7
Total 439.8 507.2 Δ 67.4 86.7
1616
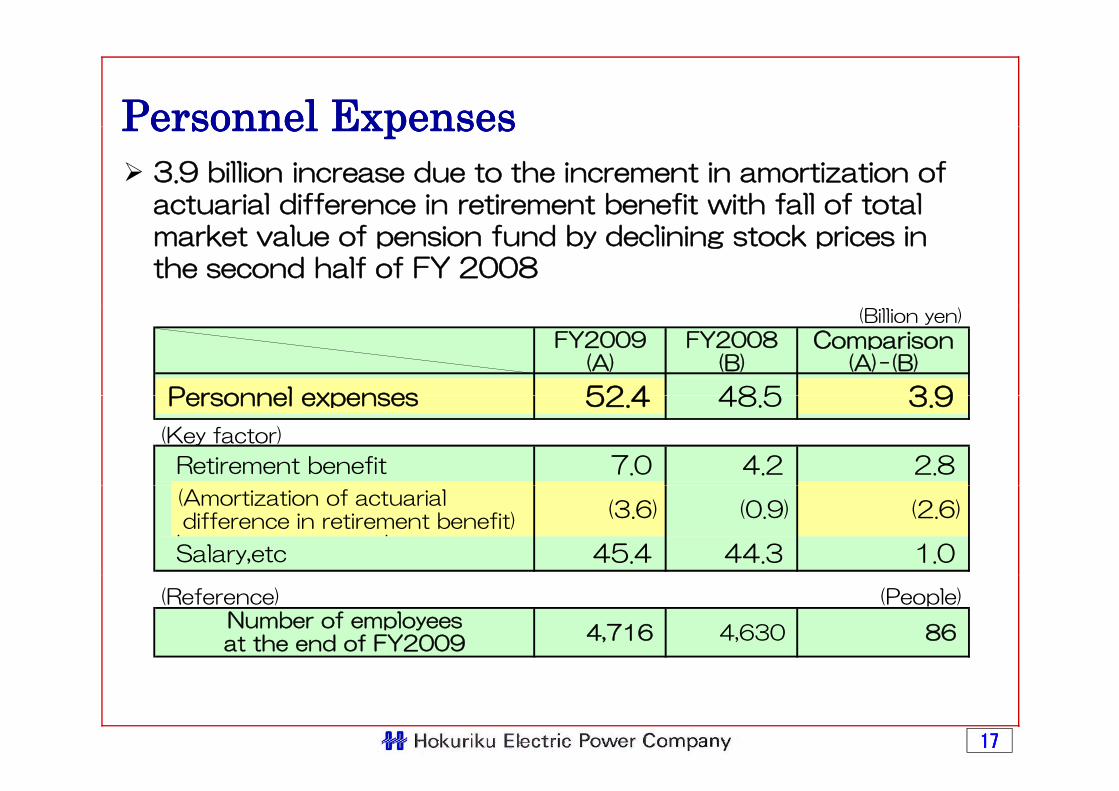
Personnel ExpensesPersonnel Expenses3.9 billion increase due to the increment in amortization of actuarial difference in retirement benefit with fall of total
Personnel ExpensesPersonnel Expenses
market value of pension fund by declining stock prices in the second half of FY 2008
(Billion yen)
FY2009 FY2008 Comparison(A) (B) (A)-(B)
Personnel expenses 52 4 48 5 3 9 Personnel expenses 52.4 48.5 3.9
(Key factor)
Retirement benefit 7.0 4.2 2.8
(Amortization of actuarial difference in retirement benefit)
(3.6) (0.9) (2.6)
Salary,etc 45.4 44.3 1.0
(Reference) (People)
4,716 4,630 86 Number of employeesat the end of FY2009
1717
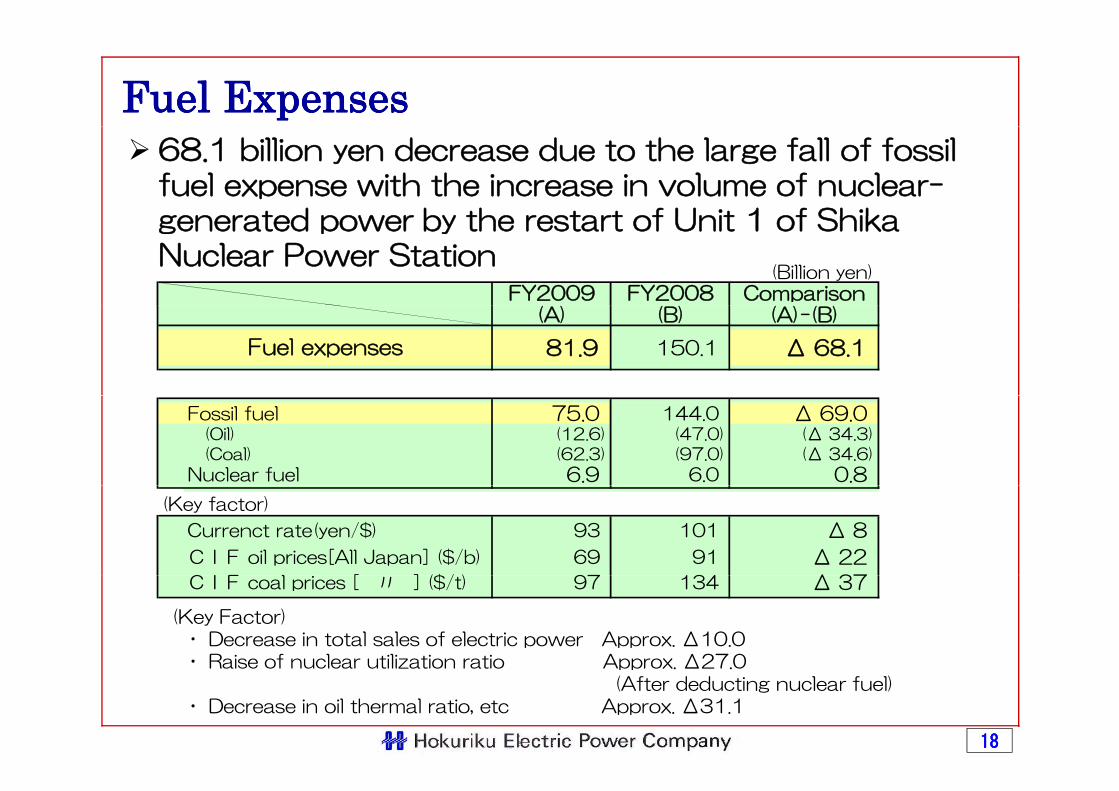
Fuel ExpensesFuel Expenses68.1 billion yen decrease due to the large fall of fossil fuel expense with the increase in volume of nuclear-generated power by the restart of Unit 1 of Shikagenerated power by the restart of Unit 1 of Shika Nuclear Power Station
(Billion yen)FY2009 FY2008 Comparison
( ) ( ) ( ) ( )(A) (B) (A)-(B)
81.9 150.1 Δ 68.1
Fuel expenses
Fossil fuel 75.0 144.0 Δ 69.0 (Oil) (12.6) (47.0) (Δ 34.3) (Coal) (62.3) (97.0) (Δ 34.6)
Nuclear fuel 6.9 6.0 0.8
(Key factor)
CIF oil prices[All Japan] ($/b) 69 91 Δ 22
97 134 Δ 37
Δ 8 Currenct rate(yen/$) 93 101
CIF l [ ] ($/ ) 97 134 Δ 37 CIF coal prices [ 〃 ] ($/t)
(Key Factor)・ Decrease in total sales of electric power Approx. Δ10.0・ Raise of nuclear utilization ratio Approx Δ27 0
1818
Raise of nuclear utilization ratio Approx. Δ27.0(After deducting nuclear fuel)
・ Decrease in oil thermal ratio, etc Approx. Δ31.1
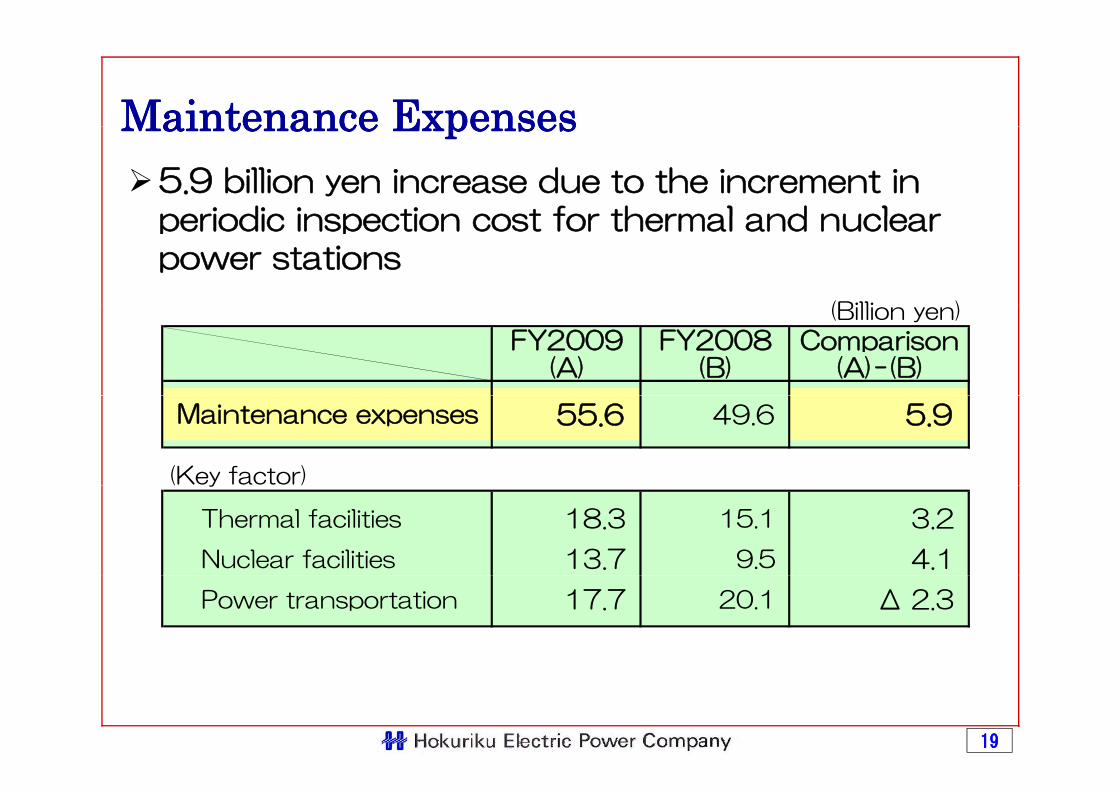
Maintenance ExpensesMaintenance Expenses5.9 billion yen increase due to the increment in periodic inspection cost for thermal and nuclear
Maintenance ExpensesMaintenance Expenses
periodic inspection cost for thermal and nuclear power stations
(Billi )(Billion yen)
FY2009 FY2008 Comparison(A) (B) (A)-(B)
55.6 49.6 5.9
(Key factor)
Maintenance expenses
( y )
Thermal facilities 18.3 15.1 3.2
Nuclear facilities 13.7 9.5 4.1
Power transportation 17.7 20.1 Δ 2.3
1919
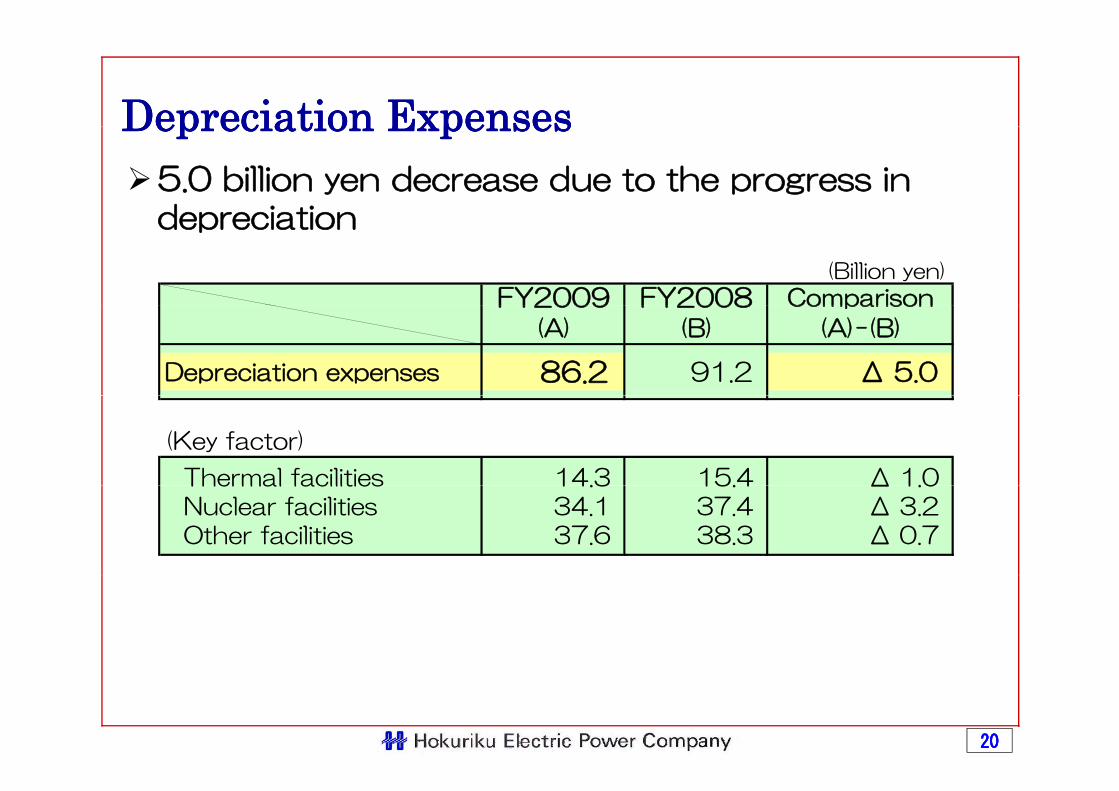
Depreciation ExpensesDepreciation Expenses5.0 billion yen decrease due to the progress in depreciation
Depreciation ExpensesDepreciation Expenses
depreciation
(Billion yen)
FY2009 FY2008 ComparisonFY2009 FY2008 Comparison
(A) (B) (A)-(B)
Depreciation expenses 86.2 91.2 Δ 5.0
(Key factor)
Thermal facilities 14.3 15.4 Δ 1.0Thermal facilities 14.3 15.4 Δ 1.0 Nuclear facilities 34.1 37.4 Δ 3.2 Other facilities 37.6 38.3 Δ 0.7
2020
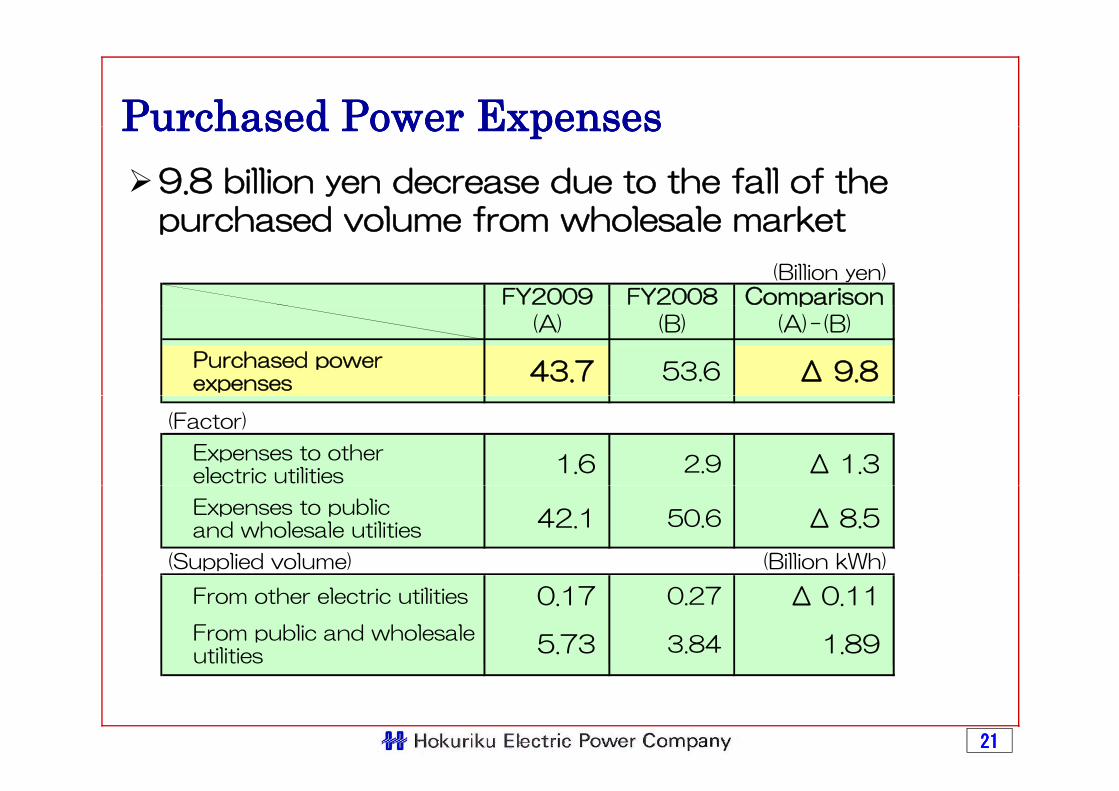
Purchased Power ExpensesPurchased Power Expenses9.8 billion yen decrease due to the fall of the purchased volume from wholesale market
Purchased Power ExpensesPurchased Power Expenses
purchased volume from wholesale market
(Billion yen)FY2009 FY2008 Comparisonp
(A) (B) (A)-(B)
Purchased powerexpenses 43.7 53.6 Δ 9.8
(Factor)
Expenses to otherelectric utilities 1.6 2.9 Δ 1.3
Expenses to publicand wholesale utilities 42.1 50.6 Δ 8.5
(Supplied volume) (Billion kWh)
From other electric utilities 0.17 0.27 Δ 0.11
From public and wholesaleutilities 5.73 3.84 1.89
2121
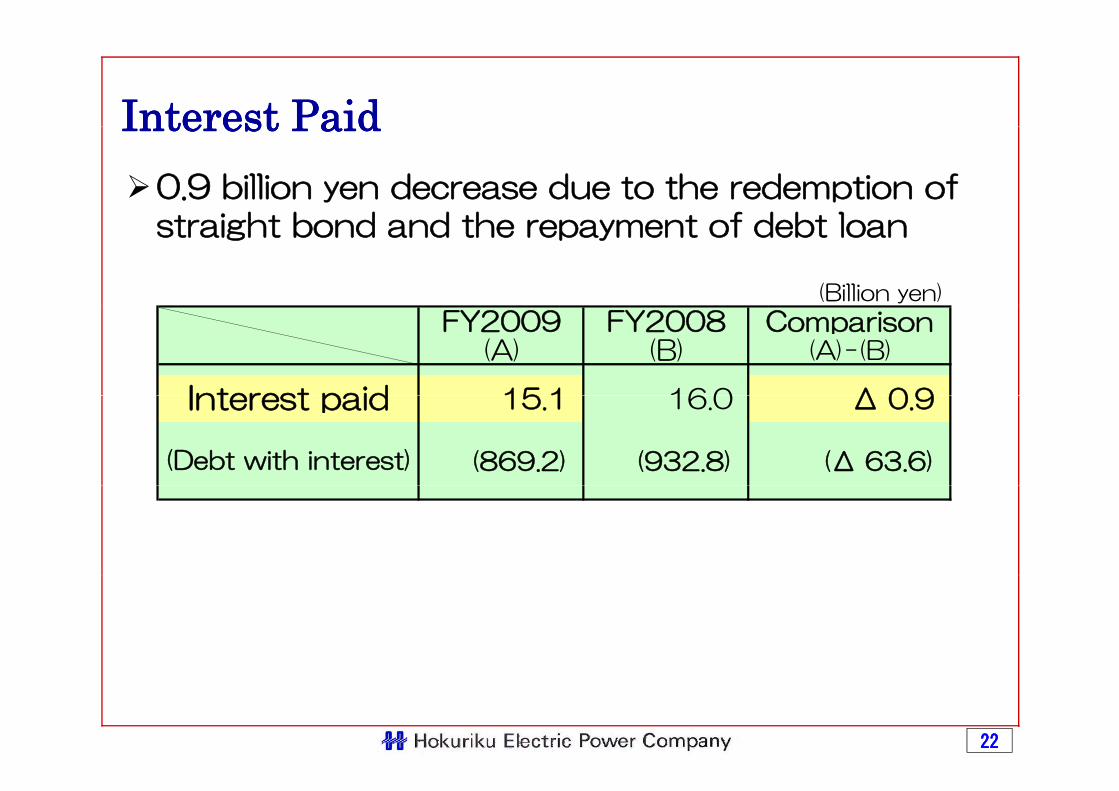
Interest PaidInterest Paid0.9 billion yen decrease due to the redemption of t i ht b d d th t f d bt l
Interest PaidInterest Paid
straight bond and the repayment of debt loan
(Billion yen)
FY2009 FY2008 Comparison(A) (B) (A)-(B)
15 1 16 0 Δ 0 9Interest paid 15.1 16.0 Δ 0.9
(869.2) (932.8) (Δ 63.6)
Interest paid
(Debt with interest)
2222
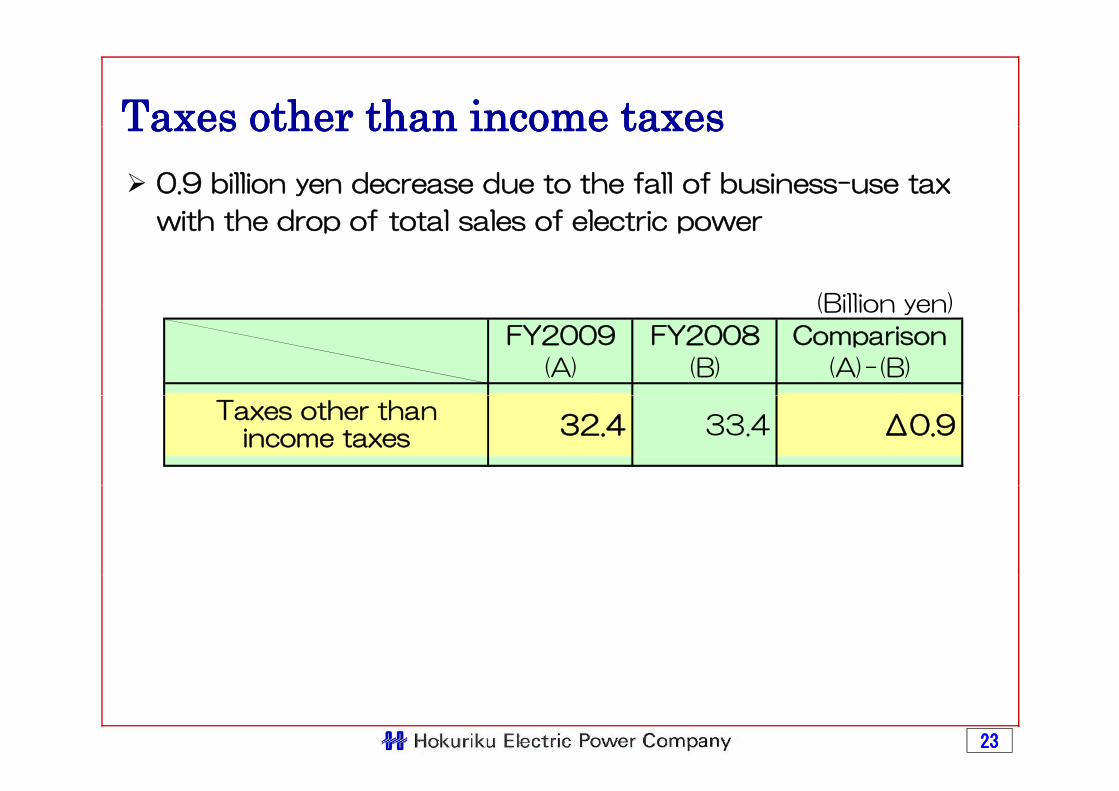
Taxes other than income taxesTaxes other than income taxes0.9 billion yen decrease due to the fall of business-use tax
ith th d f t t l l f l t i
Taxes other than income taxesTaxes other than income taxes
with the drop of total sales of electric power
(Billion yen)(Billion yen)
FY2009 FY2008 Comparison
(A) (B) (A)-(B)
32.4 33.4 Δ0.9Taxes other than
income taxes
2323
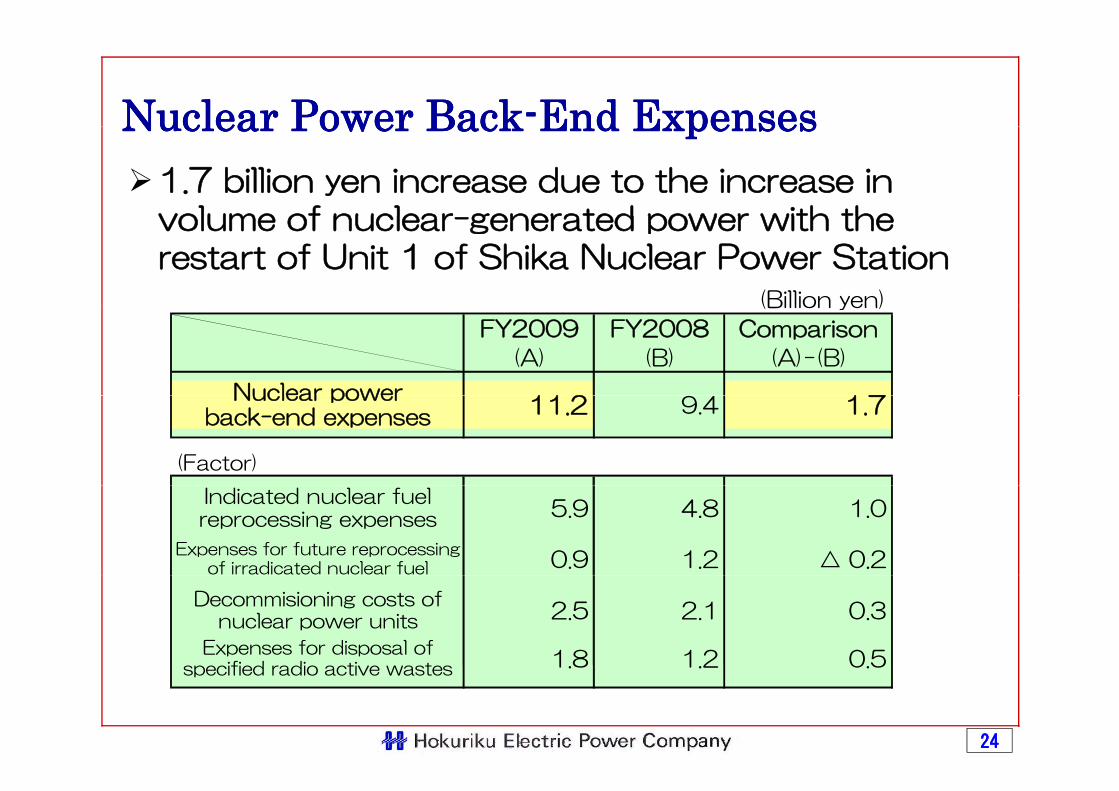
Nuclear Power BackNuclear Power Back--End ExpensesEnd Expenses1.7 billion yen increase due to the increase in volume of nuclear generated power with the
Nuclear Power BackNuclear Power Back End ExpensesEnd Expenses
volume of nuclear-generated power with the restart of Unit 1 of Shika Nuclear Power Station
(Billion yen)(Billion yen)
FY2009 FY2008 Comparison
(A) (B) (A)-(B)
11 2 1 7Nuclear power
11.2 9.4 1.7
(Factor)
Nuclear powerback-end expenses
5.9 4.8 1.0
0.9 1.2 △ 0.2Expenses for future reprocessing
of irradicated nuclear fuel
Indicated nuclear fuelreprocessing expenses
2.5 2.1 0.3
1 8 1 2 0 5Expenses for disposal of
ifi d di ti t
Decommisioning costs ofnuclear power units
2424
1.8 1.2 0.5specified radio active wastes
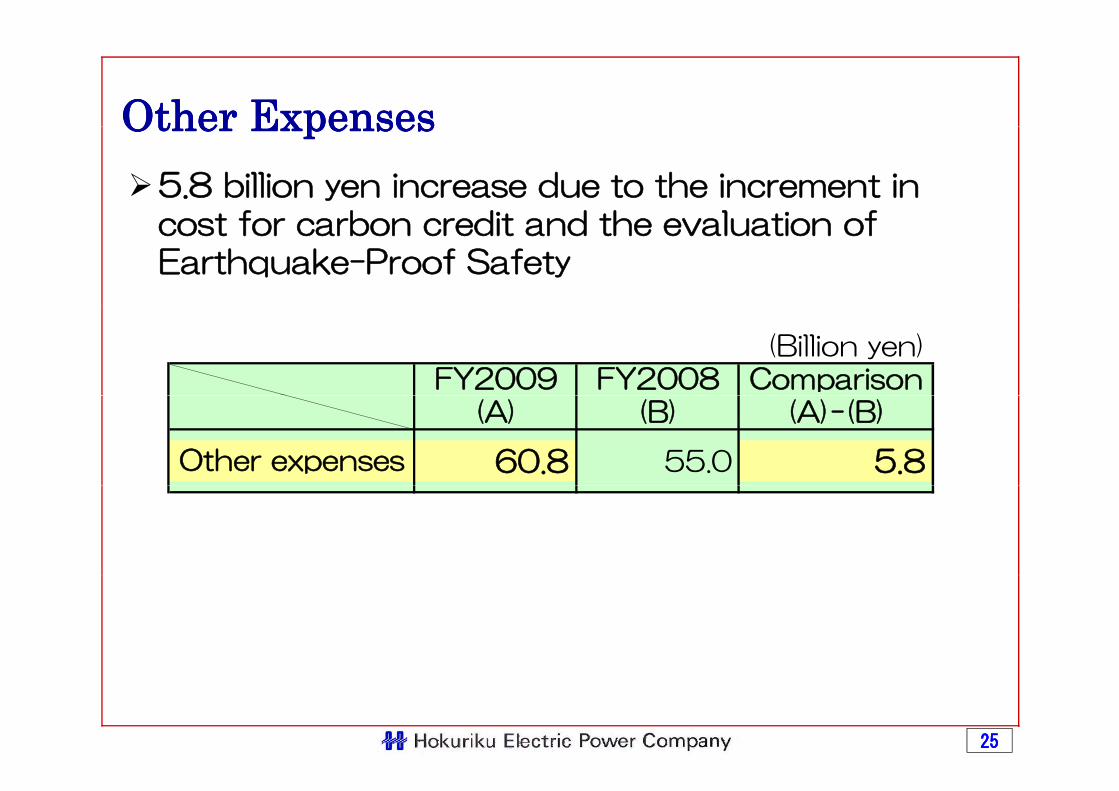
Other ExpensesOther Expenses5.8 billion yen increase due to the increment in
t f b dit d th l ti f
Other ExpensesOther Expenses
cost for carbon credit and the evaluation of Earthquake-Proof Safety
(Billion yen)FY2009 FY2008 Comparison
(A) (B) (A)-(B)
60.8 55.0 5.8Other expenses
2525
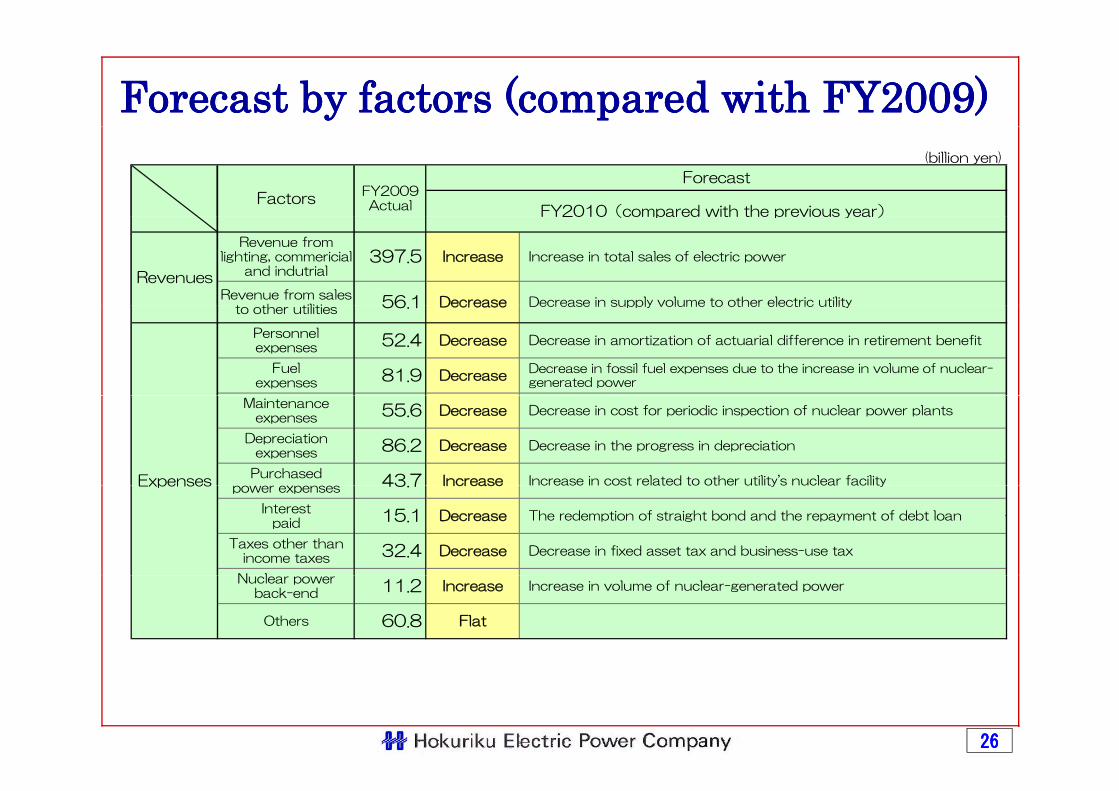
Forecast by factors (compared with FY2009) Forecast by factors (compared with FY2009) (billion yen)
Factors
ForecastFY2009Actual FY2010(compared with the previous year)
397.5
56 1
Revenues
Revenue fromlighting, commericial
and indutrialIncrease
Revenue from salest th tiliti
Decrease
Increase in total sales of electric power
FY2010(compared with the previous year)
Decrease in supply volume to other electric utility56.1
52.4
to other utilitiesDecrease
81.9
Personnelexpenses
Decrease
Fuelexpenses
Decrease in amortization of actuarial difference in retirement benefit
Decrease in fossil fuel expenses due to the increase in volume of nuclear-generated power
Decrease
Decrease in supply volume to other electric utility
86.2
43 7Expenses Increase
Maintenanceexpenses
Decrease
Purchasedx
Depreciationexpenses
Decrease in cost for periodic inspection of nuclear power plants
Decrease
55.6
Increase in cost related to other utility's nuclear facility
Decrease in the progress in depreciation
43.7Expenses
N l
Taxes other thanincome taxes
Decrease
Increasepower expenses
15.1 DecreaseInterest
paid
32.4 Decrease in fixed asset tax and business-use tax
Increase in cost related to other utility s nuclear facility
The redemption of straight bond and the repayment of debt loan
Nuclear powerback-end
Increase
Others Flat
11.2
60.8
Increase in volume of nuclear-generated power
2626
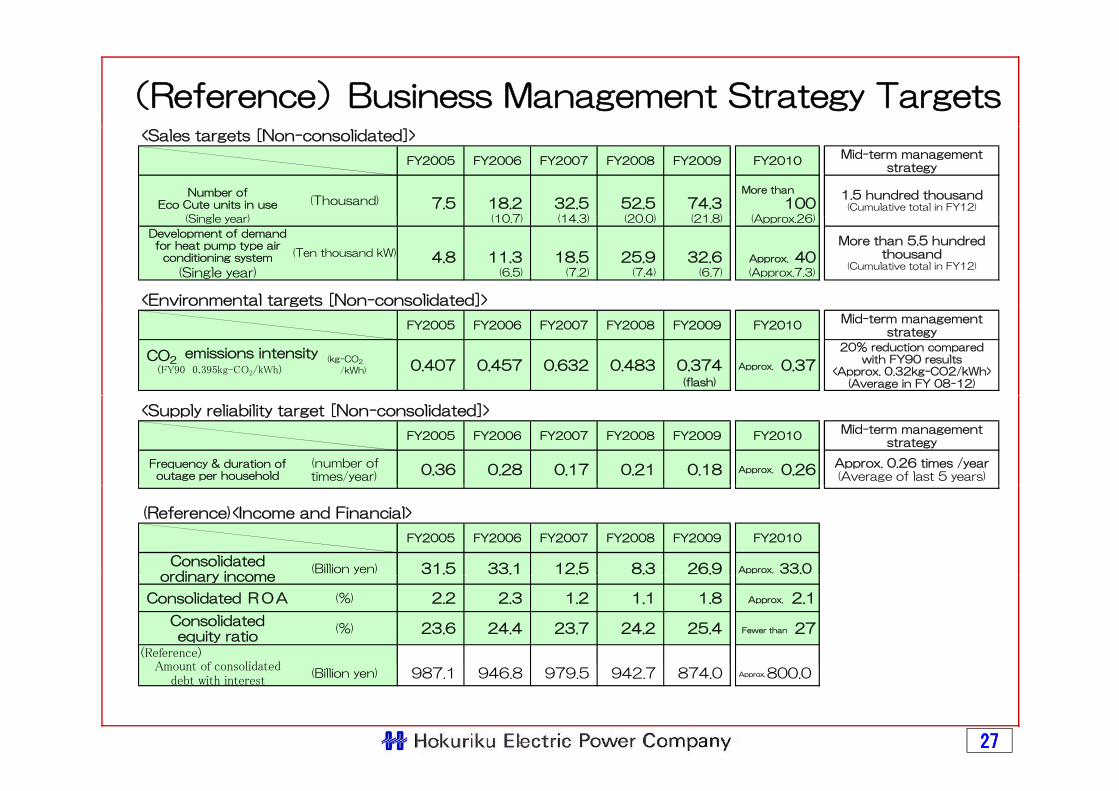
(Reference)Business Management Strategy Targets<Sales targets [Non-consolidated]>
FY2005 FY2006 FY2007 FY2008 FY2009 FY2010Mid-term management
strategy
Number ofEco Cute units in use 7.5 18.2 32.5 52.5 74.3 100
(Si l ) (10 7) (14 3) (20 0) (21 8) (A 26)
(Thousand) 1.5 hundred thousand(Cumulative total in FY12)
More than
(Single year) (10.7) (14.3) (20.0) (21.8) (Approx.26)
Development of demandfor heat pump type air
conditioning system 4.8 11.3 18.5 25.9 32.6 40(Single year) (6.5) (7.2) (7.4) (6.7) (Approx.7.3)
<Environmental targets [Non-consolidated]>
(Ten thousand kW)More than 5.5 hundred
thousand(Cumulative total in FY12)
Approx.
g [ ]
FY2005 FY2006 FY2007 FY2008 FY2009 FY2010Mid-term management
strategy
CO2 (kg-CO2
/kWh) 0.407 0.457 0.632 0.483 0.374 0.37
20% reduction comparedwith FY90 results
<Approx. 0.32kg-CO2/kWh>(Average in FY 08-12)(flash)
emissions intensity(FY90 0.395kg-CO2/kWh) Approx.
<Supply reliability target [Non-consolidated]>
FY2005 FY2006 FY2007 FY2008 FY2009 FY2010Mid-term management
strategy
Frequency & duration ofoutage per household
(number oftimes/year) 0.36 0.28 0.17 0.21 0.18 0.26
Approx. 0.26 times /year(Average of last 5 years)
Approx.
(Reference)<Income and Financial>
FY2005 FY2006 FY2007 FY2008 FY2009 FY2010
Consolidatedordinary income
(Billion yen) 31.5 33.1 12.5 8.3 26.9 33.0 Approx.ordinary income
Consolidated ROA (%) 2.2 2.3 1.2 1.1 1.8 2.1
Consolidatedequity ratio
(%) 23.6 24.4 23.7 24.2 25.4 27
(Reference)Amount of consolidated
Approx.
Fewer than
2727
Amount of consolidateddebt with interest
(Billion yen) 987.1 946.8 979.5 942.7 874.0 800.0 Approx.
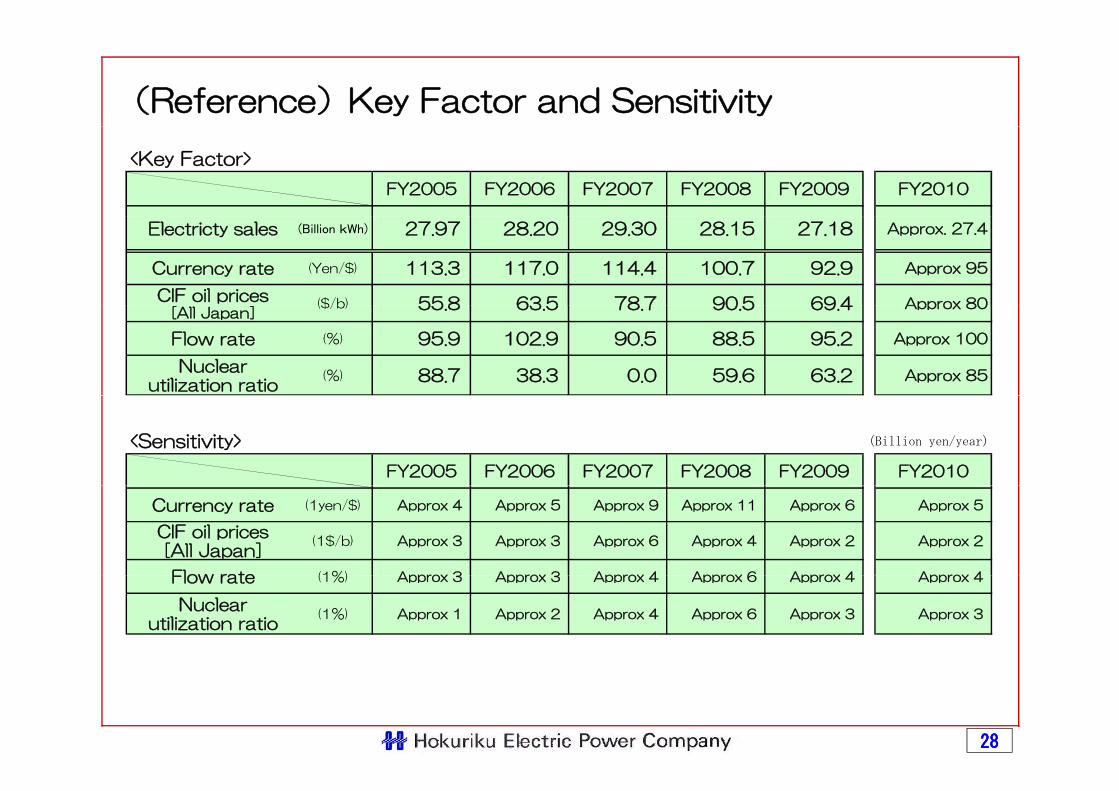
(Reference)Key Factor and Sensitivity
<Key Factor>
FY2005 FY2006 FY2007 FY2008 FY2009 FY2010
Electricty sales (Billion kWh) 27.97 28.20 29.30 28.15 27.18 Approx. 27.4
Currency rate (Yen/$) 113.3 117.0 114.4 100.7 92.9 Approx 95
CIF oil prices($/b) 55 8 63 5 78 7 90 5 69 4 Approx 80
[All Japan]($/b) 55.8 63.5 78.7 90.5 69.4 Approx 80
Flow rate (%) 95.9 102.9 90.5 88.5 95.2 Approx 100
Nuclearutilization ratio
(%) 88.7 38.3 0.0 59.6 63.2 Approx 85
<Sensitivity> (Billion yen/year)
FY2005 FY2006 FY2007 FY2008 FY2009 FY2010
Currency rate (1yen/$) Approx 4 Approx 5 Approx 9 Approx 11 Approx 6 Approx 5
CIF oil prices[All Japan]
(1$/b) Approx 3 Approx 3 Approx 6 Approx 4 Approx 2 Approx 2
Flow rate (1%) Approx 3 Approx 3 Approx 4 Approx 6 Approx 4 Approx 4Flow rate (1%) Approx 3 Approx 3 Approx 4 Approx 6 Approx 4 Approx 4
Nuclearutilization ratio
(1%) Approx 1 Approx 2 Approx 4 Approx 6 Approx 3 Approx 3
2828
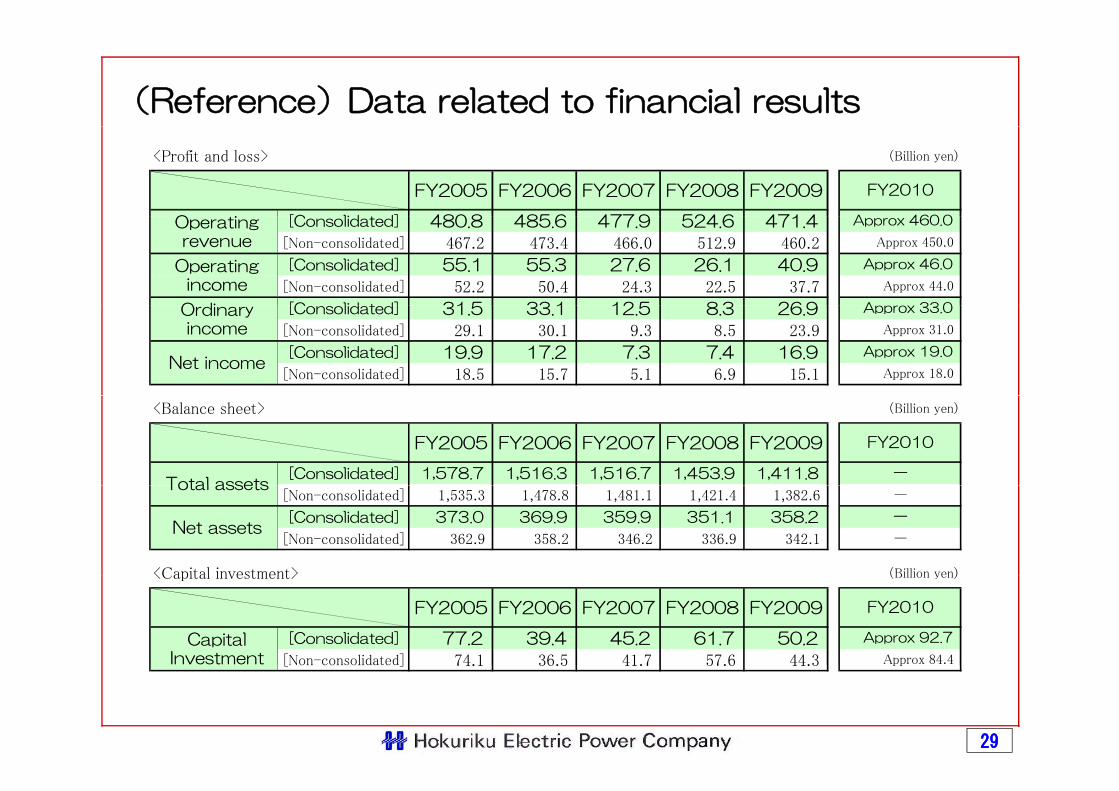
(Reference)Data related to financial results
<Profit and loss> (Billion yen)
FY2005 FY2006 FY2007 FY2008 FY2009
[C lid d] 480 8 485 6 477 9 524 6 471 4
FY2010
O i A 460 0[Consolidated] 480.8 485.6 477.9 524.6 471.4
[Non-consolidated] 467.2 473.4 466.0 512.9 460.2
[Consolidated] 55.1 55.3 27.6 26.1 40.9
[Non-consolidated] 52.2 50.4 24.3 22.5 37.7
[C lid t d] 31 5 33 1 12 5 8 3 26 9
Operatingrevenue
Operatingincome
O di
Approx 460.0
Approx 450.0
Approx 46.0
Approx 44.0
Approx 33 0[Consolidated] 31.5 33.1 12.5 8.3 26.9
[Non-consolidated] 29.1 30.1 9.3 8.5 23.9
[Consolidated] 19.9 17.2 7.3 7.4 16.9
[Non-consolidated] 18.5 15.7 5.1 6.9 15.1 Net income
Ordinaryincome
Approx 33.0
Approx 31.0
Approx 19.0
Approx 18.0
<Balance sheet> (Billion yen)
FY2005 FY2006 FY2007 FY2008 FY2009
[Consolidated] 1,578.7 1,516.3 1,516.7 1,453.9 1,411.8
FY2010
-Total assets
[Non-consolidated] 1,535.3 1,478.8 1,481.1 1,421.4 1,382.6
[Consolidated] 373.0 369.9 359.9 351.1 358.2
[Non-consolidated] 362.9 358.2 346.2 336.9 342.1
<Capital investment> (Billion yen)
-
-
-
Total assets
Net assets
<Capital investment> (Billion yen)
FY2005 FY2006 FY2007 FY2008 FY2009
[Consolidated] 77.2 39.4 45.2 61.7 50.2
[Non-consolidated] 74.1 36.5 41.7 57.6 44.3
CapitalInvestment
FY2010
Approx 92.7
Approx 84.4
2929
[Non consolidated] 74.1 36.5 41.7 57.6 44.3 pp
Contact Information for Inquiries
Finance Team Finance & Accounting Dept Hokuriku Electric Power Company
15-1 Ushijima-Cho, Toyama, 930-8686, Japan
TEL:+81-76-405-3339,3345(Direct)
FAX:+81-76-405-0127
Internet address http://www.rikuden.co.jp/
E mail address pub mast@rikuden co jpE-mail address [email protected]