Embed Size (px)
Citation preview
PTT Group NDRwith Phatra/BofAML
21 June 2017

Overview
Q1/2017 Performance
Outlook 2017
Contents
1
Overview Performance Outlook

Indigenous (20%)233 KBD
Imported Refined Petroleum Products 68 KBD
952 KBD (**)
Source: PTIT
Remark : (*)Refined product from refineries = 964 KBD, including domestic supply of LPG from GSPs and Petrochemical Plants = 110 KBD
(**) Not included Inventory
KBD = Thousand Barrels per day
Import (80%)
Crude/ Condensate866 KBD
RefinedProducts1074 KBD*
Domestic
Crude/ Condensate 197 KBD
Supply Production Sales
Export
186 KBD
Total Refining Capacity in Thailand: 1,097 KBD
PTT’s Associated Refineries : 635 KBD
(TOP, PTTGC, IRPC)
Other Refineries : 462 KBD(ESSO, BCP, SPRC)
RefinedProducts150KBD
2
Crude Export 36 KBD
934 KBD
Oil Balance Thailand: Jan - Mar 2017 Adequate refining capacity maintains the stability of supply
Overview Performance Outlook

Natural Gas Balance: Jan – Mar 2017
Gulf of Thailand (69%)
Power (58%)
Industry (15%)
NGV (6%)
Petrochemical Feedstock
(14%)
IndustryHousehold
Transportation(7%)
Ethane/ Propane/LPG/NGL
LPG/NGL
Remark: MMSCFD = Million Cubic Feet @ Heating Value 1,000 Btu/ft3
Main driver of the Thai economy
Supply Production Sales
LNG41%
Myanmar59%
1,030 MMSCFD (21%)
Methane 1,685 MMSCFD
143 MMSCFD
6 GSPsTotal Capacity
2,820 MMSCFD @ Actual Heat
Import (28%)
1,315 MMSCFD
3
PTTEP,
30%
Others,
70%
3,270 MMSCFD
Bypass Gas555
MMSCFDOnshore (3%)
Overview Performance Outlook

Largest company on Thai Stock exchange
Market cap ~US$61.1bn1 or ~ THB 2.1 trillion
Group companies: 13.6%1 of Thai Stock Exchange market
capitalization
Majority owned by Thai government (66%)
51% by Ministry of Finance
15% by Vayupak Fund
Fully integrated and highly diversified over the entire O&G
value chain
International exploration and production business with 695
mmboe of proved reserves in 2016
Sole operator and owner of gas transmission pipelines and
GSPs in Thailand
Largest refinery group in Thailand with stakes in 3 of 6
refineries in the country
Largest petrochemical producer group in Thailand with
stakes in 6 of 8 major petrochemical plants
Leading oil marketing business in Thailand with 1,530 retail
stations2 and 41%2 of market share by sales volume
International oil trading business having traded 74.6 bn
liters3 in 2016
Coal business assets in Indonesia and Madagascar
Power Flagship (GPSC) to capture opportunity in
neighboring ASEAN countries
2001 2016
Revenue
Net IncomeAffiliate
PTT
702
55%
19%
2,667
45%
81%19%
IPO
1 As of 31 Mar 2017 : Avg. BOT selling rate USD/THB of 34.61 (End rate)2 As of 31 Dec 20163 For the year 2016 4 As of 31 Dec 2016 : Annual Avg. BOT selling rate USD/THB of 35.47 (Avg. rate)
PTT Public Limited Company (“PTT”) Robust revenue and Net Income growth since IPO (MMUSD) 4
12,553
57,106
International and local recognition
Thailand best borrower award Best CEO
Best CFO
Best Managed Company
Best Corporate Governance
Best Investor Relations
Best Corporate Social
Responsibility
Best Commitment to Strong
Dividend Policy
SET Awards
Top Corporate
Governance Report
Award 2010 & 2011
Best Corporate Social
Responsibility Awards
2011 & 2012
146th Fortune Global
500 in 201693rd in 2015
84th in 2014
81st in 2013
95th in 2012
Platts Top 250 Global Energy
Company
24th Overall Global
Performance in Asia of 2014
180th in 2014144th in 2013
167th in 2012
171th in 2011
Dow Jones Sustainability
Index (DJSI)
DJSI Member 2013-2016
(Listed in 2011)
4
PTT is Thailand’s Largest Energy Company
Overview Performance Outlook
Ministry of Finance holds majority stake in PTT PTT ratings at Thai sovereign level
Thai Ministry of Finance
51%
VayupakFund1
14%
Public 36%
Kingdom of Thailand –FC
Baa1 BBB+ BBB+ A-
PTT – FC Baa1 BBB+ BBB+ A-
PTT – LC Baa1 BBB+ BBB+ A
Largest market cap on the Thai Stock Exchange
Note: As of Apr 2017
• Foreign 16%
• Thai 20%
PTT PTTEP PTTGC TOP IRPC GPSC Total Others
Market cap (BNUSD)2 31.9 10.6 9.5 4.5 3.0 1.5 61.1 386.5
% of SET 7.1% 2.4% 2.1% 1.0% 0.7% 0.3% 13.6% 86.4%
Moody’s rating Baa1 Baa1 Baa2 Baa1 Ba1 N.A. - -
S&P rating BBB+ BBB+ BBB BBB BB+ BBB- - -
PTT’s Strategic Importance to Thailand
5
1 The Vayupak Fund is a registered investment management fund in Thailand in which the Government is a major unit holder. The Government has rights of first refusal with respect to
any of our shares to be sold by the fund. Although the fund’s shareholding may be considered to be beneficially owned by the Government under international standards, such shares
are not considered to be owned by the Government for the purposes of Thai law or our compliance with certain of our debt covenants 2 As of 31 Mar 2017 : Avg. BOT selling rate USD/THB of 34.61 (End rate)
5
Overview Performance Outlook

Our Major Businesses & Activities
E&P
Gas
PTTEP 65.29% Exploration and Production
Upst
ream
Oil Marketing
Int’l Trading
Dow
nst
ream
Petrochemical
& Refining
PTTGC 48.91% Petrochemical Flagship
TOP 49.10% Refinery Flagship
IRPC 38.51% Integrated Refinery & Petrochemical
Infr
ast
ructu
re
Coal
GPSC 22.58% Power Flagship
• Oil Marketing 100% Retail service Stations and commercial Marketing
• Int’l Trading 100% Import/Export/Out-Out trading of petroleum and
petrochemical products
Inte
rmedia
te PTT PLC
• Gas Pipeline 100% Sole owner/operator of the Transmission pipeline
• S&M 100% Supply & Marketing of Natural Gas
• GSP 100% Extracting Hydrocarbon contents in NG for Petrochemical’s feedstock
6
Business Areas ActivitiesCompany PTT’s holding (%)
6
PTT Energy Resources 100% Coal Business
Power
Overview Performance Outlook

7
Vision: “Thai Premier Multinational Energy Company”
Strategic Objectives:
BIG: FT 100
Pride with Inclusiveness
People
Aspiration: Pride & Treasure of Thailand
RTI ExpresSoFinanceEnablers:
Treasure
Sustainability
2017 – 2021 PTT Group Strategic Framework
CCSRDigitization
Pride
Inclusiveness
Build Public Trust Stakeholder Management Strengthen from Inside by “SPIRIT” Social Enterprise
Enhance Business Transparency & CG
Compliance Unit & Internal control
Ensure Country Energy Security
Public/Community Wealth with Environment Conservation
CVC
Overview Performance Outlook

Margin
FX & Derivatives
OPEX* Depre & Amortiza-
tion
Other Income
Int. & CIT exp.& Other**
19,092
3,303 5,171
6,322
1,092
10,297
11,967
22,8933,671
8,020
6,299
12,369
1,732
2,886-
Q1/16 Q1’17
PTTEP
PTT
Others Affi.
P&R
TradingImproved domestic condensate margin
OilBetter Aviation fuel & gasoline marginNon-oil expansions (Amazon & 7-11)
Gas
GSP margin improved from lower feed cost & higher petchem pricesIndustrial margin rose from higher FO price Increased sales volume from GSP with no major T/A in Q1/17
PTTEPImproved ASP from oil price recoveryLower unit costReduced sales volume
Q1/2017 Performance: Record High Quarterly NI
8* including petroleum exploration expenses and royalties** including profit from discontinued operation
23,669
MMTHB
46,168
Net Income
Petrochem & Refining
Better Olefins due to both prices and vol.Aromatics improved from BZ and PX spreads, despite decreased sales volume Increase in MKT GRM and higher stock gains
Overview Performance Outlook
91%
118%
67%
96%
PTTNGD : higher FO price & lower feed cost PTTER : Improved coal performance from higher ASP
Others Affi

9
ContentsOverview Performance Outlook
Overview
Q1/2017 Performance
Outlook 2017

41
-139
138116
123
211718
(1,572)
32.04
46.8052.79
35.08
35.6538.00
Q1/16 Q4/16 Q1/17
E&P : Solid performance from recovery in sales price and lower unit cost
Product Prices
Net Income (100%)
Sales Volume
Key Highlights
Liquid ($/BBL)
Gas($/MMBTU)
Weighted Avg.
($/BOE)
MMUSD
226 222 211
104 94 93
Q1/16 Q4/16 Q1/17
Liquid
Gas
KBOED
10
330
349
157(16)
*** Includes Deferred tax from Functional currency, Current Tax from FX Revaluation, Gain/loss from Financial instruments, Gain/(loss)on FX, H1 incident Insurance Claim, and etc.
Non-recurring***
Recurring NI
316 304
>100% YoY
Q1/16 Q4/16 Q1/17
E & P Gas Oil & Trading P&R Others
8% YoY
Overview Performance Outlook
13% QoQ
65% YoY
6.09
5.15 5.24
2% QoQ
14% YoY
7% QoQ
8% YoY
4% QoQ
>100% QoQ QoQ
• ASP increased from higher oil price
• Sales volume drop from planned S/D in Myanmar & lower production from MTJDA project (buyer technical problem)
• NI rose from lower expenses as no impairment & tax saving from Baht appreciation
YoY
• ASP increased from the rise in oil price
• Sales vol. decreased from PTTEP Australasia & MTJDA
• NI improved from the decrease in depre, oil price hedging gain and tax benefit (Baht appreciation)
11
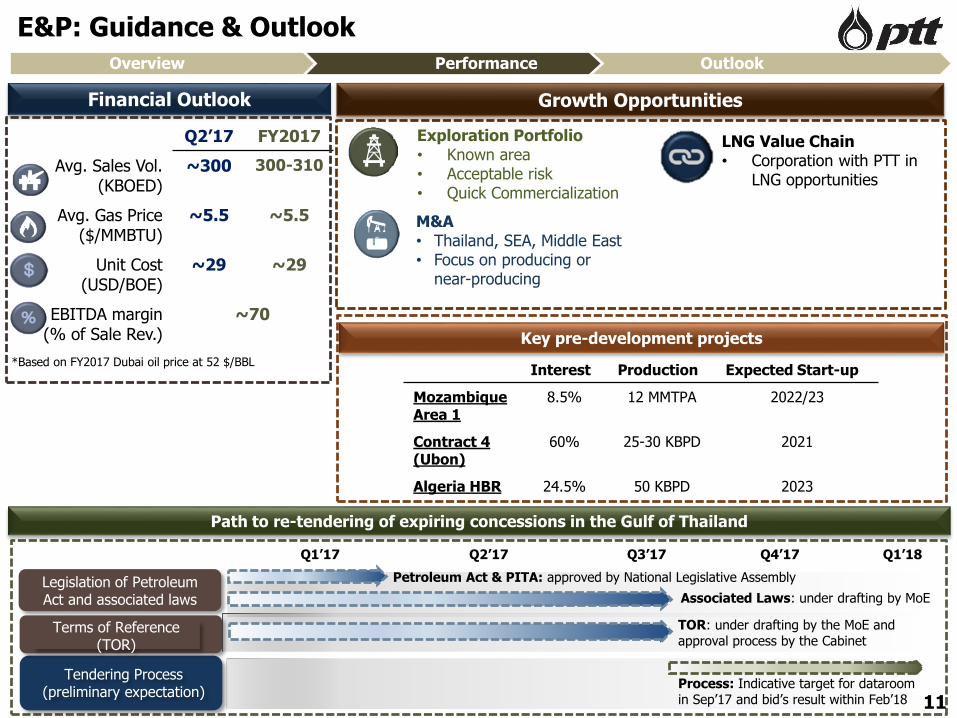
E&P: Guidance & Outlook
Overview Performance Outlook
Financial Outlook
11
Path to re-tendering of expiring concessions in the Gulf of Thailand
Legislation of Petroleum Act and associated laws
Tendering Process (preliminary expectation)
Terms of Reference (TOR)
Process: Indicative target for dataroomin Sep’17 and bid’s result within Feb’18
TOR: under drafting by the MoE and approval process by the Cabinet
Associated Laws: under drafting by MoE
Petroleum Act & PITA: approved by National Legislative Assembly
Exploration Portfolio• Known area• Acceptable risk• Quick Commercialization
Interest Production Expected Start-up
Mozambique Area 1
8.5% 12 MMTPA 2022/23
Contract 4 (Ubon)
60% 25-30 KBPD 2021
Algeria HBR 24.5% 50 KBPD 2023
Growth Opportunities
Q2’17 FY2017
Avg. Sales Vol. (KBOED)
~300 300-310
Avg. Gas Price ($/MMBTU)
~5.5 ~5.5
Unit Cost(USD/BOE)
~29 ~29
EBITDA margin (% of Sale Rev.)
~70
*Based on FY2017 Dubai oil price at 52 $/BBL
M&A• Thailand, SEA, Middle East• Focus on producing or
near-producing
LNG Value Chain• Corporation with PTT in
LNG opportunities
Key pre-development projects
11
Q1’17 Q2’17 Q3’17 Q4’17 Q1’18

12
Overview Performance Outlook
PTT EBITDA Breakdown by BU’s:
Business Unit Q1/16 Q4/16 Q1/17 QoQ YoY
Gas- EBITDA 14,562 20,472 22,490 10% 54%
• S&M 1,365 2,277 3,602 58% 164%
• TM 8,431 7,717 8,737 13% 4%
• GSP 3,497 8,301 7,698 (7%) 120%
• NGV (937) (935) (1,009) (8%) (8%)
• Others 2,206 3,112 3,462 11% 57%
Oil- EBITDA 5,687 4,243 5,931 40% 4%
Trading*- EBITDA 1,548 348 1,135 226% (27%)
Total** 21,797 25,063 29,556 18% 36%
(Unit:MMTHB)
*MIS** Included subsidiaries from all BUs 12

4,721
1,075 873 842
894912 912
808 905 973
884 1,017 1,009
694 714 707294 281 278
Q1/16 Q4/16 Q1/17
8.5 7.9
7.3 6.6
6.2 5.8 5.6 5.4 5.5
318
607
265
217
160
219
247
296318
0
100
200
300
400
5
7
9
11
13
15
Q1/15 Q2/15 Q3/15 Q4/15 Q1/16 Q2/16 Q3/16 Q4/16 Q1/17
%QoQ %YoY
FO 7% 98%PooledPrice 2% 12%
12.611.6 11.9
8.18 7.30 7.09
Q1/16 Q4/16 Q1/17
Gas BU: Pooled gas cost started to rise, and NG volume increased from GSP
NG Price VS FO NG Customer Breakdown
$/MMBTU
EGAT (18%)
IPP (19%)
SPP (21%)
GSP (21%)
Industry (15%)
NGV (6%)
MMSCFD
4,702
NGV Price/Sales Volume
QoQ
• Gas cost started to pick up, while F/O price continued rising
• NG sales volume maintained low in Q1 from cold weather
• Drop in NGV volume with persistent low demand, and NGV prices increased following pooled price
YoY
• Overall NG sales slightly increased mainly from GSP with no major T/A this year offsetting with lower power demand
• NGV volume decreased, as a result of lower demand from switching to gasoline
Key Highlights
ที่เพ่ิมข้ึนเป็นของ
K.Ton/Day
13
13% YoY
E & P Gas Oil & Trading P&R Others
4,649$/Ton
Fuel Oil*
* MOPS HSFO 180 CST
Avg. Pooled gas price LHS
RHS
2% YoY
•
THB/KG
NGV Avg. price
3% QoQ5% YoY
0.4% QoQ
3% QoQ
Overview Performance Outlook
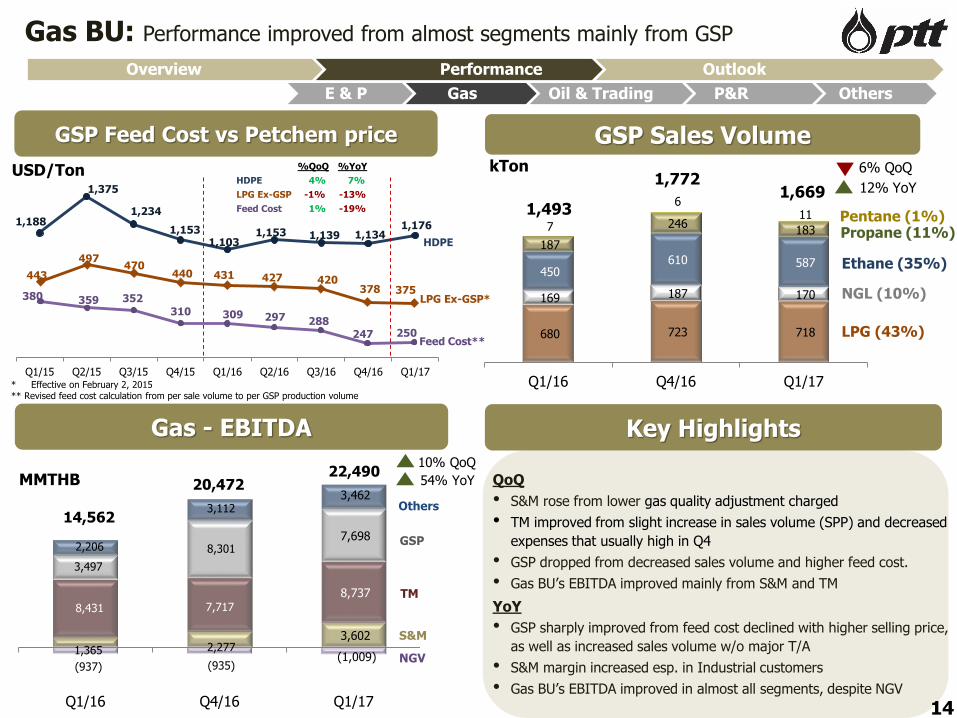
1,188
1,375
1,234
1,153 1,103
1,153 1,139 1,134 1,176
Q1/15 Q2/15 Q3/15 Q4/15 Q1/16 Q2/16 Q3/16 Q4/16 Q1/17
443
497 470
440 431 427 420 378 375
380 359 352
310 309 297 288247 250
1,365 2,277 3,602
8,431 7,717
8,737
3,497
8,301 7,698
(937) (935)(1,009)
2,206
3,112 3,462
Q1/16 Q4/16 Q1/17
Propane (11%)
Gas - EBITDA
MMTHB
Others
TM
GSP
22,49020,472
S&M
NGV
680 723 718
169 187 170
450 610 587
187
246 183 7
6 11
Q1/16 Q4/16 Q1/17
GSP Sales Volume
LPG (43%)
kTon1,772
6% QoQ
12% YoY
Gas BU: Performance improved from almost segments mainly from GSP
NGL (10%)
Ethane (35%)
Key Highlights
GSP Feed Cost vs Petchem price
USD/Ton
Feed Cost**
LPG Ex-GSP*
* Effective on February 2, 2015** Revised feed cost calculation from per sale volume to per GSP production volume
Pentane (1%)1,493
14,562
14
HDPE
54% YoY QoQ
• S&M rose from lower gas quality adjustment charged
• TM improved from slight increase in sales volume (SPP) and decreased
expenses that usually high in Q4
• GSP dropped from decreased sales volume and higher feed cost.
• Gas BU’s EBITDA improved mainly from S&M and TM
YoY
• GSP sharply improved from feed cost declined with higher selling price,
as well as increased sales volume w/o major T/A
• S&M margin increased esp. in Industrial customers
• Gas BU’s EBITDA improved in almost all segments, despite NGV
10% QoQ
1,669
E & P Gas Oil & Trading P&R Others
Overview Performance Outlook
%QoQ %YoY
HDPE 4% 7%
LPG Ex-GSP -1% -13%
Feed Cost 1% -19%

15
Gas Business Roadmap
LNG ProjectsNG Country Demand
E & P Gas Oil & Trading P&R Others
Overview Performance Outlook
15
LNG Terminal 1 Phase 2 :
- Construction completed 99.73%
- COD : 2H2017
New LNG projects :
1) LNG Terminal 1 phase 2 Extension :
(Capacities expansion from 10 MTA to 11.5 MTA)
- Approved by Cabinet 12 Jul 2016
- Expansion capacity: 1.5 MTA
- Construction completed 30.93%
- COD : 2019
2) LNG Terminal 2 (Onshore LNG Terminal No.2)
- Approved by National Energy Policy Council
(NEPC) 8 Dec 2016
- Capacity: 7.5 MTA
- COD : 2022
Additional LNG projects needed for further
studies before submitting for CEPA and
NEPC to consider
− Myanmar-Thailand LNG Terminal
− FSRUs (domestic)
− Onshore LNG Terminal 3
New Project
LNG Ph#2
MajorProject
COD
LNGCapacity
(MTA)
10 10
• Offshore Comp.
• 4th
onshore Midline Comp.
7
• Comp Wangnoi
• Nakhon Ratchasima
LNG Ph#2(Early Sent
Out)
11.5 11.5
LNG Terminal#1 - Extension
11.5
• 5th
Pipeline
Gas Facilities Expansion

20.00
30.00
40.00
50.00
60.00
70.00
80.00
Q1/16 Q2/16 Q3/16 Q4/16 Jan-17 Feb-17 Mar-17
0.87 0.71
1.06
6,677 6,608 6,740
Q1/16 Q4/16 Q1/17
786 751 914
4,901 3,492
5,017
Q1/16 Q4/16 Q1/17
QoQ YoY
Oil 44% 2%
Non-oil 22% 16%
Oil BU : Better overall performance mainly from aviation fuel
MMTHB
THB/Liter
16
Oil
Non-Oil*
Gross margin1/Sales volume2
MM Liter
1/Excluded Non-oil, stock gain/loss, non-recurring item 2/PTT only
22% YoY
0.9% YoY
687 1,382 -183
Petroleum Prices
Stock Gain/Loss(MMTHB)
49% QoQ
2% QoQ
Oil - EBITDA
USD/BBL
(Average Prices)
Key Highlights
QoQ
• Higher gross margin/EBITDA mainly from aviation fuel (JET A-1 pricing structure: Buy M, sell M-1) following declining price trend in Q1/17 vs upward trend in Q4/16
YoY• Higher gross margin mainly from aviation fuel as
aforementioned
• Higher EBITDA mainly from
- higher aviation fuel margin
- non-oil expansions (Amazon & 7-11)
- higher gasoline margin
4,243
5,687 5,931
Overview Performance Outlook
E & P Gas Oil & Trading P&R Others
* Domestic only

18,480
19,375 18,888
Q1/16 Q4/16 Q1/17
QoQ
• Gross margin and EBITDA increased mainly from higher domestic condensate margin following lower discount and higher oil price
• Sales volume declined mainly from lower crude supplied to domestic refinery from IRPC turnaround in Feb'17
YoY
• Gross margin improved mainly from higher domestic condensate margin following higher oil price
• EBITDA declined mainly from reversal of MTM inventory gain of PTTT despite better condensate margin
0.08
0.05
0.14
Q1/16 Q4/16 Q1/17
*FX Adjusted
1,548
348
1,135
Q1/16 Q4/16 Q1/17
Trading BU: Gross margin improved from better domestic condensate margin
Gross Margin*
Trading - EBITDA*
Sales Volume
Key Highlights
MMTHB
MM Liter
17
* PTT only : FX Adjusted
27% YoY
Gross Margin (THB/Liter)
2% YoY
>100% QoQ
75% YoY
>100% QoQ 3% QoQ
Overview Performance Outlook
E & P Gas Oil & Trading P&R Others

Trading BU & PTTT: Key Achievement Q1/2017
Overview Performance Outlook
E & P Gas Oil & Trading P&R Others
► 8 shipments of crude oil trading with volume 4,090
KBBL
1st Commercialized Deal of LDN Office
Arthit Condensate Term Contract Renewal
Securing Crude Oil Term Contract For Country security
► Crude type : Seria Light
Export Blend and
Champion Export
► Term period 1 Year
contract (2017)
► Successfully secured Arthit condensate term contract with PTTEP for supplying to domestic refineries
Expand Coal trade opportunity in new region
► Continuously buying coal spot cargo from South Africa during Q1-Q2’17
► 1st time manage NGL pricing exposure for GSP by using paper swap during Apr-May’17
Expand hedging service to GSP
18

5.12 5.60 5.55
3.71
6.97 5.95
7.11
10.04 9.90
Q1/16 Q4/16 Q1/17
QoQ YoY
A/C GIM 1% 39%
4,726 5,802 7,075
3,014 1,694 2,365
4,707 9,745
13,182
649
1,072
977
240
63
1,314 -
Q1/16** Q4/16 Q1/17
QoQ YoY
36% 87%
272 288
458 415
358
420
Q1/16 Q4/16 Q1/17
87% 82%78%
19
Net Income (100%)
P&R BU : Improved P&R from higher product prices and margins
13,33618,376
IRPC
TOP
Unit : MMTHB
19
24,913
Aromatics
BZ-Cond
PX-Cond
USD/Ton
E & P Gas Oil & Trading P&R Others
Overview Performance Outlook
PTTGC
HMC
Others
BTXU-Rate
30.448.3 53.1
GRM/GIM
USD/BBL
A/C GRM*
A/C GIM*
Mkt GRM
Dubai
-1.02 2.62 0.60StockGain/Loss
*A/C GRM and A/C GIM include effect from hedging gain/(loss)
1,103 1,134 1,176
930 1,085
1,159
Q1/16 Q4/16 Q1/17
Olefins
Olefins U-Rate
81%100% 95%
USD/Ton
HDPEPrice
PPPrice
QoQ YoY
BZ 59% 68%
PX 17% 1%
QoQ YoY
HDPE 4% 7%
PP 7% 25%

P&R : Upcoming Projects
20
E & P Gas Oil & Trading P&R Others
Overview Performance Outlook
2017 2018 2019 2020
HDI Derivatives Thailand
Assets Injection
Gasoline Maximization UHV Catalyst Cooler
PP Expansion & PP Compounding
mLLDPE
ME plants2)
PO/Polyols
MTP Retrofit
HDI Thailand
AssetsInjection
PP Expansion and
PP Compounding
Gasoline Maximization
mLLDPEME
plants2
UHV CatalystCooler
PO/Polyols
MTP Retrofit
CFP
CapacityHDI
Derivatives(12 KTA)
HMC (PP 750 KTA)
PTTAC(AN 200 KTA,MMA 70 KTA,
AMS 160 KTA)
PTTMCC (PBS 20 KTA)
PPE +160 KTAPPC +140 KTA
To capture domestic market
gasoline deficit
mLLDPE(400 KTA)
Hexane -1 (34 KTA)
Methyl Ester
(200 KTA)
Flexibility of crude
selection and fully
optimizedUHV
operation
PO (200 KTA)
Polyols (130 KTA)
Ethylene (500 KTA)
Propylene (250 KTA)
upgrade lower value product
into higher value product and ability to
process heavier (cheaper) crude
oil
CAPEX 44 MUSD 766 MUSD 236 MUSD 1,100 MB 288 MUSD 47 MUSD 1,390 MB TBA TBA TBA
2021
CFP
PTTGCIRPC
TOP

1 11
(5)
45
5468
37
34
51
51
95
82
Q1/16 Q4/16 Q1/17
Other Businesses : Coal - SAR Better performance from higher market coal price despite higher cash cost
Net income
Sales Volume
Key Highlights
MMUSD
USD/Ton
1,446 2,233
1,752
617
527
71
2,760
1,823
Q1/16 Q4/16 Q1/17
kTon
Jembayan
SebukuAvg. Selling Price
Total Cash Costs
34% QoQ
Avg. Selling Price* & Cash cost*
New Castle
12% YoY
>100% YoY
14%
50%
51%
61%
38%
QoQ YoY
QoQ
• Selling price increased following contracts fixed since Q4/16
• Cash cost increased due to reduction in contractor discount regarding higher coal price
• Sales volume declined mainly from temporarily stopped production in Sebuku as a result of mud slide
• Performance improved mainly from
- Unrealized gain from mark-to-market price contract and Gasoil
hedging vs loss in Q4/16
- No impairment
YoY
• Cash cost increased due to reduction in contractor discount as aforementioned
• Sales volume declined mainly mud slide in Sebuku as mentioned above
• Performance improved mainly from higher market coal price
*Calorific value ~ 5,500 kcal/ton
Overview Performance Outlook
26%
>100% QoQ
E & P Gas Oil & Trading P&R Others
Q1/16 Q4/16 Q1/17
Impairment
Operating NI
NI 1961
2,063
19
21

1,178
717
1,4031,320 1,467
1,301
Q1/16 Q4/16 Q1/17
Combine Cycle : IPP
65.9%
Cogen : SPP
31.1%
Renewable2.7%
Combined heat : VSPP
0.4%Hydro
Electricity64%
Cogen: SPP 32%
Renewable4%
871
419
750
Q1/16 Q4/16 Q1/17
Net Income (100%)Sales Volume (Comp. only)
Key Highlights
MMBahtGWh
Other Businesses : Power - GPSC Performance declined from lower dividend received
‘000 Ton
Committed Capacity
PowerSteam
22
Operating1,381 MW
Underconstruction
541 MW
14% YoY
79% QoQ
Present 2019
E & P Gas Oil & Trading P&R Others
QoQ YoYPower 95% 19%Steam 11% 1%
Overview Performance Outlook
QoQ
• Higher power sales vol. due to higher dispatch vol. to EGAT but lower steam sales vol. from Rayong Plant as major customers had planned maintenance.
• Better NI mainly due to the continuously efficient cost management of Rayong Plant and dividend income from RPCL 120 MB in Q1’17.
YoY
• Higher power sales vol. from higher dispatch to EGAT but lower steam vol. from Rayong Plant due to maintenance shutdown of industrial customers.
• Lower NI as lower dividend received from RPCL and major customer of IRPC-CP phase 1 has planned shutdown.

Other Businesses : Power – GPSC
Overview Performance Outlook
E & P Gas Oil & Trading P&R Others
Project Type Capacity COD Construction Progress
as of Q1/17
Bangpa-In Cogeneration Company Limited (BIC) Phase 2(SPP)
Gas-Fired Power Plant
• Electricity: 117 MW• Steam: 20 T/h
Jun’17 86%
IRPC-CP Phase 2 (SPP) Gas-Fired
Power Plant • Electricity: 240 MW• Steam: 180-300 T/H
Q4’17 95%
Ichinoseki Solar Power 1GK (ISP1) Solar • Electricity: 20.8 MW Q4’17 37%
Project Highlight: 3 Projects to COD in 2017
23

17%
50%
27%
6%
23,66919,087
46,168
23,66924,544
46,168
Q1/16 Q4/16 Q1/17
30.44
48.3153.12
PTT Consolidated Performance: Q1/2017
Avg. Dubai (USD/BBL) Q1/17Q1/16
386,644
476,857 509,797
Q1/16 Q4/16 Q1/17
PTT
P&R
Others
PTTEP
Net Income
Unit : MMTHB
EBITDA
Net Income/Operating Performance
RevenueRevenue
EBITDA
71,26183,469
89,261
Q1/16 Q4/16 Q1/17
24
32% YoY
31%
25%6%
36%
2%
EBITDA
P&R
PTT - Gas
Others
PTTEP
PTT - Oil
& Trading
Net Income
Overview Performance Outlook
7% QoQ
25% YoY
10% QoQ
YoY95%95%
5%
15%
50%
29%
1%
Revenue
PTT - Oil
& Trading
PTT - Gas
OthersPTTEP
P&R
QoQ>100%88%
7% QoQ
75% YoY
6%
20%
44%
29%
1%
40%
20%
9%
30%
1%
15%
51%
27%
7%

0.19 0.15
0.71
0.57
0.00
0.20
0.40
0.60
0.80
1.00
1.20
1.40
(0.1)
0.1
0.3
0.5
0.7
0.9
YE16 Q1/17
PTT Ratings at Sovereign Level
− FC : Moody’s (Baa1), S&P (BBB+),
JCR (A-), FITCH (BBB+)
− LC : Moody’s (Baa1), S&P (BBB+),
JCR (A), FITCH (BBB+)
MMTHB
Statement of Financial Position
25
Overview Performance Outlook
Assets/Liabilities slightly decreased :
• Decreased in PPE due to depreciation expenses in
the period
• Increased in cash and cash equivalent and S/T
investment from cash from operation following the
efficiency improvement policy of each company
group.
AP & Other Liabilities
PPE
Others Non-
currentAssets
AR & OtherCurrentAssets L/T
Liabilities(incl. due within 1 yr)
TotalEquity
MMTHB
Cash & S/T Invest
31 Dec 13 30 Sep 14
1,805,041 1,818,746
1,116,170 1,101,962
374,577 371,162
349,204 352,194
392,380 404,646
1,171,597 1,213,369
583,323 559,264
477,411 457,331
1 2 3 4 5
0.1%
2,232,331 2,229,964
31 Mar 1731 Dec 16
Net Debt/EBITDA ≤ 2.0
Net Debt/Equity ≤ 1.0

Infrastructure, 43%
Gas, 4%Oil & Trading, 12%
Other Wholly
Owned Sub. , 4%
Capital Restructuring,
22%
LNG, 14%
Others, 1%
2017 2017(revised)
2018 2019 2020 2021
4,566 3,792 3,887 2,382 2,066 2,304 10,376 9,350 9,036 7,265 7,785 6,736
867 6,410 510
556 597 620
47,215 57,635
51,975
14,313 13,944 7,551
20,637
16,812 36,874
35,970
9,935 40,882
Infrastructure
Investment in whollyowned subsidiaries
Head Office andOthers
Oil and InternationalTrading
Natural Gas
PTT: CAPEX (PTT and Wholly Owned Subsidiaries) PTT plans to invest ~Bt 339bn ($8bn) during 2017-2021
By Business Unit
Investment in
Wholly Owned
Subsidiaries
40%
102,282
34,327
58,093
83,661
60,486
* 2017 budget revision approved by BOD on 16 Jun 17
5th pipeline & extension
JV & Investment in 100% owned subsidiaries
Unit: MMTHB
PTT 5-Years CAPEX Plan ̴Bt 339 bn
Overview Performance Outlook
26
CAPEX revision Y2017:
• CAPEX increased by ~ THB 10.3 bn mainly from
Head Office: LNG value chain opportunistic investment
Wholly owned subsidiaries: Land purchase for LNG Terminal 2
93,999*

7.71 8.75
13.43
22.40
30.5734.14 34.82
18.3321.06
29.58
37.24 36.58
32.52
20.34
6.73
32.68
2.50 2.85 4.006.75
9.25 10.50 11.508.00 8.50
10.2513.00 13.00 13.00
11.0010.00
16.00
25% 25%
32.4% 32.6% 29.8% 30.1% 30.3% 30.8% 33.0% 43.6% 40.4% 34.7% 34.9% 35.5% 40.0% 54.1%148.6%
49.0%
2001 2002 2003 2004 2005 2006 2007 2008 2009 2010 2011 2012 2013 2014 2015 2016
PTT’s minimum payout ratio
Baht / share
EPS
DPS
Dividend payout
27
Dividend Policy & Historical PaymentsPTT is firmly committed to pay dividend at no less than 25% of net income
Overview Performance Outlook

28
Contents
Overview
Q1/2017 Performance
Outlook 2017
Overview Performance Outlook

Summary: Outlook 2017
Business Q1 2017 2017 (Forecast)
Reason
Gas Price ($/mmbtu)- Henry Hub- JKM
3.067.02
Range 3.2 – 3.86.3 – 7.0
• Increase in US LNG export capacity & domestic consumption (coal-to-gas switching)
• JKM abnormal high from unplanned supply disruptions in Q1 (Australia, Brunei, Algeria)
Oil Price ($/bbl)Dubai Price 53
Range50-55
• Saudi & Russia agreed to extend production cut through to Q1 2018
• A price-response of U.S. shale oil producers in ramping up output
Refinery Margin ($/bbl)Singapore GRM 6.4
Range6.3-7.0
• Higher regional refineries T/A (mostly postponed from last year) lower supply
• Huge drop of 40% in China’s oil product export quota lower supply
• FO: Higher bunker demand due to economic recovery
Petrochemical ($/ton) - Olefins (HDPE, PP)
- Aromatics (PX, BZ)
HDPE-Naphtha =677
PP –Naphtha = 640
PX-Naphtha = 391BZ-Naphtha = 423
HDPE-Naphtha = 660-670PP –Naphtha = 610-620
PX-Naphtha = 375-385BZ-Naphtha = 325-335
Olefin• New PE capacity from US & Saudi• New PP capacity mainly from China
Aromatics• PX Additional capacity from India & Saudi (2H/2017)
• BZ as Q1 spread was higher than normal due to China supply tightness and high Styrene Monomer (SM) price.
Overview Performance Outlook
29

Thank youPTT Public Company Limited – Investor Relations Department
Tel. +66 2 537-3518, Fax. +66 2 537-3948, E-mail: [email protected] Website: http://www.pttplc.com
Disclaimer
The information contained in our presentation is intended solely for your personal reference only. Please do not circulate this material. If you are not an intended recipient,
you must not read, disclose, copy, retain, distribute or take any action in reliance upon it. In addition, such information contains projections and forward-looking statements
that reflect our current views with respect to future events, financial performance and result of PTT’s activities. These views are based on assumptions subject to various
risks and uncertainties. No assurance is given that future events will occur, that projections will be achieved, or that our assumptions are correct. Actual results may differ
materially from those projected.
The information contained in this presentation is subject to change without notice and PTT does not undertake any duty to update the forward-looking statements, and the
estimates and assumptions associated with them, except to the extent required by applicable laws and regulations.
30
30

31
Debt Profile : Control Cost & Manage RiskManaged debt according to financial risk and policy
ConsolidatedPTT OnlyUnit : MMTHB
: Cost of debts ~ 4.73%: % fixed-rate ~ 71%: Avg. debt life ~ 8.29 years
: Cost of debts ~ 4.5%: % fixed-rate ~ 68%: Avg. debt life ~ 7.06 years
184,091147,592 144,408
368,733325,524 313,232
81,15481,245 76,043
256,588
250,968239,595
265,245228,837 220,451
625,321576,492
552,827
31 Dec 15 31 Dec 16 31 Mar 17 31 Dec 15 31 Dec 16 31 Mar 17
USD&Other
THB
(31%)
(69%)
(34%)
(66%)
(41%)
(59%)
(43%)
(57%)
Note : Data as of 31 Mar 17 (THB/USD = 34.6114 THB/JPY = 0.31127) Excluding liabilities from finance leases; Cost of debts includes withholding tax.
Cost of debts, % fixed rate, and avg. debt life took into account the derivative transactions. Debt outstanding is reconciled with accounting.
(36%)
(64%)
(44%)
(56%)
Debt Portfolio
31

Free Cash flow
13,992 6,027
InvestingQ1/2016(62,819)
Q1/2017(55,858)
CAPEX (PP&E, Intangible asset) (32,540) (26,209)
Investment (Sub.& Affiliates & Others) (245) (5,657)
Current investment (29,481) (30,198)
Dividend/Interest Received 1,217 6,226
Others (1,770) (20)
OperatingQ1/2016
76,811Q1/2017
61,885
Net Income 23,669 46,168
Changes in assets & liabilities 8,576 (28,335)
Income Tax (2,549) (1,633)
Non-Cash Adjustment 47,115 45,685
Ending Cash & Cash Equivalents
249,833 197,635
Ending cash incl. S/T investment
386,061 404,646
Beginning Cash and Cash Equivalents
239,978 215,566
Cash In/(Out)
9,855 (17,931)
Adjustment
3,871 (4,174)
Financing (8,008) (19,784)
Repayment Loans (8,597) (14,825)
Interest paid (7,074) (6,889)
Received from loans/Bonds 7,993 1,853
Others (330) 77
Statements of Consolidated Cash Flows : Q1/2017
32
Overview Performance Outlook

Statements of Cash Flows (PTT Only) : Q1/2017
33
OperatingQ1/2016 Q1/2017
21,480 7,868
Net Income 18,282 31,572
Changes in assets & liabilities 3,443 (17,564)
Income Tax (382) (320)
Non-Cash Adjustment 137 (5,820)
InvestingQ1/2016 Q1/2017
(29,743) 2,801
CAPEX (PP&E, Intangible asset) (5,584) (5,288)
Investment (Sub.& Affiliates & Others) (39) (4,287)
Current investment (21,241) 13,071
Dividend/Interest Received 548 5,212
Others (3,427) (5,907)
Free Cash Flow
(8,263) 10,669
Financing (4,047) (5,868)
Repayment Loans (1,643) (6,148)
Interest paid (2,739) (2,299)
Received from loans/Bonds
335 2,579
Adjustment
13 (118)
Beginning Cash and Cash Equivalents
67,524 62,648
Cash In/(Out)
(12,297) 4,683
Ending Cash & Cash Equivalents
55,227 67,331
Ending cash incl. S/T investment
111,377 112,637
Overview Performance Outlook

3434
PTT Group Performance : Q1/2017 (YoY)
34
% PTT
holding
Q1/16 Q1/17 YoY Q1/16 Q1/17 YoY
PTT Net operating Income 11,967 22,893 91% 11,967 22,893 91%
E&P - PTTEP 5,625 12,284 118% 65.3% 3,671 8,020 118%
Petrochemical 5,596 15,473 177% 2,687 7,724 187%
- PTTGC 4,707 13,182 180% 49.3% 2,242 6,617 195%
- HMC/PTTPL/PTTPM/PTTAC/PTTMCC/PMMA/PTTTANK 889 2,291 158% 445 1,107 149%
Refining 7,740 9,440 22% 3,612 4,645 29%
- TOP 4,726 7,075 50% 49.1% 2,366 3,674 55%
- IRPC 3,014 2,365 -22% 38.5% 1,246 971 -22%
Others Business 3,258 4,650 43% 1,732 2,886 67%
Inter - PTTER, PTTGE -348 202 158% 100% -364 147 140%
Gas - PTTLNG/PTTNGD/ TTM(T)/ TTM (M) 1,349 2,149 59% 1,228 1,676 36%
Utilities -GPSC/ TP/ DCAP/Others 1,408 1,201 -15% 365 295 -19%
Oil & Oth. - PTTT/SBECL/THAPPLINE/PTTRB/Others 849 1,098 29% 503 768 53%
Shared of Net Income from Affiliates 22,219 41,847 88% 11,702 23,275 99%
PTT Conso. Net Income 34,186 64,740 89% 23,669 46,168 95%
Unit : MMTHB
Performance 100% Equity Method % PTT

PTT Group Performance : Q1/2017 (QoQ)
35
% PTT
holding
Q4/16 Q1/17 QoQ Q4/16 Q1/17 QoQ
PTT Net operating Income 12,240 22,893 87% 12,240 22,893 87%
E&P - PTTEP -872 12,284 1509% 65.3% -572 8,020 1502%
Petrochemical 10,880 15,473 42% 5,341 7,724 45%
- PTTGC 9,745 13,182 35% 49.3% 4,674 6,617 42%
- HMC/PTTPL/PTTPM/PTTAC/PTTMCC/PMMA/PTTTANK 1,135 2,291 102% 667 1,107 66%
Refining 7,496 9,440 26% 3,421 4,645 36%
- TOP 5,802 7,075 22% 49.1% 2,793 3,674 32%
- IRPC 1,694 2,365 40% 38.5% 628 971 55%
Others Business -138 4,650 3470% -1,343 2,886 315%
Inter - PTTER, PTTGE -4,109 202 105% 100% -4,110 147 104%
Gas - PTTLNG/PTTNGD/ TTM(T)/ TTM (M) 1,798 2,149 20% 1,587 1,676 6%
Utilities -GPSC/ TP/ DCAP/Others 819 1,201 47% 167 295 77%
Oil & Oth. - PTTT/SBECL/THAPPLINE/PTTRB/Others 1,354 1,098 -19% 1,013 768 -24%
Shared of Net Income from Affiliates 17,366 41,847 141% 6,847 23,275 240%
PTT Conso. Net Income 29,606 64,740 119% 19,087 46,168 142%
Unit : MMTHB
Performance 100% Equity Method % PTT

Subsidiaries ConsolidatePTT (Cambodia) Co., Ltd. PTTCL 100.00%PTT Oil & Retail Business Co., Ltd. PTTOR 100.00%Thai Lube Blending Co., Ltd. TLBC** 48.95%PTT Oil Myanmar Co., Ltd. PTTOM 100.00%
Associates EquityKeloil-PTT LPG Sdn. Bhd. KPL 40.00%Thai Petroleum Pipeline Co., Ltd.THAPPLINE 40.40%PetroAsia (Thailand) Co., Ltd. PA(Thailand) 35.00%
Others CostPetroAsia (Maoming) Co., Ltd. PA(Maoming) 20.00%PetroAsia (Sanshui) Co., Ltd. PA(Sanshui) 25.00%Intoplane Services Co., Ltd. IPS 16.67%Fuel Pipeline Transportation Co., Ltd.FPT 0.0000090%
Others Fair ValueBangkok Aviation Fuel Services Plc. BAFS 7.06%
Others
Subsidiaries ConsolidatePTT Exploration & Production Plc. PTTEP 65.29%PTT Natural Gas Distribution Co., Ltd. PTTNGD 58.00%PTT LNG Co., Ltd. PTTLNG 100.00%Thai Oil Power Co., Ltd.* TP 26.00%Global Power Synergy Co., Ltd* GPSC 22.58%
Joint Ventures EquityTrans Thai-Malaysia (Thailand) Co., Ltd. TTM (T) 50.00%Trans Thai-Malaysia (Malaysia) Sdn. Bhd. TTM (M) 50.00%District Cooling System and Power Plant DCAP 35.00%
Petrochemical Subsidiaries ConsolidatePTT Polymer Marketing Co., Ltd. PTTPM 50.00%PTT Polymer Logistics Co., Ltd. PTTPL**50.00%PTT PMMA Co., Ltd. PTTPMMA 100.00%PTT Global Chemical Plc.* PTTGC 49.42%PTT Maintenance and Engineering* PTTME 40.00%PTT Energy Solutions Co., Ltd.* PTTES 40.00%PTT Tank Terminal Co., Ltd. PTTTANK 100.00%
Joint Ventures EquityHMC Polymers Co., Ltd. HMC 41.44%PTT Asahi Chemical Co., Ltd. PTTAC 48.50%PTT MCC Biochem Co., Ltd. PTTMCC 50.00%
Refining Subsidiaries ConsolidateThai Oil Plc.* TOP 49.10%IRPC Plc.* IRPC 38.51%
Others Fair ValueStar Petroleum Refining Co., Ltd. SPRC 5.41%
Others Fair ValueDhipaya Insurance Plc. TIP 13.33%
Subsidiaries ConsolidateEnergy Complex Co., Ltd. EnCo 50.00%Business Service Alliance Co., Ltd. BSA * 100.00%PTT Regional Treasury Center Pte. Ltd. PTTRTC 100.00%PTT ICT Solutions Co., Ltd.* PTTICT 20.00%
International Trading Business Group
Subsidiaries ConsolidatePTT International Trading Pte. PTTT 100.00%PTT International Trading London Ltd PTTTLDN 100.00%
Remark : *The companies have changed their status to subsidiaries due to impact from PACK5** Subsidiaries that PTT holds less than 50% but being consolidated because PTT has the power to control the financial and operating policies.
Petrochemicals & Refining Business GroupE&P and Gas Business Group Oil Business Group
Data as of 31 Mar 2017
International Investment
Subsidiaries ConsolidatePTT Energy Resources Co., Ltd. PTTER 100.00%PTT Green Energy Pte. Ltd PTTGE 100.00%
36

3737
Natural Gas Price Structure : Jan-Mar 2017
CustomersSales Price Structure
Gas Pool Price Supply Margins Pipeline Tariffs+ +
Average Purchased Gas Price
1.75%
1.75%
9.33%
21.9 Bt/MMBtu
Charged at the same price structure of power producers
Reference to Saudi Aramco’s contract price
Charged at prices comparable to fuel oil
Gas prices are mostly agreed under long-term contracts and volatility pass-through to ensure stable returns.
Profit-sharing mechanism based on market prices of petrochemicals
Reference to Naphtha market price
At GSPs cost (adjusted every 3 months)
• Contract periods are ~ 25-30 years or until depletion of gas fields or the expiration of concessions
*
*
*
GSP 21%
Petrochemicals Feedstocks
Industry 15%
Ethane, Propane, LPG
NGL
Local Cooking Gas
Export Cooking Gas
Power Producers 58%
: EGAT 18%
: IPP 19%
: SPP 21% * EGAT IPP and SPP Supply Margins not more than 2.1525 and 11.4759 respectively
NGV 6% • 21 Jan -15 Jul 2016: Capped at 13.50 Baht/Kg. If cost is less than 13.50 Baht/Kg, retail price will be set to reflect the cost.
• Since 16 Jul 2016 : The retail price is set to reflect the cost.• NGV retail Price as of 31 Mar,17 = 13.20 Baht/Kg.
37

Natural Gas : Growth of natural gas upon Government fuel diversification policy for power generation
38
Thailand Gas DemandReplace :coal (3,340 MW), AE and EE 30%
Thailand Gas demand forecast (CAGR during 2017-2031): Total ~ 1%: Power ~ 2%: GSP ~ -3%: Industry ~ 1%: NGV ~ -5%

Thailand’s Projected Energy Demand
39
Primary Energy Consumption
Sources : Ministry of Energy (Thailand Energy Outlook 2016)
0
500
1,000
1,500
2,000
2,500
3,000
3,500
4,000
4,500
2013
2014
2015
2016
2017
2018
2019
2020
2021
2022
2023
2024
2025
2026
2027
2028
2029
2030
2031
2032
2033
2034
2035
KBD
Oil
Natural Gas
Coal/Lignite
Hydro/Import
Renewable
28%
34%
16%
3%
18%
3,853
2,812
33%
44%
11%
10%
2%
2,714
32%
46%
11%
9%2%
0.7%
0.3%
4.6%
2.9%
3.6%

Gas Business Generates Stable Returns
Sole owner and operator of entire
gas transmission pipelines in
Thailand (~ 4,000 km), a regulated
business
• IRROE ranges between
12.5% - 18% for transmission
pipeline investment
Supply & marketing of natural gas
provides fixed margin with long-term
contracts of 25-30 years
6 Gas Separation Plants; Total
production 6.7 MTA; are on
petrochemical market price-linked
profit sharing basis
40
Overview Gas transmission pipeline capacity
Gas Separation Plant Capacity
Unit 1 420 MMcf/d
Unit 2 and 3 820 MMcf/d
Unit 4 170 MMcf/d
Unit 5 570 MMcf/d
Unit 6 840 MMcf/d

![PTT Multicasting Scheme [호환 모드] · 2 New PTT Group Add by Mouse right button click 3PTTGrouppg Name Setting 4 PTT Group Number Setting 5 PTT Server Setting 6 PTT Group Session](https://img.pdfslide.us/doc/110x75/5f727989ade5745a8a06acb0/ptt-multicasting-scheme-eeoe-2-new-ptt-group-add-by-mouse-right-button.jpg)