Embed Size (px)
DESCRIPTION
ptp dec 14
Citation preview
Answer to PTP_Final_Syllabus 2012_Dec2014_Set 1
Board of Studies, The Institute of Cost Accountants of India (Statutory Body under an Act of Parliament) Page 1
Paper – 17 - Strategic Performance Management
Full Marks: 100 Time Allowed: 3 hours
This paper contains 10 questions, divided in three sections Section A, Section B and
Section C. In total 7 questions are to be answered.
From Section A, Question No.1 is compulsory and answer any two questions from Section A
(out of three questions - Questions Nos. 2 to 4). From Section B, Answer any two
questions (i.e. out of Question nos. 5 to 7). From Section C, Answer any two questions
(i.e. out of Question nos. 8 to 10).
Students are requested to read the instructions against each individual question also . All
workings must form part of your answer. Assumptions, if any, must be clearly indicated.
Section –A
[Question 1 is compulsory and answers any 2 from the rest]
1. Read the following case study and answer the following questions:
A Prominent Foreign Bank found itself in a precarious position: Its commercial loan volume
was static, but the unit's operating costs were increasing annually. Customer responsiveness
was adequate for the industry, but not the competitive advantage that the bank needed.
Managers wanted to engage employees in an ongoing, continuous improvement culture.
Bank facilitated a week-long session attended by senior management from each of the four
regional operations centers, as well as internal business partners from IT, HR, and Sales. The
team's goal was to use Voice of the Customer (VOC) analytics to see the business through
the eyes of their customers, eliminate process steps that added no value, and develop the
best future state for loan processing. At the end of the workshop, the group had a vision for
the future operations flow and an agreed-upon roadmap to get there.
Through a series of rapid improvement projects, groups of 8 to 12 employees worked to
scrutinize a particular segment of the lending process and find ways to eliminate waste and
improve the flow of work. Overall, six improvement projects were completed over a five
month period, engaging employees across three locations to create a new workflow that
would improve the experience for customers and employees — and lower costs for the bank.
A limited two-week pilot was launched to further refine and evaluate the new process.
Employees in one location set up the new process and then worked to iron out details in the
live customer environment. A week-long evaluation period followed, where the collected
data was analyzed and discussed.
The elimination of redundant and unnecessary steps in the lending process led to dramatic
increases in loan processing speed and capability. Analysis of the results from the pilot
showed that the target of 20 percent productivity improvement was met and exceeded by
an additional 10-15 percent gain. The lead time necessary to process a loan transaction also
decreased from 4-8 hours to 20-60 minutes. The bank validated those results with pilots at two
other sites. The project team and management team had the confidence to plan the full-
scale roll-out of the new process.
After full implementation of the new process, the bank was able to reduce:
Process steps from 140+ to 70
Decision points from 20 to 14
Physical hand-offs from 46 to 11; and electronic hand-offs from 16 to 14
Operating expenses from $10 to $8 million
Delivery time from 4-8 hours to 20-60 minutes with fewer errors and rework
Answer to PTP_Final_Syllabus 2012_Dec2014_Set 1
Board of Studies, The Institute of Cost Accountants of India (Statutory Body under an Act of Parliament) Page 2
Required to:
(a) State the shortcomings faced by the foreign bank before developing the new
process.
(b) Discuss the result achieved by the bank after implementing the new process.
(c) Describe the advantages achieved by the foreign bank after full implementation of
the new process.
(d) Describe the steps taken by the bank to face the challenge. [4+5+5+6]
Answer of 1:
(a) Shortcomings of the foreign Bank:
Commercial Loan Volume were Static
Operating costs were increasing
Customer responsiveness was not adequate.
Redundant Loan processing steps to reduce the speed of lending process.
(b) The elimination of redundant and unnecessary steps in the lending process led to
dramatic increases in loan processing speed and capability. Analysis of the results from
the pilot showed that the target of 20 percent productivity improvement was met and
exceeded by an additional 10-15 percent gain. The lead time necessary to process a
loan transaction also decreased from 4-8 hours to 20-60 minutes. The bank validated
those results with pilots at two other sites. The project team and management team had
the confidence to plan the full-scale roll-out of the new process.
(c) After full implementation of the new process, the bank was able to reduce:
Process steps from 140+ to 70
Decision points from 20 to 14
Physical hand-offs from 46 to 11; and electronic hand-offs from 16 to 14
Operating expenses from $10 to $8 million
Delivery time from 4-8 hours to 20-60 minutes with fewer errors and rework
(d) Bank facilitated a week-long session attended by senior management from each of the
four regional operations centers, as well as internal business partners from IT, HR, and
Sales. The team's goal was to use Voice of the Customer (VOC) analytics to see the
business through the eyes of their customers, eliminate process steps that added no
value, and develop the best future state for loan processing. At the end of the workshop,
the group had a vision for the future operations flow and an agreed-upon roadmap to
get there.
Through a series of rapid improvement projects, groups of 8 to 12 employees worked to
scrutinize a particular segment of the lending process and find ways to eliminate waste
and improve the flow of work. Overall, six improvement projects were completed over a
five-month period, engaging employees across three locations to create a new workflow
that would improve the experience for customers and employees — and lower costs for
the bank. A limited two-week pilot was launched to further refine and evaluate the new
process. Employees in one location set up the new process and then worked to iron out
details in the live customer environment. A week-long evaluation period followed, where
the collected data was analyzed and discussed.
2. (a) A company is organized into two large Divisions. Division 'A' produces a component
which is used by Division 'B' in making a final product. The final product is sold for `400
each. Division A has a capacity to produce 2,000 units and the entire quantity can be
purchased by Division B.
Division A informed that due to installation of new machines, its depreciation cost had
gone up and hence wanted to increase the price of the component to be supplied to
Division B to `220. Division B, however can buy the component from the outside market at
Answer to PTP_Final_Syllabus 2012_Dec2014_Set 1
Board of Studies, The Institute of Cost Accountants of India (Statutory Body under an Act of Parliament) Page 3
`200 each. The variable cost of Division A is `190. The variable costs of Division B in
manufacturing the final product by using the component are `150 (excluding the
component cost).
Present statement indicating the position of each Division and the company as a whole
taking each of the following situations separately.
(i) If there are no alternative used for the production facilities of A, will the company
benefit if Division B buys from outside suppliers at `200 per component?
(ii) If internal facilities of A are not otherwise idle and the alternative use of the facilities will
give an annual cash operating saving of `30,000 to Division A, should Division B
purchase the component from outside suppliers?
(iii) If there are no alternative used for the production facilities of Division A and the selling
price for the component in the outside market drops by `15, should Division B
purchase from outside suppliers?
(iv) What transfer price would you fix for the component in each of the above
circumstances?
(b) Discuss the role of the Management Accountant in Value Chain Analysis.
(c) State the steps of Business Process Re-Engineering. [10+5+5]
Answer of 2 :
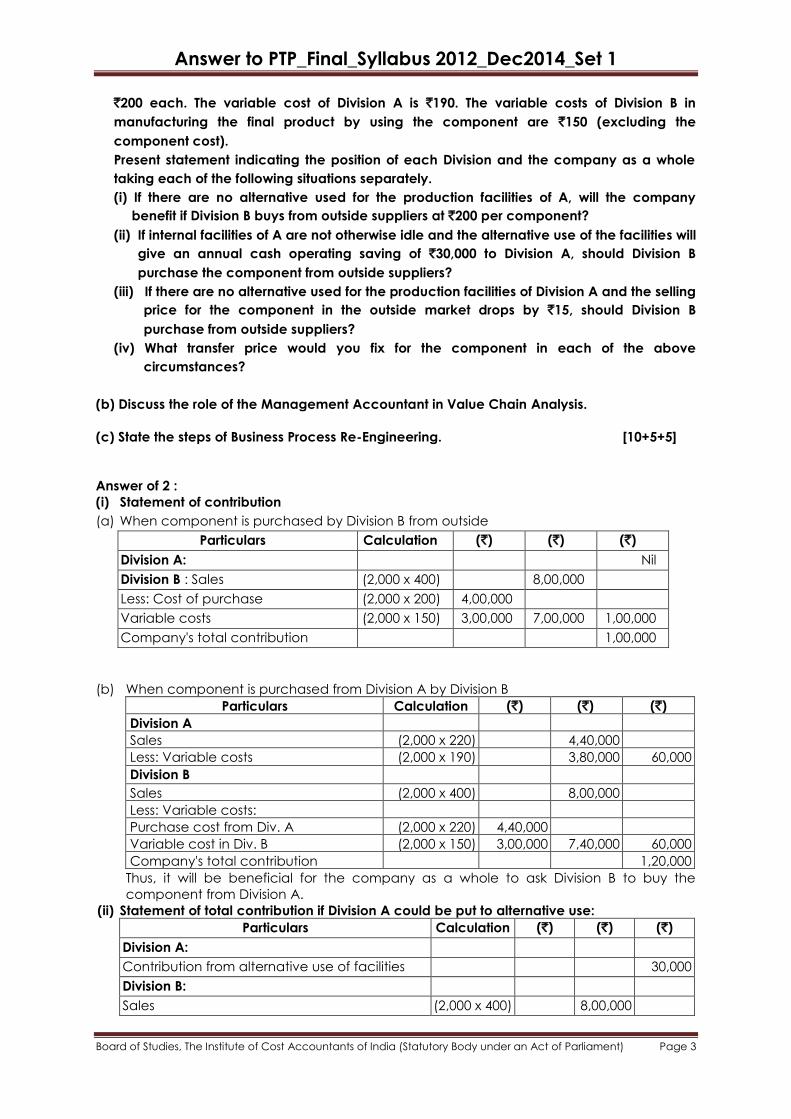
(i) Statement of contribution
(a) When component is purchased by Division B from outside
Particulars Calculation (`) (`) (`)
Division A: Nil
Division B : Sales (2,000 x 400) 8,00,000
Less: Cost of purchase (2,000 x 200) 4,00,000
Variable costs (2,000 x 150) 3,00,000 7,00,000 1,00,000
Company's total contribution 1,00,000
(b) When component is purchased from Division A by Division B
Particulars Calculation (`) (`) (`)
Division A
Sales (2,000 x 220) 4,40,000
Less: Variable costs (2,000 x 190) 3,80,000 60,000
Division B
Sales (2,000 x 400) 8,00,000
Less: Variable costs:
Purchase cost from Div. A (2,000 x 220) 4,40,000
Variable cost in Div. B (2,000 x 150) 3,00,000 7,40,000 60,000
Company's total contribution 1,20,000
Thus, it will be beneficial for the company as a whole to ask Division B to buy the
component from Division A.
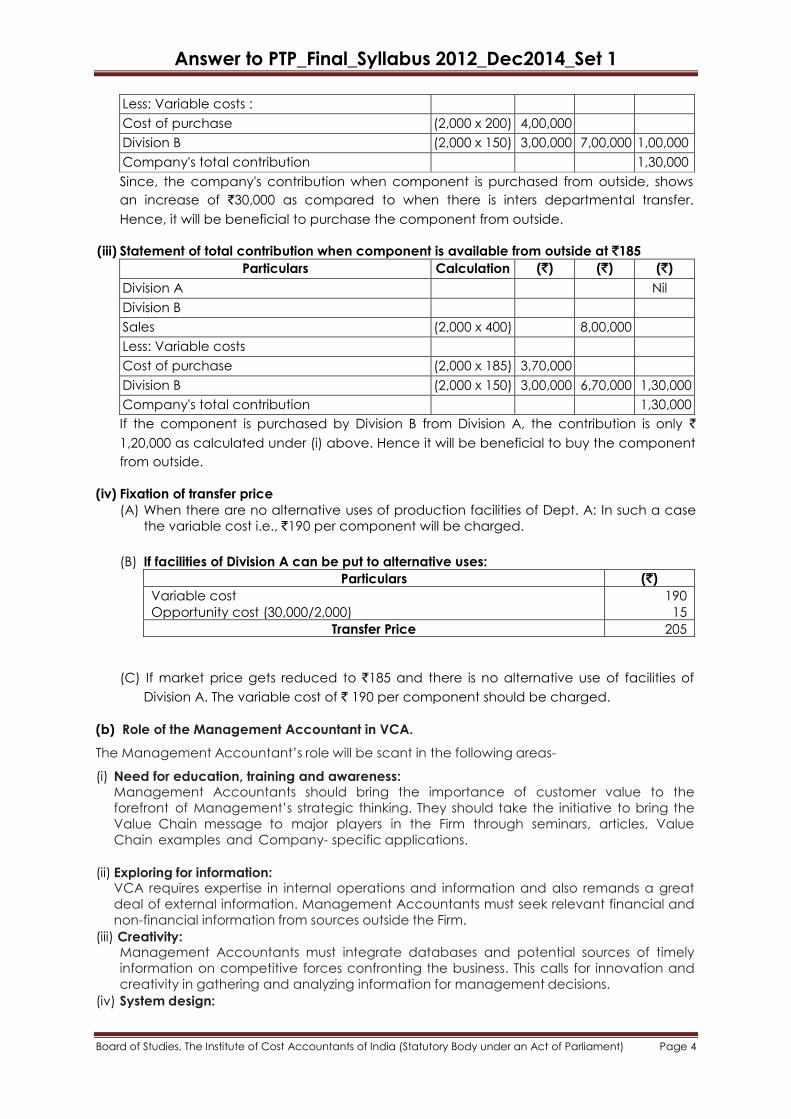
(ii) Statement of total contribution if Division A could be put to alternative use:
Particulars Calculation (`) (`) (`)
Division A:
Contribution from alternative use of facilities 30,000
Division B:
Sales (2,000 x 400) 8,00,000
Answer to PTP_Final_Syllabus 2012_Dec2014_Set 1
Board of Studies, The Institute of Cost Accountants of India (Statutory Body under an Act of Parliament) Page 4
Less: Variable costs :
Cost of purchase (2,000 x 200) 4,00,000
Division B (2,000 x 150) 3,00,000 7,00,000 1,00,000
Company's total contribution 1,30,000
Since, the company's contribution when component is purchased from outside, shows
an increase of `30,000 as compared to when there is inters departmental transfer.
Hence, it will be beneficial to purchase the component from outside.
(iii) Statement of total contribution when component is available from outside at `185
Particulars Calculation (`) (`) (`)
Division A Nil
Division B
Sales (2,000 x 400) 8,00,000
Less: Variable costs
Cost of purchase (2,000 x 185) 3,70,000
Division B (2,000 x 150) 3,00,000 6,70,000 1,30,000
Company's total contribution 1,30,000
If the component is purchased by Division B from Division A, the contribution is only `
1,20,000 as calculated under (i) above. Hence it will be beneficial to buy the component
from outside.
(iv) Fixation of transfer price
(A) When there are no alternative uses of production facilities of Dept. A: In such a case
the variable cost i.e., `190 per component will be charged.
(B) If facilities of Division A can be put to alternative uses:
Particulars (`)
Variable cost
Opportunity cost (30,000/2,000)
190
15
Transfer Price 205
(C) If market price gets reduced to `185 and there is no alternative use of facilities of
Division A. The variable cost of ` 190 per component should be charged.
(b) Role of the Management Accountant in VCA.
The Management Accountant‘s role will be scant in the following areas-
(i) Need for education, training and awareness: Management Accountants should bring the importance of customer value to the
forefront of Management‘s strategic thinking. They should take the initiative to bring the
Value Chain message to major players in the Firm through seminars, articles, Value
Chain examples and Company- specific applications.
(ii) Exploring for information: VCA requires expertise in internal operations and information and also remands a great
deal of external information. Management Accountants must seek relevant financial and
non-financial information from sources outside the Firm.
(iii) Creativity: Management Accountants must integrate databases and potential sources of timely
information on competitive forces confronting the business. This calls for innovation and
creativity in gathering and analyzing information for management decisions.
(iv) System design:
Answer to PTP_Final_Syllabus 2012_Dec2014_Set 1
Board of Studies, The Institute of Cost Accountants of India (Statutory Body under an Act of Parliament) Page 5
Designing internal and external information systems to assist managers in planning,
monitoring and improving value-creating processes is another challenge of
Management Accountants.
(v) Co-operation: Management Accountants should solicit support from all senior managers for
allocating resources to develop and improve Value Chain-oriented Information Systems.
The Management Accountant should ensure that the Top Management is committed to
Value Chain Analysis and the organizational changes necessary for its successful
implementation.
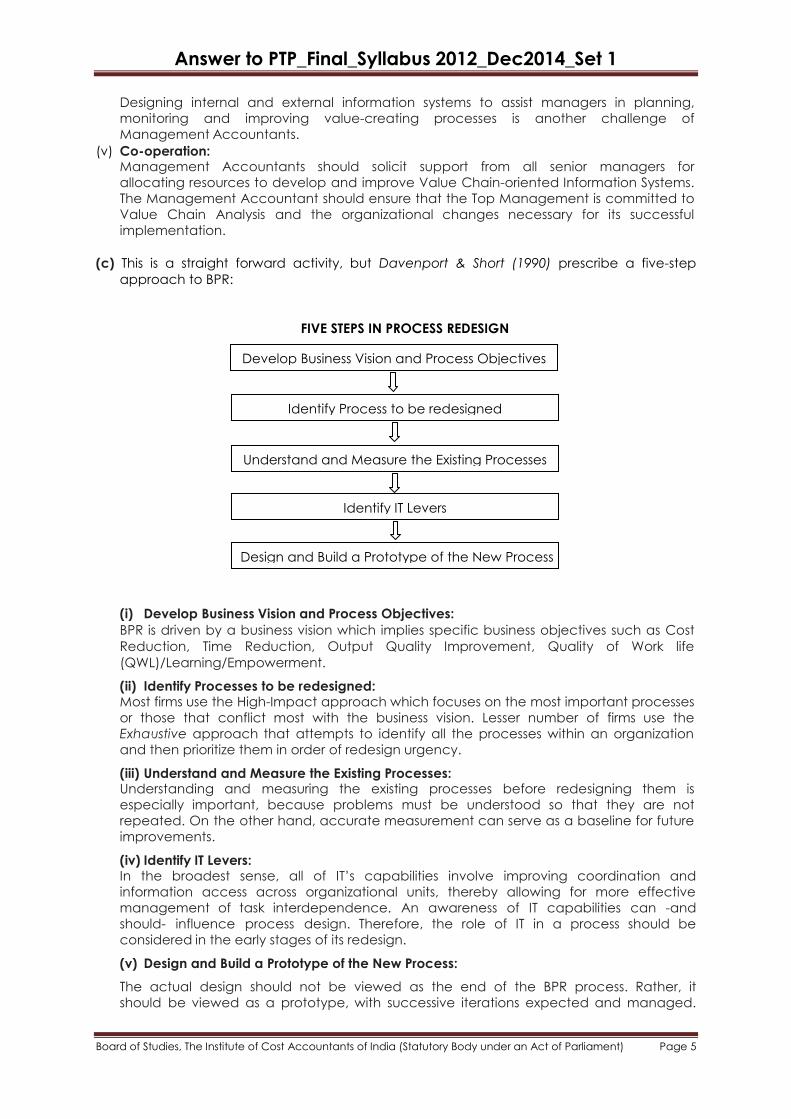
(c) This is a straight forward activity, but Davenport & Short (1990) prescribe a five-step
approach to BPR:
FIVE STEPS IN PROCESS REDESIGN
(i) Develop Business Vision and Process Objectives:
BPR is driven by a business vision which implies specific business objectives such as Cost
Reduction, Time Reduction, Output Quality Improvement, Quality of Work life
(QWL)/Learning/Empowerment.
(ii) Identify Processes to be redesigned: Most firms use the High-Impact approach which focuses on the most important processes
or those that conflict most with the business vision. Lesser number of firms use the
Exhaustive approach that attempts to identify all the processes within an organization
and then prioritize them in order of redesign urgency.
(iii) Understand and Measure the Existing Processes: Understanding and measuring the existing processes before redesigning them is
especially important, because problems must be understood so that they are not
repeated. On the other hand, accurate measurement can serve as a baseline for future
improvements.
(iv) Identify IT Levers: In the broadest sense, all of IT‘s capabilities involve improving coordination and
information access across organizational units, thereby allowing for more effective
management of task interdependence. An awareness of IT capabilities can -and
should- influence process design. Therefore, the role of IT in a process should be
considered in the early stages of its redesign.
(v) Design and Build a Prototype of the New Process:
The actual design should not be viewed as the end of the BPR process. Rather, it
should be viewed as a prototype, with successive iterations expected and managed.
Develop Business Vision and Process Objectives
Identify Process to be redesigned
Understand and Measure the Existing Processes
Identify IT Levers
Design and Build a Prototype of the New Process
Answer to PTP_Final_Syllabus 2012_Dec2014_Set 1
Board of Studies, The Institute of Cost Accountants of India (Statutory Body under an Act of Parliament) Page 6
Key factors and tactics to consider in process design and prototype generation include
using IT as a design tool, understanding generic design criteria, and creating
organizational prototypes.
These prototypes of business process changes and organizational redesign initiatives,
after agreement by owners and stakeholders, would be implemented on a pilot basis,
examined regularly for problems and objective achievement, and modified as necessary.
As the process approached final acceptance, it would be phased into full
implementation.
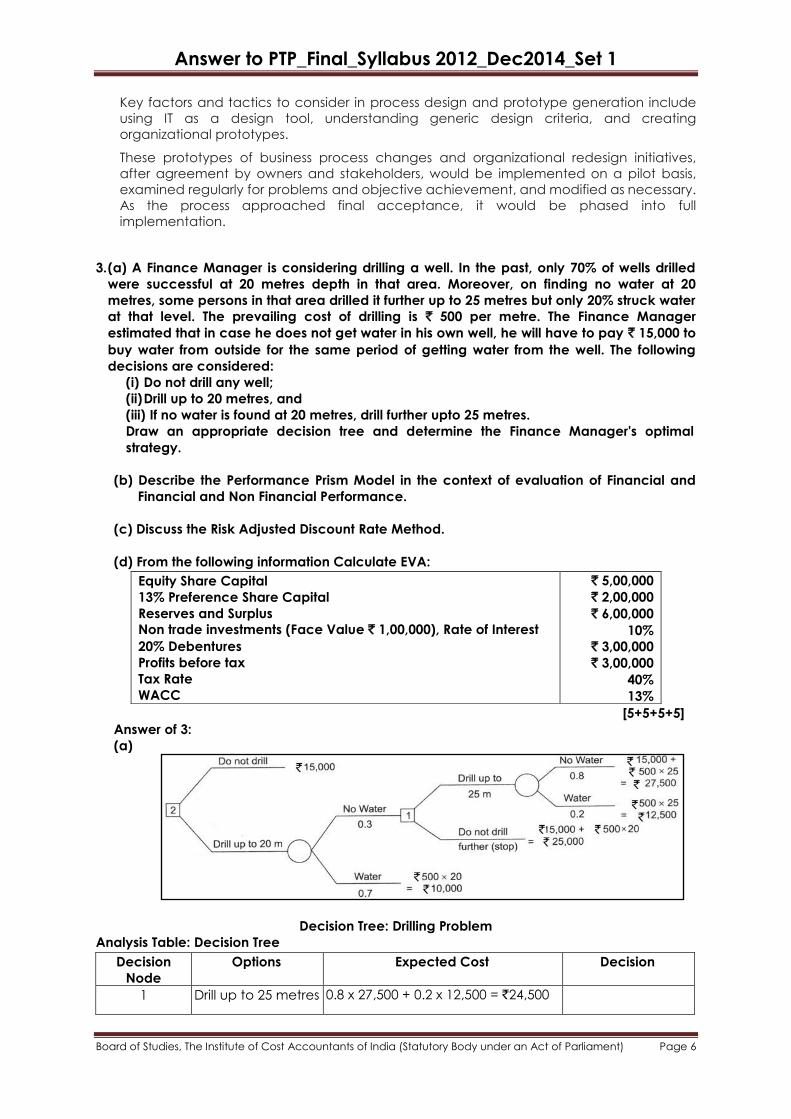
3. (a) A Finance Manager is considering drilling a well. In the past, only 70% of wells drilled
were successful at 20 metres depth in that area. Moreover, on finding no water at 20
metres, some persons in that area drilled it further up to 25 metres but only 20% struck water
at that level. The prevailing cost of drilling is ` 500 per metre. The Finance Manager
estimated that in case he does not get water in his own well, he will have to pay ` 15,000 to
buy water from outside for the same period of getting water from the well. The following
decisions are considered:
(i) Do not drill any well;
(ii) Drill up to 20 metres, and
(iii) If no water is found at 20 metres, drill further upto 25 metres.
Draw an appropriate decision tree and determine the Finance Manager's optimal
strategy.
(b) Describe the Performance Prism Model in the context of evaluation of Financial and
Financial and Non Financial Performance.
(c) Discuss the Risk Adjusted Discount Rate Method.
(d) From the following information Calculate EVA:
[5+5+5+5]
Answer of 3:
(a)
Decision Tree: Drilling Problem
Analysis Table: Decision Tree
Decision
Node
Options Expected Cost Decision
1 Drill up to 25 metres 0.8 x 27,500 + 0.2 x 12,500 = `24,500
Equity Share Capital
13% Preference Share Capital
Reserves and Surplus
Non trade investments (Face Value ` 1,00,000), Rate of Interest
20% Debentures
Profits before tax
Tax Rate
WACC
` 5,00,000
` 2,00,000
` 6,00,000
10%
` 3,00,000
` 3,00,000
40%
13%
Answer to PTP_Final_Syllabus 2012_Dec2014_Set 1
Board of Studies, The Institute of Cost Accountants of India (Statutory Body under an Act of Parliament) Page 7
Stop ` 25,000 Drill up to 25 metres
2 Do not drill
Drill up to 20 metres
` 15,000
0.3 x 24,500 + 0.7 x 10,000 = `14,350
Drill up to 20 metres
From the analysis table, it may be observed that decision at node 2 implies that if it is
decided to drill up to 20 metres and water is not found, then drilling up to 25 metres should
be done. At node 1, the decision taken is to drill up to 20 metres as it involved lower
expected cost. Thus, the optimal strategy is to drill up to 20 metres and if water is not struck
then drill further to 25 metres.
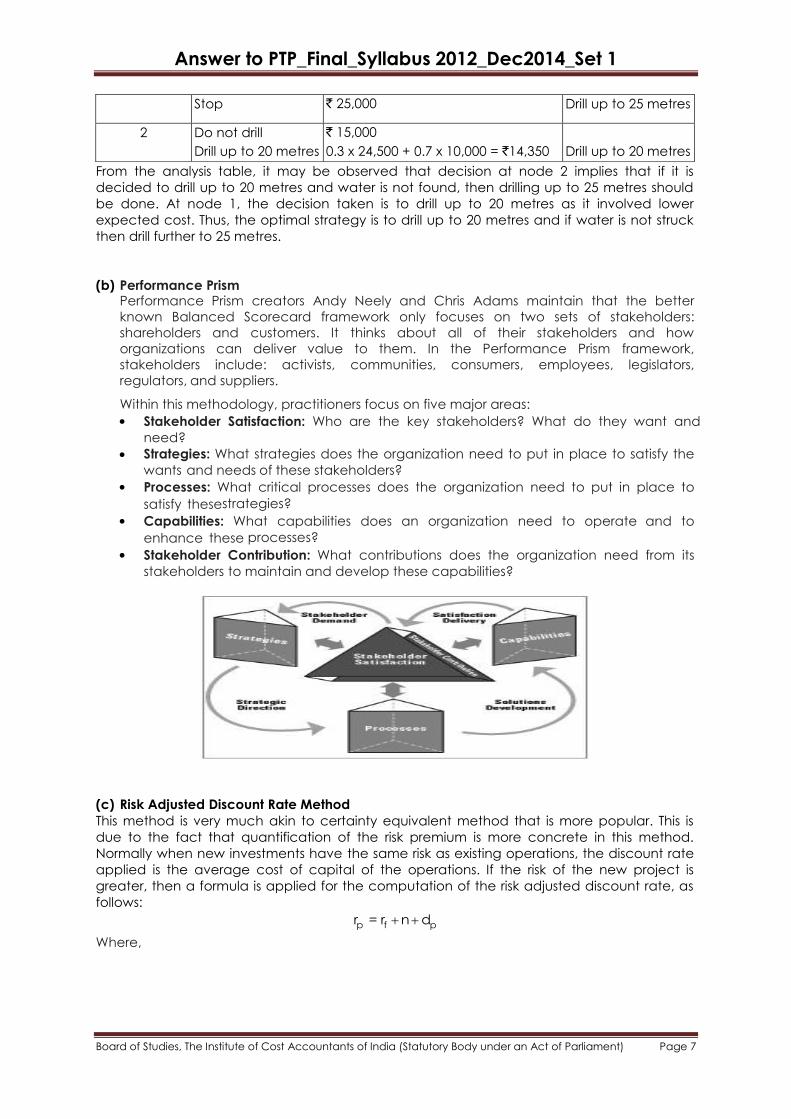
(b) Performance Prism Performance Prism creators Andy Neely and Chris Adams maintain that the better
known Balanced Scorecard framework only focuses on two sets of stakeholders:
shareholders and customers. It thinks about all of their stakeholders and how
organizations can deliver value to them. In the Performance Prism framework,
stakeholders include: activists, communities, consumers, employees, legislators,
regulators, and suppliers.
Within this methodology, practitioners focus on five major areas:
Stakeholder Satisfaction: Who are the key stakeholders? What do they want and
need?
Strategies: What strategies does the organization need to put in place to satisfy the
wants and needs of these stakeholders?
Processes: What critical processes does the organization need to put in place to
satisfy thesestrategies?
Capabilities: What capabilities does an organization need to operate and to
enhance these processes?
Stakeholder Contribution: What contributions does the organization need from its
stakeholders to maintain and develop these capabilities?
(c) Risk Adjusted Discount Rate Method
This method is very much akin to certainty equivalent method that is more popular. This is
due to the fact that quantification of the risk premium is more concrete in this method.
Normally when new investments have the same risk as existing operations, the discount rate
applied is the average cost of capital of the operations. If the risk of the new project is
greater, then a formula is applied for the computation of the risk adjusted discount rate, as
follows:
p f pr = r n d
Where,
Answer to PTP_Final_Syllabus 2012_Dec2014_Set 1
Board of Studies, The Institute of Cost Accountants of India (Statutory Body under an Act of Parliament) Page 8
p
f
p
r Risk Adjusted discount rate for project 'p'
r Risk free rate of interest
n = Premium for normal risk
d Pr emium for additional risk differential for project 'p'
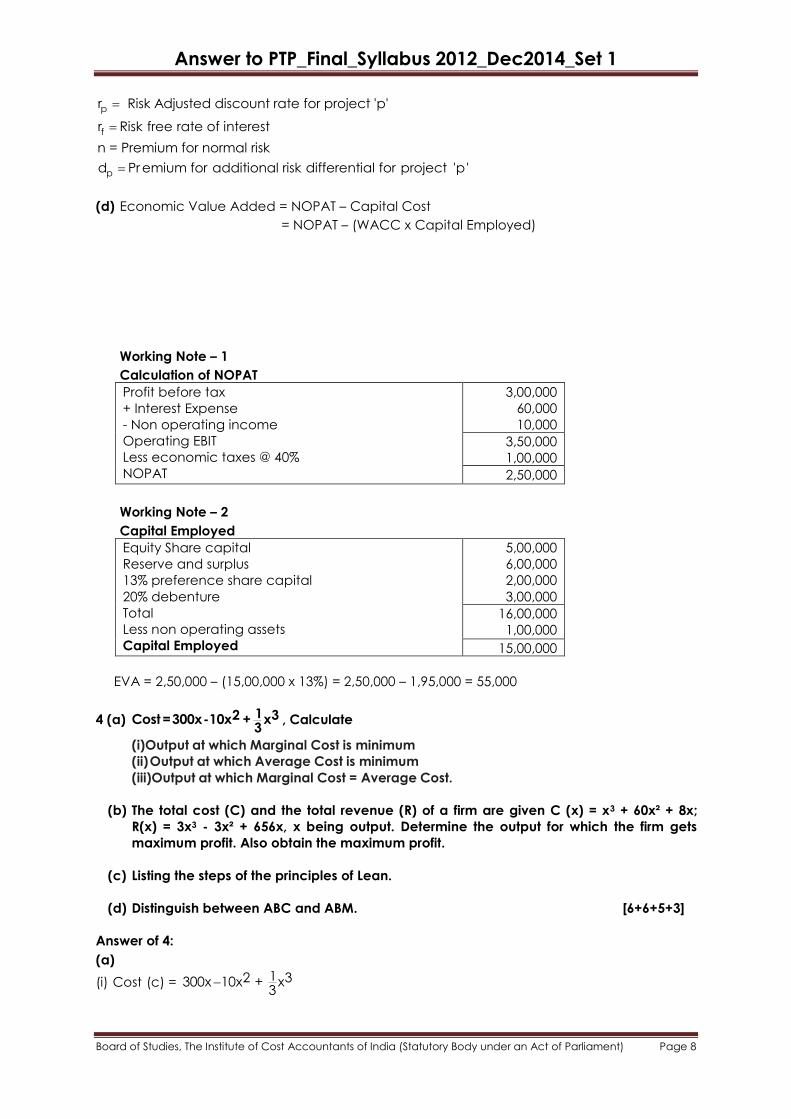
(d) Economic Value Added = NOPAT – Capital Cost
= NOPAT – (WACC x Capital Employed)
Working Note – 1
Calculation of NOPAT
Profit before tax
+ Interest Expense
- Non operating income
Operating EBIT
Less economic taxes @ 40%
NOPAT
3,00,000
60,000
10,000
3,50,000
1,00,000
2,50,000
Working Note – 2
Capital Employed
Equity Share capital
Reserve and surplus
13% preference share capital
20% debenture
Total
Less non operating assets
Capital Employed
5,00,000
6,00,000
2,00,000
3,00,000
16,00,000
1,00,000
15,00,000
EVA = 2,50,000 – (15,00,000 x 13%) = 2,50,000 – 1,95,000 = 55,000
4 (a) 12 3Cost =300x-10x + x3
, Calculate
(i)Output at which Marginal Cost is minimum
(ii) Output at which Average Cost is minimum
(iii)Output at which Marginal Cost = Average Cost.
(b) The total cost (C) and the total revenue (R) of a firm are given C (x) = x3 + 60x² + 8x;
R(x) = 3x3 - 3x² + 656x, x being output. Determine the output for which the firm gets
maximum profit. Also obtain the maximum profit.
(c) Listing the steps of the principles of Lean.
(d) Distinguish between ABC and ABM. [6+6+5+3]
Answer of 4:
(a)
(i) Cost (c) = 12 3300x 10x + x3
Answer to PTP_Final_Syllabus 2012_Dec2014_Set 1
Board of Studies, The Institute of Cost Accountants of India (Statutory Body under an Act of Parliament) Page 9
Marginal Cost = 2dc300 20x x (say y)
dx
In order that MC is minimum first derivate must be equal to zero and 2nd derivate must be
positive.
∴ dydx
= 2x – 20 => 2x = 20
x = 10
2d y2dx
= 2, which is positive. It is minimum at x = 10.
(ii) Average Cost = 300 – 10x + 21x
3 (y say)
dy 2 -10 + x 0
dx 3
=> x = 30/2 = 15
2
2
d y 2>0,
3dx
∴ Average Cost is minimum at x = 15
(iii) Output at which Marginal Cost = Average Cost
300 – 20x + x2 = 300 -10x + 21x
3
or, –20x + 10x + x2 – 21x
3 = 0
2
2
2or, 10x x 0
3
30x 2xor, 0
3
or, 2x2 - 30x = 0
or, 2x (x – 15) = 0
Or, X – 15 = 0
∴ x = 15
(b) C = x3 + 60x2 + 8x
R = 3x3 – 3x2 + 656x
Profit = 3x3 – 3x2 + 656x – x3 – 60x2 – 8x
= 2x3 – 63x2 + 648x = (p)
Derivative w.r.to x
dp
dx= 6x2 – 126x + 648 = 0
x2 – 21x + 108 = 0
x2 – 9x – 12x + 108 = 0
x(x – 9) – 12 (x – 9) = 0
(x – 12) (x – 9) = 0; x = 12 or 9
Answer to PTP_Final_Syllabus 2012_Dec2014_Set 1
Board of Studies, The Institute of Cost Accountants of India (Statutory Body under an Act of Parliament) Page 10
2
2
d p
dx= 2x – 21
at x = 9
= 18 – 21 = – 3 < 0
∴ P is maximum at x = 9
at x = 12
2
2
d p
dx= 24 – 21= 3 > 0
∴ P is minimum at x = 12
P = 2x3 – 63x2 + 648x
at x = 9
Profit P = 2 x (9)3 – 63(9)2 + 648(9)
729 x 2 – 63 x 81 + 648 x 9 = 2187
(c) The five-step thought process for guiding the implementation of lean techniques is easy
to remember, but not always easy to achieve:
Specify value from the standpoint of the end customer by product family.
Identify all the steps in the value stream for each product family, eliminating
whenever possible those steps that do not create value.
Make the value-creating steps occur in tight sequence so the product will flow
smoothly toward the customer.
As flow is introduced, let customers pull value from the next upstream activity.
As value is specified, value streams are identified, wasted steps are removed, and flow
and pull are introduced, begin the process again and continue it until a state of
perfection is reached in which perfect value is created with no waste.
(d) Distinguish between ABC and ABM
ABC ABM
ABC refers to the technique of determining
the cost of activities and the cost of output
produced by those activities.
It refers to the management philosophy that
focusses on the planning, execution and
measurement of activities as the key to competitive
advantage.
The aim of ABC is to generate improved
cost data for use in managing a
Company‘s activities.
ABM is a much broader concept and aims to use
information given by ABC, for effective business
processes and profitability.
ABC is the operational segment of ABM. It is a conceptual aspect, i.e. management
attitude.
Section – B
[Answer any 2]
5 (a) List the Advantages of these Data Envelopment Analysis.
(b) “Data quality management incorporates a virtuous cycle in which continuous analysis,
observation, and improvement lead to overall improvement in the quality of
organizational information across the board. This virtuous cycle incorporates five
Answer to PTP_Final_Syllabus 2012_Dec2014_Set 1
Board of Studies, The Institute of Cost Accountants of India (Statutory Body under an Act of Parliament) Page 11
fundamental data quality management practices, which are ultimately implemented
using a combination of core data services.” – Discuss the five fundamentals. [5+5]
Answer of 5 :
(a) Some of the Advantages of DEA are:
• No need to explicitly specify a mathematical form for the production function.
•Proven to be useful in uncovering relationships that remain hidden for other
methodologies.
• Capable of handling multiple inputs and outputs.
• Capable of being used with any input-output measurement.
• The sources of inefficiency can be analyzed and quantified for every evaluated unit.
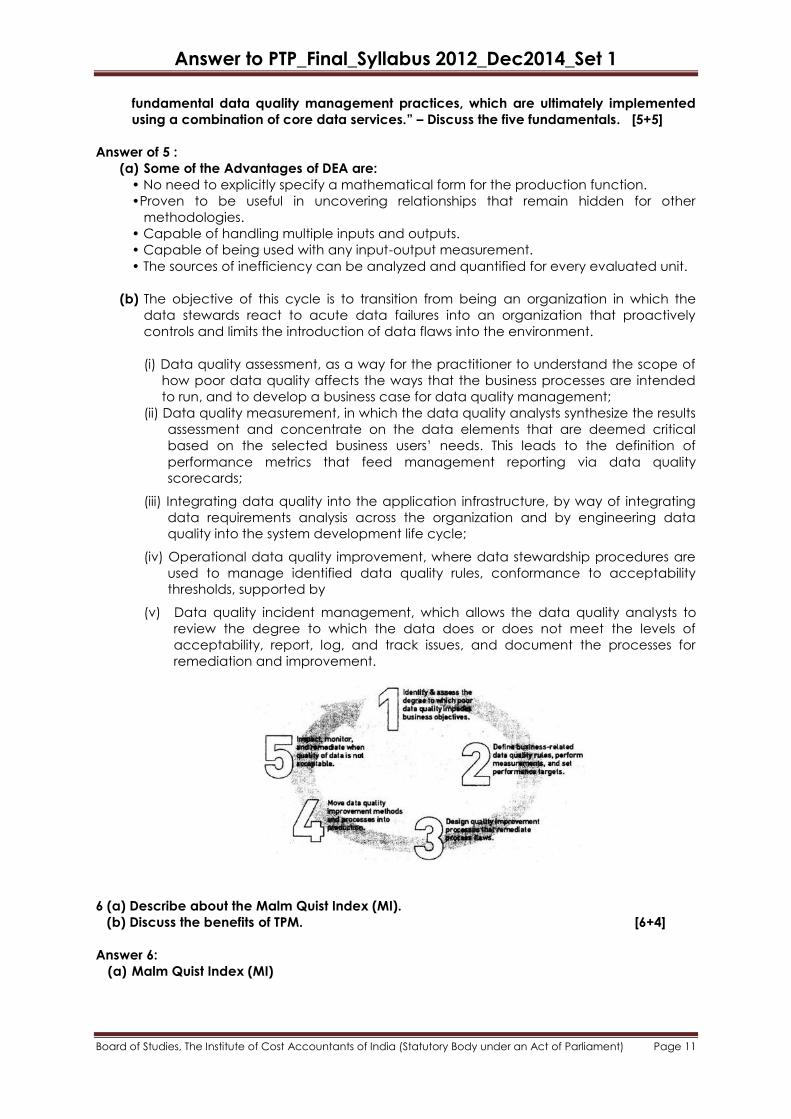
(b) The objective of this cycle is to transition from being an organization in which the
data stewards react to acute data failures into an organization that proactively
controls and limits the introduction of data flaws into the environment.
(i) Data quality assessment, as a way for the practitioner to understand the scope of
how poor data quality affects the ways that the business processes are intended
to run, and to develop a business case for data quality management;
(ii) Data quality measurement, in which the data quality analysts synthesize the results
assessment and concentrate on the data elements that are deemed critical
based on the selected business users‘ needs. This leads to the definition of
performance metrics that feed management reporting via data quality
scorecards;
(iii) Integrating data quality into the application infrastructure, by way of integrating
data requirements analysis across the organization and by engineering data
quality into the system development life cycle;
(iv) Operational data quality improvement, where data stewardship procedures are
used to manage identified data quality rules, conformance to acceptability
thresholds, supported by
(v) Data quality incident management, which allows the data quality analysts to
review the degree to which the data does or does not meet the levels of
acceptability, report, log, and track issues, and document the processes for
remediation and improvement.
6 (a) Describe about the Malm Quist Index (MI).
(b) Discuss the benefits of TPM. [6+4]
Answer 6:
(a) Malm Quist Index (MI)
Answer to PTP_Final_Syllabus 2012_Dec2014_Set 1
Board of Studies, The Institute of Cost Accountants of India (Statutory Body under an Act of Parliament) Page 12
The Malm quist Index (MI) is a bilateral index that can be used to compare the
production technology of two economies. It is named after Professor Sten Malmquist,
on whose ideas it is based. It is also called the Malmquist Productivity Index.
The MI is based on the concept of the Production function. This is a function of
maximum possible production, with respect to a set of inputs pertaining to capital and
labour. So, if is the set of labour and capital inputs to the production function of
Economy A, and Q is the production function of Economy A, we could write a aQ f (S ) .
While the production function would normally apply to an enterprise, it is possible to
calculate it for an entire region or nation. This would be called the aggregate
production function.
To calculate the Malmquist Index of economy A with respect to economy B, we must
substitute the labour and capital inputs of economy A into the production function of B,
and vice versa. The formula for MI is given below.
MI = (Q Q ) / (Q Q )1 2 3 4
Where,
Q f (S )a a1
Q f (S )a2 b
Q f (S )a3 b
Q f (S )4 b b
Note that the MI of A with respect to B is the reciprocal of the MI of B with respect to A.
If the MI of A with respect to B is greater than 1, the aggregate production technology
of economy A is superior to that of economy B.
(b)Benefits of TPM:
• A set of new management goals will be developed by the Management, using the
skills and training provided during the implementation of the TPM
• Team bonding and better accountability
• Improved quality and total cost competitiveness
• Productivity and quality team training for problem solving
• Earlier detection of factors critical to maintaining equipment ―uptime‖
• Measure impact of defects, sub-optimal performance, and downtime using OEE
(Overall Equipment Effectiveness).
• Motivated people function better all the time
• The cost is reduced because the losses and other not value added work is reduced
7. Define the following term in the context of Supply Chain Management:
(a)Capacity Utilization, (b) In source vs Outsource, (c) Logistics Management, (d)
Strategic Alliance (e) Supplier Performance Evaluation. [2x5]
Answer of 7:
(a) Capacity Utilization
This is a measure (usually expressed as a percentage) of how intensively a resource is being
used to produce a good or service. Utilization compares actual time used to available time.
Traditionally, utilization is the ratio of direct time charged (run time plus setup time) to the
clock time available.
(b) In source vs Outsource
The act of deciding whether to produce an item internally or buy it from an outside supplier.
Factors to consider in the decision include costs, capacity availability, proprietary and/or
specialized knowledge, quality considerations, skill requirements, volume, and timing.
(c) Logistics Management
Answer to PTP_Final_Syllabus 2012_Dec2014_Set 1
Board of Studies, The Institute of Cost Accountants of India (Statutory Body under an Act of Parliament) Page 13
Logistics management is the process of strategically managing the procurement, movement
and storage of materials, parts and finished inventory (and the related information flows)
through the organization and its marketing channels in such as way that current and future
profitability are maximized through the cost-effective fulfillment of orders.
(d) Strategic Alliance
A relationship formed by two or more organizations that share (proprietary), participate in
joint investments, and develop linked and common processes to increase the performance
of both companies. Many organizations form strategic alliances to increase the performance
of their common supply chain.
(e) Supplier Performance Evaluation
The main objective of the supplier evaluation process is to reduce purchase risk and
maximize the overall value of the purchaser. It typically involves evaluating, at a minimum,
supplier quality, cost competitiveness, potential delivery performance and technological
capability. Some of the other criteria used in the preliminary evaluation of suppliers include
financial risk analysis, evaluation of previous performance, and evaluation of supplier
provided information.
Section C
[Answer any 2]
8. (a) Discuss the needs for Implementation of ERM.
(b) State the objectives of Risk Management. [5+5]
Answer of 8:
(a)Need for Implementation of ERM
ERM needs to be implemented for the following reasons:
Reduce unacceptable performance variability.
Align and integrate varying views of risk management.
Build confidence of investment community and stakeholders.
Enhance corporate governance.
Successfully respond to a changing business environment.
Align strategy and corporate culture.
[Students may answer any 5 points out of 6]
(b)Objectives of Risk Management
Risk management basically has the following objectives:
Anticipating the uncertainty and the degree of uncertainty of the events not
happening the way they are planned.
Channelizing events to happen the way they are planned.
Setting right, at the earliest opportunity, deviations from plans, whenever they occur.
Ensuring that the objective of the planned event is achieved by alternative means,
when the means chosen proves wrong, and
In case the expected event is frustrated, making the damage minimal.
9. “Just as diseases are identified by certain symptoms, industrial sickness too can be
identified by some symptoms.” - Justify the statement. [10]
Answer of 9:
Symptoms act as leading indicators of sickness, and if immediate remedial actions are not
taken, the sickness will grow to the extent that the organization will find its natural death.
There are the following indicators of sickness:
Continuous reduction in turnover.
Piling up of inventory,
Answer to PTP_Final_Syllabus 2012_Dec2014_Set 1
Board of Studies, The Institute of Cost Accountants of India (Statutory Body under an Act of Parliament) Page 14
Continuous reduction of net profit to sales ratio.
Short term borrowings M high interest rate,
Continuous cash losses leading to erosion of tangible net worth,
Default in payment of interest on borrowings and default in repayment of term
loan installments.
The ‗sundry debtors‘ as well as the ‗sundry creditors‘ keep growing and reaching a
disproportionately high level.
High turnover of personnel, especially at senior levels,
Change in accounting procedure with to view to window dressing.
Delay in finalization of accounts
10. (a) Describe about the Dr. L.C. Gupta’s Sickness Prediction Model under the corporate
failure.
(b) Discuss the Total Loss Distribution [6+4]
Answer of 10:
(a) Dr. L.C. Gupta’s Sickness Prediction Model:
Dr. L.C. Gupta made an attempt to distinguish between sick and non-sick companies on
the basis of financial ratios. He used a simple non-parametric test for measuring the relative
predicting power of different financial ratios. A mixed sample of sick and non-sick
companies was made and the companies in the sample were arranged in a single
ordered sequence from the smallest to the largest, according to the financial ratio that is
tested for its predictive power. Let [profit after tax ÷ Net worth] is a financial ratio that is to
be tested for its predictive power. The companies in the sample are arranged in increasing
order of this particular ratio. Let the sick companies be denoted by the letter ‗S‘ and the
non-sick ones by the letter ‗N‘. Let us assume that 8 sick companies and 8 non-sick
companies are taken for building up the sample. When arranged in a sequential order as
stated above, the sequence may result in any pattern as shown below:
(A) S-N-S-N-S-S-N-S-N-N-S-N-S-N-S-N
(B) S-S-S-S-S-S-S-S-N-N-N-N-N-N-N-N
(C) S-S-S-S-N-N-N-N-N-N-N-N-S-S-S-S
(D) S-S-S-N-S-S-N-N-S-S-N-N-S-N-N-N
Observing the pattern of occurrence of ‗S‘ and ‗N‘ a cutoff point is chosen to separate the
sick group from the non-sick group. Companies that fall to the left of the cutoff point lie in the
sick group while companies that fall to the right of the cutoff point lie in the non-sick group.
The cutoff point is so chosen that the numbers of misclassifications are minimized. The ratio
that showed the least percentage classification error at the earliest possible time is deemed
to have the highest predicative power. Referring to the four patterns shown above, the
pattern of sequence shown in (B) is the most accurate one since the cutoff point will be
located exactly midway in the sample group and the percentage of classification error will
be zero since there are no misclassifications. Pattern shown in (C) is bound to have a higher
error since the sick companies are concentrated on both the extreme ends.
Dr. L.C. Gupta used Indian data on a sample of 41 textile companies of which 20 were sick
companies and 21 were non-sick companies. He studied the predictive power of 63 financial
ratios and observed that the following two ratios have comparatively better predictive
power.
(a) (Earnings before Interest and Taxes) ÷ Sales
and
(b) (Operating cash flow) ÷ Sales
[Note: Operating cash flow = profit after tax + depreciation]

Answer to PTP_Final_Syllabus 2012_Dec2014_Set 1
Board of Studies, The Institute of Cost Accountants of India (Statutory Body under an Act of Parliament) Page 15
(b) Total Loss Distribution:
Probability distributions can be very useful tools for evaluating the expected frequency
and/or severity of losses due to identified risks. In risk management, two types of probability
distribution are used: empirical and theoretical. To form an empirical probability distribution,
the risk manager actually observes the events that occur, as explained in the previous
section. To create a theoretical probability distribution, a mathematical formula is used. To
effectively use such distributions, the risk manager must be reasonably confident that the
distribution of the firm‘s losses is similar to the theoretical distribution chosen. Three theoretical probability distributions that are widely used in risk management are: the
binomial, normal, and Poisson.