Embed Size (px)
Citation preview
ABSTRACT
Title Of Dissertation: PREFETCHING VS THE MEMORY SYSTEM : OPTIMIZATIONSFOR MULTI-CORE SERVER PLATFORMS
Sadagopan Srinivasan, Doctor of Philosophy, 2007
Dissertation Directed by: Professor Bruce JacobDepartment of Electrical and Computer Engineering
This dissertation investigates prefetching scheme for servers with respect to realistic
memory systems. A large body of research work has been done in prefetching, even for
server workloads that have sparse locality. Real systems disable prefetching in server set-
tings, suggesting that there is a fundamental disconnect between research and practice.
Our theory, a major point of this thesis, is that this disconnect is due to the use of simplis-
tic memory models — and our experimental results show that, among other things, using
simplistic models can over-predict the system performance by up to 65%. Our investiga-
tion proceeds as follows:
• (In)Accuracy of Simplistic Memory Models. We demonstrate the degrees of
inaccuracy of models commonly used in system design: in particular, simple mod-
els are reasonably accurate when applied to simple systems (e.g. uniprocessors),
but they become increasingly inaccurate as the level of complexity of the system
grows — as cores are added, and as prefetching is added.
• Memory side prefetching. We then perform a detailed case study of a well known
server oriented prefetch scheme — memory-side sequential prefetch — to
develop understanding of the interaction between prefetch scheme and memory
systems. In particular, we find that the projected performance gains fail to materi-
alize due to the lack of locality in the server benchmarks and the bandwidth con-
straints introduced by the prefetch requests. We conclude that prefetching studies
so far have been using the wrong metric to gauge idleness of the memory sub-
system and consequently saturate the bus with prefetch requests.
• Multi-core Server Prefetching. We use our newfound understanding of prefetch
and memory systems interplay to develop a novel scheme for prefetching in
server platforms that does interact well with real memory systems. We find that
tuning the aggressiveness of prefetching to the average memory latency, which
depends on the available bandwidth, performs the best in server platforms.
PREFETCHING vs MEMORY SYSTEM : OPTIMIZATIONS FOR MULTI-CORE
SERVER PLATFORMS
by
Sadagopan Srinivasan
Dissertation submitted to the Faculty of the Graduate School of theUniversity of Maryland, College Park in partial fulfillment
of the requirements for the degree ofDoctor of Philosophy
2007
Advisory Committee:
Professor Bruce Jacob, ChairProfessor Manoj FranklinProfessor Gang QuProfessor Chau-Wen TsengDr. Li Zhao

ii
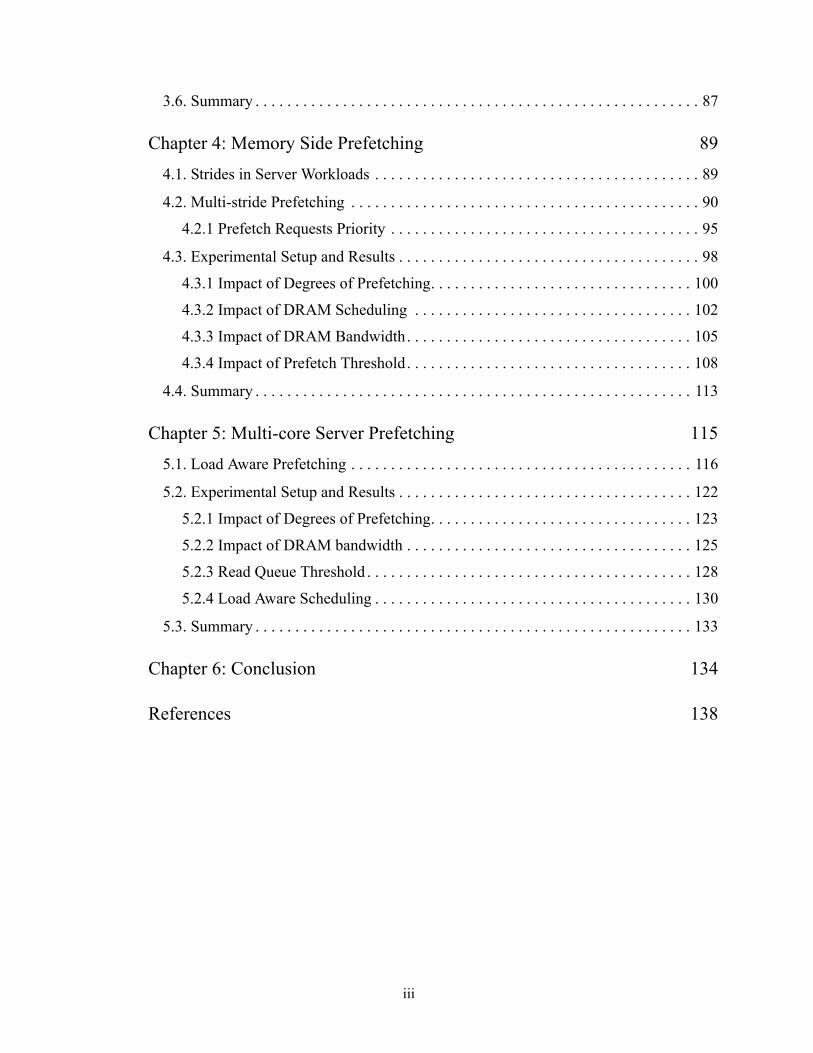
TABLE OF CONTENTS
List of Tables iv
List of Figures v
Chapter 1: Introduction 11.1. Motivation. . . . . . . . . . . . . . . . . . . . . . . . . . . . . . . . . . . . . . . . . . . . . . . . . . . . . . . . 1
1.2. Problem . . . . . . . . . . . . . . . . . . . . . . . . . . . . . . . . . . . . . . . . . . . . . . . . . . . . . . . . . . 1
1.3. Contributions and Significance. . . . . . . . . . . . . . . . . . . . . . . . . . . . . . . . . . . . . . . 11
1.4. Organization of Dissertation . . . . . . . . . . . . . . . . . . . . . . . . . . . . . . . . . . . . . . . . . 12
Chapter 2: Related Work 132.1. Performance Optimizations for the Memory Sub-System . . . . . . . . . . . . . . . . . . 13
2.1.1 Embedded systems optimizations . . . . . . . . . . . . . . . . . . . . . . . . . . . . . . . . . 14
2.1.2 General purpose systems optimizations . . . . . . . . . . . . . . . . . . . . . . . . . . . . . 16
2.2. Power Optimizations. . . . . . . . . . . . . . . . . . . . . . . . . . . . . . . . . . . . . . . . . . . . . . . 29
2.3. Commercial Memory Controllers . . . . . . . . . . . . . . . . . . . . . . . . . . . . . . . . . . . . . 33
2.4. Embedded DRAM Architectures . . . . . . . . . . . . . . . . . . . . . . . . . . . . . . . . . . . . . 35
2.5. Accurate Architectural Models . . . . . . . . . . . . . . . . . . . . . . . . . . . . . . . . . . . . . . . 38
Chapter 3: Simplistic Memory Models 413.1. Simulation Methodology. . . . . . . . . . . . . . . . . . . . . . . . . . . . . . . . . . . . . . . . . . . . 41
3.1.1 Multi-core Architecture . . . . . . . . . . . . . . . . . . . . . . . . . . . . . . . . . . . . . . . . . 41
3.1.2 Simulator . . . . . . . . . . . . . . . . . . . . . . . . . . . . . . . . . . . . . . . . . . . . . . . . . . . . 42
3.2. Benchmarks. . . . . . . . . . . . . . . . . . . . . . . . . . . . . . . . . . . . . . . . . . . . . . . . . . . . . . 53
3.3. Simplistic Memory Models. . . . . . . . . . . . . . . . . . . . . . . . . . . . . . . . . . . . . . . . . . 54
3.4. Performance comparison of memory models . . . . . . . . . . . . . . . . . . . . . . . . . . . . 57
3.4.1 Average Memory Latency Behavior . . . . . . . . . . . . . . . . . . . . . . . . . . . . . . . 72
3.5. Comparison with prefetching optimization. . . . . . . . . . . . . . . . . . . . . . . . . . . . . . 77
3.5.1 Performance Comparison. . . . . . . . . . . . . . . . . . . . . . . . . . . . . . . . . . . . . . . . 79
3.5.2 Latency Comparison . . . . . . . . . . . . . . . . . . . . . . . . . . . . . . . . . . . . . . . . . . . 83
iii
3.6. Summary . . . . . . . . . . . . . . . . . . . . . . . . . . . . . . . . . . . . . . . . . . . . . . . . . . . . . . . . 87
Chapter 4: Memory Side Prefetching 894.1. Strides in Server Workloads . . . . . . . . . . . . . . . . . . . . . . . . . . . . . . . . . . . . . . . . . 89
4.2. Multi-stride Prefetching . . . . . . . . . . . . . . . . . . . . . . . . . . . . . . . . . . . . . . . . . . . . 90
4.2.1 Prefetch Requests Priority . . . . . . . . . . . . . . . . . . . . . . . . . . . . . . . . . . . . . . . 95
4.3. Experimental Setup and Results . . . . . . . . . . . . . . . . . . . . . . . . . . . . . . . . . . . . . . 98
4.3.1 Impact of Degrees of Prefetching. . . . . . . . . . . . . . . . . . . . . . . . . . . . . . . . . 100
4.3.2 Impact of DRAM Scheduling . . . . . . . . . . . . . . . . . . . . . . . . . . . . . . . . . . . 102
4.3.3 Impact of DRAM Bandwidth. . . . . . . . . . . . . . . . . . . . . . . . . . . . . . . . . . . . 105
4.3.4 Impact of Prefetch Threshold. . . . . . . . . . . . . . . . . . . . . . . . . . . . . . . . . . . . 108
4.4. Summary . . . . . . . . . . . . . . . . . . . . . . . . . . . . . . . . . . . . . . . . . . . . . . . . . . . . . . . 113
Chapter 5: Multi-core Server Prefetching 1155.1. Load Aware Prefetching . . . . . . . . . . . . . . . . . . . . . . . . . . . . . . . . . . . . . . . . . . . 116
5.2. Experimental Setup and Results . . . . . . . . . . . . . . . . . . . . . . . . . . . . . . . . . . . . . 122
5.2.1 Impact of Degrees of Prefetching. . . . . . . . . . . . . . . . . . . . . . . . . . . . . . . . . 123
5.2.2 Impact of DRAM bandwidth . . . . . . . . . . . . . . . . . . . . . . . . . . . . . . . . . . . . 125
5.2.3 Read Queue Threshold . . . . . . . . . . . . . . . . . . . . . . . . . . . . . . . . . . . . . . . . . 128
5.2.4 Load Aware Scheduling . . . . . . . . . . . . . . . . . . . . . . . . . . . . . . . . . . . . . . . . 130
5.3. Summary . . . . . . . . . . . . . . . . . . . . . . . . . . . . . . . . . . . . . . . . . . . . . . . . . . . . . . . 133
Chapter 6: Conclusion 134
References 138
iv
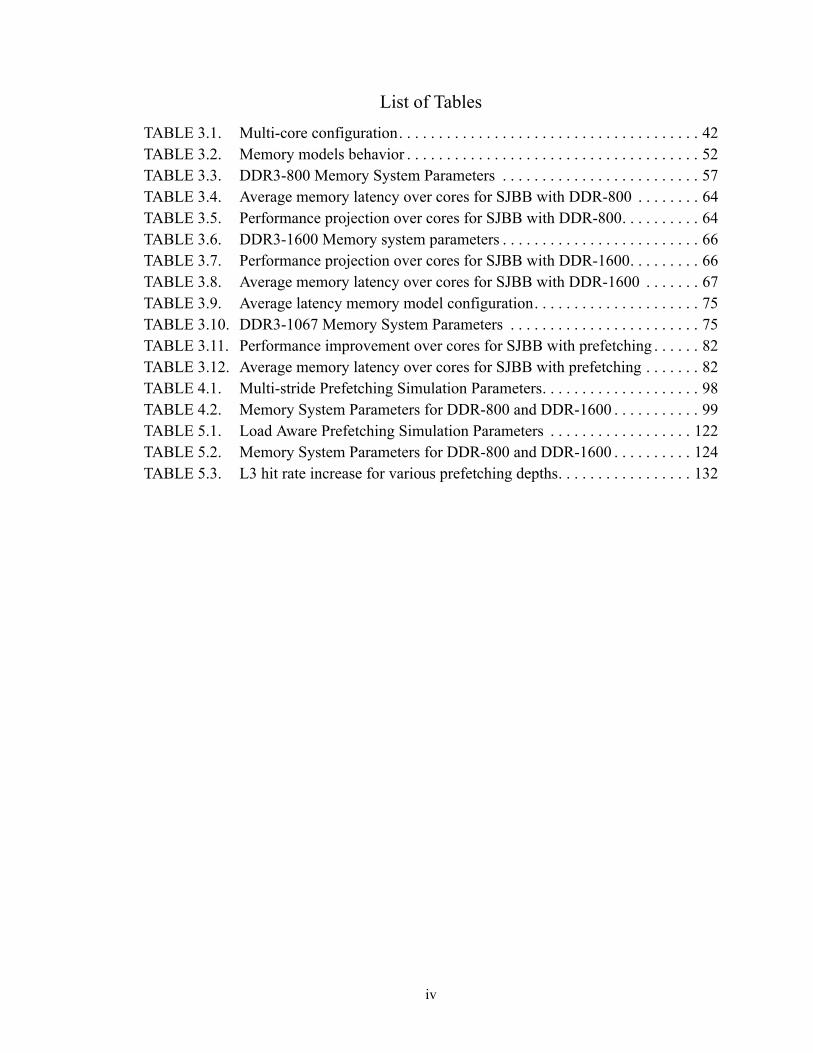
List of TablesTABLE 3.1. Multi-core configuration. . . . . . . . . . . . . . . . . . . . . . . . . . . . . . . . . . . . . . 42TABLE 3.2. Memory models behavior . . . . . . . . . . . . . . . . . . . . . . . . . . . . . . . . . . . . . 52TABLE 3.3. DDR3-800 Memory System Parameters . . . . . . . . . . . . . . . . . . . . . . . . . 57TABLE 3.4. Average memory latency over cores for SJBB with DDR-800 . . . . . . . . 64TABLE 3.5. Performance projection over cores for SJBB with DDR-800. . . . . . . . . . 64TABLE 3.6. DDR3-1600 Memory system parameters . . . . . . . . . . . . . . . . . . . . . . . . . 66TABLE 3.7. Performance projection over cores for SJBB with DDR-1600. . . . . . . . . 66TABLE 3.8. Average memory latency over cores for SJBB with DDR-1600 . . . . . . . 67TABLE 3.9. Average latency memory model configuration. . . . . . . . . . . . . . . . . . . . . 75TABLE 3.10. DDR3-1067 Memory System Parameters . . . . . . . . . . . . . . . . . . . . . . . . 75TABLE 3.11. Performance improvement over cores for SJBB with prefetching . . . . . . 82TABLE 3.12. Average memory latency over cores for SJBB with prefetching . . . . . . . 82TABLE 4.1. Multi-stride Prefetching Simulation Parameters. . . . . . . . . . . . . . . . . . . . 98TABLE 4.2. Memory System Parameters for DDR-800 and DDR-1600 . . . . . . . . . . . 99TABLE 5.1. Load Aware Prefetching Simulation Parameters . . . . . . . . . . . . . . . . . . 122TABLE 5.2. Memory System Parameters for DDR-800 and DDR-1600 . . . . . . . . . . 124TABLE 5.3. L3 hit rate increase for various prefetching depths. . . . . . . . . . . . . . . . . 132
v
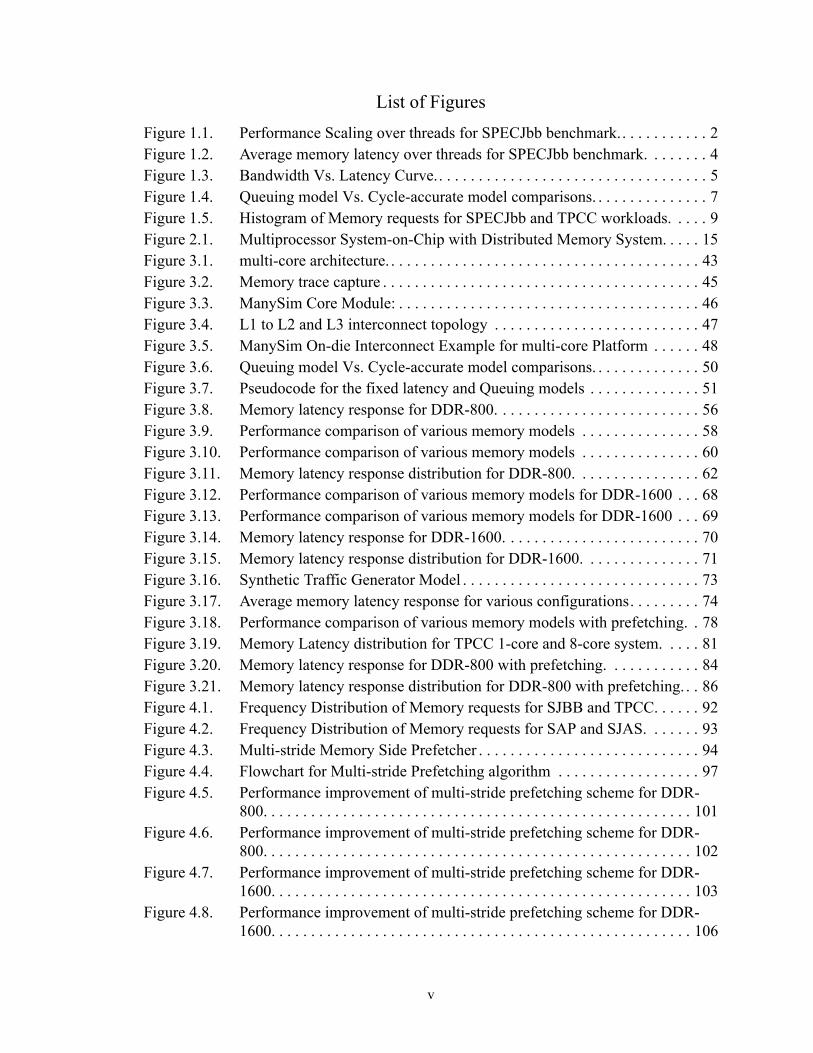
List of FiguresFigure 1.1. Performance Scaling over threads for SPECJbb benchmark.. . . . . . . . . . . 2Figure 1.2. Average memory latency over threads for SPECJbb benchmark. . . . . . . . 4Figure 1.3. Bandwidth Vs. Latency Curve.. . . . . . . . . . . . . . . . . . . . . . . . . . . . . . . . . . 5Figure 1.4. Queuing model Vs. Cycle-accurate model comparisons. . . . . . . . . . . . . . . 7Figure 1.5. Histogram of Memory requests for SPECJbb and TPCC workloads. . . . . 9Figure 2.1. Multiprocessor System-on-Chip with Distributed Memory System. . . . . 15Figure 3.1. multi-core architecture. . . . . . . . . . . . . . . . . . . . . . . . . . . . . . . . . . . . . . . . 43Figure 3.2. Memory trace capture . . . . . . . . . . . . . . . . . . . . . . . . . . . . . . . . . . . . . . . . 45Figure 3.3. ManySim Core Module: . . . . . . . . . . . . . . . . . . . . . . . . . . . . . . . . . . . . . . 46Figure 3.4. L1 to L2 and L3 interconnect topology . . . . . . . . . . . . . . . . . . . . . . . . . . 47Figure 3.5. ManySim On-die Interconnect Example for multi-core Platform . . . . . . 48Figure 3.6. Queuing model Vs. Cycle-accurate model comparisons. . . . . . . . . . . . . . 50Figure 3.7. Pseudocode for the fixed latency and Queuing models . . . . . . . . . . . . . . 51Figure 3.8. Memory latency response for DDR-800. . . . . . . . . . . . . . . . . . . . . . . . . . 56Figure 3.9. Performance comparison of various memory models . . . . . . . . . . . . . . . 58Figure 3.10. Performance comparison of various memory models . . . . . . . . . . . . . . . 60Figure 3.11. Memory latency response distribution for DDR-800. . . . . . . . . . . . . . . . 62Figure 3.12. Performance comparison of various memory models for DDR-1600 . . . 68Figure 3.13. Performance comparison of various memory models for DDR-1600 . . . 69Figure 3.14. Memory latency response for DDR-1600. . . . . . . . . . . . . . . . . . . . . . . . . 70Figure 3.15. Memory latency response distribution for DDR-1600. . . . . . . . . . . . . . . 71Figure 3.16. Synthetic Traffic Generator Model . . . . . . . . . . . . . . . . . . . . . . . . . . . . . . 73Figure 3.17. Average memory latency response for various configurations. . . . . . . . . 74Figure 3.18. Performance comparison of various memory models with prefetching. . 78Figure 3.19. Memory Latency distribution for TPCC 1-core and 8-core system. . . . . 81Figure 3.20. Memory latency response for DDR-800 with prefetching. . . . . . . . . . . . 84Figure 3.21. Memory latency response distribution for DDR-800 with prefetching. . . 86Figure 4.1. Frequency Distribution of Memory requests for SJBB and TPCC. . . . . . 92Figure 4.2. Frequency Distribution of Memory requests for SAP and SJAS. . . . . . . 93Figure 4.3. Multi-stride Memory Side Prefetcher . . . . . . . . . . . . . . . . . . . . . . . . . . . . 94Figure 4.4. Flowchart for Multi-stride Prefetching algorithm . . . . . . . . . . . . . . . . . . 97Figure 4.5. Performance improvement of multi-stride prefetching scheme for DDR-
800. . . . . . . . . . . . . . . . . . . . . . . . . . . . . . . . . . . . . . . . . . . . . . . . . . . . . . 101Figure 4.6. Performance improvement of multi-stride prefetching scheme for DDR-
800. . . . . . . . . . . . . . . . . . . . . . . . . . . . . . . . . . . . . . . . . . . . . . . . . . . . . . 102Figure 4.7. Performance improvement of multi-stride prefetching scheme for DDR-
1600. . . . . . . . . . . . . . . . . . . . . . . . . . . . . . . . . . . . . . . . . . . . . . . . . . . . . 103Figure 4.8. Performance improvement of multi-stride prefetching scheme for DDR-
1600. . . . . . . . . . . . . . . . . . . . . . . . . . . . . . . . . . . . . . . . . . . . . . . . . . . . . 106
vi
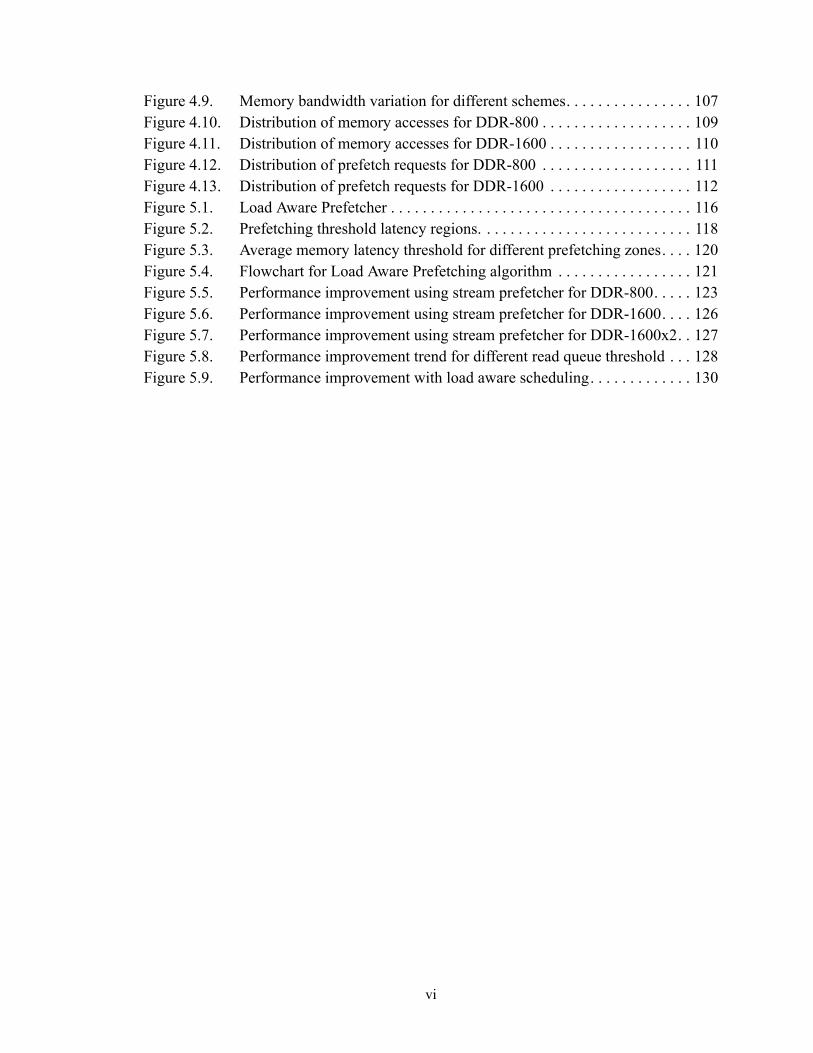
Figure 4.9. Memory bandwidth variation for different schemes. . . . . . . . . . . . . . . . 107Figure 4.10. Distribution of memory accesses for DDR-800 . . . . . . . . . . . . . . . . . . . 109Figure 4.11. Distribution of memory accesses for DDR-1600 . . . . . . . . . . . . . . . . . . 110Figure 4.12. Distribution of prefetch requests for DDR-800 . . . . . . . . . . . . . . . . . . . 111Figure 4.13. Distribution of prefetch requests for DDR-1600 . . . . . . . . . . . . . . . . . . 112Figure 5.1. Load Aware Prefetcher . . . . . . . . . . . . . . . . . . . . . . . . . . . . . . . . . . . . . . 116Figure 5.2. Prefetching threshold latency regions. . . . . . . . . . . . . . . . . . . . . . . . . . . 118Figure 5.3. Average memory latency threshold for different prefetching zones. . . . 120Figure 5.4. Flowchart for Load Aware Prefetching algorithm . . . . . . . . . . . . . . . . . 121Figure 5.5. Performance improvement using stream prefetcher for DDR-800. . . . . 123Figure 5.6. Performance improvement using stream prefetcher for DDR-1600. . . . 126Figure 5.7. Performance improvement using stream prefetcher for DDR-1600x2. . 127Figure 5.8. Performance improvement trend for different read queue threshold . . . 128Figure 5.9. Performance improvement with load aware scheduling. . . . . . . . . . . . . 130
1
Chapter 1: Introduction1.1. Motivation
Prefetching has been proposed as one of the important solutions to hide memory
latency in systems. Numerous prefetching schemes have been proposed, both hardware and
software, targeting regular/irregular spatial locality [1][2]. Almost all of these prefetching
techniques have been studied from a single core perspective, and most of them use simplis-
tic memory models [3][4]. In spite of the performance improvement shown by the vast
amount of prefetching research, prefetching is disabled in servers due to their lack of local-
ity [personal experience in Intel][5].
The increased number of cores in modern chips and lack of locality in servers has
further aggravated the memory wall problem. A memory-side prefetching scheme pro-
posed by others was shown to improve the performance for server workloads, but our
results prove otherwise. Though aggressive and novel prefetching methods have been pro-
posed for workloads that lack locality, these results don’t translate to actual performance
gain in a real system, due to the use of inaccurate memory models in these studies. Simplis-
tic memory models which worked well for uni-processor systems can’t handle the com-
plexity of the multi-core systems that have more bandwidth constraints and increased
contention among requests.
1.2. Problem
The scaling limitations of uni-processors and availability of a large silicon area due
to reduced transistor size has led to an increased number of cores on a chip. The cost of
extracting more instruction level parallelism (ILP) from a single thread/core is becoming
2
expensive due to complex logic, wider issue width, and more accurate branch predictors.
These factors have fueled the growth of chip multi-processors (CMPs), also known as
multi-core processors which extract ILP using simpler, less costly means. This is the cur-
rent trend in the performance growth of processors. These complex CMPs are becoming
the ubiqitous architecture for commercial servers targeting throughput-oriented applica-
tions [6].
The emergence of CMPs has led to increased exploitation of thread-level parallel-
ism. Furthermore, independent processes in a system can be executed in tandem on differ-
ent cores for faster response time and to improve overall throughput. The simultaneous
execution of multiple processes/threads increases the memory bandwidth demand, i.e, the
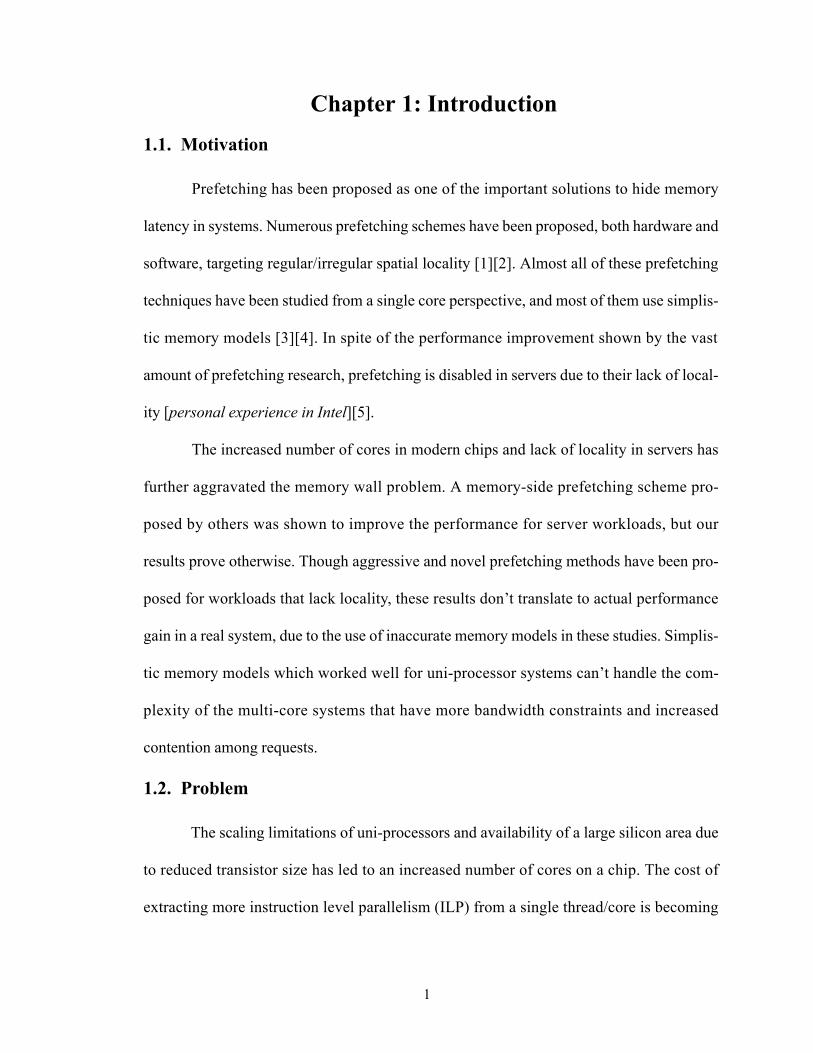
increased number of cores aggravates the memory wall problem.
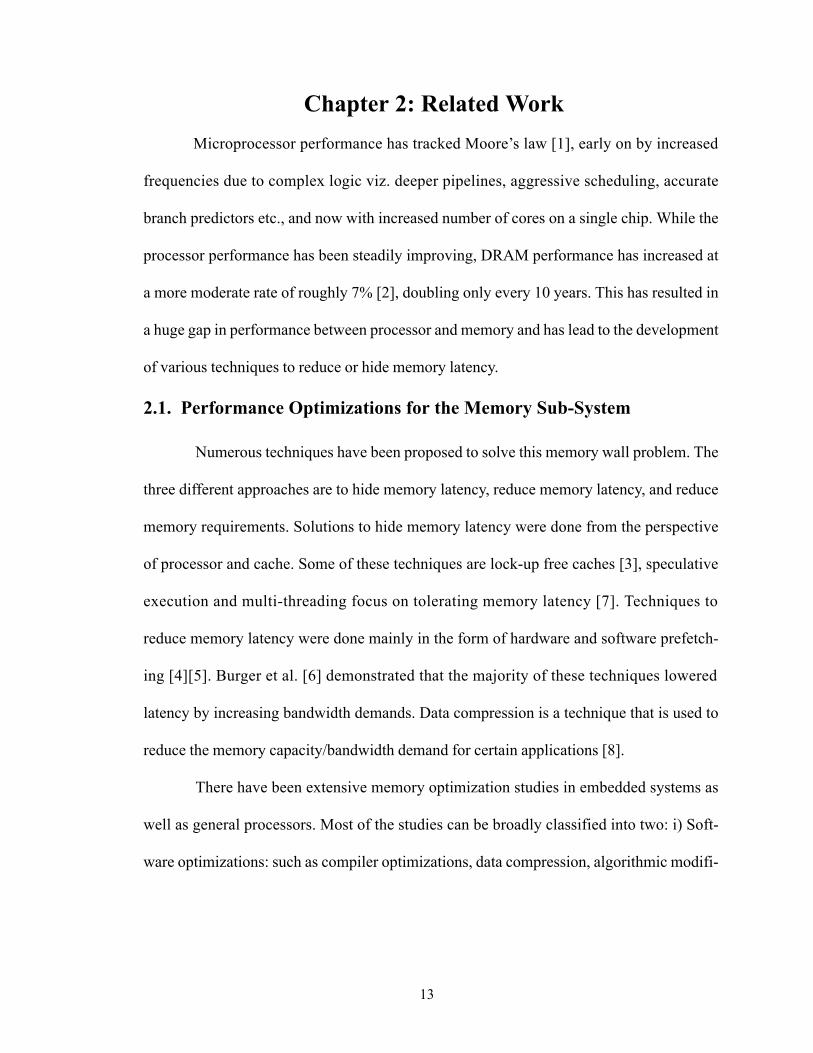
Figure 1.1. Performance Scaling over threads for SPECJbb benchmark. Thisfigure shows the performance improvement for various number of threads for SPECJbbserver workload. The threads were increased from 8 to 128 and the cache sizes werescaled proportionately. The dotted line shows the ideal performance possible in anunlimited bandwidth system.
0
2
4
6
8
10
12
14
16
0 32 64 96 128
Number of Threads
Norm
aliz
ed P
erfo
rman
ce
16 8
Performance constrained by BW
Ideal Performance
Performance constrained by BW
Ideal Performance
3
To illustrate this unfortunate side effect refer to Figure 1.1, which shows the perfor-
mance scaling of a server workload for various number of threads. This study was under-
taken for a SPECJbb benchmark. SPECjbb (Java Server Benchmark) is SPEC's benchmark
for evaluating the performance of server side Java. SPECjbb evaluates the performance of
server side Java by emulating a three-tier client/server system (with emphasis on the mid-
dle tier). The benchmark exercises the implementations of the JVM (Java Virtual
Machine), JIT (Just-In-Time) compiler, garbage collection, threads, and some aspects of
the operating system. The threads in SPECJbb benchmark are separate warehouses that are
spawned independent of each other. It is similar to independent search queries in databases.
Our study is based on instruction traces collected from a Pentium 4 machine using
SoftSDV [7]. The system under observation had three levels of cache. We varied the num-
ber of threads from 8 to 128. [Note: here thread refers to independent cores]. Each thread
had its private L1 cache of 16KB (separate instruction and data cache), and every 8 threads
shared a 512KB L2 cache. All the threads shared the last level cache (L3), which was
increased proportionally from 2MB to 32MB for 8 to 128 threads. The maximum available
memory bandwidth was set to 52 GB/sec. for all configurations.
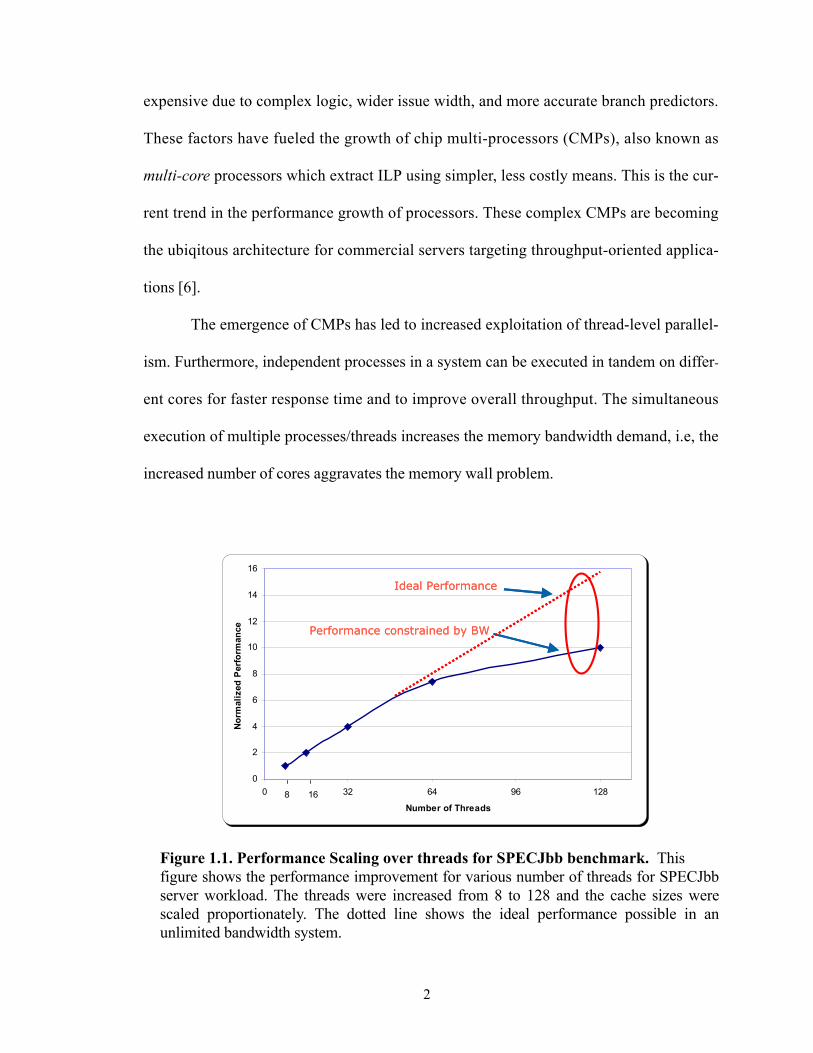
We see that the performance of the system scales linearly from 8 threads to 16 and
thereon to 32 as shown in Figure 1.1. Beyond 32 threads, performance of the system tapers
off. This is because of the increased average memory latency of the system as shown in
Figure 1.2. The average memory latency increases with the requested bandwidth of the sys-
tem. The memory latency increases exponentially, as explained below, for a large number
of threads [greater than or equal to 64 in this case]. This contributes to the non-linear
increase of system performance with the number of threads.
4
Since all other factors such as cache sizes are scaled proportionally, our obvious
conclusion is that the memory bandwidth can significantly limit the performance of multi-
core systems. The performance of future multi-core systems will scale only with the avail-
able memory bandwidth.
The DRAM latency can be divided into two parts i) Idle Latency and ii) Contention
Latency. Idle latency is the round trip time for a memory request with no other request in
the memory controller. Contention latency is the overhead which a memory request experi-
ences due to other requests pending in the memory controller. This can be due to write-to-
read turn around time, read-to-write turn around time, switching between ranks and
DIMMs, etc.
Figure 1.2. Average memory latency over threads for SPECJbb benchmark. Thisfigure shows the average memory latency for various number of threads for SPECJbbserver workload. The threads were increased from 8 to 128 and the cache sizes werescaled proportionately. The latency increases linearly at the lower end of the spectrumand becomes exponential at the higher end of number of threads.
5
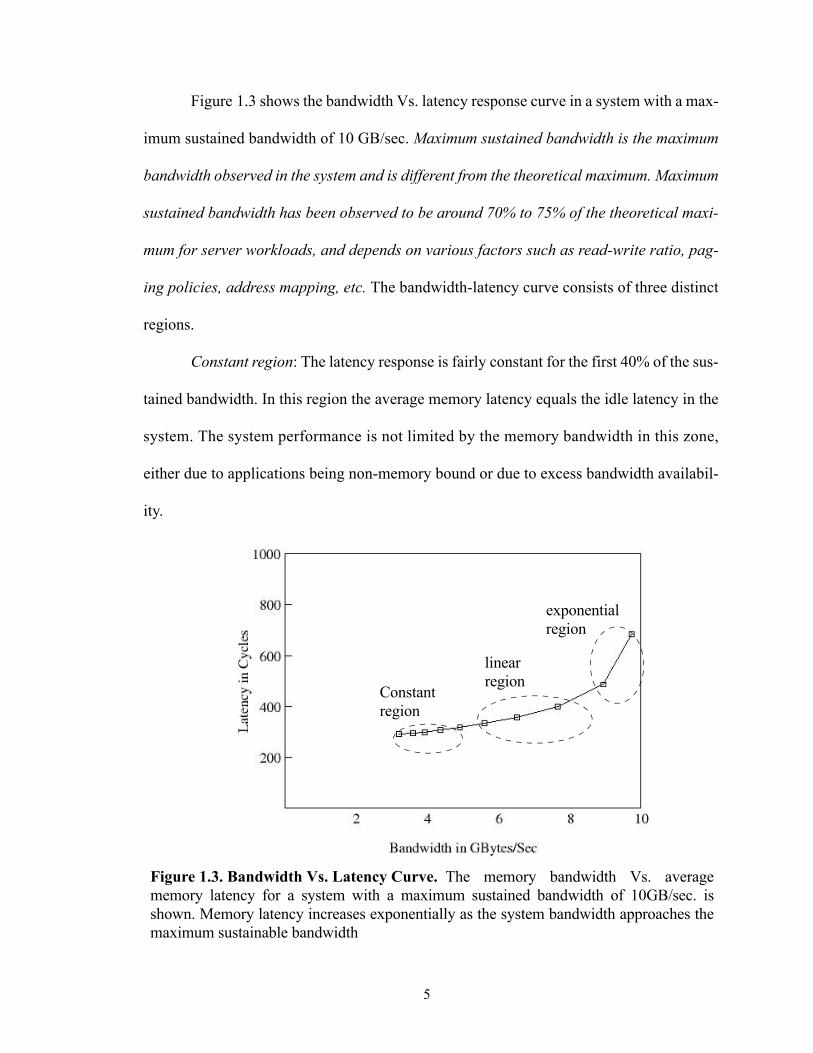
Figure 1.3 shows the bandwidth Vs. latency response curve in a system with a max-
imum sustained bandwidth of 10 GB/sec. Maximum sustained bandwidth is the maximum
bandwidth observed in the system and is different from the theoretical maximum. Maximum
sustained bandwidth has been observed to be around 70% to 75% of the theoretical maxi-
mum for server workloads, and depends on various factors such as read-write ratio, pag-
ing policies, address mapping, etc. The bandwidth-latency curve consists of three distinct
regions.
Constant region: The latency response is fairly constant for the first 40% of the sus-
tained bandwidth. In this region the average memory latency equals the idle latency in the
system. The system performance is not limited by the memory bandwidth in this zone,
either due to applications being non-memory bound or due to excess bandwidth availabil-
ity.
Figure 1.3. Bandwidth Vs. Latency Curve. The memory bandwidth Vs. averagememory latency for a system with a maximum sustained bandwidth of 10GB/sec. isshown. Memory latency increases exponentially as the system bandwidth approaches themaximum sustainable bandwidth
Constantregion
linearregion
exponentialregion
6
Linear region: In this region, the latency responses increases almost linearly with
the bandwidth demand of the system. This region is usually between 40% to 80% of the
sustained maximum. The average memory latency starts to increase due to contention over-
head introduced into the system by numerous memory requests. The performance degrada-
tion of the system starts in this zone, and the system is claimed to be fairly memory bound.
Exponential region: This is the last region of the bandwidth-latency curve. This
region exists between 80%-100% of the sustained maximum. In this zone the memory
latency is dominated by the contention latency, which can be two times the idle latency or
more. Applications operating in this region are completely memory bound, and their per-
formance is limited by the available memory bandwidth.
The above figure clearly illustrates the need for a system to operate in the constant
region or at worst the linear region. The need for a better memory system becomes even
more important as we go towards aggressive multi-core systems and simple models are
increasingly inaccurate in these scenarios.
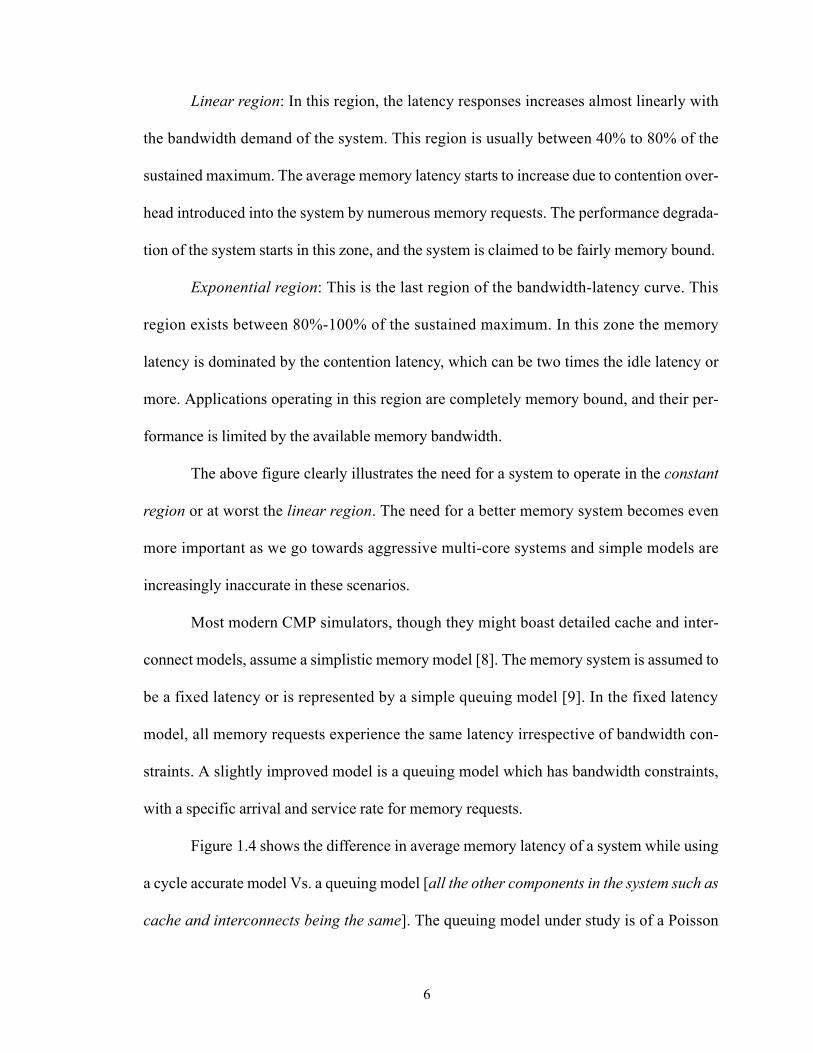
Most modern CMP simulators, though they might boast detailed cache and inter-
connect models, assume a simplistic memory model [8]. The memory system is assumed to
be a fixed latency or is represented by a simple queuing model [9]. In the fixed latency
model, all memory requests experience the same latency irrespective of bandwidth con-
straints. A slightly improved model is a queuing model which has bandwidth constraints,
with a specific arrival and service rate for memory requests.
Figure 1.4 shows the difference in average memory latency of a system while using
a cycle accurate model Vs. a queuing model [all the other components in the system such as
cache and interconnects being the same]. The queuing model under study is of a Poisson
7
distribution, i.e. the arrival and servicing of the memory requests are assumed to be at a
Poisson arrival rate. This model accurately constrains the bandwidth of the system. Both
models (cycle-accurate and queuing) were simulated for different system bandwidth
requirements with a maximum of 10 GB/sec. and the same idle latency.
We observed that the queuing model behaves close to the cycle-accurate model in
the constant region, but it does not capture the contention overhead accurately at other
regions. This results in the average memory latency of the system to be under-estimated by
up to 45% in a queuing model. In a fixed latency model the average memory latency would
be a straight line in the graph for all the bandwidth requirements. This would fare even
worse than a queuing model in depicting the memory controller accurately.
Figure 1.4. Queuing model Vs. Cycle-accurate model comparisons. This graphcompares the memory latency behavior of a cycle accurate model with a queuing modelfor various bandwidths. The x-axis represents the various sustained bandwidths of thesystem and y-axis denotes the average memory latency corresponding to it. The queuingmodel assumes a poisson arrival and service rate.
8
Our results show that the performance difference between the two models can be as
high as 15% in a multi-core system with eight cores. This performance difference increases
with increased bandwidth requirement of the system and can go up to 65% for memory
optimization studies, such as prefetching. This can lead to artificial improvement in perfor-
mance while using a simplistic model, but it will not result in true performance gain in an
actual system which will have a cycle-accurate model. This behavior can lead to wrongful
conclusions about certain optimization techniques and result in substandard products.
We also show that, irrespective of memory optimization techniques, using a queu-
ing model or a simple latency model can result in incorrect performance projections for
multi-core systems. We observed that the difference in IPC between simple latency model
and cycle-accurate model (with rest of the system being same for both models) is 2% for a
single core and increases to 15% for 8 cores. This can lead to incorrect conclusions about
performance gains as the number of cores is increased.
Memory side prefetching is a concept wherein the prefetched data is stored in a
small buffer that resides in the memory controller. Studies show that memory side prefetch-
ing complements the processor side prefetching and is independent of it. This has been
shown to perform well even for workloads that lack locality [5]. Earlier studies were
mainly focused on stream based prefetchers. Our studies show that memory access patterns
are not strictly sequential and have few strides repeated.
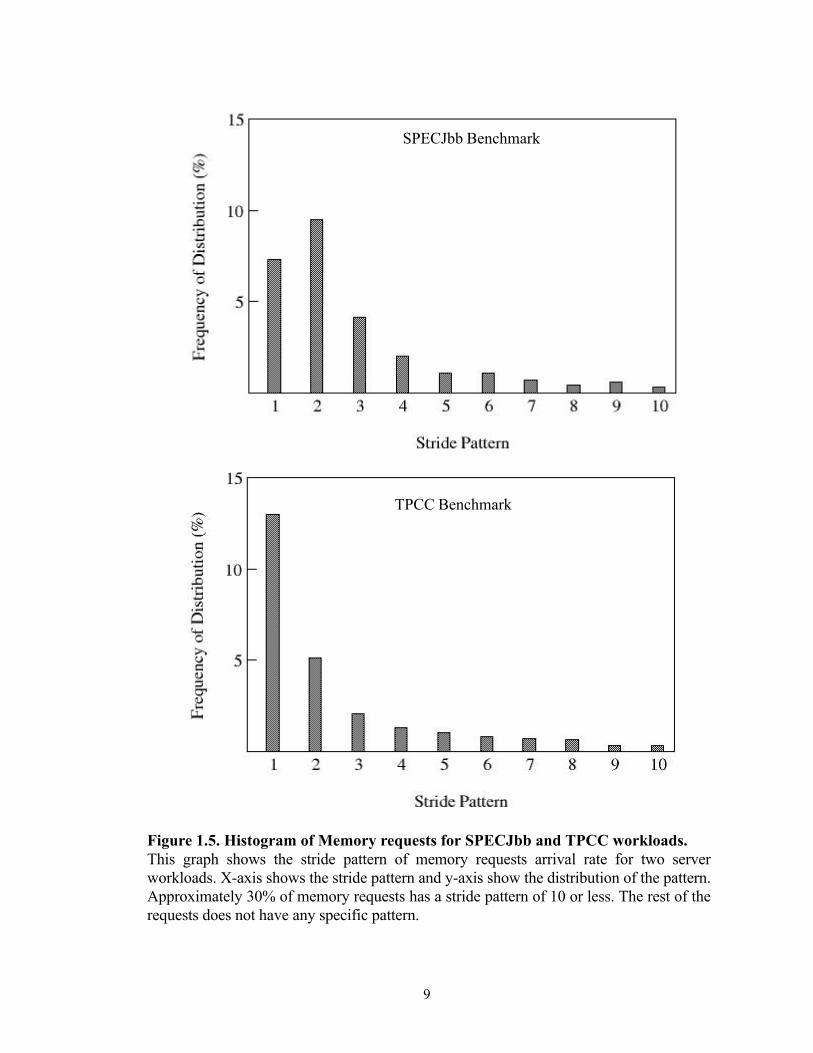
Figure 1.5 shows the histogram of memory requests stride pattern for SPECJbb and
TPCC benchmarks. SPECJbb benchmark has 10% of its memory requests with a stride
length of 2, 5% of its requests with a length of 3 and 7% with a length of 1. On-line transac-
9
SPECJbb Benchmark
TPCC Benchmark
Figure 1.5. Histogram of Memory requests for SPECJbb and TPCC workloads. This graph shows the stride pattern of memory requests arrival rate for two serverworkloads. X-axis shows the stride pattern and y-axis show the distribution of the pattern.Approximately 30% of memory requests has a stride pattern of 10 or less. The rest of therequests does not have any specific pattern.
10
tion processing (OLTP) benchmark TPCC has 13% of its memory requests with a stride
length of 1, 5% with a stride length of 2, and 3% with a stride length of 4 and 5. Approxi-
mately 30% of memory requests have a stride pattern of 10 or less. This distribution shows
that there isn’t much locality/regularity in server workloads. These systems need aggres-
sive prefetching schemes, not simple sequential schemes, to achieve significant improve-
ment in performance.
Our studies show that, instead of the expected 15% gain, the actual performance
benefit obtained from memory side prefetching is about 6% due to irregular spatial locality
in server workloads such as SPECJbb, SPECJapp, TPCC etc. We also observed that the
performance of the system degraded as the prefetching aggressiveness was increased. This
was due to the system operating in the exponential region instead of constant or linear
region in the bandwidth-latency curve. This increased the average memory latency
response and correspondingly decreased the system performance. Our results project
smaller gains compared to other works in terms of performance improvement obtained
using memory side prefetchers. Further, we also found that scheduling algorithms proposed
in [5] doesn’t perform as well as in multi-core systems.
Our solution to the memory wall problem in servers is a novel concept called load
aware prefetching. Aggressive prefetching schemes can be used to reduce the memory
latency of applications that lack regular spatial locality. This improves the performance of
the system at the cost of increased memory bandwidth. This worsens the situation in a
memory bandwidth constrained system such as CMPs, where multiple cores are trying to
access the memory at the same time. The existing prefetching solutions try to hide the
memory latency without considering the impact of memory bandwidth.
11
We propose a solution which controls the aggressiveness of the prefetching based
on the average memory latency. Our approach exploits the relationship between the band-
width requirement and the observed latency of the system. We observed that aggressive
prefetching without bandwidth constraints can degrade the performance by up to almost
65% compared to a no-prefetching scheme. This is due to the system operating in the expo-
nential region of the bandwidth-latency curve. Our solution varied the aggressiveness of
the prefetching scheme based on the latency and ensured that the prefetching requests were
issued only during the constant or linear region of bandwidth-latency curve. By varying
the aggressiveness we were able to improve the performance by up to 15% when there was
sufficient bandwidth available in the system compared to a no-prefetching scheme. Our
solution improves the performance of the system and also guarantees no performance deg-
radation in a bandwidth constrained system.
1.3. Contributions and Significance
This dissertation consists of three major inter-related studies. First, we performed a
detailed study on the accuracy of various simplistic memory models and compared their
performance against a cycle accurate memory system (including bus interface unit, con-
troller, and DRAMs) in multi-core environment. In this study we showed the limitations of
the simplistic models and highlighted the wrongful conclusions that can be obtained using
them.
Secondly, we showed the performance benefits of a multi-stride prefetcher imple-
mented as a memory side prefetching mechanism for server workloads. This study is an
extension of the proposed adaptive steam detection scheme. We extended the idea to handle
strides, which are predominant in server workloads, in a multi-core system.
12
Third, we proposed a novel load aware prefetching algorithm to handle the band-
width constraints in a multi-core system. This solution controls the aggressiveness of the
prefetcher based on the available bandwidth in the system. This scheme can improve the
performance by prefetching aggressively when the system is operating in the linear/con-
stant region of the bandwidth-latency curve and reducing the prefetching when it is operat-
ing in the exponential region of the curve.
1.4. Organization of Dissertation
This dissertation is organized as follows. Chapter 2 describes the related work done
in the CMP memory systems area both in academia and industry. Chapter 3 describes the
necessity of cycle-accurate memory models for multi-core systems and describes in detail
various issues that arises due to using simple latency or queuing model. Chapter 4 discusses
the multi-stride memory side prefetching for server workloads and its performance impact.
Chapter 5 describes the load aware prefetching optimization technique that we explored to
improve the performance of multi-core systems with various available memory band-
widths. Chapter 6 summarizes the final conclusions of this dissertation.
13
Chapter 2: Related WorkMicroprocessor performance has tracked Moore’s law [1], early on by increased
frequencies due to complex logic viz. deeper pipelines, aggressive scheduling, accurate
branch predictors etc., and now with increased number of cores on a single chip. While the
processor performance has been steadily improving, DRAM performance has increased at
a more moderate rate of roughly 7% [2], doubling only every 10 years. This has resulted in
a huge gap in performance between processor and memory and has lead to the development
of various techniques to reduce or hide memory latency.
2.1. Performance Optimizations for the Memory Sub-System
Numerous techniques have been proposed to solve this memory wall problem. The
three different approaches are to hide memory latency, reduce memory latency, and reduce
memory requirements. Solutions to hide memory latency were done from the perspective
of processor and cache. Some of these techniques are lock-up free caches [3], speculative
execution and multi-threading focus on tolerating memory latency [7]. Techniques to
reduce memory latency were done mainly in the form of hardware and software prefetch-
ing [4][5]. Burger et al. [6] demonstrated that the majority of these techniques lowered
latency by increasing bandwidth demands. Data compression is a technique that is used to
reduce the memory capacity/bandwidth demand for certain applications [8].
There have been extensive memory optimization studies in embedded systems as
well as general processors. Most of the studies can be broadly classified into two: i) Soft-
ware optimizations: such as compiler optimizations, data compression, algorithmic modifi-
14
cations, etc., and ii) Hardware optimizations: such as changes to the memory controller,
scheduling policies, DRAM subsystem, etc.
2.1.1 Embedded systems optimizations
Yang et al. estimate the memory usage of the embedded application and perform
algorithm level optimization in [9]. This paper describes a methodology for memory analy-
sis and optimization of embedded system design with the goal of reducing memory usage.
The paper illustrates an efficient way to optimize the memory module of the embedded sys-
tems at design time. Panda et al. [10] have performed extensive studies of various memory
optimization techniques for embedded systems. They present a survey of the state-of-the-
art techniques used for data and memory related optimizations in embedded systems. They
investigate various schemes such as code transformation, dynamic memory allocation,
memory estimation, custom memory architecture etc. These optimizations are targeted
directly or indirectly at the memory subsystem and impact area, performance, and power
dissipation of the resulting implementation.
A compile time data remapping algorithm is discussed in [12]. This remapping
algorithm is an automatic approach applicable to pointer-intensive dynamic applications,
and is designed to reduce the energy consumption as well as memory size needed to meet a
user-specified performance goal. This is a static approach and is done using the compiler
during software design. Contrary to this, Vahid et al. [11] propose a three step approach of
memory tuning once the software has been developed. This work proposes functional sim-
ulation, trace based simulation and equation-based estimation for memory tuning with
regard to power and performance. Using the three step approach a tool developer can deter-
mine the best memory hierarchy for a particular embedded system.
15
All the ideas discussed so far propose solutions which involve significant changes
to the compiler, the algorithm, or both. Moreover, their objectives have been memory usage
reduction, memory hierarchy optimization, memory architecture customization etc. Our
work focuses on studying the impact of memory systems in a multi-core environment.
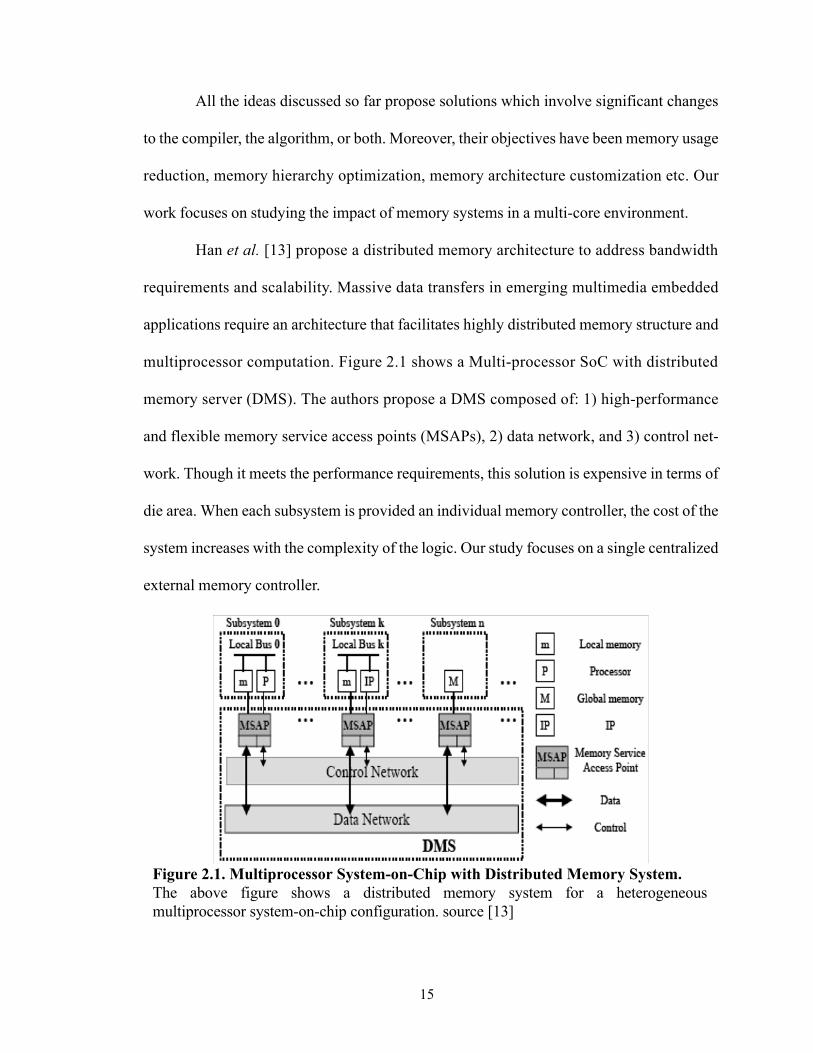
Han et al. [13] propose a distributed memory architecture to address bandwidth
requirements and scalability. Massive data transfers in emerging multimedia embedded
applications require an architecture that facilitates highly distributed memory structure and
multiprocessor computation. Figure 2.1 shows a Multi-processor SoC with distributed
memory server (DMS). The authors propose a DMS composed of: 1) high-performance
and flexible memory service access points (MSAPs), 2) data network, and 3) control net-
work. Though it meets the performance requirements, this solution is expensive in terms of
die area. When each subsystem is provided an individual memory controller, the cost of the
system increases with the complexity of the logic. Our study focuses on a single centralized
external memory controller.
Figure 2.1. Multiprocessor System-on-Chip with Distributed Memory System. The above figure shows a distributed memory system for a heterogeneousmultiprocessor system-on-chip configuration. source [13]
16
2.1.2 General purpose systems optimizations
This section deals with optimizations in general purpose systems. They are catego-
rized into three divisions based on techniques to reduce memory consumption, memory
controller performance optimization in terms of latency and bandwidth, and power optimi-
zations.
2.1.2.1 Data Compression
Data compression has been proposed to reduce the memory bandwidth require-
ment. Alameldeen and Wood show that cache compression can increase performance by
increasing effective cache capacity and eliminating misses [8]. Their adaptive policy
dynamically modifies the L2 cache to hold compressed or uncompressed data based on the
miss rate.
IBM’s MXT technology uses a real time memory compression that can effectively
double the capacity using a parallel algorithm. The parallel algorithm used in this paper
was Parallel Block-Referential Compression with Directory sharing, which divides each
input block into sub-blocks and constructs a dictionary while compressing all sub-blocks in
parallel [14].
X-Match hardware compression algorithm is used in [15] to reduce communication
bandwidth by compacting cache-to-memory address streams and data streams. This algo-
rithm maintains a dictionary and replaces each input data element with a shorter code in
case of a total or partial match with a dictionary entry.
A data compression/decompression scheme to reduce memory traffic is proposed
in [16]. This scheme stores compressed data in the cache and compresses/decompresses it
dynamically when the data is transferred from/to memory. The compression scheme used
17
in this study is based on the assumption that it is likely for data words in the same cache line
to have some common bits.
A compressed memory hierarchy that selectively compresses L2 cache and mem-
ory is proposed in [17]. This work uses the X-RL compression algorithm, a variant of X-
Match algorithm that treats zeros specially to reduce the memory requirements by a factor
of two.
Ahn et al. propose four compression algorithms to be used in a compressed cache
architecture [18]. These are variants of the X-Match algorithm, and their results show 10%
to almost 100% improvement in performance.
A dynamic cache partition scheme is proposed by Chen et al. in [19]. This scheme
partitions the cache into different sections based on the compressibility factor. Hallnor and
Reinhardt propose an indirect index cache to allocate variable amounts of storage to differ-
ent blocks depending on their compressibility. This method increases the effective cache
size by allocating unused compressed cache blocks to other blocks [20].
Yang and Gupta show that a small number of distinct values occupy a large fraction
of memory access values in SPECint 95 benchmarks [21]. This study has lead them to pro-
pose a “compression cache”, value centric cache design called Frequent Value Cache [22].
In this work, the authors show that a small direct mapped cache dedicated to holding fre-
quent benchmark values can reduce the cache miss rate. The Frequent Value Cache aug-
ment the performance along with the small direct-mapped cache.
2.1.2.2 Processor Side Prefetching Optimization
Processor side prefetching is done from the perspective of processor’s cache access
pattern. Prefetch requests are issued on a cache miss, and the prefetched data is usually
18
stored in the cache or in a prefetch buffer. Prefetching was proposed initially to reduce the
cache miss penalty by Smith in [23]. This study evaluates the type of prefetching with
respect to page size and memory size. They propose and implement prefetching methodol-
ogies to improve the performance of the system. Stream buffers, a similar concept to
prefetching, were proposed by Jouppi [24]. Stream buffers prefetch cache lines starting at a
cache miss address. The prefetched data is placed in a separate stream buffer and not in the
cache. Stream buffers are useful in removing capacity and compulsory misses, as well as
some instruction cache conflict misses. Dahlgren and Dubois further extend this idea to
shared memory multiprocessors in [26].
Stride directed prefetching to improve the cache performance of numerical pro-
grams executing on a vector was proposed in [27]. This study implements a simple hard-
ware mechanism called the stride prediction table to calculate the stride distances of array
accesses made from within the loop body of a program.
A modification of the above mentioned schemes is proposed by Ki and Knowles
[28]. Their study shows that for maximum effectiveness it is necessary to adapt the
prefetching parameters, such as prefetch offset and prefetch degree, to match programs and
system conditions. This work utilizes the usage of prefetched data and rate of replacement
of prefetched data to change the prefetching dynamically.
Dahlgren and Stenstrom evaluate the performance of hardware based stride and
sequential prefetching in [25]. Their study shows that both mechanisms have their advan-
tages depending on the workloads with the balance slightly tilted in favor of stride
prefetches, due to its reduced bandwidth consumption and fewer useless prefetches.
19
A novel multi-stride prefetcher that supports streams with up to four distinct strides
was proposed by Iacobovici et al [29]. This study was based on the observation that single
non-unit stride prefetchers are unable to prefetch for some commonly occurring streams.
The authors show that most programs exhibit up to four streams 40% of the time with some
of them having as high as 32 different streams 80% of time. Their multi-stride prefetcher
responds to this behavior accurately and improves the system performance.
Apart from stream and stride prefetchers, the Markov prefetcher has been proposed
in [30]. The Markov prefetcher is distinguished by prefetching multiple reference predic-
tions from the memory system and then prioritizing the delivery of those references to the
processor. A Markov model based on the access pattern is used for the basic prediction
mechanism. This is shown to be useful in pointer chasing applications.
Prefetching schemes have also been implemented in software as shown by Mowry
et al. in [31]. The compiler schedules the prefetch instructions explicitly to bring the data
into cache or prefetch buffer. A compiler algorithm identifies the data references that are
likely to be cache misses, and prefetch instructions are inserted only for them. The focus is
on array accesses whose indices are linear functions of the loop indices.
2.1.2.3 Memory Side Prefetching
Memory side prefetching was initially proposed as cache that resides along DRAM.
Studies have shown that memory side prefetching is orthogonal to processor side prefetch-
ing. A prediction and prefetching technique combined with a distributed cache architecture
to build a high performance memory system was proposed in [32]. This study prefetches
multiple cache blocks into the prefetch buffer which is integrated into the DRAM IC. This
huge bandwidth gives the opportunity to do aggressive prefetching based on prediction
20
tables. In this work up to four adjacent cache blocks of 128bytes each are prefetched into
the buffers. They also show a performance improvement in the range of 50%-80% with a
prefetch buffer of 32KB.
A cached DRAM for ILP processor to reduce memory latency is proposed in [33].
In a cached DRAM, a small or on-memory cache is added onto the DRAM core. The on-
memory cache exploits the locality that appears on the main memory side. The DRAM core
can transfer a large block of data to the on-memory cache in one DRAM cycle. This data
block can be several dozen times larger than an L2 cache line. The on-memory cache takes
advantage of the DRAM chip’s high internal bandwidth, which can be as high as few hun-
dred gigabytes per second.
Adaptive stream detection, a simple technique for modulating the aggressiveness of
a stream prefetcher to match a workload’s spatial locality was proposed by Hur and Lin
[34]. This technique is effective for streams of any length, including extremely short
streams. The authors show 15% improvement in performance with a small prefetch buffer
that resides in the memory controller.
Most previous solutions have addressed the single-core processor’s perspective and
haven’t taken into account the bandwidth limitations of multi-core processors. Further,
most of these studies were done using SPEC integer and floating point workloads, and not
server benchmarks which lack locality.
2.1.2.4 Adaptive Prefetching Optimizations
Prefetching has been studied extensively to reduce memory latency, and the optimi-
zation studies have been primarily oriented towards improving the prefetcher efficiency in
terms of accuracy. Most studies focussed on improving the prefetching algorithms in terms
21
of tracking more streams/strides, and some tried to improve the learning time for new pat-
terns [28]. Most of these ideas designed their prefetcher to adapt to any new pattern fast.
Few studies focus on the system factors that determine the performance improvement with
prefetching enabled in the system.
The impact of timeliness on prefetching has been studied by Wong and Baer in [36].
This work examines the impact of hardware-based prefetchers at the L2-main memory
interface on the performance of an aggressive out-of-order superscalar processor. The
authors show the importance of timeliness by simulating prefetch oracles with perfect cov-
erage and accuracy. Their studies show that prefetches must be initiated ahead of at least
one L2 cache miss and in some cases by as much as four.
Emma et al. explore the limits of prefetching in terms of timeliness and bandwidth
limitation [35]. This work profiles the workload to identify the maximum amount of per-
formance gain that can be obtained with prefetching for a given application. This is a limit
study and uses a queuing model based memory controller for the simulation. This work
identifies the importance of line transfer interval, the time it takes to transfer the data from
DRAM to cache, and quantifies the impact of bus speed on prefetching.
An aggressive prefetcher unit integrated with L2 cache and memory controller is
discussed by Lin et al. in [37]. In this study, prefetch requests are issued only when the
memory channels are idle. Further, the requests are prioritized to maximize the row buffer
hits, and they are given low replacement priority to improve the cache hit rate. This work
shows up to 43% improvement in performance of the system. Their approach led them to
come within 10% of perfect L2 cache.
22
Srinath et al. propose a mechanism that incorporates dynamic feedback into the
design of the prefetcher to increase the performance improvement provided by prefetching
as well as to reduce the negative performance and bandwidth impact of prefetching [38].
This work estimates prefetcher accuracy, prefetcher timeliness, and prefetcher caused
cache pollution to adjust the aggressiveness of the data prefetcher dynamically. The authors
introduce a new method to track cache pollution caused by the prefetcher at run-time along
with smart cache replacement policies.
Adaptive stream detection, a simple technique for modulating the aggressiveness of
a stream prefetcher to match a workload’s spatial locality, was proposed by Hur and Lin
[34]. This technique is effective for streams of any length, including extremely short
streams. Adaptive Scheduling, a heuristic associated with the technique, uses variations of
the number of outstanding requests to determine when to issue prefetch requests. The dif-
ferent policies include issuing prefetches when there are i) no outstanding requests in the
memory controller, ii) no pending requests in the read queue, iii) no pending requests in the
conflict queue, and so on. Their study shows minimal variation in performance between
different scheduling policies.
Our work, load aware prefetching, differs from the above mentioned studies in that
we use the average memory latency to determine when to prefetch and the prefetching
depth as explained below. Since the goal of prefetching is to reduce memory latency, our
methodology uses the main metric — average memory latency — as a feedback loop for
prefetching. Further, all the above mentioned studies were conducted in a uniprocessor
environment. Our work focuses on a multi-core system and highlights the drawbacks of the
aforementioned schemes in such an environment.
23
2.1.2.5 Memory Controller and Address Mapping Optimizations
There have been several studies at the controller level which examine how to lower
latency while simultaneously increasing bandwidth utilization. These techniques have low-
ered row-buffer miss rates by employing address mapping, memory request access reorder-
ing, or split-transaction scheduling. Row-buffer misses are expensive, because conflicts
can be resolved only after a precharge-activate sequence. Zhang et al. [39] studied how
address mapping can reduce row-buffer conflicts. The scheme attempts to distribute blocks
that occupy the same cache set across multiple banks in the system, by XORing the lower
page-id bits with the bank-index bits.
The Impulse memory controller [40] adds an optional level of address indirection
at the memory controller which may involve the operating system. Impulse extends the
traditional virtual memory hierarchy by adding address translation hardware to the mem-
ory controller. Applications can use this level of indirection to remap their data structures
in memory. As a result, they can control how their data is accessed and cached, which in
turn improves cache and bus utilization. This scheme is unsuitable for an SoC environ-
ment, since SoCs typically lack virtual memory.
There have been numerous studies on application specific memory controller opti-
mization. Zhang et al. [41] propose stream prefetching and dynamic access ordering to
overcome memory bottlenecks. This study combines a stride-based reference prediction
table, a mechanism that prefetches L2 cache lines, and a memory controller that dynami-
cally schedules accesses to a Direct Rambus memory subsystem. Applications with
strided access patterns are targeted in this work. Despite their poor cache behavior, these
applications have predictable access patterns. This can be exploited to reduce the latency
24
of the memory subsystem in two ways: 1) latencies can be masked by prefetching stream
data, and 2) latencies can be reduced by reordering stream accesses to exploit parallelism
and locality within the DRAMs.
Matthew et al.[42] describes a Parallel Vector Access unit, the vector memory sub-
system that efficiently gathers sparse, strided data structures in parallel on a multi-bank
SDRAM memory. Their proposal improves memory locality via remapping and increases
throughput with parallelism. The memory controller in this study lets applications dictate
how their data is being accessed and cached. To mitigate the high latency of SDRAM, they
operate multiple banks simultaneously with components working on independent parts of
a vector request.
Mckee et al. [44] discusses a Stream Memory Controller (SMC) that combines
compile-time detection of streams with execution-time selection of the access order and
issue. The SMC effectively prefetches read-streams, buffers write-streams, and reorders
the accesses to exploit the existing memory bandwidth as much as possible.
The Imagine [43] architecture proposes a bandwidth-efficient media processor.
Imagine consists of a single-chip programmable processor which exploits the parallelism
and locality of streaming media applications and provides a storage bandwidth hierarchy.
This study supports the stream programming model by providing a bandwidth hierarchy
tailored to the demands of media applications.
These projects mainly focus on media applications, streamed computations, or
applications with strided access patterns; they do not account for other random behaviors
and timing constraints. Our work is not tailored towards specific applications and instead
focuses on the whole system in general.
25
Memory controller scheduling policies have also been studied in detail. Rixner et
al. [46] were the first to consider priorities for various commands in a memory controller.
Using a Stream Processor Architecture [43], they show that rescheduling access requests
based on priorities improves the performance of the processor by an order of magnitude.
The focus of their study was on effective utilization of the memory, by re-ordering DRAM
commands, and not on the individual components. Our work not only considers the
requirements of various components in the system, but also the DRAM commands, in
designing the memory controller.
Hur et al. [45] propose a novel memory scheduler which uses the history of
recently scheduled operations for future scheduling policies. This work shows the usage of
history based arbiters implemented as finite state machines. The authors highlight the
effects of arbitration when scheduling decisions are done based on recently scheduled
operations. Their approach investigates the advantages of a history-based system which i)
allows the scheduler to better reason about delays associated with its scheduling decisions
and ii) allows the scheduler to select operations so that they match the program’s mixture
of Reads and Writes, thereby avoiding certain bottlenecks within the memory controller.
Building on their prior work [46], Rixner et al. [47] discuss memory controller
scheduling policies for web servers. The authors come up with various memory controller
scheduling policies such as sequential, bank sequential, first ready, row and column and
investigate their performance on the system. Each policy schedules the next command
based on the instructions arrival order, availability of bank, activate command or read/
write operation.
26
All the above mentioned works focus on improving the DRAM bandwidth and do
not consider real-time constraints/quality-of-service. Further, their simulation environ-
ment is designed for a single master (uniprocessor) system. Hence, their schemes may not
be applicable for a multi-processor environment where many components compete to
access a shared memory. The various components might have their individual timing con-
straints which may not be satisfied by the above mentioned scheduler as they focus only
on DRAM bandwidth utilization.
Natarajan et al. [48] study the performance impact of memory controller features in
a multi-processor server environment. They were the first to focus on various scheduling
policies in a multi-processor server environment. This study utilizes intel’s 870 bus con-
troller architecture [49] and investigates various scheduling policies similar to [47] in a
multi-processor scenario. Bus controllers are important in multi-processor environment
because they funnel the requests from the master to the memory controller. This paper
includes different address mapping schemes as part of scheduling policies and analyzes its
impact on performance along with open/closed page policy in DRAM. This study priori-
tizes between read and write commands along with its scheduling policies. Only homoge-
neous cores are considered in this study.
[50] studied how such re-ordering benefitted from the presence of SRAM caches on
the DRAM aka Virtual-Channel DRAM for web servers Takizawa et al. [51] proposed a
memory arbiter that increased the bandwidth utilization by reducing bank conflicts and bus
turnarounds in a multi-core environment. The arbiter reduces bank conflicts by reducing
the priority of DRAM accesses that are to the same bank as the previously issued access or
if the access direction (read or write) is different from that of the previously issued access.
27
Wang [52] proposed a memory request re-ordering algorithm which focussed on
increasing bandwidth utilization. The algorithm attempted to get around bus constraints
like bus turnaround time, and DRAM constraints like row-activation windows. Shao et al
[53] propose a burst reordering scheduling scheme in order to improve the system memory
bus utilization. The scheme reorders memory requests, such that read accesses, that are
addressed to the same row of the same bank are clustered together. Writes are typically
delayed until the write queue is either full or hits a particular threshold size. When the latter
occurs, the scheduler piggybacks write transactions onto the ongoing burst by issuing a
write transaction which is addressed to the currently open row. When the write queue is
full, the scheduler issues the oldest write transaction in the system.
Lin et al. [37] studied how memory controller based pre-fetching can lower the sys-
tem latency in a system with an on-chip memory controller. This was done to optimize for
both power and performance. Zhu et al. [54], on the other hand studied how awareness of
resource usage of threads in an SMT could be used to prioritize memory requests.
Cuppu et al [55] demonstrated that concurrency is important even in a uni-proces-
sor system, but split-transaction support would lower latency of individual operations. [56]
studied how split-transaction scheduling in a multi-channel environment could be used to
lower latency.
A bit reversal address mapping scheme for SDRAM systems was proposed by Shao
et al. [57]. This scheme reverses the ‘N’ highest address bits and uses them to map the rank
bits, bank bits and part of the row address bits. They demonstrate that this scheme improves
execution time by mapping the most likely changing bits to the column, rank and bank bits
and by redistributing memory accesses to be equally distributed across all banks.
28
Mitra et al. [58] characterized the behavior of 3D graphics workloads in order to
understand the architectural requirements for these applications. They explored the impact
of using architectural optimizations such as active texture memory management, specula-
tive rendering and dynamic tiling on the performance of graphics applications. In addition
they characterized the memory bandwidth requirements for these applications.
Embedded system controllers used in media systems have to provide high band-
width utilization for the media and signal processing workloads while simultaneously pro-
viding low latency service to on-chip processing elements. Harmsze et al. [59] proposed a
solution in which fixed scheduling intervals are allocated to continuous streams and any
additional slack time at a higher priority to CPUs and peripherals. This scheme was used in
conjunction with on-chip buffering to provide compile-time guarantees of performance.
This scheme does not take into account the state of the underlying DRAM. Weber [61]
investigates the memory controller scheduling policies in a SoC environment with a shared
bus and DRAM subsystem. This study focuses on both bus arbitration and memory con-
troller scheduling policies. This paper briefly explains the bandwidth requirements and
gives result for their scheduling policy.
Lee et al. [62][63] proposed a memory controller design that used a layered archi-
tecture, with a layer dedicated to DRAM management, QoS scheduling and address gener-
ation for continuos streams requestors to solve the same problem. The DRAM management
layer generated the DRAM command stream required to process an actual request. As in
earlier work, the DRAM layer designed a schedule that takes into account bank conflicts,
bus turnaround times etc. In addition, the Quality of Service Access layer provided the
DRAM layer with information regarding the priority of a given request which is taken into
29
account to build the schedule. The QoS Access layer sends the DRAM layer information
whether a given access is latency-sensitive, bandwidth sensitive or neither. Like Harmsze
et al, they provide fixed bandwidth to a bandwidth sensitive stream, but unlike them they
build in pre-emptive mechanisms which allows the scheduler to pre-empt a bandwidth-sen-
sitive stream when a latency sensitive requestor makes a request.
A fair queuing memory controller scheduling algorithm for chip multiprocessor
platforms was proposed by Nesbit et al. [64]. This study is based on concepts developed for
network fair queuing and scheduling algorithms. This work explains the effect of starvation
that can be caused by aggressive threads on others and quantifies the system performance
degradation. This study highlights the destructive interference caused between threads due
to uncontrolled sharing and provides solutions to prevent it. The controller allocates mem-
ory bandwidth to each thread based on the threads memory utilization. Excess bandwidth is
then distributed across threads that have consumed less bandwidth in the previous cycles.
Thus fairness in memory access is maintained across threads.
2.2. Power Optimizations
The memory density has been increasing with the shrinking transistor sizes, and the
DRAM frequency is increasing to meet the higher bandwidth demand of the system. These
two factors have fueled the power consumption of memory systems. Further, FB-DIMM, a
serial memory interface designed to address the memory capacity issues [65], has lead to
increased power consumption due to its unique design with its Advanced Memory Buffer
[AMB] logic. These factors have lead to extensive research in DRAM power management.
In the case of the memory system, power modes are available in nearly all DRAMs
e.g. RDRAM, SDRAM, DDR/2. In DRAMs, a large portion of the power is drawn by the I/
30
O circuitry, PLLs, on-chip registers. The low power modes disable this circuitry. Inter-node
transitions take non-zero time, with the transition from low power modes to high power
modes taking longer than transitions from high power modes to low power ones. All the
DRAM models [Rambus, DDR] provide support for different power modes with varying
degree of power consumption. The deeper the power mode, the longer it takes to bring the
DRAM to active state.
Lebeck et al. [68] introduce the concept of power aware page allocation. They pro-
pose a hardware/software cooperative approach, that exploits power-aware memory, to
reduce energy consumption. They explore the interaction of page placement with both
static and dynamic hardware policies to exploit the individual chip power mode. They also
consider page allocation policies that can be employed by an informed operating system to
complement the hardware power management strategies.
Huang et al. [67] propose a power aware virtual memory, where individual memory
devices are put into low power modes dynamically using software control, to reduce power
consumption. The authors propose schemes to manage memory nodes — the smallest unit
of memory that can be power managed independently of other units — to reduce power
used by the memory. They utilize the operating system to make better transition decisions
from active to idle power mode, to minimize performance degradation, and reap greater
energy savings.
There are other studies which focus on DRAM power management. Fan et al. [66]
investigate memory controller policies for manipulating DRAM power states in cache-
based systems. The authors monitor the gap between various DRAM accesses and decide
on appropriate thresholds to transition the DRAM from active to idle mode. Their work

31
focuses on identifying the transition time period where benefits outweigh the penalty for
transitioning back to the active state.
Various energy management policies in servers based on commercial workloads
has been analyzed in [70]. In their work, authors survey various power management tech-
niques in a commercial web server environment. They investigate various issues which
impact the power consumption in servers such as frequency and voltage scaling, processor
packing, data placement, simultaneous multithreading, etc. and utilize them in their energy
management mechanisms.
Huang et al. [69] propose page migration, where they monitor memory traffic and
move pages between ranks to increase the idle periods. This work elaborates a new tech-
nique that actively reshapes memory traffic to coalesce short idle periods — which were
previously unusable for power management — into longer ones, thus enabling existing
techniques to effectively exploit idleness in the memory.
De La Luz et al. proposed automatic data migration for reducing energy consump-
tion in multi-bank memory systems in [73]. This paper describes an automatic data migra-
tion strategy which dynamically places the arrays with temporal affinity into the same set
of banks. This strategy increases the number of banks which can be put into low power
modes and allows the use of more energy saving modes.
De La Luz et al. [71] also examined how to control DRAM power consumption for
an RDRAM system. Their study focused on compiler modifications and insertion of direc-
tives to transition the DRAM into the appropriate power state based on profiling informa-
tion. They also examined array accesses reordering, and clustering arrays with similar
access patterns together to reduce power consumption. They studied some hardware-based
32
techniques that were threshold monitoring or history based techniques and found that these
performed better because compiler-based techniques tended to be more pessimistic and
lacked the detailed runtime information.
In a follow-up paper [72], they examined the operating system power management
policies of the memory system. They observed that the OS can keep track of which pages
are required by a process, and enable the associated modules prior to its scheduling, while
disabling the idle modules. Power savings using this technique did not scale well with the
number of modules, because of the uniform distribution of a process’ pages across multiple
modules. As the number of active threads increased, the returns also diminished.
An efficient method for dynamic power management of DRAM based on accessed
physical addresses is proposed in [74]. This paper presents an efficient method that sets an
accessed node to active state and sets each not accessed node to proper low power state.
The proposed method is simple and faster than the earlier methods. This model requires a
software counter for each node in the DRAM to check whether the threshold for transition-
ing to low power state is satisfied.
Lin et al. propose FB-DIMM specific optimizations in [37]. The authors propose an
AMB prefetching method that prefetches memory blocks from DRAM chips to Advanced
Memory Buffers [AMB]. This method reduces the DRAM power consumption by merging
some DRAM precharges and activations.
Most of these above mentioned techniques involve hardware-software cooperation
or the involvement of operating system. Moreover, these work have been focussed on uni-
processor environment. The commercial memory controllers discussed in the next section
do focus on entirely hardware oriented optimizations.
33
2.3. Commercial Memory Controllers
The commercial memory controllers are divided into two groups i) External Memory
controller: This has been the traditional design in the general purpose processor with a
north bridge consisting of video card (AGP) unit, and the memory controller connected to
the processor through a Front Side Bus (FSB). Intel memory controller [75] has been tradi-
tionally designed based on this concept. The FSB can’t scale well for higher bandwidth
demand. This will be a bottleneck as the number of cores increase on chip. The advantage
of this type of design is that the memory controller is not tied to the chipset, and the con-
sumers have the freedom to make their own choice of processor and memory controller. ii)
Integrated Memory controller: The memory controller is integrated with the processor on-
chip. Advanced Micro Devices (AMD) memory controllers adopt this concept [76].
Though there is no flexibility as the memory controller is tightly coupled with the proces-
sor, the performance benefits outweigh the drawbacks.
G3MX is the latest memory controller from AMD. This innovative platform-level
technology is designed to extend the total memory footprint in future AMD Opteron pro-
cessor-based systems, and therefore, enable increased performance to customers’ enter-
prise-class servers, such as those used for databases and emerging technologies like
virtualization and multi-core computing. This is an on-die memory controller and is geared
for DDR3 memory systems. The processors will interface with one or more G3MX chips,
which in turn are connected to the memory ports. G3MX will act as a memory port
extender for the memory controller in the CPU socket and provides a serial link to the
RAM. Also, the electrical signaling between the memory controller and G3MX is based on
HyperTransport 3.0.
34
The 21174 memory controller [77], which was designed for the 21164 and 21164PC
Alpha workstations [78], was an SDRAM based memory controller. This controller repre-
sented the transition from the use of asynchronous DRAM architectures to synchronous
DRAM architectures. The design goals of this project were to eliminate the latency over-
heads incurred due to multiple chip domain crossing. This was achieved by using a novel
memory sub-system where the CPU was directly connected to the DRAM data bus, but the
addressing and control was managed by the memory controller. The controller was
designed for an open page policy, and had a built-in 4-bit predictor per bank, which was
used to determine whether the next access will be a hit or a miss. A 16-bit software con-
trolled register was used to configure the predictor state. They noted that the performance
improvement by using this predictor is substantial for a few applications.
The Intel 870 is a memory controller for the Itanium processor. This controller sup-
ports up to 4 channels each with 8 DDR ranks. This chip can be connected to 4 processors
simultaneously. It has an on-chip scalability port that enables it to add another 12 proces-
sors. The chipset supports memory access re-ordering policies which focus on taking
advantage of row locality and read/write re-ordering to avoid the impact of bus turn around
times. The chipset also has its own read caches that act as prefetch buffers for controller
level pre-fetching. Being a multi-processor memory controller, it has support for directory
level cache coherence. Several chipsets can be connected via the scalability port to form a
network of 16-way processor system. Communication on this network is high-speed serial
packet based communication.
The Intel front-side bus architecture has the processor communicating to the North-
bridge chipset and cores via a fast, wide, shared bus. The northbridge chip, which was
35
mainly the off-chip memory controller and cache coherence controller, is connected to the
I/O controller, the AGP and the memory channels. With the trends towards increased inte-
gration, Intel first moved the graphics controller onto the chip-set [79]. More recently, the
Intel 5000 series memory controller, (code-named Blackford), that is designed for dual-
core and quad-core chips, takes this integration process further by moving the PCI Express
controller onto the chipset [80]. The Blackford chipset supports 2 logical channels of
FBDIMM memory (4 physical channels), that are referred to as “branches”. The chipset
supports interleaving of cachelines across channels, ranks and banks. To provide increased
RAS (Reliability, Availability and Serviceability), the memory is stored with ECC and the
memory controller supports scrubbing i.e. periodically reading back memory and checking
that it is correct. Both the PCI-express and FBDIMM channel are protected by CRC due to
the higher transfer rates.
The increased integration of platform level components has resulted in the moving of
the memory controller on-chip for both IBM’s Power 5 [81] and AMD Opteron processors
[82][83]. Both these chips support a dual-channel, 16-byte memory channel interface and
reduce memory latency by eliminating a chip domain crossing. In the past, on-chip mem-
ory controllers have been built for the Sun Sparc 5, which used a simple 1 level caching
hierarchy and an on-chip memory controller to reduce memory access overheads. Intel is
expected to follow this trend with their future Nehelam processor.
2.4. Embedded DRAM Architectures
Complex Out-Of-Order (OOO) processors have been built to extract more Instruc-
tion Level Parallelism (ILP) in order to hide the memory latency. These processors use
sophisticated techniques such as complex issue logic, big issue widths, deeper pipelines

36
and speculation to hide this latency. A large amount of memory is required to keep these
complex OOO processors busy. As the memory hierarchy gets more complex, the distance
between the CPU and memory increases. Saulsbury et al. [84] proposed moving away from
CPU-centric design in order to reduce the impact of the memory wall. They proposed
bringing the processor and memory closer by moving the processor onto the DRAM chip.
The Berkeley Intelligent Random Access Memory (IRAM) RAM [85][86][87][88]
project studied how to merge the processor and DRAM onto the same chip. This work
demonstrated techniques to improve memory access latency, available bandwidth to the
processor, overall energy efficiency and cost savings. Memory latency was reduced by
redesigning the memory and allowing the processor to get data from accesses to rows
which are closer to the processor earlier than those which were further away. This approach
differed from traditional DRAM methodology. Energy savings were achieved due to the
lower cost of a DRAM access as compared to the SRAM access. Further, due to the larger
density of DRAM, the reduction in number of off-chip accesses also contributed to addi-
tional energy savings [88]. System cost reductions were achieved by reducing the number
of chips on a mother board.
Vector IRAM [89][90][91] is an architecture that combines vector processing and
IRAM in order to meet the demands of multimedia processing, with high energy efficiency.
The vector IRAM processor comprises of an in-order superscalar core with one level of
cache, a eight pipeline vector execution unit and several banks of memory. Code written for
this architecture had to be compiled by a vectorizing compiler [89][92] which was designed
to compile code such that it took advantage of the on-chip memory bandwidth.
37
FlexRAM architecture, another approach to merge DRAM logic on chip was pro-
posed by Kang et al. [93]. This architecture comprises of many simpler processing ele-
ments each with a DRAM bank. Each compute element is restricted to access its own
DRAM bank and that of its immediate neighbors. A Main processor on chip, which acts as
the scheduler, manages the execution of tasks on the simpler compute elements and the
communication between non-adjacent members. The FlexRAM chip in turn can be con-
nected onto any commodity memory interconnect. Cache coherence is managed either by
the programmer or by using a directory based shared memory controller [94]. Program-
ming for this architecture is made easy by the use of a special language and compiler sup-
port to automatically layout the code across the different compute elements [95][96].
Some of the issues with building logic on DRAM technology [88] is the process vari-
ation. The DRAM technology has been primarily optimized for small size and low leakage,
whereas a processor technology is optimized for speed. Further, the number of layers avail-
able in the two fabrication processes differ. The packaging used in DRAM chips is
designed to dissipate significantly lower power (on the order of Watts) than that used by
processors (can dissipate on the order of tens of watts). Further, the merging of logic and
DRAM on the same chip can also increase testing time.
The third approach proposed that has been proposed is the use of active pages
[97][98][99], a page-based model of computation that associates simple functions with
each page of memory. Active Page architectures are different from the previous two pro-
posals as they are used to enhance performance of the conventional processor-memory
architecture and not replace them. This approach does not change the memory interface
and hence is easier to adopt this methodology. Active Page data is modified with conven-
38
tional memory reads and writes; Active Page functions are invoked through memory-
mapped writes. Synchronization is accomplished through user-defined memory locations.
Finally, Active Pages can exploit large amounts of parallelism by being able to support
simultaneous computations to each of the pages in memory.
An alternate approach to reduce the distance between the processor and DRAM is to
use a stacked micro-architecture. Black et al.[100] proposed a 3D die-stacked micro-archi-
tecture, where the DRAM is stacked on the CPU, thereby reducing memory latency and
increasing bandwidth. Further, they demonstrate that this is a more power efficient archi-
tecture since it reduces the off-chip bus lengths.
2.5. Accurate Architectural Models
There are various studies that highlight the need for accurate architectural models
to evaluate the system performance. Alameldeen and Wood identifies the performance
variability as a major challenge for architectural simulation studies for multi-threaded
workloads [101]. Variability refers to the differences between multiple estimates of a work-
load performance. These variability can be classified into i) time variability where the
workload exhibits different behavior during different phases of a single run, and ii) space
variability, that occurs due to different input data and leads the program to follow different
execution paths. Their studies show that variability can lead to do as much as 31% differ-
ence in performance for different runs. The impact of variability of multi-threaded work-
loads can be extended to chip-multiprocessors.
Alameldeen et al. also have characterized commercial workloads dependency on
non-determinism in [102]. They propose a methodology of that uses pseudo-random per-
turbations and standard statistical techniques to compensate for the non-deterministic
39
effects. Their approach reduces the probability of reaching incorrect conclusions while
completing the simulation within reasonable time limits.
Desikan et al. show the experimental error that arises from the use of non-validated
simulators in computer architecture research [105]. Their work describe ways to reduce the
error by considering specific aspects of the pipeline, and their results show optimization
techniques to reduce average error from 40% to 20%. This work was conducted in a single
processor environment.
A similar study involving multiprocessors was studied in [104] by Gibson et al. The
authors have compared their simulator with an actual hardware for FLASH based systems.
This paper studies the source and magnitude of error in a range of architectural simulators
by comparing the simulated execution time of several applications and microbenchmarks
to their execution time on the actual hardware being modeled.
Krishnan and Torellas examined experimental errors in multiprocessor simulations
due to simple processor models [106]. They propose a novel direct-execution framework
that allows accurate simulation of wide-issue superscalar processors without the need for
code interpretation.They achieve this with the aid of an interface window between the
front-end and the architectural simulator, that buffers the necessary information, thus elim-
inating the need for full fledged instruction elimination.
Cain et al. discusses about the issues of precision and accuracy in simulation [107].
Their work highlights the operating system effects on both commercial and SPECint work-
loads. They also show that simulation incorrect speculative path is unimportant for these
benchmarks. Finally they show the I/O effects on simulation accuracy even for uniproces-
sors.
40
Simulation errors by selecting particular program phases were investigated by
Sherwood et al. [109]. This study proposes a solution to address this problem by selecting
basic block distribution that represents the entire program’s execution across different
architectural metrics such as branch miss rate, IPC, cache miss rate etc. This approach is
based upon using program’s profile code structure to uniquely identify the different phases
of execution in the program. They provide fast profiling tools that can provide practical
techniques for finding the periodicity and simulation in applications.
Oskin et al. introduce a hybrid processor simulator that uses statistical models and
symbolic execution to evaluate design alternatives [108]. This simulation methodology
allows for quick and accurate contour maps to be generated to the performance space
spanned by design parameters. The authors validate their approach against a cycle accurate
simulator and hardware.
Trace based sampling techniques to estimate architectural parameters were done in
[]. Kessler et al. use multi-billion references to estimate the accuracy of sampling in deter-
mining the miss rate of multi-megabyte caches. Their set sampling approach predicts the
behavior 90% accurately for 90% of the time.
The effects of I/O configuration to the entire system in terms of both performance
and power is studied in [103]. This work highlights the need for a full system simulator, and
investigate the system-level impacts of several disk enhancements and technology
improvements to the detailed interaction in memory hierarchy during the I/O intensive
phase.
41
Chapter 3: Simplistic Memory ModelsIn this chapter, we demonstrate the necessity for a cycle-accurate memory model
for complex systems — multi-core architectures in our case. We examine the impact of
simple latency/queuing model as the number of cores is increased on-chip. We have imple-
mented four different simplistic models, and found out that the performance between these
models and cycle-accurate simulator increases with the number of cores. We also found out
that optimization studies done using simplistic models can lead to erroneous conclusions.
Our studies show that the performance difference between simplistic models and accurate
memory controller can be as high as 65% for memory optimization studies.
3.1. Simulation Methodology
This sections describes our simulation methodology. We first describe the architec-
ture details of the chip multiprocessor/multi-core environment. We then describe the simu-
lator used with detailed explanation of all the modules in the system. We describe the
various server workloads used in our experiments. Finally, we explain the various memory
models implemented in our studies.
3.1.1 Multi-core Architecture
The multi-core architecture for one, two and eight cores is shown in Figure 3.1.
Each core in our model have their private L1, a shared L2 and a shared L3 cache. Table 3.1
gives the various configuration parameters of our simulation environment in terms of
cache, DRAM and cores.
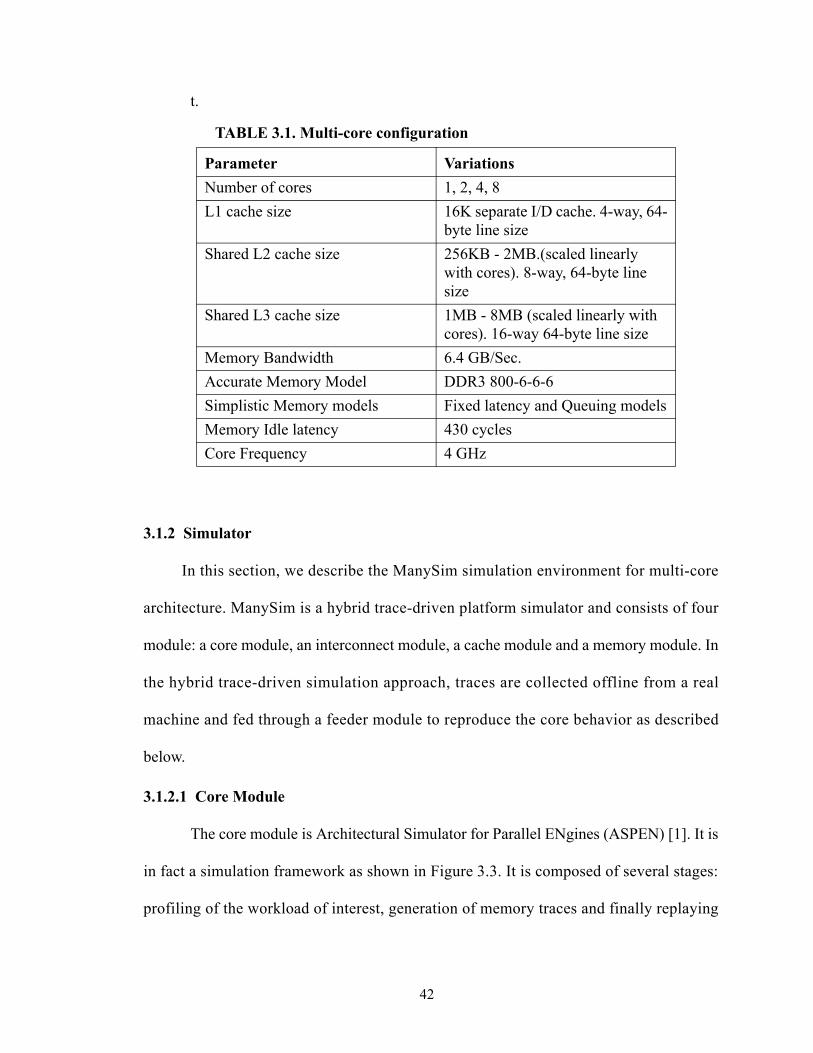
42
t.
3.1.2 Simulator
In this section, we describe the ManySim simulation environment for multi-core
architecture. ManySim is a hybrid trace-driven platform simulator and consists of four
module: a core module, an interconnect module, a cache module and a memory module. In
the hybrid trace-driven simulation approach, traces are collected offline from a real
machine and fed through a feeder module to reproduce the core behavior as described
below.
3.1.2.1 Core Module
The core module is Architectural Simulator for Parallel ENgines (ASPEN) [1]. It is
in fact a simulation framework as shown in Figure 3.3. It is composed of several stages:
profiling of the workload of interest, generation of memory traces and finally replaying
TABLE 3.1. Multi-core configuration
Parameter VariationsNumber of cores 1, 2, 4, 8L1 cache size 16K separate I/D cache. 4-way, 64-
byte line sizeShared L2 cache size 256KB - 2MB.(scaled linearly
with cores). 8-way, 64-byte line size
Shared L3 cache size 1MB - 8MB (scaled linearly with cores). 16-way 64-byte line size
Memory Bandwidth 6.4 GB/Sec.Accurate Memory Model DDR3 800-6-6-6Simplistic Memory models Fixed latency and Queuing modelsMemory Idle latency 430 cyclesCore Frequency 4 GHz
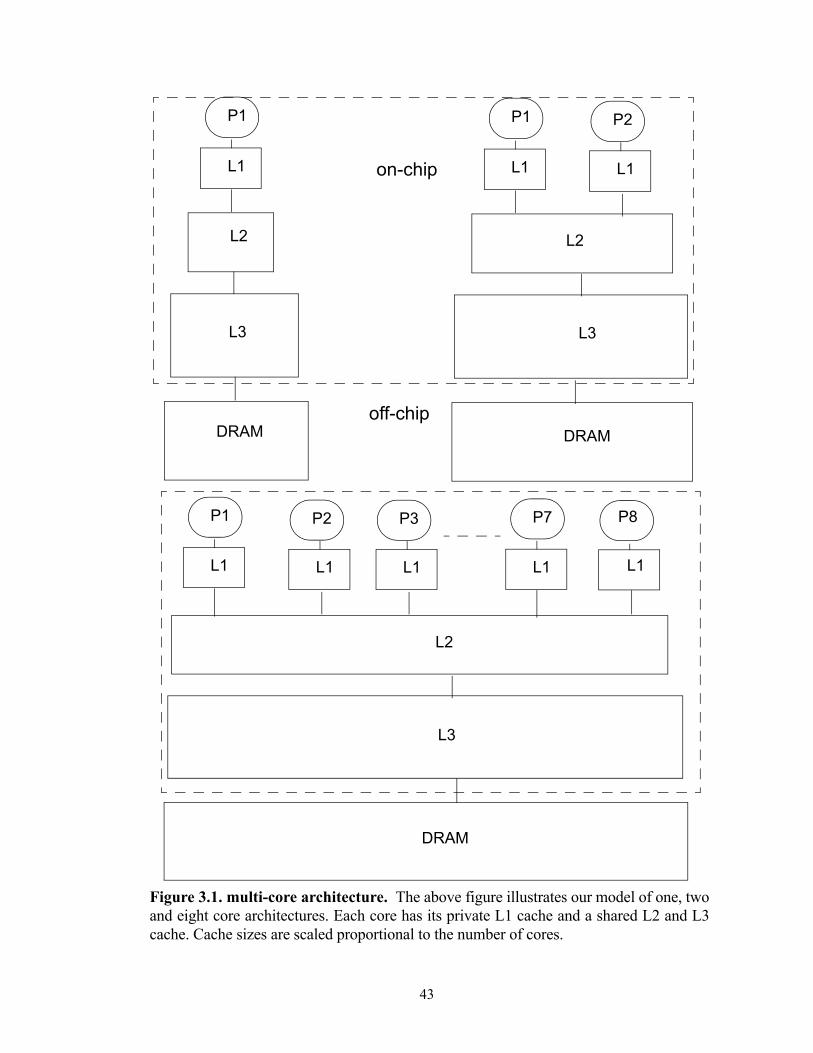
43
L1
L2
L3
DRAM
P1
L1
L2
L3
DRAM
P1 P2
L1
Figure 3.1. multi-core architecture. The above figure illustrates our model of one, twoand eight core architectures. Each core has its private L1 cache and a shared L2 and L3cache. Cache sizes are scaled proportional to the number of cores.
L1
L2
L3
DRAM
P7 P8
L1L1
P1 P2
L1
P3
L1
on-chip
off-chip
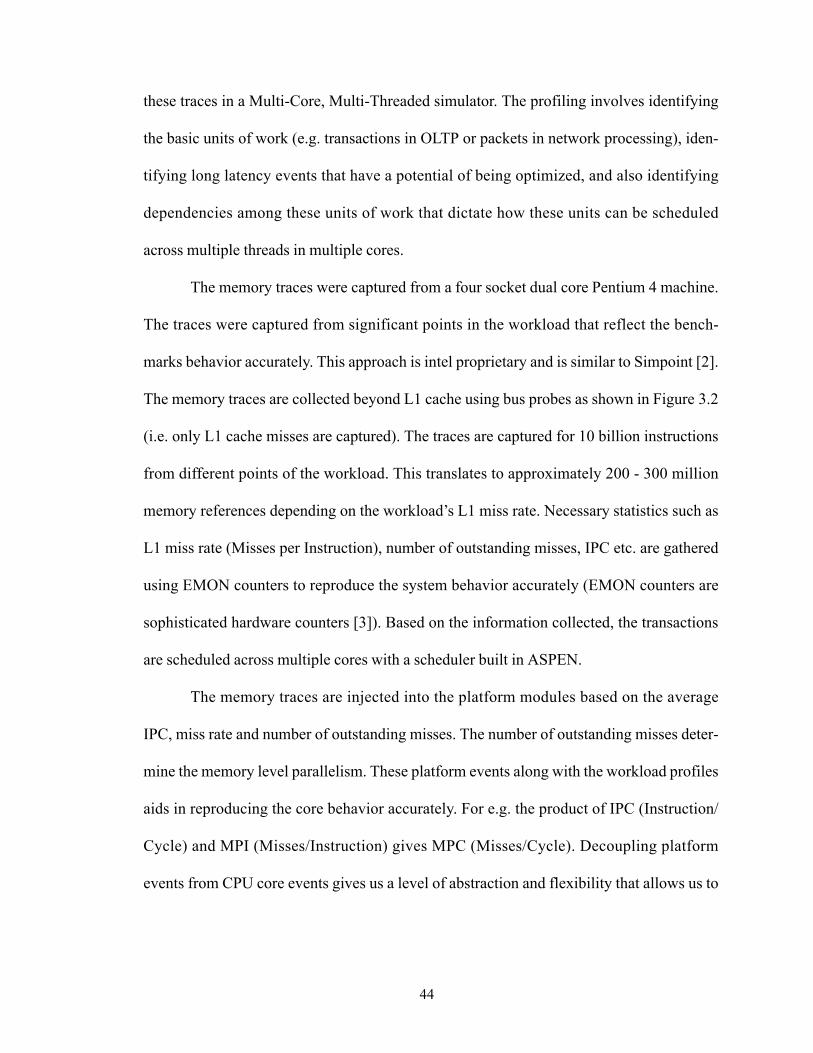
44
these traces in a Multi-Core, Multi-Threaded simulator. The profiling involves identifying
the basic units of work (e.g. transactions in OLTP or packets in network processing), iden-
tifying long latency events that have a potential of being optimized, and also identifying
dependencies among these units of work that dictate how these units can be scheduled
across multiple threads in multiple cores.
The memory traces were captured from a four socket dual core Pentium 4 machine.
The traces were captured from significant points in the workload that reflect the bench-
marks behavior accurately. This approach is intel proprietary and is similar to Simpoint [2].
The memory traces are collected beyond L1 cache using bus probes as shown in Figure 3.2
(i.e. only L1 cache misses are captured). The traces are captured for 10 billion instructions
from different points of the workload. This translates to approximately 200 - 300 million
memory references depending on the workload’s L1 miss rate. Necessary statistics such as
L1 miss rate (Misses per Instruction), number of outstanding misses, IPC etc. are gathered
using EMON counters to reproduce the system behavior accurately (EMON counters are
sophisticated hardware counters [3]). Based on the information collected, the transactions
are scheduled across multiple cores with a scheduler built in ASPEN.
The memory traces are injected into the platform modules based on the average
IPC, miss rate and number of outstanding misses. The number of outstanding misses deter-
mine the memory level parallelism. These platform events along with the workload profiles
aids in reproducing the core behavior accurately. For e.g. the product of IPC (Instruction/
Cycle) and MPI (Misses/Instruction) gives MPC (Misses/Cycle). Decoupling platform
events from CPU core events gives us a level of abstraction and flexibility that allows us to
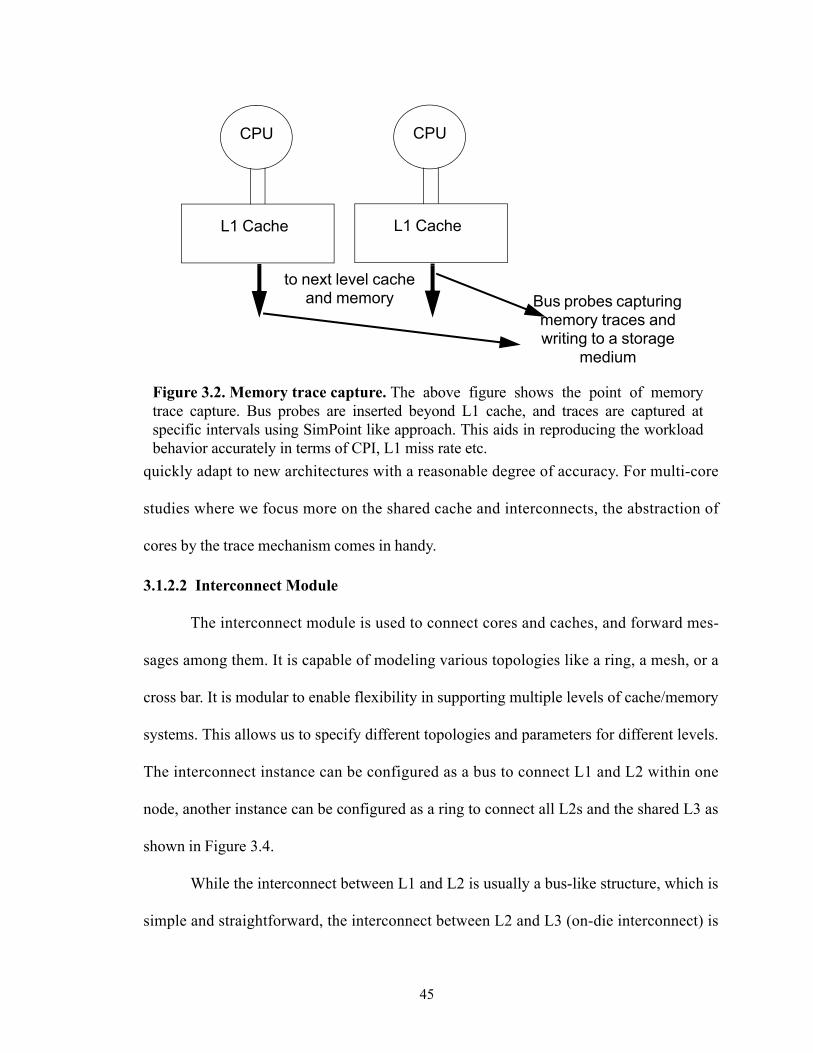
45
quickly adapt to new architectures with a reasonable degree of accuracy. For multi-core
studies where we focus more on the shared cache and interconnects, the abstraction of
cores by the trace mechanism comes in handy.
3.1.2.2 Interconnect Module
The interconnect module is used to connect cores and caches, and forward mes-
sages among them. It is capable of modeling various topologies like a ring, a mesh, or a
cross bar. It is modular to enable flexibility in supporting multiple levels of cache/memory
systems. This allows us to specify different topologies and parameters for different levels.
The interconnect instance can be configured as a bus to connect L1 and L2 within one
node, another instance can be configured as a ring to connect all L2s and the shared L3 as
shown in Figure 3.4.
While the interconnect between L1 and L2 is usually a bus-like structure, which is
simple and straightforward, the interconnect between L2 and L3 (on-die interconnect) is
CPU
L1 Cache
to next level cache and memory
CPU
L1 Cache
Bus probes capturing memory traces and writing to a storage
medium
Figure 3.2. Memory trace capture. The above figure shows the point of memorytrace capture. Bus probes are inserted beyond L1 cache, and traces are captured atspecific intervals using SimPoint like approach. This aids in reproducing the workloadbehavior accurately in terms of CPI, L1 miss rate etc.
46
not. This is because as the number of threads/cores increases, more memory traffic is gen-
erated, which increases the communication between L2 and L3 significantly. Therefore, it
is important to have an efficient interconnect topology and take on-die interconnect band-
width into account. The topology depends on a lot of other factors like the area space that is
allowed, the power dissipation and latency restrictions [4].
Currently, we focus on a bi-directional ring. To illustrate how this ring works,
Figure 3.5 shows an example, where there are 8 nodes (each node representing a thread/
core) with 8 L3 slices on the ring. Each node has a local L3 slice, which means that a node
can send requests to its local slice without entering the ring. However if a node sends a
workloads Real Platformwith L1 cache
enabled
Memory Traces and EMON Data
ASPEN
Figure 3.3. ManySim Core Module: The above figure illustrates the various stepsinvolved in the capturing and reproduction of CPU behavior using traces. The workloadsare profiled using SimPoint like approach and are run through a four socket dual corePentium 4 machine. Bus probes are inserted beyond L1, and memory traces are capturedas L1 misses. System data such as L1 miss rate, CPI etc. are captured using EMON alongwith the traces. These statistics help in reproducing the core behavior when fed throughASPEN module.
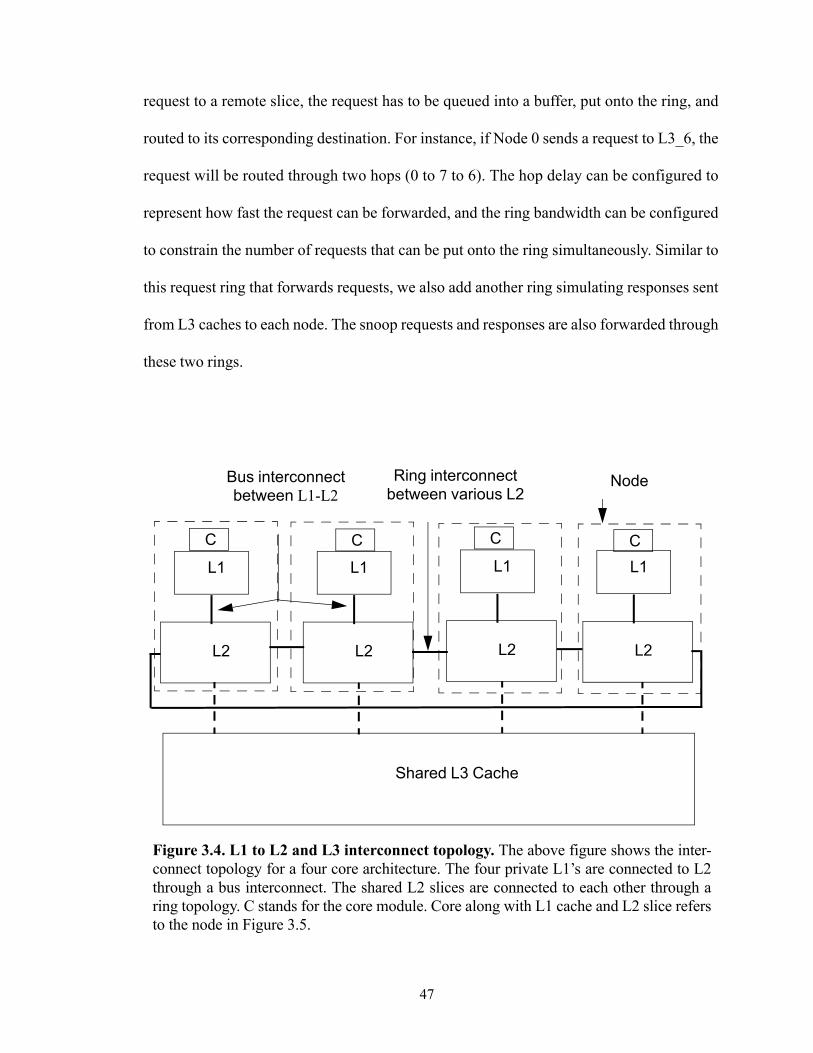
47
request to a remote slice, the request has to be queued into a buffer, put onto the ring, and
routed to its corresponding destination. For instance, if Node 0 sends a request to L3_6, the
request will be routed through two hops (0 to 7 to 6). The hop delay can be configured to
represent how fast the request can be forwarded, and the ring bandwidth can be configured
to constrain the number of requests that can be put onto the ring simultaneously. Similar to
this request ring that forwards requests, we also add another ring simulating responses sent
from L3 caches to each node. The snoop requests and responses are also forwarded through
these two rings.
CCCC
L1
L2
L1
L2
L1
L2
L1
L2
Figure 3.4. L1 to L2 and L3 interconnect topology. The above figure shows the inter-connect topology for a four core architecture. The four private L1’s are connected to L2through a bus interconnect. The shared L2 slices are connected to each other through aring topology. C stands for the core module. Core along with L1 cache and L2 slice refersto the node in Figure 3.5.
Shared L3 Cache
Bus interconnect between L1-L2
Ring interconnect between various L2
Node
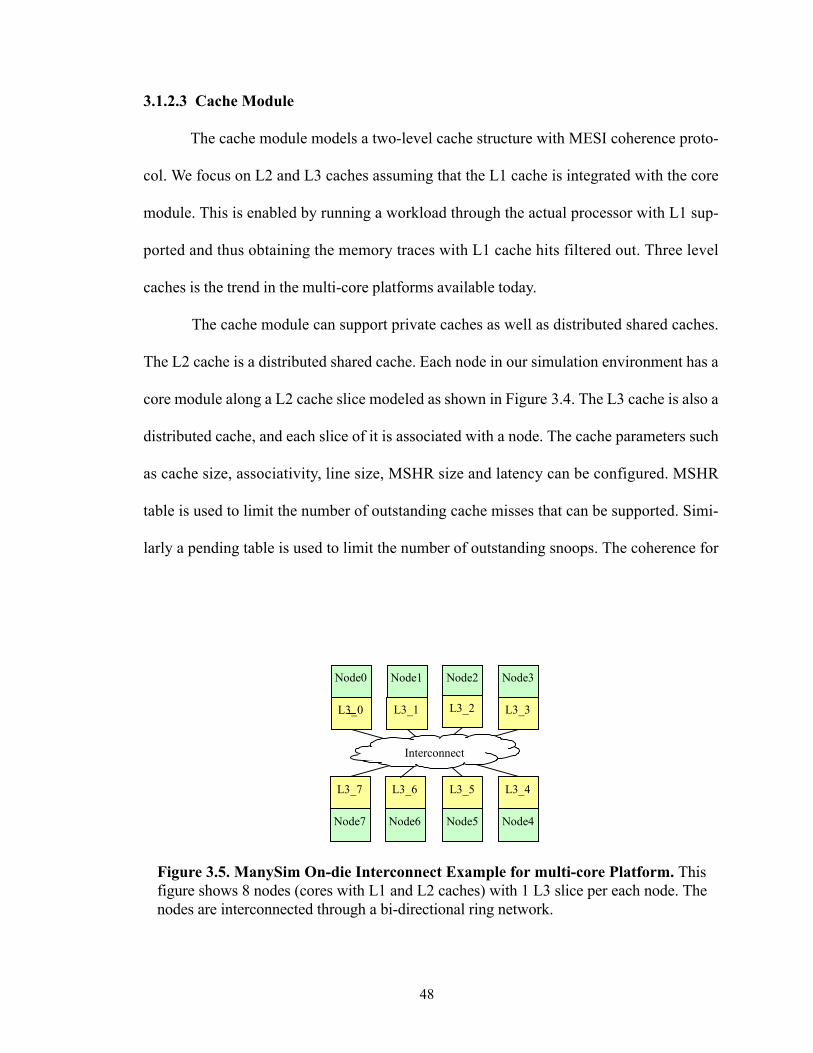
48
3.1.2.3 Cache Module
The cache module models a two-level cache structure with MESI coherence proto-
col. We focus on L2 and L3 caches assuming that the L1 cache is integrated with the core
module. This is enabled by running a workload through the actual processor with L1 sup-
ported and thus obtaining the memory traces with L1 cache hits filtered out. Three level
caches is the trend in the multi-core platforms available today.
The cache module can support private caches as well as distributed shared caches.
The L2 cache is a distributed shared cache. Each node in our simulation environment has a
core module along a L2 cache slice modeled as shown in Figure 3.4. The L3 cache is also a
distributed cache, and each slice of it is associated with a node. The cache parameters such
as cache size, associativity, line size, MSHR size and latency can be configured. MSHR
table is used to limit the number of outstanding cache misses that can be supported. Simi-
larly a pending table is used to limit the number of outstanding snoops. The coherence for
Node0
L3_0
Node1
L3_1
Node2
L3_2
Node3
L3_3
Node7
L3_7
Node6
L3_6
Node5
L3_5
Node4
L3_4
Interconnect
Figure 3.5. ManySim On-die Interconnect Example for multi-core Platform. Thisfigure shows 8 nodes (cores with L1 and L2 caches) with 1 L3 slice per each node. Thenodes are interconnected through a bi-directional ring network.
49
the two-level caches is maintained by building a state transition model based on the MESI
protocol.
3.1.2.4 Memory Module
The memory controller is a detailed cycle-accurate model that supports DDR and
FBD protocols similar to DRAMSim [5]. The model supports various scheduling algo-
rithms such as read first, write first, adaptive etc. The scheduling algorithm used in this
study is an adaptive scheduling algorithm. This policy gives priority to read requests over
write requests as long as the number of outstanding writes is below a threshold. The thresh-
old is set to be 2/3rd of the write queue size. The model also provides the flexibility to vary
the address mapping policies, number of ranks, DIMMs etc.in the system.
We have also implemented two simplistic memory models to compare the perfor-
mance against an accurate memory controller (AMC). The first simplistic model is the
fixed memory latency model as used in GEMS [6], an execution driven chip-multiproces-
sor simulator. In this model all memory requests incur the same delay irrespective of the
requested system bandwidth, access pattern, ratio of read to write requests etc. There is no
concept of bandwidth limitation in this model. This model can be represented in Figure 1.4
[redrawn here as Figure 3.6 for convenience] as a straight line across the entire requested
bandwidth.
The second simplistic model is a queuing model based on poisson distribution
[7][8]. The arrival of memory requests and their servicing rate is considered to be of pois-
son distribution. Poisson distribution is a discrete probability distribution that expresses the
probability of a number of events occurring in a fixed period of time if these events occur
with a known average rate, and are independent of the time since the last event.
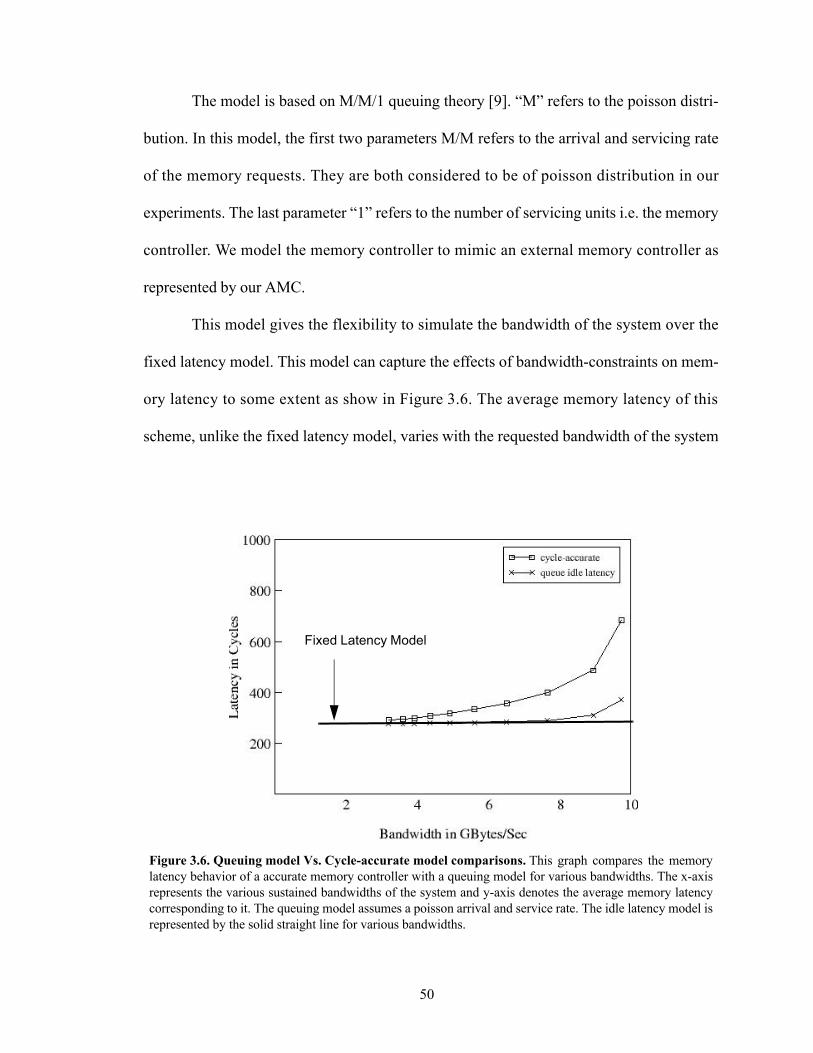
50
The model is based on M/M/1 queuing theory [9]. “M” refers to the poisson distri-
bution. In this model, the first two parameters M/M refers to the arrival and servicing rate
of the memory requests. They are both considered to be of poisson distribution in our
experiments. The last parameter “1” refers to the number of servicing units i.e. the memory
controller. We model the memory controller to mimic an external memory controller as
represented by our AMC.
This model gives the flexibility to simulate the bandwidth of the system over the
fixed latency model. This model can capture the effects of bandwidth-constraints on mem-
ory latency to some extent as show in Figure 3.6. The average memory latency of this
scheme, unlike the fixed latency model, varies with the requested bandwidth of the system
Figure 3.6. Queuing model Vs. Cycle-accurate model comparisons. This graph compares the memorylatency behavior of a accurate memory controller with a queuing model for various bandwidths. The x-axisrepresents the various sustained bandwidths of the system and y-axis denotes the average memory latencycorresponding to it. The queuing model assumes a poisson arrival and service rate. The idle latency model isrepresented by the solid straight line for various bandwidths.
Fixed Latency Model
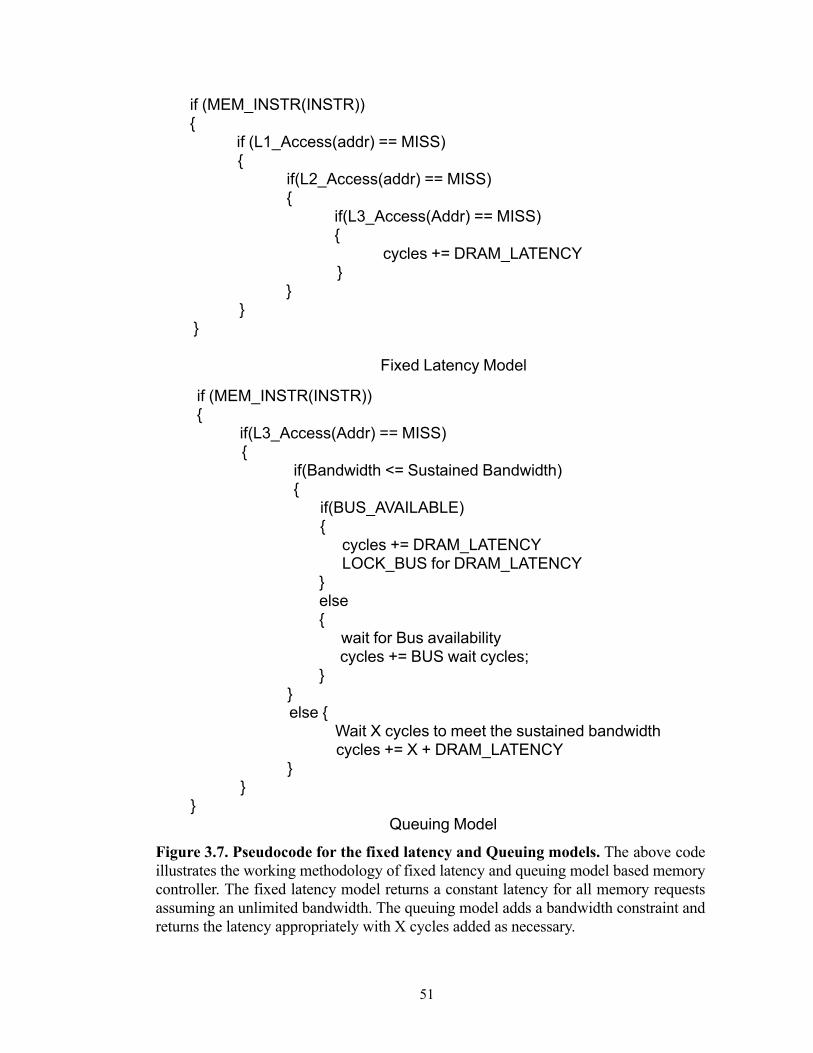
51
if (MEM_INSTR(INSTR)){
if (L1_Access(addr) == MISS){
if(L2_Access(addr) == MISS){
if(L3_Access(Addr) == MISS){
cycles += DRAM_LATENCY}
}}
}
Fixed Latency Model
if (MEM_INSTR(INSTR)){
if(L3_Access(Addr) == MISS){
if(Bandwidth <= Sustained Bandwidth){
if(BUS_AVAILABLE){
cycles += DRAM_LATENCYLOCK_BUS for DRAM_LATENCY
}else{
wait for Bus availabilitycycles += BUS wait cycles;
}}else {
Wait X cycles to meet the sustained bandwidthcycles += X + DRAM_LATENCY
}}
}Queuing Model
Figure 3.7. Pseudocode for the fixed latency and Queuing models. The above codeillustrates the working methodology of fixed latency and queuing model based memorycontroller. The fixed latency model returns a constant latency for all memory requestsassuming an unlimited bandwidth. The queuing model adds a bandwidth constraint andreturns the latency appropriately with X cycles added as necessary.
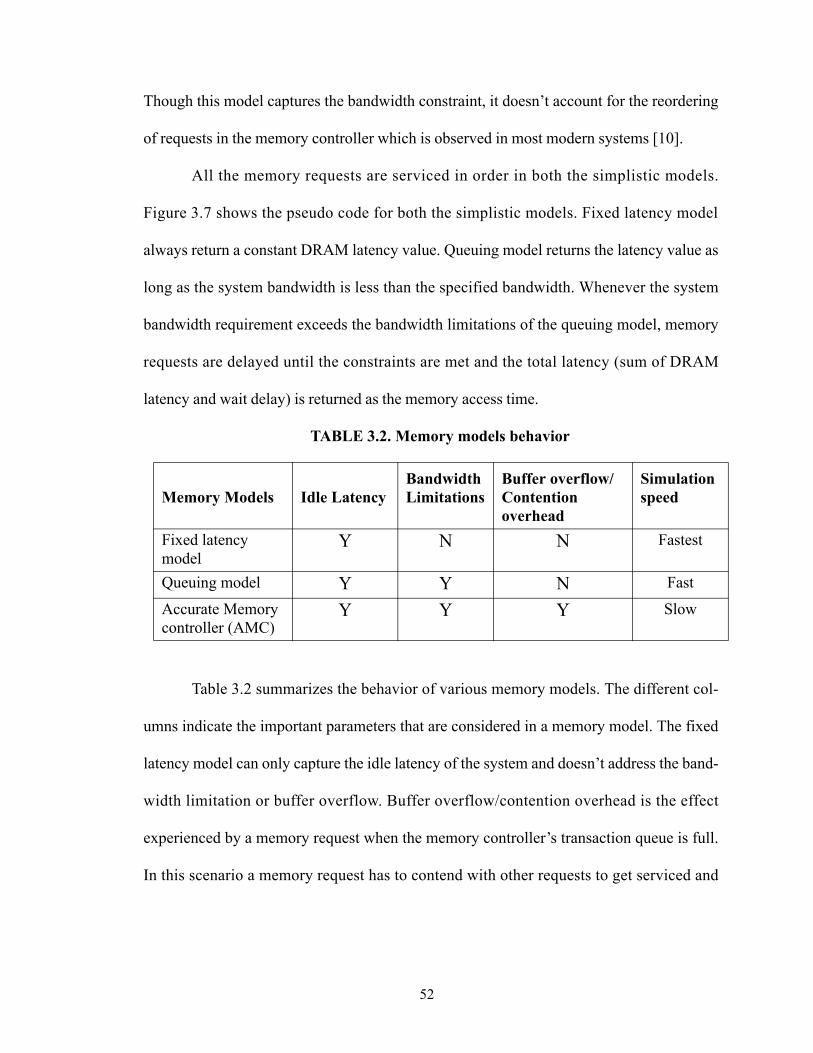
52
Though this model captures the bandwidth constraint, it doesn’t account for the reordering
of requests in the memory controller which is observed in most modern systems [10].
All the memory requests are serviced in order in both the simplistic models.
Figure 3.7 shows the pseudo code for both the simplistic models. Fixed latency model
always return a constant DRAM latency value. Queuing model returns the latency value as
long as the system bandwidth is less than the specified bandwidth. Whenever the system
bandwidth requirement exceeds the bandwidth limitations of the queuing model, memory
requests are delayed until the constraints are met and the total latency (sum of DRAM
latency and wait delay) is returned as the memory access time.
TABLE 3.2. Memory models behavior
Table 3.2 summarizes the behavior of various memory models. The different col-
umns indicate the important parameters that are considered in a memory model. The fixed
latency model can only capture the idle latency of the system and doesn’t address the band-
width limitation or buffer overflow. Buffer overflow/contention overhead is the effect
experienced by a memory request when the memory controller’s transaction queue is full.
In this scenario a memory request has to contend with other requests to get serviced and
Memory Models Idle LatencyBandwidth Limitations
Buffer overflow/ Contention overhead
Simulation speed
Fixed latency model
Y N N Fastest
Queuing model Y Y N Fast
Accurate Memory controller (AMC)
Y Y Y Slow
53
becomes more pronounced at higher bandwidths of the system. This is the most simplest of
all models, and hence the fastest.
The queuing model captures the idle latency of the system, and to an extent can
model the bandwidth. This model still does not capture the effects introduced in the system
due to contention among memory requests. This model is faster than the accurate memory
controller but slower than the idle latency model.
The accurate memory controller (AMC), as the name suggests, is the most accurate
of all models and captures the memory system behavior completely. This is also the slowest
among all models.
3.2. Benchmarks
The following server benchmarks are used in this dissertation. Server workloads is
one of the important class of applications to exploit the performance benefits of chip multi-
processors.
OLTP: For representing on-line transaction processing (OLTP), we used traces of a TPCC-
like workload. TPC-C [11] is an online-transaction processing benchmark that simulates a
complete computing environment where a population of users executes transactions
against a database. The benchmark is based on the primary transactions in an order-entry
environment. These transactions include entering and delivering orders, recording pay-
ments, checking the status of orders, and monitoring the level of stock at the warehouses.
ERP: For representing ERP workloads, we used traces from a SAP SD 2-tier benchmark.
The SAP SD 2-tier benchmark [12] is a sales and distribution benchmark to represent
enterprise resource planning (ERP) transactions. The transaction include creating orders,
creating deliveries for orders, displaying orders, changing options, listing and creating
54
invoices. An average transaction executes roughly 70 million x86 instructions, making this
a very difficult benchmark to characterize.
Java1: SPECjbb2005 [13] is a Java-based server benchmark that models a warehouse
company with warehouses that serve a number of districts (much like TPC-C). This work-
load is intended to test the performance of JVM components including garbage collection
and runtime optimization. From hereon we use SJBB to represent this workload.
Java2: SPECjAppServer2004 (Java Application Server) is a multi-tier benchmark for
measuring the performance of Java 2 Enterprise Edition (J2EE) technology-based applica-
tion servers. SPECjAppServer2004 is an end-to-end application which exercises all major
J2EE technologies implemented by compliant application servers such as transaction man-
agement, database connectivity, EJB container etc. From hereon we use SJAS to represent
this workload.
Web Server: SPECweb2005 emulates users sending browser requests over broadband
Internet connections to a web server [14]. It provides three new workloads: a banking site
(HTTPS), an e-commerce site (HTTP/HTTPS mix), and a support site (HTTP).
SPECweb2005 benchmark includes many sophisticated and state-of-the-art enhancements
to meet the modern demands of Web users such as simultaneous user sessions, browser
caching effects, etc. From hereon we use SPECW to represent this workload.
3.3. Simplistic Memory Models
We compare the performance difference of various types of memory models in this
section. Earlier we had described two types of simplistic models i) Fixed Latency and ii)
Queuing model. This is further classified into two i) Idle Latency Model (ILM) and ii)
55
Average Latency Model (ALM). We compares these four simple models with a cycle-accu-
rate model.
Figure 3.8 shows the memory latency distribution, idle and the average latency for
SAP and SJBB. Idle latency is the minimum round trip time for any memory request in the
system. Average latency is the mean of the all the memory requests latency for the entire
simulation run.
In the Idle latency model (ILM), the minimum round trip time for a memory request
is equal to the idle latency of the accurate memory controller. The minimum round trip time
for any memory request in an Average Latency Model is equal to the average memory
latency of the accurate memory controller i.e. the idle latency of this model is equal to the
average latency of the accurate model. The following are the four types of simplistic mem-
ory models:
Simple Idle Latency Model (SILM): This is a type of fixed latency model. In this model
the fixed latency is equal to the idle latency of the AMC. Idle latency is the round trip time
for a memory request with no other request pending in the memory controller i.e. the mini-
mum time for any request without contention overhead.
Simple Average Latency Model (SALM): This is a type of fixed latency model, where the
fixed latency is equal to the average latency of the cycle accurate model. Average latency
for each workload is computed for the entire simulation period using an accurate memory
controller.
Queue Idle Latency Model (QILM): This is a type of queuing model based on the poisson
distribution. In this model the minimum latency for a memory request is equal to the idle
56
Figure 3.8. Memory latency response for DDR-800. The figure shows the memorylatency distribution, idle and the mean latency for SAP and SJBB with 8 cores. The firstsolid line indicates the idle latency of the system: the minimum round trip time for anymemory request. The second solid line is the average latency of the system. This latencyis the mean of the all the memory requests latency for the entire simulation run.
SAP
SJBB
Average latency of the system.= 572
Average latency of the system.= 617
Idle latency of the system.
Idle latency of the system.
57
latency of the AMC. Since the queuing model has bandwidth constraints, the latency of the
requests increases with the requested bandwidth of the system.
Queue Average Latency Model (QALM): This is the type of queuing model wherein the
minimum latency of a memory request is equal to the average latency of the cycle accurate
model. The average memory latency is computed as described before for each benchmark.
All of the above models were compared against a cycle accurate simulator to deter-
mine the performance impact of these models in a multi-core system as shown in Table 3.1.
The DRAM model was DDR3-800 with parameters shown in Table 3.3.
3.4. Performance comparison of memory models
We found that the degree of inaccuracy introduced by the memory model increased
with the number of cores. This was true even for a model like the queueing models which
take into account the first order of effects like the impact of bandwidth on memory latency.
TABLE 3.3. DDR3-800 Memory System Parameters
Parameter DDR3Data-rate (Mbps) 800tRAS (ns) 37.5
tRP (ns) 15
tRC (ns) 52
tRCD (ns) 15
tFAW (ns) 40
tRRL (ns) 20
tRRD (ns) 7.5
tCL (ns) 15
tWL (ns) 12.5
Number of logical channels 1Scheduling policy Adaptive
58
SAP
SJBB
Figure 3.9. Performance comparison of various memory models. The x-axis showthe different number of cores and y-axis show the IPC difference for various memorymodels normalized to accurate memory controller. We can observe that the differenceincreases with the number of cores.
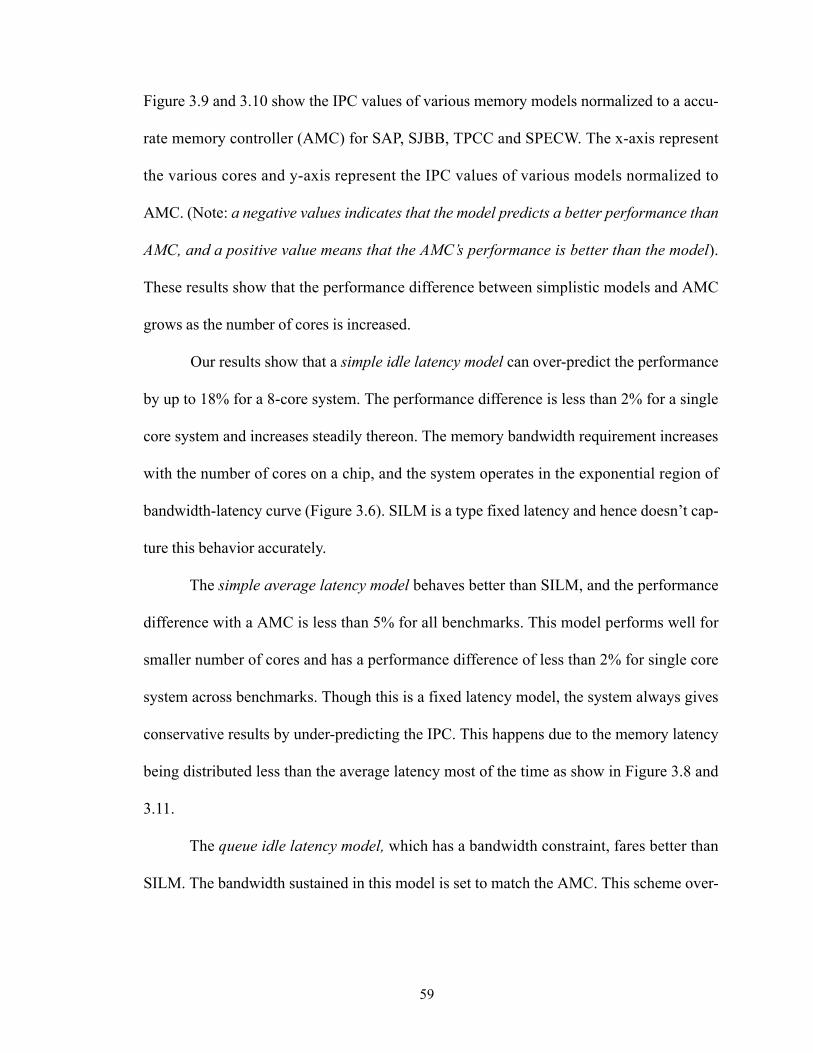
59
Figure 3.9 and 3.10 show the IPC values of various memory models normalized to a accu-
rate memory controller (AMC) for SAP, SJBB, TPCC and SPECW. The x-axis represent
the various cores and y-axis represent the IPC values of various models normalized to
AMC. (Note: a negative values indicates that the model predicts a better performance than
AMC, and a positive value means that the AMC’s performance is better than the model).
These results show that the performance difference between simplistic models and AMC
grows as the number of cores is increased.
Our results show that a simple idle latency model can over-predict the performance
by up to 18% for a 8-core system. The performance difference is less than 2% for a single
core system and increases steadily thereon. The memory bandwidth requirement increases
with the number of cores on a chip, and the system operates in the exponential region of
bandwidth-latency curve (Figure 3.6). SILM is a type fixed latency and hence doesn’t cap-
ture this behavior accurately.
The simple average latency model behaves better than SILM, and the performance
difference with a AMC is less than 5% for all benchmarks. This model performs well for
smaller number of cores and has a performance difference of less than 2% for single core
system across benchmarks. Though this is a fixed latency model, the system always gives
conservative results by under-predicting the IPC. This happens due to the memory latency
being distributed less than the average latency most of the time as show in Figure 3.8 and
3.11.
The queue idle latency model, which has a bandwidth constraint, fares better than
SILM. The bandwidth sustained in this model is set to match the AMC. This scheme over-
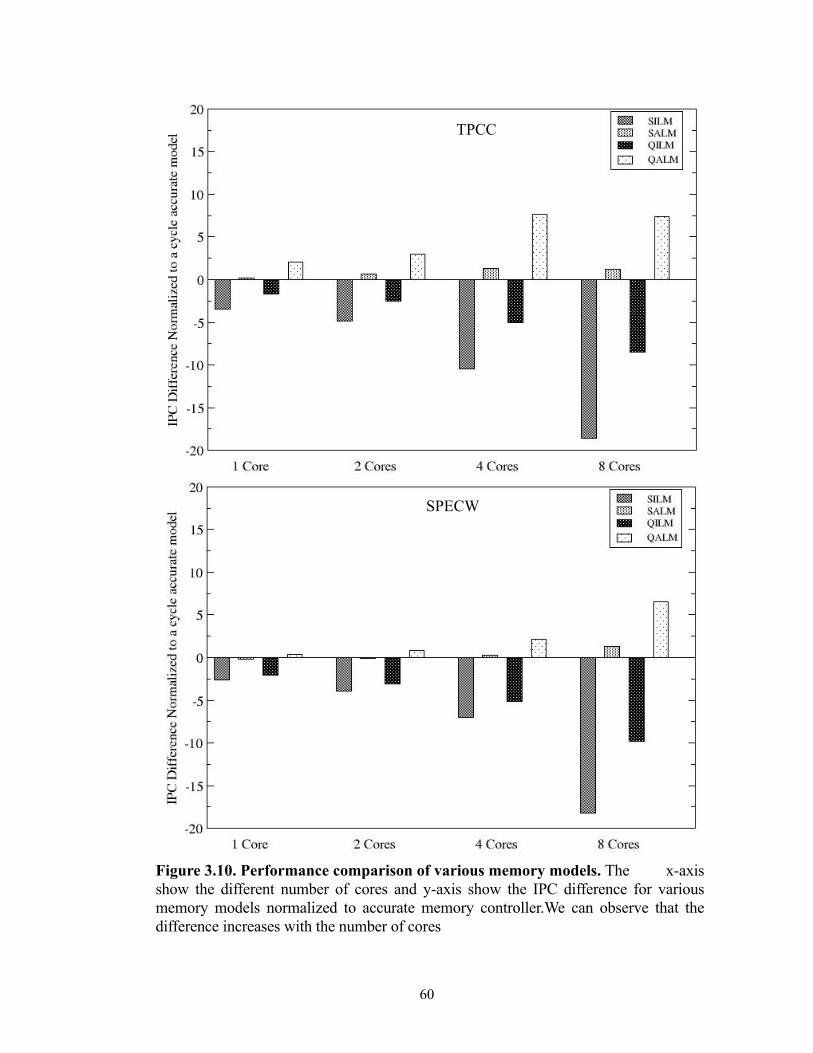
60
TPCC
SPECW
Figure 3.10. Performance comparison of various memory models. The x-axisshow the different number of cores and y-axis show the IPC difference for variousmemory models normalized to accurate memory controller.We can observe that thedifference increases with the number of cores
61
predicts the performance of the system by up to 12% for 8 cores. The performance differ-
ence is as less as 2% for a single core system. The bandwidth constraint in this model
ensures a better prediction than the SILM.
The queue average latency model under-predicts the performance by up to 7% for
8-core system. This scheme performs worse than SALM. The latency experienced by most
requests in this scheme is greater than or equal to the average memory latency of the AMC
[at higher bandwidths, this model increases the memory latency response of the system due
to its bandwidth constraint higher]. Hence, at higher bandwidths this model performs
worse the SALM, and under-predicts the performance than AMC.
Our results conclusively indicate that both the idle latency models (simple and
queue) over-predict the performance of the system. This is because the memory latency
experienced in these simplistic models is closer to the AMC’s idle latency. We can observe
from Figure 3.8 that the average latency in AMC is between 1.3 to 1.4 times the idle
latency of the system and depends on the bandwidth region the benchmark operates on. The
average latency can be more than 3 times the idle latency for the exponential region of the
bandwidth-latency curve [Figure 3.6]. Hence these simplistic models over-predict the per-
formance as the memory latency overhead is lesser in these models compared to AMC.
Further, the queuing model performs closer to AMC at higher bandwidths due to its model-
ing of bandwidth limitations. The memory latency increases with the processor’s requested
bandwidth. Since both the idle latency models are over-predicting the performance at lower
bandwidths, queuing model becomes more conservative and behave closer to AMC at
higher bandwidths.
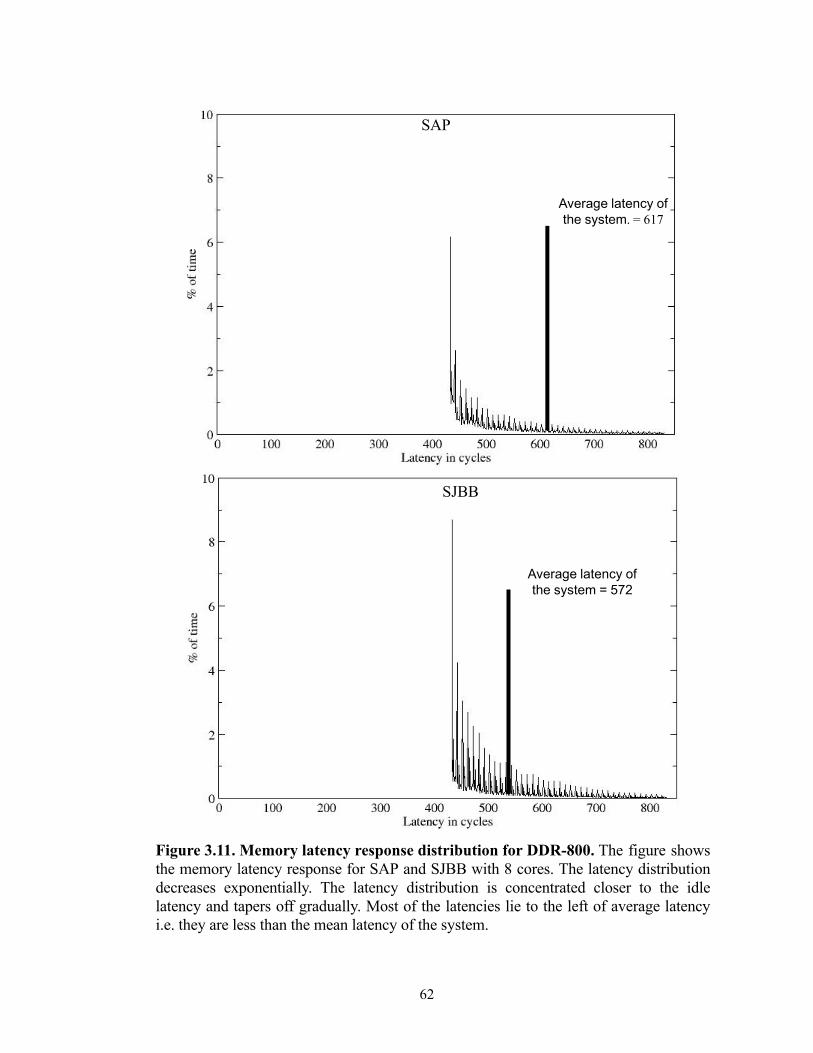
62
SAP
SJBB
Figure 3.11. Memory latency response distribution for DDR-800. The figure showsthe memory latency response for SAP and SJBB with 8 cores. The latency distributiondecreases exponentially. The latency distribution is concentrated closer to the idlelatency and tapers off gradually. Most of the latencies lie to the left of average latencyi.e. they are less than the mean latency of the system.
Average latency of the system = 572
Average latency of the system. = 617
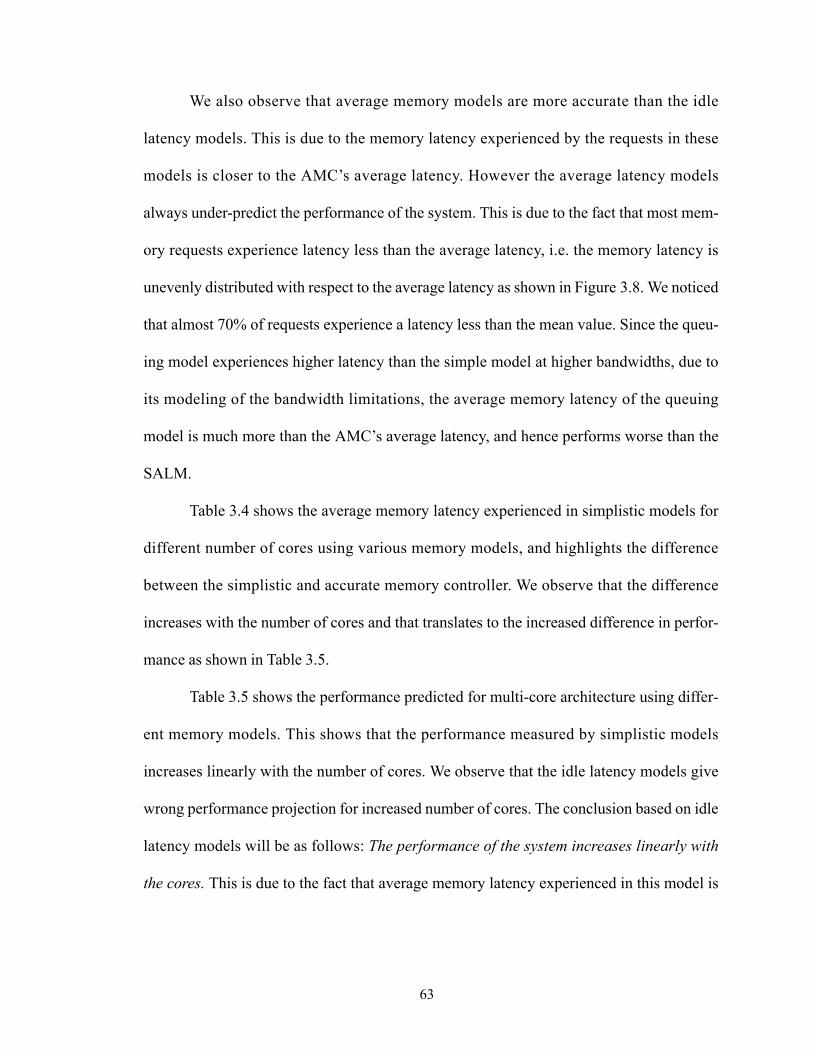
63
We also observe that average memory models are more accurate than the idle
latency models. This is due to the memory latency experienced by the requests in these
models is closer to the AMC’s average latency. However the average latency models
always under-predict the performance of the system. This is due to the fact that most mem-
ory requests experience latency less than the average latency, i.e. the memory latency is
unevenly distributed with respect to the average latency as shown in Figure 3.8. We noticed
that almost 70% of requests experience a latency less than the mean value. Since the queu-
ing model experiences higher latency than the simple model at higher bandwidths, due to
its modeling of the bandwidth limitations, the average memory latency of the queuing
model is much more than the AMC’s average latency, and hence performs worse than the
SALM.
Table 3.4 shows the average memory latency experienced in simplistic models for
different number of cores using various memory models, and highlights the difference
between the simplistic and accurate memory controller. We observe that the difference
increases with the number of cores and that translates to the increased difference in perfor-
mance as shown in Table 3.5.
Table 3.5 shows the performance predicted for multi-core architecture using differ-
ent memory models. This shows that the performance measured by simplistic models
increases linearly with the number of cores. We observe that the idle latency models give
wrong performance projection for increased number of cores. The conclusion based on idle
latency models will be as follows: The performance of the system increases linearly with
the cores. This is due to the fact that average memory latency experienced in this model is
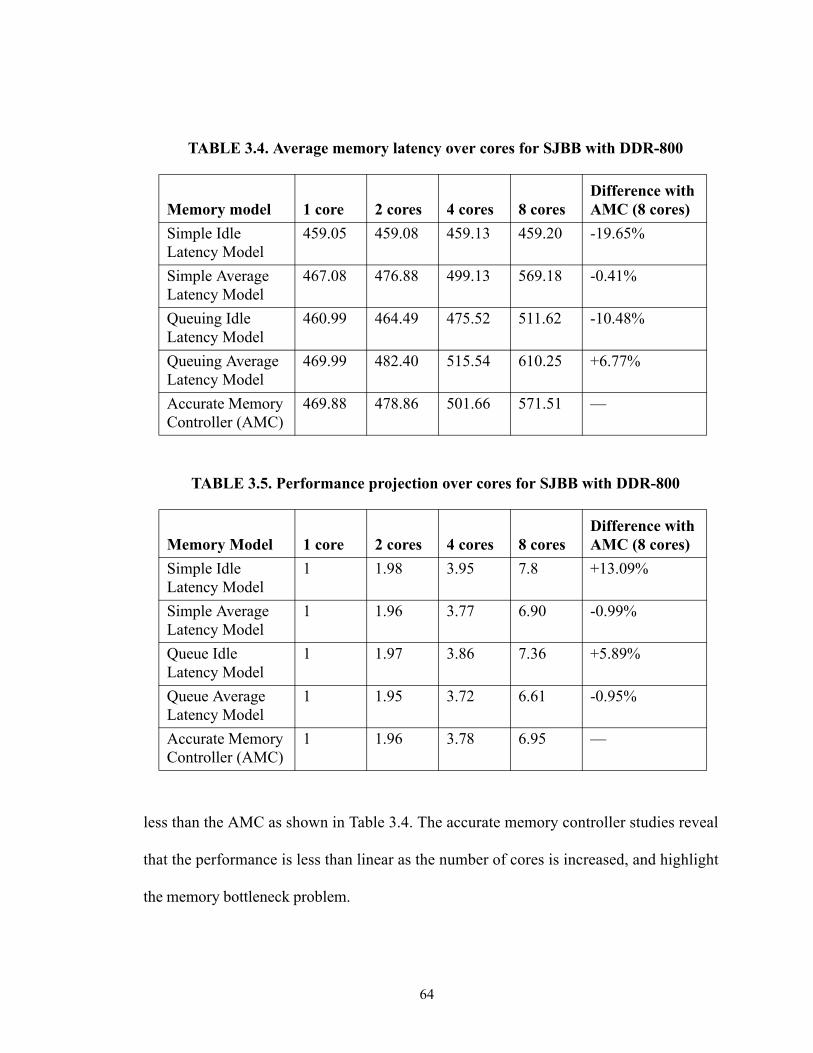
64
less than the AMC as shown in Table 3.4. The accurate memory controller studies reveal
that the performance is less than linear as the number of cores is increased, and highlight
the memory bottleneck problem.
TABLE 3.4. Average memory latency over cores for SJBB with DDR-800
TABLE 3.5. Performance projection over cores for SJBB with DDR-800
Memory model 1 core 2 cores 4 cores 8 coresDifference with AMC (8 cores)
Simple Idle Latency Model
459.05 459.08 459.13 459.20 -19.65%
Simple Average Latency Model
467.08 476.88 499.13 569.18 -0.41%
Queuing Idle Latency Model
460.99 464.49 475.52 511.62 -10.48%
Queuing Average Latency Model
469.99 482.40 515.54 610.25 +6.77%
Accurate Memory Controller (AMC)
469.88 478.86 501.66 571.51 —
Memory Model 1 core 2 cores 4 cores 8 coresDifference with AMC (8 cores)
Simple Idle Latency Model
1 1.98 3.95 7.8 +13.09%
Simple Average Latency Model
1 1.96 3.77 6.90 -0.99%
Queue Idle Latency Model
1 1.97 3.86 7.36 +5.89%
Queue Average Latency Model
1 1.95 3.72 6.61 -0.95%
Accurate Memory Controller (AMC)
1 1.96 3.78 6.95 —
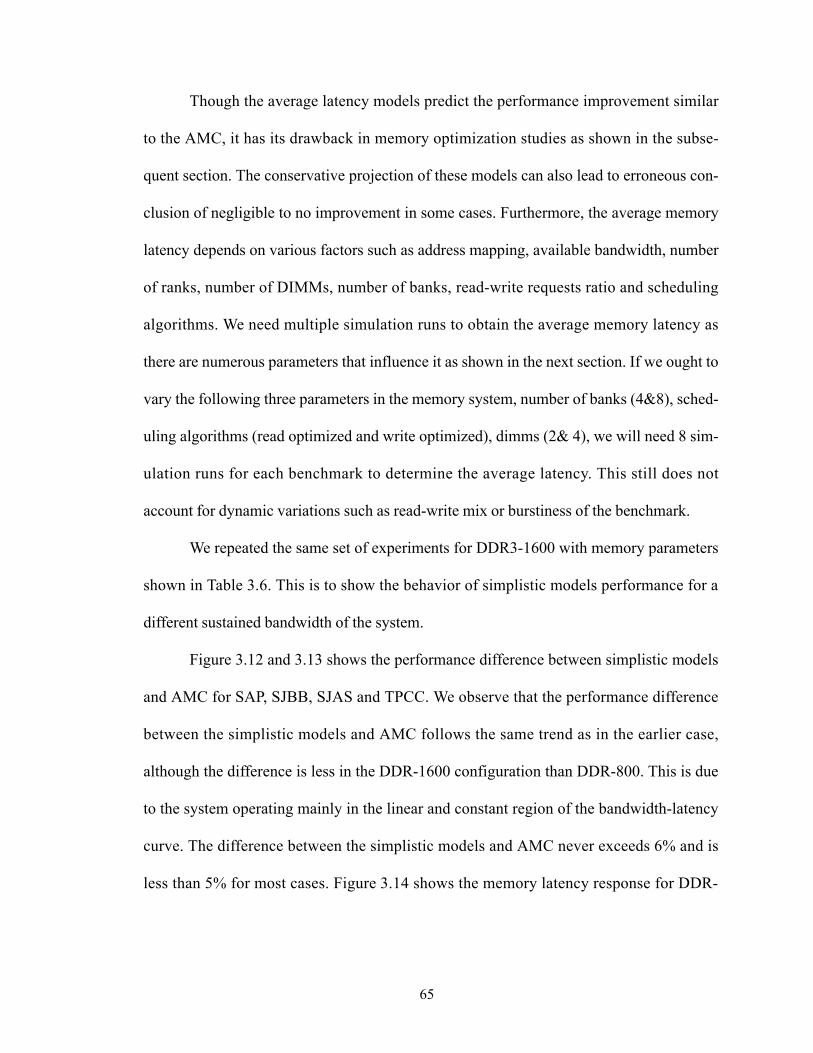
65
Though the average latency models predict the performance improvement similar
to the AMC, it has its drawback in memory optimization studies as shown in the subse-
quent section. The conservative projection of these models can also lead to erroneous con-
clusion of negligible to no improvement in some cases. Furthermore, the average memory
latency depends on various factors such as address mapping, available bandwidth, number
of ranks, number of DIMMs, number of banks, read-write requests ratio and scheduling
algorithms. We need multiple simulation runs to obtain the average memory latency as
there are numerous parameters that influence it as shown in the next section. If we ought to
vary the following three parameters in the memory system, number of banks (4&8), sched-
uling algorithms (read optimized and write optimized), dimms (2& 4), we will need 8 sim-
ulation runs for each benchmark to determine the average latency. This still does not
account for dynamic variations such as read-write mix or burstiness of the benchmark.
We repeated the same set of experiments for DDR3-1600 with memory parameters
shown in Table 3.6. This is to show the behavior of simplistic models performance for a
different sustained bandwidth of the system.
Figure 3.12 and 3.13 shows the performance difference between simplistic models
and AMC for SAP, SJBB, SJAS and TPCC. We observe that the performance difference
between the simplistic models and AMC follows the same trend as in the earlier case,
although the difference is less in the DDR-1600 configuration than DDR-800. This is due
to the system operating mainly in the linear and constant region of the bandwidth-latency
curve. The difference between the simplistic models and AMC never exceeds 6% and is
less than 5% for most cases. Figure 3.14 shows the memory latency response for DDR-
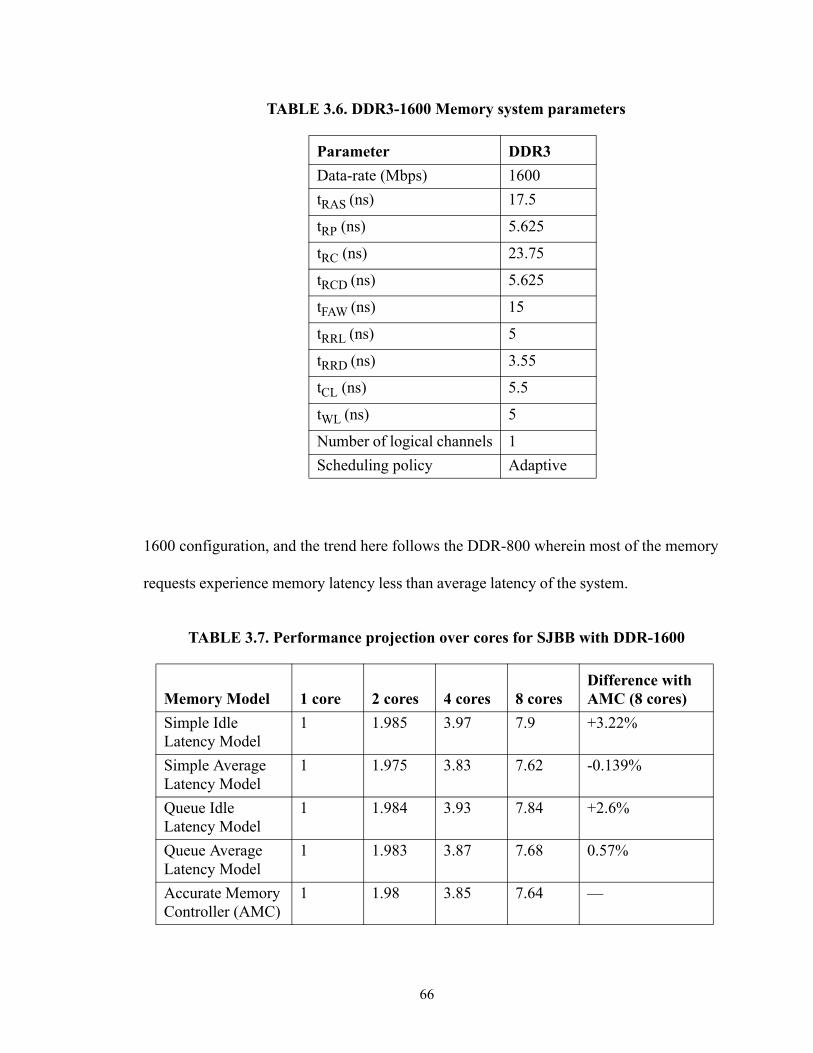
66
1600 configuration, and the trend here follows the DDR-800 wherein most of the memory
requests experience memory latency less than average latency of the system.
TABLE 3.6. DDR3-1600 Memory system parameters
Parameter DDR3Data-rate (Mbps) 1600tRAS (ns) 17.5
tRP (ns) 5.625
tRC (ns) 23.75
tRCD (ns) 5.625
tFAW (ns) 15
tRRL (ns) 5
tRRD (ns) 3.55
tCL (ns) 5.5
tWL (ns) 5
Number of logical channels 1Scheduling policy Adaptive
TABLE 3.7. Performance projection over cores for SJBB with DDR-1600
Memory Model 1 core 2 cores 4 cores 8 coresDifference with AMC (8 cores)
Simple Idle Latency Model
1 1.985 3.97 7.9 +3.22%
Simple Average Latency Model
1 1.975 3.83 7.62 -0.139%
Queue Idle Latency Model
1 1.984 3.93 7.84 +2.6%
Queue Average Latency Model
1 1.983 3.87 7.68 0.57%
Accurate Memory Controller (AMC)
1 1.98 3.85 7.64 —
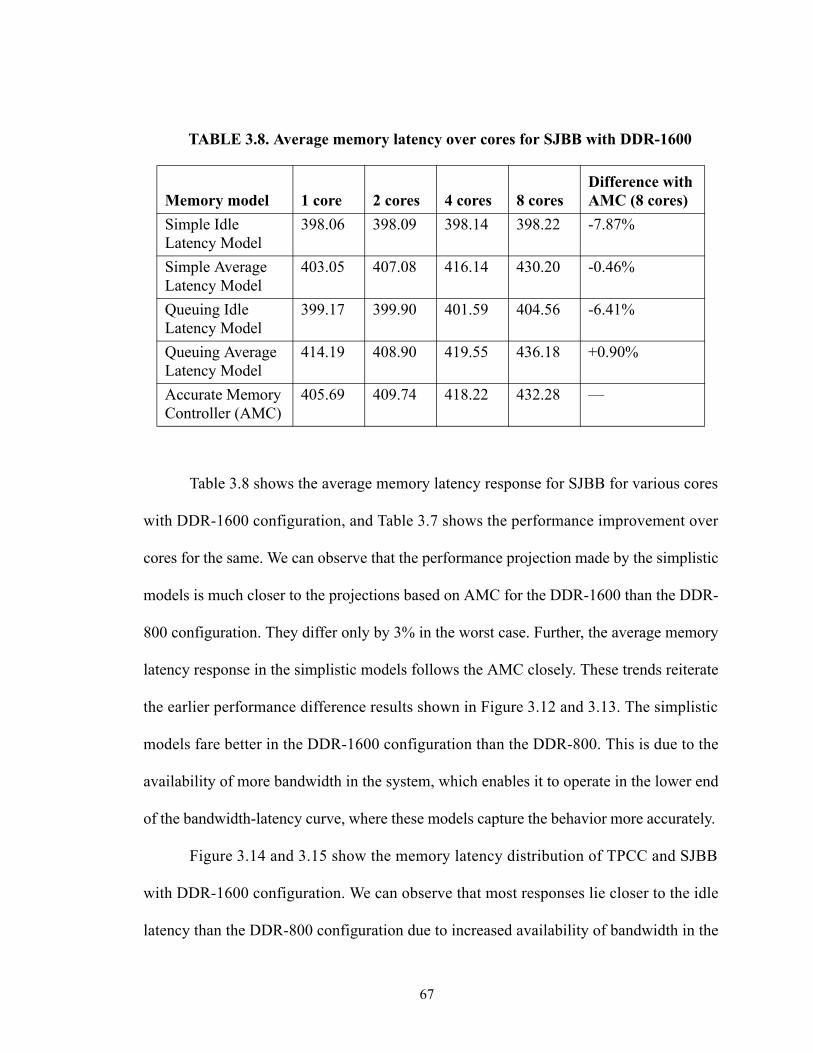
67
Table 3.8 shows the average memory latency response for SJBB for various cores
with DDR-1600 configuration, and Table 3.7 shows the performance improvement over
cores for the same. We can observe that the performance projection made by the simplistic
models is much closer to the projections based on AMC for the DDR-1600 than the DDR-
800 configuration. They differ only by 3% in the worst case. Further, the average memory
latency response in the simplistic models follows the AMC closely. These trends reiterate
the earlier performance difference results shown in Figure 3.12 and 3.13. The simplistic
models fare better in the DDR-1600 configuration than the DDR-800. This is due to the
availability of more bandwidth in the system, which enables it to operate in the lower end
of the bandwidth-latency curve, where these models capture the behavior more accurately.
Figure 3.14 and 3.15 show the memory latency distribution of TPCC and SJBB
with DDR-1600 configuration. We can observe that most responses lie closer to the idle
latency than the DDR-800 configuration due to increased availability of bandwidth in the
TABLE 3.8. Average memory latency over cores for SJBB with DDR-1600
Memory model 1 core 2 cores 4 cores 8 coresDifference with AMC (8 cores)
Simple Idle Latency Model
398.06 398.09 398.14 398.22 -7.87%
Simple Average Latency Model
403.05 407.08 416.14 430.20 -0.46%
Queuing Idle Latency Model
399.17 399.90 401.59 404.56 -6.41%
Queuing Average Latency Model
414.19 408.90 419.55 436.18 +0.90%
Accurate Memory Controller (AMC)
405.69 409.74 418.22 432.28 —
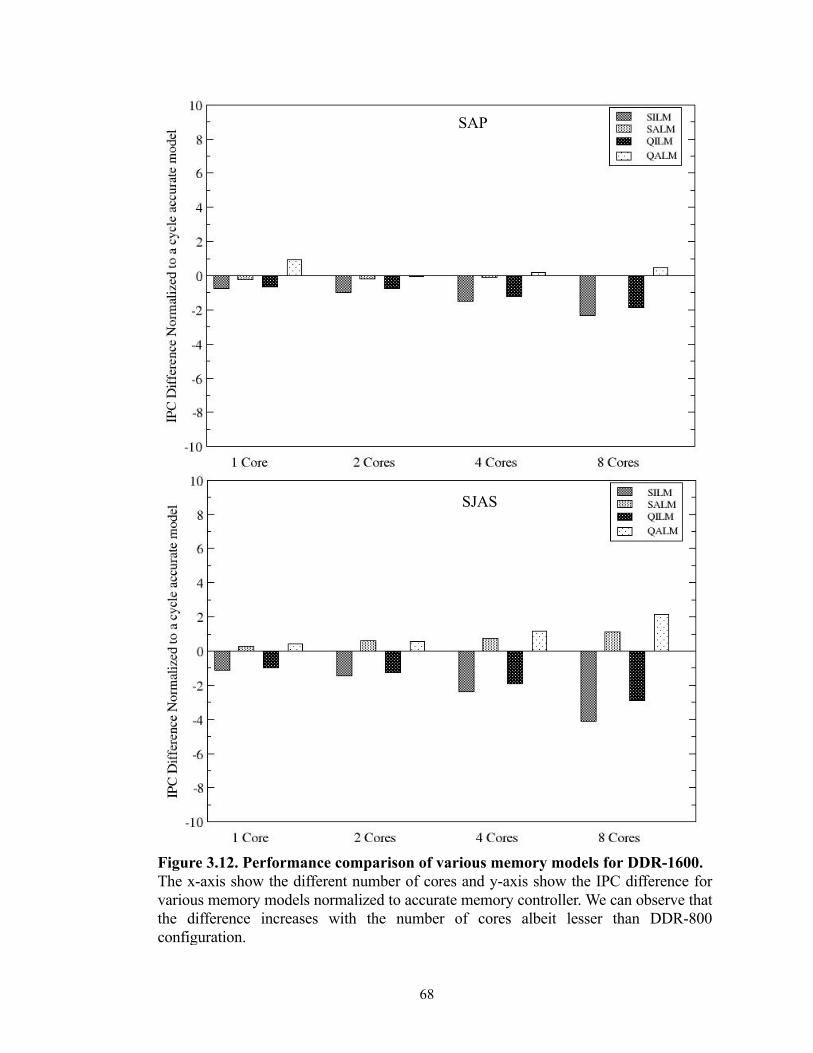
68
SAP
SJAS
Figure 3.12. Performance comparison of various memory models for DDR-1600. The x-axis show the different number of cores and y-axis show the IPC difference forvarious memory models normalized to accurate memory controller. We can observe thatthe difference increases with the number of cores albeit lesser than DDR-800configuration.
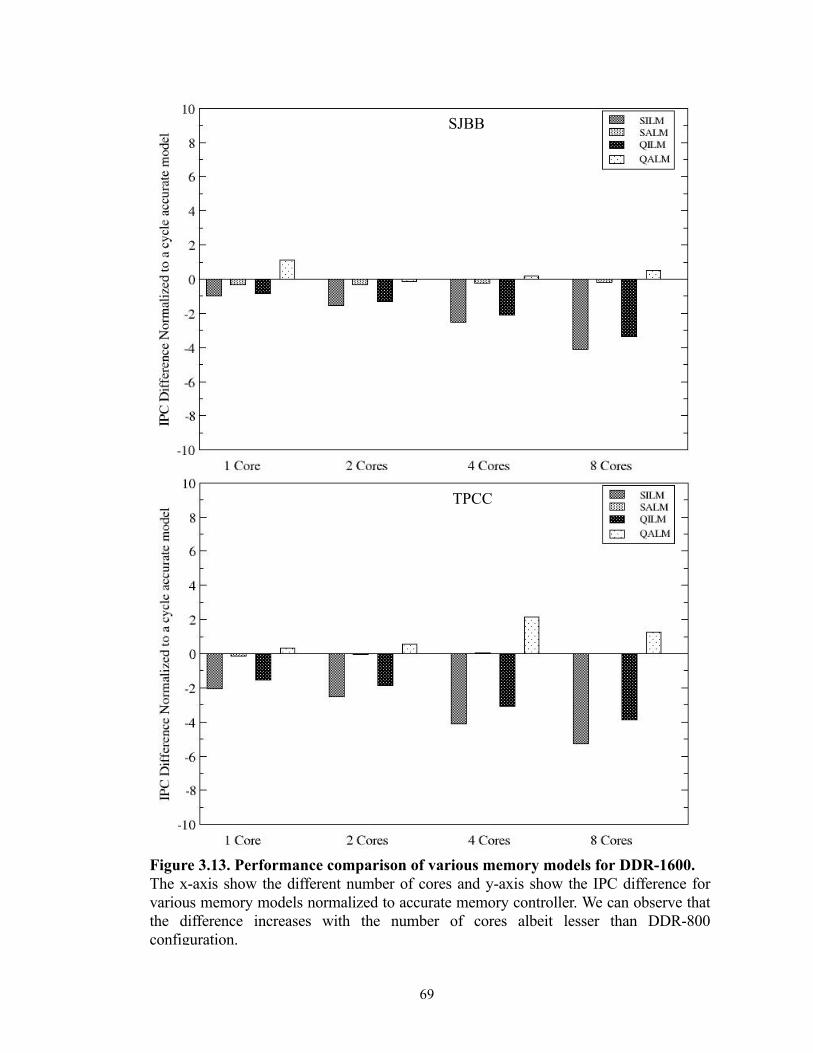
69
SJBB
TPCC
Figure 3.13. Performance comparison of various memory models for DDR-1600. The x-axis show the different number of cores and y-axis show the IPC difference forvarious memory models normalized to accurate memory controller. We can observe thatthe difference increases with the number of cores albeit lesser than DDR-800configuration.
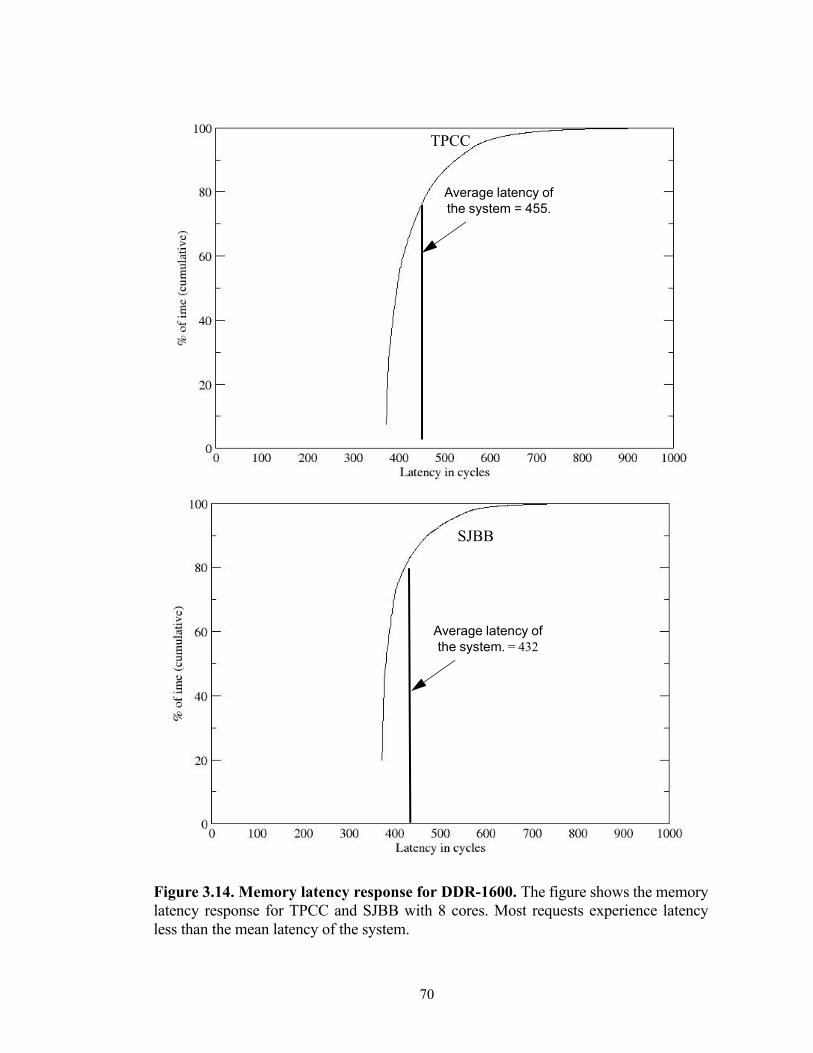
70
SJBB
TPCC
Figure 3.14. Memory latency response for DDR-1600. The figure shows the memorylatency response for TPCC and SJBB with 8 cores. Most requests experience latencyless than the mean latency of the system.
Average latency of the system = 455.
Average latency of the system. = 432
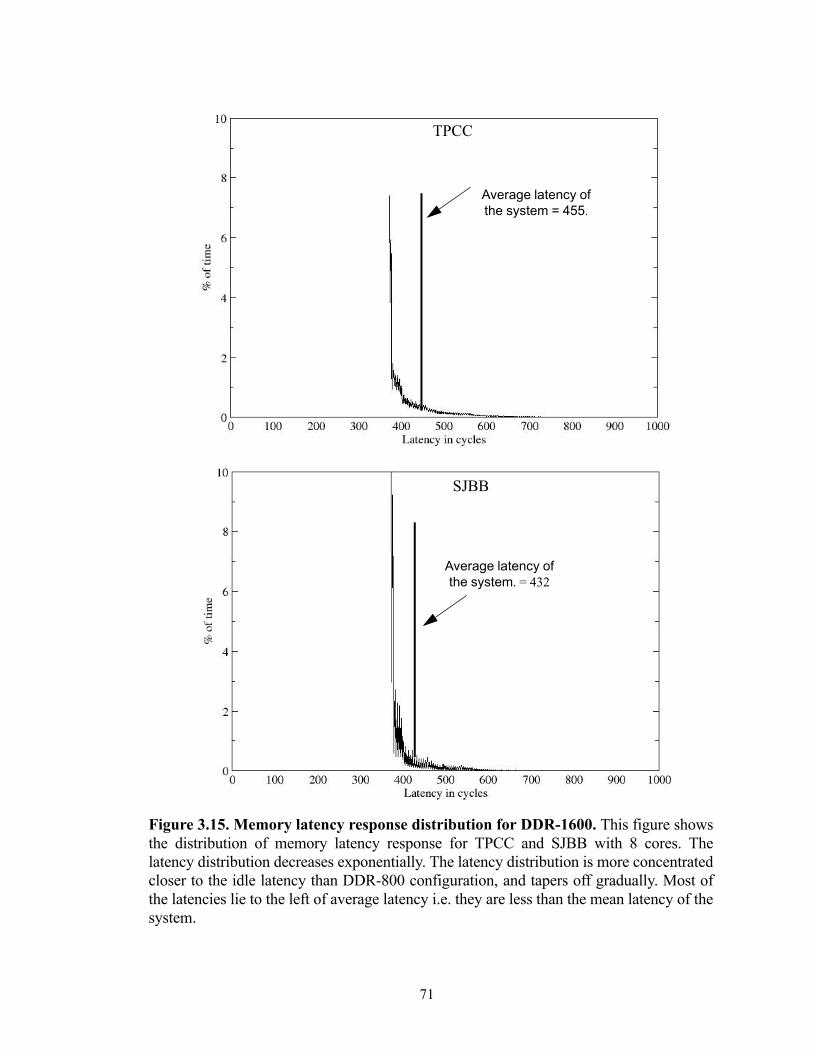
71
TPCC
SJBB
Figure 3.15. Memory latency response distribution for DDR-1600. This figure showsthe distribution of memory latency response for TPCC and SJBB with 8 cores. Thelatency distribution decreases exponentially. The latency distribution is more concentratedcloser to the idle latency than DDR-800 configuration, and tapers off gradually. Most ofthe latencies lie to the left of average latency i.e. they are less than the mean latency of thesystem.
Average latency of the system. = 432
Average latency of the system = 455.
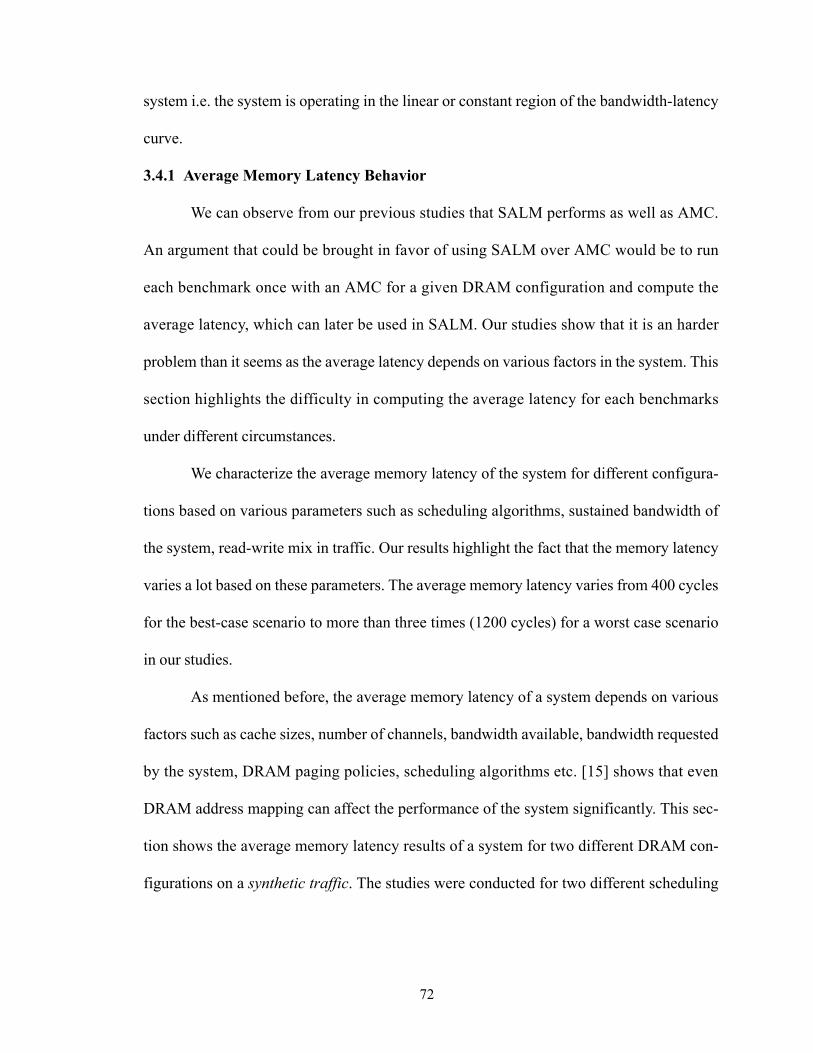
72
system i.e. the system is operating in the linear or constant region of the bandwidth-latency
curve.
3.4.1 Average Memory Latency Behavior
We can observe from our previous studies that SALM performs as well as AMC.
An argument that could be brought in favor of using SALM over AMC would be to run
each benchmark once with an AMC for a given DRAM configuration and compute the
average latency, which can later be used in SALM. Our studies show that it is an harder
problem than it seems as the average latency depends on various factors in the system. This
section highlights the difficulty in computing the average latency for each benchmarks
under different circumstances.
We characterize the average memory latency of the system for different configura-
tions based on various parameters such as scheduling algorithms, sustained bandwidth of
the system, read-write mix in traffic. Our results highlight the fact that the memory latency
varies a lot based on these parameters. The average memory latency varies from 400 cycles
for the best-case scenario to more than three times (1200 cycles) for a worst case scenario
in our studies.
As mentioned before, the average memory latency of a system depends on various
factors such as cache sizes, number of channels, bandwidth available, bandwidth requested
by the system, DRAM paging policies, scheduling algorithms etc. [15] shows that even
DRAM address mapping can affect the performance of the system significantly. This sec-
tion shows the average memory latency results of a system for two different DRAM con-
figurations on a synthetic traffic. The studies were conducted for two different scheduling
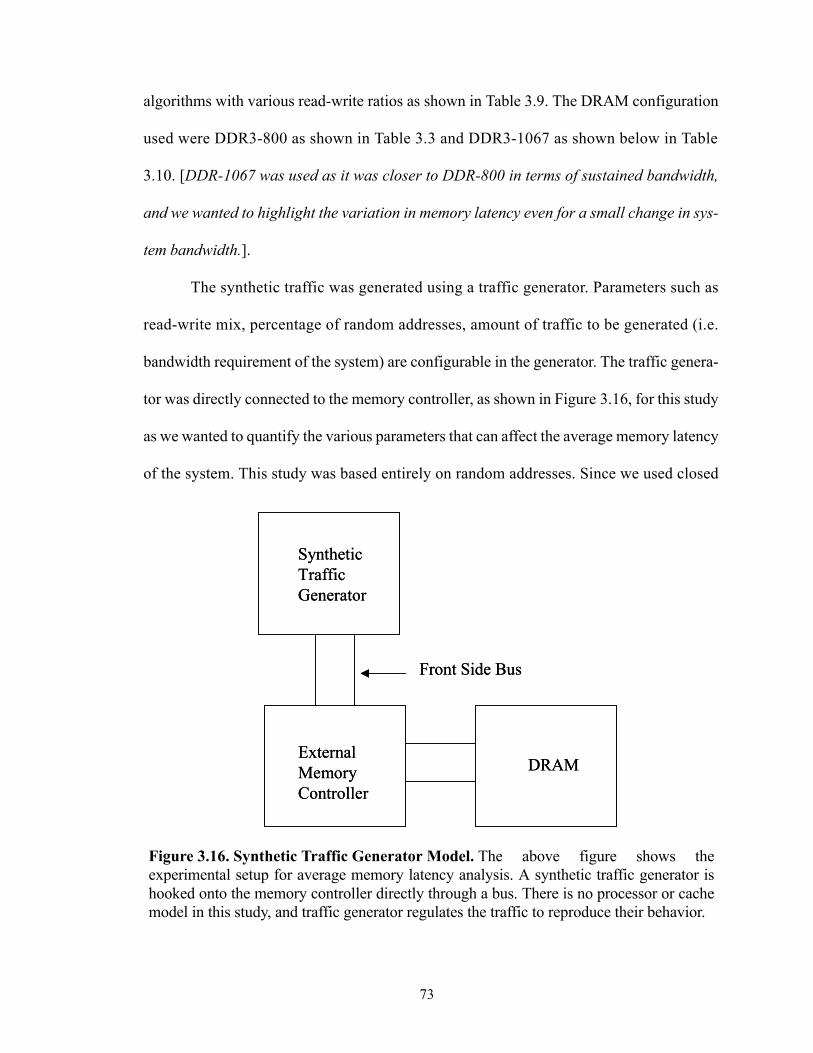
73
algorithms with various read-write ratios as shown in Table 3.9. The DRAM configuration
used were DDR3-800 as shown in Table 3.3 and DDR3-1067 as shown below in Table
3.10. [DDR-1067 was used as it was closer to DDR-800 in terms of sustained bandwidth,
and we wanted to highlight the variation in memory latency even for a small change in sys-
tem bandwidth.].
The synthetic traffic was generated using a traffic generator. Parameters such as
read-write mix, percentage of random addresses, amount of traffic to be generated (i.e.
bandwidth requirement of the system) are configurable in the generator. The traffic genera-
tor was directly connected to the memory controller, as shown in Figure 3.16, for this study
as we wanted to quantify the various parameters that can affect the average memory latency
of the system. This study was based entirely on random addresses. Since we used closed
Figure 3.16. Synthetic Traffic Generator Model. The above figure shows theexperimental setup for average memory latency analysis. A synthetic traffic generator ishooked onto the memory controller directly through a bus. There is no processor or cachemodel in this study, and traffic generator regulates the traffic to reproduce their behavior.
Synthetic Traffic Generator
External Memory Controller
DRAM
Front Side Bus
Synthetic Traffic Generator
External Memory Controller
DRAM
Front Side Bus
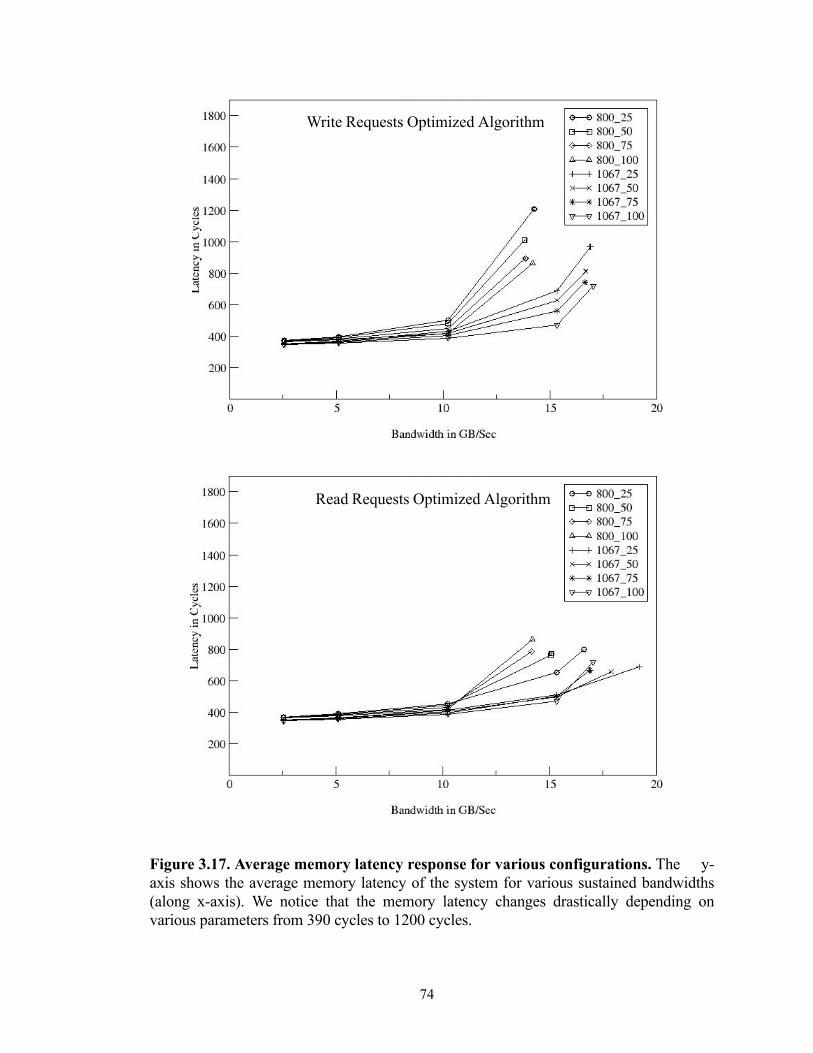
74
Write Requests Optimized Algorithm
Figure 3.17. Average memory latency response for various configurations. The y-axis shows the average memory latency of the system for various sustained bandwidths(along x-axis). We notice that the memory latency changes drastically depending onvarious parameters from 390 cycles to 1200 cycles.
Read Requests Optimized Algorithm
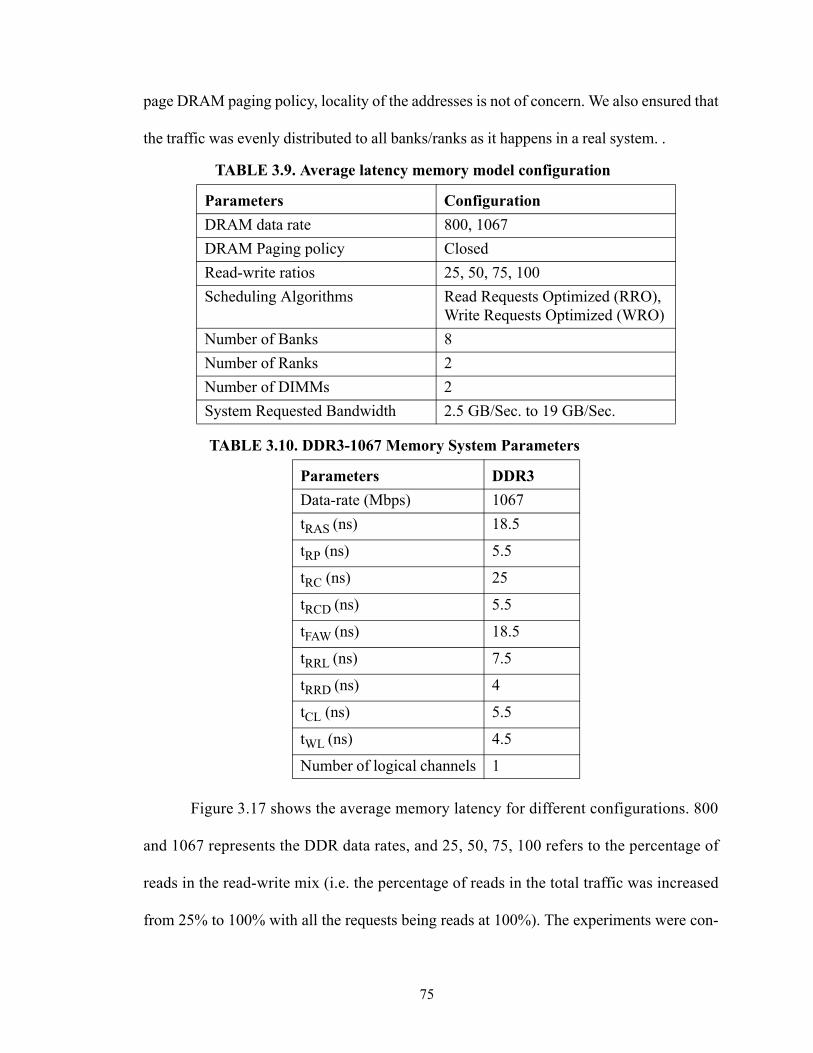
75
page DRAM paging policy, locality of the addresses is not of concern. We also ensured that
the traffic was evenly distributed to all banks/ranks as it happens in a real system. .
Figure 3.17 shows the average memory latency for different configurations. 800
and 1067 represents the DDR data rates, and 25, 50, 75, 100 refers to the percentage of
reads in the read-write mix (i.e. the percentage of reads in the total traffic was increased
from 25% to 100% with all the requests being reads at 100%). The experiments were con-
TABLE 3.9. Average latency memory model configuration
Parameters Configuration DRAM data rate 800, 1067DRAM Paging policy ClosedRead-write ratios 25, 50, 75, 100Scheduling Algorithms Read Requests Optimized (RRO),
Write Requests Optimized (WRO)Number of Banks 8Number of Ranks 2Number of DIMMs 2System Requested Bandwidth 2.5 GB/Sec. to 19 GB/Sec.
TABLE 3.10. DDR3-1067 Memory System Parameters
Parameters DDR3Data-rate (Mbps) 1067tRAS (ns) 18.5
tRP (ns) 5.5
tRC (ns) 25
tRCD (ns) 5.5
tFAW (ns) 18.5
tRRL (ns) 7.5
tRRD (ns) 4
tCL (ns) 5.5
tWL (ns) 4.5
Number of logical channels 1
76
ducted using synthetic traffic on closed page DRAM system. The two graphs show the
results for two different scheduling algorithms with one of them being optimized for
writes, and the other optimized for reads. Write requests are given priority in the write opti-
mized algorithm (WRO), and the read optimized algorithm (RRO) gives priority to read
requests.
Our results show that the memory latency ranges from 390 cycles for read opti-
mized algorithm at 2.5 GB/Sec. of system bandwidth to 1200 cycles for a write optimized
algorithm at 14 GB/Sec. The latency increases from 900 to 1200 cycles for DDR 800 when
the scheduling algorithm is changed from RRO to WRO. The latency changes from 390
cycles to 900 cycles for a system bandwidth change from 2.5 GB/Sec. to 15 GB/Sec.
Further, the latency changes from 400 to 800 cycles as the DRAM configuration is
changed from DDR-800 to DDR-1067 at 14GB/Sec. with RRO. For the same bandwidth
and read-write mix, the latency increases from 600 to 1200 in a system with WRO as the
DRAM configuration is changed from DDR-800 to DDR-1067. This is because of the sys-
tem shifting its operating zone from linear to exponential region in DDR-800 system as
shown in Figure 1.3. The system continues its operation in linear region for DDR-1067 due
to higher available bandwidth.
The latency decreases from 800 to 500 cycles when the percentage of reads in the
traffic is increased from 25% to 100% in DDR-800 system with RRO algorithm for the
same bandwidth (14 GB/Sec.). In a similar scenario with WRO the latency decreases from
1200 to 800 cycles. We also observe that the sustained bandwidth of the system increases
from 14 GB/Sec. to 16 GB/Sec. in DDR-800 system with RRO when the traffic consists of
77
entirely read requests from 25%. This is because of the reduced read-to-write and write-to-
read turn around time overheads.
Our results conclusively prove that the average memory latency of a system
depends on various factors, and a separate simulation run is needed to determine the aver-
age latency for each possible configuration. Simulating the benchmarks with cycle-accu-
rate model for each DDR-configuration once wouldn’t suffice as the latency depends on
numerous other parameters such as system requested bandwidth and read-write mix of the
workload etc. apart from the DDR data rate. These factors are heavily system dependent,
and varies with cache sizes and replacement policies as shown in [16]. Further, any changes
to the core (in terms of issue width, branch predictor) and other modules (caches, intercon-
nect etc.) can also lead to change in the system traffic pattern and rate. Thus it is hard to use
a single computed average memory latency in simplistic models.
3.5. Comparison with prefetching optimization
Prefetching has been proposed as one of the main schemes to reduce memory
latency. This section shows the impact on the performance, of various memory models
when the system implements prefetching. The prefetching model under study uses a hard-
ware stream prefetcher with a stream depth of 5. Each L3 cache miss (last level cache) ini-
tiates a memory request for the missing line and 5 subsequent lines. The memory, cache
and interconnect modules remained the same as the previous study. The cache misses and
prefetch requests are given the same priority in the memory controller.
Stream prefetchers/buffers were first proposed in [17]. Stream buffers prefetch
cache lines at starting at a cache miss address. The prefetched data was placed in a separate
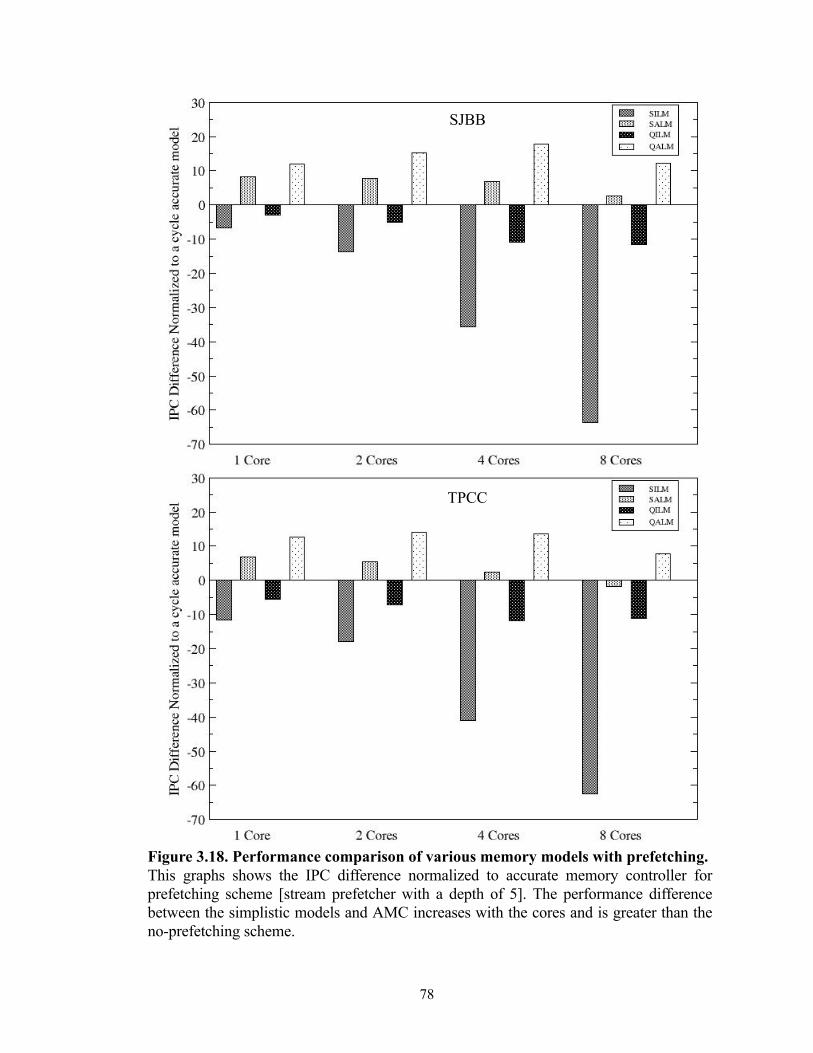
78
Figure 3.18. Performance comparison of various memory models with prefetching. This graphs shows the IPC difference normalized to accurate memory controller forprefetching scheme [stream prefetcher with a depth of 5]. The performance differencebetween the simplistic models and AMC increases with the cores and is greater than theno-prefetching scheme.
SJBB
TPCC
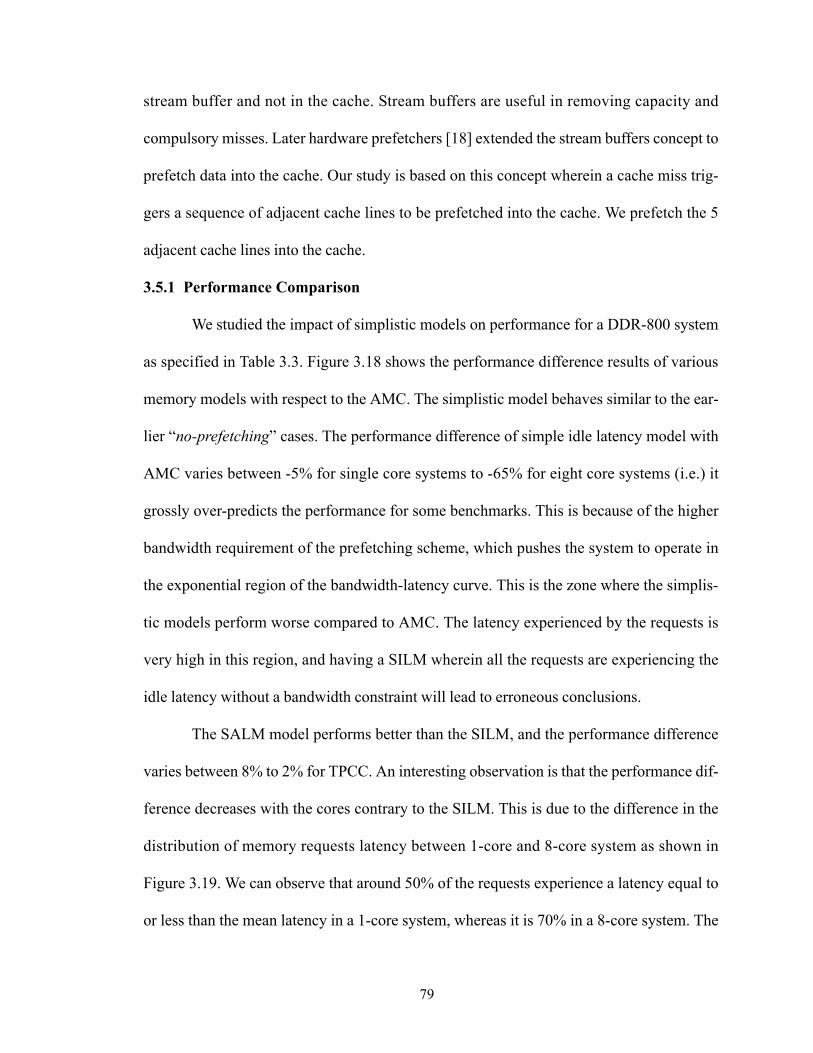
79
stream buffer and not in the cache. Stream buffers are useful in removing capacity and
compulsory misses. Later hardware prefetchers [18] extended the stream buffers concept to
prefetch data into the cache. Our study is based on this concept wherein a cache miss trig-
gers a sequence of adjacent cache lines to be prefetched into the cache. We prefetch the 5
adjacent cache lines into the cache.
3.5.1 Performance Comparison
We studied the impact of simplistic models on performance for a DDR-800 system
as specified in Table 3.3. Figure 3.18 shows the performance difference results of various
memory models with respect to the AMC. The simplistic model behaves similar to the ear-
lier “no-prefetching” cases. The performance difference of simple idle latency model with
AMC varies between -5% for single core systems to -65% for eight core systems (i.e.) it
grossly over-predicts the performance for some benchmarks. This is because of the higher
bandwidth requirement of the prefetching scheme, which pushes the system to operate in
the exponential region of the bandwidth-latency curve. This is the zone where the simplis-
tic models perform worse compared to AMC. The latency experienced by the requests is
very high in this region, and having a SILM wherein all the requests are experiencing the
idle latency without a bandwidth constraint will lead to erroneous conclusions.
The SALM model performs better than the SILM, and the performance difference
varies between 8% to 2% for TPCC. An interesting observation is that the performance dif-
ference decreases with the cores contrary to the SILM. This is due to the difference in the
distribution of memory requests latency between 1-core and 8-core system as shown in
Figure 3.19. We can observe that around 50% of the requests experience a latency equal to
or less than the mean latency in a 1-core system, whereas it is 70% in a 8-core system. The
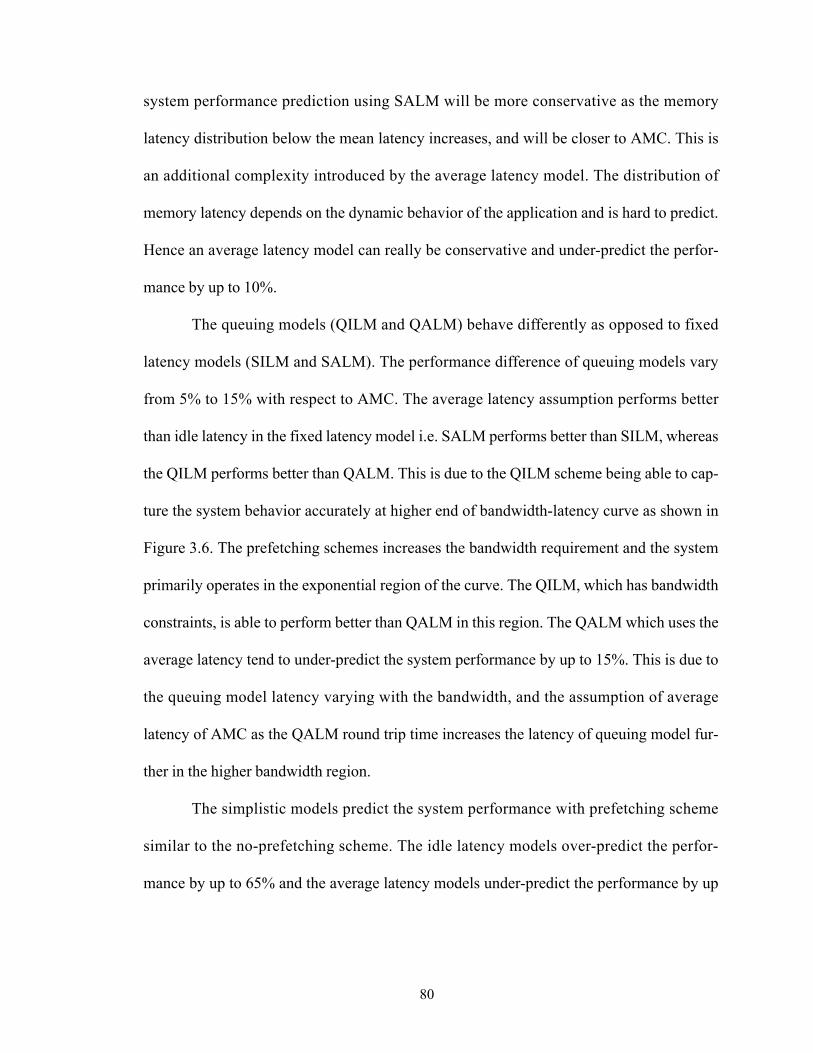
80
system performance prediction using SALM will be more conservative as the memory
latency distribution below the mean latency increases, and will be closer to AMC. This is
an additional complexity introduced by the average latency model. The distribution of
memory latency depends on the dynamic behavior of the application and is hard to predict.
Hence an average latency model can really be conservative and under-predict the perfor-
mance by up to 10%.
The queuing models (QILM and QALM) behave differently as opposed to fixed
latency models (SILM and SALM). The performance difference of queuing models vary
from 5% to 15% with respect to AMC. The average latency assumption performs better
than idle latency in the fixed latency model i.e. SALM performs better than SILM, whereas
the QILM performs better than QALM. This is due to the QILM scheme being able to cap-
ture the system behavior accurately at higher end of bandwidth-latency curve as shown in
Figure 3.6. The prefetching schemes increases the bandwidth requirement and the system
primarily operates in the exponential region of the curve. The QILM, which has bandwidth
constraints, is able to perform better than QALM in this region. The QALM which uses the
average latency tend to under-predict the system performance by up to 15%. This is due to
the queuing model latency varying with the bandwidth, and the assumption of average
latency of AMC as the QALM round trip time increases the latency of queuing model fur-
ther in the higher bandwidth region.
The simplistic models predict the system performance with prefetching scheme
similar to the no-prefetching scheme. The idle latency models over-predict the perfor-
mance by up to 65% and the average latency models under-predict the performance by up
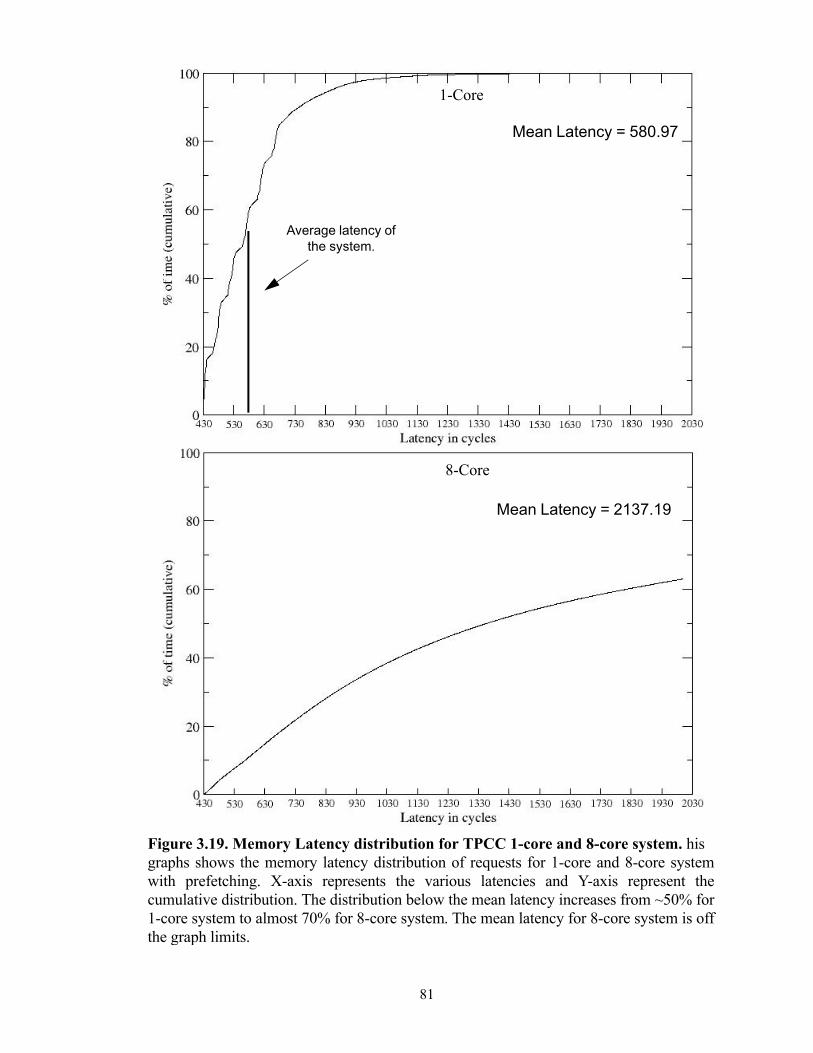
81
1-Core
8-Core
Figure 3.19. Memory Latency distribution for TPCC 1-core and 8-core system. hisgraphs shows the memory latency distribution of requests for 1-core and 8-core systemwith prefetching. X-axis represents the various latencies and Y-axis represent thecumulative distribution. The distribution below the mean latency increases from ~50% for1-core system to almost 70% for 8-core system. The mean latency for 8-core system is offthe graph limits.
Mean Latency = 580.97
Mean Latency = 2137.19
Average latency of the system.
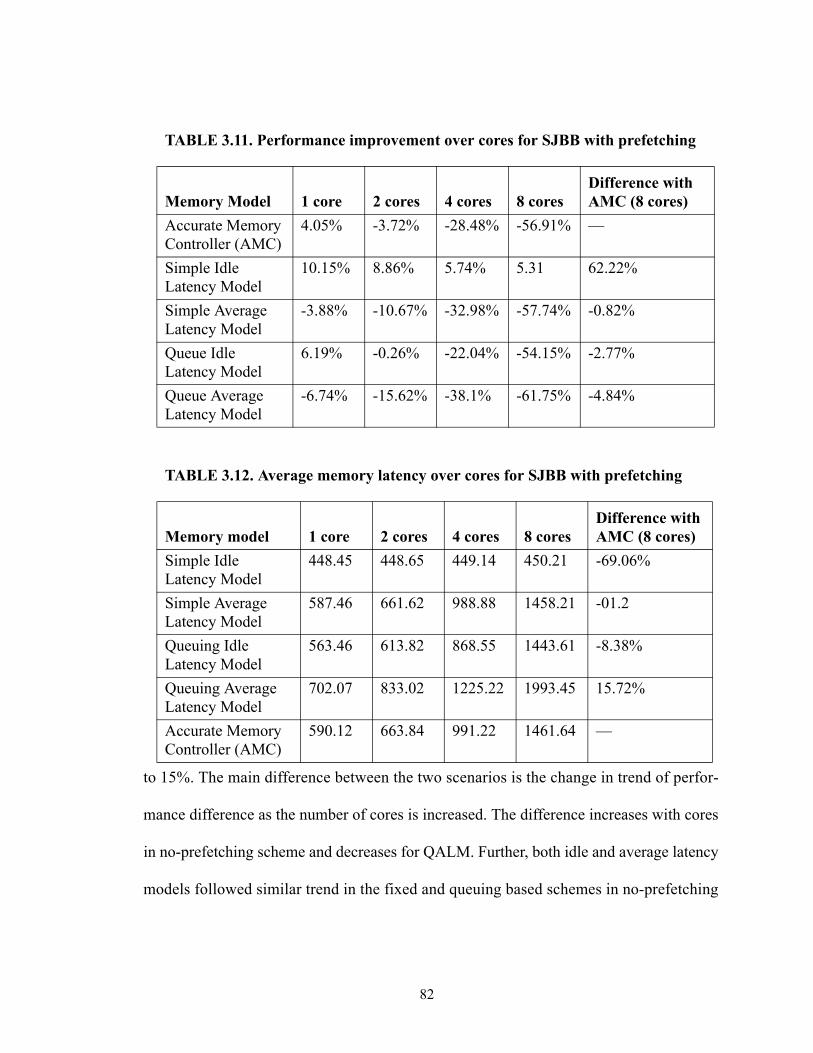
82
to 15%. The main difference between the two scenarios is the change in trend of perfor-
mance difference as the number of cores is increased. The difference increases with cores
in no-prefetching scheme and decreases for QALM. Further, both idle and average latency
models followed similar trend in the fixed and queuing based schemes in no-prefetching
TABLE 3.11. Performance improvement over cores for SJBB with prefetching
TABLE 3.12. Average memory latency over cores for SJBB with prefetching
Memory Model 1 core 2 cores 4 cores 8 coresDifference with AMC (8 cores)
Accurate Memory Controller (AMC)
4.05% -3.72% -28.48% -56.91% —
Simple Idle Latency Model
10.15% 8.86% 5.74% 5.31 62.22%
Simple Average Latency Model
-3.88% -10.67% -32.98% -57.74% -0.82%
Queue Idle Latency Model
6.19% -0.26% -22.04% -54.15% -2.77%
Queue Average Latency Model
-6.74% -15.62% -38.1% -61.75% -4.84%
Memory model 1 core 2 cores 4 cores 8 coresDifference with AMC (8 cores)
Simple Idle Latency Model
448.45 448.65 449.14 450.21 -69.06%
Simple Average Latency Model
587.46 661.62 988.88 1458.21 -01.2
Queuing Idle Latency Model
563.46 613.82 868.55 1443.61 -8.38%
Queuing Average Latency Model
702.07 833.02 1225.22 1993.45 15.72%
Accurate Memory Controller (AMC)
590.12 663.84 991.22 1461.64 —
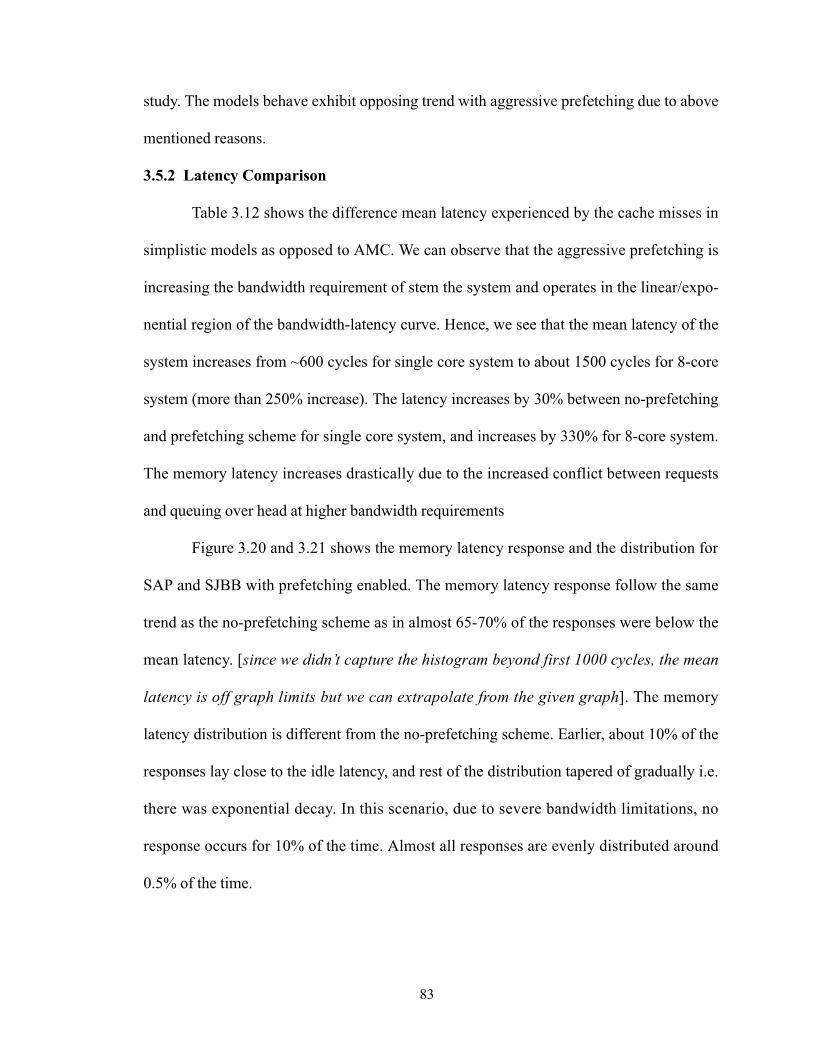
83
study. The models behave exhibit opposing trend with aggressive prefetching due to above
mentioned reasons.
3.5.2 Latency Comparison
Table 3.12 shows the difference mean latency experienced by the cache misses in
simplistic models as opposed to AMC. We can observe that the aggressive prefetching is
increasing the bandwidth requirement of stem the system and operates in the linear/expo-
nential region of the bandwidth-latency curve. Hence, we see that the mean latency of the
system increases from ~600 cycles for single core system to about 1500 cycles for 8-core
system (more than 250% increase). The latency increases by 30% between no-prefetching
and prefetching scheme for single core system, and increases by 330% for 8-core system.
The memory latency increases drastically due to the increased conflict between requests
and queuing over head at higher bandwidth requirements
Figure 3.20 and 3.21 shows the memory latency response and the distribution for
SAP and SJBB with prefetching enabled. The memory latency response follow the same
trend as the no-prefetching scheme as in almost 65-70% of the responses were below the
mean latency. [since we didn’t capture the histogram beyond first 1000 cycles, the mean
latency is off graph limits but we can extrapolate from the given graph]. The memory
latency distribution is different from the no-prefetching scheme. Earlier, about 10% of the
responses lay close to the idle latency, and rest of the distribution tapered of gradually i.e.
there was exponential decay. In this scenario, due to severe bandwidth limitations, no
response occurs for 10% of the time. Almost all responses are evenly distributed around
0.5% of the time.
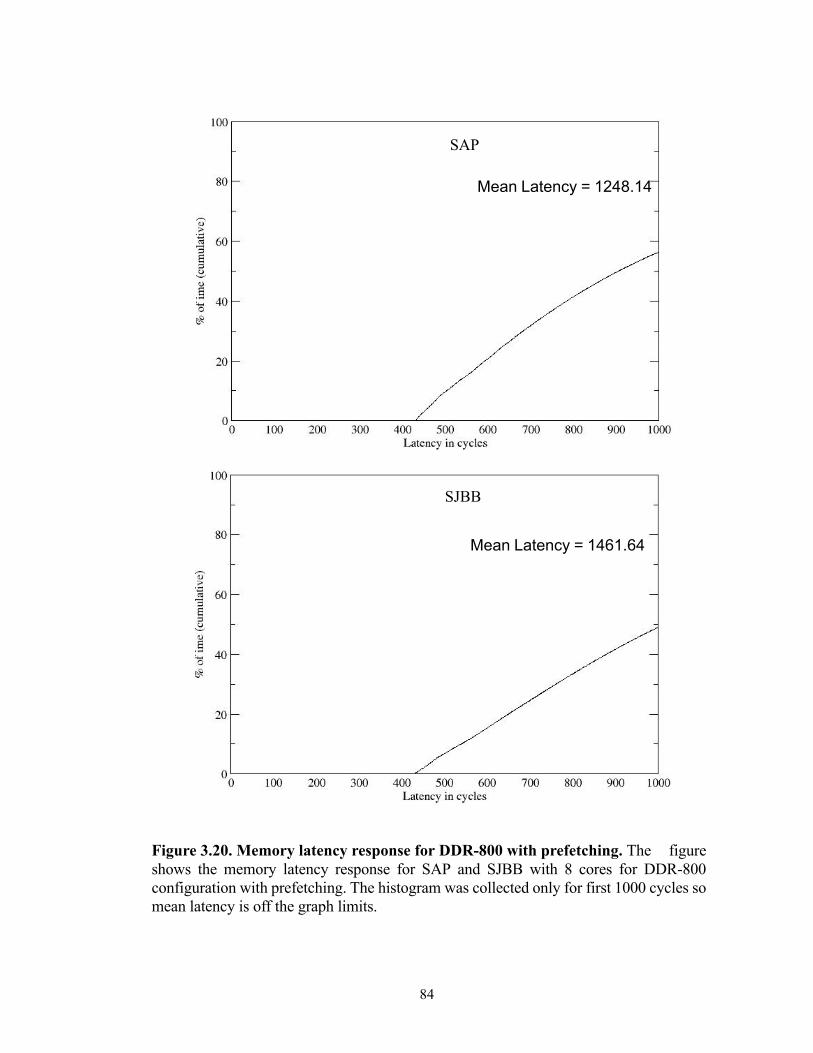
84
SJBB
SAP
Mean Latency = 1248.14
Mean Latency = 1461.64
Figure 3.20. Memory latency response for DDR-800 with prefetching. The figureshows the memory latency response for SAP and SJBB with 8 cores for DDR-800configuration with prefetching. The histogram was collected only for first 1000 cycles somean latency is off the graph limits.
85
Table 3.11 shows the performance improvement with prefetching scheme by differ-
ent memory models for all the core configurations [performance improvement are com-
puted based on the no-prefetching scheme for corresponding memory models and are
normalized to single core system]. We observe that the AMC model projects a performance
improvement of 4% for single core system and degradation of 56% for 8-core system. The
performance degrades due to the system operating at the exponential region of the band-
width-latency curve thereby increasing the average memory latency. The mean latency of
the system increases from 569 cycles for no-prefetching scheme in a 8-core system to 1461
cycles for stream prefetching depth of 5 with DDR-800 configuration.
The simplistic model, especially SILM, doesn’t capture the bandwidth constraint
and hence projects a performance improvement for all the core configuration. Performance
with AMC starts degrading from 2 cores onwards, and at 8 cores the difference between
AMC and SILM is 62%. The conclusion based on SILM would be moderate to no improve-
ment with prefetching, whereas AMC shows a degradation of 56%. Here, both the absolute
performance with respect to AMC and the performance improvement due to prefetching
scheme are vastly different from the cycle accurate model.
The QALM scheme, whose absolute performance is close to AMC is still not able
to capture the performance improvement due to prefetching scheme. The QALM behavior
depends on the region (bandwidth-latency curve) of operation. It is not able to capture the
queuing over heads in the linear region, whereas is able to reproduce it in the exponential
region more faithfully. Hence it shows a performance degradation of 7% for single core
system when there is a performance improvement of almost 5%.
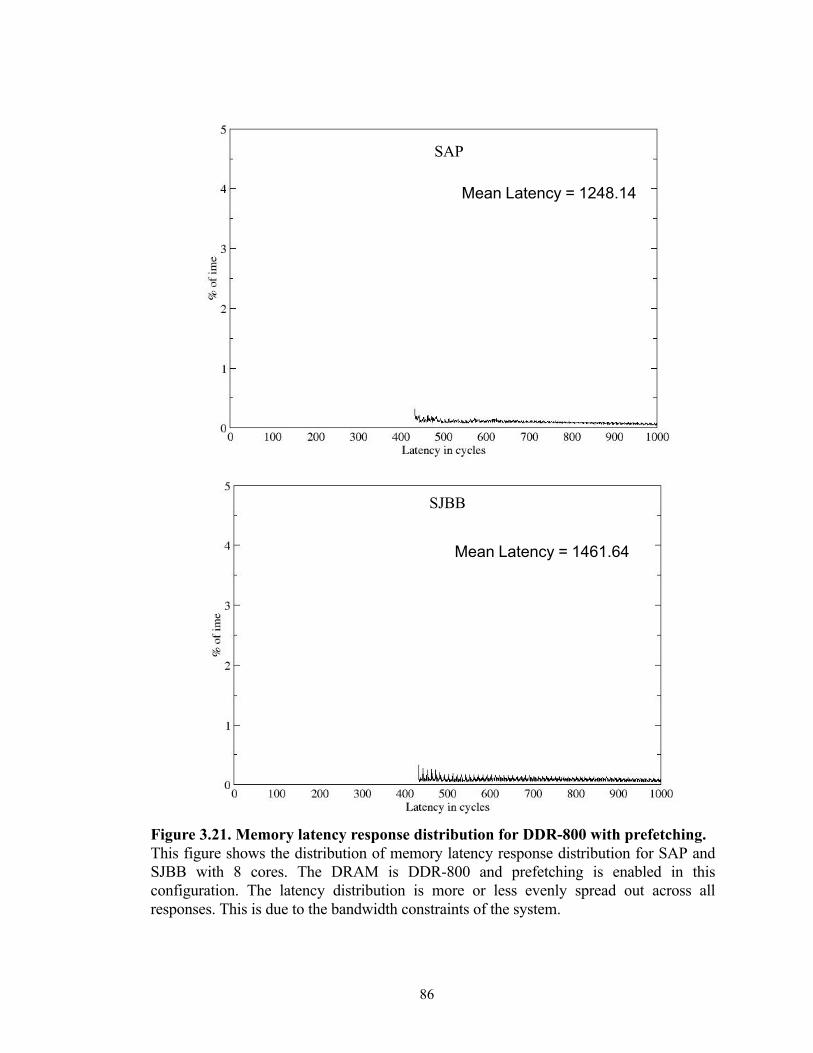
86
SJBB
SAP
Mean Latency = 1248.14
Mean Latency = 1461.64
Figure 3.21. Memory latency response distribution for DDR-800 with prefetching. This figure shows the distribution of memory latency response distribution for SAP andSJBB with 8 cores. The DRAM is DDR-800 and prefetching is enabled in thisconfiguration. The latency distribution is more or less evenly spread out across allresponses. This is due to the bandwidth constraints of the system.
87
3.6. Summary
This chapter described our simulation methodology and highlighted the drawbacks
of using inaccurate/simplistic models. One of the main argument in favor of these simplis-
tic models has been that they are sufficient to compute the performance difference between
various systems, though may not be useful for absolute values. Our studies show that these
models can be wrong both in absolute performance numbers and relative performance
comparison between different systems.
We show case studies where the simplistic models either over-predict or under-pre-
dict the system performance with respect to a cycle accurate model. We also show that
using simplistic models can lead to wrongful conclusions in terms of performance projec-
tion. There are scenarios wherein the comparison between models are similar to AMC
whereas the absolute numbers are not. In some cases both the performance comparison and
absolute numbers are different from the AMC. Under-predicting the performance can lead
to over designing the system, and will render it expensive. Over-predicting the perfor-
mance can lead to system being ineffective due to not being able to meet the performance
constraints of applications in a real world environment. Both these cases are causes of con-
cern due to simplistic models.
Our results show as the system grows in complexity more accurate models are
needed to evaluate system performance. The ease of use and speed offered by the simplistic
models are easily offset by the inaccurate results produced by them. Further, the simplistic
models are not able to capture the performance trends accurately as we observed with
prefetching schemes. SILM and QILM projected performance increase whereas the AMC
showed performance degradation due to memory contention. Thus the use of simplistic

88
models can lead to erroneous conclusions, wherever memory is the bottleneck, which can
be avoided using accurate memory models.
89
Chapter 4: Memory Side PrefetchingIn the earlier chapter, we demonstrated that inaccurate memory models can lead to
wrongful conclusions by giving artificial performance improvements for experimental
memory optimization schemes. In this chapter, we do an extended case of study of the
impact of memory side prefetching in multi-core servers with real memory systems. Mem-
ory side stream prefetching has been shown to improve performance for server workloads
that lack locality [1]. Since our results show that there is a significant amount of stride pat-
tern and since this is investigative research, we extended this idea to track different strides
in the application.
Our results show that about 30% to 45% of memory requests exhibit some type of
stride behavior in the memory accesses of commercial server workloads that have sparse
locality. Hence, a novel multi-stride prefetcher was implemented as a memory side
prefetcher to exploit this behavior. The prefetcher resides in the memory controller with a
buffer to store the prefetched data. Our optimization improves the performance of the sys-
tem by about 6% for certain workloads while degrading the performance by about 1% in
certain cases.
4.1. Strides in Server Workloads
Figure 4.1 shows the distribution of memory requests with different stride patterns
for SJBB and TPCC. This shows that there is some pattern in the memory access behavior
of the server workloads that have sparse locality. This can be exploited to reduce the mem-
ory latency of the system and correspondingly improve the performance. SPECJbb’s mem-
ory requests have the following distribution: 7% of the requests have a stride length of 1,
90
10% of the requests have a stride of 2 and 4% have a stride of 3. The memory requests also
have almost 2% distribution of each stride 4, 5 and 6.
TPCC has 13% of its memory requests with a stride length of 1, 5% of the requests
have a stride of 2, and 3% of the requests are of stride 3. Strides of 4, 5 and 6 occur in the
memory requests with an almost equal distribution of 2% each. This distribution of these
workloads doesn’t cover 100% of the memory requests as they don’t exhibit any specific
memory access pattern. Still approximately 30% of memory requests have a stride pattern of
10 or less. [Note: The stride pattern shown in the graph is cumulative and is not uniformly
distributed with respect to time].
Figure 4.2 shows the frequency distribution of memory requests with different
stride patterns for SJAS and SAP. These benchmarks behave differently from the earlier
ones as more memory requests exhibit a specific pattern in strides, one being predominant.
Both these benchmarks have almost 30% to 40% of the requests having a stride pattern of
1, i.e. the adjacent cache line is being accessed. Further, both these benchmarks have
approximately 50% of their requests being covered with a stride of 10 or less in this distri-
bution.
4.2. Multi-stride Prefetching
Figure 4.3 shows the block diagram of multi-stride prefetching implemented as a
memory side prefetcher. The proposed prefetcher is located in the memory controller,
which can be on-chip or off-chip. It consists of the following components:
•Prefetch buffer to store prefetched data (from 64B to 512B per thread)
•Stride filter with prefetch generator
91
Note: “Threads” in this dissertation refer to Hardware Threads i.e. requests from
different cores.
Prefetch Buffer: When a processor's memory request arrives at the memory controller, the
prefetch buffers are examined for the availability of data. The buffers can be organized as a
set associative cache. If the data exists in the prefetch buffer the memory request is satisfied
directly from the prefetch buffer, or else it is sent to the memory. The size of the buffer
depends on the number of strides that need to be captured and can vary from 64Bytes (1
cache line) to 512B per thread (8 cache lines).
Stride Filter: Memory requests from the processor are intercepted by the stride filter. The
stride filter monitors the access pattern and identifies the stride based on the difference in
physical address between the current and previous address. This is done on a per thread
basis (i.e. each thread's stride is monitored separately). This keeps the patterns from differ-
ent threads from polluting each other. Further, our model monitors more than one stride at
any instance for each thread. This increases the probability of capturing a thread's stride
behavior. The number of strides monitored at a given instant is programmable to a fixed
value. The prefetch generator monitors the stride pattern and generates the next access
based on the prefetch threshold (PT) value. For example: Let the PT value be 3 and a given
thread exhibits the following pattern in terms of physical addresses - 1, 3, 5, 7, 9,11, We can
observe that this thread is exhibiting a stride of 2. The first occurrence of stride 2 is when
address 3 arrives, second occurrence is for address 5, and third occurrence is for 7. Once the
number of occurrences has met the PT value prefetching begins. In this example, we
prefetch from address 9 onwards and store it in the prefetch buffer.
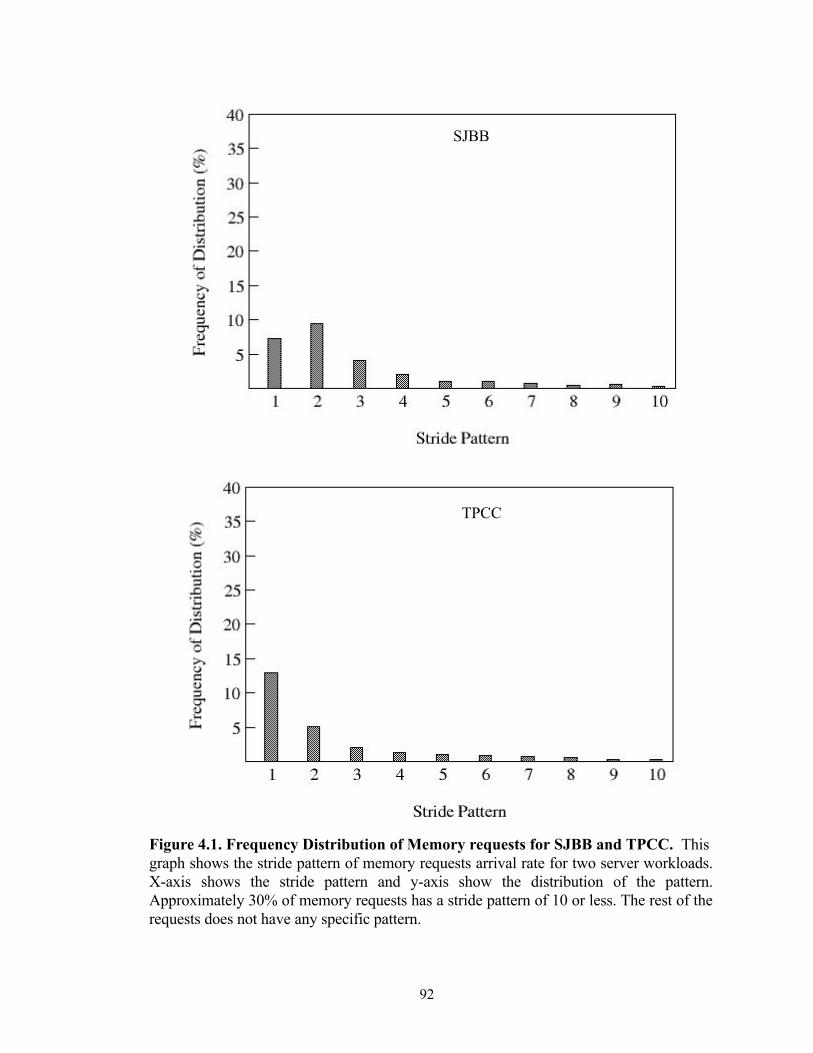
92
Figure 4.1. Frequency Distribution of Memory requests for SJBB and TPCC. Thisgraph shows the stride pattern of memory requests arrival rate for two server workloads.X-axis shows the stride pattern and y-axis show the distribution of the pattern.Approximately 30% of memory requests has a stride pattern of 10 or less. The rest of therequests does not have any specific pattern.
TPCC
SJBB
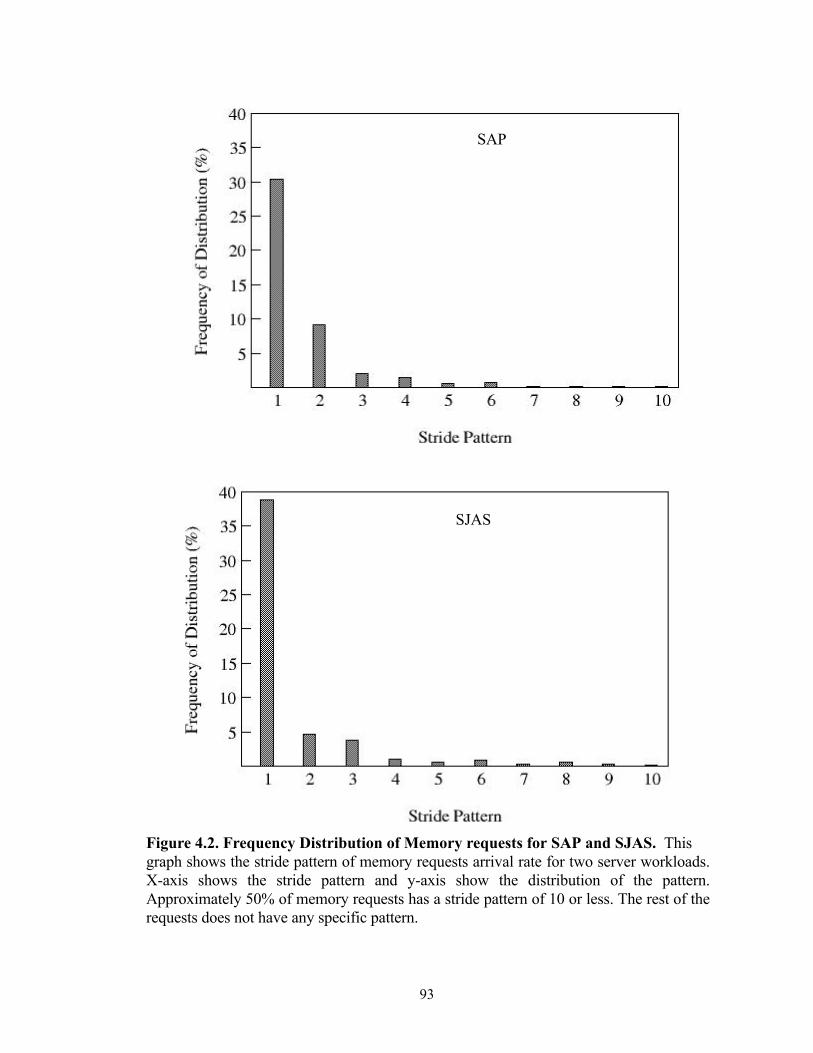
93
SAP
SJAS
Figure 4.2. Frequency Distribution of Memory requests for SAP and SJAS. Thisgraph shows the stride pattern of memory requests arrival rate for two server workloads.X-axis shows the stride pattern and y-axis show the distribution of the pattern.Approximately 50% of memory requests has a stride pattern of 10 or less. The rest of therequests does not have any specific pattern.
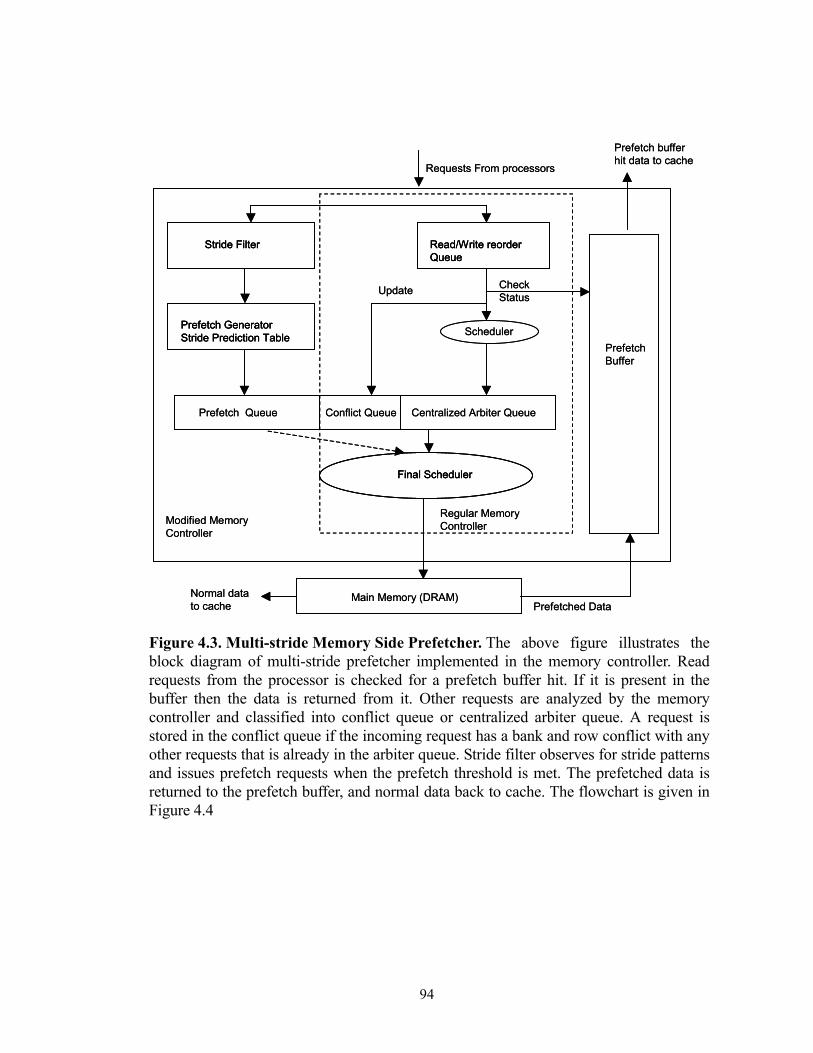
94
Figure 4.3. Multi-stride Memory Side Prefetcher. The above figure illustrates theblock diagram of multi-stride prefetcher implemented in the memory controller. Readrequests from the processor is checked for a prefetch buffer hit. If it is present in thebuffer then the data is returned from it. Other requests are analyzed by the memorycontroller and classified into conflict queue or centralized arbiter queue. A request isstored in the conflict queue if the incoming request has a bank and row conflict with anyother requests that is already in the arbiter queue. Stride filter observes for stride patternsand issues prefetch requests when the prefetch threshold is met. The prefetched data isreturned to the prefetch buffer, and normal data back to cache. The flowchart is given inFigure 4.4
Requests From processors
Read/Write reorderQueue
Prefetch GeneratorStride Prediction Table
PrefetchBuffer
Final Scheduler
Main Memory (DRAM)
Prefetch Queue Conflict Queue Centralized Arbiter Queue
Prefetched Data
Stride Filter
Scheduler
Check StatusUpdate
Modified Memory Controller
Regular Memory Controller
Prefetch buffer hit data to cache
Normal data to cache
Requests From processors
Read/Write reorderQueueRead/Write reorderQueue
Prefetch GeneratorStride Prediction TablePrefetch GeneratorStride Prediction Table
PrefetchBuffer
Final SchedulerFinal Scheduler
Main Memory (DRAM)
Prefetch Queue Conflict Queue Centralized Arbiter Queue
Prefetched Data
Stride FilterStride Filter
Scheduler
Check StatusUpdate
Modified Memory Controller
Regular Memory Controller
Prefetch buffer hit data to cache
Normal data to cache
95
The PT value is programmable to a fixed value or can be adaptive. When a thread
shows a good prefetch buffer hit rate (ratio of prefetch buffer hit to number of prefetches
issued), we can dynamically reduce the PT value, and if the hit rate is low (say < 50%) we
can increase the PT value to reduce the number of prefetches.
4.2.1 Prefetch Requests Priority
There are two ways of scheduling a prefetch request in the memory controller. 1)
Prefetches can be given the same priority as normal requests 2) Prefetches can be treated as
low priority requests. Let us examine each scenario separately. Both schemes have their
advantages and disadvantages as described below. Studies have been conducted with both
schemes without much difference in performance as shown by our results. Normal requests
are given higher priority so as to not stall the processor on a cache miss. The normal
requests shouldn’t be slowed down, assuming they don’t hit in the prefetch buffer, due to a
prefetch request. Though this is the obvious case, it can get complicated based on various
scenarios as described below.
Case 1: Let a prefetch request P1 be generated @ cycle 100 and a normal request
N1 arrive at cycle 101. In our example, we consider a bank conflict between the two
requests. If the prefetches are given equal priority, then the normal request N1 gets delayed
due to P1. Considering the fact that the normal requests have to compete with prefetch
requests for the available bandwidth, this can degrade the performance of the system. As it
is, the increased bandwidth requirement might push the system to operate in the exponen-
tial region of the bandwidth-latency curve.
Case 2: If the prefetch request's priority is reduced, N1 gets served fast, and P1 gets
delayed. This can result in prefetch response being untimely and may impact the perfor-
96
mance in multiple ways - either delayed (due to other memory request) or issuing more
memory requests than necessary. Let us further examine the possible causes for both sce-
narios.
Case 2A: Let a normal request N2 arrive @ cycle 200 which happens to be a
prefetch pending hit to P1 (i.e. a prefetch request P1 has been submitted to the memory
controller, but the data hasn't arrived yet). In a system with low priority for prefetch
requests, we have to issue a separate memory request for N2 to achieve fast turn around
time. This increases the memory bandwidth requirement because the prefetch request P1
which was issued @ cycle 100 will eventually be served, and we would have issued two
requests for the same data. The increased bandwidth can potentially increase the memory
contention and can indirectly lead to increased memory latency.
Case 2B: In continuation of the above example, if we decide not to initiate a new
request for N2 but decide to wait for the pending request to come back, then the memory
latency for the request N2 might be high. This can happen in a situation where the prefetch
request P1 gets inadvertently delayed due to normal requests. This leads to increased mem-
ory latency and reduced processor performance. This will most likely happen when the
memory is saturated with normal requests that have higher priority than prefetches. In such
a situation, if N2 had been sent to the memory directly without waiting for prefetch data to
come back, it might have finished earlier.
A pending hit is NOT always better than a “no-prefetch” scheme as illustrated by
the above example. There can be situations where a “no-prefetch” can perform better than
the prefetch model. In such a scenario (when the memory is saturated with normal
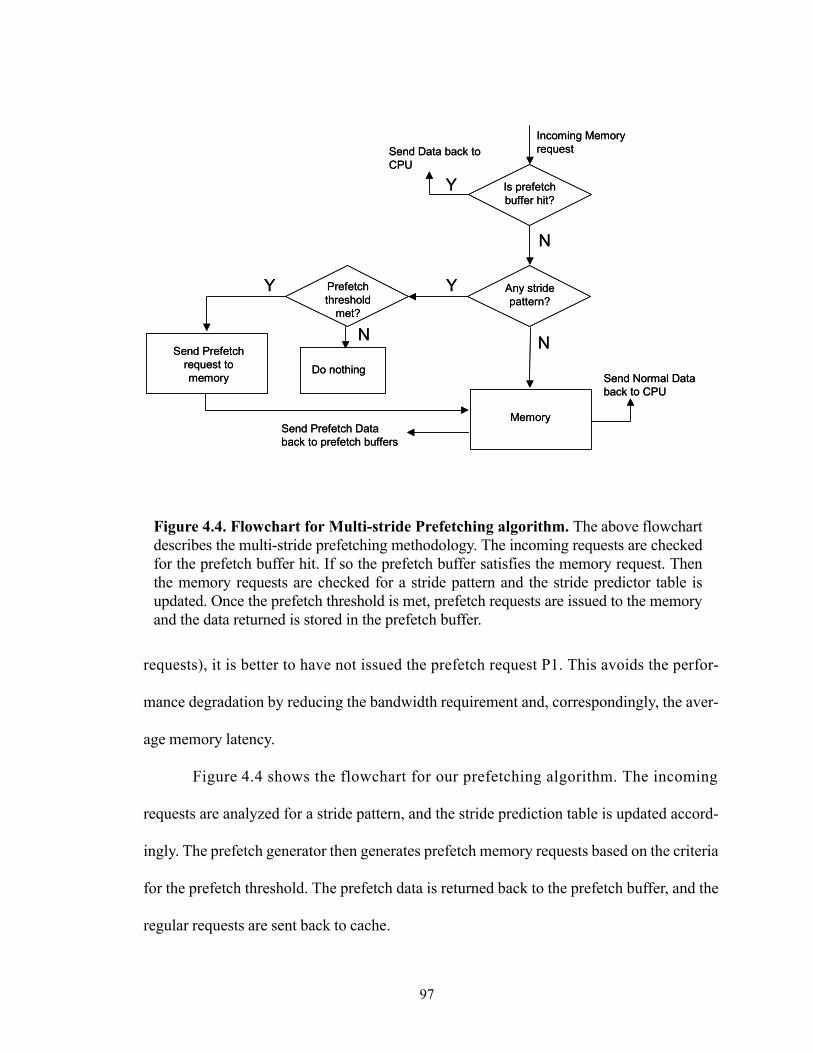
97
requests), it is better to have not issued the prefetch request P1. This avoids the perfor-
mance degradation by reducing the bandwidth requirement and, correspondingly, the aver-
age memory latency.
Figure 4.4 shows the flowchart for our prefetching algorithm. The incoming
requests are analyzed for a stride pattern, and the stride prediction table is updated accord-
ingly. The prefetch generator then generates prefetch memory requests based on the criteria
for the prefetch threshold. The prefetch data is returned back to the prefetch buffer, and the
regular requests are sent back to cache.
Is prefetch buffer hit?
Incoming Memory requestSend Data back to
CPU
Y
N
Any stride pattern?
N
Memory
Y
Send Normal Data back to CPU
Prefetch threshold
met?
Y
Send Prefetch request to memory
Do nothing
N
Send Prefetch Data back to prefetch buffers
Is prefetch buffer hit?
Incoming Memory requestSend Data back to
CPU
Y
N
Any stride pattern?
N
Memory
Y
Send Normal Data back to CPU
Prefetch threshold
met?
Y
Send Prefetch request to memory
Do nothing
N
Send Prefetch Data back to prefetch buffers
Figure 4.4. Flowchart for Multi-stride Prefetching algorithm. The above flowchartdescribes the multi-stride prefetching methodology. The incoming requests are checkedfor the prefetch buffer hit. If so the prefetch buffer satisfies the memory request. Thenthe memory requests are checked for a stride pattern and the stride predictor table isupdated. Once the prefetch threshold is met, prefetch requests are issued to the memoryand the data returned is stored in the prefetch buffer.
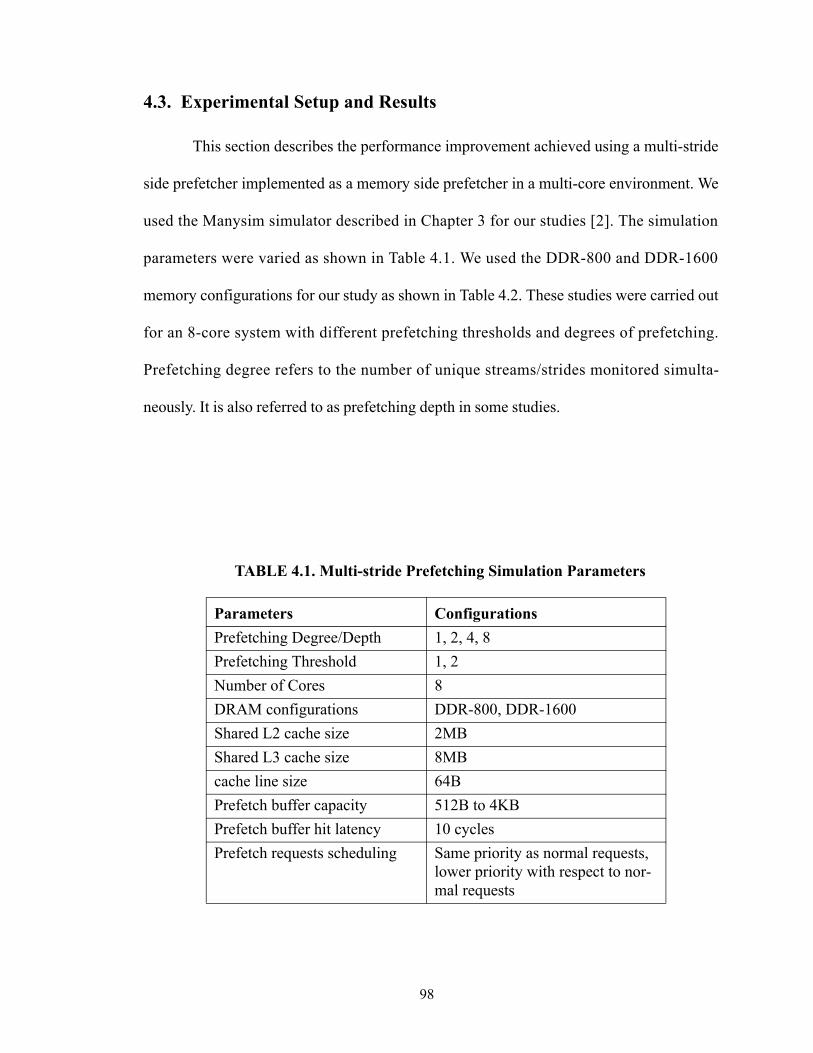
98
4.3. Experimental Setup and Results
This section describes the performance improvement achieved using a multi-stride
side prefetcher implemented as a memory side prefetcher in a multi-core environment. We
used the Manysim simulator described in Chapter 3 for our studies [2]. The simulation
parameters were varied as shown in Table 4.1. We used the DDR-800 and DDR-1600
memory configurations for our study as shown in Table 4.2. These studies were carried out
for an 8-core system with different prefetching thresholds and degrees of prefetching.
Prefetching degree refers to the number of unique streams/strides monitored simulta-
neously. It is also referred to as prefetching depth in some studies.
TABLE 4.1. Multi-stride Prefetching Simulation Parameters
Parameters ConfigurationsPrefetching Degree/Depth 1, 2, 4, 8Prefetching Threshold 1, 2Number of Cores 8DRAM configurations DDR-800, DDR-1600Shared L2 cache size 2MBShared L3 cache size 8MBcache line size 64BPrefetch buffer capacity 512B to 4KBPrefetch buffer hit latency 10 cyclesPrefetch requests scheduling Same priority as normal requests,
lower priority with respect to nor-mal requests
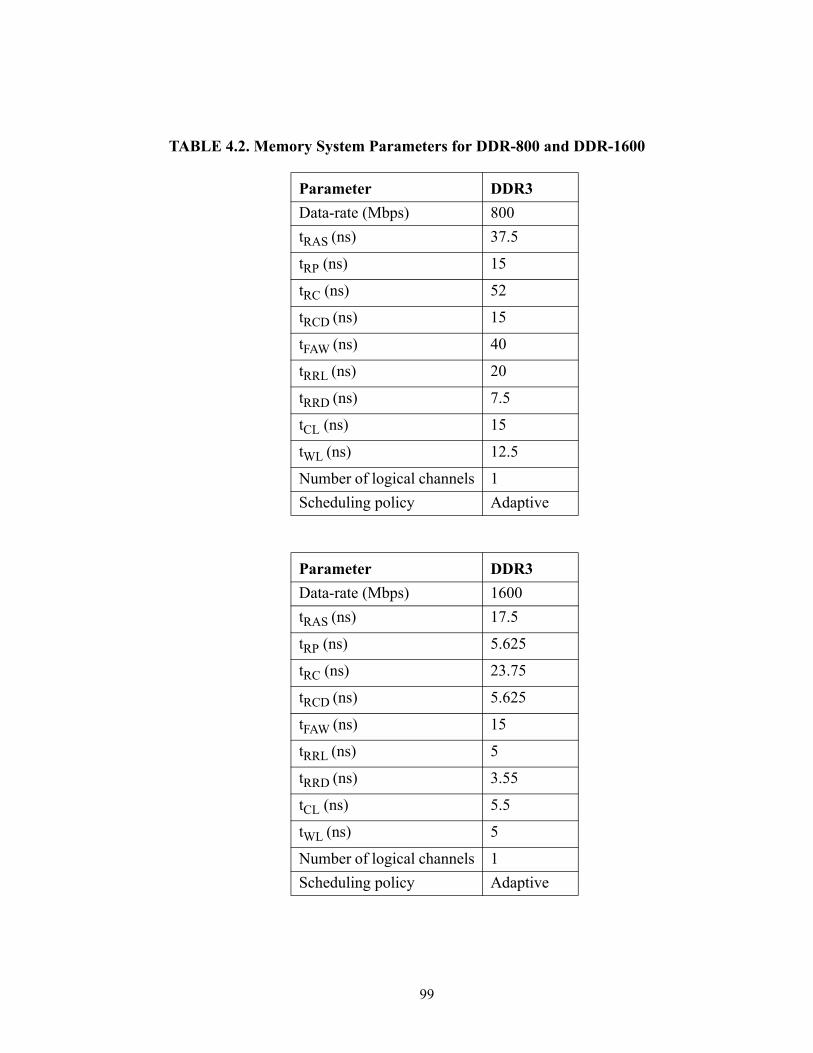
99
TABLE 4.2. Memory System Parameters for DDR-800 and DDR-1600
Parameter DDR3Data-rate (Mbps) 800tRAS (ns) 37.5
tRP (ns) 15
tRC (ns) 52
tRCD (ns) 15
tFAW (ns) 40
tRRL (ns) 20
tRRD (ns) 7.5
tCL (ns) 15
tWL (ns) 12.5
Number of logical channels 1Scheduling policy Adaptive
Parameter DDR3Data-rate (Mbps) 1600tRAS (ns) 17.5
tRP (ns) 5.625
tRC (ns) 23.75
tRCD (ns) 5.625
tFAW (ns) 15
tRRL (ns) 5
tRRD (ns) 3.55
tCL (ns) 5.5
tWL (ns) 5
Number of logical channels 1Scheduling policy Adaptive
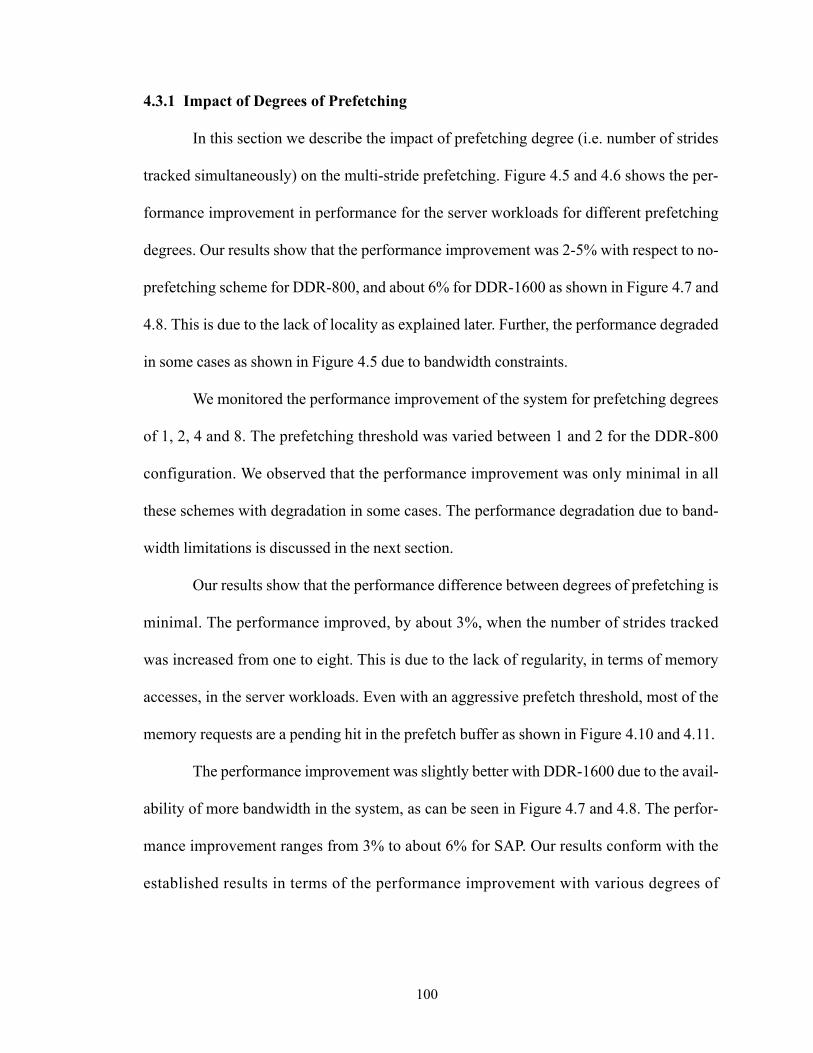
100
4.3.1 Impact of Degrees of Prefetching
In this section we describe the impact of prefetching degree (i.e. number of strides
tracked simultaneously) on the multi-stride prefetching. Figure 4.5 and 4.6 shows the per-
formance improvement in performance for the server workloads for different prefetching
degrees. Our results show that the performance improvement was 2-5% with respect to no-
prefetching scheme for DDR-800, and about 6% for DDR-1600 as shown in Figure 4.7 and
4.8. This is due to the lack of locality as explained later. Further, the performance degraded
in some cases as shown in Figure 4.5 due to bandwidth constraints.
We monitored the performance improvement of the system for prefetching degrees
of 1, 2, 4 and 8. The prefetching threshold was varied between 1 and 2 for the DDR-800
configuration. We observed that the performance improvement was only minimal in all
these schemes with degradation in some cases. The performance degradation due to band-
width limitations is discussed in the next section.
Our results show that the performance difference between degrees of prefetching is
minimal. The performance improved, by about 3%, when the number of strides tracked
was increased from one to eight. This is due to the lack of regularity, in terms of memory
accesses, in the server workloads. Even with an aggressive prefetch threshold, most of the
memory requests are a pending hit in the prefetch buffer as shown in Figure 4.10 and 4.11.
The performance improvement was slightly better with DDR-1600 due to the avail-
ability of more bandwidth in the system, as can be seen in Figure 4.7 and 4.8. The perfor-
mance improvement ranges from 3% to about 6% for SAP. Our results conform with the
established results in terms of the performance improvement with various degrees of
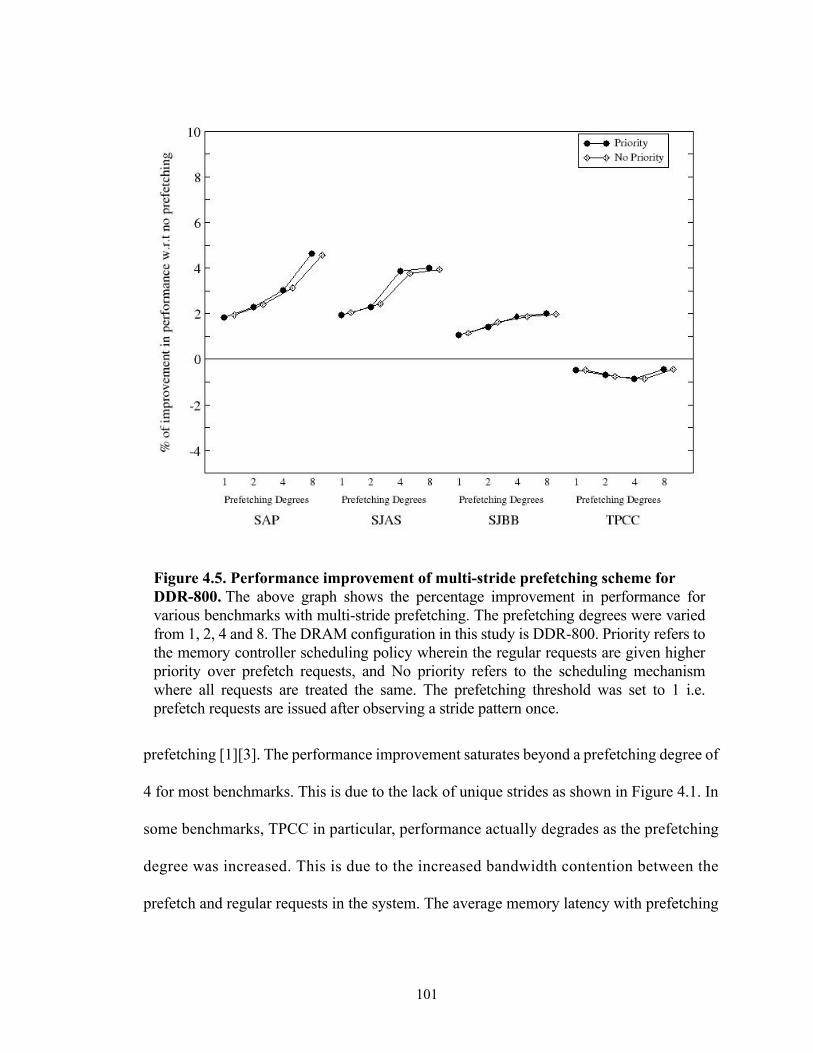
101
prefetching [1][3]. The performance improvement saturates beyond a prefetching degree of
4 for most benchmarks. This is due to the lack of unique strides as shown in Figure 4.1. In
some benchmarks, TPCC in particular, performance actually degrades as the prefetching
degree was increased. This is due to the increased bandwidth contention between the
prefetch and regular requests in the system. The average memory latency with prefetching
Figure 4.5. Performance improvement of multi-stride prefetching scheme for DDR-800. The above graph shows the percentage improvement in performance forvarious benchmarks with multi-stride prefetching. The prefetching degrees were variedfrom 1, 2, 4 and 8. The DRAM configuration in this study is DDR-800. Priority refers tothe memory controller scheduling policy wherein the regular requests are given higherpriority over prefetch requests, and No priority refers to the scheduling mechanismwhere all requests are treated the same. The prefetching threshold was set to 1 i.e.prefetch requests are issued after observing a stride pattern once.
102
increases due to the memory serving more requests, leading to degrading system perfor-
mance. This is discussed in detail in a further subsection.
4.3.2 Impact of DRAM Scheduling
Our study involved two different scheduling algorithms i) Priority Scheduling (PS)
and ii) No Priority Scheduling (NPS). Priority Scheduling policy gave priority to normal
Figure 4.6. Performance improvement of multi-stride prefetching scheme for DDR-800. The above graph shows the percentage improvement in performance forvarious benchmarks with multi-stride prefetching. The prefetching degrees were variedfrom 1, 2, 4 and 8. The DRAM configuration in this study is DDR-800. Priority refers tothe memory controller scheduling policy wherein the regular requests are given higherpriority over prefetch requests, and No priority refers to the scheduling mechanismwhere all requests are treated the same. The prefetching threshold was set to 2 i.e.prefetch requests are issued after observing a stride pattern twice.
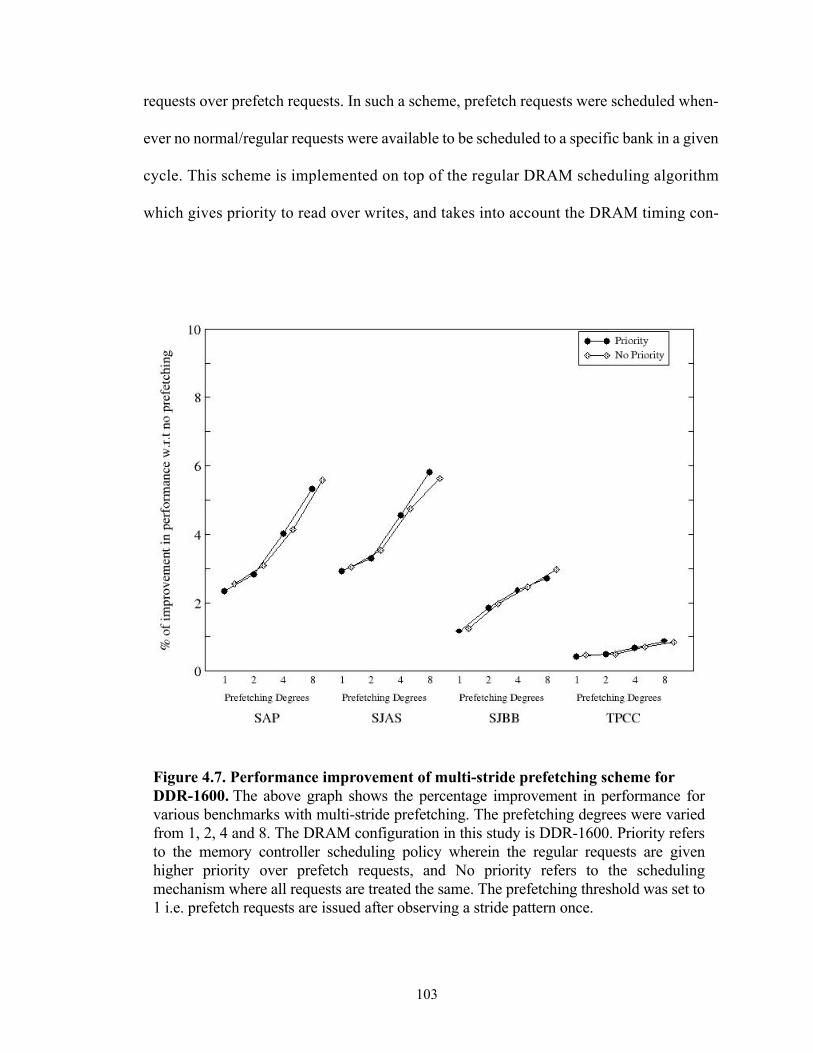
103
requests over prefetch requests. In such a scheme, prefetch requests were scheduled when-
ever no normal/regular requests were available to be scheduled to a specific bank in a given
cycle. This scheme is implemented on top of the regular DRAM scheduling algorithm
which gives priority to read over writes, and takes into account the DRAM timing con-
Figure 4.7. Performance improvement of multi-stride prefetching scheme for DDR-1600. The above graph shows the percentage improvement in performance forvarious benchmarks with multi-stride prefetching. The prefetching degrees were variedfrom 1, 2, 4 and 8. The DRAM configuration in this study is DDR-1600. Priority refersto the memory controller scheduling policy wherein the regular requests are givenhigher priority over prefetch requests, and No priority refers to the schedulingmechanism where all requests are treated the same. The prefetching threshold was set to1 i.e. prefetch requests are issued after observing a stride pattern once.
104
straints while scheduling commands. No Priority Scheduling treats all requests with equal
priority and uses the regular DRAM scheduling algorithm.
Our results show that the two schemes performed alike in all scenarios. The perfor-
mance difference is less than 1% between these schemes for varying degrees of prefetching
with both DDR-800 and DDR-1600 configurations. The NPS scheme has better prefetch
buffer hit rate than the PS scheme, and lower pending hit rate as shown in Figure 4.10 and
4.11. This is due to the NPS scheme giving equal priority to all requests there by reducing
the average latency for prefetch requests. The total hit rate [sum of buffer and pending hit
rate] remains almost the same for both schemes.
Prioritizing normal requests over prefetch requests does not yield much perfor-
mance gain compared to a NPS scheme as there is sufficient memory level parallelism
between threads/cores. This can be effective in a uniprocessor environment with a simple
in-order core. A good design of aggressive out-of-order cores or multi-core architecture
can yield sufficient memory level parallelism to offset the benefits obtained by the priority
scheduling.
We also showed, that contrary to conventional wisdom, giving equal priority to
prefetch requests can improve the system performance in certain cases (SJBB Figure 4.7
prefetch depth 4). This happens when the prefetch buffer hit rate is more than the pending
hit rate, and cache misses don’t have to wait for the pending data to come back from the
memory. The pending hit latency can be more in a system with PS policy due to normal
requests getting higher priority than the prefetch requests. The prefetch buffer hit rate will
be more in a NPS policy as the prefetch requests are served at the same rate as normal
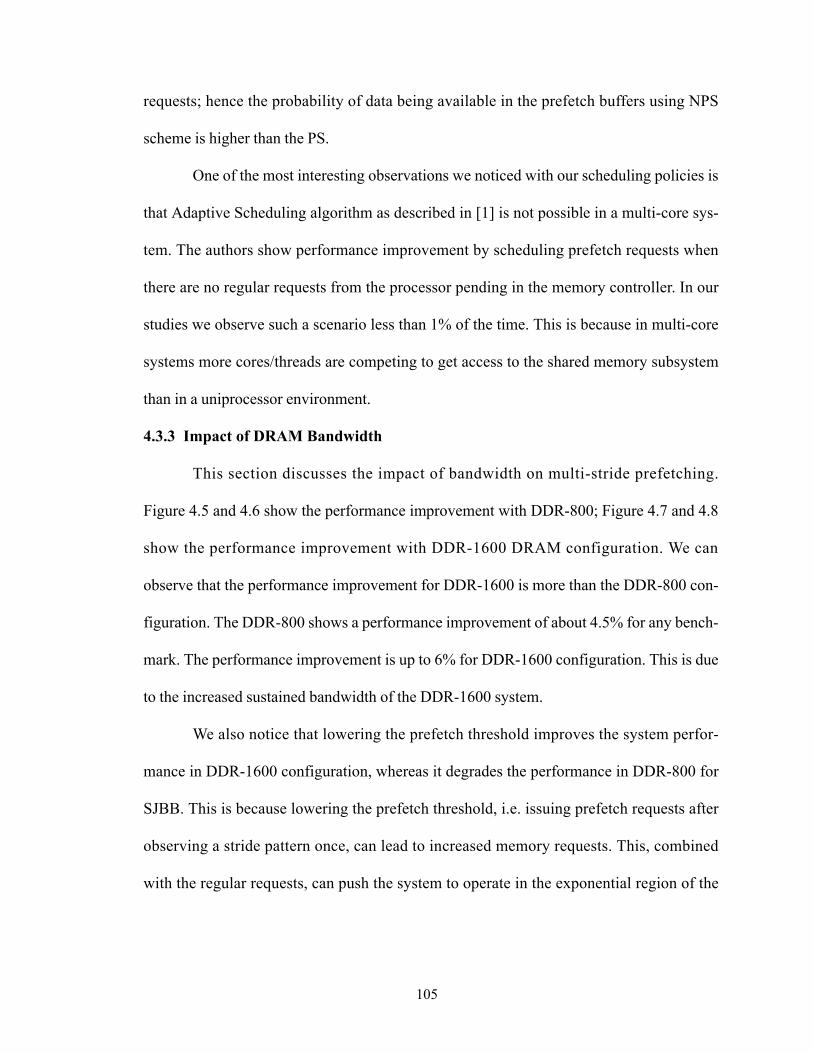
105
requests; hence the probability of data being available in the prefetch buffers using NPS
scheme is higher than the PS.
One of the most interesting observations we noticed with our scheduling policies is
that Adaptive Scheduling algorithm as described in [1] is not possible in a multi-core sys-
tem. The authors show performance improvement by scheduling prefetch requests when
there are no regular requests from the processor pending in the memory controller. In our
studies we observe such a scenario less than 1% of the time. This is because in multi-core
systems more cores/threads are competing to get access to the shared memory subsystem
than in a uniprocessor environment.
4.3.3 Impact of DRAM Bandwidth
This section discusses the impact of bandwidth on multi-stride prefetching.
Figure 4.5 and 4.6 show the performance improvement with DDR-800; Figure 4.7 and 4.8
show the performance improvement with DDR-1600 DRAM configuration. We can
observe that the performance improvement for DDR-1600 is more than the DDR-800 con-
figuration. The DDR-800 shows a performance improvement of about 4.5% for any bench-
mark. The performance improvement is up to 6% for DDR-1600 configuration. This is due
to the increased sustained bandwidth of the DDR-1600 system.
We also notice that lowering the prefetch threshold improves the system perfor-
mance in DDR-1600 configuration, whereas it degrades the performance in DDR-800 for
SJBB. This is because lowering the prefetch threshold, i.e. issuing prefetch requests after
observing a stride pattern once, can lead to increased memory requests. This, combined
with the regular requests, can push the system to operate in the exponential region of the
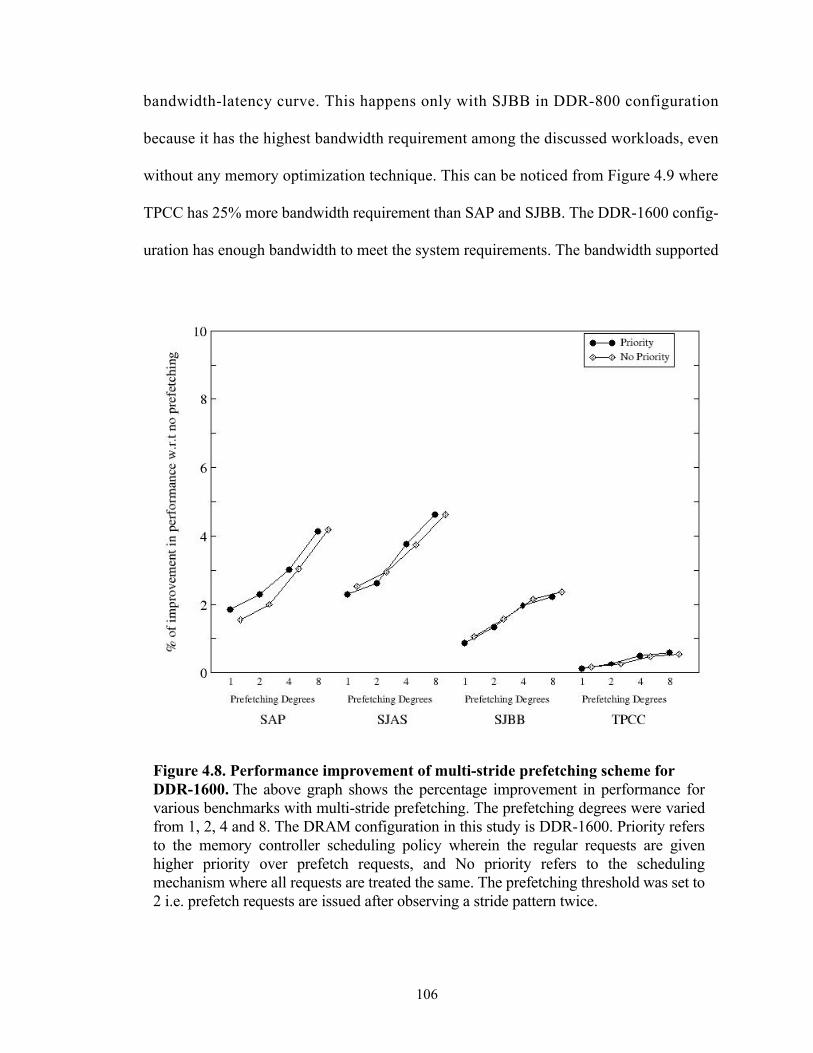
106
bandwidth-latency curve. This happens only with SJBB in DDR-800 configuration
because it has the highest bandwidth requirement among the discussed workloads, even
without any memory optimization technique. This can be noticed from Figure 4.9 where
TPCC has 25% more bandwidth requirement than SAP and SJBB. The DDR-1600 config-
uration has enough bandwidth to meet the system requirements. The bandwidth supported
Figure 4.8. Performance improvement of multi-stride prefetching scheme for DDR-1600. The above graph shows the percentage improvement in performance forvarious benchmarks with multi-stride prefetching. The prefetching degrees were variedfrom 1, 2, 4 and 8. The DRAM configuration in this study is DDR-1600. Priority refersto the memory controller scheduling policy wherein the regular requests are givenhigher priority over prefetch requests, and No priority refers to the schedulingmechanism where all requests are treated the same. The prefetching threshold was set to2 i.e. prefetch requests are issued after observing a stride pattern twice.
107
in this system is doubled, and the requirements grow by only 60%. Thus there is more than
necessary bandwidth available in the system to meet the demand. Hence, the performance
improves as the prefetch threshold is reduced in a higher bandwidth system.
Figure 4.9. Memory bandwidth variation for different schemes. The above graphshows the bandwidth requirement for four benchmarks SAP, SJAS, SJBB and TPCC forthe various memory configuration and prefetch threshold. DDR-800 thresh2 refer to theDDR-800 configuration with prefetch threshold 2 and DDR-800 thresh1 refer to DDR-800 configuration with prefetch threshold 1. DDR-1600 configuration is represented byDDR-1600 thresh1 and DDR-1600 thresh2. thresh1 and thresh2 follow the same trend aswith DDR-800 i.e. they represent Prefetch threshold 1 and 2. The y-axis represents thebandwidth scaled in GigaBytes/Sec. The bandwidth increases steadily with differentschemes for all the benchmarks. The rate of increase is more for TPCC as its bandwidthrequirements are more and also due to its prefetch requests being useless, and mostrequests end up accessing memory. SJAS has increased bandwidth requirement due to theprefetcher being able to predict the pattern of the benchmark. All the configurations arefor No Priority Scheduling scheme with a prefetch degree of 8.
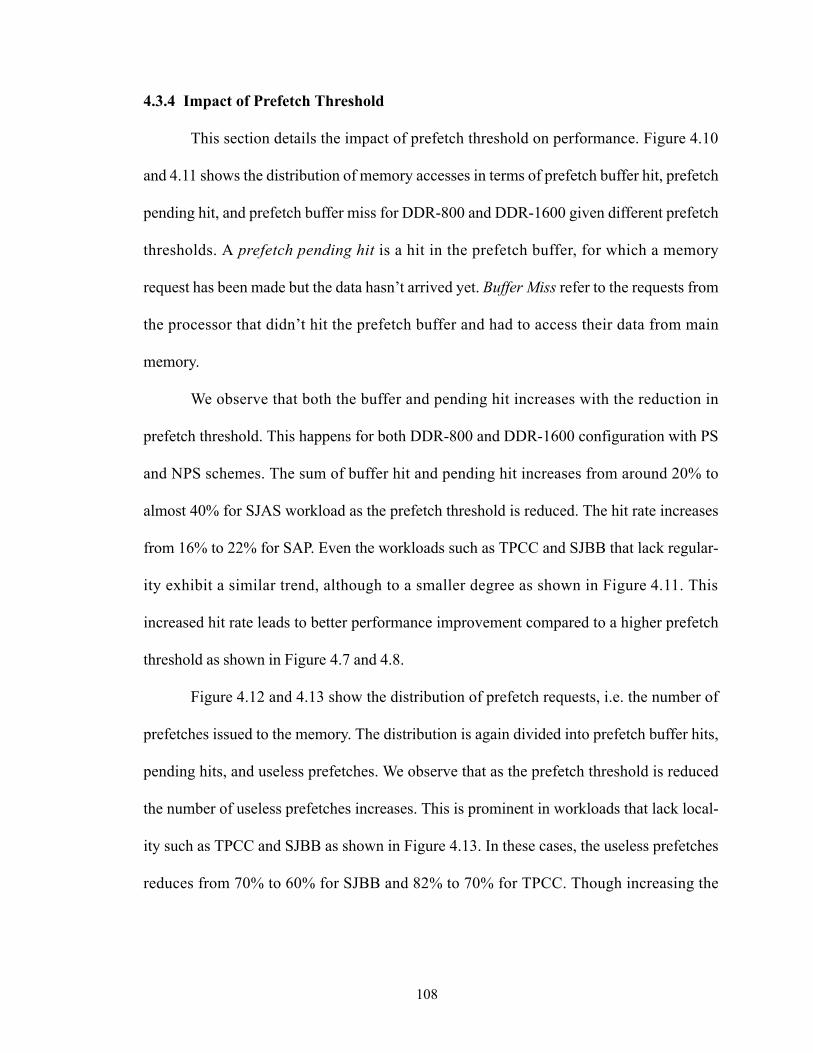
108
4.3.4 Impact of Prefetch Threshold
This section details the impact of prefetch threshold on performance. Figure 4.10
and 4.11 shows the distribution of memory accesses in terms of prefetch buffer hit, prefetch
pending hit, and prefetch buffer miss for DDR-800 and DDR-1600 given different prefetch
thresholds. A prefetch pending hit is a hit in the prefetch buffer, for which a memory
request has been made but the data hasn’t arrived yet. Buffer Miss refer to the requests from
the processor that didn’t hit the prefetch buffer and had to access their data from main
memory.
We observe that both the buffer and pending hit increases with the reduction in
prefetch threshold. This happens for both DDR-800 and DDR-1600 configuration with PS
and NPS schemes. The sum of buffer hit and pending hit increases from around 20% to
almost 40% for SJAS workload as the prefetch threshold is reduced. The hit rate increases
from 16% to 22% for SAP. Even the workloads such as TPCC and SJBB that lack regular-
ity exhibit a similar trend, although to a smaller degree as shown in Figure 4.11. This
increased hit rate leads to better performance improvement compared to a higher prefetch
threshold as shown in Figure 4.7 and 4.8.
Figure 4.12 and 4.13 show the distribution of prefetch requests, i.e. the number of
prefetches issued to the memory. The distribution is again divided into prefetch buffer hits,
pending hits, and useless prefetches. We observe that as the prefetch threshold is reduced
the number of useless prefetches increases. This is prominent in workloads that lack local-
ity such as TPCC and SJBB as shown in Figure 4.13. In these cases, the useless prefetches
reduces from 70% to 60% for SJBB and 82% to 70% for TPCC. Though increasing the
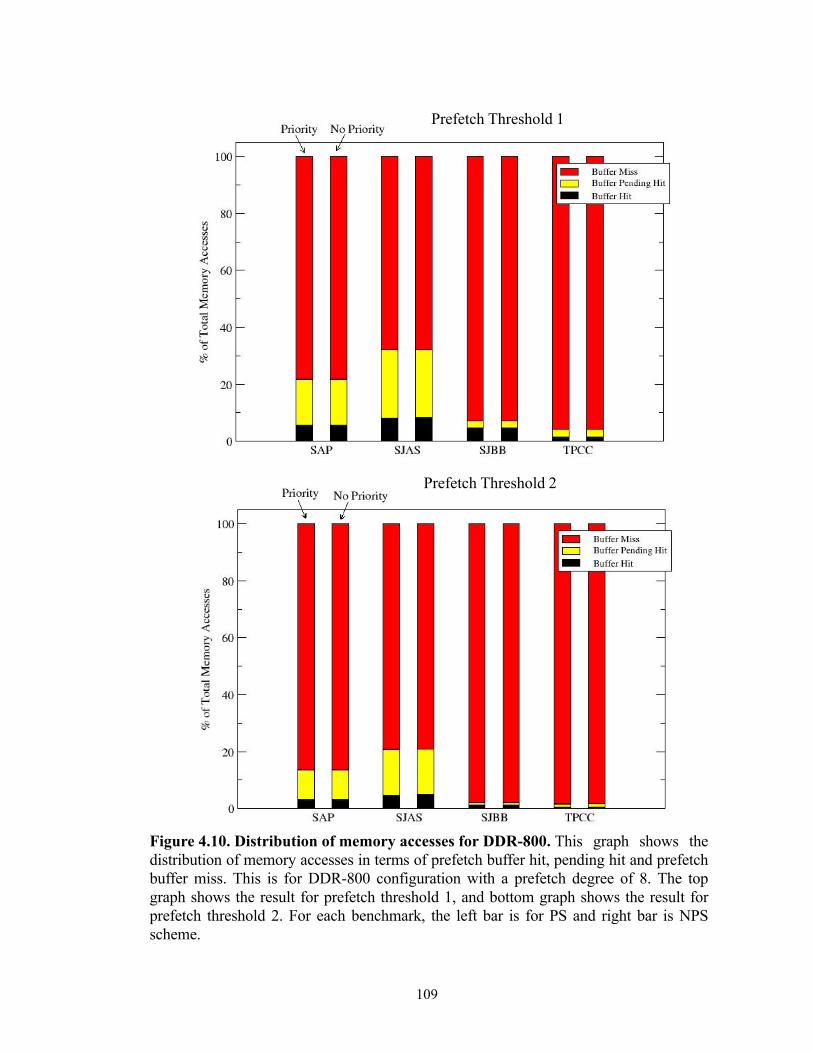
109
Figure 4.10. Distribution of memory accesses for DDR-800. This graph shows thedistribution of memory accesses in terms of prefetch buffer hit, pending hit and prefetchbuffer miss. This is for DDR-800 configuration with a prefetch degree of 8. The topgraph shows the result for prefetch threshold 1, and bottom graph shows the result forprefetch threshold 2. For each benchmark, the left bar is for PS and right bar is NPSscheme.
Prefetch Threshold 1
Prefetch Threshold 2
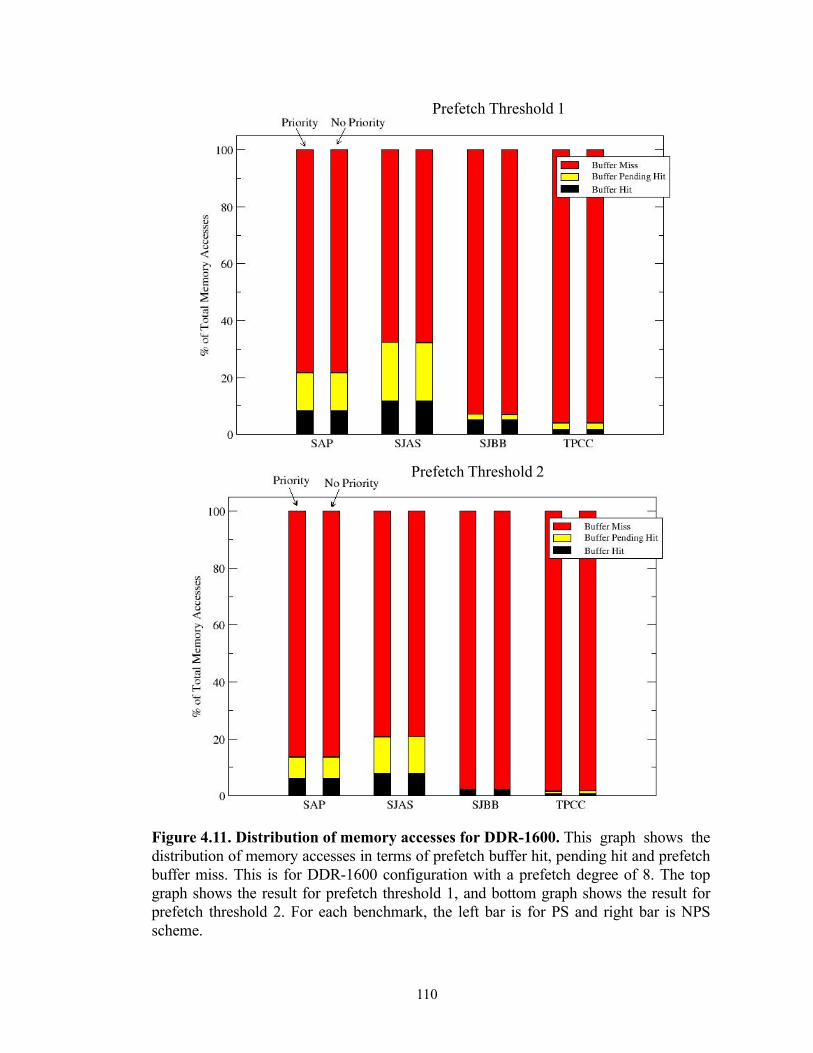
110
Prefetch Threshold 1
Figure 4.11. Distribution of memory accesses for DDR-1600. This graph shows thedistribution of memory accesses in terms of prefetch buffer hit, pending hit and prefetchbuffer miss. This is for DDR-1600 configuration with a prefetch degree of 8. The topgraph shows the result for prefetch threshold 1, and bottom graph shows the result forprefetch threshold 2. For each benchmark, the left bar is for PS and right bar is NPSscheme.
Prefetch Threshold 2
111
Figure 4.12. Distribution of prefetch requests for DDR-800. This graph shows thedistribution of prefetch requests in terms of prefetch buffer hit, pending hit and prefetchbuffer miss. This is for DDR-800 configuration with a prefetch degree of 8. The top graphshows the result for prefetch threshold 1, and bottom graph shows the result for prefetchthreshold 2. For each benchmark, the left bar is for PS and right bar is for NPS scheme.
Prefetch Threshold 1
Prefetch Threshold 2
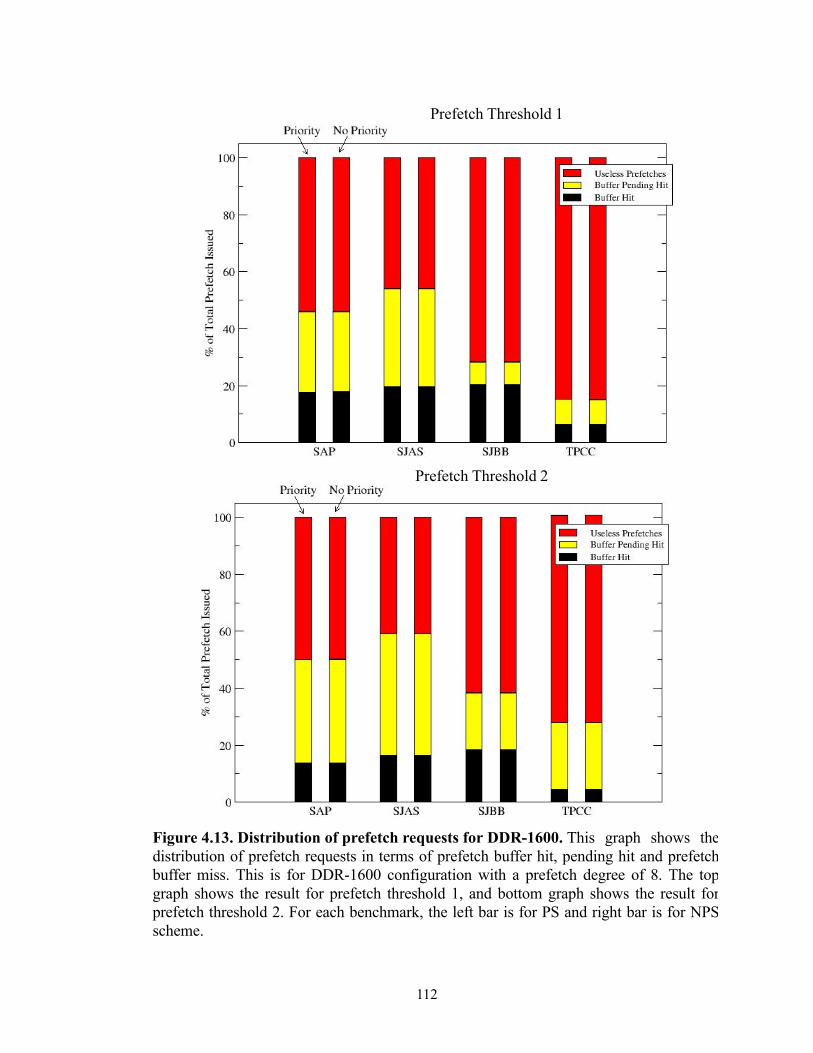
112
Figure 4.13. Distribution of prefetch requests for DDR-1600. This graph shows thedistribution of prefetch requests in terms of prefetch buffer hit, pending hit and prefetchbuffer miss. This is for DDR-1600 configuration with a prefetch degree of 8. The topgraph shows the result for prefetch threshold 1, and bottom graph shows the result forprefetch threshold 2. For each benchmark, the left bar is for PS and right bar is for NPSscheme.
Prefetch Threshold 1
Prefetch Threshold 2
113
prefetch threshold can reduce the useless prefetches, it also reduces the performance due to
increased prefetch buffer miss. This reduction in useless prefetches can reduce the band-
width consumed in the system. This increased prefetch threshold can give better perfor-
mance than a lower prefetch threshold in a bandwidth constrained system as shown in
Figure 4.5 and 4.6 for TPCC.
4.4. Summary
This chapter highlighted the performance improvements using a multi-stride
prefetching technique implemented as a memory side prefetcher. Our studies show a per-
formance improvement of about 6% for certain workloads. This leads to the conclusion,
contrary to the published results, that a simple prefetcher cannot improve the performance
significantly for workloads that lack locality/regularity. Though there is a significant
amount of stride behavior in these workloads, they do not occur in regular intervals and
thus make it harder to predict/prefetch. Aggressive prefetching mechanisms need to be
implemented to extract significant performance improvements for server workloads.
We also showed that, contrary to conventional wisdom, giving equal priority to
prefetch requests can improve the system performance in certain cases. This happens when
the prefetch buffer hit rate is more than the pending hit rate, and cache misses don’t have to
wait for the pending data to come back from the memory. The pending hit latency can be
more in a system with PS policy due to normal requests getting higher priority than the
prefetch requests. This can be circumvented by issuing separate prefetch requests for pend-
ing hits, but this will increase the bandwidth requirement of the system and correspond-
ingly the average latency.
114
Our results don’t correlate well against other published results in terms of perfor-
mance improvement, and also we found an interesting anomaly. One of the main observa-
tions from this study is that Adaptive Scheduling mechanism as proposed in [1] will not
work in a multi-core system. The authors show performance improvement by scheduling
prefetch requests when there are no regular requests from the processor pending in the
memory controller. In our studies we observe such a scenario less than 1% of the time. This
is because in multi-core systems more cores/threads are competing to get access to the
shared memory subsystem than in a uniprocessor environment.
115
Chapter 5: Multi-core Server PrefetchingIn the previous chapter, we established that simple prefetching schemes can’t give
significant performance improvements for server workloads which have sparse locality.
We also demonstrated that increasing the aggressiveness of the prefetcher can increase the
bandwidth usage and correspondingly lead to performance degradation. In this chapter, we
use this newfound understanding to address the memory wall problem for server platforms
by proposing a novel prefetching technique called Load Aware Prefetching.
Our characterization of server workloads shows that aggressive prefetching is nec-
essary to improve the system performance of applications that lack regularity/locality. This
can improve the performance of the system at the cost of an increased memory bandwidth
requirement. This aggressiveness worsens the situation in a memory bandwidth con-
strained system such as CMPs, where multiple cores are trying to access the memory at the
same time. We observed that aggressive prefetching that does not limit itself to realistic
bandwidth constraints can degrade the performance by up to 65% compared to a no-
prefetching scheme. This is due to the system operating in the exponential region of the
bandwidth-latency curve.
We propose a solution which controls the aggressiveness of the prefetching based
on the average memory latency. The prefetcher in this study is stream buffer based mecha-
nism. Our approach exploits the observed relationship between the bandwidth requirement
and resulting memory latency of the system. By varying the aggressiveness we were able to
improve the performance by up to 15% compared to a no-prefetching scheme when there
was sufficient bandwidth available in the system, and perform as well as the base no-
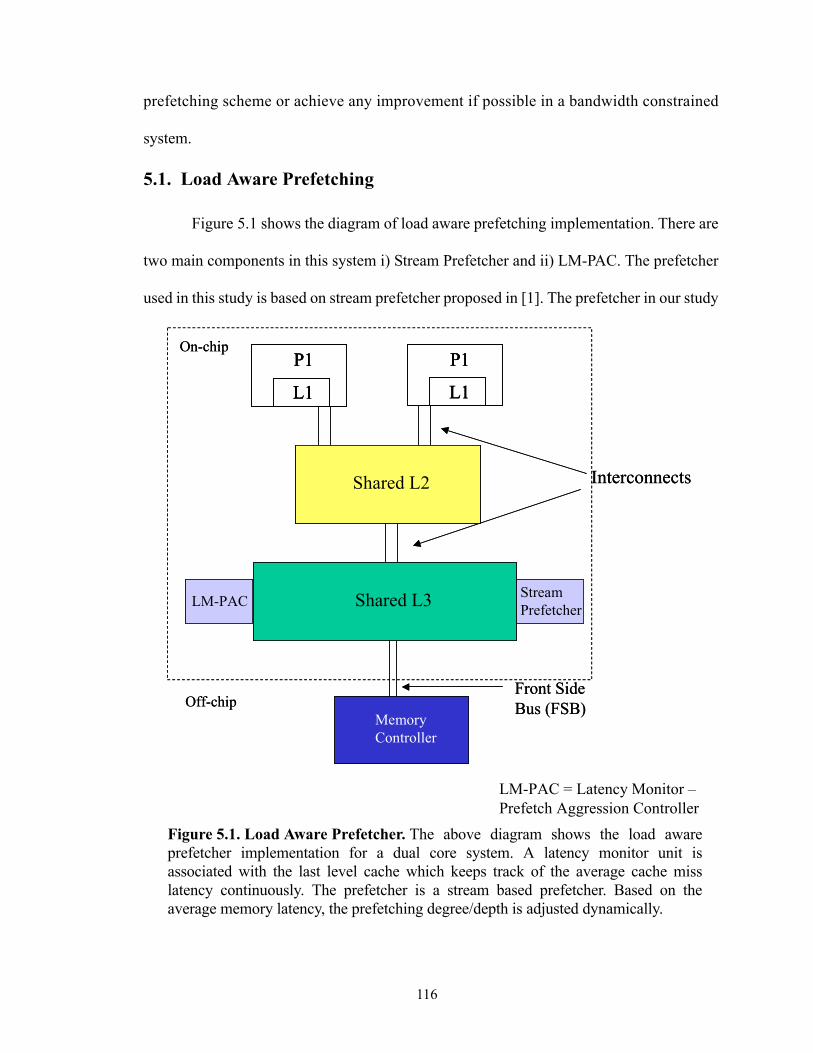
116
prefetching scheme or achieve any improvement if possible in a bandwidth constrained
system.
5.1. Load Aware Prefetching
Figure 5.1 shows the diagram of load aware prefetching implementation. There are
two main components in this system i) Stream Prefetcher and ii) LM-PAC. The prefetcher
used in this study is based on stream prefetcher proposed in [1]. The prefetcher in our study
LM-PAC = Latency Monitor –Prefetch Aggression Controller
Figure 5.1. Load Aware Prefetcher. The above diagram shows the load awareprefetcher implementation for a dual core system. A latency monitor unit isassociated with the last level cache which keeps track of the average cache misslatency continuously. The prefetcher is a stream based prefetcher. Based on theaverage memory latency, the prefetching degree/depth is adjusted dynamically.
Interconnects
P1
L1
P1
L1
Shared L2
Shared L3LM-PAC
Memory Controller
Front SideBus (FSB)
On-chip
Off-chip
Stream Prefetcher
Interconnects
P1
L1
P1
L1
P1
L1
P1
L1
Shared L2Shared L2
Shared L3LM-PAC
Memory Controller
Front SideBus (FSB)
On-chip
Off-chip
Stream Prefetcher
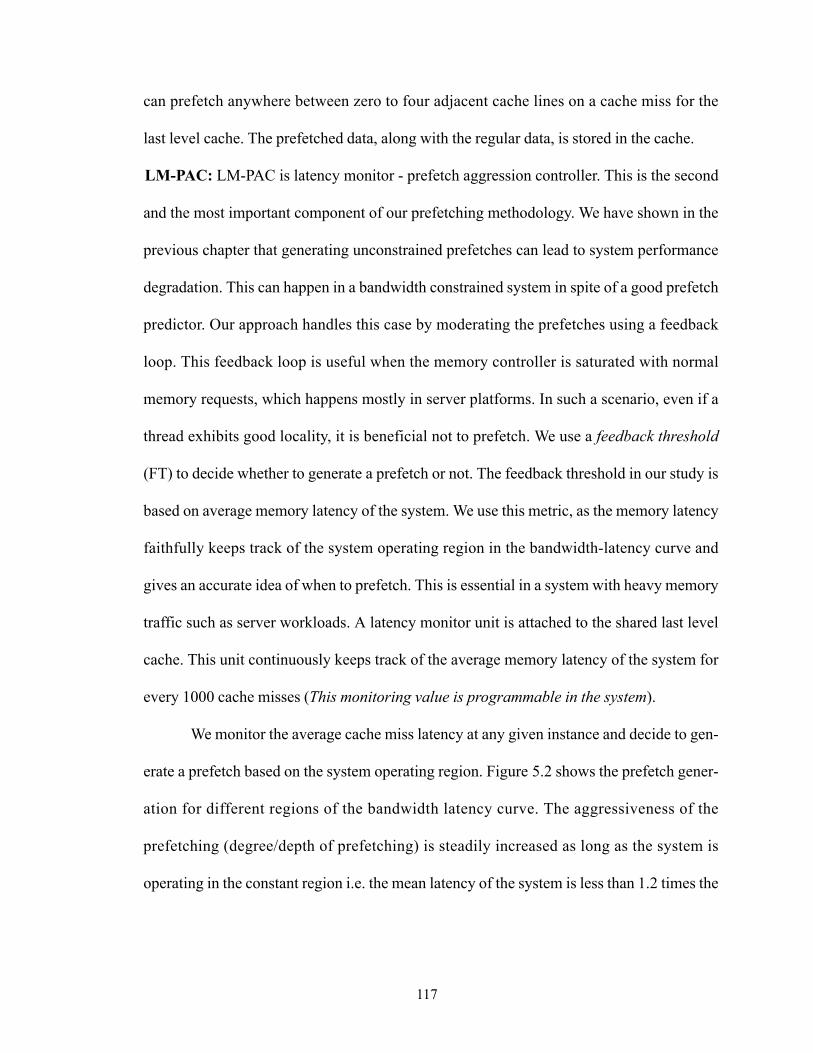
117
can prefetch anywhere between zero to four adjacent cache lines on a cache miss for the
last level cache. The prefetched data, along with the regular data, is stored in the cache.
LM-PAC: LM-PAC is latency monitor - prefetch aggression controller. This is the second
and the most important component of our prefetching methodology. We have shown in the
previous chapter that generating unconstrained prefetches can lead to system performance
degradation. This can happen in a bandwidth constrained system in spite of a good prefetch
predictor. Our approach handles this case by moderating the prefetches using a feedback
loop. This feedback loop is useful when the memory controller is saturated with normal
memory requests, which happens mostly in server platforms. In such a scenario, even if a
thread exhibits good locality, it is beneficial not to prefetch. We use a feedback threshold
(FT) to decide whether to generate a prefetch or not. The feedback threshold in our study is
based on average memory latency of the system. We use this metric, as the memory latency
faithfully keeps track of the system operating region in the bandwidth-latency curve and
gives an accurate idea of when to prefetch. This is essential in a system with heavy memory
traffic such as server workloads. A latency monitor unit is attached to the shared last level
cache. This unit continuously keeps track of the average memory latency of the system for
every 1000 cache misses (This monitoring value is programmable in the system).
We monitor the average cache miss latency at any given instance and decide to gen-
erate a prefetch based on the system operating region. Figure 5.2 shows the prefetch gener-
ation for different regions of the bandwidth latency curve. The aggressiveness of the
prefetching (degree/depth of prefetching) is steadily increased as long as the system is
operating in the constant region i.e. the mean latency of the system is less than 1.2 times the
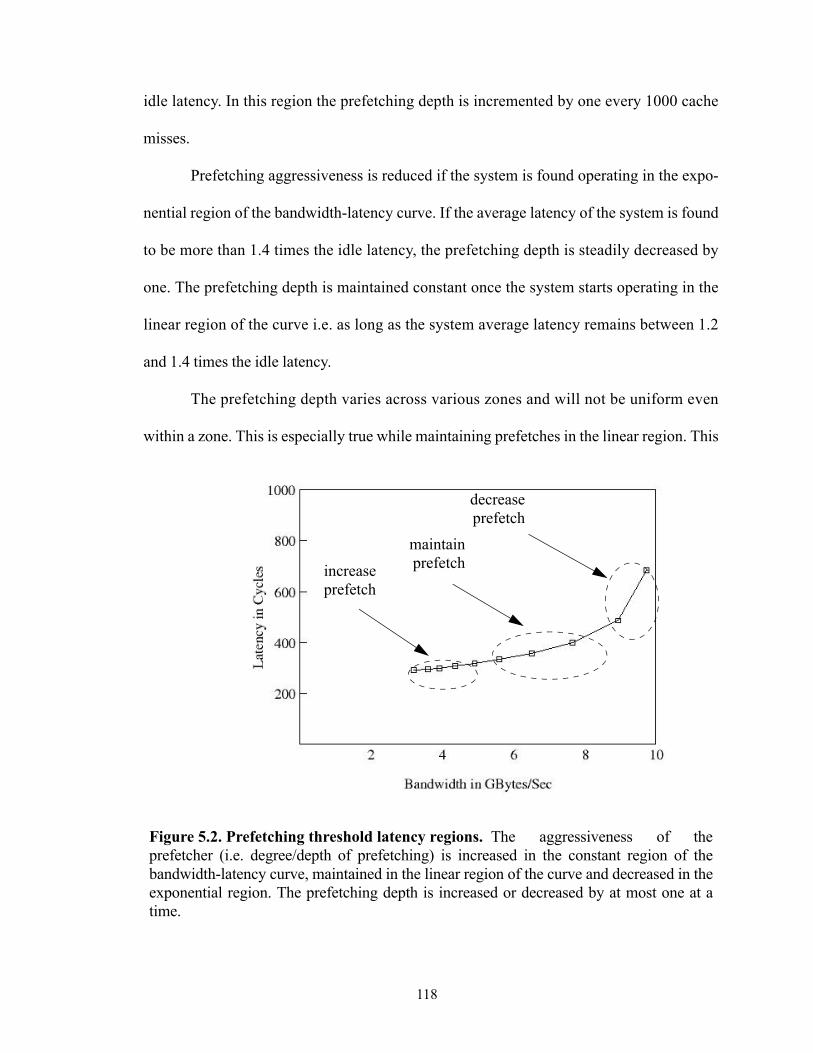
118
idle latency. In this region the prefetching depth is incremented by one every 1000 cache
misses.
Prefetching aggressiveness is reduced if the system is found operating in the expo-
nential region of the bandwidth-latency curve. If the average latency of the system is found
to be more than 1.4 times the idle latency, the prefetching depth is steadily decreased by
one. The prefetching depth is maintained constant once the system starts operating in the
linear region of the curve i.e. as long as the system average latency remains between 1.2
and 1.4 times the idle latency.
The prefetching depth varies across various zones and will not be uniform even
within a zone. This is especially true while maintaining prefetches in the linear region. This
Figure 5.2. Prefetching threshold latency regions. The aggressiveness of theprefetcher (i.e. degree/depth of prefetching) is increased in the constant region of thebandwidth-latency curve, maintained in the linear region of the curve and decreased in theexponential region. The prefetching depth is increased or decreased by at most one at atime.
decreaseprefetch
increaseprefetch
maintainprefetch
119
can happen because the system might enter this region either from the constant or the expo-
nential region, and depending on the prefetch depth at the time of entering this zone the
aggressiveness of the prefetcher will vary. We equated the different regions (constant, lin-
ear and exponential) of bandwidth-latency curve to different values of idle latency based on
our observation of the system behavior for different DRAM configurations and read-write
mix as explained below. This is because the sustained bandwidth of a system, i.e. efficiency
of the DRAM subsytem, depends on numerous factors such as memory scheduler policies,
read-write mix, number of banks/ranks, memory level parallelism available in the work-
load etc., and it varies a lot dynamically. Hence we chose to use the memory latency behav-
ior instead of the sustained bandwidth of the system.
Figure 5.3 shows the average memory latency for different configurations (this is
redrawn from chapter 3 Figure 3.17 for convenience). 800 and 1067 represents the DDR
data rates, and 25, 50, 75, 100 refers to the percentage of reads in the read-write mix (i.e.
the percentage of reads in the total traffic was increased from 25% to 100% with all the
requests being reads at 100%). The experiments were conducted using synthetic traffic on
closed page DRAM system. The two graphs show the results for two different scheduling
algorithms with one of them being optimized for writes, and the other optimized for reads.
We observed that the memory latency below 1.2 times the idle latency represents
the constant region of the bandwidth-latency curve and above 1.4 times the idle latency
represents the exponential region of the curve. This ratio remains almost the same for dif-
ferent read-write mix, scheduling algorithms and sustained bandwidth. Hence in our stud-
ies we used this latency threshold to increase or decrease the aggressiveness of the
prefetcher.
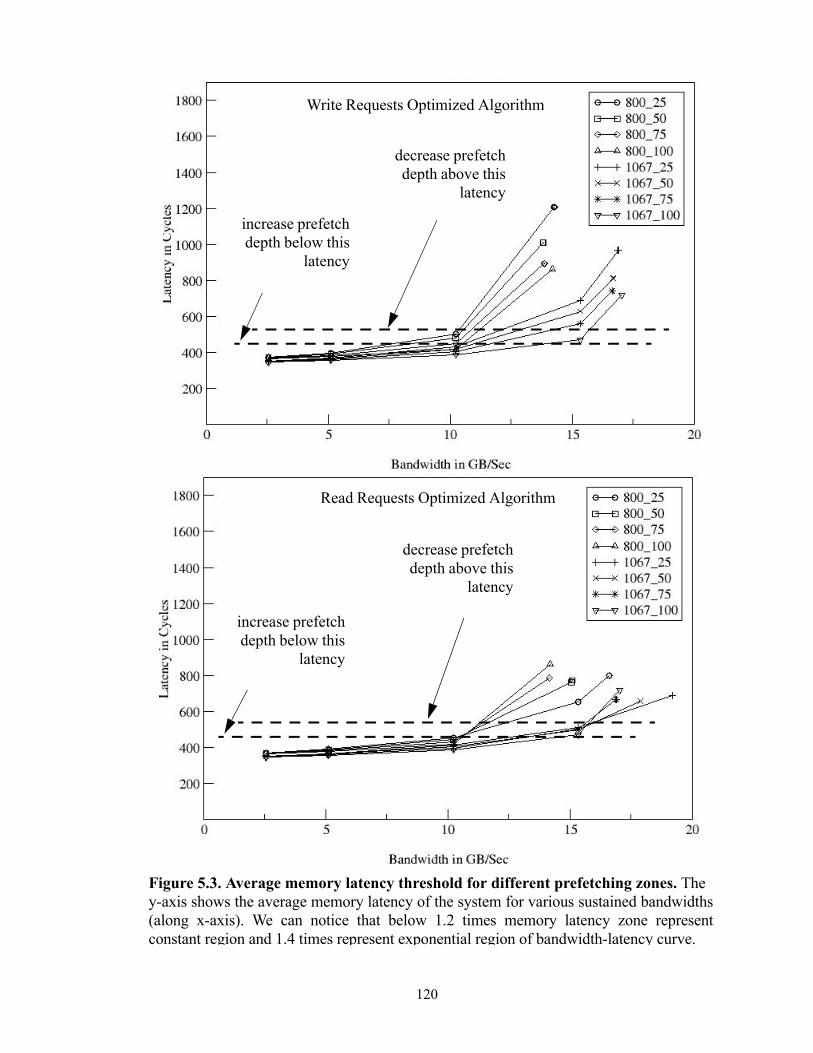
120
Write Requests Optimized Algorithm
Figure 5.3. Average memory latency threshold for different prefetching zones. They-axis shows the average memory latency of the system for various sustained bandwidths(along x-axis). We can notice that below 1.2 times memory latency zone representconstant region and 1.4 times represent exponential region of bandwidth-latency curve.
Read Requests Optimized Algorithm
increase prefetchdepth below this
latency
decrease prefetchdepth above this
latency
decrease prefetchdepth above this
latency
increase prefetchdepth below this
latency
121
The feedback threshold can also be based on other factors such as DRAM power
consumption, prefetch data hit rate, cache pollution etc. These ideas are orthogonal to our
methodology and can complement our scheme. Further, the latency threshold can also be
made adaptive depending on these factors.
Figure 5.4 shows the flowchart for the load aware prefetching algorithm. Normal
cache misses are sent to memory and returned data is stored in the cache. Latency monitor
unit computes the average latency of misses every so many cycles or cache misses. The
stream prefetch generator then generates the prefetch memory requests based on the crite-
Figure 5.4. Flowchart for Load Aware Prefetching algorithm. The above flowchartdescribes the load aware prefetching methodology. 1) Cache misses are sent to memoryand 2) Data is received from memory. 3) The average memory latency is computed forevery X cache misses (where X is programmable). 4) Based on the prefetch zone,determined by the latency feedback, necessary number of stream prefetches aregenerated.
Generate Prefetch request for demand miss based on prefetch zone
Memory
Prefetch request to memory
CACHE
Data back to cache
Latency Monitor
Latency tolerable?
Y
Normal request to memory
Do nothing
N1
2
34
Generate Prefetch request for demand miss based on prefetch zone
Memory
Prefetch request to memory
CACHE
Data back to cache
Latency Monitor
Latency tolerable?
Y
Normal request to memory
Do nothing
N1
2
34
122
ria for feedback threshold, which depends on the operating region of the system. The
prefetch data is returned back to the cache along with regular requests.
5.2. Experimental Setup and Results
This section describes the performance improvement achieved for different sus-
tained DRAM bandwidth with stream prefetchers and the adaptive scheduling policies of
load aware prefetcher in a multi-core environment. We used the Manysim simulator
described in chapter 3 for our studies [2]. The simulation parameters were varied as shown
in Table 5.1. We used the DDR-800 and DDR-1600 memory configurations for our study
as shown in Table 5.2. These studies were carried out for an 8-core system with different
degrees of prefetching. Prefetching degree refers to the number of adjacent cache lines
TABLE 5.1. Load Aware Prefetching Simulation Parameters
Parameters ConfigurationsPrefetching Degree/Depth 1, 2, 4Number of Cores 8DRAM configurations DDR-800, DDR-1600, DDR-
1600x2Shared L2 cache size 2MBL2 hit latency 15L2 Associativity 8Shared L3 cache size 8MBL3 hit latency 50L3 Associativity 16cache line size 64BytesPrefetch Scheduling Policy Normal scheduling, Adaptive
Scheduling
123
fetched on a demand miss. It is also referred to as prefetching depth in some studies. (In this
thesis prefetching degree and depth are used interchangeably.)
5.2.1 Impact of Degrees of Prefetching
In this section we describe the impact of prefetching degree (i.e. number of adja-
cent cache lines prefetched) using stream prefetchers. Figure 5.5 shows the performance
improvement with respect to no-prefetching scheme for different prefetching depth with
DDR-800 configuration. We observed that as the number of adjacent cache lines fetched in
is increased, the performance degrades for all benchmarks for DDR-800 configuration. The
performance degrades from +5% for single adjacent cache line to about -25% for SAP. The
Figure 5.5. Performance improvement using stream prefetcher for DDR-800. Thex-axis shows the various benchmarks with different prefetching degree. The performanceimproves by 5% for SAP and degrades from there on for all cases due to bandwidthconstraint.
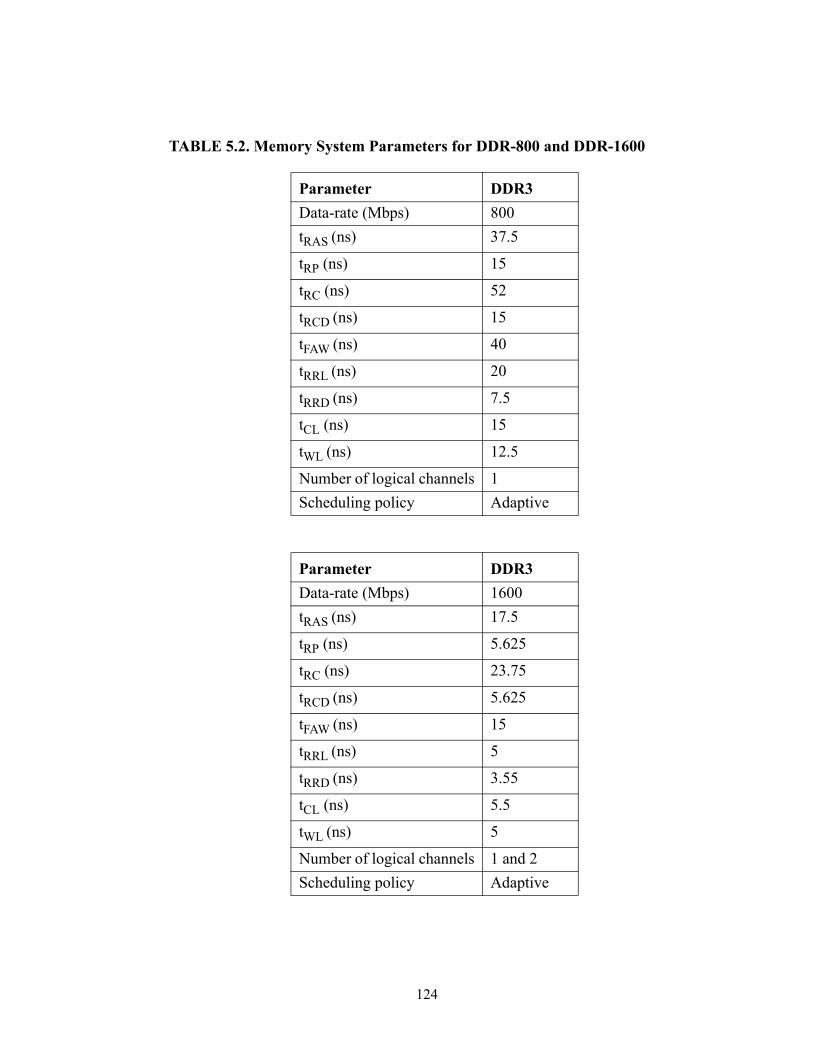
124
TABLE 5.2. Memory System Parameters for DDR-800 and DDR-1600
Parameter DDR3Data-rate (Mbps) 800tRAS (ns) 37.5
tRP (ns) 15
tRC (ns) 52
tRCD (ns) 15
tFAW (ns) 40
tRRL (ns) 20
tRRD (ns) 7.5
tCL (ns) 15
tWL (ns) 12.5
Number of logical channels 1Scheduling policy Adaptive
Parameter DDR3Data-rate (Mbps) 1600tRAS (ns) 17.5
tRP (ns) 5.625
tRC (ns) 23.75
tRCD (ns) 5.625
tFAW (ns) 15
tRRL (ns) 5
tRRD (ns) 3.55
tCL (ns) 5.5
tWL (ns) 5
Number of logical channels 1 and 2Scheduling policy Adaptive
125
performance degradation is more pronounced in TPCC which needed more bandwidth
even for the base case i.e. no-prefetching scheme. The performance degrades from -10% to
-65% with TPCC. This is due to the increased bandwidth constraint which increases the
memory latency. The average latency increases from 645 cycles for TPCC with no-
prefetching scheme to 1640 cycles (more than 220% increase) when 4 adjacent cache lines
are prefetched. The performance degradation slows down for SJAS compared to SAP as
more number of adjacent cache lines are prefetched due to increased hit rate. The hit rate
increases by almost 7% from prefetching degree of 2 to 4 for SJAS and only by 3% for
SAP. We can observe from our earlier studies that SJAS had the most locality among all
server workloads.
Figure 5.6 shows the performance improvement for the DDR-1600 configuration.
The performance improvement is better than the DDR-800 configuration. The performance
improves by almost 12% for SAP and around 8% for SJAS for a prefetching depth of 2.
The performance degrades for SJBB and TPCC due to their lack of locality, which
increases the miss rate further with a stream prefetching scheme and correspondingly the
bandwidth requirement. This increases the average latency for these two benchmarks and
hence the performance degrades.
5.2.2 Impact of DRAM bandwidth
We wanted to study the possibility of further improvement in performance for these
workloads in a higher bandwidth environment. So we simulated the DDR-1600 configura-
tion in a dual channel mode. We effectively doubled the theoretical bandwidth of the sys-
tem to 25.6 GB/Sec. Figure 5.7 shows the performance improvement for different
prefetching depths using this configuration. We observed that SJAS is the single workload
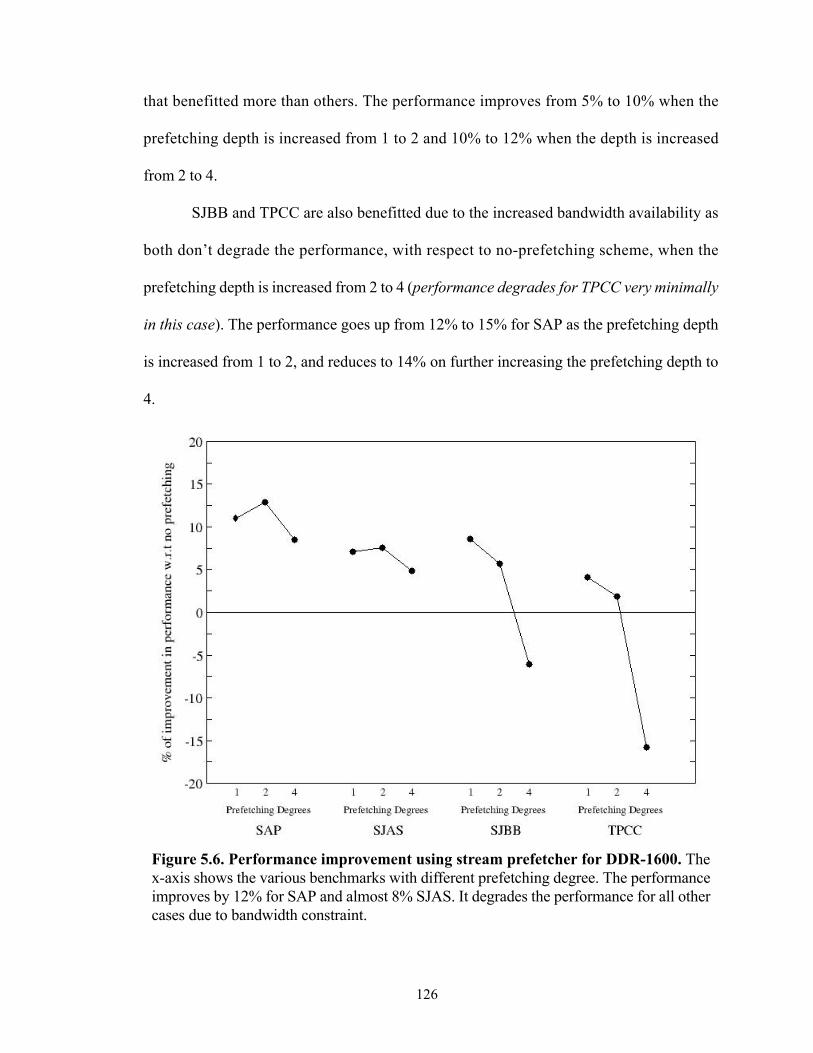
126
that benefitted more than others. The performance improves from 5% to 10% when the
prefetching depth is increased from 1 to 2 and 10% to 12% when the depth is increased
from 2 to 4.
SJBB and TPCC are also benefitted due to the increased bandwidth availability as
both don’t degrade the performance, with respect to no-prefetching scheme, when the
prefetching depth is increased from 2 to 4 (performance degrades for TPCC very minimally
in this case). The performance goes up from 12% to 15% for SAP as the prefetching depth
is increased from 1 to 2, and reduces to 14% on further increasing the prefetching depth to
4.
Figure 5.6. Performance improvement using stream prefetcher for DDR-1600. Thex-axis shows the various benchmarks with different prefetching degree. The performanceimproves by 12% for SAP and almost 8% SJAS. It degrades the performance for all othercases due to bandwidth constraint.
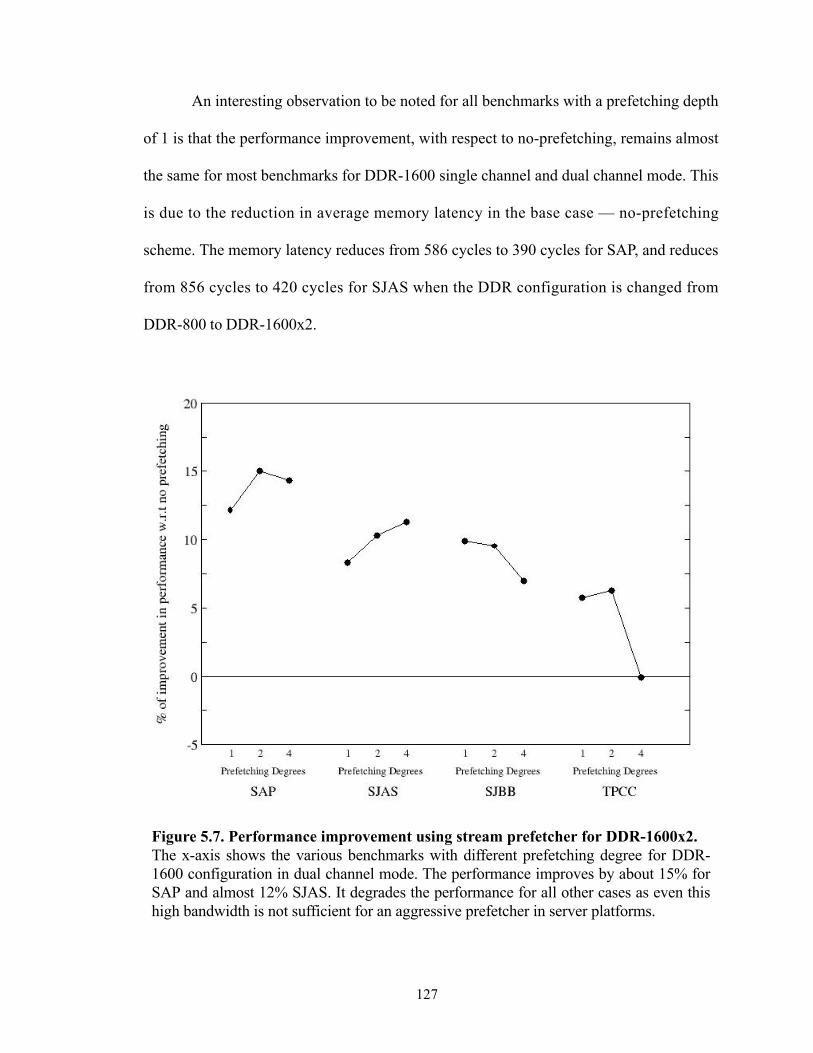
127
An interesting observation to be noted for all benchmarks with a prefetching depth
of 1 is that the performance improvement, with respect to no-prefetching, remains almost
the same for most benchmarks for DDR-1600 single channel and dual channel mode. This
is due to the reduction in average memory latency in the base case — no-prefetching
scheme. The memory latency reduces from 586 cycles to 390 cycles for SAP, and reduces
from 856 cycles to 420 cycles for SJAS when the DDR configuration is changed from
DDR-800 to DDR-1600x2.
Figure 5.7. Performance improvement using stream prefetcher for DDR-1600x2. The x-axis shows the various benchmarks with different prefetching degree for DDR-1600 configuration in dual channel mode. The performance improves by about 15% forSAP and almost 12% SJAS. It degrades the performance for all other cases as even thishigh bandwidth is not sufficient for an aggressive prefetcher in server platforms.
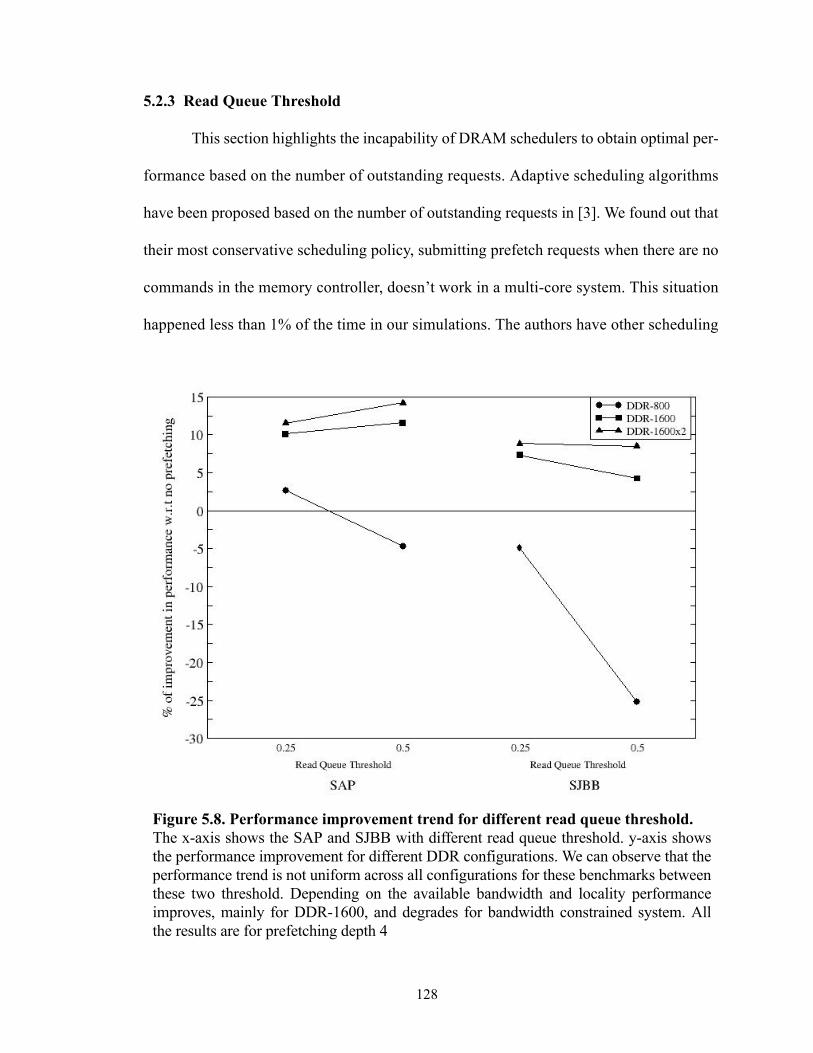
128
5.2.3 Read Queue Threshold
This section highlights the incapability of DRAM schedulers to obtain optimal per-
formance based on the number of outstanding requests. Adaptive scheduling algorithms
have been proposed based on the number of outstanding requests in [3]. We found out that
their most conservative scheduling policy, submitting prefetch requests when there are no
commands in the memory controller, doesn’t work in a multi-core system. This situation
happened less than 1% of the time in our simulations. The authors have other scheduling
Figure 5.8. Performance improvement trend for different read queue threshold. The x-axis shows the SAP and SJBB with different read queue threshold. y-axis showsthe performance improvement for different DDR configurations. We can observe that theperformance trend is not uniform across all configurations for these benchmarks betweenthese two threshold. Depending on the available bandwidth and locality performanceimproves, mainly for DDR-1600, and degrades for bandwidth constrained system. Allthe results are for prefetching depth 4
129
policies such as issuing prefetch requests when conflict queue is empty, when there are no
transactions in read queue alone etc. We modified these policies into two of our own adap-
tive schedulers based on read queue occupancy.
In the first case we scheduled prefetch requests only when the read queue was less
than 25% of its full capacity (prefetch requests are included in the read requests). In the
second scenario we scheduled prefetch requests when the read queue was up to 50% to its
full capacity and beyond that no prefetch requests were issued. In both these cases
prefetches weren’t generated above the threshold value.
Figure 5.8 shows the performance variation for the two read queue threshold poli-
cies for different DDR configurations with a prefetch depth of 4. We observe that the per-
formance trend is not uniform across all configurations. The performance degrades when
the read queue threshold is increased from 0.25 to 0.5 for both SAP and SJBB workloads
with DDR-800 configuration. The performance degrades from 2.5% to -5% for SAP and
degrades from -5% to around -20% for SJBB. On the contrary, performance improves for
SAP with both DDR-1600 configurations (single channel and dual channel mode). The
performance improves from 10% to 12% for DDR-1600 configuration and 12% to 14% for
DDR-1600x2. The performance remains almost the same for SJBB with DDR-1600x2 and
degrades slightly for 8% to 4% for DDR-1600.
This shows that the behavior of the workloads depends more on the available band-
width than on the number of outstanding requests. Performance degrades as the threshold is
increased in a bandwidth constrained system and improves otherwise. Using a conservative
policy is good in a bandwidth constrained system and being aggressive in a bandwidth
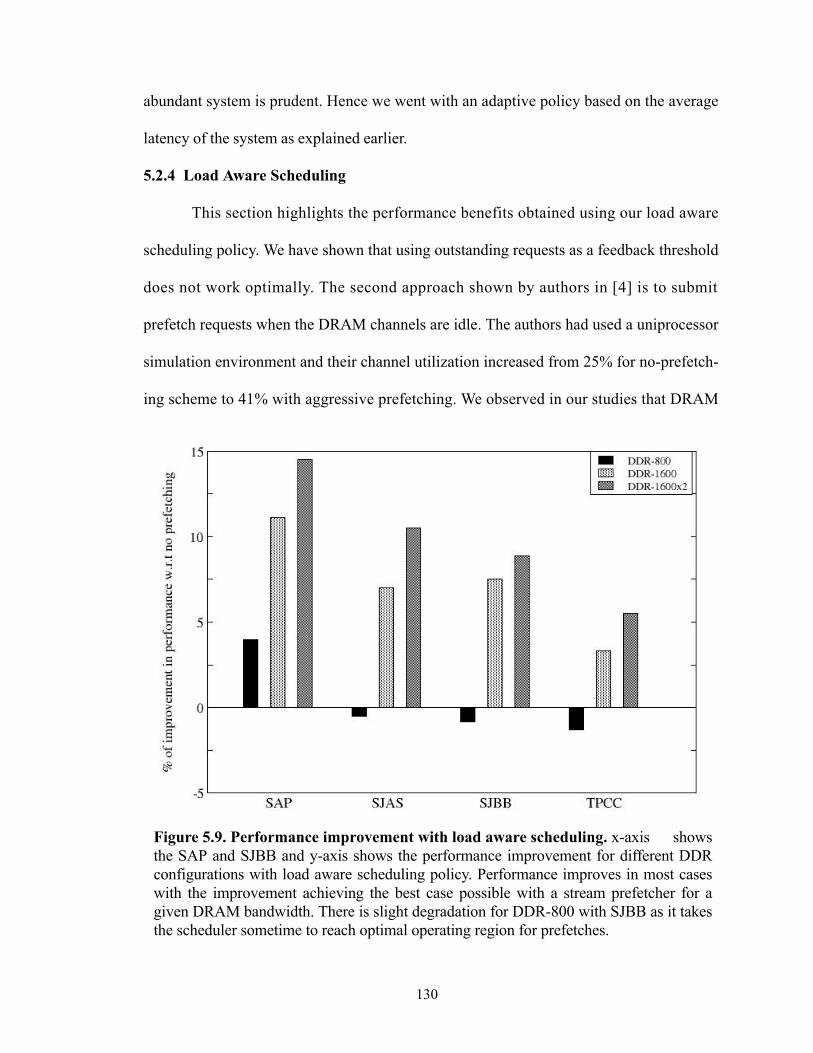
130
abundant system is prudent. Hence we went with an adaptive policy based on the average
latency of the system as explained earlier.
5.2.4 Load Aware Scheduling
This section highlights the performance benefits obtained using our load aware
scheduling policy. We have shown that using outstanding requests as a feedback threshold
does not work optimally. The second approach shown by authors in [4] is to submit
prefetch requests when the DRAM channels are idle. The authors had used a uniprocessor
simulation environment and their channel utilization increased from 25% for no-prefetch-
ing scheme to 41% with aggressive prefetching. We observed in our studies that DRAM
Figure 5.9. Performance improvement with load aware scheduling. x-axis showsthe SAP and SJBB and y-axis shows the performance improvement for different DDRconfigurations with load aware scheduling policy. Performance improves in most caseswith the improvement achieving the best case possible with a stream prefetcher for agiven DRAM bandwidth. There is slight degradation for DDR-800 with SJBB as it takesthe scheduler sometime to reach optimal operating region for prefetches.
131
efficiency in server settings is around 70%-75%. This being the case, DRAM channels are
idle at least 25% of the time. The average memory latency reaches the exponential region
beyond 75% of the sustained bandwidth, which is around 55% of the theoretical maximum
bandwidth. Hence this scheme of submitting prefetching requests during idle cycles is not
possible in multi-core systems. If we try to submit prefetch requests during the available
idle cycles, performance will degrade if the system is already operating in the exponential
region of the bandwidth latency curve. This can be observed from our earlier results in the
previous chapter when we submitted prefetches as low priority requests in the memory
controller for TPC.
This highlights the fact that we need a different metric to be able to submit prefetch
requests to obtain optimal performance improvement across different DDR configurations,
i.e. available system bandwidth. We use latency as the metric, because it is this we are try-
ing to reduce using prefetch optimizations. Since this faithfully gives the operating region
of the application, we can be aggressive or docile in prefetching depending on the available
bandwidth.
Figure 5.9 shows the performance improvement obtained using the load aware
scheduling policy as described in 5.1. We observe that the performance improves across all
DDR configurations, and we are able to achieve the best possible improvement for the
available bandwidth. We get about 14.5% improvement in performance for SAP with
DDR-1600x2 configuration, which is close to 15.1% obtained using prefetch depth of 4 for
the same configuration. We get almost 12% performance gain for DDR-1600 and 4.5% for
DDR-800 for SAP which comes close to our other best results obtained using stream
prefetchers of different depth.
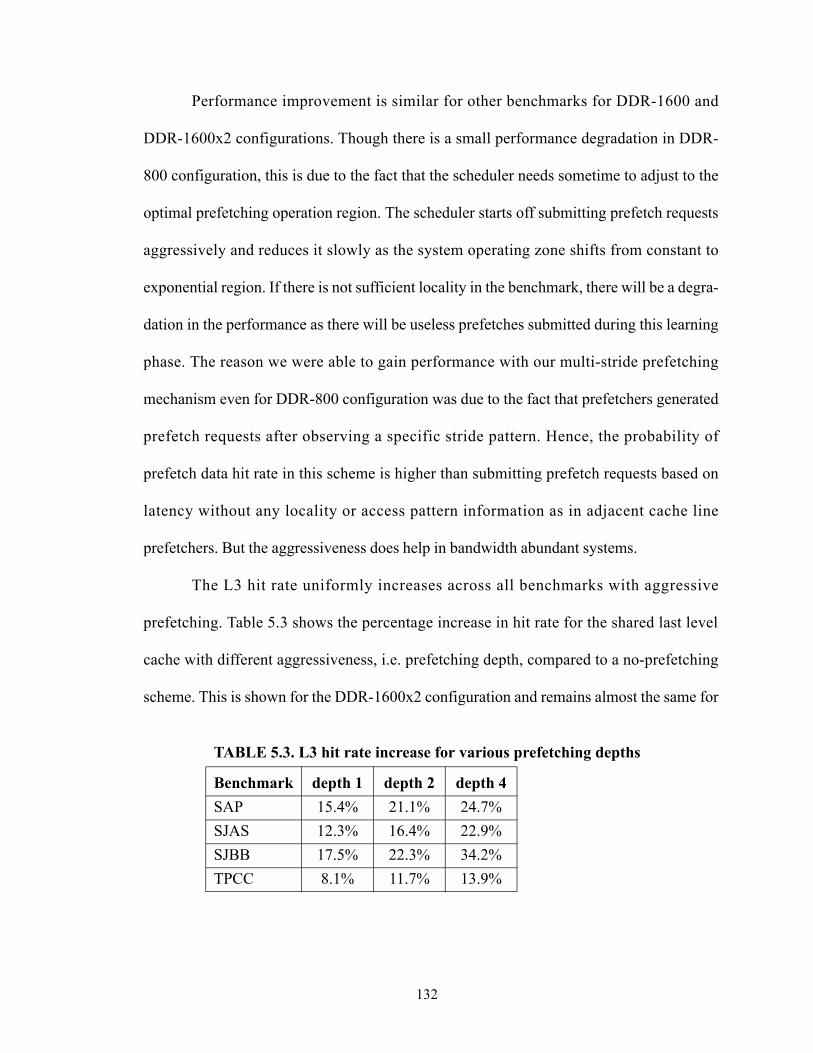
132
Performance improvement is similar for other benchmarks for DDR-1600 and
DDR-1600x2 configurations. Though there is a small performance degradation in DDR-
800 configuration, this is due to the fact that the scheduler needs sometime to adjust to the
optimal prefetching operation region. The scheduler starts off submitting prefetch requests
aggressively and reduces it slowly as the system operating zone shifts from constant to
exponential region. If there is not sufficient locality in the benchmark, there will be a degra-
dation in the performance as there will be useless prefetches submitted during this learning
phase. The reason we were able to gain performance with our multi-stride prefetching
mechanism even for DDR-800 configuration was due to the fact that prefetchers generated
prefetch requests after observing a specific stride pattern. Hence, the probability of
prefetch data hit rate in this scheme is higher than submitting prefetch requests based on
latency without any locality or access pattern information as in adjacent cache line
prefetchers. But the aggressiveness does help in bandwidth abundant systems.
The L3 hit rate uniformly increases across all benchmarks with aggressive
prefetching. Table 5.3 shows the percentage increase in hit rate for the shared last level
cache with different aggressiveness, i.e. prefetching depth, compared to a no-prefetching
scheme. This is shown for the DDR-1600x2 configuration and remains almost the same for
TABLE 5.3. L3 hit rate increase for various prefetching depths
Benchmark depth 1 depth 2 depth 4SAP 15.4% 21.1% 24.7%SJAS 12.3% 16.4% 22.9%SJBB 17.5% 22.3% 34.2%TPCC 8.1% 11.7% 13.9%
133
other configurations. This is because the hit rate depends on the aggressiveness of the
stream prefetcher and not on the DDR configuration. We can observe that the hit rate
increases by up to 35% for SJBB, 25% for SJAS and 22% for SAP. TPCC is the only
benchmark that shows a small improvement in hit rate due to its lack of locality. This can
be seen in its small performance improvement of only 6% for the best case.
5.3. Summary
This chapter highlighted the drawbacks of other scheduling policies for prefetch
requests without considering the bandwidth constraints in server platforms. We showed
that existing scheduling policies for prefetchers don’t work well in a multi-core systems
due to the increased bandwidth contention among cores. We provided a new metric to be
used for prefetching in server settings and showed how performance gains can be obtained
using smarter scheduling policies based on average memory latency behavior of the sys-
tem. Our results showed that performance improvement as high as 15% can be obtained
using an aggressive stream prefetchers combined with a load aware scheduling policy. We
also showed the cases where this prefetcher may not perform as well as multi-stride
prefetching and explained the reasons. We also show that performance improvement tapers
off at higher bandwidths even with aggressive prefetching. This is due to the improvement
in base case i.e. average memory latency reducing significantly with no-prefetching
scheme for different DDR configurations.
134
Chapter 6: ConclusionThe importance of memory models in performance evaluation is not clearly
understood. Simplistic models have been used to show performance improvement with
memory optimization schemes such as prefetching. The fact that industry practice cannot
reproduce these theoretical results demonstrates a problem with this experimental
approach. This dissertation has been an attempt to address this problem in a holistic
manner, and to identify mechanisms to improve the system performance in server
platforms.
This dissertation consists of three major inter-related studies. First, we performed a
detailed study of the accuracy of various simplistic memory models for different multi-core
configurations, and we compared it against a cycle accurate model. We then showed how
the inaccuracy increases as the complexity of the system increases — the number of cores
in our case. We explored the memory optimization technique of prefetching and its impact
on performance gains using these simplistic models. We showed that performance
projections using the simplistic models can be misleading. We also showed how the
average memory latency of the system varies with different things such as read-write mix
in the workload, sustained bandwidth, and scheduling algorithms. The contributions of this
study include:
• Detailed characterization results of different simplistic models in multi-core
configuration and their performance compared against a cycle accurate model. The
performance difference increased from 2% for single-core system to 15% for multi-
core architectures. The performance improvement projection with the simplistic
135
memory models was shown to be linear whereas it tapered off at higher number of
cores due to bandwidth constraints.
• Highlighted the complexity of using average memory latency in performance
evaluation. We showed that the average latency, which depends on numerous
factors, varies a lot with read-write mix in the traffic, DRAM sustained bandwidth
and scheduling policies. We showed that the average memory latency varied from
390 cycles to more than 1200 cycles (~300% increase) based on these different
configurations.
• We studied the effects of prefetching using simplistic models. We showed that
the performance difference increases between these models and a cycle accurate
model with memory optimization studies. The performance difference was as high
as 65% for an 8-core configuration. We showed that the performance projection
trend using the simplistic models and cycle accurate model vastly differed, and we
might under-design the system based on these results.
In the second study, we did a case study to improve the performance of server
platforms using established approaches. We extended the idea of memory side sequential
prefetch, which has been shown to work for server platforms, to accommodate the strides
observed in server workloads. We demonstrated that the performance improvement did not
match the established results due to lack of locality/regularity in the server workloads. We
also identified that bandwidth is a constraint in these systems. We showed that prefetching
without feedback can lead to performance degradation in certain cases. The contributions
made in this study include:
136
• Extending the memory sequential prefetcher to account for stride patterns in
server workloads. A novel multi-stride prefetcher to track different strides in server
benchmarks was proposed. The prefetcher was implemented as memory side
prefetcher i.e. prefetcher residing in memory controller with buffers. We showed
performance improvement of up to 6% in these workloads. This limited improve-
ment was due to the sparse locality in these benchmarks and also the bandwidth
constraint imposed by the prefetch requests.
• We also showed that contrary to conventional wisdom, giving equal priority to
prefetch requests can improve the system performance in certain cases when the
prefetch buffer hit rate is more than the pending hit rate, and cache misses don’t
have to wait for the pending data to come back from the memory. Though the
performance difference is minimal and happens rarely, it has to be taken into
account while designing a system.
Third, we used the knowledge gained from the previous studies to propose a novel
load aware scheduling policy for prefetching schemes in server platforms. We found out
that using average memory latency of the application to efficiently schedule prefetch
requests gave optimal performance gain over other schemes, which calibrates the idleness
of the system based on the DRAM channel idleness or the number of outstanding requests
in the memory controller. We showed performance improvement using aggressive
prefetching technique in combination with our scheduling policy for server workloads. The
contributions made in this study include:
137
• Highlighted the drawbacks of existing scheduling policies for prefetch requests
in multi-core systems. We showed that either these schemes are inapplicable, or
they do not give optimal performance for different sustained system bandwidths.
• Highlighted the benefits of our scheduling policy with an aggressive stream
prefetcher in a multi-core environment. Our results show a performance improve-
ment of up to 15% without much degradation across various system bandwidths.
Taken together, these studies address one of the major problems in performance
evaluation and optimization of complex systems such as CMP server platforms. The results
quantified by our models should enable researchers to gain a better understanding of the
working behavior of memory systems and the role it plays in bandwidth intensive environ-
ments such as CMPs. The ideas proposed in this study based on real memory systems
should improve the performance of server platforms.
138
References
Chapter 1
[1] N. P. Jouppi, “Improving direct-mapped cache performance by the addition of a small fully-associative cache and prefetch buffers”, In Proceedings of the 17th International Symposium on Computer Architecture, pp. 364-373, May 1990.
[2] F. Dahlgren and P. Stenstrom, “Effectiveness of hardware-based stride and sequential prefetching in shared memory multiprocessors”, In Proceedings of 1st IEEE Symposium on High Performance Computer Architecture, pp.68-77, January 1995.
[3] P. G. Emma, A. Hartstein, T. R. Puzak, and V. Srinivasan, “Exploring the limits of prefetching”, IBM Journal of Research and Development, vol. 49, issue 1, pp. 127-144, January 2005.
[4] W. A. Wong and J. L. Baer, “The Impact of timeliness for hardware-based prefetching from main memory”, Technical Report UW-CSE-02-06-03, University of Washington, February 2003.
[5] I. Hur and C. Lin, “Memory prefetching using adaptive stream detection”, In Proceed-ings of 39th International Symposium on Microarchitecture, pp. 397-408, December 2006.
[6] J. D. Davis, J. Laudon, and K. Olukotun, “Maximizing CMP throughput with mediocre cores”, In Proceedings of the 14th International Conference on Parallel Architectures and Compilation Techniques, pp. 51-62, September 2005.
[7] R. Uhlig, R. Fishtein, O. Gershon, I. Hirsh, and H. Wang, “SoftSDV: a presilicon devel-opment environment for the IA-64 architecture”, Intel Technology Journal, 1999.
[8] Milo M.K. Martin, Daniel J. Sorin, Bradford M. Beckmann, Michael R. Marty, Min Xu, Alaa R. Alameldeen, Kevin E. Moore, Mark D. Hill, and David A. Wood, “Multifacet's General Execution-driven Multiprocessor Simulator (GEMS) Toolset”, Computer Architecture News (CAN), September 2005.
[9] L. Zhao, R. Iyer, J. Moses, R. Illikkal, S. Makineni, and D. Newell, “Exploring Large-Scale CMP Architectures using Manysim”, IEEE Micro, vol. 27, issue 4, pp. 21-33, August 2004.
Chapter 2
[1] G. E. Moore, “Cramming more components onto integrated circuits”, Electronics, vol. 38, April 1965.
[2] W. A. Wulf and S. A. McKee, “Hitting the memory wall: Implications of the obvi-ous”, Computer Architecture News, 1994.
[3] D. Kroft, “Lockup-free instruction fetch/prefetch cache organization”, in ISCA ’81: Proceedings of the 8th annual symposium on Computer Architecture, (Los Alami-tos, CA, USA), pp. 81–87, IEEE Computer Society Press, 1981.
[4] D. Callahan, K. Kennedy, and A. Porterfield, “Software prefetching”, in ASPLOS-IV: Proceedings of the fourth international conference on Architectural support for programming languages and operating systems, (New York, NY, USA), pp. 40–52, ACM Press, 1991.
139
[5] T.-F. Chen and J.-L. Baer., “A performance study of software and hardware data prefetching schemes”, In Proceedings of the 21st Annual International Symposium on Computer Architecture, 1994.
[6] D. Burger, J. R. Goodman, and A. Kagi, “Memory bandwidth limitations of future microprocessors”, In Proceedings of the 23rd Annual International Symposium on Computer Architecture, 1996.
[7] Dean Tullsen, Susan J. Eggers, Henry M. Levy, “Simultaneous Multithreading: Maxi-mizing On-Chip Parallelism”, In Proceedings of the 22th Annual International Sympo-sium on Computer Architecture, 1995.
[8] A. R. Alameldeen and D. A. Wood, “Adaptive cache compression for high performance processors”, In Proceedings of the 31st Annual International Symposium on Computer Architecture, 2004.
[9] Shenglin Yang, Ingrid M. Verbauwhede, “Methodology for Memory Analysis and Optimization in Embedded Systems”, GSPx 2004.
[10] P. R. Panda, F. Catthhoor, N. D. Dutt, et al., “Data and Memory Optimization Techniques for Embedded Systems”, ACM Transactions on Design Automation of Electronic Systems, Vol. 6, no. 2, pp. 149-206, April 2001.
[11] Frank Vahid, Tony Givargis, Susan Cotterell, “Power Estimator Development for Embedded System Memory Tuning”, Journal of Circuits, Systems and Computers, vol. 11, no. 5, pp. 459-476, October 2002.
[12] Krishna V. Palem, Rodric M. Rabbah, Vincent J. Mooney III, Pinar Korkmaz, Kiran Puttaswamy, “Design Space Optimization of Embedded Memory Systems via Data Remapping”, In 6th Annual High Performance Embedded Computing Workshop (HPEC), 2002.
[13] Sang-II Han, Amer Baghdadi, Marius Bonaciu, Soo-Ik Chae, Ahmed. A. Jerraya, “An Efficient Scalable and Flexible Data Transfer Architecture for Multiprocessor SoC with Massive Distributed Memory”, In 41st Design Automation Conference, 2004.
[14] R. B. Teremaine, P. A. Franaszek, J. T. Robinson, C.O. Schulz, T. B. Smith, M. E. Wazlowski, and P. M. Bland, “IBM Memory Expansion Technology”, IBM Journal of Research and Development, vol. 45, issue 2, pp. 271-285, March 2001.
[15] M. Kjelso, M. Gooch, and S. Jones, “Design and performance of a main memory hardware data compressor”, In Proceedings of 22nd EUROMICRO conference, 1996.
[16] L. Benini, D. Bruni, B. Ricco, A. Macii, and E. Macii, “An adaptive data compres-sion scheme for memory traffic minimization in processor based systems”, In pro-ceedings of International Conference on Circuits and Systems, pp. 866-869, May 2002.
[17] J. Lee, W. Hong, S-D Kim, “Design and Evaluation of a selective compressed memory system”, In Proceedings of International Conference on Computer Design, pp. 184-191, October 1999.
[18] E. Ahn, S-M. Yoo, and S-M S. Kang, “Effective algorithms for cache-level com-pression”, In Proceedings of the 2001 conference on Great Lake Symposium on VLSI, pp. 89-92, 2001.
140
[19] D. Chen,E. Peserico, and L. Rudolph, “A Dynamically partitionable compressed cache”, In Proceedings of Singapore-MIT Alliance Symposium, January 2003.
[20] E. Hallnor and S. Reinhardt, “A compressed memory hierarchy using an indirect index cache”, Technical Report CSE-TR-488-04, University of Michigan, 2004.
[21] J. Yang and R. Gupta, “Frequent value locality and its applications”, ACM Trans-actions on Embedded Computing Systems, vol. 1, issue 1, pp. 79-105, November 2002.
[22] Y. Zhang, J. Yang and R. Gupta, “Frequent value locality and value centric data cache design”, In Proceedings of 9th International conference on Architectural Support for Programming Languages and Operating Systems, pp. 150-159, November 2000.
[23] A. J. Smith, “Sequential program prefetching in memory hierarchies”, IEEE Com-puter, vol. 11, issue 12, December 1978.
[24] N. P. Jouppi, “Improving direct-mapped cache performance by the addition of a small fully-associative cache and prefetch buffers”, In Proceedings of the 17th International Symposium on Computer Architecture, pp. 364-373, May 1990.
[25] F. Dahlgren and P. Stenstrom, “Effectiveness of hardware-based stride and sequential prefetching in shared memory multiprocessors”, In Proceedings of 1st IEEE Symposium on High Performance Computer Architecture, pp.68-77, January 1995.
[26] F. Dahlgren and M. Dubois, “Sequential hardware prefetching in shared-memory multiprocessors”, IEEE Transaction on Parallel and Distributed Systems, vol. 6, issue 7, July 1995.
[27] J. W. C. Fu, J. H. Patel, and B. L. Janssens, “Stride directed prefetching in scalar processors”, In Proceedings of 25th International Symposium on Microarchitec-ture, pp. 102-110, 1992.
[28] A. Ki and A. E. Knowles, “Adaptive data prefetching using cache information”, In Proceedings of 11th International Conference on Supercomputing, pp. 204-212, 1997.
[29] S. Iacobovici, L. Spracklen, S. Kadambi, Y. Chou, and S. G. Abraham, “Effective stream-based and execution-based data prefetching”, In Proceedings of 18th Inter-national Conference on Supercomputing, pp. 1-11, 2004.
[30] D. Joseph and D. Grunwald, “Prefetching using Markov Predictors”, In Proceed-ings of the 24th Annual International Symposium on Computer Architecture, 1997.
[31] T. Mowry and A. Gupta, “Tolerating latency through software-controlled prefetch-ing in shared-memory multiprocessors”, Journal of Parallel and Distributed Com-puting, June 1991.
[32] T. Alexander and G. Kedem, “Distributed prefetch buffer/cache design for high performance memory systems”, In Proceedings of the 2nd International Symposium on High Performance Computer Architecture, pp. 254-263, 1996.
[33] Z. Zhang, Z. Zhu, and X. Zhang, “Cache dram for ILP processor memory access latency reduction”, IEEE Micro, vol. 21, issue 4, pp. 22-32, August 2001.
[34] I. Hur and C. Lin, “Memory prefetching using adaptive stream detection”, In Proceed-ings of 39th International Symposium on Microarchitecture, pp. 397-408, December 2006.
141
[35] P. G. Emma, A. Hartstein, T. R. Puzak, and V. Srinivasan, “Exploring the limits of prefetching”, IBM Journal of Research and Development, vol. 49, issue 1, pp. 127-144, January 2005.
[36] W. A. Wong and J. L. Baer, “The Impact of timeliness for hardware-based prefetching from main memory”, Technical Report UW-CSE-02-06-03, University of Washington, February 2003.
[37] W. F. Lin, S. K. Reinhardt, and D. Burger, “Reducing DRAM latencies with an integrated memory hierarchy design,” in HPCA, 2001.
[38] S. Srinath, O. Mutlu, H. Kim, Y. N. Patt, “Feedback directed prefetching: improv-ing the performance and bandwidth-efficiency of hardware prefetchers, in HPCA, 2007.
[39] Z. Zhang, Z. Zhu, and X. Zhang, “A permutation-based page interleaving scheme to reduce row-buffer conflicts and exploit data locality,” in MICRO 33: Proceed-ings of the 33rd annual ACM/IEEE international symposium on Microarchitecture, (New York, NY, USA), pp. 32–41, ACM Press, 2000.
[40] J. B. Carter, W. C. Hsieh, L. Stoller, M. R. Swanson, L. Zhang, E. Brunvand, A. Davis, C.-C. Kuo, R. Kuramkote, M. Parker, L. Schaelicke, T. T. Kuramkote, M. Parker, L. Schaelicke, and T. Tateyama, “Impulse: Building a smarter memory controller,” in HPCA, 1999.
[41] Chengqiang Zhang, Sally A. Mckee, “Hardware-Only Stream Prefetching and Dynamic Access Ordering”, In 14th Intl. Conference on Supercomputing, 2000.
[42] Binu K. Mathew, Sally A. Mckee, John B. Carter, Al Davis, “Design of a Parallel Vector Access Unit for SDRAM Memory Systems”, In 6th International Sympo-sium on High Performance Computer Architecture, 2000.
[43] Scott Rixner, William J. Dally, Ujval J. Kappasi et al., “A Bandwidth-Efficient Architecture for Media Processing”, In 31st Intl. Symposium on Microarchitecture, 1998.
[44] Sally A. Mckee, William A. Wulf, James H. Aylor, Robert H. Klenke et al., “Dynamic Access Ordering for Streamed Computations”, IEEE Transactions on Computers, vol. 49, no. 11, pp. 1255-1271, November 2000.
[45] Ibrahim Hur, Calvin Lin, “Adaptive History-Based Memory Schedulers”, In 37th Intl. Symposium on Microarchitecture, 2004.
[46] Scott Rixner, William J. Dally, Ujval J. Kappasi, Peter Mattson, John D. Owens, “Memory Access Scheduling”, In 27th Intl. Symposium on Computer Architecture, 2000.
[47] Scott Rixner, “Memory Controller Optimizations for Web Servers”, In 37th Intl. Symposium on Microarchitecture, 2004.
[48] K.-B. Lee, T.-C. Lin, and C.-W. Jen, “An efficient quality-aware memory control-ler for multimedia platform soc,” in IEEE TRANSACTIONS ON CIRCUITS AND SYSTEMS FOR VIDEO TECHNOLOGY, vol. 15, 2005.
[49] K.-B. Lee and C.-W. Jen, “Design and verification for configurable memory con-trollermemory interface socket soft ip,” in Journal of Chin. Institute of Electrical Engineers, vol. 8, p. 309 323, 2001.
142
[50] V. Cuppu, B. Jacob, B. Davis, and T. Mudge, “High-performance drams in work-station environments,” in IEEE Trans. Comput, vol. 50, (Washington, DC, USA), pp. 1133–1153, IEEE Computer Society, 2001.
[51] T. Takizawa and M. Hirasawa, “An efficient memory arbitration algorithm for a single chip mpeg2 av decoder,” in ICCE International Conference onConsumer Electronics, 2001.
[52] D. T. Wang, Modern DRAM Memory Systems: Performance Analysis and a High Performance, Power-Constrained DRAM-Scheduling Algorithm. PhD thesis, Uni-versity of Maryland College Park, 2005.
[53] B. D. Jun Shao, “A burst scheduling access reordering mechanism,” in HPCA 07: Proceedings of the 13th International Symposium on High-Performance Computer Architecture, Feburary 2007.
[54] Z. Zhu and Z. Zhang, “A performance comparison of dram system optimizations for smt processors,” in HPCA, 2005.
[55] V. Cuppu, B. Jacob, B. Davis, and T. Mudge, “High-performance drams in work-station environments,” in IEEE Trans. Comput, vol. 50, (Washington, DC, USA), pp. 1133–1153, IEEE Computer Society, 2001.
[56] Z. Zhu, Z. Zhang, and X. Zhang, “Fine-grain priority scheduling on multi-channel memory systems,” in 8th International Symposium on High Performance Com-puter Architecture, (HPCA-8), 2002.
[57] J. Shao and B. T. Davis, “The bit-reversal sdram address mapping,” in SCOPES’05: Proceedings of the 9th International Workshop on Software and Com-pilers for Embedded Systems, pp. 62–71, 2005.
[58] T. Mitra and T. cker Chiueh, “Dynamic 3d graphics workload characterization and the architectural implications,” in International Symposium on Microarchitecture, pp. 62–71, 1999.
[59] F. Harmsze, A. Timmer, and J. van Meerbergen, “Memory arbitration and cache management in stream-based systems,” in Proceedings of Design, Automation and Test in Europe Conference and Exhibition., 2000.
[60] F. A. B. Chitra Natarajan, Bruce Christenson, “A study of performance impact of memory controller features in multi-processor server environment.,” in Workshop on Memory performance issues, 2004.
[61] W. Weber, “Efficient Shared DRAM Subsystems for SOCs”, http://www.sonics-inc.com/sonics/products/memmax/productinfo/docs/DRAM_Scheduler.pdf
[62] K.-B. Lee, T.-C. Lin, and C.-W. Jen, “An efficient quality-aware memory control-ler for multimedia platform soc,” in IEEE TRANSACTIONS ON CIRCUITS AND SYSTEMS FOR VIDEO TECHNOLOGY, vol. 15, 2005.
[63] K.-B. Lee and C.-W. Jen, “Design and verification for configurable memory con-trollermemory interface socket soft ip,” in Journal of Chin. Institute of Electrical Engineers, vol. 8, p. 309 323, 2001.
[64] K. J. Nesbit, N. Aggarwal, J. Laudon, and J. E. Smith, “Fair queuing memory sys-tems,” in Proceedings of the 39th Annual International Symposium on Microarchi-tecture (MICRO-39), December 2006.
143
[65] P. Vogt. Fully buffered dimm (fb-dimm) server memory architecture: Capac-ity,performance, reliability, and longevity. Intel Developer Forum, Session OSAS008., Feburary 2004.
[66] Xiaobo Fan, Carla S. Ellis, Alvin R. Lebeck, “Memory Controller Policies for DRAM Power Management”, In Intl. Symposium on Low Power Electronics and Design, 2001.
[67] Hai Huang, Padmanabhan Pillai, Kang G. Shin, “Design and Implementation of Power-Aware Virtual Memory”, In USENIX Annual Technical Conference, 2003.
[68] Alvin R. Lebeck, Xiaobo Fan, Heng Zeng, Carla S. Ellis, “Power Aware Page Allocation”, In 9th Intl. Conference on Architectural Support for Programming Languages and Operating Systems, 2000.
[69] Hai Huang, Kang G. Shin, Charles Lefurgy, Tom Keller, “Improving Energy Effi-ciency by Making DRAM Less Randomly Accessed”, In Intl. Symposium on Low Power Electronics and Design, 2005.
[70] Charles Lefurgy, Karthick Rajamani, Freeman Rawson, Wes Felter, Michael Kis-tler, Tom W. Keller, “Energy Management for Commercial Servers”, IEEE Com-puter, vol. 36, no. 12, pp. 39-48, December 2003.
[71] V. Delaluz, M. Kandemir, N. Vijaykrishnan, A. Sivasubramaniam, and M. J. Irwin, “Dram energy management using software and hardware directed power mode control,” in 7th International Symposium on High Performance Computer Architecture, 2001.
[72] V. Delaluz, A. Sivasubramaniam, M. Kandemir, N. Vijaykrishnan, and M. J. Irwin, “Scheduler based dram energy management,” in DAC, 2002.
[73] V. Delaluz, M.T. Kandemir, I. Kolev, “Automatic data migration for reducing energy consumption in multi-bank memory systems”, in Proceedings of the 39th Design Automation Conference DAC’02, pp. 213–218, 2002.
[74] J-H Min, H. Cha, and V. P. Srini, “Dynamic power management of DRAM using accessed physical addresses”, Microprocessors and Microsystems, vol. 31, issue 1, February 2007.
[75] “Intel 975x express chipset.” http://www.intel.com/products/chipsets/975x/index.htm, 2005.
[76] “AMD Unveils Forward-Looking Technology Innovation To Extend Memory Footprint for Server Computing”, http://www.amd.com/us-en/Corporate/Virtual-PressRoom/0,,51_104_543%7E118446,00.html
[77] R. C. Schumann, “Design of the 21174 memory controller for digital personal workstations,” Digital Tech. J., vol. 9, no. 2, pp. 57–70, 1997.
[78] K. M. Weiss and K. A. House, “Digital personal workstations: the design of high-performance, low-cost, alpha systems,” Digital Technical Journal, vol. 9, pp. 45–56, 1997.
[79] F. Briggs, M. Cekleov, K. Creta, M. Khare, S. Kulick, A. Kumar, L. P. Looi, C. Natarajan, S. Radhakrishnan, and L. Rankin, “Intel 870: A building block for cost-effective, scalable servers,” IEEE Micro, vol. 22, pp. 36–47, 2002.
[80] S. Radhakrishnan and S. Chinthamani, “Intel 5000 series: Dual processor chipsets for servers and workstations.” Intel Developer Forum, 2006.
144
[81] B. Sinharoy, R. N. Kalla, J. M. Tendler, R. J. Eickemeyer, and J. B. Joyner, “Power5 system microarchitecture,” IBM Journal of Research and Development, vol. 49, 2005.
[82] C. Keltcher, “The amd hammer processor core.” Hot Chips 14, August 2002.[83] C. Keltcher, K. McGrath, A. Ahmed, and P. Conway., “The amd opteron processor
for multiprocessor servers.,” IEEE Micro, vol. 23, pp. 66–76, March-April 2003.[84] A. Saulsbury, F. Pong, and A. Nowatzyk, “Missing the memory wall: the case for
processor/memory integration,” in ISCA ’96: Proceedings of the 23rd annual inter-national symposium on Computer architecture, (New York, NY, USA), pp. 90–101, ACM Press, 1996.
[85] D. Patterson, T. Anderson, N. Cardwell, R. Fromm, K. Keeton, C. Kozyrakis, R. Thomas, and K. Yelick, “A case for intelligent ram,” IEEE Micro, vol. 17, no. 2, pp. 34–44, 1997.
[86] W. Bowman, N. Cardwell, C. Kozyrakis, C. Romer, and H. Wang, “Evaluation of existing architectures in iram systems,” in Workshop on Mixing Logic and DRAM, 24th International Symposium on Computer Architecture, 1997.
[87] D. Patterson, K. Asanovic, A. Brown, J. G. Richard Fromm, B. Gribstad, K. Keeton, C. Kozyrakis, D. Martin, S. Perissakis, R. Thomas, N. Treuhaft, and K. Yelick, “Intelligent ram (iram): the industrial setting, applications, and architec-tures,” in Intelligent RAM (IRAM): the Industrial Setting, Applications, and Archi-tectures, October 1997.
[88] R. Fromm, S. Perissakis, N. Cardwell, C. Kozyrakis, B. McGaughy, D. Patterson, T. Anderson, and K. Yelick, “The energy efficiency of iram architectures,” in The 24th Annual International Symposium on Computer Architecture, June 1997.
[89] C. Kozyrakis, J. Gebis, D. Martin, S. Williams, I. Mavroidis, S. Pope, D. Jones, D. Patterson, and K. Yelick, “Vector iram: A media-oriented vector processor with embedded dram,” in 12th Hot Chips Conference, August 2000.
[90] C. Kozyrakis, D. Judd, J. Gebis, S. Williams, D. Patterson, and K. Yelick, “Hard-ware/compiler co-development for an embedded media processor,” Proceedings of the IEEE, vol. 89, pp. 1694 – 1709, 2001.
[91] C. Kozyrakis and D. Patterson, “Overcoming the limitations of conventional vec-tor processors,” in 30th Annual International Symposium on Computer Architec-ture, 2003.
[92] D. Judd, K. Yelick, C. Kozyrakis, D. Martin, and D. Patterson, “Exploiting on-chip memory bandwidth in the viram compiler,” in Second Workshop on Intelligent Memory Systems, 2000.
[93] Y. Kang, M. W. Huang, S.-M. Yoo, D. Keen, Z. Ge, V. Lam, P. Pattnaik, and J. Torrellas, “Flexram: Toward an advanced intelligent memory system,” in ICCD ’99: Proceedings of the 1999 IEEE International Conference on Computer Design, (Washington, DC, USA), p. 192, IEEE Computer Society, 1999.
[94] J. Torrellas, L. Yang, and A.-T. Nguyen, “Toward a cost-effective dsm organiza-tion that exploits processor-memory integration,” in Sixth International Symposium on High-Performance Computer Architecture (HPCA), January 2000.
145
[95] B. Fraguela, P. Feautrier, J. Renau, D. Padua, and J. Torrellas, “Programming the flexram parallel intelligent memory system,” in International Symposium on Prin-ciples and Practice of Parallel Programming (PPoPP), June 2003.
[96] Y. Solihin, J. Lee, and J. Torrellas, “Adaptively mapping code in an intelligent memory architecture,” in 2nd Workshop on Intelligent Memory Systems, November 2000.
[97] M. Oskin, F. T. Chong, and T. Sherwood, “Active pages: A model of computation for intelligent memory.,” in International Symposium on Computer Architecture, 1998.
[98] M. Oskin, J. Hensley, D. Keen, F. T. Chong, M. Farrens, and A. Chopra, “Exploit-ing ilp in page-based intelligent memory,” in Proceedings of the International Sym-posium on Microarchitecture, November 1999.
[99] M. Oskin, F. T. Chong, and T. Sherwood, “Activeos: Virtualizing intelligent mem-ory,” in International Conference on Computer Design (ICCD99), 1999.
[100] B. Black, M. Annavaram, N. Brekelbaum, J. DeVale, L. Jiang, G. H. Loh, D. McCauley, P. Morrow, D. W. Nelson, D. Pantuso, P. Reed, J. Rupley, S. Shankar, J. Shen, and C. Webb, “Die stacking (3d) microarchitecture,” in Inter-national Symposium on Microarchitecture (MICRO), 2006.
[101] A. R. Alameldeen and D. A. Wood, “Variability in architectural simulations of multi-threaded workloads”, in 9th HPCA, 2003.
[102] Alaa R. Alameldeen, Milo M.K. Martin, Carl J. Mauer, Kevin E. Moore, Min Xu, Daniel J. Sorin, Mark D. Hill and David A. Wood, “Simulating a $2M Commercial Server on a $2K PC”, IEEE Computer, February 2003
[103] Nuengwong Tuaycharoen, Disk Design-Space Exploration in Terms of System-Level Performance, Power, and Energy Consumption. PhD thesis, University of Maryland College Park, 2006.
[104] J. Gibson, R. Kunz, D. Ofelt, M. Horowitz, J. Hennessy, and M. Heinrich, “Flash Vs. (Simulated) Flash: closing the simulation loop”, in ASPLOS 2000.
[105] R. Desikan, D. Burger, and S. W. Keckler, “Measuring experimental error in microprocessor simulation”, in 28th ISCA 2001.
[106] V. Krishnan and J. Torellas, “A Direct execution framework for fast and accurate simulation of superscalar processors”, in proceedings of International Parallel Architecture and Compilation Techniques, 1998.
[107] H. W. Cain, K. M. Lepak, B. A. Schwartz, and M. H. Lipasti, “Precise and accu-rate processor simulation”, in proceedings of fifth workshop on computer architec-ture evaluation using commercial workloads, pp. 13-22, 2002.
[108] M. Oskin, F. T. Chong, and M. Farrens, “HLS: Combining statistical and sym-bolic simulation to guide microprocessor designs”, in 27th ISCA, 2000.
[109] T. Sherwood, E. Perelman, and B. Calder, “Basic block distribution analysis to find periodic behavior and simulation points in applications”, in proceedings of International Parallel Architecture and Compilation Techniques, 2001.
[110] R. E. Kessler, M. D. Hill, and D. A. Wood, “A comparison of trace-sampling techniques for multimegabyte caches”, IEEE Transaction on Computers, vol. 43, issue 6, pp. 664-675, 1994.
146
Chapter 3
[1] J. Moses, R. Illikkal, R. Iyer, R. Huggahalli, and D. Newell, “ASPEN: Towards effective simulation of threads and engines in evolving platforms”, 12th IEEE International Sym-posium on Modeling, Analysis, and Simulation of Computer and Telecommunications Systems (MASCOTS'04) , pp. 51-58, 2004.
[2] T. Sherwood, E. Perelman, and B. Calder, “Basic block distribution analysis to find periodic behavior and simulation points in applications”, in proceedings of Interna-tional Parallel Architecture and Compilation Techniques, 2001.
[3] B. Sprunt, “Pentium 4 Performance-Monitoring Features”, IEEE Micro, vol. 22, no. 4, pp. 72-82, August 2002.
[4] R. Kumar, V. Zyuban, and D. M. Tullsen, “Interconnection in multi-core architectures: understanding mechanisms, overheads and scaling”, in 32nd ISCA, 2005.
[5] David Wang, Brinda Ganesh, Nuengwong Tuaycharoen, Katie Baynes, Aamer Jaleel, and Bruce Jacob, “DRAMsim: A memory-system simulator”, SIGARCH Computer Architecture News, vol. 33, no. 4, pp. 100-107. September 2005.
[6] Milo M.K. Martin, Daniel J. Sorin, Bradford M. Beckmann, Michael R. Marty, Min Xu, Alaa R. Alameldeen, Kevin E. Moore, Mark D. Hill, and David A. Wood, “Multifacet's General Execution-driven Multiprocessor Simulator (GEMS) Toolset”, Computer Architecture News (CAN), September 2005.
[7] P. G. Emma, A. Hartstein, T. R. Puzak, and V. Srinivasan, “Exploring the limits of prefetching”, IBM Journal of Research and Development, vol. 49, issue 1, pp. 127-144, January 2005.
[8] L. Zhao, R. Iyer, J. Moses, R. Illikkal, S. Makineni, and D. Newell, “Exploring Large-Scale CMP Architectures using Manysim”, IEEE Micro, vol. 27, issue 4, pp. 21-33, August 2004.
[9] L. Kleinrock, “Queuing Systems volume 1: Theory”, John Wiley and Sons publishers.[10] “Intel 975x express chipset.” http://www.intel.com/products/chipsets/975x/
index.htm, 2005.[11] “TPC-C Design Document”, www.tpc.org/tpcc/[12] Sap America Inc., “SAP Standard Benchmarks”, http://www.sap.com/solutions/bench-
mark/index.epx[13] SPECjbb2005 Java Business Benchmark, available online at http://www.spec.org/
jbb2005/[14] SPECweb2005 webserverBenchmark, available online at http://www.spec.org/
web2005/[15] Z. Zhang, Z. Zhu, and X. Zhang, “A permutation-based page interleaving scheme
to reduce row-buffer conflicts and exploit data locality,” in MICRO 33: Proceed-ings of the 33rd annual ACM/IEEE international symposium on Microarchitecture, (New York, NY, USA), pp. 32–41, ACM Press, 2000.
[16] Moinuddin K. Qureshi, Aamer Jaleel, Yale N. Patt, Simon C. Steely Jr., and Joel Emer, “ Adaptive Insertion Policies for High-Performance Caching”, in ISCA 2007.
[17] N. P. Jouppi, “Improving direct-mapped cache performance by the addition of a small fully-associative cache and prefetch buffers”, In Proceedings of the 17th International Symposium on Computer Architecture, pp. 364-373, May 1990.
147
[18] F. Dahlgren and P. Stenstrom, “Effectiveness of hardware-based stride and sequential prefetching in shared memory multiprocessors”, In Proceedings of 1st IEEE Symposium on High Performance Computer Architecture, pp.68-77, January 1995.
Chapter 4
[1] I. Hur and C. Lin, “Memory prefetching using adaptive stream detection”, In Proceed-ings of 39th International Symposium on Microarchitecture, pp. 397-408, December 2006.
[2] L. Zhao, R. Iyer, J. Moses, R. Illikkal, S. Makineni, and D. Newell, “Exploring Large-Scale CMP Architectures using Manysim”, IEEE Micro, vol. 27, issue 4, pp. 21-33, August 2004.
[3] T. Alexander and G. Kedem, “Distributed prefetch buffer/cache design for high per-formance memory systems”, In Proceedings of the 2nd International Symposium on High Performance Computer Architecture, pp. 254-263, 1996.
Chapter 5
[1] N. P. Jouppi, “Improving direct-mapped cache performance by the addition of a small fully-associative cache and prefetch buffers”, In Proceedings of the 17th International Symposium on Computer Architecture, pp. 364-373, May 1990.
[2] L. Zhao, R. Iyer, J. Moses, R. Illikkal, S. Makineni, and D. Newell, “Exploring Large-Scale CMP Architectures using Manysim”, IEEE Micro, vol. 27, issue 4, pp. 21-33, August 2004.
[3] I. Hur and C. Lin, “Memory prefetching using adaptive stream detection”, In Proceed-ings of 39th International Symposium on Microarchitecture, pp. 397-408, December 2006.
[4] W. F. Lin, S. K. Reinhardt, and D. Burger, “Reducing DRAM latencies with an inte-grated memory hierarchy design,” in HPCA, 2001.