Embed Size (px)
Citation preview
Swinburne University of Technology | CRICOS Provider 00111D | swinburne.edu.au
Swinburne Research Bank http://researchbank.swinburne.edu.au
Cenko, S. B., et al. (2012). PTF10iya: a short-lived, luminous flare from the nuclear region of a star-forming galaxy.
Originally published in Monthly Notices of the Royal Astronomical Society, 420(3), 2684–2699.
Available from: http://dx.doi.org/10.1111/j.1365-2966.2011.20240.x
Copyright © 2012 The authors.
This is the author’s version of the work, posted here with the permission of the publisher for your personal use. No further distribution is permitted. You may also be able to access the published version from your library. The definitive version is available at www.interscience.wiley.com.
arX
iv:1
103.
0779
v2 [
astr
o-ph
.HE
] 1
7 O
ct 2
011
Mon. Not. R. Astron. Soc. 000, 1–17 (2011) Printed 18 October 2011 (MN LATEX style file v2.2)
PTF10iya: A short-lived, luminous flare from the nuclear
region of a star-forming galaxy
S. Bradley Cenko1⋆, Joshua S. Bloom1, S. R. Kulkarni2, Linda E. Strubbe1,3,
Adam A. Miller1, Nathaniel R. Butler1,4, Robert M. Quimby5, Avishay Gal-Yam6,
Eran O. Ofek2,4, Eliot Quataert1,3, Lars Bildsten7,8, Dovi Poznanski4,9,1,10,
Daniel A. Perley1, Adam N. Morgan1, Alexei V. Filippenko1, Dale A. Frail11,
Iair Arcavi6, Sagi Ben-Ami6, Antonio Cucchiara9,1, Christopher D. Fassnacht12,
Yoav Green6, Isobel M. Hook13,14, D. Andrew Howell15,7, David J. Lagattuta12,
Nicholas M. Law16, Mansi M. Kasliwal2, Peter E. Nugent9, Jeffrey M. Silverman1,
Mark Sullivan13, Shriharsh P. Tendulkar2, and Ofer Yaron6.1Department of Astronomy, University of California, Berkeley, CA 94720-3411, USA2Cahill Center for Astrophysics, California Institute of Technology, Pasadena, CA, 91125, USA3Theoretical Astrophysics Center, University of California, Berkeley, CA 94720-3411, USA4Einstein Fellow5IPMU, University of Tokyo, Kashiwanoha 5-1-5, Kashiwa-shi, Chiba, Japan6Department of Particle Physics and Astrophysics, The Weizmann Institute of Science, Rehovot 76100, Israel7Department of Physics, Broida Hall, University of California, Santa Barbara, CA 93106, USA8Kavli Institute for Theoretical Physics, Kohn Hall, University of California, Santa Barbara, CA 93106, USA9Computational Cosmology Center, Lawrence Berkeley National Laboratory, 1 Cyclotron Road, Berkeley, CA 94720, USA10School of Physics and Astronomy, Tel-Aviv University, Tel-Aviv 69978, Israel11National Radio Astronomy Observatory, P.O. Box 0, Socorro, NM 87801, USA12Department of Physics, University of California Davis, 1 Shields Avenue, Davis, CA 95616, USA13Department of Physics (Astrophysics), University of Oxford, Keble Road, Oxford, OX1 3RH UK14INAF-Osservatorio di Roma, via Frascati 33, I-00040 Monteporzio Catone (Roma), Italy15Las Cumbres Observatory Global Telescope Network, Goleta, CA 93117, USA16Dunlap Institute for Astronomy and Astrophysics, University of Toronto, 50 St. George Street, Toronto M5S 3H4, Ontario, Canada
18 October 2011
ABSTRACTWe present the discovery and characterisation of PTF10iya, a short-lived (∆t ≈ 10 d,with an optical decay rate of ∼ 0.3magd−1), luminous (Mg′ ≈ −21mag) transientsource found by the Palomar Transient Factory. The ultraviolet/optical spectral en-ergy distribution is reasonably well fit by a blackbody with T ≈ (1–2) ×104K andpeak bolometric luminosity LBB ≈ (1–5)×1044 erg s−1 (depending on the details of theextinction correction). A comparable amount of energy is radiated in the X-ray bandthat appears to result from a distinct physical process. The location of PTF10iya isconsistent with the nucleus of a star-forming galaxy (z = 0.22405± 0.00006) to within350mas (99.7 per cent confidence radius), or a projected distance of less than 1.2 kpc.At first glance, these properties appear reminiscent of the characteristic “big bluebump” seen in the near-ultraviolet spectra of many active galactic nuclei (AGNs).However, emission-line diagnostics of the host galaxy, along with a historical lightcurve extending back to 2007, show no evidence for AGN-like activity. We thereforeconsider whether the tidal disruption of a star by an otherwise quiescent supermas-sive black hole may account for our observations. Though with limited temporal in-formation, PTF10iya appears broadly consistent with the predictions for the early“super-Eddington” phase of a solar-type star being disrupted by a ∼ 107M⊙ blackhole. Regardless of the precise physical origin of the accreting material, the large lu-minosity and short duration suggest that otherwise quiescent galaxies can transitionextremely rapidly to radiate near the Eddington limit; many such outbursts may havebeen missed by previous surveys lacking sufficient cadence.
Key words: accretion – galaxies: nuclei – black hole physics – galaxies: active
c© 2011 RAS
2 Cenko et al.
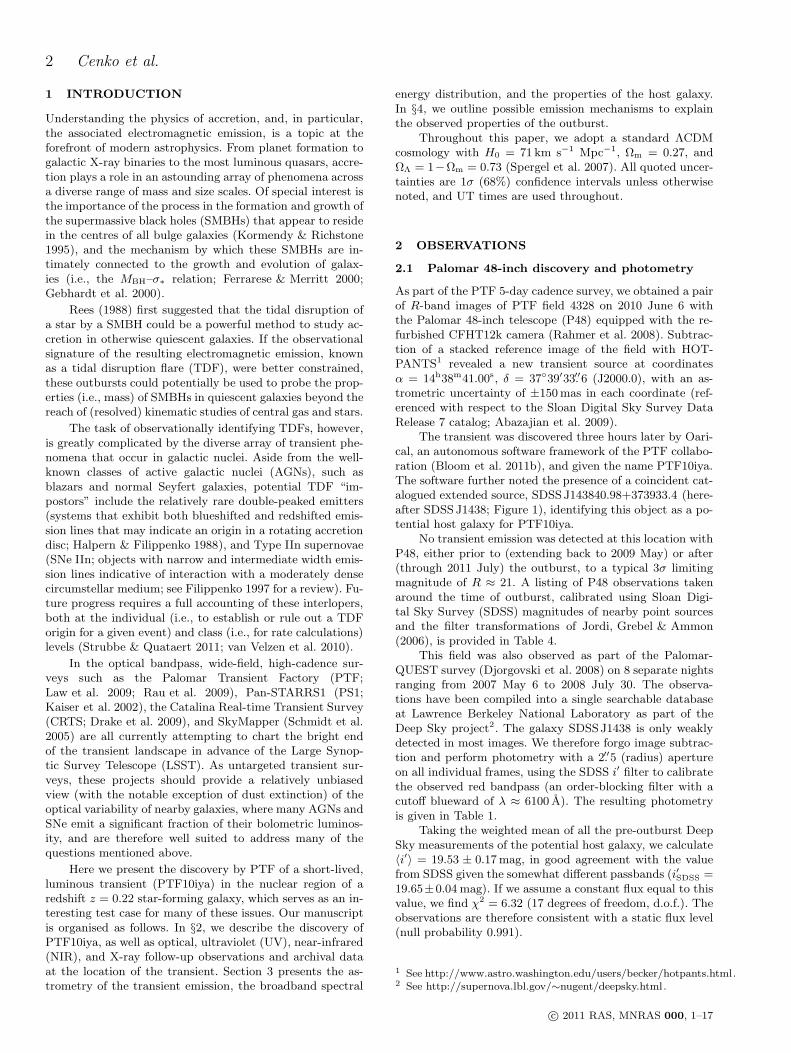
1 INTRODUCTION
Understanding the physics of accretion, and, in particular,the associated electromagnetic emission, is a topic at theforefront of modern astrophysics. From planet formation togalactic X-ray binaries to the most luminous quasars, accre-tion plays a role in an astounding array of phenomena acrossa diverse range of mass and size scales. Of special interest isthe importance of the process in the formation and growth ofthe supermassive black holes (SMBHs) that appear to residein the centres of all bulge galaxies (Kormendy & Richstone1995), and the mechanism by which these SMBHs are in-timately connected to the growth and evolution of galax-ies (i.e., the MBH–σ∗ relation; Ferrarese & Merritt 2000;Gebhardt et al. 2000).
Rees (1988) first suggested that the tidal disruption ofa star by a SMBH could be a powerful method to study ac-cretion in otherwise quiescent galaxies. If the observationalsignature of the resulting electromagnetic emission, knownas a tidal disruption flare (TDF), were better constrained,these outbursts could potentially be used to probe the prop-erties (i.e., mass) of SMBHs in quiescent galaxies beyond thereach of (resolved) kinematic studies of central gas and stars.
The task of observationally identifying TDFs, however,is greatly complicated by the diverse array of transient phe-nomena that occur in galactic nuclei. Aside from the well-known classes of active galactic nuclei (AGNs), such asblazars and normal Seyfert galaxies, potential TDF “im-postors” include the relatively rare double-peaked emitters(systems that exhibit both blueshifted and redshifted emis-sion lines that may indicate an origin in a rotating accretiondisc; Halpern & Filippenko 1988), and Type IIn supernovae(SNe IIn; objects with narrow and intermediate width emis-sion lines indicative of interaction with a moderately densecircumstellar medium; see Filippenko 1997 for a review). Fu-ture progress requires a full accounting of these interlopers,both at the individual (i.e., to establish or rule out a TDForigin for a given event) and class (i.e., for rate calculations)levels (Strubbe & Quataert 2011; van Velzen et al. 2010).
In the optical bandpass, wide-field, high-cadence sur-veys such as the Palomar Transient Factory (PTF;Law et al. 2009; Rau et al. 2009), Pan-STARRS1 (PS1;Kaiser et al. 2002), the Catalina Real-time Transient Survey(CRTS; Drake et al. 2009), and SkyMapper (Schmidt et al.2005) are all currently attempting to chart the bright endof the transient landscape in advance of the Large Synop-tic Survey Telescope (LSST). As untargeted transient sur-veys, these projects should provide a relatively unbiasedview (with the notable exception of dust extinction) of theoptical variability of nearby galaxies, where many AGNs andSNe emit a significant fraction of their bolometric luminos-ity, and are therefore well suited to address many of thequestions mentioned above.
Here we present the discovery by PTF of a short-lived,luminous transient (PTF10iya) in the nuclear region of aredshift z = 0.22 star-forming galaxy, which serves as an in-teresting test case for many of these issues. Our manuscriptis organised as follows. In §2, we describe the discovery ofPTF10iya, as well as optical, ultraviolet (UV), near-infrared(NIR), and X-ray follow-up observations and archival dataat the location of the transient. Section 3 presents the as-trometry of the transient emission, the broadband spectral
energy distribution, and the properties of the host galaxy.In §4, we outline possible emission mechanisms to explainthe observed properties of the outburst.
Throughout this paper, we adopt a standard ΛCDMcosmology with H0 = 71 km s−1 Mpc−1, Ωm = 0.27, andΩΛ = 1−Ωm = 0.73 (Spergel et al. 2007). All quoted uncer-tainties are 1σ (68%) confidence intervals unless otherwisenoted, and UT times are used throughout.
2 OBSERVATIONS
2.1 Palomar 48-inch discovery and photometry
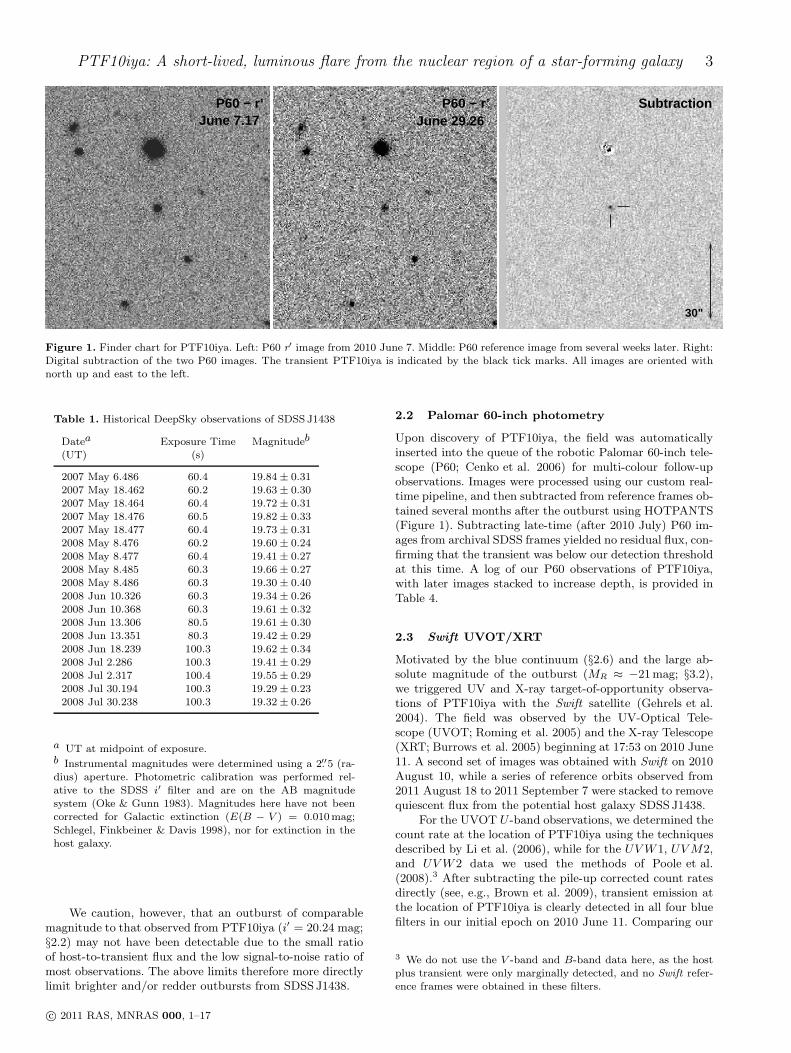
As part of the PTF 5-day cadence survey, we obtained a pairof R-band images of PTF field 4328 on 2010 June 6 withthe Palomar 48-inch telescope (P48) equipped with the re-furbished CFHT12k camera (Rahmer et al. 2008). Subtrac-tion of a stacked reference image of the field with HOT-PANTS1 revealed a new transient source at coordinatesα = 14h38m41.00s, δ = 3739′33.′′6 (J2000.0), with an as-trometric uncertainty of ±150mas in each coordinate (ref-erenced with respect to the Sloan Digital Sky Survey DataRelease 7 catalog; Abazajian et al. 2009).
The transient was discovered three hours later by Oari-cal, an autonomous software framework of the PTF collabo-ration (Bloom et al. 2011b), and given the name PTF10iya.The software further noted the presence of a coincident cat-alogued extended source, SDSSJ143840.98+373933.4 (here-after SDSSJ1438; Figure 1), identifying this object as a po-tential host galaxy for PTF10iya.
No transient emission was detected at this location withP48, either prior to (extending back to 2009 May) or after(through 2011 July) the outburst, to a typical 3σ limitingmagnitude of R ≈ 21. A listing of P48 observations takenaround the time of outburst, calibrated using Sloan Digi-tal Sky Survey (SDSS) magnitudes of nearby point sourcesand the filter transformations of Jordi, Grebel & Ammon(2006), is provided in Table 4.
This field was also observed as part of the Palomar-QUEST survey (Djorgovski et al. 2008) on 8 separate nightsranging from 2007 May 6 to 2008 July 30. The observa-tions have been compiled into a single searchable databaseat Lawrence Berkeley National Laboratory as part of theDeep Sky project2. The galaxy SDSSJ1438 is only weaklydetected in most images. We therefore forgo image subtrac-tion and perform photometry with a 2.′′5 (radius) apertureon all individual frames, using the SDSS i′ filter to calibratethe observed red bandpass (an order-blocking filter with acutoff blueward of λ ≈ 6100 A). The resulting photometryis given in Table 1.
Taking the weighted mean of all the pre-outburst DeepSky measurements of the potential host galaxy, we calculate〈i′〉 = 19.53 ± 0.17mag, in good agreement with the valuefrom SDSS given the somewhat different passbands (i′SDSS =19.65±0.04 mag). If we assume a constant flux equal to thisvalue, we find χ2 = 6.32 (17 degrees of freedom, d.o.f.). Theobservations are therefore consistent with a static flux level(null probability 0.991).
1 See http://www.astro.washington.edu/users/becker/hotpants.html.2 See http://supernova.lbl.gov/∼nugent/deepsky.html.
c© 2011 RAS, MNRAS 000, 1–17
PTF10iya: A short-lived, luminous flare from the nuclear region of a star-forming galaxy 3
P60 − r’June 29.26
P60 − r’June 7.17
30"
Subtraction
Figure 1. Finder chart for PTF10iya. Left: P60 r′ image from 2010 June 7. Middle: P60 reference image from several weeks later. Right:Digital subtraction of the two P60 images. The transient PTF10iya is indicated by the black tick marks. All images are oriented withnorth up and east to the left.
Table 1. Historical DeepSky observations of SDSS J1438
Datea Exposure Time Magnitudeb
(UT) (s)
2007 May 6.486 60.4 19.84± 0.312007 May 18.462 60.2 19.63± 0.302007 May 18.464 60.4 19.72± 0.312007 May 18.476 60.5 19.82± 0.332007 May 18.477 60.4 19.73± 0.312008 May 8.476 60.2 19.60± 0.242008 May 8.477 60.4 19.41± 0.272008 May 8.485 60.3 19.66± 0.272008 May 8.486 60.3 19.30± 0.402008 Jun 10.326 60.3 19.34± 0.262008 Jun 10.368 60.3 19.61± 0.322008 Jun 13.306 80.5 19.61± 0.302008 Jun 13.351 80.3 19.42± 0.292008 Jun 18.239 100.3 19.62± 0.342008 Jul 2.286 100.3 19.41± 0.292008 Jul 2.317 100.4 19.55± 0.292008 Jul 30.194 100.3 19.29± 0.232008 Jul 30.238 100.3 19.32± 0.26
a UT at midpoint of exposure.b Instrumental magnitudes were determined using a 2.′′5 (ra-dius) aperture. Photometric calibration was performed rel-ative to the SDSS i′ filter and are on the AB magnitudesystem (Oke & Gunn 1983). Magnitudes here have not beencorrected for Galactic extinction (E(B − V ) = 0.010mag;
Schlegel, Finkbeiner & Davis 1998), nor for extinction in thehost galaxy.
We caution, however, that an outburst of comparablemagnitude to that observed from PTF10iya (i′ = 20.24 mag;§2.2) may not have been detectable due to the small ratioof host-to-transient flux and the low signal-to-noise ratio ofmost observations. The above limits therefore more directlylimit brighter and/or redder outbursts from SDSSJ1438.
2.2 Palomar 60-inch photometry
Upon discovery of PTF10iya, the field was automaticallyinserted into the queue of the robotic Palomar 60-inch tele-scope (P60; Cenko et al. 2006) for multi-colour follow-upobservations. Images were processed using our custom real-time pipeline, and then subtracted from reference frames ob-tained several months after the outburst using HOTPANTS(Figure 1). Subtracting late-time (after 2010 July) P60 im-ages from archival SDSS frames yielded no residual flux, con-firming that the transient was below our detection thresholdat this time. A log of our P60 observations of PTF10iya,with later images stacked to increase depth, is provided inTable 4.
2.3 Swift UVOT/XRT
Motivated by the blue continuum (§2.6) and the large ab-solute magnitude of the outburst (MR ≈ −21mag; §3.2),we triggered UV and X-ray target-of-opportunity observa-tions of PTF10iya with the Swift satellite (Gehrels et al.2004). The field was observed by the UV-Optical Tele-scope (UVOT; Roming et al. 2005) and the X-ray Telescope(XRT; Burrows et al. 2005) beginning at 17:53 on 2010 June11. A second set of images was obtained with Swift on 2010August 10, while a series of reference orbits observed from2011 August 18 to 2011 September 7 were stacked to removequiescent flux from the potential host galaxy SDSSJ1438.
For the UVOT U -band observations, we determined thecount rate at the location of PTF10iya using the techniquesdescribed by Li et al. (2006), while for the UVW 1, UVM2,and UVW 2 data we used the methods of Poole et al.(2008).3 After subtracting the pile-up corrected count ratesdirectly (see, e.g., Brown et al. 2009), transient emission atthe location of PTF10iya is clearly detected in all four bluefilters in our initial epoch on 2010 June 11. Comparing our
3 We do not use the V -band and B-band data here, as the hostplus transient were only marginally detected, and no Swift refer-ence frames were obtained in these filters.
c© 2011 RAS, MNRAS 000, 1–17
4 Cenko et al.
1"
+
10"
A
B
NIRC2 LGS (Zoom)NIRC2 LGSLFC Reference
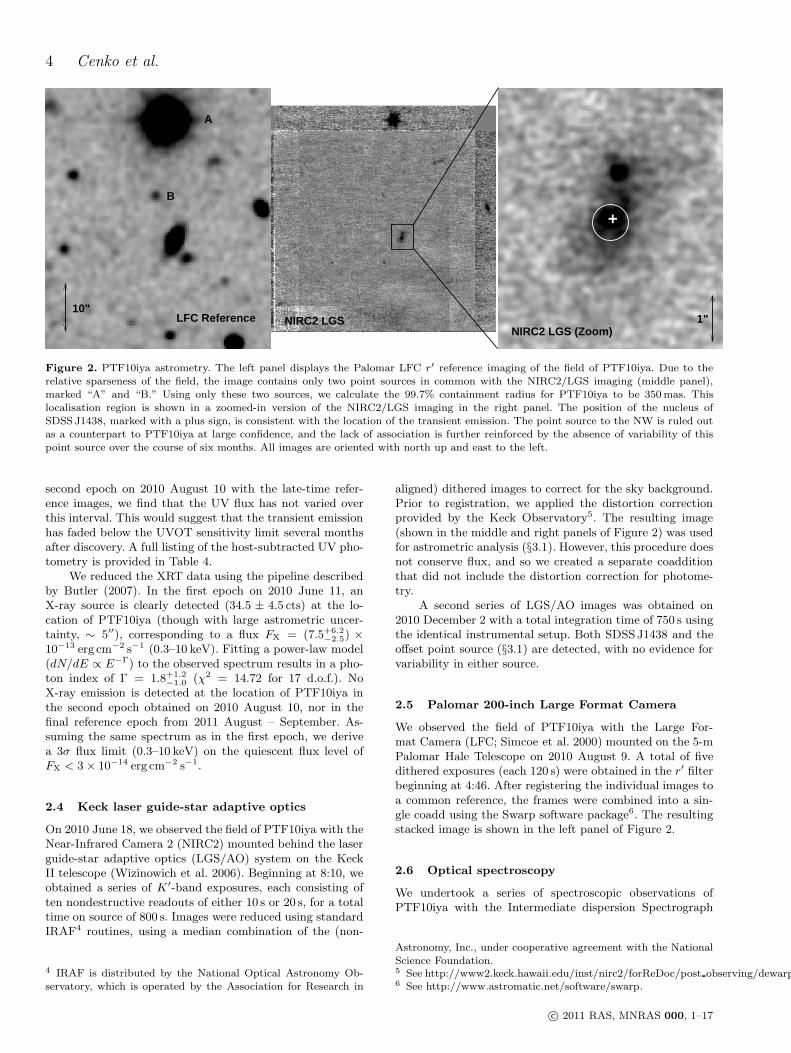
Figure 2. PTF10iya astrometry. The left panel displays the Palomar LFC r′ reference imaging of the field of PTF10iya. Due to therelative sparseness of the field, the image contains only two point sources in common with the NIRC2/LGS imaging (middle panel),marked “A” and “B.” Using only these two sources, we calculate the 99.7% containment radius for PTF10iya to be 350mas. Thislocalisation region is shown in a zoomed-in version of the NIRC2/LGS imaging in the right panel. The position of the nucleus ofSDSS J1438, marked with a plus sign, is consistent with the location of the transient emission. The point source to the NW is ruled outas a counterpart to PTF10iya at large confidence, and the lack of association is further reinforced by the absence of variability of thispoint source over the course of six months. All images are oriented with north up and east to the left.
second epoch on 2010 August 10 with the late-time refer-ence images, we find that the UV flux has not varied overthis interval. This would suggest that the transient emissionhas faded below the UVOT sensitivity limit several monthsafter discovery. A full listing of the host-subtracted UV pho-tometry is provided in Table 4.
We reduced the XRT data using the pipeline describedby Butler (2007). In the first epoch on 2010 June 11, anX-ray source is clearly detected (34.5 ± 4.5 cts) at the lo-cation of PTF10iya (though with large astrometric uncer-tainty, ∼ 5′′), corresponding to a flux FX = (7.5+6.2
−2.5) ×10−13 erg cm−2 s−1 (0.3–10 keV). Fitting a power-law model(dN/dE ∝ E−Γ) to the observed spectrum results in a pho-ton index of Γ = 1.8+1.2
−1.0 (χ2 = 14.72 for 17 d.o.f.). NoX-ray emission is detected at the location of PTF10iya inthe second epoch obtained on 2010 August 10, nor in thefinal reference epoch from 2011 August – September. As-suming the same spectrum as in the first epoch, we derivea 3σ flux limit (0.3–10 keV) on the quiescent flux level ofFX < 3× 10⁻¹⁴ erg cm−2 s−1.
2.4 Keck laser guide-star adaptive optics
On 2010 June 18, we observed the field of PTF10iya with theNear-Infrared Camera 2 (NIRC2) mounted behind the laserguide-star adaptive optics (LGS/AO) system on the KeckII telescope (Wizinowich et al. 2006). Beginning at 8:10, weobtained a series of K′-band exposures, each consisting often nondestructive readouts of either 10 s or 20 s, for a totaltime on source of 800 s. Images were reduced using standardIRAF4 routines, using a median combination of the (non-
4 IRAF is distributed by the National Optical Astronomy Ob-servatory, which is operated by the Association for Research in
aligned) dithered images to correct for the sky background.Prior to registration, we applied the distortion correctionprovided by the Keck Observatory5. The resulting image(shown in the middle and right panels of Figure 2) was usedfor astrometric analysis (§3.1). However, this procedure doesnot conserve flux, and so we created a separate coadditionthat did not include the distortion correction for photome-try.
A second series of LGS/AO images was obtained on2010 December 2 with a total integration time of 750 s usingthe identical instrumental setup. Both SDSSJ1438 and theoffset point source (§3.1) are detected, with no evidence forvariability in either source.
2.5 Palomar 200-inch Large Format Camera
We observed the field of PTF10iya with the Large For-mat Camera (LFC; Simcoe et al. 2000) mounted on the 5-mPalomar Hale Telescope on 2010 August 9. A total of fivedithered exposures (each 120 s) were obtained in the r′ filterbeginning at 4:46. After registering the individual images toa common reference, the frames were combined into a sin-gle coadd using the Swarp software package6. The resultingstacked image is shown in the left panel of Figure 2.
2.6 Optical spectroscopy
We undertook a series of spectroscopic observations ofPTF10iya with the Intermediate dispersion Spectrograph
Astronomy, Inc., under cooperative agreement with the NationalScience Foundation.5 See http://www2.keck.hawaii.edu/inst/nirc2/forReDoc/post observing/dewarp.6 See http://www.astromatic.net/software/swarp.
c© 2011 RAS, MNRAS 000, 1–17
PTF10iya: A short-lived, luminous flare from the nuclear region of a star-forming galaxy 5
Table 2. Optical spectra of PTF10iya
Datea Telescope/Instrument Wavelength Coverage Exposure Time Spectral Resolution(UT) (A) (s) (A)
Jun 8.43 Keck I/LRIS (blue) 3500–5600 450.0 7.0Jun 8.43 Keck I/LRIS (red) 5600–10100 370.0 6.5Jun 9.10 WHT/ISIS (blue) 3100–5300 600.0 3.4Jun 9.10 WHT/ISIS (red) 5300–9500 600.0 7.3Jun 12.49 Keck I/LRIS (blue) 3500–5600 600.0 4.0Jun 12.49 Keck I/LRIS (red) 5600–10100 600.0 6.5Jul 8.29 Keck I/LRIS (blue) 3500–5600 1200.0 4.0Jul 8.29 Keck I/LRIS (red) 5600–10100 1200.0 6.5
a UT at beginning of exposure.
and Imaging System (ISIS) mounted on the 4.2-m WilliamHerschel Telescope (WHT; June 9) and the Low ResolutionImaging Spectrometer (LRIS; Oke et al. 1995) mounted onthe 10-m Keck I telescope (June 8, June 12, July 7). Forall spectra the slit was oriented at the parallactic angle tominimise losses due to atmospheric dispersion (Filippenko1982). Details of the observational setup for each respectivespectrum are provided in Table 2.5.
All spectra were reduced using standard routines (see,e.g., Ellis et al. 2008 for details). Spectra were extracted op-timally (Horne 1986) within the IRAF environment. A dis-persion solution was computed using afternoon calibrationspectra of arc lamps, and then adjusted for each individ-ual exposure using night-sky lines. Telluric atmospheric ab-sorption features were removed using the continuum fromspectrophotometric standard stars (Wade & Horne 1988;Matheson et al. 2000). Finally, a sensitivity function was ap-plied using observations of spectrophotometric standards ata comparable airmass. The red and blue arms were rebinnedto a common dispersion and then joined across the dichroic.
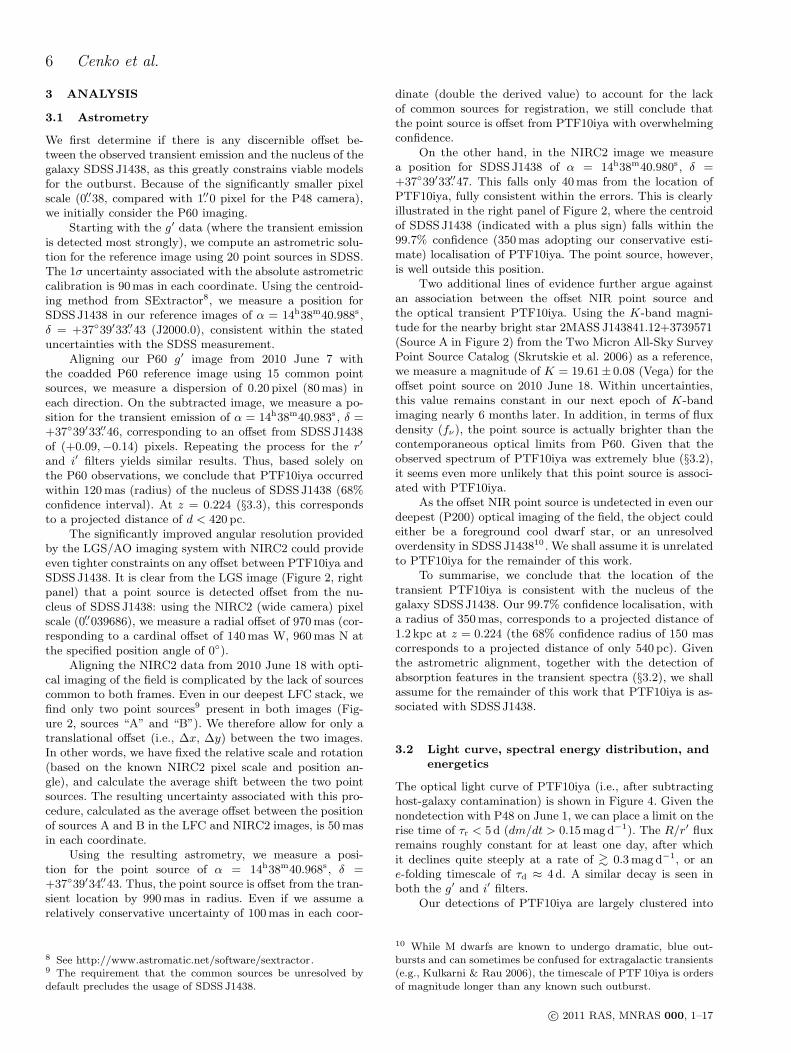
To account for slit losses, we have adjusted the fluxcalibration for all four spectra using broadband photometryfrom our (unsubtracted) P60 images at comparable epochs.Three of the resulting spectra are shown in Figure 3.
2.7 Radio Observations
We observed the location of PTF10iya with the NRAO7 Ex-panded Very Large Array (EVLA) for 1 hour on 2011 April29.3 UT. Observations with a total bandwidth of 256 MHzwere obtained at centre frequencies of 1.3 and 8.4 GHz. Acompact source (J1426+3625) near PTF10iya was observedevery 4–6 min for accurate phase calibration, while 3C 286was observed at the end of the run for the bandpass andflux-density calibration. The data were reduced and imagedusing the Astronomical Image Processing System (AIPS)software package.
There was no emission detected at the positionof PTF10iya to 3σ limits of 0.13mJy and 0.07mJyat 1.3 and 8.4 GHz, respectively. At the distance of
7 The National Radio Astronomy Observatory (NRAO) is a fa-cility of the National Science Foundation operated under cooper-ative agreement by Associated Universities, Inc.
3000 4000 5000 6000 7000 8000 9000 10000
Observed Wavelength (A)
0.0
0.5
1.0
1.5
2.0
2.5
3.0
3.5
Flux D
ensi
ty (
erg
cm
2 s
1 A
1)
1e16
June 9 - WHT (+1.51016 )
June 12 - LRIS (+1.01016 )
July 8 - LRIS
Figure 3. Spectroscopic observations of PTF10iya/SDSS J1438.The spectra from June 9 (WHT) and June 12 (LRIS) have beenoffset for clarity. Our spectrum from June 8 obtained with LRISis not plotted, as it is nearly identical to the WHT spectrum.
the host galaxy (§3.3), this corresponds to spectral lu-minosities of <1.4×1029 erg s−1 Hz−1 (1.3 GHz) and <7.8×1028 erg s−1 Hz−1 (8.4 GHz).
2.8 Additional archival data
As discussed in §2.1, PTF10iya is spatially coincident (see§3.1 for a detailed discussion of astrometry) with the ex-tended source SDSSJ1438. The photometry (model mag-nitudes) provided by SDSS implies a modestly red galaxy(g′ − r′ = 0.72mag).
The location of PTF10iya was observed with the VeryLarge Array (VLA) at 1.4GHz in 1995 December as partof the Faint Images of the Radio Sky at Twenty centime-ters (FIRST; Becker, White & Helfand 1995). No source isdetected at this location to a 3σ limiting flux density of0.39mJy. There is no source consistent with the locationof PTF10iya in either the Fermi Large Area Telescope(LAT; 100MeV – 100GeV) 1-year Point Source Catalog(Abdo et al. 2010) nor the ROSAT (0.1 – 2.4 keV) All-SkySurvey Bright Source Catalog (Voges et al. 1999).
c© 2011 RAS, MNRAS 000, 1–17
6 Cenko et al.
3 ANALYSIS
3.1 Astrometry
We first determine if there is any discernible offset be-tween the observed transient emission and the nucleus of thegalaxy SDSSJ1438, as this greatly constrains viable modelsfor the outburst. Because of the significantly smaller pixelscale (0.′′38, compared with 1.′′0 pixel for the P48 camera),we initially consider the P60 imaging.
Starting with the g′ data (where the transient emissionis detected most strongly), we compute an astrometric solu-tion for the reference image using 20 point sources in SDSS.The 1σ uncertainty associated with the absolute astrometriccalibration is 90mas in each coordinate. Using the centroid-ing method from SExtractor8, we measure a position forSDSSJ1438 in our reference images of α = 14h38m40.988s ,δ = +3739′33.′′43 (J2000.0), consistent within the stateduncertainties with the SDSS measurement.
Aligning our P60 g′ image from 2010 June 7 withthe coadded P60 reference image using 15 common pointsources, we measure a dispersion of 0.20 pixel (80mas) ineach direction. On the subtracted image, we measure a po-sition for the transient emission of α = 14h38m40.983s , δ =+3739′33.′′46, corresponding to an offset from SDSSJ1438of (+0.09,−0.14) pixels. Repeating the process for the r′
and i′ filters yields similar results. Thus, based solely onthe P60 observations, we conclude that PTF10iya occurredwithin 120mas (radius) of the nucleus of SDSSJ1438 (68%confidence interval). At z = 0.224 (§3.3), this correspondsto a projected distance of d < 420 pc.
The significantly improved angular resolution providedby the LGS/AO imaging system with NIRC2 could provideeven tighter constraints on any offset between PTF10iya andSDSSJ1438. It is clear from the LGS image (Figure 2, rightpanel) that a point source is detected offset from the nu-cleus of SDSSJ1438: using the NIRC2 (wide camera) pixelscale (0.′′039686), we measure a radial offset of 970mas (cor-responding to a cardinal offset of 140mas W, 960mas N atthe specified position angle of 0).
Aligning the NIRC2 data from 2010 June 18 with opti-cal imaging of the field is complicated by the lack of sourcescommon to both frames. Even in our deepest LFC stack, wefind only two point sources9 present in both images (Fig-ure 2, sources “A” and “B”). We therefore allow for only atranslational offset (i.e., ∆x, ∆y) between the two images.In other words, we have fixed the relative scale and rotation(based on the known NIRC2 pixel scale and position an-gle), and calculate the average shift between the two pointsources. The resulting uncertainty associated with this pro-cedure, calculated as the average offset between the positionof sources A and B in the LFC and NIRC2 images, is 50masin each coordinate.
Using the resulting astrometry, we measure a posi-tion for the point source of α = 14h38m40.968s , δ =+3739′34.′′43. Thus, the point source is offset from the tran-sient location by 990mas in radius. Even if we assume arelatively conservative uncertainty of 100mas in each coor-
8 See http://www.astromatic.net/software/sextractor.9 The requirement that the common sources be unresolved bydefault precludes the usage of SDSS J1438.
dinate (double the derived value) to account for the lackof common sources for registration, we still conclude thatthe point source is offset from PTF10iya with overwhelmingconfidence.
On the other hand, in the NIRC2 image we measurea position for SDSSJ1438 of α = 14h38m40.980s , δ =+3739′33.′′47. This falls only 40mas from the location ofPTF10iya, fully consistent within the errors. This is clearlyillustrated in the right panel of Figure 2, where the centroidof SDSSJ1438 (indicated with a plus sign) falls within the99.7% confidence (350mas adopting our conservative esti-mate) localisation of PTF10iya. The point source, however,is well outside this position.
Two additional lines of evidence further argue againstan association between the offset NIR point source andthe optical transient PTF10iya. Using the K-band magni-tude for the nearby bright star 2MASS J143841.12+3739571(Source A in Figure 2) from the Two Micron All-Sky SurveyPoint Source Catalog (Skrutskie et al. 2006) as a reference,we measure a magnitude of K = 19.61± 0.08 (Vega) for theoffset point source on 2010 June 18. Within uncertainties,this value remains constant in our next epoch of K-bandimaging nearly 6 months later. In addition, in terms of fluxdensity (fν), the point source is actually brighter than thecontemporaneous optical limits from P60. Given that theobserved spectrum of PTF10iya was extremely blue (§3.2),it seems even more unlikely that this point source is associ-ated with PTF10iya.
As the offset NIR point source is undetected in even ourdeepest (P200) optical imaging of the field, the object couldeither be a foreground cool dwarf star, or an unresolvedoverdensity in SDSSJ143810 . We shall assume it is unrelatedto PTF10iya for the remainder of this work.
To summarise, we conclude that the location of thetransient PTF10iya is consistent with the nucleus of thegalaxy SDSSJ1438. Our 99.7% confidence localisation, witha radius of 350mas, corresponds to a projected distance of1.2 kpc at z = 0.224 (the 68% confidence radius of 150 mascorresponds to a projected distance of only 540 pc). Giventhe astrometric alignment, together with the detection ofabsorption features in the transient spectra (§3.2), we shallassume for the remainder of this work that PTF10iya is as-sociated with SDSSJ1438.
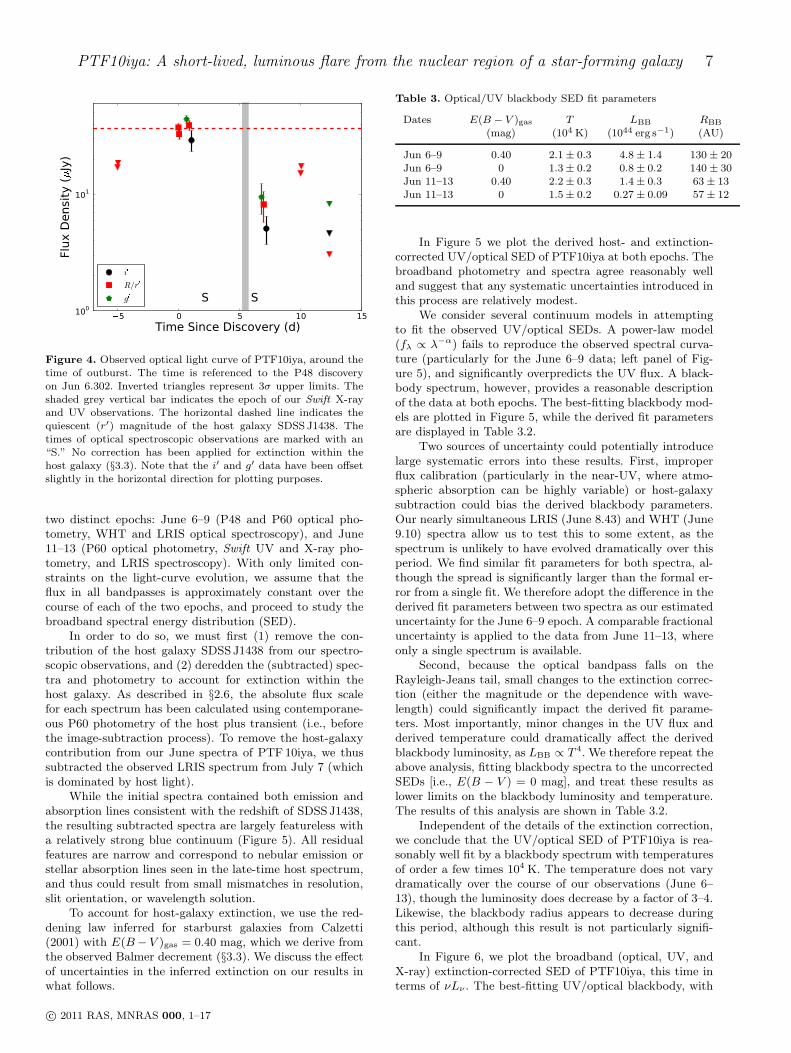
3.2 Light curve, spectral energy distribution, andenergetics
The optical light curve of PTF10iya (i.e., after subtractinghost-galaxy contamination) is shown in Figure 4. Given thenondetection with P48 on June 1, we can place a limit on therise time of τr < 5 d (dm/dt > 0.15mag d−1). The R/r′ fluxremains roughly constant for at least one day, after whichit declines quite steeply at a rate of ∼
> 0.3mag d−1, or ane-folding timescale of τd ≈ 4 d. A similar decay is seen inboth the g′ and i′ filters.
Our detections of PTF10iya are largely clustered into
10 While M dwarfs are known to undergo dramatic, blue out-bursts and can sometimes be confused for extragalactic transients(e.g., Kulkarni & Rau 2006), the timescale of PTF10iya is ordersof magnitude longer than any known such outburst.
c© 2011 RAS, MNRAS 000, 1–17
PTF10iya: A short-lived, luminous flare from the nuclear region of a star-forming galaxy 7
5 0 5 10 15
Time Since Discovery (d)100
101
Flux D
ensi
ty (
Jy)
S S S
i
R/r
g
Figure 4. Observed optical light curve of PTF10iya, around thetime of outburst. The time is referenced to the P48 discoveryon Jun 6.302. Inverted triangles represent 3σ upper limits. Theshaded grey vertical bar indicates the epoch of our Swift X-rayand UV observations. The horizontal dashed line indicates thequiescent (r′) magnitude of the host galaxy SDSS J1438. Thetimes of optical spectroscopic observations are marked with an“S.” No correction has been applied for extinction within thehost galaxy (§3.3). Note that the i′ and g′ data have been offsetslightly in the horizontal direction for plotting purposes.
two distinct epochs: June 6–9 (P48 and P60 optical pho-tometry, WHT and LRIS optical spectroscopy), and June11–13 (P60 optical photometry, Swift UV and X-ray pho-tometry, and LRIS spectroscopy). With only limited con-straints on the light-curve evolution, we assume that theflux in all bandpasses is approximately constant over thecourse of each of the two epochs, and proceed to study thebroadband spectral energy distribution (SED).
In order to do so, we must first (1) remove the con-tribution of the host galaxy SDSSJ1438 from our spectro-scopic observations, and (2) deredden the (subtracted) spec-tra and photometry to account for extinction within thehost galaxy. As described in §2.6, the absolute flux scalefor each spectrum has been calculated using contemporane-ous P60 photometry of the host plus transient (i.e., beforethe image-subtraction process). To remove the host-galaxycontribution from our June spectra of PTF 10iya, we thussubtracted the observed LRIS spectrum from July 7 (whichis dominated by host light).
While the initial spectra contained both emission andabsorption lines consistent with the redshift of SDSSJ1438,the resulting subtracted spectra are largely featureless witha relatively strong blue continuum (Figure 5). All residualfeatures are narrow and correspond to nebular emission orstellar absorption lines seen in the late-time host spectrum,and thus could result from small mismatches in resolution,slit orientation, or wavelength solution.
To account for host-galaxy extinction, we use the red-dening law inferred for starburst galaxies from Calzetti(2001) with E(B− V )gas = 0.40 mag, which we derive fromthe observed Balmer decrement (§3.3). We discuss the effectof uncertainties in the inferred extinction on our results inwhat follows.
Table 3. Optical/UV blackbody SED fit parameters
Dates E(B − V )gas T LBB RBB
(mag) (104 K) (1044 erg s−1) (AU)
Jun 6–9 0.40 2.1± 0.3 4.8± 1.4 130 ± 20Jun 6–9 0 1.3± 0.2 0.8± 0.2 140 ± 30Jun 11–13 0.40 2.2± 0.3 1.4± 0.3 63± 13Jun 11–13 0 1.5± 0.2 0.27 ± 0.09 57± 12
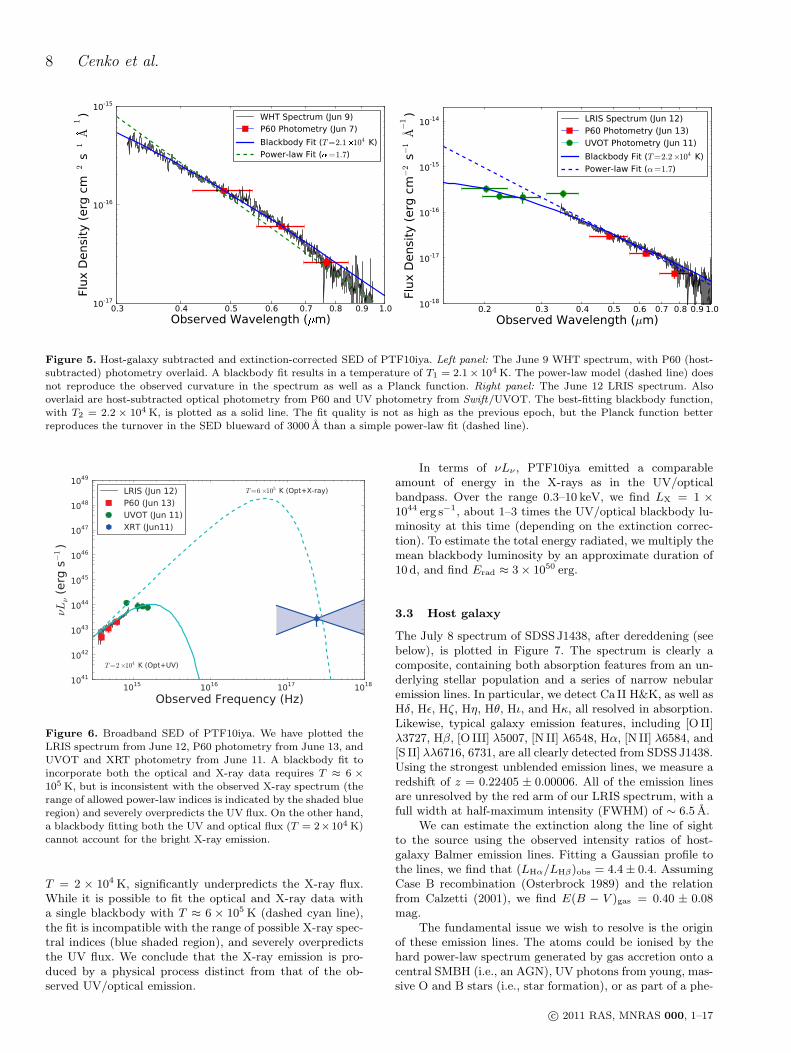
In Figure 5 we plot the derived host- and extinction-corrected UV/optical SED of PTF10iya at both epochs. Thebroadband photometry and spectra agree reasonably welland suggest that any systematic uncertainties introduced inthis process are relatively modest.
We consider several continuum models in attemptingto fit the observed UV/optical SEDs. A power-law model(fλ ∝ λ−α) fails to reproduce the observed spectral curva-ture (particularly for the June 6–9 data; left panel of Fig-ure 5), and significantly overpredicts the UV flux. A black-body spectrum, however, provides a reasonable descriptionof the data at both epochs. The best-fitting blackbody mod-els are plotted in Figure 5, while the derived fit parametersare displayed in Table 3.2.
Two sources of uncertainty could potentially introducelarge systematic errors into these results. First, improperflux calibration (particularly in the near-UV, where atmo-spheric absorption can be highly variable) or host-galaxysubtraction could bias the derived blackbody parameters.Our nearly simultaneous LRIS (June 8.43) and WHT (June9.10) spectra allow us to test this to some extent, as thespectrum is unlikely to have evolved dramatically over thisperiod. We find similar fit parameters for both spectra, al-though the spread is significantly larger than the formal er-ror from a single fit. We therefore adopt the difference in thederived fit parameters between two spectra as our estimateduncertainty for the June 6–9 epoch. A comparable fractionaluncertainty is applied to the data from June 11–13, whereonly a single spectrum is available.
Second, because the optical bandpass falls on theRayleigh-Jeans tail, small changes to the extinction correc-tion (either the magnitude or the dependence with wave-length) could significantly impact the derived fit parame-ters. Most importantly, minor changes in the UV flux andderived temperature could dramatically affect the derivedblackbody luminosity, as LBB ∝ T 4. We therefore repeat theabove analysis, fitting blackbody spectra to the uncorrectedSEDs [i.e., E(B − V ) = 0 mag], and treat these results aslower limits on the blackbody luminosity and temperature.The results of this analysis are shown in Table 3.2.
Independent of the details of the extinction correction,we conclude that the UV/optical SED of PTF10iya is rea-sonably well fit by a blackbody spectrum with temperaturesof order a few times 104 K. The temperature does not varydramatically over the course of our observations (June 6–13), though the luminosity does decrease by a factor of 3–4.Likewise, the blackbody radius appears to decrease duringthis period, although this result is not particularly signifi-cant.
In Figure 6, we plot the broadband (optical, UV, andX-ray) extinction-corrected SED of PTF10iya, this time interms of νLν . The best-fitting UV/optical blackbody, with
c© 2011 RAS, MNRAS 000, 1–17
8 Cenko et al.
0.3 0.4 0.5 0.6 0.7 0.8 0.9 1.0
Observed Wavelength (m)10-17
10-16
10-15
Flux D
ensi
ty (
erg
cm
2 s
1 A
1) WHT Spectrum (Jun 9)
P60 Photometry (Jun 7)
Blackbody Fit (T=2.1104 K)
Power-law Fit ( =1.7)
0.2 0.3 0.4 0.5 0.6 0.7 0.8 0.9 1.0
Observed Wavelength (µm)10-18
10-17
10-16
10-15
10-14
Flux Density (erg cm
−2 s−1 A
−1) LRIS Spectrum (Jun 12)
P60 Photometry (Jun 13)UVOT Photometry (Jun 11)
Blackbody Fit (T=2.2×10⁴ K)Power-law Fit (α=1.7)
Figure 5. Host-galaxy subtracted and extinction-corrected SED of PTF10iya. Left panel: The June 9 WHT spectrum, with P60 (host-subtracted) photometry overlaid. A blackbody fit results in a temperature of T1 = 2.1× 10⁴ K. The power-law model (dashed line) doesnot reproduce the observed curvature in the spectrum as well as a Planck function. Right panel: The June 12 LRIS spectrum. Alsooverlaid are host-subtracted optical photometry from P60 and UV photometry from Swift/UVOT. The best-fitting blackbody function,with T2 = 2.2 × 10⁴ K, is plotted as a solid line. The fit quality is not as high as the previous epoch, but the Planck function betterreproduces the turnover in the SED blueward of 3000 A than a simple power-law fit (dashed line).
Figure 6. Broadband SED of PTF10iya. We have plotted theLRIS spectrum from June 12, P60 photometry from June 13, andUVOT and XRT photometry from June 11. A blackbody fit toincorporate both the optical and X-ray data requires T ≈ 6 ×
105 K, but is inconsistent with the observed X-ray spectrum (therange of allowed power-law indices is indicated by the shaded blueregion) and severely overpredicts the UV flux. On the other hand,a blackbody fitting both the UV and optical flux (T = 2×10⁴ K)cannot account for the bright X-ray emission.
T = 2 × 10⁴ K, significantly underpredicts the X-ray flux.While it is possible to fit the optical and X-ray data witha single blackbody with T ≈ 6 × 10⁵ K (dashed cyan line),the fit is incompatible with the range of possible X-ray spec-tral indices (blue shaded region), and severely overpredictsthe UV flux. We conclude that the X-ray emission is pro-duced by a physical process distinct from that of the ob-served UV/optical emission.
In terms of νLν , PTF10iya emitted a comparableamount of energy in the X-rays as in the UV/opticalbandpass. Over the range 0.3–10 keV, we find LX = 1 ×1044 erg s−1, about 1–3 times the UV/optical blackbody lu-minosity at this time (depending on the extinction correc-tion). To estimate the total energy radiated, we multiply themean blackbody luminosity by an approximate duration of10 d, and find Erad ≈ 3× 1050 erg.
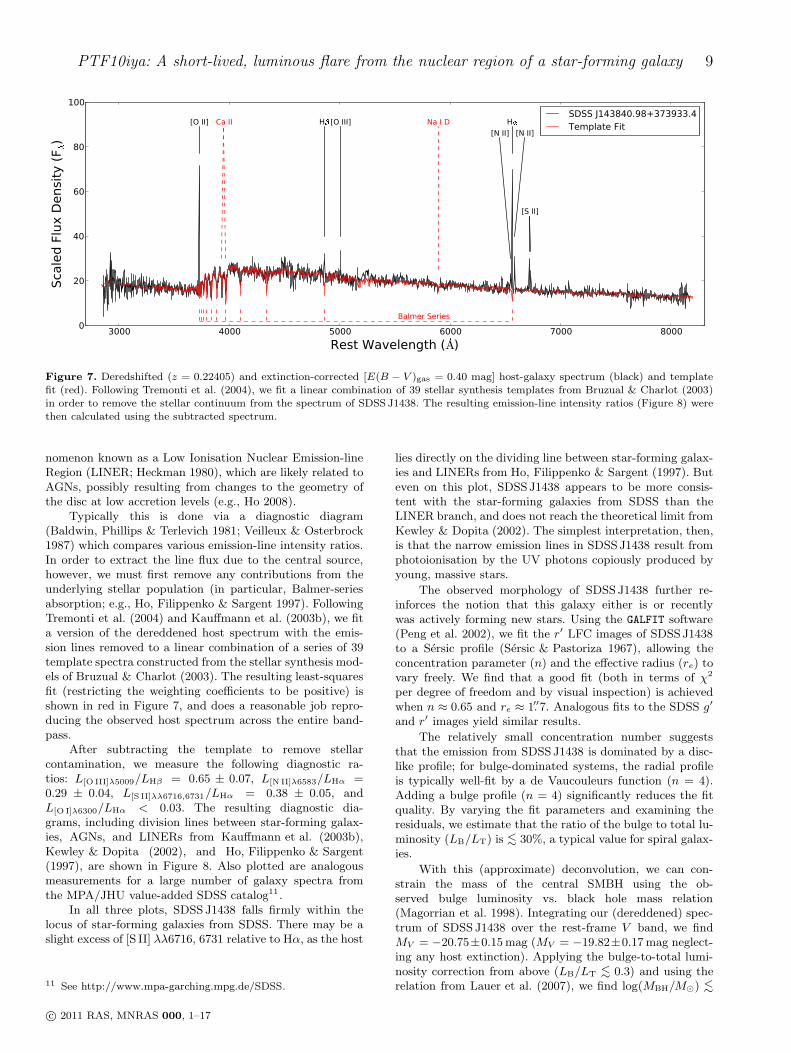
3.3 Host galaxy
The July 8 spectrum of SDSSJ1438, after dereddening (seebelow), is plotted in Figure 7. The spectrum is clearly acomposite, containing both absorption features from an un-derlying stellar population and a series of narrow nebularemission lines. In particular, we detect Ca II H&K, as well asHδ, Hǫ, Hζ, Hη, Hθ, Hι, and Hκ, all resolved in absorption.Likewise, typical galaxy emission features, including [O II]λ3727, Hβ, [O III] λ5007, [N II] λ6548, Hα, [N II] λ6584, and[S II] λλ6716, 6731, are all clearly detected from SDSSJ1438.Using the strongest unblended emission lines, we measure aredshift of z = 0.22405 ± 0.00006. All of the emission linesare unresolved by the red arm of our LRIS spectrum, with afull width at half-maximum intensity (FWHM) of ∼ 6.5 A.
We can estimate the extinction along the line of sightto the source using the observed intensity ratios of host-galaxy Balmer emission lines. Fitting a Gaussian profile tothe lines, we find that (LHα/LHβ)obs = 4.4± 0.4. AssumingCase B recombination (Osterbrock 1989) and the relationfrom Calzetti (2001), we find E(B − V )gas = 0.40 ± 0.08mag.
The fundamental issue we wish to resolve is the originof these emission lines. The atoms could be ionised by thehard power-law spectrum generated by gas accretion onto acentral SMBH (i.e., an AGN), UV photons from young, mas-sive O and B stars (i.e., star formation), or as part of a phe-
c© 2011 RAS, MNRAS 000, 1–17
PTF10iya: A short-lived, luminous flare from the nuclear region of a star-forming galaxy 9
3000 4000 5000 6000 7000 8000
Rest Wavelength (A)
0
20
40
60
80
100
Sca
led F
lux D
ensi
ty (
F
)
[O II] H [O III]
[N II]
H
[N II]
[S II]
Ca II Na I D
Balmer Series
SDSS J143840.98+373933.4Template Fit
Figure 7. Deredshifted (z = 0.22405) and extinction-corrected [E(B − V )gas = 0.40 mag] host-galaxy spectrum (black) and templatefit (red). Following Tremonti et al. (2004), we fit a linear combination of 39 stellar synthesis templates from Bruzual & Charlot (2003)in order to remove the stellar continuum from the spectrum of SDSS J1438. The resulting emission-line intensity ratios (Figure 8) werethen calculated using the subtracted spectrum.
nomenon known as a Low Ionisation Nuclear Emission-lineRegion (LINER; Heckman 1980), which are likely related toAGNs, possibly resulting from changes to the geometry ofthe disc at low accretion levels (e.g., Ho 2008).
Typically this is done via a diagnostic diagram(Baldwin, Phillips & Terlevich 1981; Veilleux & Osterbrock1987) which compares various emission-line intensity ratios.In order to extract the line flux due to the central source,however, we must first remove any contributions from theunderlying stellar population (in particular, Balmer-seriesabsorption; e.g., Ho, Filippenko & Sargent 1997). FollowingTremonti et al. (2004) and Kauffmann et al. (2003b), we fita version of the dereddened host spectrum with the emis-sion lines removed to a linear combination of a series of 39template spectra constructed from the stellar synthesis mod-els of Bruzual & Charlot (2003). The resulting least-squaresfit (restricting the weighting coefficients to be positive) isshown in red in Figure 7, and does a reasonable job repro-ducing the observed host spectrum across the entire band-pass.
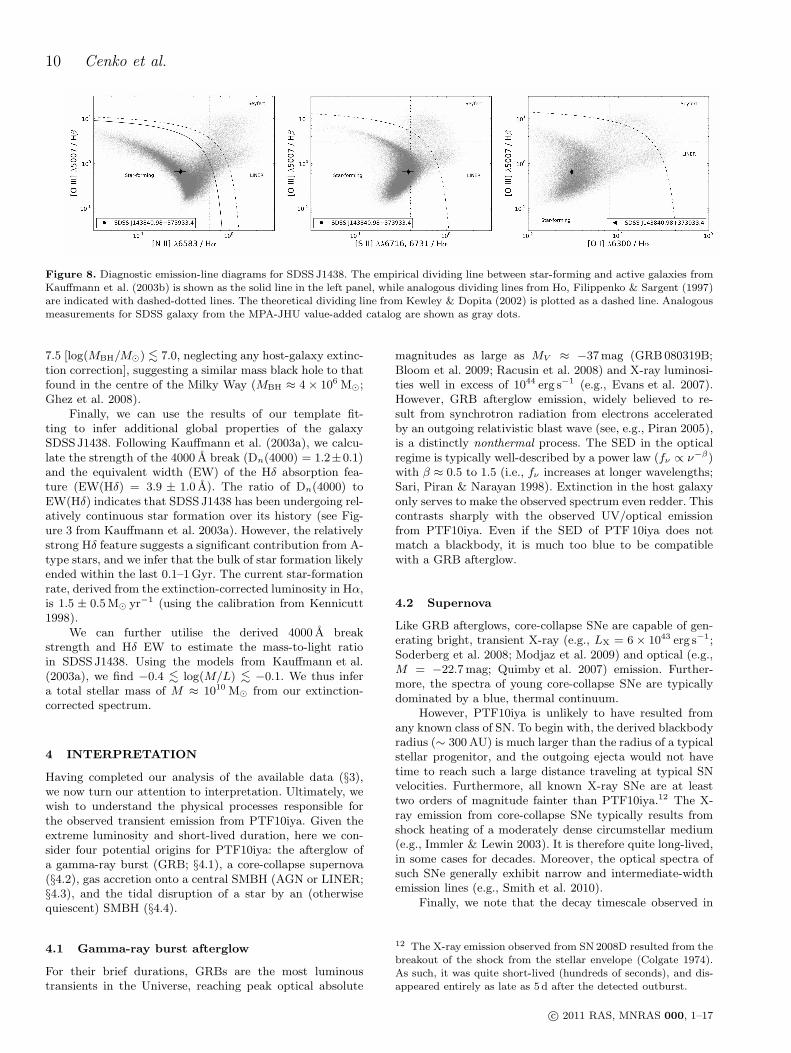
After subtracting the template to remove stellarcontamination, we measure the following diagnostic ra-tios: L[O III]λ5009/LHβ = 0.65 ± 0.07, L[N II]λ6583/LHα =0.29 ± 0.04, L[S II]λλ6716,6731/LHα = 0.38 ± 0.05, andL[O I]λ6300/LHα < 0.03. The resulting diagnostic dia-grams, including division lines between star-forming galax-ies, AGNs, and LINERs from Kauffmann et al. (2003b),Kewley & Dopita (2002), and Ho, Filippenko & Sargent(1997), are shown in Figure 8. Also plotted are analogousmeasurements for a large number of galaxy spectra fromthe MPA/JHU value-added SDSS catalog11 .
In all three plots, SDSSJ1438 falls firmly within thelocus of star-forming galaxies from SDSS. There may be aslight excess of [S II] λλ6716, 6731 relative to Hα, as the host
11 See http://www.mpa-garching.mpg.de/SDSS.
lies directly on the dividing line between star-forming galax-ies and LINERs from Ho, Filippenko & Sargent (1997). Buteven on this plot, SDSSJ1438 appears to be more consis-tent with the star-forming galaxies from SDSS than theLINER branch, and does not reach the theoretical limit fromKewley & Dopita (2002). The simplest interpretation, then,is that the narrow emission lines in SDSSJ1438 result fromphotoionisation by the UV photons copiously produced byyoung, massive stars.
The observed morphology of SDSSJ1438 further re-inforces the notion that this galaxy either is or recentlywas actively forming new stars. Using the GALFIT software(Peng et al. 2002), we fit the r′ LFC images of SDSSJ1438to a Sersic profile (Sersic & Pastoriza 1967), allowing theconcentration parameter (n) and the effective radius (re) tovary freely. We find that a good fit (both in terms of χ2
per degree of freedom and by visual inspection) is achievedwhen n ≈ 0.65 and re ≈ 1.′′7. Analogous fits to the SDSS g′
and r′ images yield similar results.
The relatively small concentration number suggeststhat the emission from SDSSJ1438 is dominated by a disc-like profile; for bulge-dominated systems, the radial profileis typically well-fit by a de Vaucouleurs function (n = 4).Adding a bulge profile (n = 4) significantly reduces the fitquality. By varying the fit parameters and examining theresiduals, we estimate that the ratio of the bulge to total lu-minosity (LB/LT) is ∼
< 30%, a typical value for spiral galax-ies.
With this (approximate) deconvolution, we can con-strain the mass of the central SMBH using the ob-served bulge luminosity vs. black hole mass relation(Magorrian et al. 1998). Integrating our (dereddened) spec-trum of SDSSJ1438 over the rest-frame V band, we findMV = −20.75±0.15mag (MV = −19.82±0.17mag neglect-ing any host extinction). Applying the bulge-to-total lumi-nosity correction from above (LB/LT ∼
< 0.3) and using therelation from Lauer et al. (2007), we find log(MBH/M⊙) ∼
<
c© 2011 RAS, MNRAS 000, 1–17
10 Cenko et al.
Figure 8. Diagnostic emission-line diagrams for SDSS J1438. The empirical dividing line between star-forming and active galaxies fromKauffmann et al. (2003b) is shown as the solid line in the left panel, while analogous dividing lines from Ho, Filippenko & Sargent (1997)are indicated with dashed-dotted lines. The theoretical dividing line from Kewley & Dopita (2002) is plotted as a dashed line. Analogousmeasurements for SDSS galaxy from the MPA-JHU value-added catalog are shown as gray dots.
7.5 [log(MBH/M⊙) ∼< 7.0, neglecting any host-galaxy extinc-
tion correction], suggesting a similar mass black hole to thatfound in the centre of the Milky Way (MBH ≈ 4× 10⁶ M⊙;Ghez et al. 2008).
Finally, we can use the results of our template fit-ting to infer additional global properties of the galaxySDSSJ1438. Following Kauffmann et al. (2003a), we calcu-late the strength of the 4000 A break (Dn(4000) = 1.2±0.1)and the equivalent width (EW) of the Hδ absorption fea-ture (EW(Hδ) = 3.9 ± 1.0 A). The ratio of Dn(4000) toEW(Hδ) indicates that SDSSJ1438 has been undergoing rel-atively continuous star formation over its history (see Fig-ure 3 from Kauffmann et al. 2003a). However, the relativelystrong Hδ feature suggests a significant contribution from A-type stars, and we infer that the bulk of star formation likelyended within the last 0.1–1Gyr. The current star-formationrate, derived from the extinction-corrected luminosity in Hα,is 1.5 ± 0.5M⊙ yr−1 (using the calibration from Kennicutt1998).
We can further utilise the derived 4000 A breakstrength and Hδ EW to estimate the mass-to-light ratioin SDSSJ1438. Using the models from Kauffmann et al.(2003a), we find −0.4 ∼
< log(M/L) ∼< −0.1. We thus infer
a total stellar mass of M ≈ 1010 M⊙ from our extinction-corrected spectrum.
4 INTERPRETATION
Having completed our analysis of the available data (§3),we now turn our attention to interpretation. Ultimately, wewish to understand the physical processes responsible forthe observed transient emission from PTF10iya. Given theextreme luminosity and short-lived duration, here we con-sider four potential origins for PTF10iya: the afterglow ofa gamma-ray burst (GRB; §4.1), a core-collapse supernova(§4.2), gas accretion onto a central SMBH (AGN or LINER;§4.3), and the tidal disruption of a star by an (otherwisequiescent) SMBH (§4.4).
4.1 Gamma-ray burst afterglow
For their brief durations, GRBs are the most luminoustransients in the Universe, reaching peak optical absolute
magnitudes as large as MV ≈ −37mag (GRB080319B;Bloom et al. 2009; Racusin et al. 2008) and X-ray luminosi-ties well in excess of 1044 erg s−1 (e.g., Evans et al. 2007).However, GRB afterglow emission, widely believed to re-sult from synchrotron radiation from electrons acceleratedby an outgoing relativistic blast wave (see, e.g., Piran 2005),is a distinctly nonthermal process. The SED in the opticalregime is typically well-described by a power law (fν ∝ ν−β)with β ≈ 0.5 to 1.5 (i.e., fν increases at longer wavelengths;Sari, Piran & Narayan 1998). Extinction in the host galaxyonly serves to make the observed spectrum even redder. Thiscontrasts sharply with the observed UV/optical emissionfrom PTF10iya. Even if the SED of PTF10iya does notmatch a blackbody, it is much too blue to be compatiblewith a GRB afterglow.
4.2 Supernova
Like GRB afterglows, core-collapse SNe are capable of gen-erating bright, transient X-ray (e.g., LX = 6× 1043 erg s−1;Soderberg et al. 2008; Modjaz et al. 2009) and optical (e.g.,M = −22.7mag; Quimby et al. 2007) emission. Further-more, the spectra of young core-collapse SNe are typicallydominated by a blue, thermal continuum.
However, PTF10iya is unlikely to have resulted fromany known class of SN. To begin with, the derived blackbodyradius (∼ 300AU) is much larger than the radius of a typicalstellar progenitor, and the outgoing ejecta would not havetime to reach such a large distance traveling at typical SNvelocities. Furthermore, all known X-ray SNe are at leasttwo orders of magnitude fainter than PTF10iya.12 The X-ray emission from core-collapse SNe typically results fromshock heating of a moderately dense circumstellar medium(e.g., Immler & Lewin 2003). It is therefore quite long-lived,in some cases for decades. Moreover, the optical spectra ofsuch SNe generally exhibit narrow and intermediate-widthemission lines (e.g., Smith et al. 2010).
Finally, we note that the decay timescale observed in
12 The X-ray emission observed from SN2008D resulted from thebreakout of the shock from the stellar envelope (Colgate 1974).As such, it was quite short-lived (hundreds of seconds), and dis-appeared entirely as late as 5 d after the detected outburst.
c© 2011 RAS, MNRAS 000, 1–17
PTF10iya: A short-lived, luminous flare from the nuclear region of a star-forming galaxy 11
the optical (∼ 0.3mag d−1) is shorter than that of any previ-ously observed SNe thought to be powered by radioactive de-cay.13 The current record holders, SN2010X (Kasliwal et al.2010) and SN2002bj (Poznanski et al. 2010), both decayedafter the peak at a rate of ∼ 0.2mag d−1. It would requirean extremely small ejecta mass and/or an outflow entirelytransparent to the γ-rays produced by the radioactive decayto produce a SN that decayed at such a rapid rate, both ofwhich are inconsistent with the large observed luminosity.
4.3 AGN/LINER
The nuclear location of PTF10iya, together with the ob-served spectrum (reminiscent of the “big blue bump”;Sanders et al. 1989; Bregman 1990), naturally lead us toconsider accretion onto a SMBH as a possible origin (Shields1978; Malkan & Sargent 1982). Here we determine if gas ac-cretion (either in the form of a normal AGN or a LINER) isconsistent with the observed properties of PTF10iya.
To begin with, we must confront the fact that the neb-ular emission lines in the spectrum of SDSSJ1438 do notappear to be caused by AGN photoionisation, even with alow ionisation parameter as in a LINER. In and of itself,however, this is not sufficient to entirely discount continu-ous accretion activity. Because of the nonzero size of ourslit, our spectrum of the “nucleus” of SDSSJ1438 could becontaminated by nearby H II regions. For example, HubbleSpace Telescope (HST) spectroscopy of NGC5905, initiallyclassified as a starburst galaxy in a similar analysis to thatconducted in §3.3, revealed a faint Seyfert nucleus that hadpreviously gone undetected (Gezari et al. 2003).
If we set aside for the moment the nebular emission-line classification, we still must simultaneously account forthe short timescale and the order of magnitude increase inthe UV/optical and X-ray flux. The most dramatically vari-able class of AGNs are the blazars, which are thought toarise when a relativistic jet fed by accretion is oriented di-rectly along our line of sight (e.g., Blandford & Rees 1978;Urry & Padovani 1995). For example, 3C 279 has variedacross the entire electromagnetic spectrum by factors of or-der a few on timescales shorter than days (e.g., Wehrle et al.1998).
Blazars are typically hosted in massive (∼> 1010 M⊙)
elliptical galaxies, though individual counterexamples areknown (see, e.g., Gal-Yam et al. 2002, for a blazar initiallythought to be an orphan GRB afterglow). More importantly,blazars are almost exclusively bright radio sources, even inquiescence. Using our post-outburst radio limits from theEVLA (§2.7), we calculate an upper limit on the quiescentradio luminosity (νLν) of < 3×1038 erg s−1 at ν = 1.3GHz.Even when comparing with samples of blazars selectedbased on X-ray variability, the ratio of quiescent opticalto X-ray flux (αOX ≡ − log(fν,O/fν,X)/ log(νO/νX) > 1.6),
13 The fast decay rate could result to some extent from spectralevolution (i.e., varying TBB), and therefore may not representthe true evolution of the bolometric luminosity. For example, thelight curve of PTF09uj, which is believed to be powered by shockbreakout from a dense circumstellar wind, declined even morequickly in the R band (∼ 3mag in 25 days; Ofek et al. 2010).We have already, however, dismissed a shock-breakout origin forPTF10iya.
like the ratio of quiescent radio to optical flux (αRO ≡− log(fν,R/fν,O)/ log(νR/νO) < 0.1), appears inconsistentwith the properties of the known blazar population (αOX =0.6–1.4; αRO = 0.2–0.5; Beckmann et al. 2003).
Even during outburst, the characteristic double-peakedblazar SED (e.g., Urry & Padovani 1995; Fossati et al. 1997)does not provide a good match to the observed emission fromPTF10iya. Well below the first peak (νLν) in the broadbandspectrum, blazar SEDs are dominated by nonthermal syn-chrotron radiation, rising as a power law like ν1. The SEDonly becomes shallower near the peak frequency. The ob-served spectrum of PTF10iya, on the other hand, is quitesteep, with νLν ∝ ν2.7. Furthermore, the SED of lower lu-minosity blazars typically peaks at higher frequencies thanthat of higher luminosity sources (e.g., Fossati et al. 1998).Objects with peak frequencies as low as the UV typicallyhave peak νLν ∼
> 1045 erg s−1, several orders of magnitudebrighter than PTF 10iya. In contrast, the faintest blazarscompiled in the sample of Fossati et al. (1998), with peakνLν ≈ 6 × 1044 erg s−1 (a factor of several brighter thanPTF10iya), peak in the soft X-ray band.
Turning now to Seyfert galaxies, we consider two sep-arate classes of known sources, and compare their vari-ability properties to those of PTF10iya. ROSAT detectedbright (LX ∼
> 1042 erg s−1) X-ray outbursts from a num-ber of narrow-line Seyfert 1 (NLS1) galaxies as part of theAll-Sky Survey (Voges et al. 1999). For instance, the nearby(z = 0.028) galaxy WPVS007 was detected in outburst withLX ≈ 1044 erg s−1 in November 1990; three years later, theX-ray flux had declined by a factor of 400 (Grupe et al.1995). While WPVS007 is the most dramatic example,many other NLS1 galaxies were observed by ROSAT to varyby more than an order of magnitude on timescales as shortas days (e.g., McHardy et al. 2004). In some cases, the X-rayflare was followed by variability in the optical spectra, in-cluding the appearance of high-ionisation iron emission lines(e.g., IC 3599; Grupe et al. 1995; Brandt, Pounds & Fink1995; Komossa & Bade 1999).
However, several properties of either PTF 10iya (theoutburst) or SDSSJ1438 (the quiescent host) are incon-sistent with the NLS1 interpretation. To begin with, theX-ray spectra of NLS1 galaxies are typically significantlysteeper (power-law index Γ ≈ 3–5 compared to ΓPTF10iya =1.8) than the observed X-ray outburst from PTF10iya(Grupe et al. 2004). The X-ray spectral slope is actu-ally quite crucial to the interpretation of the NLS1 phe-nomenon, where the observed variability is thought to arisefrom changes in the covering fraction of a warm absorb-ing cloud (Grupe, Leighly & Komossa 2008). In addition,optical spectra of NLS1 galaxies are characterised by (1)relatively narrow Balmer emission lines (FWHM(Hβ) <2000 kms−1); (2) weak [O III] λ5007 emission ([O III]/Hβ <3), and (3) strong Fe II emission (Osterbrock & Pogge 1985;Goodrich 1989). For SDSSJ1438, the [O III] λ5007 emissionis indeed quite weak. But while the Hα and Hβ emissionlines are clearly narrow, there is in fact no sign of a broadcomponent whatsoever — both Hβ and Hα are unresolvedin our July LRIS spectrum. Together with the lack of Fe IIemission, PTF10iya appears to differ fundamentally fromthe known properties of NLS1 galaxies, or of normal Seyfert1 galaxies for that matter.
While a Seyfert 2 galaxy (those lacking any evidence
c© 2011 RAS, MNRAS 000, 1–17
12 Cenko et al.
for a broad-line region in the optical) may be easier tohide in the spectrum of the quiescent host galaxy, dra-matic continuum variability is not typically observed fromthese sources. One particularly interesting exception meritsmention here: NGC5905 (Bade, Komossa & Dahlem 1996;Komossa & Bade 1999).
Bright X-ray emission (LX = 7 × 1043 erg s−1) was de-tected from NGC5905 in 1990 July by the ROSAT all-skysurvey. Follow-up observations over the subsequent monthsand years failed to redetect the source, implying that the qui-escent flux is at least two orders of magnitude fainter thanthe outburst. Like in the NLS1 galaxies, the X-ray spectrumduring outburst was quite soft (Γ ≈ 4–5). But follow-up opti-cal spectroscopy, both from the ground and with HST, failedto reveal any broad component to the Balmer emission lines(Komossa & Bade 1999; Gezari et al. 2003).
A variety of models have been proposed to explain theproperties of the NGC5905 outburst (e.g., Komossa & Bade1999; Li, Narayan & Menou 2002). In the AGN context,Komossa & Bade (1999) explored the possibility of a vari-able absorbing cloud along the line of sight. In this warmabsorber model, the Seyfert nucleus becomes visible by ion-izing the ambient medium, making it transparent to softX-rays (much like a NLS1). This naturally explains the rel-atively steep X-ray spectrum observed in NGC5905 (Γ ≈ 5),but the presence of a significant dust column is required tohide the broad-line region in the optical.
PTF10iya is more difficult to accomodate in the warmabsorber framework, as the observed X-ray spectrum is notparticularly steep (Γ = 1.8), and the observed thermal SEDin outburst rules out a large amount of dust (at least atthat time). We cannot, however, entirely eliminate geome-tries whereby the observed outburst results from short-livedchanges in obscuration along the line of sight. The lingeringambiguity over the origin of the NGC5905 outburst (see,e.g., Li, Narayan & Menou 2002 for a tidal disruption flareinterpretation) reinforces just how difficult such a task canbe.
Finally, we consider the known variability properties oflow-luminosity AGNs (i.e., LINERs) to see if they couldexplain our observations of PTF10iya. It was originallythought LINERs exhibited little to no X-ray variability onshort timescales (e.g., Komossa, Bohringer & Huchra 1999),though more recent studies of Type I LINERs have demon-strated variations of ∼ 30% on timescales of less than oneday (Pian et al. 2010). Likewise, recent UV studies haveshown variability of order 50% in the UV in both TypeI and II LINERs, though on longer (months) timescales(Maoz et al. 2005). In fact, at the time of our X-ray de-tection of PTF10iya (2010 June 11), the observed optical toX-ray spectral index, αOX ≈ 1.1, is broadly consistent withthe properties of known low-luminosity AGNs (Maoz 2007).
However, if SDSSJ1438 does indeed host a faint ac-tive nucleus (similar to NGC5905; Gezari et al. 2003), theemission-line flux from the nucleus must be significantly lessthan the total integrated value across the slit (in order forthe line diagnostics to indicate a pure H II region). If weadopt a limit of < 10% on the contribution to the extinction-corrected [O III] line and apply the observed correlation be-tween [O III] flux and LX for AGNs (Heckman et al. 2005),we infer a quiescent X-ray luminosity of LX ∼
< 1042 erg s−1.This value is two orders of magnitude less than the observed
flaring state; to the best of our knowledge, such a dramaticoutburst has never before been observed in a low-luminosityLINER, though the nature of the variability in these sourcesis not yet well understood.
To summarise, even if we overlook the lack of evidencefor AGN activity in SDSSJ1438, the emission-line ratios, thehistorical light curve, and the dramatic increase in the X-rayflux make PTF10iya unique among known AGN outbursts.Of course, we cannot entirely exclude some previously un-observed mode of variability in the gas accretion process.Nevertheless, given the inadequacy of AGNs in explainingthe observed properties of PTF10iya, we also seek an alter-native possibility.
4.4 Tidal disruption flare
Stars passing too close to a SMBH will be tornapart when tidal forces are stronger than their self-gravity (Frank & Rees 1976; Lacy, Townes & Hollenbach1982; Rees 1988). In the case of solar-type stars (massM∗, radius R∗), this disruption will occur outside theevent horizon for SMBHs with MBH ∼
< 108 M⊙ (Hills1975). Bound stellar debris is sent off on highly ellip-tical orbits, and should return to pericentre (Rp) at arate M ∝ t−5/3 (Phinney 1989; Evans & Kochanek 1989;Ayal, Livio & Piran 2000; Lodato, King & Pringle 2009;Ramirez-Ruiz & Rosswog 2009). The resulting accretiononto the SMBH powers an outburst known as a tidal dis-ruption flare (TDF).
In the simplest models, the returning debris shocksand circularises, forming a torus around the SMBH (e.g.,Ulmer 1999; Li, Narayan & Menou 2002). Particularly atlate times, the disc should be optically thick but geomet-rically thin, and the emergent spectrum should be approxi-mately thermal, with
T ≈
(
LEdd
4πR2Tσ
)1/4
=
2× 10⁵(
MBH
106 M⊙
)1/12 (
R∗
R⊙
)−1/2 (
M∗
M⊙
)−1/6
K, (1)
where RT ≈ R∗(MBH/M∗)1/3 is the tidal radius (where the
tidal force due to the SMBH exceeds the self-gravity of thestar). As is evident from Equation 1, the spectrum peaksin the far UV, with a large bolometric correction from therest-frame optical bandpass. For emission from the accretiondisc, the bolometric luminosity evolution should approxi-mately follow the mass accretion rate, L ∝ t−5/3, althoughthe observed flux in a given bandpass could deviate fromthis behaviour.
It is not surprising, then, that the majority of TDFcandidates have been identified through wide-field X-ray (Bade, Komossa & Dahlem 1996; Komossa & Greiner1999; Greiner et al. 2000; Donley et al. 2002; Esquej et al.2007, 2008; Maksym, Ulmer & Eracleous 2010) and UV(Renzini et al. 1995; Gezari et al. 2006, 2008, 2009) surveys.PTF10iya differs in important ways from most of these TDFcandidates: the derived blackbody temperature of PTF10iyais approximately an order of magnitude smaller than inthese sources (which exhibit typical temperatures of a fewtimes 105 K), the decay timescale is significantly shorter
c© 2011 RAS, MNRAS 000, 1–17
PTF10iya: A short-lived, luminous flare from the nuclear region of a star-forming galaxy 13
(typical durations of months to years), and, when detected,the X-ray emission is significantly harder (typical power-law indices of Γ ≈ 4–5). Many of these differences couldbe ascribed to bandpass selection effects, so a more aptcomparison would be to the optically discovered candidatesfrom van Velzen et al. (2010). We shall return to this issueshortly.
The blackbody prediction in Equation 1 is well moti-vated at late times, when the fallback rate is sub-Eddington:M ∼
< MEdd ≡ LEdd/ǫc2 (ǫ is the radiative efficiency of the
accretion disc, assumed to be ∼ 0.1). However, for blackholes with MBH ∼
< 3 × 10⁷ M⊙, the mass accretion ratewill exceed the Eddington rate for some period of time fol-lowing disruption. In this case, the accretion disc is likelyto be highly advective, and some fraction of the boundmaterial may be blown out from the system as a power-ful wind (e.g., King & Pounds 2003; Ohsuga et al. 2005).Strubbe & Quataert (2009) have calculated the expectedemission from this super-Eddington outflow, and predict ashort-lived (∆t ≈ 30 d), luminous (Lpeak ≈ 1044 erg s−1)flare with a lower temperature than that seen during thethin-disc phase.
The observed properties of PTF10iya are broadly con-sistent with the predictions for this super-Eddington phase.The relatively short timescale, both in terms of the rise anddecline, suggests that the disruption occurred close to theSMBH: Rp ∼
< 3RS, where RS is the Schwarzschild radius.Likewise, the large bolometric luminosity is consistent witha relatively massive SMBH: MBH ∼
> 107 M⊙. For a solar-type star with pericentre distance Rp ≈ 2Rs disrupted bya 107 M⊙ black hole, we find RBB ≈ 100AU, TBB ≈ 104 K,and LBB ≈ 1045 erg s−1 a few days after the disruption oc-curs [taking the fiducial values for the fraction of incomingmaterial expelled in the super-Eddington wind (fout) andthe terminal wind velocity (fv) from Strubbe & Quataert2009]. If we instead allow fout and fv to vary, we find a rangeof possible models (MBH ≈ 106–107 M⊙; Rp ≈ 2RS–RT) canreproduce the observed optical luminosity and colours. Withonly two epochs of data, however, a detailed test of thesemodels, in particular the temporal evolution, is beyond thescope of this work.
After the accretion rate drops below Eddington, in thetidal disruption model the emission should be dominatedby shock-heated material in the accretion disc. Given thepredicted temperature for the disc in this phase (Eq. 1),it is important to check if we would be sensitive to anydisc emission in our X-ray and UV observations from 2010August. Using models for the sub-Eddington disc emissionfrom Strubbe & Quataert (2009) with the system parame-ters determined above, we estimate νLν(λrest = 2000 A) ∼
<
2× 1042 erg s−1. This corresponds to a UVOT UVW 1 mag-nitude of ∼
> 22.5. Even neglecting the derived host-galaxyextinction, this value is several magnitudes fainter than ourlimits at this time. Likewise, the derived X-ray emission fromthis accretion disc component is well below the upper limitsfrom the XRT at this time.
On the other hand, comparing our late-time (∆t ≈2months) limits with the observed UV properties of candi-date TDFs from GALEX presents a slightly more complexpicture. With typical near-UV absolute magnitudes (AB)of ≈ −18 to −19mag at this time (Gezari et al. 2009),a comparable source would appear with UVW 1 ≈ 19.5–
20.5mag at the distance of PTF10iya. One possibility toexplain this apparent discrepancy with our derived limits(UVW 1 > 20.5mag) is extinction: our derived value ofE(B − V )gas = 0.40mag corresponds to AUV W1 ≈ 1.5mag.With this correction, our 2010 August UVOT limits are notsufficiently deep to rule out UV flares similar to those re-ported by Gezari et al. (2009). However, our derived extinc-tion correction is quite uncertain. We are therefore left toconclude that our 2010 August Swift observations are notsufficiently constraining to either detect or rule out the ex-pected disc signature during the sub-Eddington phase.
A 107 M⊙ SMBH is consistent with the limits forSDSSJ1438 derived from the black hole vs. bulge luminos-ity relation (§3.3). Furthermore, Strubbe & Quataert (2011)predict that any absorption features in the optical band-pass due to the photoionisation of the unbound materialshould be weaker for more massive black holes, and indeedwe do not detect such features in the early-time spectra ofPTF10iya. We reiterate, however, that the estimated blackhole mass is still sufficiently small to ensure that the disrup-tion would occur outside the event horizon.
In addition to the outburst properties, the host galaxyof PTF10iya is consistent with a TDF interpretation. Novariability is seen in the optical light curve in our PTF andDeepSky imaging of the field in the last few years. The ob-served emission-line ratios in quiescence indicate a moder-ately star-forming galaxy and are incompatible with pho-toionisation by the hard X-ray continuum common in AGNs.In fact, the host galaxy of PTF10iya, SDSSJ1438, bears astrong resemblance to the host galaxy of D23H-1, a candi-date TDF discovered by GALEX (Gezari et al. 2009). Thediagnostic emission-line ratios are all consistent within 2σuncertainties, as is the derived line-of-sight extinction.
Several important distinctions between PTF10iya andprevious TDF candidates remain, however. First, PTF10iyaappears to decay much more rapidly than any previouslyclaimed TDF candidate, even the handful discovered in theoptical. Given that the constraints on the outburst dates aremuch weaker for nearly all previous candidates14, this maybe simply because PTF10iya was caught shortly after thedisruption; the higher cadence of PTF enables detection ofshort-lived outbursts that might have been missed by othersurveys. Nevertheless, the contrast between the two TDFcandidates from van Velzen et al. (2010), which decayed by∼ 0.5–1.0mag in the 50 d since discovery, and PTF10iya,which decayed by ∼ 1.5mag in only 6 d, is quite striking.
Most importantly, the X-ray emission from PTF10iya,which accounts for a significant fraction of the bolometricluminosity, remains a significant challenge for TDF models.Unlike previous TDF candidates discovered in the X-rays,the shallow, nonthermal X-ray spectrum is inconsistent witha simple extrapolation of a 105 K blackbody to high energies.
Recently, two unusual high-energy transients discov-ered by the Swift satellite (Sw J1644+57 and Sw J2058+05)were suggested to result from the tidal disruption process(Levan et al. 2011; Bloom et al. 2011a; Burrows et al. 2011;
14 Two exceptions include D1-9, where the a rising lightcurve was observed in the optical (Gezari et al. 2008), andNGC5905, where a rising X-ray light curve was observed(Li, Narayan & Menou 2002).
c© 2011 RAS, MNRAS 000, 1–17
14 Cenko et al.
Zauderer et al. 2011; Cenko et al. 2011). While both sourcesdisplay extremely luminous (LX > 1047 erg s−1) X-ray emis-sion, this was also accompanied by a luminous radio source,with compelling evidence that the outburst marked the birthof a collimated, relativistic outflow (i.e., a jet). One possibil-ity is that the observed emission from PTF10iya is generatedby the same process (i.e., tidal disruption), but we are view-ing the system from outside the narrow angle of the jet (an“off-axis” TDF).
Giannios & Metzger (2011) considered off-axis emis-sion from the interaction of a mildly relativistic jetwith surrounding material, and predict bright (Lν ∼
>
1030 erg s−1 Hz−1 at 10 GHz), self-absorbed radio emis-sion peaking around a year after disruption15. Our ra-dio nondetections (§2.7) are an order of magnitude belowthe predictions of these models, suggesting in this case ei-ther that no relativistic jet was generated during the dis-ruption process or that the surrounding environment dif-fered significantly from the nominal parameters assumedby Giannios & Metzger (2011). We note that these limitsare significantly more constraining for these radio jet mod-els than previous observations, which were either obtainedshortly after disruption (van Velzen et al. 2010) or solely atlow frequency, where self-absorption comes into play (Bower2011).
If we do not consider relativistic jetted models, we maystill be able to explain the observed X-ray flare by analogywith AGNs. Theoretically, for MBH > 107 M⊙, the densityat pericentre is never quite high enough for the gas and radi-ation to reach thermal equilibrium, and so instead, photonslikely Compton upscatter off of fast-moving electrons to pro-duce hard X-rays (Strubbe & Quataert 2011). While such aphenomenon, similar to what is observed in the hard X-raybandpass in AGNs, may account for the X-ray emission fromPTF10iya, the process is relatively poorly understood andbeyond the scope of this work.
5 CONCLUSIONS
To summarise, we reiterate the primary observed propertiesof PTF10iya.
(i) It was a short-lived (τ ≈ 10 d), luminous (Mg′ ≈−21mag) UV/optical flare.
(ii) After subtracting the host-galaxy contribution, thetransient emission is relatively blue, and reasonably well-fitby a blackbody with T ≈ (1–2) ×104 K, R ≈ 200AU, andL ≈ 1044–1045 erg s−1.
(iii) A simultaneous X-ray flare of comparable energy out-put (LX ≈ 1044 erg s−1) at ∆t ≈ 5 d after the outburst wasdetected.
(iv) It was astrometrically consistent with the nucleus ofa z = 0.22405 star-forming galaxy with a predominantlydisc-like morphology (SDSSJ1438).
(v) There is no evidence, either from the historical lightcurve or host spectrum, for previous episodes of accretion
15 van Velzen, Kording & Falcke (2011) also consider radio jetsfrom TDFs, but powered instead internally by the accretion pro-cess. The predicted radio luminosity and spectra are mostly sim-ilar to those of Giannios & Metzger (2011).
onto the central SMBH; that is, SDSSJ1438 does not appearto be an AGN.
After ruling out other known classes of extragalacticvariable sources (GRBs and SNe), we have demonstratedthat the basic properties of the UV/optical outburst (lumi-nosity, temperature, duration) are broadly consistent withthe recent predictions of Strubbe & Quataert (2009) for theearly stages following the tidal disruption of a solar-type starby a ∼ 107 M⊙ SMBH. This picture is further supported bythe lack of variability in the historical optical light curve,and the emission-line diagnostic diagrams which suggest anordinary star-forming galaxy (i.e., not a Seyfert or LINER).
At the same time, PTF10iya differs in important waysfrom previously identified TDF candidates. While some ofthis can be understood largely as bandpass biases (e.g.,lower blackbody temperature than for UV and X-ray se-lected candidates), the short duration and associated brightX-ray flare suggest a significant diversity if indeed all ofthese sources do result from the tidal disruption of a starby a SMBH. Without an unambiguous signature, such asthe predicted broad (0.01c–0.1c), blueshifted absorption fea-tures in the rest-frame UV bandpass (Strubbe & Quataert2011), we cannot definitely rule out an unusual AGN out-burst scenario.
While much of the interpretation herein has beencentred on the TDF framework, it is nonetheless inter-esting to speculate on what might cause such a shorttimescale outburst in an otherwise quiescent AGN. Theblack-hole binary systems known as soft X-ray transients(SXTs) at first glance appear to be potential stellar-massanalogs. These systems, such as A0620–00 (Elvis et al.1975; Gelino, Harrison & Orosz 2001), spend decades ina quiescent state accreting from their companions at ex-tremely low rates (MEdd < 0.01). After intervals of sev-eral decades, however, a thermal viscous instability in theaccretion disc triggers a dramatic outburst typically last-ing several weeks (e.g., Cannizzo 1993). Since the recur-rence time should scale proportionally to black hole mass,a quiescent 107 M⊙ black hole would be expected to un-dergo such an outburst every ∼ 106 yr, much too long todetect on human timescales. Interpreting AGN outburstsin this manner yields a self-consistent quasar luminosityfunction (Siemiginowska & Elvis 1997), and can accountfor the resemblance between the power spectrum of AGNsand stellar-mass black-hole binaries in the soft-high state(McHardy et al. 2004, 2006).
There are significant problems with this picture,however. First, the thermal viscous instability may not becapable of producing large-amplitude outbursts in SMBHsystems, as the gas in these systems is well coupled tothe magnetic field even in quiescence due to the largersize of the accretion disc (Menou & Quataert 2001).Even more troubling, the outburst duration should alsoscale as the black hole mass, so SXT-like outbursts inSMBH systems would have durations of ∼ 104–105 yr.Conversely, a 10 d outburst in a 107 M⊙ system cor-responds to a ∼ 1 s outburst in a 10M⊙ black-holebinary. While some stellar-mass Galactic systems doexhibit dramatic X-ray flares on such short timescales(e.g., GRS1915+105; Greiner, Morgan & Remillard1996; Morgan, Remillard & Greiner 1997;
c© 2011 RAS, MNRAS 000, 1–17
PTF10iya: A short-lived, luminous flare from the nuclear region of a star-forming galaxy 15
Muno, Morgan & Remillard 1999), these systems donot return to quiescence immediately (if at all). To thebest of our knowledge, there are no known stellar-massblack-hole binaries that transition from quiescence to Ed-dington luminosities on such a short timescale. If PTF10iyais truly an AGN outburst, it would suggest some newaccretion physics that does not appear to manifest itself instellar-mass systems.
Regardless of its ultimate origin, it is clear that eventslike PTF10iya have not been previously reported. But be-cause of its short timescale, this does not necessarily meansuch outbursts are rare. Given the large luminosity (compa-rable to the brightest SNe), current and future optical sur-veys should be capable of detecting additional similar eventsout to relatively large distances, provided they observe withsufficiently high cadence. Rapid broadband follow-up obser-vations will be key to uncovering more examples of this class(see, e.g., Gal-Yam et al. 2011, for a detailed discussion ofthe PTF follow-up time line).
ACKNOWLEDGMENTS
We wish to thank S. A. Wright, K. Bundy, and the anony-mous referee for valuable comments and discussions regard-ing this manuscript. Follow-up data were obtained by thePalomar Transient Factory TDF Key Project.
S.B.C. and A.V.F. wish to acknowledge generoussupport from Gary and Cynthia Bengier, the Richardand Rhoda Goldman Fund, National Aeronautics andSpace Administration (NASA)/Swift grant NNX10AI21G,NASA/Fermi grant NNX1OA057G, and National ScienceFoundation (NSF) grant AST–0908886. N.R.B. is supportedthrough the Einstein Fellowship Program (NASA Coop-erative Agreement NNG06DO90A). J.S.B. and his groupwere partially supported by NASA/Swift Guest Investigatorgrants NNX09AQ66G and NNX10AF93G, and a SciDACgrant from the US Department of Energy. The WeizmannInstitute PTF partnership is supported in part by grantsfrom the Israeli Science Foundation (ISF) to A.G. Jointwork by the Weizmann and Caltech groups is supported by agrant from the Binational Science Foundation (BSF) to A.G.and S.R.K., and A.G. acknowledges further support from anEU/FP7 Marie Curie IRG fellowship. L.B. is supported bythe NSF under grants PHY–0551164 and AST–0707633. P60operations are funded in part by NASA through the SwiftGuest Investigator Program (grant NNG06GH61G).
We acknowledge the use of public data from the Swiftdata archive. Some of the data presented herein were ob-tained at the W.M. Keck Observatory, which is operatedas a scientific partnership among the California Institute ofTechnology, the University of California, and NASA. TheObservatory was made possible by the generous financialsupport of the W.M. Keck Foundation. The authors wishto recognize and acknowledge the very significant culturalrole and reverence that the summit of Mauna Kea has al-ways had within the indigenous Hawaiian community; weare most fortunate to have the opportunity to conduct ob-servations from this mountain.
REFERENCES
Abazajian K. N., et al., 2009, ApJS, 182, 543Abdo A. A., et al., 2010, ApJS, 188, 405Ayal S., Livio M., Piran T., 2000, ApJ, 545, 772Bade N., Komossa S., Dahlem M., 1996, A&A, 309, L35Baldwin J. A., Phillips M. M., Terlevich R., 1981, PASP,93, 5
Becker R. H., White R. L., Helfand D. J., 1995, ApJ, 450,559
Beckmann V., Engels D., Bade N., Wucknitz O., 2003,A&A, 401, 927
Blandford R. D., Rees M. J., 1978, in BL Lac Objects,A. M. Wolfe, ed., p. 328
Bloom J. S., et al., 2011a, Science, 333, 203Bloom J. S., et al., 2011b, PASP, submitted (astro-ph/1106.5491)
Bloom J. S., et al., 2009, ApJ, 691, 723Bower G. C., 2011, ApJL, 732, L12Brandt W. N., Pounds K. A., Fink H., 1995, MNRAS, 273,L47
Bregman J. N., 1990, A&A Rev., 2, 125Brown P. J., et al., 2009, AJ, 137, 4517Bruzual G., Charlot S., 2003, MNRAS, 344, 1000Burrows D. N., et al., 2011, Nat, 476, 421Burrows D. N., et al., 2005, Space Science Reviews, 120,165
Butler N. R., 2007, AJ, 133, 1027Calzetti D., 2001, PASP, 113, 1449Cannizzo J. K., 1993, ApJ, 419, 318Cenko S. B., et al., 2011, ApJ, submitted (astro-ph/1107.5307)
Cenko S. B., et al., 2006, PASP, 118, 1396Colgate S. A., 1974, ApJ, 187, 333Djorgovski S. G., et al., 2008, Astronomische Nachrichten,329, 263
Donley J. L., Brandt W. N., Eracleous M., Boller T., 2002,AJ, 124, 1308
Drake A. J., et al., 2009, ApJ, 696, 870Ellis R. S., et al., 2008, ApJ, 674, 51Elvis M., Page C. G., Pounds K. A., Ricketts M. J., TurnerM. J. L., 1975, Nat, 257, 656
Esquej P., Saxton R. D., Freyberg M. J., Read A. M., Al-tieri B., Sanchez-Portal M., Hasinger G., 2007, A&A, 462,L49
Esquej P., et al., 2008, A&A, 489, 543Evans C. R., Kochanek C. S., 1989, ApJL, 346, L13Evans P. A., et al., 2007, A&A, 469, 379Ferrarese L., Merritt D., 2000, ApJL, 539, L9Filippenko A. V., 1982, PASP, 94, 715Filippenko A. V., 1997, ARA&A, 35, 309Fossati G., Celotti A., Ghisellini G., Maraschi L., 1997,MNRAS, 289, 136
Fossati G., Maraschi L., Celotti A., Comastri A., GhiselliniG., 1998, MNRAS, 299, 433
Frank J., Rees M. J., 1976, MNRAS, 176, 633Gal-Yam A., et al., 2011, ApJ, 736, 159Gal-Yam A., Ofek E. O., Filippenko A. V., Chornock R.,Li W., 2002, PASP, 114, 587
Gebhardt K., et al., 2000, ApJL, 539, L13Gehrels N., et al., 2004, ApJ, 611, 1005Gelino D. M., Harrison T. E., Orosz J. A., 2001, AJ, 122,
c© 2011 RAS, MNRAS 000, 1–17
16 Cenko et al.
2668Gezari S., Halpern J. P., Komossa S., Grupe D., LeighlyK. M., 2003, ApJ, 592, 42
Gezari S., et al., 2006, ApJ, 653, L25Gezari S., et al., 2008, ApJ, 676, 944Gezari S., et al., 2009, ApJ, 698, 1367Ghez A. M., et al., 2008, ApJ, 689, 1044Giannios D., Metzger B. D., 2011, MNRAS, 416, 2102Goodrich R. W., 1989, ApJ, 342, 224Greiner J., Morgan E. H., Remillard R. A., 1996, ApJL,473, L107
Greiner J., Schwarz R., Zharikov S., Orio M., 2000, A&A,362, L25
Grupe D., Beuermann K., Mannheim K., Bade N., ThomasH., de Martino D., Schwope A., 1995, A&A, 299, L5
Grupe D., Leighly K. M., Komossa S., 2008, AJ, 136, 2343Grupe D., Wills B. J., Leighly K. M., Meusinger H., 2004,AJ, 127, 156
Halpern J. P., Filippenko A. V., 1988, Nat, 331, 46Heckman T. M., 1980, A&A, 87, 152Heckman T. M., Ptak A., Hornschemeier A., KauffmannG., 2005, ApJ, 634, 161
Hills J. G., 1975, Nat, 254, 295Ho L. C., 2008, ARA&A, 46, 475Ho L. C., Filippenko A. V., Sargent W. L. W., 1997, ApJS,112, 315
Horne K., 1986, PASP, 98, 609Immler S., Lewin W. H. G., 2003, in Supernovae andGamma-Ray Bursters, K. Weiler, ed., Vol. 598, p. 91
Jordi K., Grebel E. K., Ammon K., 2006, A&A, 460, 339Kaiser N., et al., 2002, in Society of Photo-OpticalInstrumentation Engineers (SPIE) Conference Series,J. A. Tyson & S. Wolff, ed., Vol. 4836, p. 154
Kasliwal M. M., et al., 2010, ApJL, 723, L98Kauffmann G., et al., 2003a, MNRAS, 341, 33Kauffmann G., et al., 2003b, MNRAS, 346, 1055Kennicutt R. C., 1998, ARA&A, 36, 189Kewley L. J., Dopita M. A., 2002, ApJS, 142, 35King A. R., Pounds K. A., 2003, MNRAS, 345, 657Komossa S., Bade N., 1999, A&A, 343, 775Komossa S., Bohringer H., Huchra J. P., 1999, A&A, 349,88
Komossa S., Greiner J., 1999, A&A, 349, L45Kormendy J., Richstone D., 1995, ARA&A, 33, 581Kulkarni S. R., Rau A., 2006, ApJL, 644, L63Lacy J. H., Townes C. H., Hollenbach D. J., 1982, ApJ,262, 120
Lauer T. R., et al., 2007, ApJ, 662, 808Law N. M., et al., 2009, PASP, 121, 1395Levan A. J., et al., 2011, Science, 333, 199Li L., Narayan R., Menou K., 2002, ApJ, 576, 753Li W., Jha S., Filippenko A. V., Bloom J. S., Pooley D.,Foley R. J., Perley D. A., 2006, PASP, 118, 37
Lodato G., King A. R., Pringle J. E., 2009, MNRAS, 392,332
Magorrian J., et al., 1998, AJ, 115, 2285Maksym W. P., Ulmer M. P., Eracleous M., 2010, ApJ,722, 1035
Malkan M. A., Sargent W. L. W., 1982, ApJ, 254, 22Maoz D., 2007, MNRAS, 377, 1696Maoz D., Nagar N. M., Falcke H., Wilson A. S., 2005, ApJ,625, 699
Matheson T., Filippenko A. V., Ho L. C., Barth A. J.,Leonard D. C., 2000, AJ, 120, 1499
McHardy I. M., Koerding E., Knigge C., Uttley P., FenderR. P., 2006, Nat, 444, 730
McHardy I. M., Papadakis I. E., Uttley P., Page M. J.,Mason K. O., 2004, MNRAS, 348, 783
Menou K., Quataert E., 2001, ApJ, 552, 204Modjaz M., et al., 2009, ApJ, 702, 226Morgan E. H., Remillard R. A., Greiner J., 1997, ApJ, 482,993
Muno M. P., Morgan E. H., Remillard R. A., 1999, ApJ,527, 321
Ofek E. O., et al., 2010, ApJ, 724, 1396Ohsuga K., Mori M., Nakamoto T., Mineshige S., 2005,ApJ, 628, 368
Oke J. B., Gunn J. E., 1983, ApJ, 266, 713Oke J. B., et al., 1995, PASP, 107, 375Osterbrock D. E., 1989, Astrophysics of gaseous nebulaeand active galactic nuclei, Osterbrock, D. E., ed.
Osterbrock D. E., Pogge R. W., 1985, ApJ, 297, 166Peng C. Y., Ho L. C., Impey C. D., Rix H.-W., 2002, AJ,124, 266
Phinney E. S., 1989, in IAU Symposium, Vol. 136, TheCenter of the Galaxy, M. Morris, ed., p. 543
Pian E., Romano P., Maoz D., Cucchiara A., Pagani C.,Parola V. L., 2010, MNRAS, 401, 677
Piran T., 2005, Reviews of Modern Physics, 76, 1143Poole T. S., et al., 2008, MNRAS, 383, 627Poznanski D., et al., 2010, Science, 327, 58Quimby R. M., Aldering G., Wheeler J. C., Hoflich P., Ak-erlof C. W., Rykoff E. S., 2007, ApJL, 668, L99
Racusin J. L., et al., 2008, Nature, 455, 183Rahmer G., Smith R., Velur V., Hale D., Law N., Bui K.,Petrie H., Dekany R., 2008, in Presented at the Society ofPhoto-Optical Instrumentation Engineers (SPIE) Confer-ence, Vol. 7014, Society of Photo-Optical InstrumentationEngineers (SPIE) Conference Series
Ramirez-Ruiz E., Rosswog S., 2009, ApJL, 697, L77Rau A., et al., 2009, PASP, 121, 1334Rees M. J., 1988, Nat, 333, 523Renzini A., Greggio L., di Serego Alighieri S., CappellariM., Burstein D., Bertola F., 1995, Nature, 378, 39
Roming P. W. A., et al., 2005, Space Science Reviews, 120,95
Sanders D. B., Phinney E. S., Neugebauer G., Soifer B. T.,Matthews K., 1989, ApJ, 347, 29
Sari R., Piran T., Narayan R., 1998, ApJ, 497, L17Schlegel D. J., Finkbeiner D. P., Davis M., 1998, ApJ, 500,525
Schmidt B. P., Keller S. C., Francis P. J., Bessell M. S.,2005, American Astronomical Society Meeting 206, 206,457
Sersic J. L., Pastoriza M., 1967, PASP, 79, 152Shields G. A., 1978, Nat, 272, 706Siemiginowska A., Elvis M., 1997, ApJL, 482, L9+Simcoe R. A., Metzger M. R., Small T. A., Araya G., 2000,in Bulletin of the American Astronomical Society, Vol. 32,p. 758
Skrutskie M. F., et al., 2006, AJ, 131, 1163Smith N., Chornock R., Silverman J. M., Filippenko A. V.,Foley R. J., 2010, ApJ, 709, 856
Soderberg A. M., et al., 2008, Nat, 453, 469
c© 2011 RAS, MNRAS 000, 1–17
PTF10iya: A short-lived, luminous flare from the nuclear region of a star-forming galaxy 17
Spergel D. N., et al., 2007, ApJS, 170, 377Strubbe L. E., Quataert E., 2009, MNRAS, 400, 2070Strubbe L. E., Quataert E., 2011, MNRAS, 415, 168Tremonti C. A., et al., 2004, ApJ, 613, 898Ulmer A., 1999, ApJ, 514, 180Urry C. M., Padovani P., 1995, PASP, 107, 803van Velzen S., Farrar G. R., Gezari S., Morrell N., ZaritskyD., Ostman L., Smith M., Gelfand J., 2010, ApJ, submit-ted (astro-ph/1009.1627)
van Velzen S., Kording E., Falcke H., 2011, MNRAS, L310Veilleux S., Osterbrock D. E., 1987, ApJS, 63, 295Voges W., et al., 1999, A&A, 349, 389Wade R. A., Horne K., 1988, ApJ, 324, 411Wehrle A. E., et al., 1998, ApJ, 497, 178Wizinowich P. L., et al., 2006, PASP, 118, 297Zauderer B. A., et al., 2011, Nat, 476, 425
c© 2011 RAS, MNRAS 000, 1–17
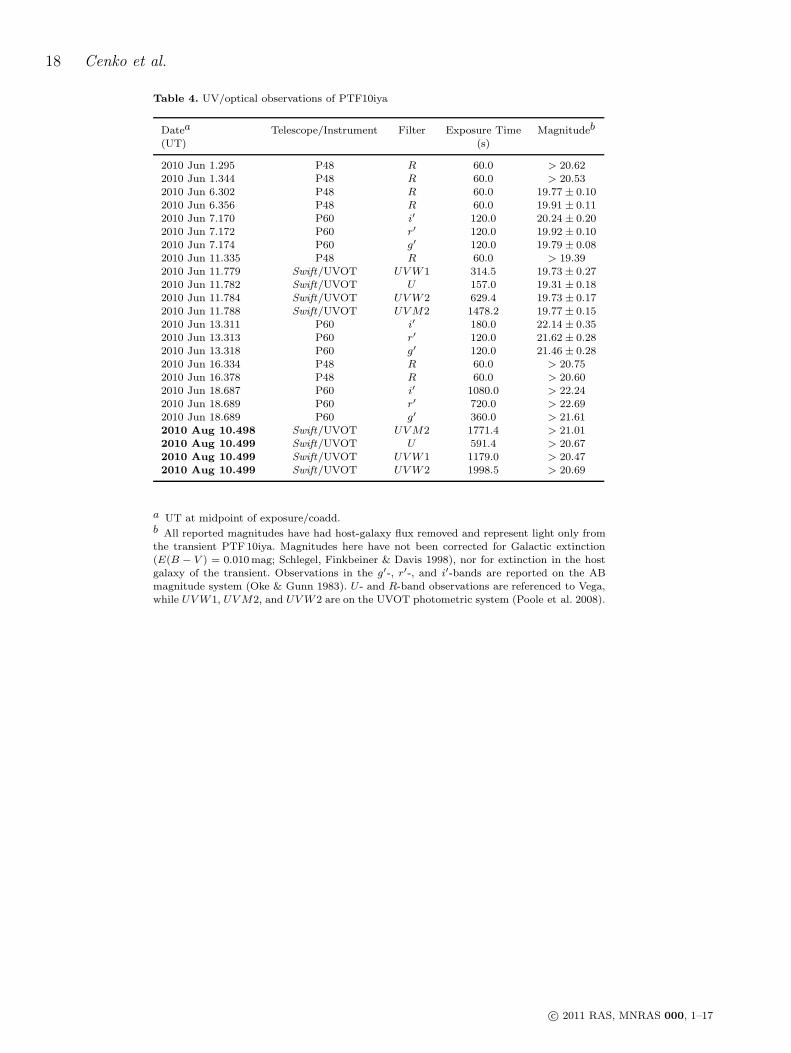
18 Cenko et al.
Table 4. UV/optical observations of PTF10iya
Datea Telescope/Instrument Filter Exposure Time Magnitudeb
(UT) (s)
2010 Jun 1.295 P48 R 60.0 > 20.622010 Jun 1.344 P48 R 60.0 > 20.532010 Jun 6.302 P48 R 60.0 19.77 ± 0.102010 Jun 6.356 P48 R 60.0 19.91 ± 0.112010 Jun 7.170 P60 i′ 120.0 20.24 ± 0.202010 Jun 7.172 P60 r′ 120.0 19.92 ± 0.102010 Jun 7.174 P60 g′ 120.0 19.79 ± 0.082010 Jun 11.335 P48 R 60.0 > 19.392010 Jun 11.779 Swift/UVOT UVW1 314.5 19.73 ± 0.272010 Jun 11.782 Swift/UVOT U 157.0 19.31 ± 0.182010 Jun 11.784 Swift/UVOT UVW2 629.4 19.73 ± 0.172010 Jun 11.788 Swift/UVOT UVM2 1478.2 19.77 ± 0.152010 Jun 13.311 P60 i′ 180.0 22.14 ± 0.352010 Jun 13.313 P60 r′ 120.0 21.62 ± 0.282010 Jun 13.318 P60 g′ 120.0 21.46 ± 0.282010 Jun 16.334 P48 R 60.0 > 20.752010 Jun 16.378 P48 R 60.0 > 20.602010 Jun 18.687 P60 i′ 1080.0 > 22.242010 Jun 18.689 P60 r′ 720.0 > 22.692010 Jun 18.689 P60 g′ 360.0 > 21.612010 Aug 10.498 Swift/UVOT UVM2 1771.4 > 21.012010 Aug 10.499 Swift/UVOT U 591.4 > 20.672010 Aug 10.499 Swift/UVOT UVW1 1179.0 > 20.472010 Aug 10.499 Swift/UVOT UVW2 1998.5 > 20.69
a UT at midpoint of exposure/coadd.b All reported magnitudes have had host-galaxy flux removed and represent light only fromthe transient PTF10iya. Magnitudes here have not been corrected for Galactic extinction(E(B − V ) = 0.010mag; Schlegel, Finkbeiner & Davis 1998), nor for extinction in the hostgalaxy of the transient. Observations in the g′-, r′-, and i′-bands are reported on the ABmagnitude system (Oke & Gunn 1983). U - and R-band observations are referenced to Vega,while UVW1, UVM2, and UVW2 are on the UVOT photometric system (Poole et al. 2008).
c© 2011 RAS, MNRAS 000, 1–17


![[B19 HS 1101] SAGI RAMA KRISHNAM RAJU ENGINEERING …](https://img.pdfslide.us/doc/110x75/61f8ade7a40cbe701c21beea/b19-hs-1101-sagi-rama-krishnam-raju-engineering-.jpg)


![[B19 BS 2102] SAGI RAMA KRISHNAM RAJU ENGINEERING …](https://img.pdfslide.us/doc/110x75/624d84dc8b2d192aeb63a563/b19-bs-2102-sagi-rama-krishnam-raju-engineering-.jpg)
![[M19 PS 1101] SAGI RAMA KRISHNAM RAJU ENGINEERING …](https://img.pdfslide.us/doc/110x75/62802452cfa12b32493b4100/m19-ps-1101-sagi-rama-krishnam-raju-engineering-.jpg)


![[B19IT2101] SAGI RAMA KRISHNAM RAJU ENGINEERING …](https://img.pdfslide.us/doc/110x75/629a75d13a32b36e3b6d9b39/b19it2101-sagi-rama-krishnam-raju-engineering-.jpg)


![[B19CS2101] SAGI RAMA KRISHNAM RAJU ENGINEERING …](https://img.pdfslide.us/doc/110x75/61bded0da8552b04656cc96b/b19cs2101-sagi-rama-krishnam-raju-engineering-.jpg)