Embed Size (px)
Citation preview

ORIGINAL ARTICLE
PTEN loss is associated with a poor response to trastuzumabin HER2-overexpressing gastroesophageal adenocarcinoma
Yasunori Deguchi1 • Hiroshi Okabe1,4 • Nobu Oshima1 • Shigeo Hisamori1 •
Sachiko Minamiguchi2 • Manabu Muto3 • Yoshiharu Sakai1
Received: 18 February 2016 / Accepted: 2 August 2016 / Published online: 12 August 2016
� The International Gastric Cancer Association and The Japanese Gastric Cancer Association 2016
Abstract
Background Although trastuzumab improves the outcome
of patients with human epidermal growth factor receptor 2
(HER2)-overexpressing gastric or gastroesophageal junc-
tion adenocarcinoma (collectively referred to as ‘‘gastroe-
sophageal adenocarcinoma’’; GEA), no clinical response is
observed in a substantial population of patients. A pre-
dictive biomarker of trastuzumab response is required. The
aim of this study was to evaluate whether the hyperacti-
vation of the downstream phosphatidylinositol 3-kinase
pathway, due to phosphatase and tensin homolog (PTEN)
loss or PIK3CA mutations, could provide trastuzumab
resistance in GEA.
Methods Expression of HER2 and PTEN, and PIK3CA
gene mutations were screened in 264 surgically resected
GEA specimens. The effects of PTEN knockdown on the
response to trastuzumab on cell viability, HER2 down-
stream signaling, apoptosis, and cell cycle were evaluated
in HER2-overexpressing NCI-N87 gastric adenocarcinoma
and OE19 esophageal adenocarcinoma cell lines. Inhibition
of xenograft tumor growth by trastuzumab was investigated
in OE19 cells with or without PTEN knockdown. The
PTEN expression and objective response were analyzed in
23 GEA patients who received trastuzumab-based therapy.
Results PTEN loss was identified in 34.5 % of HER2-
overexpressing GEA patients, whereas PIK3CA mutations
were rare (5.6 %). Trastuzumab-mediated growth sup-
pression, apoptosis, and G1 cell cycle arrest were inhibited
by PTEN knockdown through Akt activation in NCI-N87
and OE19 cells. PTEN knockdown impaired the antipro-
liferative effect of trastuzumab in OE19 xenograft models.
A clinical response was observed in 50 % of PTEN-posi-
tive tumors (9 of 18) but in no tumors with PTEN loss
(none of 5).
Conclusions PTEN loss was frequently found in HER2-
overexpressing tumors, and was associated with a poor
response to trastuzumab-based therapy in patients with
GEA.
Keywords Gastric adenocarcinoma � Esophageal
adenocarcinoma � Phosphatase and tensin homolog �Human epidermal growth factor receptor 2 � Trastuzumab
Introduction
Gastric cancer is the fifth commonest malignancy and the
third leading cause of cancer death in the world [1]. Most
gastric cancer patients have highly advanced disease at
presentation, despite improvements in the diagnosis, and
thus the treatment option is mainly limited to systemic
chemotherapy. Patients with advanced gastric cancer rarely
achieve long-term survival, and the median survival is
8–14 months [2, 3]. In addition, the incidence of gastroe-
sophageal junction adenocarcinoma has increased consid-
erably in the past 40 years, especially in industrialized
countries [4].
& Hiroshi Okabe
1 Department of Surgery, Graduate School of Medicine, Kyoto
University, 54 Shogoin Kawahara-cho, Sakyo-ku,
Kyoto 606-8507, Japan
2 Department of Diagnostic Pathology, Graduate School of
Medicine, Kyoto University, Kyoto, Japan
3 Department of Therapeutic Oncology, Graduate School of
Medicine, Kyoto University, Kyoto, Japan
4 Department of Surgery, Otsu Municipal Hospital, 2-9-9
Motomiya, Otsu, Shiga 520-0804, Japan
123
Gastric Cancer (2017) 20:416–427
DOI 10.1007/s10120-016-0627-z

The Trastuzumab for Gastric Cancer (ToGA) trial, a
recent international randomized controlled trial, demon-
strated a significant survival benefit of trastuzumab com-
bined with chemotherapy for human epidermal growth
factor receptor 2 (HER2)-overexpressing gastric or gas-
troesophageal junction adenocarcinoma (collectively
referred to as ‘‘gastroesophageal adenocarcinoma’’; GEA)
[5]. However, more than half of the patients in the ToGA
trial did not exhibit an objective response to trastuzumab,
despite HER2 overexpression. Moreover, trastuzumab has
several unique adverse effects, such as cardiotoxicity,
which causes severe cardiac dysfunction in 0–3.9 % of
patients [6]. Therefore, a predictive biomarker is required
to select patients who will likely benefit from trastuzumab-
based therapy.
The phosphatidylinositol 3-kinase (PI3K) pathway is a
major downstream signal transduction pathway of HER2.
In breast cancer, constitutive activation of the PI3K path-
way due to phosphatase and tensin homolog (PTEN)
deficiency or phosphatidylinositol 4,5-bisphosphate 3-ki-
nase catalytic subunit alpha gene (PIK3CA) mutations was
identified to be one of the important mechanisms of tras-
tuzumab resistance [7–9].
However, the mechanisms of trastuzumab resistance in
GEA have yet to be clarified. We hypothesized that the
hyperactivation of the PI3K pathway might contribute to
trastuzumab resistance also in GEA. The first aim of this
study was to evaluate the frequency of PTEN loss and
PIK3CA mutations, and to evaluate the relationship
between alterations in the PI3K pathway and HER2 over-
expression in GEA. The second aim was to explore whe-
ther PTEN loss or PIK3CA mutation is associated with
trastuzumab resistance and influences the response to
trastuzumab therapy in patients with GEA.
Materials and methods
Patients
Two separate cohorts of patients were investigated in the
study. First, 326 patients who underwent R0 curative
resection for primary GEA at Kyoto University Hospital
between January 2001 and December 2010 received a
diagnosis of pathologic T2–T4 and pathologic TNM stage
IB–IIIC cancer (seventh edition of the Union for Interna-
tional Cancer Control TNM classification). Sixty-two
patients received preoperative chemotherapy and were
excluded from the study. Therefore, surgical specimens
from 264 patients were screened for HER2 expression,
PTEN expression, and PIK3CA mutation status (screening
cohort).
The second cohort included 24 patients with HER2-
overexpressing advanced GEA who received trastuzumab-
based therapy from November 2010 to December 2014 at
Kyoto University Hospital. Specimens for HER2 and
PTEN evaluation were obtained by biopsy or surgical
resection, but a specimen was not available in one patient.
Therefore, 23 patients were included in the study to
investigate the influence of PTEN loss on trastuzumab
sensitivity (investigation cohort). Trastuzumab was
administered to these patients with oral fluoropyrimidine
drugs (capecitabine or S-1) with or without cisplatin. The
objective response was assessed by the Response Evalua-
tion Criteria in Solid Tumors, version 1.1 [10].
All patients gave informed consent for additional
molecular analyses at the time of biopsy or surgery, and
formalin-fixed paraffin-embedded tissue specimens were
obtained under the protocol approved by the Institutional
Review Board of Kyoto University (E1752). Clinico-
pathology information was retrieved from medical records
and pathology reports.
Evaluation of HER2 expression and amplification
HER2 expression was analyzed by immunohistochemistry
(IHC), and ERBB2 amplification was evaluated by dual-
color in situ hybridization (DISH) as previously described
[11]. Briefly, IHC staining of HER2 with the PATHWAY�
HER2/neu (4B5) antibody (Ventana Medical Systems) was
performed with an automated slide staining system (Bench-
Mark XT; Ventana Medical Systems). The scoring system
defined in the ToGA study was used for IHC scoring
(evaluated by membranous reactivity in 10 % or more of
tumor cells.) [5]. DISH was performed with an INFORM
DISH HER2 kit (Ventana Medical Systems). The post hoc
analysis of the ToGA study showed that IHC score 0/1?
patients with ERBB2 amplification did not benefit from
trastuzumab-based chemotherapy [5]. Therefore, in this
study, HER2 overexpression was defined as either IHC
score 3? or IHC score 2? with DISH positivity.
Evaluation of PTEN expression
The evaluation of PTEN expression was performed by IHC
with a PTEN monoclonal antibody (clone 138G6, #9559,
Cell Signaling Technology, Danvers, MA, USA; diluted
1:200) according to the manufacturer’s protocol. PTEN
IHC was subjectively scored as absent (0) if no
immunostaining was detectable in cancer cells, as weak
(1?) if cytoplasmic staining was low, as moderate (2?) if
cytoplasmic staining was intermediate between weak and
strong, and as strong (3?) if the cytoplasmic staining was
intense (Fig. 1). PTEN loss was determined when there
was negative staining (score 0) of cells in more than 75 %
PTEN loss is associated with a poor response to trastuzumab in HER2-overexpressing gastro-… 417
123

of the tumor as previously reported [12]. A PTEN-positive
status was defined as weak, moderate, or strong staining
(score 1? to 3?) of cells in more than 25 % of the tumor.
Interpretation was performed by two independent observers
(Y.D. and S.M.), and discrepancies were discussed to
obtain a final result.
PIK3CA mutation analysis
Samples from 97 of the 264 patients who underwent sur-
gery before 2004 were not in the appropriate state for
mutational analysis. DNA was successfully extracted from
macrodissected tumor tissue (more than 75 % tumor con-
tent) from the remaining 167 patients, with a NucleoSpin
DNA FFPE XS kit (Macherey–Nagel, Germany) according
to the manufacturer’s instructions. Mutation analysis of the
hot spot regions of PIK3CA (exons 9 and 20) was per-
formed by PCR amplification followed by direct sequenc-
ing with a 3130xl Genetic Analyzer (Applied Biosystems,
USA).
Cell lines, cell culture, and reagents
The human gastric adenocarcinoma cell lines NCI-N87,
AGS, KATO-III, and SNU-1 were purchased from Amer-
ican Type Culture Collection (Manassas, VA, USA), and
the MKN1, MKN45, MKN7, and MKN74 cell lines were
purchased from RIKEN BRC Cell Bank (Ibaraki, Japan).
The human esophageal adenocarcinoma cell lines OE19
and OE33 and the gastric adenocarcinoma cell line HGC-
27 were purchased from the European Collection of Cell
Cultures. All cell lines were cultured in RPMI 1640 med-
ium supplemented with 10 % fetal bovine serum (Life
Technologies, Carlsbad CA, USA), penicillin (100 U/ml)
and streptomycin (100 lg/ml; Life Technologies), and
were incubated at 37 �C in a humidified chamber con-
taining 5 % CO2.
Trastuzumab was kindly provided by Chugai Pharma-
ceutical (Tokyo, Japan) for nonclinical investigations.
Anti-HER2 Affibody� molecule (fluorescein isothio-
cyanate) (ab31891) was purchased from AbCam
Fig. 1 Phosphatase and tensin homolog (PTEN) expression in
gastroesophageal adenocarcinoma specimens. Representative PTEN
scoring by immunohistochemistry. Immunoreactivity of adjacent
stromal cells was used as an internal positive control. a Score 0: no
immunostaining is detectable within the tumor cells. b Score 1: the
immunostaining is weak. c Score 2: the immunostaining is interme-
diate between weak and strong. d Score 3: strong immunostaining.
PTEN loss was defined as negative staining (score 0) of cells in more
than 75 % of the tumor (a), and the specimens in b–d were evaluated
as PTEN positive. Scale bars represent 100 lm
418 Y. Deguchi et al.
123

(Cambridge, MA, USA) for flow cytometry analysis of
membranous HER2 expression.
Small interfering RNA and short hairpin RNA
Two distinct small interfering RNA (siRNA) species tar-
geting PTEN (siPTEN #1, Hs_PTEN_6 FlexiTube siRNA,
SI00301504; siPTEN #2, Hs_PTEN_8 FlexiTube siRNA,
SI03048178) and nonsilencing control siRNA (AllStars
negative control siRNA, SI03650318) were purchased from
Qiagen, and were transfected with use of Lipofectamine
RNAiMAX (Invitrogen Life Technologies, Carlsbad, CA,
USA) according to the manufacturer’s reverse-transfection
protocol. Briefly, siRNA at a final concentration of 3 mM
with Lipofectamine RNAiMAX in Opti-MEM was first
added to wells or dishes and incubated at room temperature
for 30 min, and then cells were seeded. Cells were incu-
bated overnight and the culture medium was changed to
fresh medium or medium containing trastuzumab at 10 lg/
ml.
The control short hairpin RNA (shRNA) vector
(pLKO.1 scrambled shRNA), packaging vector (psPAX2,
plasmid 12260), and envelope vector (pMD2.G, plasmid
12259) were purchased from Addgene (Cambridge, MA,
USA). The shRNA sequences targeting PTEN were made
as the same sequences as the purchased siRNA (shPTEN
#1 as siPTEN #1 and shPTEN #2 as siPTEN #2), and
cloned into pLKO.1 vectors. Lentivirus containing shRNA
constructs was made according to the manufacturer’s pro-
tocol, and cell lines were infected with it. We selected
stable knockdown clones by culturing cells with puromycin
(2 lg/ml) for at least 4 weeks.
Western blotting
Cells were washed with ice-cold phosphate-buffered saline
and lysed in sodium dodecyl sulfate lysis buffer supple-
mented with protease inhibitor cocktail (Nacalai Tesque,
Kyoto, Japan) and phosphatase inhibitor cocktail (Nacalai
Tesque, Kyoto, Japan). The protein concentration was
determined with a bicinchoninic acid protein assay kit
(Thermo Scientific, Rockford IL, USA). A total of 20 lg of
whole cell lysate were subjected to sodium dodecyl sul-
fate–polyacrylamide gel electrophoresis and transferred to
a poly(vinylidene difluoride) membrane (Merck Millipore).
Membranes were probed with specific primary antibodies
against HER2 (polyclonal, #2242), PTEN (clone 138G6,
#9559), pan-Akt (clone C67E7, #4691), phosphorylated
Akt (Ser473, clone D9E, #4060), p44/p42 mitogen-acti-
vated protein kinase [MAPK; extracellular-signal-regulated
kinase (ERK) 1/2] (clone 137F5, #4695), and phosphory-
lated p44/p42 MAPK (ERK1/2) (Thr202/Tyr204, clone
D13.14.4E, #4370) (Cell Signaling Technology, Danvers,
MA, USA) and with horseradish peroxidase (HRP)-con-
jugated secondary antibody (Dako). HRP-conjugated b-
actin antibody (Sigma) was used as a loading control.
Bands were visualized with use of a Pierce Western blot-
ting substrate kit (Thermo Scientific).
Cell viability and cell growth inhibition assay
The cell viability was measured by the WST-8 colorimetric
assay [Cell Counting Kit-8 (CCK-8); Dojindo, Kumamoto,
Japan]. Exponentially growing cells (2 9 103–10 9 103/
100 ll/well) were seeded in triplicate into 96-well plates.
The cells were not treated with trastuzumab or were treated
with trastuzumab for 72 h, and 10 ll of CCK-8 was added
to each well and the plates were further incubated for 3 h.
The absorbance at 450 and 600 nm was measured with a
GloMax-Multi detection system (Promega) to calculate the
number of viable cells in each well. Cell growth inhibition
(%) was calculated with the following formula: [1 - ex-
perimental absorbance (treated well)/control absorbance
(untreated well)] 9 100.
Apoptosis assay
Exponentially growing cells (5 9 103–10 9 103/100 ll/
well) were plated in triplicate in 96-well plates. The cells
were not treated with trastuzumab or were treated with
trastuzumab for 72 h, and caspase 3/7 activity was mea-
sured with a Caspase-Glo 3/7 assay kit (Promega)
according to the manufacturer’s protocol. Luminescence
was measured with the GloMax-Multi detection system
(Promega). Caspase activity was normalized to the cell
number obtained from the CCK-8 assay performed simul-
taneously under the same conditions [13].
Cell cycle analysis
The cells were dissociated with trypsin/EDTA, washed
with phosphate-buffered saline, and fixed with ice-cold
70 % ethanol at -20 �C overnight. The cells were treated
with ribonuclease I (Nacalai Tesque) for 10 min at 37 �Cto digest RNA and were stained with propidium iodide
(100 lg/ml; Sigma). The cells were analyzed by flow
cytometry (BD AccuriTM C6 flow cytometer).
Xenograft experiments
Six-week-old female KSN/slc athymic nude mice (Japan
SLC, Shizuoka, Japan) were maintained under specific
pathogen-free conditions. A total of 3 9 106 scrambled or
stable PTEN-knockdown OE19 cells in 100 ll of phos-
phate-buffered saline were injected subcutaneously into
three or four points on the back. Treatment with
PTEN loss is associated with a poor response to trastuzumab in HER2-overexpressing gastro-… 419
123

intraperitoneal injection of trastuzumab (30 mg/kg as a
loading dose, then 15 mg/kg weekly) or normal saline was
started 2 weeks after inoculation, when tumors became
palpable and measurable. The tumor volume was estimated
by the following formula: 0.5 9 L 9 W 9 W, where L is
length and W is width. The experiments were approved by
the institutional Animal Ethics and Research Committee
(MedKyo15513).
Statistical analysis
All values were expressed as the mean ± standard devia-
tion. All in vitro experiments were repeated at least three
times. Statistical analyses were performed with JMP Pro 11
(SAS). Student’s t test was used to compare continuous
variables. Dunnett’s test was used for multiple compar-
isons. Categorical variables were analyzed by Fisher’s
exact test. Differences were considered statistically sig-
nificant at a p value less than 0.05.
Results
PTEN loss is frequent whereas PIK3CA mutation is
rare in HER2-overexpressing GEA
The expression/amplification of HER2, expression of
PTEN, and mutations of the PIK3CA gene were screened in
264 patients with GEA. The characteristics of the screening
cohort are shown in Table 1. The IHC scores for HER2
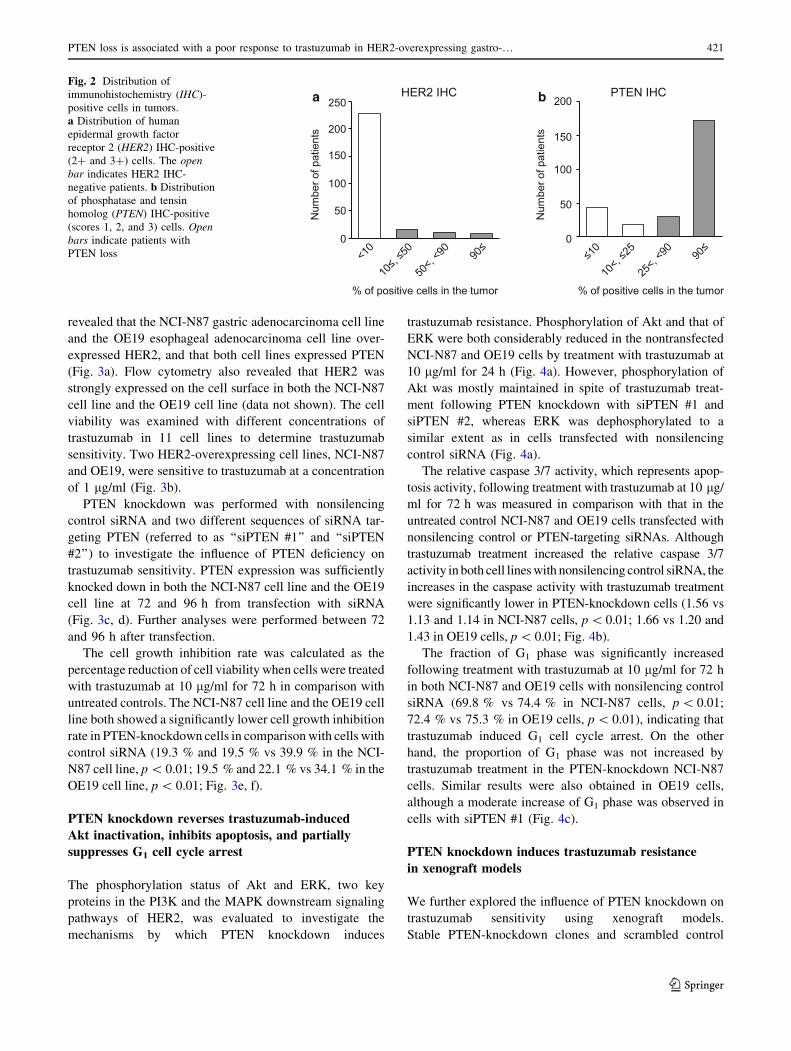
were 3? in 22 patients and 2? in 13 patients. A hetero-
geneous expression pattern of HER2 was often observed
(Fig. 2a). DISH was positive in 7 of the 13 IHC score 2?
patients. Therefore, 29 tumors (11.0 %) were defined as
positive for HER2 overexpression (IHC score 3?, or IHC
score 2? and DISH positive; Table 1).
Expression of PTEN was evaluated by IHC with use of
the scoring system described in ‘‘Materials and methods’’
(Fig. 1). PTEN loss was found in 62 patients (23.5 %;
Table 1). Homogeneous expression of PTEN (90 % or
more of tumor cells) was observed in most PTEN-positive
cases (Fig. 2b).
The mutation status of the PIK3CA gene was success-
fully evaluated in 167 patients, and 17 PIK3CA mutations
were identified in 16 patients (9.6 %; Table 1): 6 mutations
in exon 9 (E545K in five cases and E545A in one case),
and 11 mutations in exon 20 (H1047R). One patient had
mutations in both exon 9 and exon 20. A comparison of the
frequency of these alterations in relation to HER2 status
revealed that the incidence of PTEN loss was higher in
HER2-overexpressing tumors than in HER2-negative
tumors, although the difference was not significant (34.5 %
vs 22.1 %, p = 0.163, Fisher’s exact test; Table 1). On the
other hand, PIK3CA mutation was less frequent in both
HER2-overexpressing tumors and HER2-negative tumors
(5.6 % vs 10.1 %, p = 1.000, Fisher’s exact test; Table 1).
PTEN knockdown induces trastuzumab resistance
in trastuzumab-sensitive cell lines
The screening data suggested that PTEN loss is clinically
more relevant in comparison with PIK3CA mutation.
Therefore, we focused on PTEN deficiency, since this
might have a major impact on trastuzumab resistance in
GEA. Nine gastric and two esophageal adenocarcinoma
cell lines were screened to evaluate HER2 and PTEN
expression and trastuzumab sensitivity. Western blotting
Table 1 Characteristics of patients and tumors based on human
epidermal growth factor receptor 2 (HER2) status
Variables HER2 overexpression
Positive (n = 29) Negative (n = 235)
Age
Median (range) 75 (54–87) 69 (29–89)
Sex
Male 26 (89.7 %) 155 (66.0 %)
Female 3 (10.3 %) 80 (34.0 %)
Tumor location
GE junction 3 (10.3 %) 18 (7.7 %)
Stomach 26 (89.7 %) 217 (92.3 %)
Lauren classification
Intestinal 22 (75.9 %) 79 (33.6 %)
Diffuse 1 (3.4 %) 128 (54.5 %)
Mixed 6 (20.7 %) 28 (11.9 %)
pT category
2 11 (37.9 %) 89 (37.9 %)
3 12 (41.4 %) 85 (36.2 %)
4 6 (20.7 %) 61 (26.0 %)
pN category
0 7 (24.1 %) 93 (39.6 %)
1–3 22 (75.9 %) 142 (60.4 %)
pTNM stage
I 3 (10.3 %) 53 (22.6 %)
II 15 (51.7 %) 89 (37.9 %)
III 11 (37.9 %) 93 (39.6 %)
PTEN expression
Loss 10 (34.5 %) 52 (22.1 %)
Positive 19 (65.5 %) 183 (77.9 %)
PIK3CA mutation
Present 1 (5.6 %)a 15 (10.1 %)a
Absent 17 (94.4 %)a 134 (89.9 %)a
Not evaluable 11 86
GE gastroesophageal, PTEN phosphatase and tensin homologa Percentage in evaluable samples
420 Y. Deguchi et al.
123
revealed that the NCI-N87 gastric adenocarcinoma cell line
and the OE19 esophageal adenocarcinoma cell line over-
expressed HER2, and that both cell lines expressed PTEN
(Fig. 3a). Flow cytometry also revealed that HER2 was
strongly expressed on the cell surface in both the NCI-N87
cell line and the OE19 cell line (data not shown). The cell
viability was examined with different concentrations of
trastuzumab in 11 cell lines to determine trastuzumab
sensitivity. Two HER2-overexpressing cell lines, NCI-N87
and OE19, were sensitive to trastuzumab at a concentration
of 1 lg/ml (Fig. 3b).
PTEN knockdown was performed with nonsilencing
control siRNA and two different sequences of siRNA tar-
geting PTEN (referred to as ‘‘siPTEN #1’’ and ‘‘siPTEN
#2’’) to investigate the influence of PTEN deficiency on
trastuzumab sensitivity. PTEN expression was sufficiently
knocked down in both the NCI-N87 cell line and the OE19
cell line at 72 and 96 h from transfection with siRNA
(Fig. 3c, d). Further analyses were performed between 72
and 96 h after transfection.
The cell growth inhibition rate was calculated as the
percentage reduction of cell viability when cells were treated
with trastuzumab at 10 lg/ml for 72 h in comparison with
untreated controls. The NCI-N87 cell line and the OE19 cell
line both showed a significantly lower cell growth inhibition
rate in PTEN-knockdown cells in comparison with cells with
control siRNA (19.3 % and 19.5 % vs 39.9 % in the NCI-
N87 cell line, p\ 0.01; 19.5 % and 22.1 % vs 34.1 % in the
OE19 cell line, p\ 0.01; Fig. 3e, f).
PTEN knockdown reverses trastuzumab-induced
Akt inactivation, inhibits apoptosis, and partially
suppresses G1 cell cycle arrest
The phosphorylation status of Akt and ERK, two key
proteins in the PI3K and the MAPK downstream signaling
pathways of HER2, was evaluated to investigate the
mechanisms by which PTEN knockdown induces
trastuzumab resistance. Phosphorylation of Akt and that of
ERK were both considerably reduced in the nontransfected
NCI-N87 and OE19 cells by treatment with trastuzumab at
10 lg/ml for 24 h (Fig. 4a). However, phosphorylation of
Akt was mostly maintained in spite of trastuzumab treat-
ment following PTEN knockdown with siPTEN #1 and
siPTEN #2, whereas ERK was dephosphorylated to a
similar extent as in cells transfected with nonsilencing
control siRNA (Fig. 4a).
The relative caspase 3/7 activity, which represents apop-
tosis activity, following treatment with trastuzumab at 10 lg/
ml for 72 h was measured in comparison with that in the
untreated control NCI-N87 and OE19 cells transfected with
nonsilencing control or PTEN-targeting siRNAs. Although
trastuzumab treatment increased the relative caspase 3/7
activity in both cell lines with nonsilencing control siRNA, the
increases in the caspase activity with trastuzumab treatment
were significantly lower in PTEN-knockdown cells (1.56 vs
1.13 and 1.14 in NCI-N87 cells, p\0.01; 1.66 vs 1.20 and
1.43 in OE19 cells, p\ 0.01; Fig. 4b).
The fraction of G1 phase was significantly increased
following treatment with trastuzumab at 10 lg/ml for 72 h
in both NCI-N87 and OE19 cells with nonsilencing control
siRNA (69.8 % vs 74.4 % in NCI-N87 cells, p\ 0.01;
72.4 % vs 75.3 % in OE19 cells, p\ 0.01), indicating that
trastuzumab induced G1 cell cycle arrest. On the other
hand, the proportion of G1 phase was not increased by
trastuzumab treatment in the PTEN-knockdown NCI-N87
cells. Similar results were also obtained in OE19 cells,
although a moderate increase of G1 phase was observed in
cells with siPTEN #1 (Fig. 4c).
PTEN knockdown induces trastuzumab resistance
in xenograft models
We further explored the influence of PTEN knockdown on
trastuzumab sensitivity using xenograft models.
Stable PTEN-knockdown clones and scrambled control
0
50
100
150
200
250
0 - 9 10 - 50 51 - 89 90 - 100
HER2 IHC
0
50
100
150
200
0-10 11 - 25 26-89 90-100
PTEN IHCba
Num
ber o
f pat
ient
s
250
150
200
100
50
0
150
200
100
50
0
Num
ber o
f pat
ient
s
% of positive cells in the tumor % of positive cells in the tumor
Fig. 2 Distribution of
immunohistochemistry (IHC)-
positive cells in tumors.
a Distribution of human
epidermal growth factor
receptor 2 (HER2) IHC-positive
(2? and 3?) cells. The open
bar indicates HER2 IHC-
negative patients. b Distribution
of phosphatase and tensin
homolog (PTEN) IHC-positive
(scores 1, 2, and 3) cells. Open
bars indicate patients with
PTEN loss
PTEN loss is associated with a poor response to trastuzumab in HER2-overexpressing gastro-… 421
123

clones were established by lentiviral infection of shRNAs
and puromycin selection in NCI-N87 and OE19 cells. The
PTEN expression was sufficiently knocked down in OE19
cells (Fig. 5a), whereas the PTEN knockdown was not
sufficient in NCI-N87 cells (data not shown). The
scrambled control OE19 cells or stable PTEN-knockdown
OE19 cells (referred to as shPTEN #1 and shPTEN #2)
were inoculated subcutaneously, and treatment with
intraperitoneal injection of normal saline or trastuzumab
(30 mg/kg loading dose followed by 15 mg/kg weekly)
0
20
40
60
80
100
120
0.1 1 10 100
MKN74
KATO3
MKN45
SNU1
MKN7
MKN1
OE19
N87
HGC27
AGS
MKN74
KATO III
MKN45
SNU1
MKN7
MKN1
OE33
OE19
NCI-N87
HER2
ACTB
PTEN
Gastric adenocarcinoma Esophageal adenocarcinoma
a
c dNCI-N87 OE19
24hrs
HER2
ACTB
PTEN
0 1 10 100Trastuzumab concentration ( g/ml)
b
Cel
l Via
bilit
y (%
of c
ontro
l)
100
80
60
120
0
40
20
Nt Ns #1 #2siPTEN
0
10
20
30
40
50
n.c. si #1 si #2
NCI-N87
0
10
20
30
40
50
n.c. si #1 si #2
OE19fe
* *
Ns
siPTEN
#1 #2
50
40
30
20
10
0Gro
wth
Inhi
bitio
n (%
of u
ntre
ated
)
HER2
ACTB
PTEN
48hrs
Ns #1 #2siPTEN
72hrs
Ns #1 #2siPTEN
96hrs
Ns #1 #2siPTEN
24hrs
Nt Ns #1 #2siPTEN
48hrs
Ns #1 #2siPTEN
72hrs
Ns #1 #2siPTEN
96hrs
Ns #1 #2siPTEN
* *
Ns
siPTEN
#1 #2
50
40
30
20
10
0Gro
wth
Inhi
bitio
n (%
of u
ntre
ated
)
Fig. 3 Phosphatase and tensin homolog (PTEN) knockdown induces
trastuzumab resistance in trastuzumab-sensitive cell lines. a Western
blotting analyses of human epidermal growth factor receptor 2
(HER2) and PTEN in nine gastric adenocarcinoma cell lines and two
esophageal adenocarcinoma cell lines. b Cell viability assays with
increasing concentration of trastuzumab exposure for 72 h in 11 cell
lines. PTEN knockdown was performed with two distinct small
interfering RNA (siRNAs) targeting PTEN (siPTEN #1 and siPTEN
#2), and the PTEN expression was analyzed by Western blotting at
the indicated time points after transfection in the NCI-N87 cell line
(c) and the OE19 cell line (d). Cells transfected with nonsilencing
control siRNA (Ns), siPTEN #1, or siPTEN #2 were treated with
trastuzumab (10 lg/ml) for 72 h in the NCI-N87 cell line (e) and the
OE19 cell line (f). Growth inhibition rates were calculated as the
percentage reduction of the cell viability in comparison with the
untreated controls. Asterisk p\ 0.01, ACTB b-actin, Nt nontrans-
fected control
422 Y. Deguchi et al.
123

was started 2 weeks after inoculation, when tumors became
palpable and measurable. Representative images of the
xenograft tumors with normal saline treatment or trastu-
zumab treatment are shown in Fig. 5b and c respectively.
The tumor volume in the scrambled control tumors was
significantly decreased in response to trastuzumab treat-
ment in comparison with normal saline treatment (Fig. 5d;
p = 0.035). In contrast, the proliferation of the tumors
derived from PTEN-knockdown cells was not suppressed
by trastuzumab treatment (Fig. 5e, f; p = 0.200 and
p = 0.886). HER2 expression and PTEN expression in
xenograft tumor tissues after trastuzumab treatment were
evaluated by IHC (Fig. 5g). Expression of both HER2 and
PTEN was homogeneous in these tissues. HER2 expression
was similar among scrambled control tumors and PTEN-
knockdown tumors, whereas PTEN expression was strong
in scrambled control tumors and negative in PTEN-
knockdown tumors.
Patients with PTEN loss show a poor response
to trastuzumab-based therapy
We further investigated the clinical significance of PTEN
loss in trastuzumab therapy for GEA in the investigation
cohort. Twenty-three patients who received trastuzumab-
based therapy were examined. Nineteen of those patients
were treated with capecitabine and cisplatin with trastu-
zumab, three patients were treated with S-1 and cisplatin
with trastuzumab, and one patient was treated with cape-
citabine with trastuzumab. Table 2 shows that PTEN loss
phospho-Akt
total-Akt
phospho-ERK
total-ERK
a
b
c
Trastuzumab - + - + - + - +
0
20
40
60
80
si NC si#1 si#2
NCI-N87
0
20
40
60
80
si NC si#1 si#2
OE19
0
0.5
1
1.5
2
N.C. si #1 si #2
NCI-N87
0
0.5
1
1.5
2
N.C. si #1 si #2
OE192.0
1.5
1.0
0.5
0Rel
ativ
e ca
spas
e 3/
7 ac
tivity
Ns
siPTEN
#1 #2
*Trastuzumab (-)Trastuzumab (+)
Trastuzumab (-)Trastuzumab (+)
Nt
NCI-N87
Ns #1 #2siPTEN
- + - + - + - +Nt
OE19
Ns #1 #2siPTEN
* *2.0
1.5
1.0
0.5
0Rel
ativ
e ca
spas
e 3/
7 ac
tivity
Ns
siPTEN
#1 #2
* *
80
60
40
20
0Perc
enta
ge o
f G1
phas
e (%
)
Ns
siPTEN
#1 #2
*80
60
40
20
0Perc
enta
ge o
f G1
phas
e (%
)
Ns
siPTEN
#1 #2
*
Fig. 4 Phosphatase and tensin
homolog (PTEN) knockdown
reverses trastuzumab-induced
Akt suppression, apoptosis, and
G1 cell cycle arrest. a Western
blotting analyses evaluating the
influence of PTEN knockdown
on phosphorylation of Akt and
extracellular-signal-regulated
kinase (ERK). Nontransfected
control cells and cells
transfected with nonsilencing
small interfering RNA (siRNA),
siPTEN #1, or siPTEN #2 were
not treated with trastuzumab or
were treated with trastuzumab at
10 lg/ml for 24 h. b Cells
transfected with nonsilencing
siRNA, siPTEN #1, or siPTEN
#2 were not treated with
trastuzumab or were treated
with trastuzumab at 10 lg/ml
for 72 h. The caspase 3/7
activity was measured with a
Caspase-Glo 3/7 assay kit. The
relative caspase 3/7 activity of
trastuzumab-treated cells in
comparison with that of
untreated cells was calculated in
each cell line. c Flow cytometry
analysis detecting the
distribution of G1 phase in the
cell cycle. Cells transfected with
nonsilencing siRNA, siPTEN
#1, or siPTEN #2 were not
treated with trastuzumab or
were treated with trastuzumab at
10 lg/ml for 72 h. Asterisk
p\ 0.01, Ns nonsilencing
siRNA, Nt nontransfected
control
PTEN loss is associated with a poor response to trastuzumab in HER2-overexpressing gastro-… 423
123

was found in five patients. None of these five patients with
PTEN loss showed an objective clinical response to tras-
tuzumab-based therapy. On the other hand, 9 of 18 PTEN-
positive patients (50 %) responded to the trastuzumab-
based therapy, including one complete response and eight
partial responses, although the difference in the response
was not statistically significant between PTEN-loss patients
and PTEN-positive patients (Table 2, p = 0.142).
Discussion
Trastuzumab has significantly improved survival in
patients with HER2-overexpressing GEA [5]. However, a
limited response and resistance to trastuzumab-based
therapy remain as obstacles. Only a few reports have
examined the relationship between PTEN loss and trastu-
zumab resistance in gastric cancer [14–16], although PI3K
OE19
scra
mbl
e
shPT
EN#1
shPT
EN#2
a
PTEN
HER2
ACTB
b c
0
1000
2000
3000
0 1 2 3
scrscr
0
1000
2000
3000
0 1 2 3
#6#6
0
1000
2000
3000
0 1 2 3
#8#8
fed
1cm1cm
shPTEN #1 shPTEN #2
NS (n=7)
Trastuzumab (n=7)
0 1 2 3weeks
scramble
2000
1000
0
3000
Tum
or S
ize
(mm
3 )
**
NS (n=7)
Trastuzumab (n=7)
0 1 2 3weeks
2000
1000
0
3000
Tum
or S
ize
(mm
3 )
NS (n=6)
Trastuzumab (n=6)
0 1 2 3weeks
2000
1000
0
3000
Tum
or S
ize
(mm
3 )
gScramble shPTEN #1 shPTEN #2
HER2
PTEN
Fig. 5 Phosphatase and tensin homolog (PTEN) knockdown induces
trastuzumab resistance in xenograft models. a Stable PTEN-knock-
down clones were selected and the PTEN expression was evaluated
by Western blotting. Representative images of the xenograft model in
intraperitoneal normal saline injection mice (b) and in intraperitoneal
trastuzumab (30 mg/kg loading dose followed by 15 mg/kg weekly)
injection mice (c). Arrowheads represent tumors with scrambled
control, white arrows and black arrows represent tumors with
shPTEN #1 and shPTEN #2 respectively. Scale bars represent 1 cm.
Tumor growth curves of xenografts derived from cells with scrambled
control (d), shPTEN #1 (e), and shPTEN #2 (f). Mice were treated
with weekly intraperitoneal injection of normal saline or trastuzumab.
The data represent the mean tumor volume plus the standard
deviation. g human epidermal growth factor receptor 2 (HER2) and
PTEN immunohistochemistry images of scrambled control, shPTEN
#1, and shPTEN #2 xenograft tumor specimens after trastuzumab
treatment. In PTEN IHC, immunoreactivity of adjacent stromal cells
was used as an internal positive control. Scale bars represent 100 lm.
Two asterisks p\ 0.05, ACTB b-actin, NS normal saline
424 Y. Deguchi et al.
123

pathway alteration, including PTEN loss, is well known as
an inducer of trastuzumab resistance in breast cancer [7–9].
The current study is the first to comprehensively investi-
gate the impact of PTEN deficiency on trastuzumab
response in HER2-overexpressing esophageal
adenocarcinoma.
The current screening for PTEN loss and PIK3CA gene
mutations, which involve two major aberrations of the
PI3K pathway, revealed that 23.5 % of patients showed
PTEN loss and 9.6 % showed PIK3CA mutations in a
cohort of 264 curatively resected GEA patients. These
findings are consistent with those of previous reports in
gastric cancer (11–21.5 % with PTEN loss [17–19] and
2.5–15.9 % with PIK3CA mutations [18, 20–22]). More
importantly, as many as 34.5 % of patients with HER2
overexpression who are thought to be candidates for tras-
tuzumab therapy showed PTEN loss, whereas PIK3CA
mutations were found in only 5.6 % of these patients.
These data suggest the potential importance of PTEN loss
in affecting the response to trastuzumab-based therapy in
GEA.
Zaitsu et al. [19] showed that loss of heterozygosity of
PTEN, which results in PTEN deficiency, was associated
with HER2 overexpression. However, some reports have
shown that loss of PTEN expression or deletion of the
PTEN gene is rarely found (3.7–5.3 %) in HER2-overex-
pressing gastric cancer [23, 24]. The discrepancy in these
results might be due to variations in the definition of PTEN
loss. Thus, a validated standard definition of PTEN loss
may be required to evaluate the influence of PTEN
expression on the response to trastuzumab therapy.
HER2 expression in GEA is often heterogeneous, as we
have previously reported [11]. Although HER2 expression
was also highly heterogeneous in the current screening
cohort, PTEN expression was relatively homogeneous
(Fig. 2). A previous study also found that PTEN deletion
was often homogeneous in gastric cancer [24]. Given the
homogeneous distribution of PTEN-negative cells in GEA,
evaluation of PTEN expression in a biopsy specimen will
likely be a reliable method for evaluation of PTEN loss.
Trastuzumab suppresses the HER2 signaling of both the
PI3K pathway and the MAPK pathway, and thus induces
apoptosis and G1 cell cycle arrest, which contribute to the
antiproliferative effect [25]. The current study showed that
the cell growth inhibition by trastuzumab was significantly
suppressed in PTEN-knockdown cells, in which Akt
remained phosphorylated despite trastuzumab treatment,
and trastuzumab-induced apoptosis and G1 cell cycle arrest
were both prevented. These findings suggest that consti-
tutively activated Akt by PTEN knockdown leads to cell
survival and cell proliferation by inhibiting apoptosis and
G1 cell cycle arrest, resulting in trastuzumab resistance.
The importance of the inhibition of the PI3K pathway on
the antitumor effect of trastuzumab should be different
among different cell types, because trastuzumab can act via
multiple mechanisms. These could explain why the degree
of cell cycle inhibition by trastuzumab and its recovery by
PTEN knockdown was slightly different between NCI-N87
and OE19 cells. Although G1 cell cycle arrest by trastu-
zumab was not completely restored by PTEN knockdown
in OE19 cells in vitro, the antiproliferative effect of tras-
tuzumab was completely abrogated by PTEN knockdown
in xenograft models. These results imply that Akt activa-
tion by PTEN loss indeed plays a major role in the
acquisition of resistance to trastuzumab in vivo.
The current clinical data indicate that patients with GEA
with PTEN loss have a limited response to trastuzumab-
based therapy. Zhang et al. [14] recently examined 48
gastric cancer patients with HER2 overexpression who
clinically received anti-HER2 therapy (39 patients received
trastuzumab therapy and 9 patients received lapatinib
therapy), and showed that patients with PTEN loss had
shorter progression-free survival than those with PTEN
positivity in gastric cancer. These results and the current
data support the finding that PTEN deficiency contributes
to trastuzumab resistance.
The current study has several limitations. First, since the
clinical data were retrospectively examined and the sample
size was small, the results are only preliminary. However,
of note, the findings from our functional experiments
suggested that PTEN deficiency contributed to trastuzumab
resistance through PI3K pathway activation in GEA cell
lines. Second, we did not investigate the influence of PTEN
knockdown on the combined effects of trastuzumab and
other chemotherapeutic drugs, although trastuzumab is
clinically approved for use in combination with other drugs
for treatment of HER2-overexpressing GEA. However,
several studies have shown that PTEN deficiency is also
associated with increased resistance to multiple
chemotherapeutic agents [16, 26]. Collectively, PTEN loss
could be a clinically valuable biomarker of resistance to
trastuzumab-based chemotherapy in GEA. It has been
suggested that combination therapy with PI3K inhibitors
Table 2 Phosphatase and tensin homolog (PTEN) expression and
objective response to trastuzumab
Objective response PTEN expression pa
Positive (n = 18) Loss (n = 5)
Complete response 1 0 0.142
Partial response 8 0
Stable disease 7 5
Progressive disease 2 0
a Fisher’s exact test
PTEN loss is associated with a poor response to trastuzumab in HER2-overexpressing gastro-… 425
123

might be helpful in overcoming PTEN-loss-mediated
trastuzumab resistance in GEA [16] and in breast cancer
[7, 27, 28]. These present and previous results suggest that
patients with HER2-overexpressing GEA and PTEN loss
might require alternative therapy to trastuzumab therapy,
or combination therapy with PI3K inhibitors.
In conclusion, HER2-overexpressing GEA includes a
considerable subset of patients with PTEN loss, and this is
closely associated with a poor response to trastuzumab-
based therapy. Further prospective studies are required to
validate the predictive value of PTEN loss in trastuzumab-
based therapy for patients with HER2-overexpressing
GEA.
Acknowledgments We are grateful to Takahiro Horie for technical
assistance in producing short hairpin RNA vectors, and Hiroyuki
Shirahase for pathology technical support. We thank Chugai Phar-
maceutical Co. Ltd for kindly providing trastuzumab. This work was
supported by Japan Society for the Promotion of Science KAKENHI
grant no. 24591940.
Compliance with ethical standards
Human rights statement and informed consent All procedures
followed were in accordance with the ethical standards of the
responsible committee on human experimentation (institutional and
national) and with the Helsinki Declaration of 1964 and later versions.
Informed consent was obtained from all patients for their being
included in the study.
Animal studies All institutional and national guidelines for the care
and use of laboratory animals were followed.
Conflict of interest The authors declare that they have no conflict of
interest.
References
1. Ferlay J, Soerjomataram I, Dikshit R, Eser S, Mathers C, Rebelo
M, et al. Cancer incidence and mortality worldwide: sources,
methods and major patterns in GLOBOCAN 2012. Int J Cancer.
2015;136(5):E359–86.
2. Yamada Y, Higuchi K, Nishikawa K, Gotoh M, Fuse N, Sugi-
moto N, et al. Phase III study comparing oxaliplatin plus S-1 with
cisplatin plus S-1 in chemotherapy-naive patients with advanced
gastric cancer. Ann Oncol. 2015;26(1):141–8.
3. Shah MA. Update on metastatic gastric and esophageal cancers.
J Clin Oncol. 2015;33(16):1760–9.
4. Rubenstein JH, Shaheen NJ. Epidemiology, diagnosis, and
management of esophageal adenocarcinoma. Gastroenterology.
2015;149(2):302–17.
5. Bang YJ, Van Cutsem E, Feyereislova A, Chung HC, Shen L,
Sawaki A, et al. Trastuzumab in combination with chemotherapy
versus chemotherapy alone for treatment of HER2-positive
advanced gastric or gastro-oesophageal junction cancer (ToGA):
a phase 3, open-label, randomised controlled trial. Lancet.
2010;376(9742):687–97.
6. Ades F, Zardavas D, Pinto AC, Criscitiello C, Aftimos P, de
Azambuja E. Cardiotoxicity of systemic agents used in breast
cancer. Breast. 2014;23(4):317–28.
7. Nagata Y, Lan KH, Zhou X, Tan M, Esteva FJ, Sahin AA, et al.
PTEN activation contributes to tumor inhibition by trastuzumab,
and loss of PTEN predicts trastuzumab resistance in patients.
Cancer Cell. 2004;6(2):117–27.
8. Berns K, Horlings HM, Hennessy BT, Madiredjo M, Hijmans
EM, Beelen K, et al. A functional genetic approach identifies the
PI3K pathway as a major determinant of trastuzumab resistance
in breast cancer. Cancer Cell. 2007;12(4):395–402.
9. Nahta R, Yu D, Hung MC, Hortobagyi GN, Esteva FJ. Mecha-
nisms of disease: understanding resistance to HER2-targeted
therapy in human breast cancer. Nat Clin Pract Oncol.
2006;3(5):269–80.
10. Eisenhauer EA, Therasse P, Bogaerts J, Schwartz LH, Sargent D,
Ford R, et al. New response evaluation criteria in solid tumours:
revised RECIST guideline (version 1.1). Eur J Cancer.
2009;45(2):228–47.
11. Kataoka Y, Okabe H, Yoshizawa A, Minamiguchi S, Yoshimura
K, Haga H, et al. HER2 expression and its clinicopathological
features in resectable gastric cancer. Gastric Cancer.
2013;16(1):84–93.
12. Bettstetter M, Berezowska S, Keller G, Walch A, Feuchtinger A,
Slotta-Huspenina J, et al. Epidermal growth factor receptor,
phosphatidylinositol-3-kinase catalytic subunit/PTEN, and
KRAS/NRAS/BRAF in primary resected esophageal adenocar-
cinomas: loss of PTEN is associated with worse clinical outcome.
Hum Pathol. 2013;44(5):829–36.
13. Hartojo W, Silvers AL, Thomas DG, Seder CW, Lin L, Rao H,
et al. Curcumin promotes apoptosis, increases chemosensitivity,
and inhibits nuclear factor jB in esophageal adenocarcinoma.
Transl Oncol. 2010;3(2):99–108.
14. Zhang X, Park JS, Park KH, Kim KH, Jung M, Chung HC, et al.
PTEN deficiency as a predictive biomarker of resistance to
HER2-targeted therapy in advanced gastric cancer. Oncology.
2015;88(2):76–85.
15. Eto K, Iwatsuki M, Watanabe M, Ida S, Ishimoto T, Iwagami S,
et al. The microRNA-21/PTEN pathway regulates the sensitivity
of HER2-positive gastric cancer cells to trastuzumab. Ann Surg
Oncol. 2014;21(1):343–50.
16. Zuo Q, Liu J, Zhang J, Wu M, Guo L, Liao W. Development of
trastuzumab-resistant human gastric carcinoma cell lines and
mechanisms of drug resistance. Sci Rep. 2015;5:11634.
17. Cho YJ, Kim JH, Yoon J, Cho SJ, Ko YS, Park JW, et al.
Constitutive activation of glycogen synthase kinase-3b correlates
with better prognosis and cyclin-dependent kinase inhibitors in
human gastric cancer. BMC Gastroenterol. 2010;10:91.
18. Okines AF, Gonzalez de Castro D, Cunningham D, Chau I,
Langley RE, Thompson LC, et al. Biomarker analysis in
oesophagogastric cancer: results from the REAL3 and Trans-
MAGIC trials. Eur J Cancer. 2013;49(9):2116–25.
19. Zaitsu Y, Oki E, Ando K, Ida S, Kimura Y, Saeki H, et al. Loss of
heterozygosity of PTEN (encoding phosphate and tensin homo-
log) associated with elevated HER2 expression is an adverse
prognostic indicator in gastric cancer. Oncology.
2015;88(3):189–94.
20. Barbi S, Cataldo I, De Manzoni G, Bersani S, Lamba S, Mattuzzi
S, et al. The analysis of PIK3CA mutations in gastric carcinoma
and metanalysis of literature suggest that exon-selectivity is a
signature of cancer type. J Exp Clin Cancer Res. 2010;29:32.
21. Li VS, Wong CW, Chan TL, Chan AS, Zhao W, Chu KM, et al.
Mutations of PIK3CA in gastric adenocarcinoma. BMC Cancer.
2005;5:29.
22. Moehler M, Mueller A, Trarbach T, Lordick F, Seufferlein T,
Kubicka S, et al. Cetuximab with irinotecan, folinic acid and
5-fluorouracil as first-line treatment in advanced gastroe-
sophageal cancer: a prospective multi-center biomarker-oriented
phase II study. Ann Oncol. 2011;22(6):1358–66.
426 Y. Deguchi et al.
123

23. Zhang Z, Wang J, Ji D, Wang C, Liu R, Wu Z, et al. Functional
genetic approach identifies MET, HER3, IGF1R, INSR pathways
as determinants of lapatinib unresponsiveness in HER2-positive
gastric cancer. Clin Cancer Res. 2014;20(17):4559–73.
24. Mina S, Bohn BA, Simon R, Krohn A, Reeh M, Arnold D, et al.
PTEN deletion is rare but often homogeneous in gastric cancer.
J Clin Pathol. 2012;65(8):693–8.
25. Nahta R, Esteva FJ. Herceptin: mechanisms of action and resis-
tance. Cancer Lett. 2006;232(2):123–38.
26. Oki E, Baba H, Tokunaga E, Nakamura T, Ueda N, Futatsugi M,
et al. Akt phosphorylation associates with LOH of PTEN and
leads to chemoresistance for gastric cancer. Int J Cancer.
2005;117(3):376–80.
27. O’Brien NA, McDonald K, Tong L, von Euw E, Kalous O,
Conklin D, et al. Targeting PI3K/mTOR overcomes resistance to
HER2-targeted therapy independent of feedback activation of
AKT. Clin Cancer Res. 2014;20(13):3507–20.
28. Lu CH, Wyszomierski SL, Tseng LM, Sun MH, Lan KH, Neal
CL, et al. Preclinical testing of clinically applicable strategies for
overcoming trastuzumab resistance caused by PTEN deficiency.
Clin Cancer Res. 2007;13(19):5883–8.
PTEN loss is associated with a poor response to trastuzumab in HER2-overexpressing gastro-… 427
123