Embed Size (px)
Citation preview
Journal of Business Research xxx (2014) xxx–xxx
JBR-08060; No of Pages 9
Contents lists available at ScienceDirect
Journal of Business Research
PTE, innovation capital and firm value interactions in the biotech medical industry
Shu-Hua Hsiao ⁎Department of Business Administration, University of Kang Ning, No. 188, Sec. 5, An-Chung Rd., Tainan, Taiwan
⁎ Tel.: +886 6 2552500#31100.E-mail address: [email protected].
http://dx.doi.org/10.1016/j.jbusres.2014.04.0010148-2963/© 2014 Elsevier Inc. All rights reserved.
Please cite this article as: Hsiao, S.-H., PTE, insearch (2014), http://dx.doi.org/10.1016/j.jb
a b s t r a c t
a r t i c l e i n f oArticle history:Received 1 April 2013Received in revised form 30 March 2014Accepted 1 April 2014Available online xxxx
Keywords:Innovation capital (IC)Firm value (FV)Pure technical efficiency (PTE)Stock returnsData envelopment analysis (DEA)Resource-based view (RBV)
Unlike previous studies which only focus on the main effect between IC and FV, this research includes PTE withthe gap of resource-based view. IC is a key element in creating a competitive advantage, as it has a great influenceon FV. A company may put relatively less into IC if it demonstrates higher efficiency. However, previous studieshave neglected the fact that relative efficiency and IC affect FV and stock returns directly and indirectly. Theresearch periodwas from2006 to 2010 and themain researchmethods include HRA and DEA. Themain researchfindings include the following. (1) There is a space for improvement in terms of the total technical efficiency.(2) PTE has a significant moderating effect between IC and FV. (3) IC and PTE have a significant influence onFV. (4) Apart from PTE and stock returns, IC and FV show significant differences within the sub-industry.
© 2014 Elsevier Inc. All rights reserved.
1. Introduction
Facing to the global competitive advantage in thebiotechmedical in-dustry, it is necessary to invest in innovation capital (IC) to create firmvalue (FV). However, inefficient performance of IC will postponecompany's progress and the company can be substituted easily by thecompetitors. This study contains the following sections: Introduction,Literature review, Researchmethodology, Research findings, DiscussionandConclusion. The introduction presents researchmotivation andpur-pose. The literature reviewdiscusses relevant papers concerning IC, firmvalue and stock return. The research methodology presents the frame-work, data sources and variables, and statistical analysis methods. Theresearch findings express the results of statistical analysis. Finally, a dis-cussion of the results and implications of this study is contained in theconclusion.
1.1. Research motivation
The future of value creation and whether or not “ShareholdersWealth Maximum” is achievable as a goal are both firm value metrics.FVs are key items of assessmentwhen a company is engaged inmergers,acquisitions, listing on public markets, and other business activities.Taiwanese researcher, Jhing-Fa Wang, considered orange technology
novation capital and firm valusres.2014.04.001
in 2010, which consistsmainly of health technology, happiness technol-ogy, and human care technology (Wang, 2010). Focusing on “Care”, anytechnology relating to “Health, Care” and “Well-being” belongs to or-ange technology. For example, Chalfont and Gibson (2006) state howassistive technology can improve well-being. Scherer, Craddock, andMackeogh (2011) explore the relationship between personal factorsand subjective well-being by using assistive technology devices. Whena country with a lower birth rate transforms into a more elderly society,orange technology plays an increasingly important role. The BiotechMedical Industry is a core development of orange technology. Therefore,it is very important to improve its FV as a biotech & medical company.This is one of the motives of this research.
Due to rapidly changing industrial structures and technological de-velopments, innovations have become more important to maintainlong-term competitive advantages in an age of globalization and mar-ginal profits. Themain characteristic of the BiotechMedical Industry fo-cuses on innovative technology. As such it is generally acknowledged allover the world as a star industry in the 21st century. Andrew and Sirkin(2007) point out that innovation is a prerequisite for business survival.For example, the value of a company's innovative behaviors can becometangible assets, as well as be implied in intangible assets (or intellectualcapital). Bassi and Van Buren (1999) categorize intellectual capital intohuman resources, organization, relationship, and innovation aspects.Meanwhile, “innovation capital” is the most important part of “intellec-tual capital” (Bassi & Van Buren, 1999).
Scholars generally recognize IC as the key success factor in the age ofa knowledge economy. Kalafut and Low (2001) suggest that IC is an in-tangible asset with the greatest influence on a company. A company
ue interactions in the biotech medical industry, Journal of Business Re-
2 S.-H. Hsiao / Journal of Business Research xxx (2014) xxx–xxx
must create good IC to make key contributions to future business per-formance (Canto & Gonzalez, 1999). For example, Apple Inc. launchedthe iPad to stimulate the growth of the tablet computer and wonover many consumers. In High-Tech industries, the growth rate ofR&D apparently has a positive correlation to opening growth rate(Chakrabarti, 1991). Intellectual and social capitals have an importantinfluence on the sustainable business operations of a company. Studieson social capital were conducted by scholars Pérez-Luño, Cabello-Medina, Carmona-Lavado, and Cuevas-Rodríguez (2011), Cooke andWills (1999), and Cooper (2003). Johnson (1999) believes that themar-ket value is made up of financial capital and intelligence capital, and theintelligence capital is usually greater than the financial capital. The coreof intelligence capital is IC. This is the second motive for this research.
However, based on internal static analysis of the resource-basedview (RBV), it emphasizes that heterogeneity resources are unable tobecome the source of permanent super-profit because resources maynot be the source of advantage (Ray, Barney, & Muhanna, 2004;Wernerfelt, 1984). For example, a patent can be regarded as the hetero-geneous resources of the manufacturer, but Aragon-Correa and Sharma(2003) point out that the advantage may cause a different result, evenwith similar resources, since scenario factors of the company are differ-ent. In addition, the RBV also has limitations. The RBV neglects the envi-ronmental analysis and fails to pay sufficient attention to the goal ofmaximization for shareholders (Kroger, Katerkamp, Renneberg, &Cammann, 1998). The shortcomings fail to offer the diagnosed criterionof the competitive power. Gallon, Stillman, and Coates (1995) considerthat core technical competencies are leading development technologywith scientific knowledge. Prahalad andHamel (1990) propose the con-ception of core competencies that can create an enterprise's competitiveadvantage; a manager can promote the value of a firm if he encouragessuperior performance in core competencies.
The patent authority consists of both tangible technical knowledge(static type) and invisible systemic knowledge (dynamic type)(Tallman, Jenkins, Henry, & Pinch, 2004). However, “development”may prove to be a negative activity of performance compensation, be-cause the development of the patent requires continuous cost invest-ment from the enterprise. This means that a high-performance ofinput/output would influence the final FV. Brooking (1996) thinksthat a manager should be able to reach an organization's overall goals,if he focuses on intellectual capital. How much FV is created from ICinvested is influenced by the relative efficiency of input/output. Unfor-tunately thus far there has been insufficient discussion about the influ-ence of IC and PTE on FV.
Morck, Shlerifer, and Vishny (1988), McConnell and Servaes (1990),and Cho (1998) use Tobin's Q to assess FV. Tobin's Q and net value areoften used to measure a company's market performance. Yeh (2005)uses stock returns to measure FV. As a result, FV and stock returnsshould be positively correlated. Therefore, if a company is healthy, itsbusiness performance will be good, FV will increase, and its stockprice will react accordingly (Lin, 2003; Luo, Homburg, & Wieseke,2010).
Data envelopment analysis (DEA) derives from the non-parametricanalysis concept, as proposed by Farell (1957). Subsequently, Charnes,Cooper, and Rhodes (1978) employ the hypothesis of “constant returnsto scale” to develop the CCRmodel. Banker, Charnes, and Cooper (1984)use the “non-fixed production model” to develop the BCC model. TheCCR model can analyze total technical efficiency; whereas the BCCmodel can analyze PTE and scale efficiency. Hence, this study appliesthe BCC model in the computation of PTE. This is also a third motive ofthis research since most previous studies have neglected how the inter-action between IC and PTE may affect FV.
1.2. Research purpose
The research issue is crucial. Lee, Kim, and Kim (2012) reveal thatopen technology innovation activity is important for FV. The innovation
Please cite this article as: Hsiao, S.-H., PTE, innovation capital and firm valsearch (2014), http://dx.doi.org/10.1016/j.jbusres.2014.04.001
research program is one of the most successful public programs to bedesigned (Cooper, 2003). However, there has been little relevant re-search, and this research presents contradictory results. Productivitydoes not provide much meaning for future profitability. Toivanen,Stoneman, and Bosworth (2002) found the flow of “research and devel-opment (R&D)” and the use of new technologies have significant posi-tive impact on market value. Ehie and Olibe (2010) found that R&Dinvestment positively affects company performance. Avnimelech andTeubal (2008) consider R&D to represent the company's innovation.The intensive expense of R&D contributes positively to the stockmarketperformance of manufacturing firms (Riahi-Belkaoui, 1999). Yeh(2005) concluded that stock price is related to FV. The quantity of pat-ents is correlated to operational performance (De Carolis, 2003).
However, Doukas and Switzer (1992), and Sundaram, John, and John(1996) argue that investments in R&D activity have an insignificant in-fluence on the abnormal returns of a company. Riahi-Belkaoui (1999)also found that productivity related to technical efficiency does not pro-vide noteworthy influence on future profitability. Chen (2007) foundthat IC and the quantity of patents are not significantly correlated. Butthe number of patents has an apparent relationship to FV. Thus, ICmight not significantly influence FV.
There are many discussions about intellectual capital in previous re-search. But the scope of intellectual capital is too broad; IC being thecore of intellectual capital. Previous studies focusing on IC are rare andthe moderating effects of PTE are often neglected in such studies. Tsai(2007) also stated that “innovation effects on FV have not been effec-tively discussed.”
Cheng, Kuan, Chuang, and Ken (2010) found that some indicators ofpatent quality are significant to the return of assets. Thus, previous stud-ies demonstrate that ICmight have a significant influence on FV (Deeds,2001). Hence, this is clearly inconsistent with some of the researchdiscussed above. Possible reasons for this are: (1) different industrieswith different characteristics (e.g. firm scale and establishment days);(2) lack of consideration of the moderating effects of the interactionbetween PTE and IC. Higher technical efficiency may reduce inputresources. In addition, IC is only one kind of intellectual capital.Edvinsson and Malone (1997) point out that there are no equationswhich could cover all the measurement methods of intellectual capital,and certain measurement methods can only be applied to certain typesof companies. Therefore, the results of this study are relatively crediblesince it has considered the characteristics of the industry.
This study discusses the effect of Biotech-Medical Industry's IC andPTE on the correlation between FV and stock returns including: Themain effect of IC and PTE on FV (or stock returns). The research goalsare summarized as follows: (1) To discuss whether or not IC and PTEcan improve FV. (2) To explore whether IC, PTE, and FV are significantlydifferent in different sub-industries. (3) To discuss the contingent influ-ence of PTE on IC and FV and stock returns. (4) To understand the cor-relation between IC, PTE, FV and stock returns.
2. Literature review
A contingency view means that two or more independent variablesinteract, and thus, have significant impact on dependent variables(Aiken &West, 1991). The relevant literature of this research is consid-ered as follows.
2.1. Pure technical efficiency of DEA
D'Alvano and Hidalgo (2012) propose that service markets are be-coming global and competitive. Thus more complex technology andmore innovation management tools are required. Data envelopmentanalysis (DEA) was first derived by Farrell (1957). DEA measures therelative efficiency of various companies by using the overall proportionof input and output as production efficiency indicators after envelopingall possible best solutions, namely, efficiency frontier and companies of
ue interactions in the biotech medical industry, Journal of Business Re-
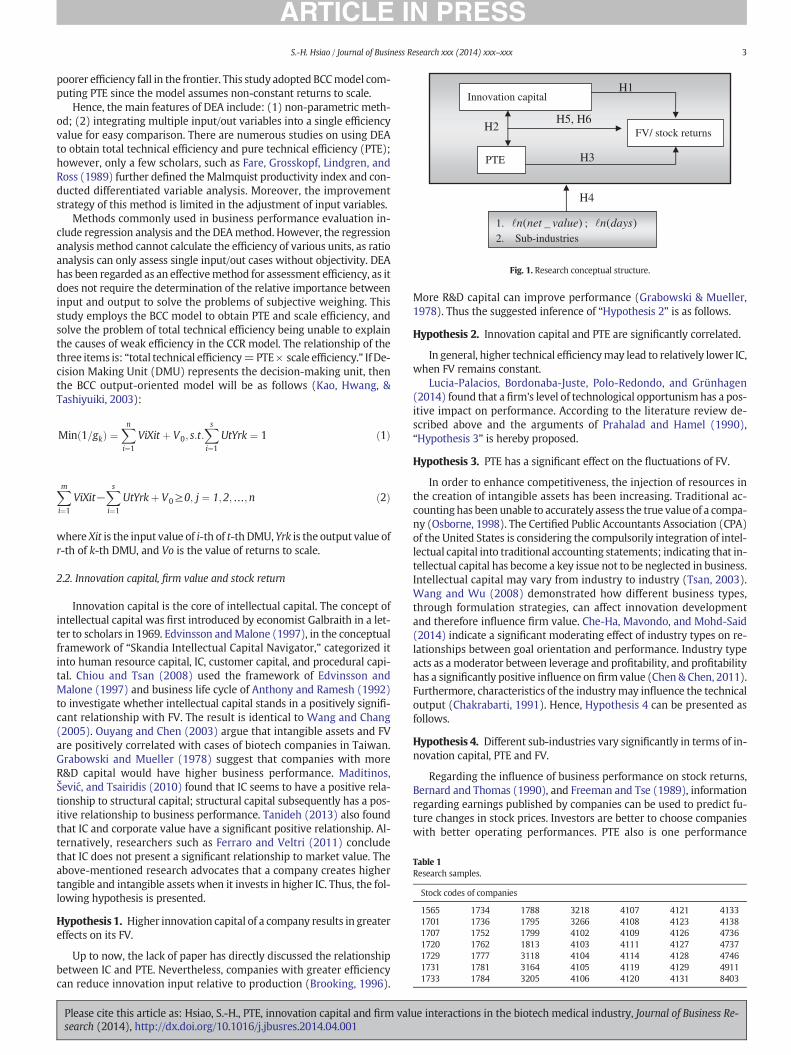
Innovation capital
PTE
FV/ stock returns
H1
H3
H2 H5, H6
1. )_( valuenetn ; )(daysn2. Sub-industries
H4
Fig. 1. Research conceptual structure.
Table 1Research samples.
Stock codes of companies
1565 1734 1788 3218 4107 4121 41331701 1736 1795 3266 4108 4123 41381707 1752 1799 4102 4109 4126 47361720 1762 1813 4103 4111 4127 47371729 1777 3118 4104 4114 4128 47461731 1781 3164 4105 4119 4129 49111733 1784 3205 4106 4120 4131 8403
3S.-H. Hsiao / Journal of Business Research xxx (2014) xxx–xxx
poorer efficiency fall in the frontier. This study adopted BCCmodel com-puting PTE since the model assumes non-constant returns to scale.
Hence, the main features of DEA include: (1) non-parametric meth-od; (2) integrating multiple input/out variables into a single efficiencyvalue for easy comparison. There are numerous studies on using DEAto obtain total technical efficiency and pure technical efficiency (PTE);however, only a few scholars, such as Fare, Grosskopf, Lindgren, andRoss (1989) further defined the Malmquist productivity index and con-ducted differentiated variable analysis. Moreover, the improvementstrategy of this method is limited in the adjustment of input variables.
Methods commonly used in business performance evaluation in-clude regression analysis and the DEAmethod. However, the regressionanalysis method cannot calculate the efficiency of various units, as ratioanalysis can only assess single input/out cases without objectivity. DEAhas been regarded as an effectivemethod for assessment efficiency, as itdoes not require the determination of the relative importance betweeninput and output to solve the problems of subjective weighing. Thisstudy employs the BCC model to obtain PTE and scale efficiency, andsolve the problem of total technical efficiency being unable to explainthe causes of weak efficiency in the CCR model. The relationship of thethree items is: “total technical efficiency=PTE× scale efficiency.” If De-cision Making Unit (DMU) represents the decision-making unit, thenthe BCC output-oriented model will be as follows (Kao, Hwang, &Tashiyuiki, 2003):
Min 1=gkð Þ ¼Xn
i¼1
ViXit þ V0; s:t:Xs
i¼1
UtYrk ¼ 1 ð1Þ
Xm
i¼1
ViXit−Xs
i¼1
UtYrkþ V0≥0; j ¼ 1;2;…;n ð2Þ
where Xit is the input value of i-th of t-th DMU, Yrk is the output value ofr-th of k-th DMU, and Vo is the value of returns to scale.
2.2. Innovation capital, firm value and stock return
Innovation capital is the core of intellectual capital. The concept ofintellectual capital was first introduced by economist Galbraith in a let-ter to scholars in 1969. Edvinsson andMalone (1997), in the conceptualframework of “Skandia Intellectual Capital Navigator,” categorized itinto human resource capital, IC, customer capital, and procedural capi-tal. Chiou and Tsan (2008) used the framework of Edvinsson andMalone (1997) and business life cycle of Anthony and Ramesh (1992)to investigate whether intellectual capital stands in a positively signifi-cant relationship with FV. The result is identical to Wang and Chang(2005). Ouyang and Chen (2003) argue that intangible assets and FVare positively correlated with cases of biotech companies in Taiwan.Grabowski and Mueller (1978) suggest that companies with moreR&D capital would have higher business performance. Maditinos,Šević, and Tsairidis (2010) found that IC seems to have a positive rela-tionship to structural capital; structural capital subsequently has a pos-itive relationship to business performance. Tanideh (2013) also foundthat IC and corporate value have a significant positive relationship. Al-ternatively, researchers such as Ferraro and Veltri (2011) concludethat IC does not present a significant relationship to market value. Theabove-mentioned research advocates that a company creates highertangible and intangible assets when it invests in higher IC. Thus, the fol-lowing hypothesis is presented.
Hypothesis 1. Higher innovation capital of a company results in greatereffects on its FV.
Up to now, the lack of paper has directly discussed the relationshipbetween IC and PTE. Nevertheless, companies with greater efficiencycan reduce innovation input relative to production (Brooking, 1996).
Please cite this article as: Hsiao, S.-H., PTE, innovation capital and firm valsearch (2014), http://dx.doi.org/10.1016/j.jbusres.2014.04.001
More R&D capital can improve performance (Grabowski & Mueller,1978). Thus the suggested inference of “Hypothesis 2” is as follows.
Hypothesis 2. Innovation capital and PTE are significantly correlated.
In general, higher technical efficiencymay lead to relatively lower IC,when FV remains constant.
Lucia-Palacios, Bordonaba-Juste, Polo-Redondo, and Grünhagen(2014) found that a firm's level of technological opportunismhas a pos-itive impact on performance. According to the literature review de-scribed above and the arguments of Prahalad and Hamel (1990),“Hypothesis 3” is hereby proposed.
Hypothesis 3. PTE has a significant effect on the fluctuations of FV.
In order to enhance competitiveness, the injection of resources inthe creation of intangible assets has been increasing. Traditional ac-countinghas been unable to accurately assess the true value of a compa-ny (Osborne, 1998). The Certified Public Accountants Association (CPA)of the United States is considering the compulsorily integration of intel-lectual capital into traditional accounting statements; indicating that in-tellectual capital has become a key issue not to be neglected in business.Intellectual capital may vary from industry to industry (Tsan, 2003).Wang and Wu (2008) demonstrated how different business types,through formulation strategies, can affect innovation developmentand therefore influence firm value. Che-Ha, Mavondo, and Mohd-Said(2014) indicate a significant moderating effect of industry types on re-lationships between goal orientation and performance. Industry typeacts as amoderator between leverage and profitability, and profitabilityhas a significantly positive influence on firm value (Chen & Chen, 2011).Furthermore, characteristics of the industrymay influence the technicaloutput (Chakrabarti, 1991). Hence, Hypothesis 4 can be presented asfollows.
Hypothesis 4. Different sub-industries vary significantly in terms of in-novation capital, PTE and FV.
Regarding the influence of business performance on stock returns,Bernard and Thomas (1990), and Freeman and Tse (1989), informationregarding earnings published by companies can be used to predict fu-ture changes in stock prices. Investors are better to choose companieswith better operating performances. PTE also is one performance
ue interactions in the biotech medical industry, Journal of Business Re-
Table 2Operational definitions of measurement variables.Data sources: summarized by this study.
Perspective Variable Descriptions
Dependent variable FV Tobin's Qi,t (i representing i-thcompany, t representingt-th year); (Teng, 2010)
Stock returns (season) (Final price − initial price + stockdividends) / initial price
Independent variable Innovation capital =R&D costs/net business income(Edvinsson & Malone, 1997;Grabowski & Mueller, 1978;Van Buren, 1999; Wang andChang, 2005)
PTE Non-fixed scale reward(Banker et al., 1984)
Control variable ‘n(net _ value) Representing firm size/scale‘n(days) Representing company age
4 S.-H. Hsiao / Journal of Business Research xxx (2014) xxx–xxx
evaluation index. However, studies relating to the impact of IC on FV aresignificantly inadequate. Moreover, no literature on the adjustment ef-fects of PTE is available.
In contrast to the viewpoint of Brooking (1996), FV may be influ-enced by relative efficiency or interaction effects between IC and PTE,when IC creates the value of a company. R&D investment, as IC, contrib-utes positively to FV for both manufacturing and service firms (Ehie &Olibe, 2010; Griliches, 1981). Griliches (1981) also indicated thatvariation in R&D expenditurewill evaluate FV again and produce the re-muneration of stock returns. Companies will be easily replaced by com-petitors if their innovation speed is too slow. The IC validity is graduallyshortened and leads to the production technology being eliminatedquickly (Carbonell & Rodriguez, 2006). Based on time-based competi-tion and dynamic capability theory, innovation speed is a requirementof the ability when the environment changes rapidly (Coombs &Bierly, 2006). Thus, PTE is very important due to the fact thathigher PTE may result in IC to create more FV. In addition, previousstudies were insufficient in their discussions of the interactive effectsof “IC/PTE” and moderate effects. Furthermore, FV may improve stockprice based on the viewpoint of Yeh (2005). Thus, this study constructsthefifth and sixthhypotheses to explore the above problemand remedythe shortcomings of previous literature.
Hypothesis 5. The interaction between innovation capital and PTE hasmoderating effects on FV.
Hypothesis 6. The interaction between innovation capital and PTE hasmoderating effects on stock returns.
Table 3HRA model.
Variable Model 1 Model 2 Model 3 Model 4
Innovation capital * * *PTE * *‘n(net _ value) * * * *‘n(days) * * * *Innovation capital × PTE *
Note: 1. “*”means variable used in theHRAmodel. 2. Dependent variablewas FV (or stockreturns). 3. IC and PTE were standardized values.
Table 4Variable descriptive statistics.
Item FV Innovation capital Total technical efficiency
Mean 1.771 0.222 64.778SD 1.858 0.870 15.377Skewness 4.969 7.590 −0.037Kurtosis 34.862 70.627 0.137
Note: 1. Total technical efficiency based on CCR model of DEA.2. Total sample size is 882.
Please cite this article as: Hsiao, S.-H., PTE, innovation capital and firm valsearch (2014), http://dx.doi.org/10.1016/j.jbusres.2014.04.001
Unlike previous studieswhich only focus on themain effect betweenIC and FV, this research includes PTEwith the gap of the RBV. It also fur-ther explores the moderating effect of PTE.
3. Research methodology
3.1. The conceptual research framework
The conceptual framework of this study is shown in Fig. 1. Indepen-dent variables are IC and PTE. Dependent variables are FV and stockreturns. Control variables are firm size and establishment days. The FVassessment indicators were not definite, for example, Yeh (2005) usedstock prices and operation performance; Hirschey and Weygandt(1985) used Tobin's Qi as the FV indicator (i-th FV/asset replacementcost). As it was difficult to obtain replacement costs in Taiwan,Claessens, Djankov, Fan, and Lang (2002) replace the asset replacementcost with the asset book value. Hence, this study calculates the FV as fol-lows, according to the approach proposed by Lemmmon and Lins(2003):
Tobin0sQ i ¼ Sþ Dð Þ=A ¼ n� Pþ Dð �= E þ Dð Þ½ ð3Þ
S market value is the common stock priceD book value of liabilitiesA total book value of assetsN number of outstanding shares for the yearP average price of common outstanding sharesE stockholder's equity.
3.2. Research data sources and variables
The samples of this studywere publicly listed biotechnology compa-nies in Taiwanwith complete data during the period from 2006 to 2010(see Table 1), and the data source was from a database of the TaiwanEconomic Journal (TEJ). In this study, IC was calculated by “R&D costs/net business income.” The PTE was the relatively efficiency obtainedby the BCC model of DEA, where the input variables included operatingcosts, operating expenses and non-business expenditure. Output vari-ables included total non-business income and net business income. ICand PTE are the independent variables of this study. The dependent var-iables include FV and stock returns. The replacement of control variableswas calculated from the natural logarithm of firm size and establish-ment days: ‘n(net _ value) and ‘n(days). The variable definitions areshown in Table 2;Wong and Lye (1990) find that SR are significantly re-lated to firm size; FV is based on the Tobin's Qi,t (Lemmmon and Lins,2003); and IC refers to the proposal of (Edvinsson & Malone, 1997;Van Buren, 1999; Wang & Chang, 2005).
3.3. Statistical analysis methods
The statistical methods of this study include the descriptive statisti-cal analysis, correlation coefficient, the analysis of variance (ANOVA),and the hierarchical regression analysis (HRA) method. The descriptivestatistics demonstrates the average and standard deviation of variables;
PTE ‘n(net _ value) ‘n(days) Stock return
76.492 13.670 9.028 8.03014.074 0.820 0.539 26.313−0.766 −0.020 −0.142 1.166
1.492 0.143 −1.018 2.288
ue interactions in the biotech medical industry, Journal of Business Re-
Table 7ANOVA of different sub-industries.
Variable Item SSE df MSE F p
FV Between 716.653 4 179.163 82.917 0.000Within 1175.456 877 2.161Total 1892.109 881
Innovation capital Between 13.965 4 3.491 4.686 0.001Within 653.382 877 0.745Total 667.346 881
Total technical efficiency Between 742.249 4 185.562 0.784 0.536Within 207561.766 877 236.672Total 208304.015 881
PTE Between 11587.249 4 2.898 4.379 0.002Within 179718.186 877 0.662Total 191305.435 881
‘n(net _ value) Between 11.591 4 2.898 4.379 0.002Within 580.395 877 0.662Total 591.987 881
‘n(days) Between 60.910 4 15.228 68.490 0.000Within 194.986 877 0.222Total 255.896 881
Stock returns Between 633.101 4 211.034 0.303 0.823Within 323389.871 877 695.462Total 324022.972 881
Note: SSE = sum of square; MSE = mean sum of square.
5S.-H. Hsiao / Journal of Business Research xxx (2014) xxx–xxx
the non-parametric correlation coefficient can illustrate the correlationbetween various independent variables, and exclude the collinearityproblem; HRA can be used to discuss the association between variables.To explore whether the FV or stock returns varied in the cases of differ-ent sub-industries, this study used the ANOVA and the Scheffe post-event testing method, with corresponding hypotheses including H1 toH6, as mentioned above.
HRA can provide different stage regressionmodels to explore the ex-planation variation of overall and individual variables and moderatingeffects. Unlike general multiple regression, HRA must be applied to theentering order based on the characteristic of the predicting variable.Cliff (1983), Tomarken andWaller (2003, 2005) also propose many po-tential problems of SEM (structural equation modeling). For example,utilizing the data correlation is incapable of establishing the causalityof a variable. Thus, this study considers HRA to be more suitable. Thisstudy incorporated the control variables into HRA in order to discussthe direct effect of IC and PTE on FV (or stock return), and the moderat-ing effect. HRA can be categorized into fourmodels:Model 1 is the basicmodel established by control variables. Model 2 tests the major effectsof dependent and independent variables. Model 4 incorporates interac-tive items to test the contingent effects of IC and PTE. To reduce the ex-pansion effect of interactive items on interpretation capabilities, thisstudy first conducted the standardization of continuous variables, asproposed by Luo (2002), and then determined the interactive items inorder to reduce the collinearity problems that may arise from the inter-active items. Table 3 demonstrates the descriptions of various models.To test whether spurious regression exists or not, this study hasutilized unit root tests and the Augmented Dickey–Fuller (ADF) test;the Durbin–Watson test was explored independently of residuals(Bhargava, Franzini, & Narendranathan, 1982); and the Akaike Informa-tion Criterion (AIC) tested the appropriateness in regression models.
4. Research findings
This study adopts contingency views to discuss the impact of IC andPTE on FV and stock returns, as well as the moderating effects. Thisstudy also explores whether FV and stock returns vary significantly interms of different sub-industries. The descriptive statistics of research
Table 5Descriptive statistics of different sub-industries.
Sub-industries(size, %)
M/SD FV Innovation capital Tota
Medical consumables (368, 41.72) Mean 1.737 0.111 64.5SD 1.469 0.458 15.2
Western medicine (355, 40.25) Mean 1.544 0.345 65.0SD 1.277 1.199 15.5
Functional food (80, 9.07) Mean 1.327 0.107 65.9SD 0.532 0.141 15.6
Dyestuffs and pigments (37, 4.20) Mean 1.970 0.035 57.3SD 0.384 0.019 14.1
Biotechnology (42, 4.76) Mean 10.568 0.624 60.5SD 5.245 0.159 11.8
Note: 1. Total technical efficiency based on CCR model of DEA.2. Total sample size is 882.
Table 6Spearman correlation coefficients.
No. Variable 1 2
1 FV 12 Innovation capital 0.323** 13 PTE −0.347** −0.0394 Total technical efficiency 0.374** −0.0395 ‘n(net _ value) −0.006 −0.193**6 ‘n(days) −0.306** −0.138**7 Stock returns 0.183** −0.054
Note: 1. Total technical efficiency based on CCR model of DEA. 2. “**” denotes a significance lev
Please cite this article as: Hsiao, S.-H., PTE, innovation capital and firm valsearch (2014), http://dx.doi.org/10.1016/j.jbusres.2014.04.001
variables are shown in Tables 4 and 5. The skewness absolute valuesof FV and IC are larger than 3, being skewed right and leptokurtic; theremaining variables are skewed left and platykurtic. The mean of FV is1.77 which appears acceptable. The variables with the highest Spear-man correlation coefficient (0.426**), as Table 6 shows, exist between“firm size” and “establishment days.”
Collinearity diagnosis of the integration of the two variables inmodel construction was conducted. The replacement variables of firmsize and establishment days are ‘n(net _ value) and ‘n(days) respec-tively. IC and FV have a significantly positive correlation if firm sizeand establishment days are ignored (Spearman = 0.323**). However,PTE and FV have a negative correlation (Spearman = −0.347**).These results reveal that IC has a positive effect on FV, and the result issimilar to the opinion of Riahi-Belkaoui (1999). But FV will be lowsince a company with high technical efficiency may possess costly
l technical efficiency PTE ‘n(net _ value) ‘n(days) Stock returns
75 79.910 13.653 8.820 6.83895 11.923 0.882 0.397 26.28865 73.060 13.667 9.302 9.13541 15.560 0.776 0.533 27.17486 73.399 13.935 8.820 8.55646 18.803 0.653 0.565 21.32001 90.689 13.835 8.634 2.34107 10.813 0.468 0.000 0.67253 80.384 12.900 8.074 0.71295 21.125 0.014 0.000 0.000
3 4 5 6 7
1−0.013 1−0.221** −0.211** 1
0.045 0.045 0.426** 10.327 0.100* 0.018 0.041 1
el of 5%.
ue interactions in the biotech medical industry, Journal of Business Re-
Table 8Variables of significant level in Scheffe verification of different sub-industries.
Variable I–J p-Value
FV 1 vs. 5 (I–J = −8.831*) 0.0002 vs. 5 (I–J = −9.024*) 0.0003 vs. 5 (I–J = −9.241*) 0.0004 vs. 5 (I–J = −8.598*) 0.000
Innovation capital 1 vs. 2 (I–J = −0.234*) 0.006PTE 1 vs. 2 (I–J = 6.851*) 0.000
1 vs. 3 (I–J = 6.513*) 0.0292 vs. 4 (I–J = −17.628*) 0.034
‘n(net _ value) 1 vs. 5 (I–J = 0.750*) 0.0432 vs. 5 (I–J = 0.764*) 0.0373 vs. 5 (I–J = 1.032*) 0.003
‘n(days) 1 vs. 2 (I–J = −0.483*) 0.0001 vs. 5 (I–J = 0.746*) 0.0002 vs. 3 (I–J = 0.431*) 0.0002 vs. 4 (I–J = 0.668*) 0.0082 vs. 5 (I–J = 1.228*) 0.0003 vs. 5 (I–J = 0.797*) 0.000
Note: 1 = medical consumables, 2 = western medicine, 3 = functional food,4 = dyestuffs and pigments, 5 = biotechnology, and “*” denotes a significance level of 10%.
6 S.-H. Hsiao / Journal of Business Research xxx (2014) xxx–xxx
maintenance fees. If only themain effect is considered, a high PTE can re-duce the input of IC. Themeanof total technical efficiency in this industryis 64.778%, and there are only 4 companies with PTE above 1. These re-sults indicate that there is a space for improvement in terms of efficiency.Otherwise there is a need to increase IC. FV and stock returns have a sig-nificant positive correlation if firm size and establishment days are ig-nored (Spearman = 0.813**). This is the same basic concept of Healy,Hutton, and Palepu (1999) who adopt stock returns in assessing FV.
This study conducted variance analysis (Table 7) and Scheffetesting (Table 8) of different sub-industries, and found that FV, PTE,‘n(net _ value) and ‘n(days) differed in a significant way. The Scheffetest found that FV varied significantly in cases of “biotechnology” sub-industries. The IC varied significantly between the “medical consum-ables” and “western medicine,” and had no significant difference inthe case of total technical efficiency. PTE varied significantly between“medical consumables” and “western medicine/functional food”. PTEvaried significantly between “western medicine” and “dyestuffs andpigments”.
Table 9Results of the panel data.
FV SR IC
ADF (probability) −13.123(0.000**)
−2.400(0.1444)
−(0
Akaike info criterion (AIC) 4.038 9.068Durbin–Watson (DW) 1.993 2.072
Note: SR is stationary state after first difference (ADF = −15.154 (0.000**); AIC = 9.035; DW
Table 10HRA of FV.
Coef. Constant Innovation capital PTE
Model l 10.232T = 6.555P = 0.000
Model 2 9.768 0.195T = 6.254 T = 2.673P = 0.000 P = 0.008
Model 3 12.186 0.445 −0.598T = 7.919 T = 5.658 T = 6.920P = 0.000 P = 0.000 P = 0.000
Model 4 10.038 2.773 0.623T = 6.710 T = 8.602 T = 7.545P = 0.000 P = 0.000 P = 0.000
Note: 1. interactive item = IC ∗ PTE; 2. significant level 0.05; 3. DW = 2.146.
Please cite this article as: Hsiao, S.-H., PTE, innovation capital and firm valsearch (2014), http://dx.doi.org/10.1016/j.jbusres.2014.04.001
Tables 7 and 8 reveal that the inputs of IC and PTE reveal a significantdifference among different sub-industries. Ignoring the moderating ef-fects between IC and PTE, Tables 5 and 7 reveal that the highest FV(10.568) is “biotechnology” which invests the highest IC (0.624). PTEof “western medicine” is similar to that of “function food.” However,the IC of “function food” is higher, so FV is also higher relatively. “Dye-stuffs and pigment” are the highest PTE (90.689%) and invest a lowestIC (0.035), so FV is lower.
Table 9 represents the results of panel data. FV is stationary state andSR is stationary state after first difference (ADF = −15.154 (0.000**);AIC = 9.035; DW = 2.022). The interaction of Model 4 in Table 10 issignificant on FV. Table 11 reveals the model of fit for HRA/SR from2008 to 2010 years. Table 12 shows the interaction is not significant ef-fect on SR. IC and PTE in Table 6 show a significant correlation betweenFV and stock return. However, SR can easily be influenced by marketfluctuations, especially in shallow-dish stock markets and by foreigncountries such as the economic systems in Southeast Asia, SouthAmerica, and Taiwan. In general, the Biotech Medical Industry has notachieved relative efficiency; hence, companies may have more ICinput. In Model 4 of Table 10, regression coefficients of IC are 2.773and 0.623 if the model considers the interaction. By referring toTable 10, this study determined that, based on the contingency view,IC and PTE have significant moderating effects on FV. Hence, regardingthe FV promotion strategies in practice, it is recommended not only toassess the major effects of IC and PTE, but also to consider the positivemoderating effects caused by the interaction of PTE. Increasing IC andPTE may improve FV, but doesn't improve stock return. Obviously, thesensitivity of IC on FV is higher than PTE. But improving FV should con-sider both appropriate PTE and IC simultaneously, since HRA resultsshow that interaction has a significant effect (positive regression coeffi-cient of 0.794).
Measuring the unit root test, ADF, and AIC of the panel data beforeHRA can strengthen the reliability of analysis. The refusal to reject thenull hypothesis means that variable has a unit root. This study executesthe unit root test for the main parameters, including FV, IC, and PTE asshown in Table 9. Whereas SR failed to achieve a significant level, FVdisplayed a stationary state. SR assumed a stationary state after thefirst-difference (ADF = −15.15351). The DW value is approximately2 and reveals no autocorrelation. Data assumes a stationary state and
PTE ‘n(net _ value) ‘n(days)
30.091.000**)
−16.606(0.000**)
−12.765(0.000**)
−11.632(0.000**)
2.563 8.177 2.061 1.3061.955 1.979 1.980 2.003
= 2.022) and “**” denotes a significance level of 5%.
‘n(net _ value) ‘n(days) Interaction Note
0.036 −0.993 R2 = 0.082T = 0.331 T = −6.531 F = 24.500P = 0.741 P = 0.000 P = 0.0000.015 −0.910 R2 = 0.094T = 0.141 T = −5.894 F = 18.899P = 0.888 P = 0.000 P = 0.000−0.232 −0.796 R2 = 0.168T = −2.137 T = −5.342 F = 19.162P = 0.033 P = 0.000 P = 0.000−0.105 −0.709 0.794 R2 = 0.244T = −1.003 T = −4.967 T = 7.425 F = 15.301P = 0.316 P = 0.000 P = 0.000 P = 0.000
ue interactions in the biotech medical industry, Journal of Business Re-
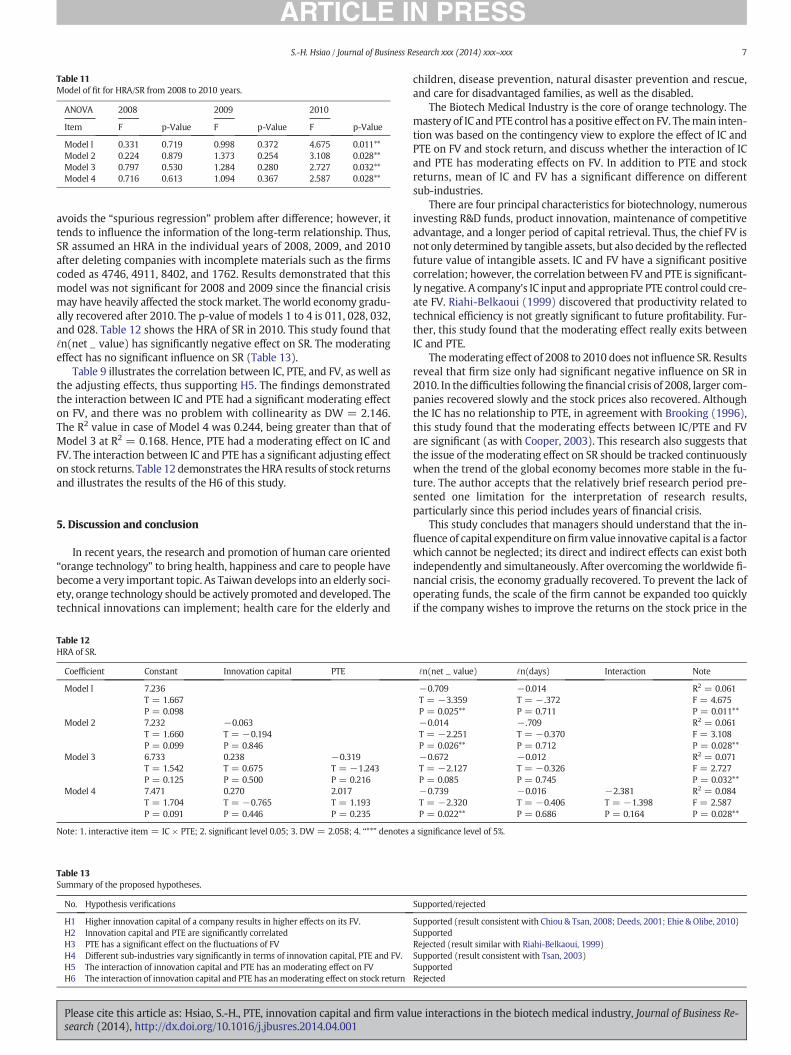
Table 11Model of fit for HRA/SR from 2008 to 2010 years.
ANOVA 2008 2009 2010
Item F p-Value F p-Value F p-Value
Model l 0.331 0.719 0.998 0.372 4.675 0.011**Model 2 0.224 0.879 1.373 0.254 3.108 0.028**Model 3 0.797 0.530 1.284 0.280 2.727 0.032**Model 4 0.716 0.613 1.094 0.367 2.587 0.028**
7S.-H. Hsiao / Journal of Business Research xxx (2014) xxx–xxx
avoids the “spurious regression” problem after difference; however, ittends to influence the information of the long-term relationship. Thus,SR assumed an HRA in the individual years of 2008, 2009, and 2010after deleting companies with incomplete materials such as the firmscoded as 4746, 4911, 8402, and 1762. Results demonstrated that thismodel was not significant for 2008 and 2009 since the financial crisismay have heavily affected the stockmarket. The world economy gradu-ally recovered after 2010. The p-value of models 1 to 4 is 011, 028, 032,and 028. Table 12 shows the HRA of SR in 2010. This study found that‘n(net _ value) has significantly negative effect on SR. The moderatingeffect has no significant influence on SR (Table 13).
Table 9 illustrates the correlation between IC, PTE, and FV, as well asthe adjusting effects, thus supporting H5. The findings demonstratedthe interaction between IC and PTE had a significant moderating effecton FV, and there was no problem with collinearity as DW = 2.146.The R2 value in case of Model 4 was 0.244, being greater than that ofModel 3 at R2 = 0.168. Hence, PTE had a moderating effect on IC andFV. The interaction between IC and PTE has a significant adjusting effecton stock returns. Table 12 demonstrates theHRA results of stock returnsand illustrates the results of the H6 of this study.
5. Discussion and conclusion
In recent years, the research and promotion of human care oriented“orange technology” to bring health, happiness and care to people havebecome a very important topic. As Taiwan develops into an elderly soci-ety, orange technology should be actively promoted and developed. Thetechnical innovations can implement; health care for the elderly and
Table 12HRA of SR.
Coefficient Constant Innovation capital PTE
Model l 7.236T = 1.667P = 0.098
Model 2 7.232 −0.063T = 1.660 T = −0.194P = 0.099 P = 0.846
Model 3 6.733 0.238 −0.319T = 1.542 T = 0.675 T = −1.243P = 0.125 P = 0.500 P = 0.216
Model 4 7.471 0.270 2.017T = 1.704 T = −0.765 T = 1.193P = 0.091 P = 0.446 P = 0.235
Note: 1. interactive item = IC × PTE; 2. significant level 0.05; 3. DW = 2.058; 4. “**” denotes
Table 13Summary of the proposed hypotheses.
No. Hypothesis verifications
H1 Higher innovation capital of a company results in higher effects on its FV.H2 Innovation capital and PTE are significantly correlatedH3 PTE has a significant effect on the fluctuations of FVH4 Different sub-industries vary significantly in terms of innovation capital, PTE and FV.H5 The interaction of innovation capital and PTE has an moderating effect on FVH6 The interaction of innovation capital and PTE has anmoderating effect on stock return
Please cite this article as: Hsiao, S.-H., PTE, innovation capital and firm valsearch (2014), http://dx.doi.org/10.1016/j.jbusres.2014.04.001
children, disease prevention, natural disaster prevention and rescue,and care for disadvantaged families, as well as the disabled.
The Biotech Medical Industry is the core of orange technology. Themastery of IC and PTE control has a positive effect on FV. Themain inten-tion was based on the contingency view to explore the effect of IC andPTE on FV and stock return, and discuss whether the interaction of ICand PTE has moderating effects on FV. In addition to PTE and stockreturns, mean of IC and FV has a significant difference on differentsub-industries.
There are four principal characteristics for biotechnology, numerousinvesting R&D funds, product innovation, maintenance of competitiveadvantage, and a longer period of capital retrieval. Thus, the chief FV isnot only determined by tangible assets, but also decided by the reflectedfuture value of intangible assets. IC and FV have a significant positivecorrelation; however, the correlation between FV and PTE is significant-ly negative. A company's IC input and appropriate PTE control could cre-ate FV. Riahi-Belkaoui (1999) discovered that productivity related totechnical efficiency is not greatly significant to future profitability. Fur-ther, this study found that the moderating effect really exits betweenIC and PTE.
Themoderating effect of 2008 to 2010 does not influence SR. Resultsreveal that firm size only had significant negative influence on SR in2010. In the difficulties following thefinancial crisis of 2008, larger com-panies recovered slowly and the stock prices also recovered. Althoughthe IC has no relationship to PTE, in agreement with Brooking (1996),this study found that the moderating effects between IC/PTE and FVare significant (as with Cooper, 2003). This research also suggests thatthe issue of themoderating effect on SR should be tracked continuouslywhen the trend of the global economy becomes more stable in the fu-ture. The author accepts that the relatively brief research period pre-sented one limitation for the interpretation of research results,particularly since this period includes years of financial crisis.
This study concludes that managers should understand that the in-fluence of capital expenditure onfirm value innovative capital is a factorwhich cannot be neglected; its direct and indirect effects can exist bothindependently and simultaneously. After overcoming theworldwide fi-nancial crisis, the economy gradually recovered. To prevent the lack ofoperating funds, the scale of the firm cannot be expanded too quicklyif the company wishes to improve the returns on the stock price in the
‘n(net _ value) ‘n(days) Interaction Note
−0.709 −0.014 R2 = 0.061T = −3.359 T = − .372 F = 4.675P = 0.025** P = 0.711 P = 0.011**−0.014 −.709 R2 = 0.061T = −2.251 T = −0.370 F = 3.108P = 0.026** P = 0.712 P = 0.028**−0.672 −0.012 R2 = 0.071T = −2.127 T = −0.326 F = 2.727P = 0.085 P = 0.745 P = 0.032**−0.739 −0.016 −2.381 R2 = 0.084T = −2.320 T = −0.406 T = −1.398 F = 2.587P = 0.022** P = 0.686 P = 0.164 P = 0.028**
a significance level of 5%.
Supported/rejected
Supported (result consistent with Chiou & Tsan, 2008; Deeds, 2001; Ehie & Olibe, 2010)SupportedRejected (result similar with Riahi-Belkaoui, 1999)Supported (result consistent with Tsan, 2003)SupportedRejected
ue interactions in the biotech medical industry, Journal of Business Re-

8 S.-H. Hsiao / Journal of Business Research xxx (2014) xxx–xxx
Biotechnology Health Care Industry. In-depth studies on improving FVand stock returns, the moderating effects and contingency factors arealso very important. Hence, the findings of this study can make up forthe above-mentioned inadequacies of RBV, and provide a reference forthe government, investors, creditors, and management.
References
Aiken, L. S., & West, S. G. (1991). Multiple-regression: Testing and interpreting interactions.Newbury Park, CA: Sage.
Andrew, J. P., & Sirkin, H. L. (2007). Payback: Reaping the rewards of innovation. Boston,MA: Harvard Business School Press.
Anthony, J. H., & Ramesh, K. (1992). Association between accounting performance mea-sures and stock prices: A test of the life cycle hypothesis. Journal of Accounting andEconomics, 15(2–3), 203–227.
Aragon-Correa, A., & Sharma, S. (2003). A contingent resource-based view of proactivecorporate environmental strategy. Academy of Management Review, 28(1), 71–88.
Avnimelech, G., & Teubal, M. (2008). From direct support of business sector R&D/innova-tion to targeting venture capital/private equity: A catching-up innovation and tech-nology policy life cycle perspective. Economics of Innovation and New Technology,17(1), 153–172.
Banker, R. D., Charnes, A., & Cooper, W. W. (1984). Some models for estimating technicaland scale inefficiencies in data envelopment analysis. Management Science, 30(9),1078–1092.
Bassi, L. J., & Van Buren, M. E. (1999). Valuing investment in intellectual capital.International Journal of Technology Management, 18(5/6/7/8), 414–432.
Bernard, V. L., & Thomas, J. K. (1990). Evidence that stock prices do not fully reflect theimplications of current earnings for future earnings. Journal of Accounting andEconomics, 13(4), 305–340.
Bhargava, A., Franzini, L., & Narendranathan,M. (1982). Serial correlation and fixed effectsmodels. Review of Economic Studies, 49, 533–549.
Brooking, A. (1996). Intellectual capital: Core assets for the third millennium enterprise.London: Thomson Business Press.
Canto, J. G. D., & Gonzalez, I. S. (1999). A resource-based analysis of the factors determin-ing a firm's R&D activities. Research Policy, 28(8), 891–905.
Carbonell, P., & Rodriguez, A. I. (2006). The impact of market characteristics and innova-tion speed on perceptions of positional advantage and new product performance.International Journal of Research in Marketing, 23(1), 1–12.
Chakrabarti, A. K. (1991). Industry characteristic influencing the technical output: A caseof small and medium size firms in the US. R&D Management, 21(2), 139–152.
Chalfont, G., & Gibson, G. (2006). How assistive technology can improve well-being.Journal of Dementia Care, 14(2), 19–21.
Charnes, A., Cooper,W.W., & Rhodes, E. (1978). Measuring the efficiency of decisionmak-ing units. European Journal of Operational Research, 2(4), 429–444.
Che-Ha, N., Mavondo, F. T., & Mohd-Said, S. (2014). Performance or learning goal orienta-tion: Implications for business performance. Journal of Business Research, 67(1),2811–2820.
Chen, K. T. (2007). The study for the relationship between innovation capital and businessvaluation — An empirical study on Taiwan electronic industries. (Master's thesis).Taiwan: National Chung Cheng University.
Chen, L. J., & Chen, S. Y. (2011). The influence of profitability on firm value with capitalstructure as the mediator and firm size and industry as moderators. InvestmentManagement and Financial Innovations, 8(3), 121–129.
Cheng, Y. H., Kuan, F. Y., Chuang, S. C., & Ken, Y. (2010). Profitability decided by patentquality? An empirical study of the U.S. semiconductor industry. Scientometrics,82(1), 175–183.
Chiou, C. C., & Tsan, H. F. (2008). A study on the association between intellectual capitaland managerial performance in different phases of business life cycle — The case ofthe electronic and information industry. Journal of Contemporary Accounting, 9(2),201–236.
Cho, M. H. (1998). Ownership structure, investment, and the corporate value: An empir-ical analysis. Journal of Financial Economics, 47(1), 103–121.
Claessens, S., Djankov, J. P., Fan, H., & Lang, H. P. (2002). Disentangling the incentive andentrenchment effects of large shareholdings. The Journal of Finance, 57(6),2741–2771.
Cliff, N. (1983). Some cautions concerning the application of causal modeling methods.Multivariate Behavioral Research, 18(1), 115–126.
Cooke, P., & Wills, D. (1999). Small firms, social capital and the enhancement of businessperformance through innovation programs. Small Business Economics, 13(3),219–234.
Coombs, J. E., & Bierly, P. E. (2006). Measuring technological capability and performance.R&D Management, 36(4), 421–438.
Cooper, R. S. (2003). Purpose and performance of the small business innovation research(SBIR) program. Small Business Economics, 20(2), 137–151.
D'Alvano, L. D., & Hidalgo, A. (2012). You have free access to this content Innovationman-agement techniques and development degree of innovation process in service orga-nizations. R&D Management, 42(1), 60–70.
De Carolis, D. M. (2003). Competences and limitability in the pharmaceutical industry: Ananalysis of their relationship with firm performance. Journal of Management, 29(1),27–50.
Deeds, D. L. (2001). The role of R&D intensity, technical development and absorptive ca-pacity in creating entrepreneurial wealth in high technology start-ups. Journal ofEngineering and Technology Management, 18(1), 29–47.
Please cite this article as: Hsiao, S.-H., PTE, innovation capital and firm valsearch (2014), http://dx.doi.org/10.1016/j.jbusres.2014.04.001
Doukas, J., & Switzer, L. (1992). The stockmarket's valuation of R&D spending and marketconcentration. Journal of Economics and Business, 44(2), 95–144.
Edvinsson, L., & Malone, M. S. (1997). Intellectual capital: Realizing your company's truevalue by finding its hidden roots. New York: Harper Collins.
Ehie, I. C., & Olibe, K. (2010). The effect of R&D investment on firm value: An examinationof US manufacturing and service industries. International Journal of ProductionEconomics, 128(1), 127–135.
Fare, R., Grosskopf, S., Lindgren, B., & Ross, P. (1989). Productivity changes in Swedishpharmacies 1980–1989: A non-parametric Malmquist approach. Journal ofProductivity Analysis, 3(1), 85–101.
Farell, M. J. (1957). The measurement of productive efficiency. Journal of Royal StatisticalSociety, 120, 253–581.
Ferraro, O., & Veltri, S. (2011). The value relevance of intellectual capital on the firm'smarket value: An empirical survey on the Italian listed firms. International Journal ofKnowledge-Based Development, 2(1), 66–84.
Freeman, R., & Tse, S. (1989). The multi-period information content of accounting earn-ings: Confirmations and contradictions of previous earnings reports. Journal ofAccounting Research, 27, 49–79.
Gallon, M. R., Stillman, H. M., & Coates, D. (1995). Putting core competency thinking intopractice. Research-Technology Management, 38(3), 20–28.
Grabowski, H. G., & Mueller, D. C. (1978). Industrial research and development, in-tangible, capital stocks, and firm profit rates. Bell Journal of Economics, 9(2),328–343.
Griliches, Z. (1981). Markets value, R&D and patents. Economic Letters, 7(2), 183–187.Healy, P. M., Hutton, A. P., & Palepu, K. G. (1999). Stock performance and intermediation
changes surrounding sustained increases in disclosure. Contemporary AccountingResearch, 16(3), 485–520.
Hirschey, M., &Weygandt, J. (1985). Amortization policy for advertising and research anddevelopment expenditures. Journal of Accounting Research, 23(1), 326–335.
Johnson, W. H. A. (1999). An integrative taxonomy of intellectual capital: Measuring thestock and flow of intellectual capital components in the firm. International Journal ofTechnology Management, 18(5–8), 562–575.
Kalafut, P. C., & Low, J. (2001). The value creation index: Quantifying intangible value.Strategy and Leadership, 29(5), 9–15.
Kao, C., Hwang, S. N., & Tashiyuiki, T. (2003). An evaluation of management performance:DEA. Taipei, Taiwan: Hwa Tai Publishing Co.
Kroger, D., Katerkamp, A., Renneberg, R., & Cammann, K. (1998). Surface investigations onthe development of a direct optical immunosensor. Biosensors & Bioelectronics,13(10), 1141–1147.
Lee, H., Kim, S., & Kim, J. (2012). Open technology innovation activity and firm value:Evidence from Korean firms. Applied Economics, 44(27), 3551–3561.
Lemmmon, M. L., & Lins, K. V. (2003). Ownership structure, corporate governance, andfirm value: evidence form the East Asian crisis. Journal of Finance, 58(4), 1445–1468.
Lin, F. L. (2003). The relationship between business operation performance and stockreturns for the OTC companies. Journal of Shu-Te University., 5(1), 39–59.
Lucia-Palacios, L., Bordonaba-Juste, V., Polo-Redondo, Y., & Grünhagen, M. (2014). Tech-nological opportunism effects on IT adoption, intra-firm diffusion and performance:Evidence from the U.S. and Spain. Journal of Business Research, 67(6), 1178–1188.
Luo, Y. (2002). Product diversification in international joint ventures: Performance impli-cations in an emerging market. Strategic Management Journal, 23(1), 1–20.
Luo, X., Homburg, C., & Wieseke, J. (2010). Customer satisfaction, analyst stock recom-mendations, and firm value. Journal of Marketing Research, 47(6), 1041–1058.
Maditinos, D., Šević, Z., & Tsairidis, C. (2010). Intellectual capital and business perfor-mance: An empirical study for the Greek listed companies. European Research StudiesJournal, 13(3), 145–167.
McConnell, J. J., & Servaes, H. (1990). Additional evidence on equity ownership and corpo-rate value. Journal of Financial Economics, 27(2), 595–612.
Morck, R., Shlerifer, A., & Vishny, R. W. (1988). Management ownership and market val-uation: An example analysis. Journal of Financial Economics, 20(C), 293–315.
Osborne, A. (1998). Measuring intellectual capital: The real value of companies. Ohio CPAJournal, 57(4), 37–38.
Ouyang, L., & Chen, C. L. (2003). Business performance, corporate governance and firmvalue. Taiwan Economics Association Annual Conference.
Pérez-Luño, A., Cabello-Medina, C., Carmona-Lavado, A., & Cuevas-Rodríguez, G. (2011).How social capital and knowledge affect innovation. Journal of Business Research,64(12), 1369–1376.
Prahalad, C. K., & Hamel, G. (1990). The core competence of the corporation. HarvardBusiness Review, 68(3), 79–91.
Ray, G., Barney, J., & Muhanna, W. (2004). Capabilities, business process, and competitiveadvantage: Choosing the dependent variable in empirical tests of the resource-basedview. Strategic Management Journal, 25(1), 23–37.
Riahi-Belkaoui, A. (1999). Productivity, profitability, and firm value. Journal ofInternational Financial Management and Accounting, 10(3), 188–201.
Scherer, M. J., Craddock, G., & Mackeogh, T. (2011). The relationship of personal factorsand subjective well-being to the use of assistive technology devices. Disability andRehabilitation, 33(10), 811–817.
Sundaram, A. K., John, T. A., & John, K. (1996). An empirical analysis of strategic competi-tion and firm values: The case of R&D competition. Journal of Financial Economics,40(3), 459–487.
Tallman, S., Jenkins, M., Henry, N., & Pinch, S. (2004). Knowledge, clusters, and competi-tive advantage. Academy of Management Review, 29(2), 258–271.
Tanideh, S. (2013). Relationship between innovation capital and intellectual capital withvalue and financial performance. Life Science Journal, 10(10s) 251–25.
Teng, J. H. (2010). Corporate governance, ownership structure, and firm value — Evidencefrom the global financial crisis. (Master's thesis). Taiwan: National Chung ChengUniversity.
ue interactions in the biotech medical industry, Journal of Business Re-

9S.-H. Hsiao / Journal of Business Research xxx (2014) xxx–xxx
Toivanen, O., Stoneman, P., & Bosworth, D. (2002). Innovation and themarket value of UKfirms, 1989–1995. Oxford Bulletin of Economics and Statistics, 64(1), 39–61.
Tomarken, A. J., & Waller, N. G. (2003). Potential problems with “Well Fitting” models.Journal of Abnormal Psychology, 112(4), 578–598.
Tomarken, A. J., & Waller, N. G. (2005). Structural equation modeling: Strengths, limita-tions, and misconceptions. Annual Review of Clinical Psychology, 1(1), 31–65.
Tsai, B. H. (2007). Innovation, market share and firm value: Evidence from personal com-puter industries. International Journal of Services and Standards, 3(1), 79–96.
Tsan, W. T. (2003). Present situation of Taiwan's industry wisdom capital creation. Re-trieved from http://www.rdec.gov.tw/public/Attachment/512113445471.pdf
Van Buren, M. E. (1999). A yard sticks for knowledge management. Training andDevelopment, 53(1), 71–74.
Wang, J. F. (2010). Initiates first orange technology exhibition in Taiwan. Retrieved fromhttp://top-en.ncku.edu.tw/files/14-1051-69844,r78-1.php
Please cite this article as: Hsiao, S.-H., PTE, innovation capital and firm valsearch (2014), http://dx.doi.org/10.1016/j.jbusres.2014.04.001
Wang, W. Y., & Chang, C. (2005). Intellectual capital and performance in casual models:Evidence from the information technology industry in Taiwan. Journal of IntellectualCapital, 6(2), 222–236.
Wang, H. W., & Wu, M. C. (2008). Business types and R&D activities performance. Journalof Management, 25(2), 173–193.
Wernerfelt, B. (1984). A resource-based view of the firm. Strategic Management Journal,5(2), 171–180.
Wong, K. A., & Lye, M. S. (1990). Market values, earnings' yields and stock returns: Evi-dence from Singapore. Journal of Banking & Finance, 14(2–3), 311–326.
Yeh, Y. H. (2005). Do controlling shareholders enhance corporate value? CorporateGovernance: an international Review, 13(2), 313–325.
ue interactions in the biotech medical industry, Journal of Business Re-