Embed Size (px)
Citation preview
November 2015 Final Report to PTAC on 2013 and 2015 Surveys 1/20
Final Report
To PTAC Collaboration Group
On 2013 and 2015 Surveys
November 2015
Sky Hunter Corporation
www.skyhunter.ca
403.830.8349
Letter to PTAC
Letter To PTAC
November 2015 Final Report to PTAC on 2013 and 2015 Surveys 2/20
PTAC statement:
The operators reviewed information, there is more to be done. The operators did indicate there is a
relationship between Sky Hunter readings and formation thickness.
20 November 2015
Sky Hunter thanks Petroleum Technology Alliance Canada (PTAC) for their funding and management of
this collaboration.
In addition, Sky Hunter thanks PTAC for its 2014 SME Commercialization Award.
The GeoViz Project in conjunction with VizworX forms a portion of this project.
We also want to thank the following for their funding, input and participation:
LOOKNorth Remote Sensing innovation for responsible, sustainable
development of Northern natural resources
Government of Alberta Enterprise and Advanced Education
The Participating Oil Sands Operators
As this is a collaboration, the project was adjusted by the participants as information was received and
evaluated. The time line increase was as a result of Sky Hunter’s operational requirements. The recent
data sets are undergoing continuing reviews by the project teams.
The introduction of new survey systems to the energy industry takes time and effort by all. We trust
the results of this collaboration will lead to effective use of this environmentally friendly, oil and gas
reservoir mapping system.
Again, a sincere thank you.
Ken Bradley Co-founder Russ Duncan Co-founder
Project Overview
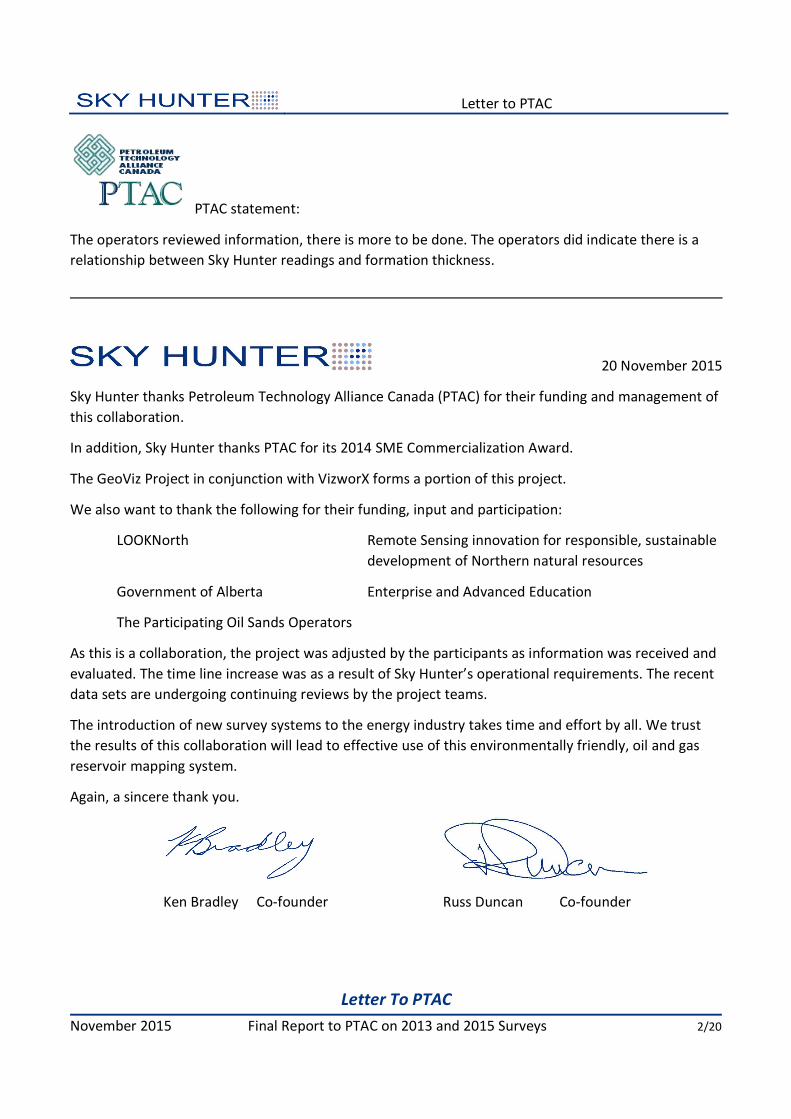
10,585 Total Line Km Flown in 10 Surveys
November 2015 Final Report to PTAC on 2013 and 2015 Surveys 3/20
Resource to Reserves Areas These hydrocarbon microseep surveys
cover large multi prospect areas with
widely spaced flight lines for an
exploratory scale overview defining
new potentially prospective areas.
250 m Line Spacing Yellow
Project Dates
A Aug 2013
B Aug 2013
C Aug 2013
D Sep 2013
E May 2015
Steam Chamber Areas These surveys have more closely spaced
flight lines to highlight detail within
existing SAGD projects. Follow-up
surveys can be used to monitor
changing reservoir conditions within
active steam chambers over time, e.g.
Jackfish 1.
50 m Line Spacing Red
Project Dates
1 Aug 2013
2 Aug 2013
3 Aug 2013
May 2015
4 Sep 2013
5 Sep 2013
Sky Hunter Survey System - Reservoir to Sensors
Hydrocarbons Migrate Vertically From Reservoirs
November 2015 Final Report to PTAC on 2013 and 2015 Surveys 4/20
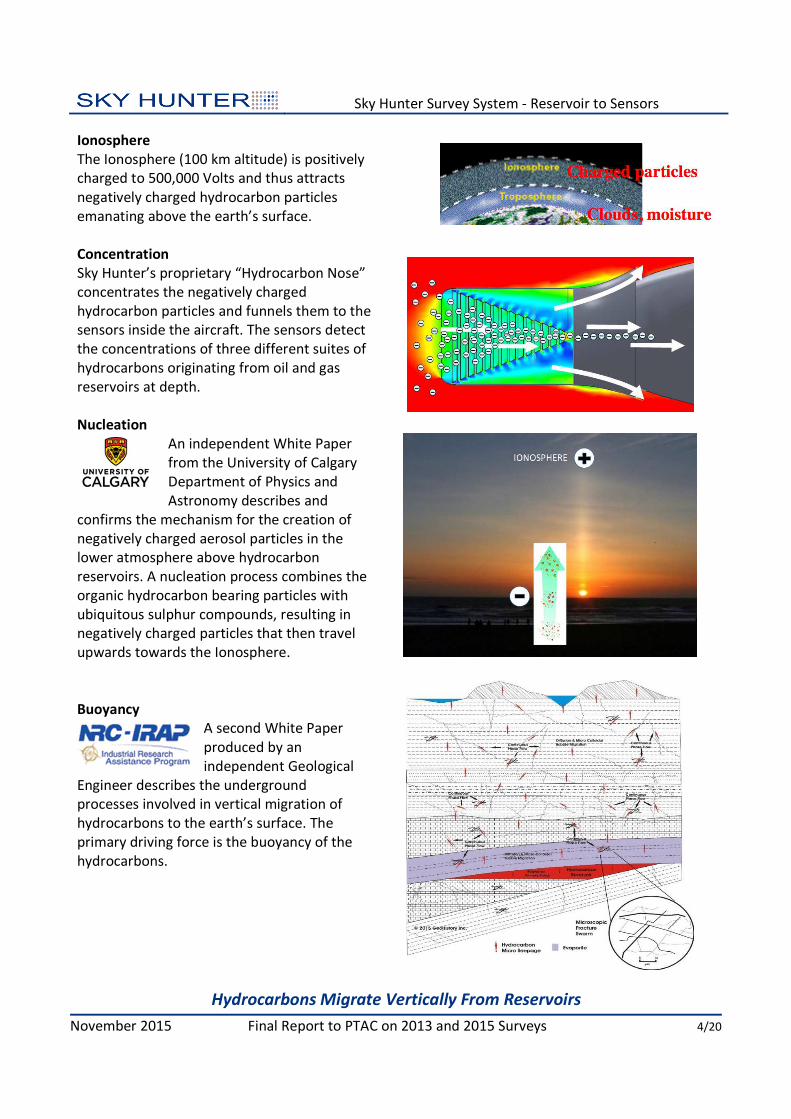
Ionosphere
The Ionosphere (100 km altitude) is positively
charged to 500,000 Volts and thus attracts
negatively charged hydrocarbon particles
emanating above the earth’s surface.
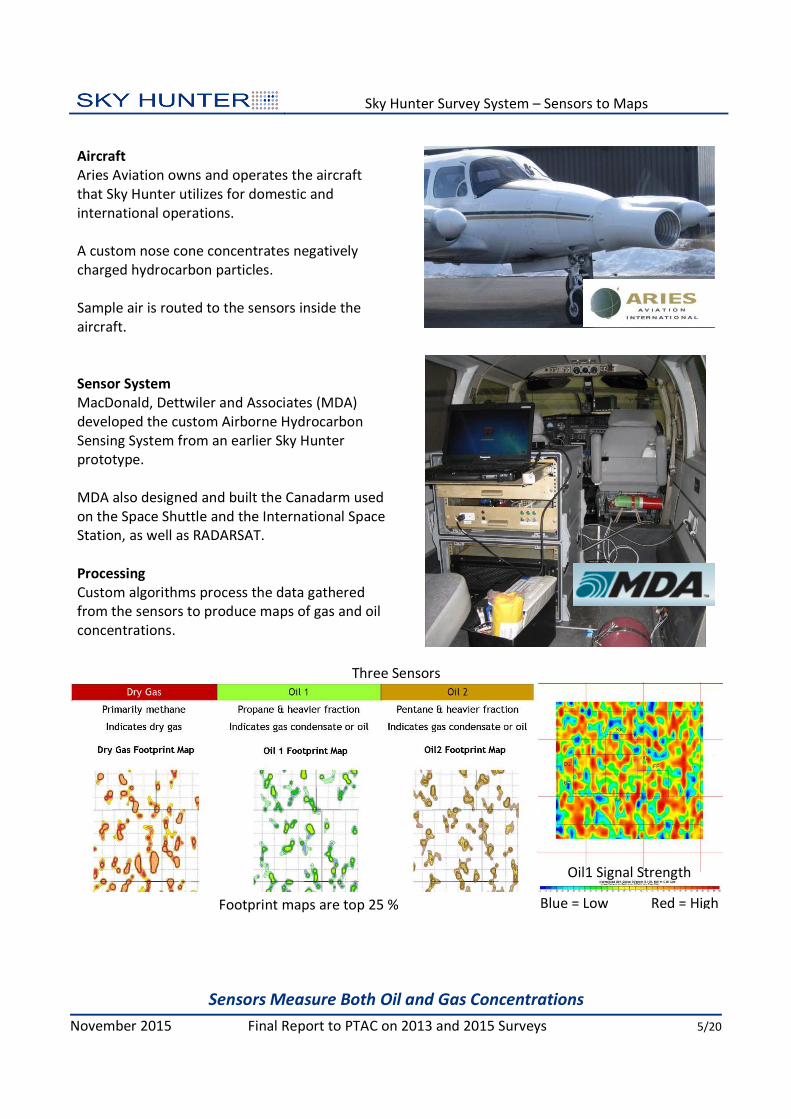
Concentration
Sky Hunter’s proprietary “Hydrocarbon Nose”
concentrates the negatively charged
hydrocarbon particles and funnels them to the
sensors inside the aircraft. The sensors detect
the concentrations of three different suites of
hydrocarbons originating from oil and gas
reservoirs at depth.
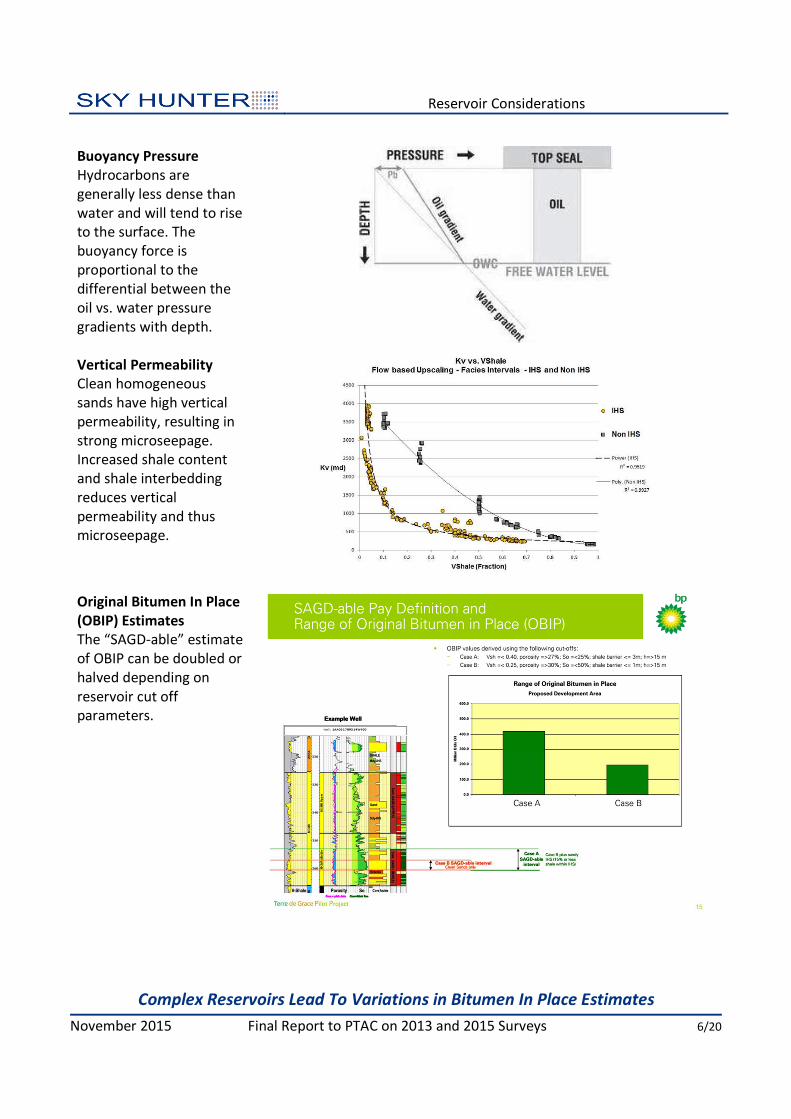
Nucleation
An independent White Paper
from the University of Calgary
Department of Physics and
Astronomy describes and
confirms the mechanism for the creation of
negatively charged aerosol particles in the
lower atmosphere above hydrocarbon
reservoirs. A nucleation process combines the
organic hydrocarbon bearing particles with
ubiquitous sulphur compounds, resulting in
negatively charged particles that then travel
upwards towards the Ionosphere.
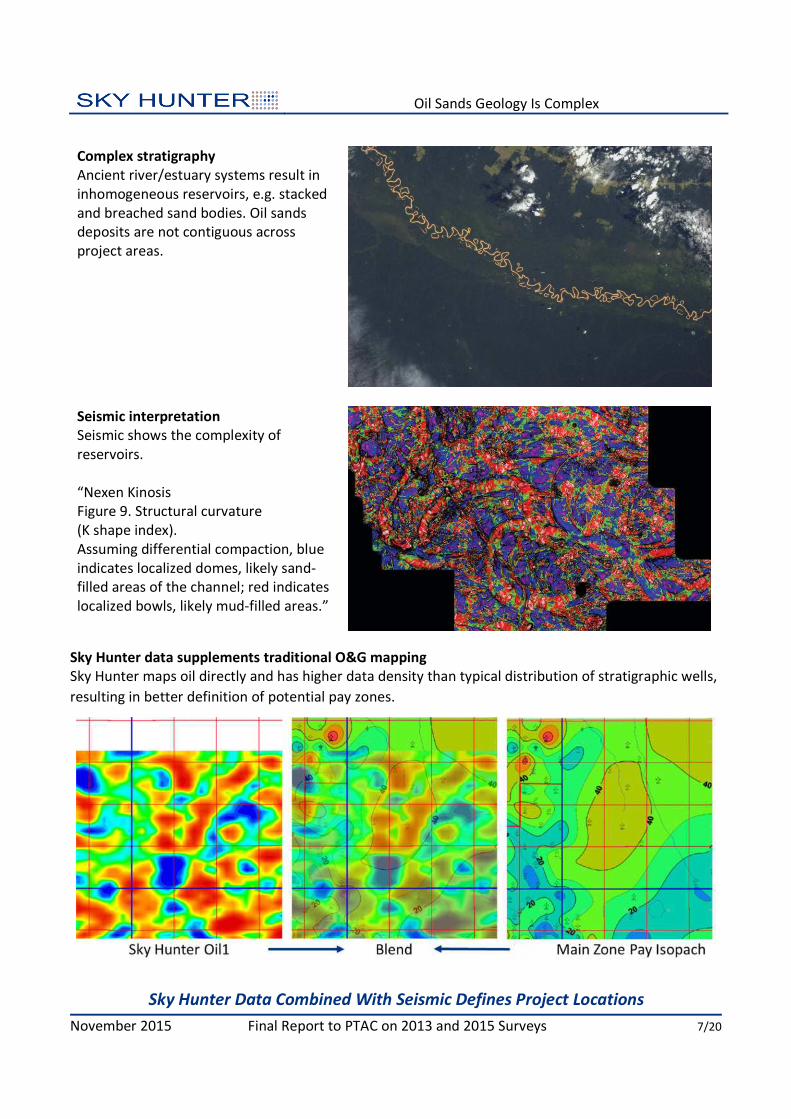
Buoyancy
A second White Paper
produced by an
independent Geological
Engineer describes the underground
processes involved in vertical migration of
hydrocarbons to the earth’s surface. The
primary driving force is the buoyancy of the
hydrocarbons.
Sky Hunter Survey System – Sensors to Maps
Sensors Measure Both Oil and Gas Concentrations
November 2015 Final Report to PTAC on 2013 and 2015 Surveys 5/20
Aircraft
Aries Aviation owns and operates the aircraft
that Sky Hunter utilizes for domestic and
international operations.
A custom nose cone concentrates negatively
charged hydrocarbon particles.
Sample air is routed to the sensors inside the
aircraft.
Sensor System
MacDonald, Dettwiler and Associates (MDA)
developed the custom Airborne Hydrocarbon
Sensing System from an earlier Sky Hunter
prototype.
MDA also designed and built the Canadarm used
on the Space Shuttle and the International Space
Station, as well as RADARSAT.
Processing
Custom algorithms process the data gathered
from the sensors to produce maps of gas and oil
concentrations.
Three Sensors
Oil1 Signal Strength
Blue = Low Red = High Footprint maps are top 25 %
Reservoir Considerations
Complex Reservoirs Lead To Variations in Bitumen In Place Estimates
November 2015 Final Report to PTAC on 2013 and 2015 Surveys 6/20
Buoyancy Pressure
Hydrocarbons are
generally less dense than
water and will tend to rise
to the surface. The
buoyancy force is
proportional to the
differential between the
oil vs. water pressure
gradients with depth.
Vertical Permeability
Clean homogeneous
sands have high vertical
permeability, resulting in
strong microseepage.
Increased shale content
and shale interbedding
reduces vertical
permeability and thus
microseepage.
Original Bitumen In Place
(OBIP) Estimates
The “SAGD-able” estimate
of OBIP can be doubled or
halved depending on
reservoir cut off
parameters.
Oil Sands Geology Is Complex
Sky Hunter Data Combined With Seismic Defines Project Locations
November 2015 Final Report to PTAC on 2013 and 2015 Surveys 7/20
Complex stratigraphy
Ancient river/estuary systems result in
inhomogeneous reservoirs, e.g. stacked
and breached sand bodies. Oil sands
deposits are not contiguous across
project areas.
Seismic interpretation
Seismic shows the complexity of
reservoirs.
“Nexen Kinosis
Figure 9. Structural curvature
(K shape index).
Assuming differential compaction, blue
indicates localized domes, likely sand-
filled areas of the channel; red indicates
localized bowls, likely mud-filled areas.”
Sky Hunter data supplements traditional O&G mapping
Sky Hunter maps oil directly and has higher data density than typical distribution of stratigraphic wells,
resulting in better definition of potential pay zones.
Reserves Repeat Project
Averaged Data Shows Repeatability
November 2015 Final Report to PTAC on 2013 and 2015 Surveys 8/20
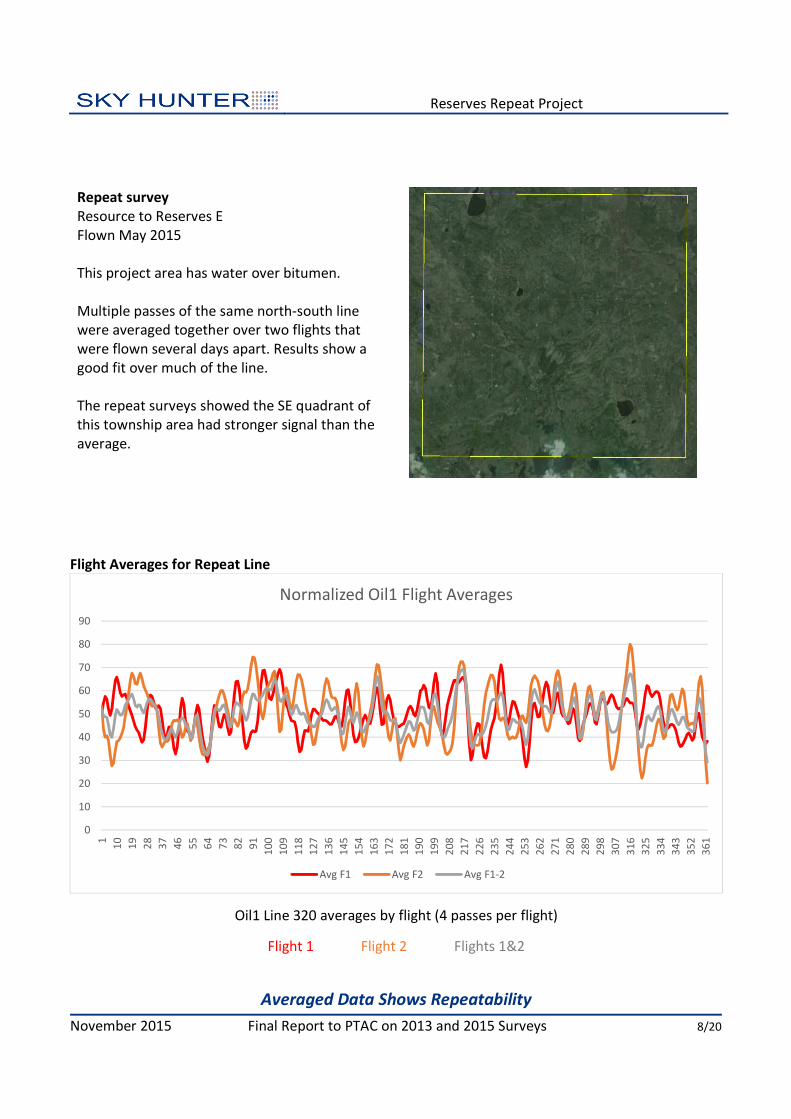
Repeat survey
Resource to Reserves E
Flown May 2015
This project area has water over bitumen.
Multiple passes of the same north-south line
were averaged together over two flights that
were flown several days apart. Results show a
good fit over much of the line.
The repeat surveys showed the SE quadrant of
this township area had stronger signal than the
average.
Flight Averages for Repeat Line
Oil1 Line 320 averages by flight (4 passes per flight)
Flight 1 Flight 2 Flights 1&2
0
10
20
30
40
50
60
70
80
90
1
10
19
28
37
46
55
64
73
82
91
10
0
10
9
11
8
12
7
13
6
14
5
15
4
16
3
17
2
18
1
19
0
19
9
20
8
21
7
22
6
23
5
24
4
25
3
26
2
27
1
28
0
28
9
29
8
30
7
31
6
32
5
33
4
34
3
35
2
36
1
Normalized Oil1 Flight Averages
Avg F1 Avg F2 Avg F1-2
Signal Strength vs. Remaining Bitumen In Place (Single Project)
Signal Strength Correlates with Remaining Bitumen In Place
November 2015 Final Report to PTAC on 2013 and 2015 Surveys 9/20
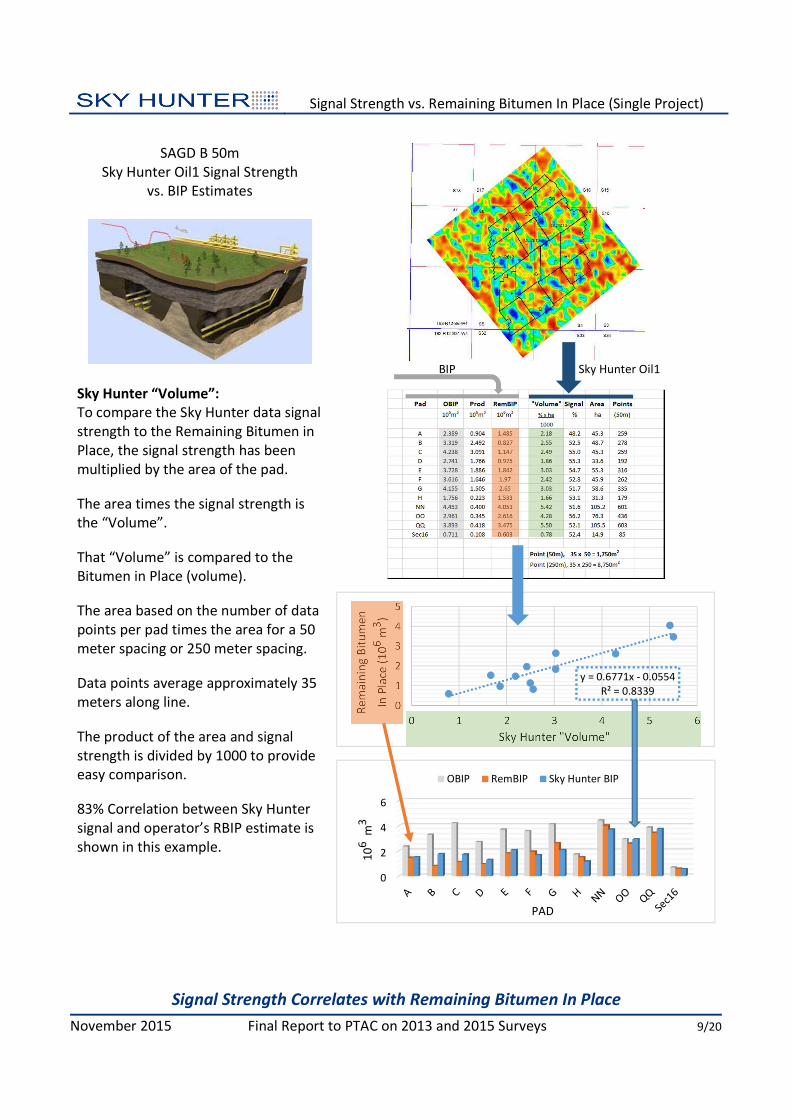
SAGD B 50m
Sky Hunter Oil1 Signal Strength
vs. BIP Estimates
Sky Hunter “Volume”:
To compare the Sky Hunter data signal
strength to the Remaining Bitumen in
Place, the signal strength has been
multiplied by the area of the pad.
The area times the signal strength is
the “Volume”.
That “Volume” is compared to the
Bitumen in Place (volume).
The area based on the number of data
points per pad times the area for a 50
meter spacing or 250 meter spacing.
Data points average approximately 35
meters along line.
The product of the area and signal
strength is divided by 1000 to provide
easy comparison.
83% Correlation between Sky Hunter
signal and operator’s RBIP estimate is
shown in this example.
BIP Sky Hunter Oil1
y = 0.6771x - 0.0554
R² = 0.8339
0
1
2
3
4
5
0 1 2 3 4 5 6
Re
ma
inin
g B
itu
me
n
In P
lace
(1
06
m3
)
Sky Hunter "Volume"
0
2
4
6
10
6m
3
PAD
OBIP RemBIP Sky Hunter BIP
Signal Strength vs. Remaining Bitumen In Place (All Projects)
Signal Strength Correlates with Remaining Bitumen In Place Over Multiple Projects
November 2015 Final Report to PTAC on 2013 and 2015 Surveys 10/20
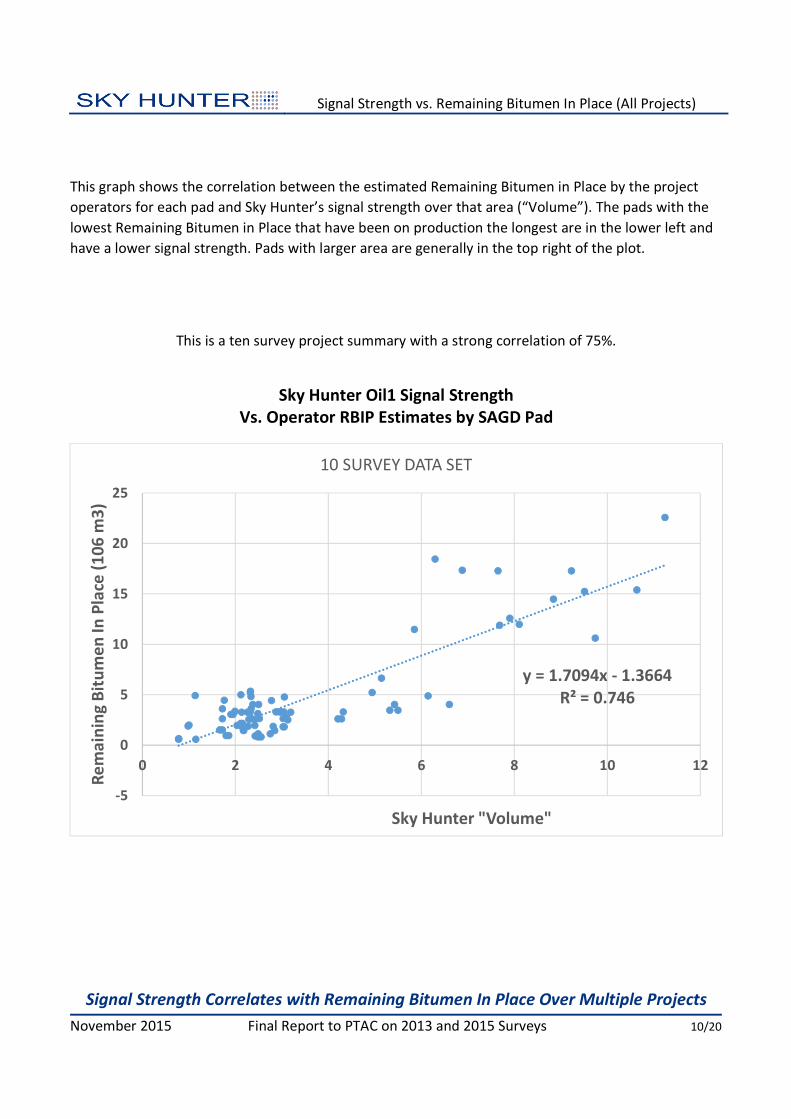
This graph shows the correlation between the estimated Remaining Bitumen in Place by the project
operators for each pad and Sky Hunter’s signal strength over that area (“Volume”). The pads with the
lowest Remaining Bitumen in Place that have been on production the longest are in the lower left and
have a lower signal strength. Pads with larger area are generally in the top right of the plot.
This is a ten survey project summary with a strong correlation of 75%.
Sky Hunter Oil1 Signal Strength
Vs. Operator RBIP Estimates by SAGD Pad
y = 1.7094x - 1.3664
R² = 0.746
-5
0
5
10
15
20
25
0 2 4 6 8 10 12
Re
ma
inin
g B
itu
me
n I
n P
lace
(1
06
m3
)
Sky Hunter "Volume"
10 SURVEY DATA SET
Using Signal Strength to Estimate Net Pay
Combine Sky Hunter Data and Reservoir Model to Estimate Net Pay Contours
November 2015 Final Report to PTAC on 2013 and 2015 Surveys 11/20
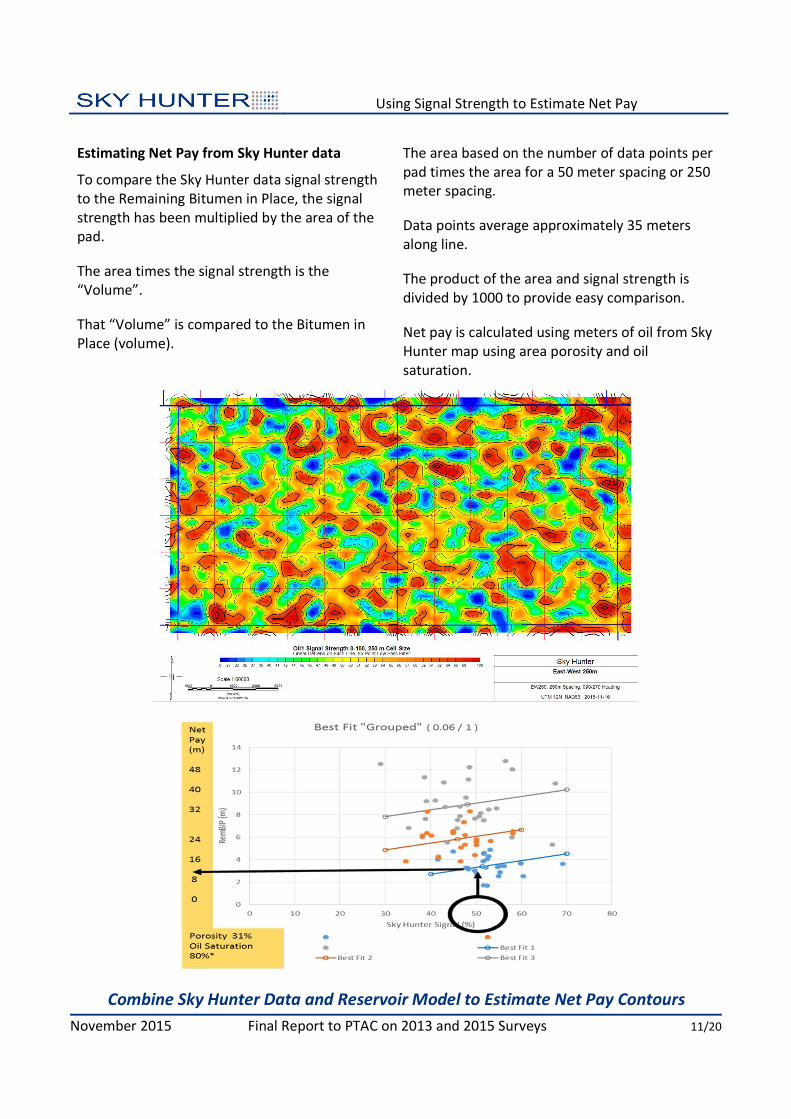
Estimating Net Pay from Sky Hunter data
To compare the Sky Hunter data signal strength
to the Remaining Bitumen in Place, the signal
strength has been multiplied by the area of the
pad.
The area times the signal strength is the
“Volume”.
That “Volume” is compared to the Bitumen in
Place (volume).
The area based on the number of data points per
pad times the area for a 50 meter spacing or 250
meter spacing.
Data points average approximately 35 meters
along line.
The product of the area and signal strength is
divided by 1000 to provide easy comparison.
Net pay is calculated using meters of oil from Sky
Hunter map using area porosity and oil
saturation.
Multiple Stacked Reservoirs
Sky Hunter Signal Strength Is the Sum of All Stacked zones
November 2015 Final Report to PTAC on 2013 and 2015 Surveys 12/20
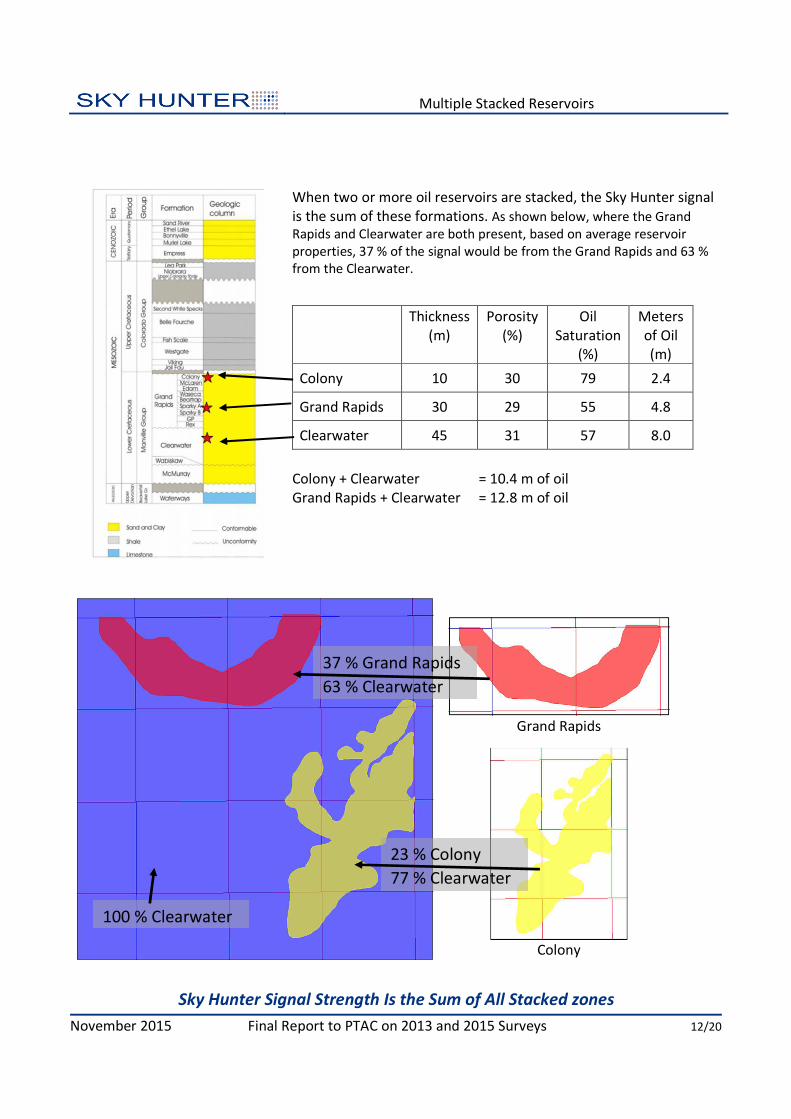
When two or more oil reservoirs are stacked, the Sky Hunter signal
is the sum of these formations. As shown below, where the Grand
Rapids and Clearwater are both present, based on average reservoir
properties, 37 % of the signal would be from the Grand Rapids and 63 %
from the Clearwater.
Thickness
(m)
Porosity
(%)
Oil
Saturation
(%)
Meters
of Oil
(m)
Colony 10 30 79 2.4
Grand Rapids 30 29 55 4.8
Clearwater 45 31 57 8.0
Colony + Clearwater = 10.4 m of oil
Grand Rapids + Clearwater = 12.8 m of oil
Grand Rapids
Colony
23 % Colony
77 % Clearwater
100 % Clearwater
37 % Grand Rapids
63 % Clearwater
Steam Chamber Survey
Microseep Signal Enhanced at Steam Front
November 2015 Final Report to PTAC on 2013 and 2015 Surveys 13/20
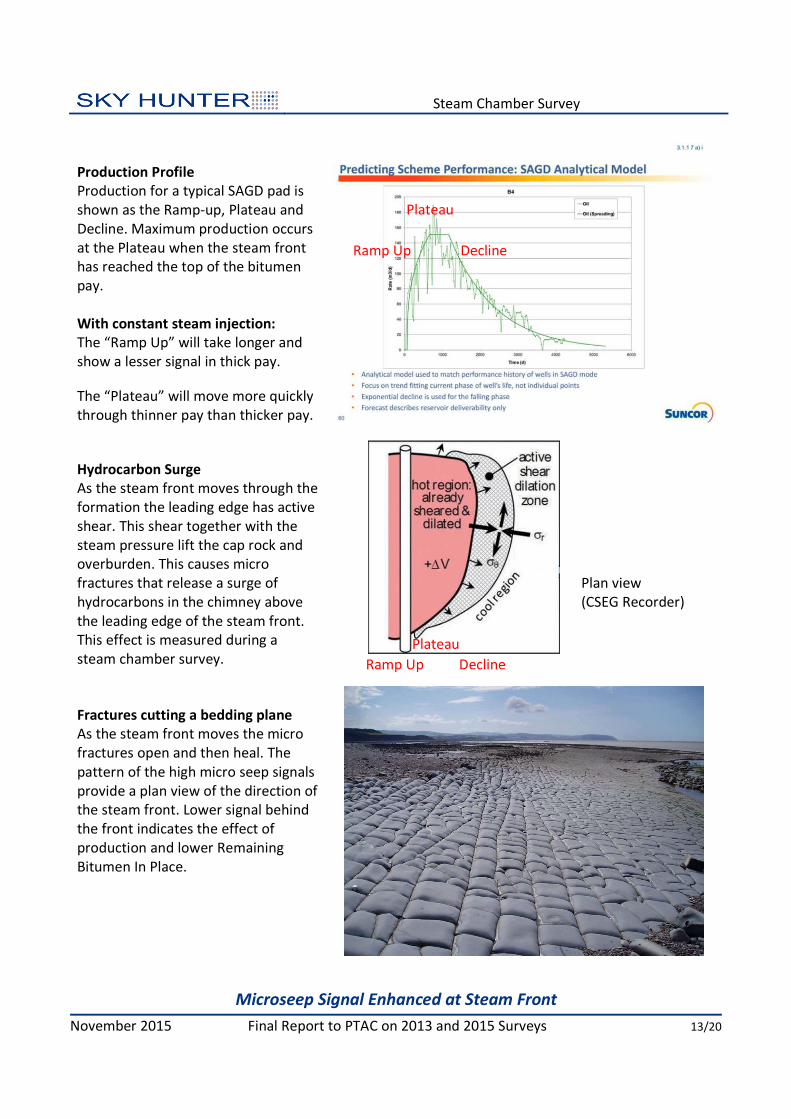
Production Profile
Production for a typical SAGD pad is
shown as the Ramp-up, Plateau and
Decline. Maximum production occurs
at the Plateau when the steam front
has reached the top of the bitumen
pay.
With constant steam injection:
The “Ramp Up” will take longer and
show a lesser signal in thick pay.
The “Plateau” will move more quickly
through thinner pay than thicker pay.
Hydrocarbon Surge
As the steam front moves through the
formation the leading edge has active
shear. This shear together with the
steam pressure lift the cap rock and
overburden. This causes micro
fractures that release a surge of
hydrocarbons in the chimney above
the leading edge of the steam front.
This effect is measured during a
steam chamber survey.
Plan view
(CSEG Recorder)
Fractures cutting a bedding plane
As the steam front moves the micro
fractures open and then heal. The
pattern of the high micro seep signals
provide a plan view of the direction of
the steam front. Lower signal behind
the front indicates the effect of
production and lower Remaining
Bitumen In Place.
Plateau
Ramp Up Decline
Plateau
Ramp Up Decline
Steam Chamber with 4D Seismic and Heave Mapping
The Combination of 4D Seismic, Surface Heave and Sky Hunter Mapping
Aid in the Definition of Steam Chambers.
November 2015 Final Report to PTAC on 2013 and 2015 Surveys 14/20
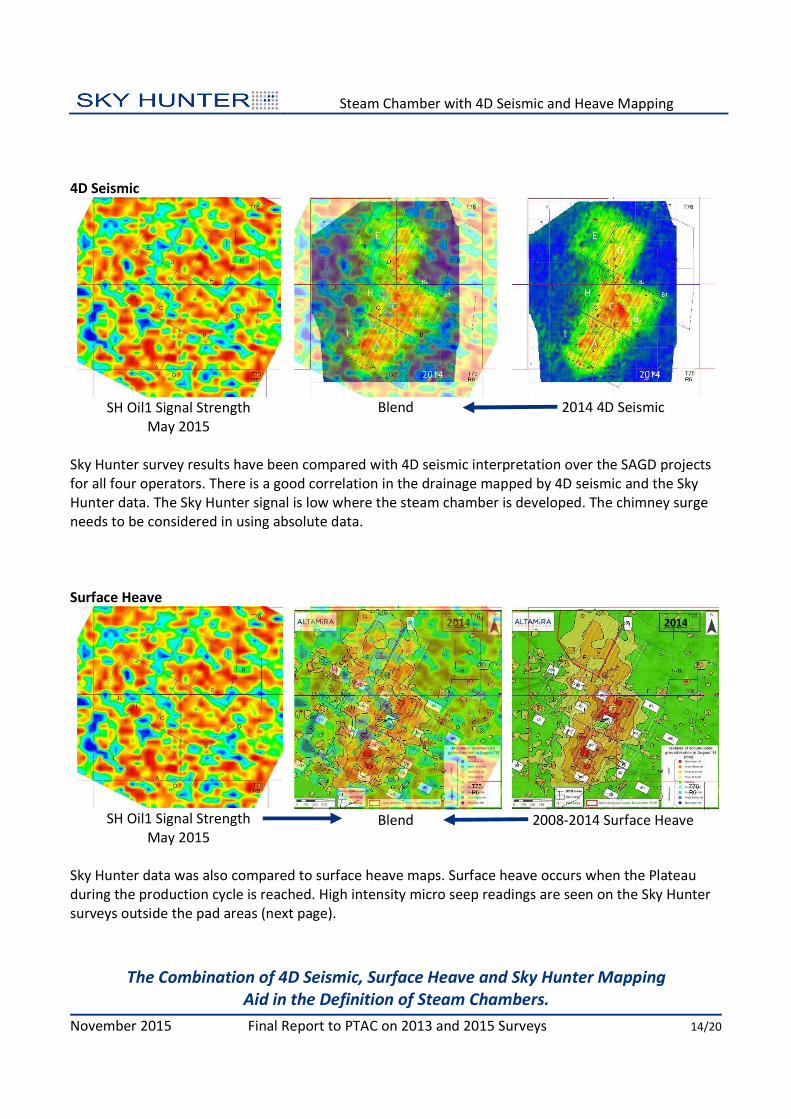
4D Seismic
SH Oil1 Signal Strength
May 2015
Blend
2014 4D Seismic
Sky Hunter survey results have been compared with 4D seismic interpretation over the SAGD projects
for all four operators. There is a good correlation in the drainage mapped by 4D seismic and the Sky
Hunter data. The Sky Hunter signal is low where the steam chamber is developed. The chimney surge
needs to be considered in using absolute data.
Surface Heave
SH Oil1 Signal Strength
May 2015
Blend
2008-2014 Surface Heave
Sky Hunter data was also compared to surface heave maps. Surface heave occurs when the Plateau
during the production cycle is reached. High intensity micro seep readings are seen on the Sky Hunter
surveys outside the pad areas (next page).
Reservoir Geomechanics
Signal Strength Can Be Used To Monitor Growth of Steam Chambers
November 2015 Final Report to PTAC on 2013 and 2015 Surveys 15/20
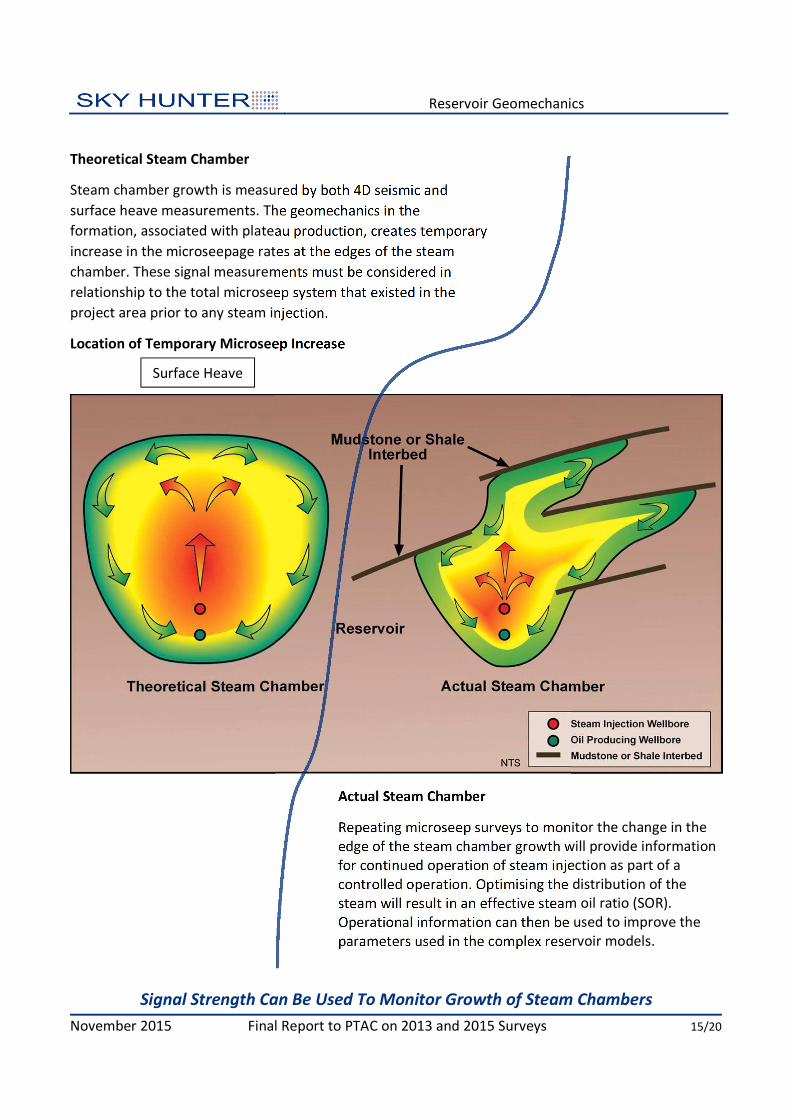
Theoretical Steam Chamber
Steam chamber growth is measured by both 4D seismic and
surface heave measurements. The geomechanics in the
formation, associated with plateau production, creates temporary
increase in the microseepage rates at the edges of the steam
chamber. These signal measurements must be considered in
relationship to the total microseep system that existed in the
project area prior to any steam injection.
Location of Temporary Microseep Increase
Actual Steam Chamber
Repeating microseep surveys to monitor the change in the
edge of the steam chamber growth will provide information
for continued operation of steam injection as part of a
controlled operation. Optimising the distribution of the
steam will result in an effective steam oil ratio (SOR).
Operational information can then be used to improve the
parameters used in the complex reservoir models.
Surface Heave
Observations
Additional Conclusions Remain To Be Gleaned from Sky Hunter Data
November 2015 Final Report to PTAC on 2013 and 2015 Surveys 16/20
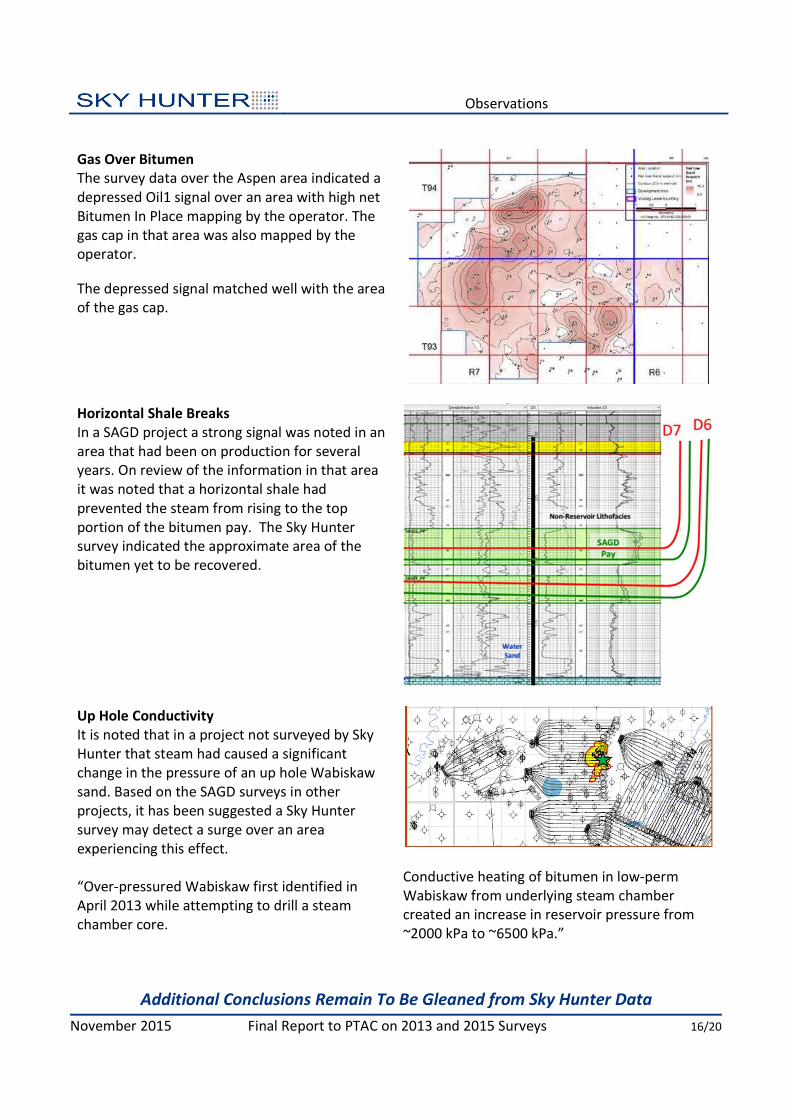
Gas Over Bitumen
The survey data over the Aspen area indicated a
depressed Oil1 signal over an area with high net
Bitumen In Place mapping by the operator. The
gas cap in that area was also mapped by the
operator.
The depressed signal matched well with the area
of the gas cap.
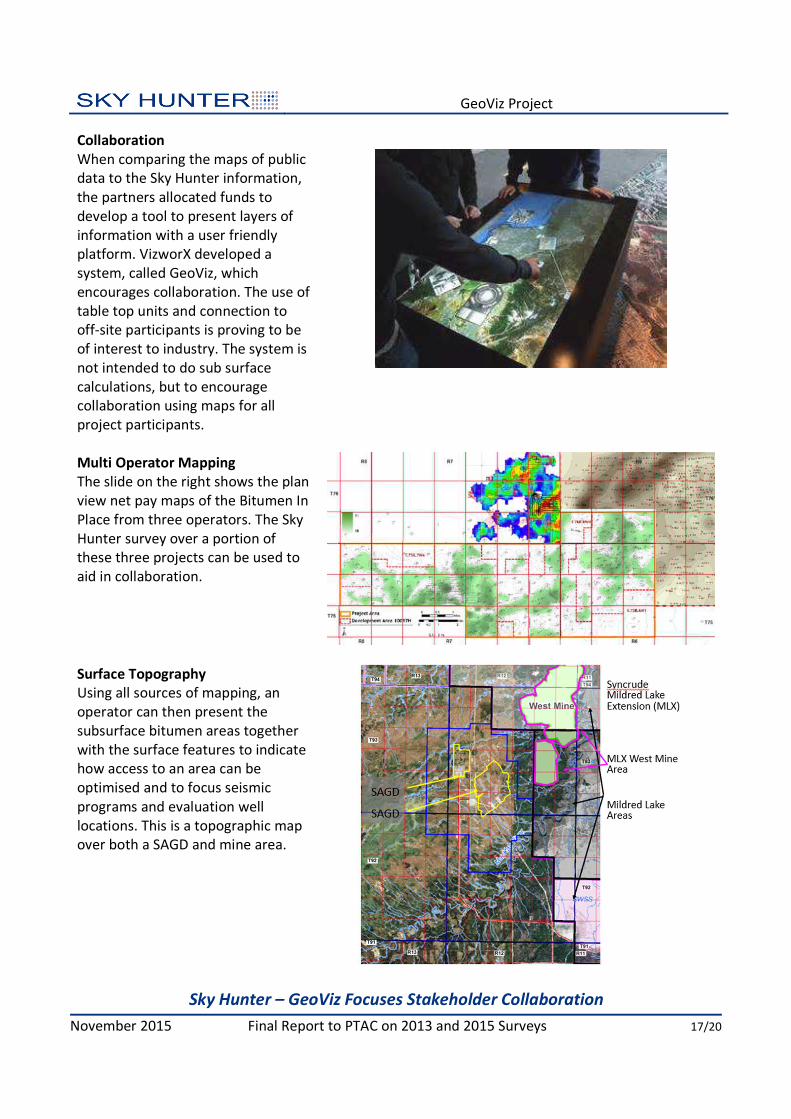
Horizontal Shale Breaks
In a SAGD project a strong signal was noted in an
area that had been on production for several
years. On review of the information in that area
it was noted that a horizontal shale had
prevented the steam from rising to the top
portion of the bitumen pay. The Sky Hunter
survey indicated the approximate area of the
bitumen yet to be recovered.
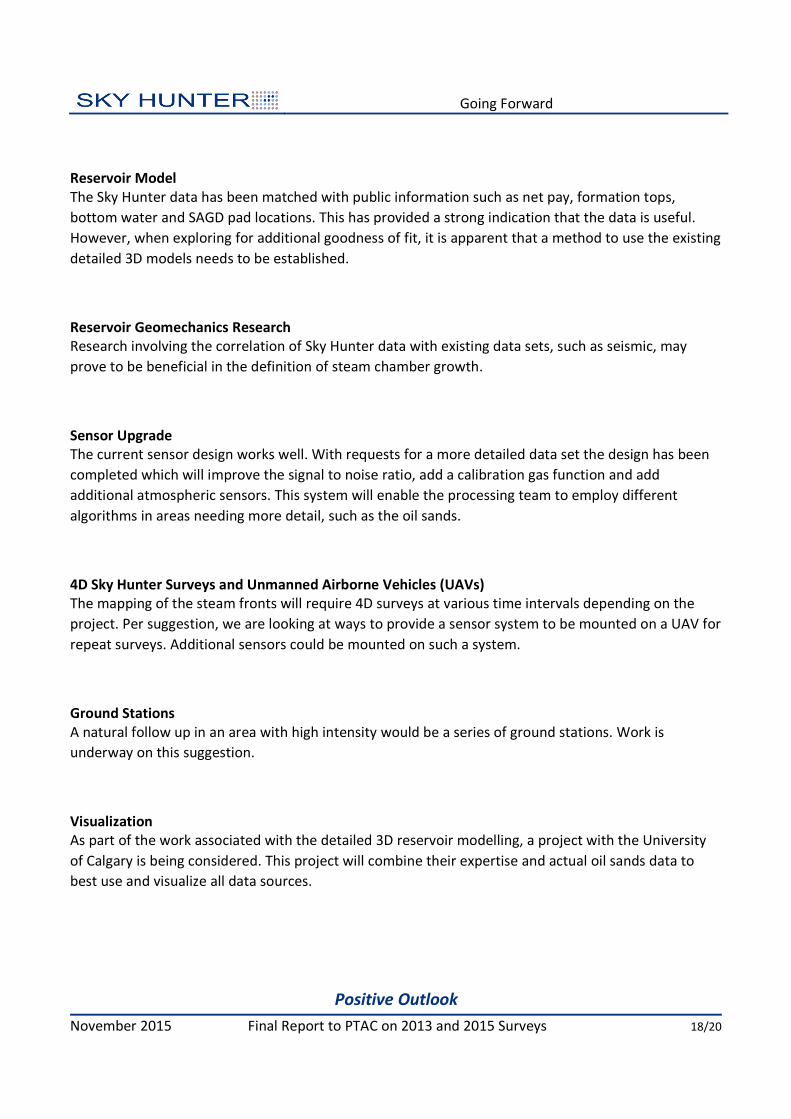
Up Hole Conductivity
It is noted that in a project not surveyed by Sky
Hunter that steam had caused a significant
change in the pressure of an up hole Wabiskaw
sand. Based on the SAGD surveys in other
projects, it has been suggested a Sky Hunter
survey may detect a surge over an area
experiencing this effect.
“Over-pressured Wabiskaw first identified in
April 2013 while attempting to drill a steam
chamber core.
Conductive heating of bitumen in low-perm
Wabiskaw from underlying steam chamber
created an increase in reservoir pressure from
~2000 kPa to ~6500 kPa.”
GeoViz Project
Sky Hunter – GeoViz Focuses Stakeholder Collaboration
November 2015 Final Report to PTAC on 2013 and 2015 Surveys 17/20
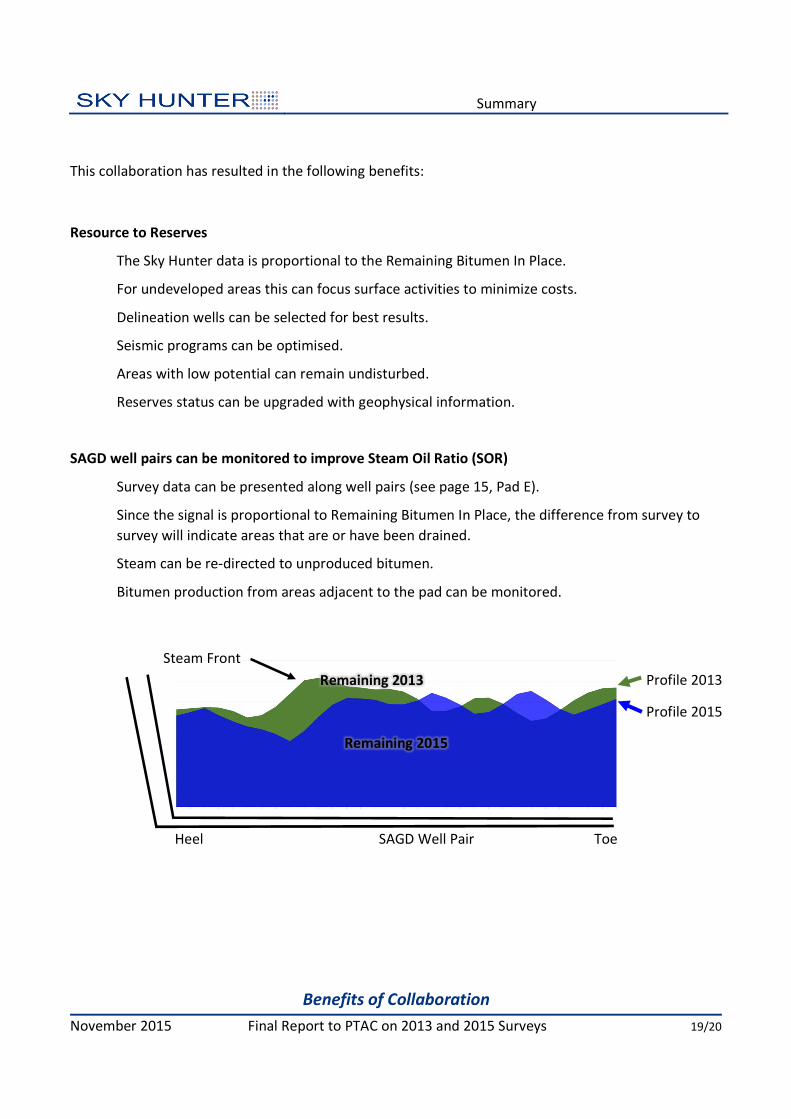
Collaboration
When comparing the maps of public
data to the Sky Hunter information,
the partners allocated funds to
develop a tool to present layers of
information with a user friendly
platform. VizworX developed a
system, called GeoViz, which
encourages collaboration. The use of
table top units and connection to
off-site participants is proving to be
of interest to industry. The system is
not intended to do sub surface
calculations, but to encourage
collaboration using maps for all
project participants.
Multi Operator Mapping
The slide on the right shows the plan
view net pay maps of the Bitumen In
Place from three operators. The Sky
Hunter survey over a portion of
these three projects can be used to
aid in collaboration.
Surface Topography
Using all sources of mapping, an
operator can then present the
subsurface bitumen areas together
with the surface features to indicate
how access to an area can be
optimised and to focus seismic
programs and evaluation well
locations. This is a topographic map
over both a SAGD and mine area.
Going Forward
Positive Outlook
November 2015 Final Report to PTAC on 2013 and 2015 Surveys 18/20
Reservoir Model
The Sky Hunter data has been matched with public information such as net pay, formation tops,
bottom water and SAGD pad locations. This has provided a strong indication that the data is useful.
However, when exploring for additional goodness of fit, it is apparent that a method to use the existing
detailed 3D models needs to be established.
Reservoir Geomechanics Research
Research involving the correlation of Sky Hunter data with existing data sets, such as seismic, may
prove to be beneficial in the definition of steam chamber growth.
Sensor Upgrade
The current sensor design works well. With requests for a more detailed data set the design has been
completed which will improve the signal to noise ratio, add a calibration gas function and add
additional atmospheric sensors. This system will enable the processing team to employ different
algorithms in areas needing more detail, such as the oil sands.
4D Sky Hunter Surveys and Unmanned Airborne Vehicles (UAVs)
The mapping of the steam fronts will require 4D surveys at various time intervals depending on the
project. Per suggestion, we are looking at ways to provide a sensor system to be mounted on a UAV for
repeat surveys. Additional sensors could be mounted on such a system.
Ground Stations
A natural follow up in an area with high intensity would be a series of ground stations. Work is
underway on this suggestion.
Visualization
As part of the work associated with the detailed 3D reservoir modelling, a project with the University
of Calgary is being considered. This project will combine their expertise and actual oil sands data to
best use and visualize all data sources.
Summary
Benefits of Collaboration
November 2015 Final Report to PTAC on 2013 and 2015 Surveys 19/20
This collaboration has resulted in the following benefits:
Resource to Reserves
The Sky Hunter data is proportional to the Remaining Bitumen In Place.
For undeveloped areas this can focus surface activities to minimize costs.
Delineation wells can be selected for best results.
Seismic programs can be optimised.
Areas with low potential can remain undisturbed.
Reserves status can be upgraded with geophysical information.
SAGD well pairs can be monitored to improve Steam Oil Ratio (SOR)
Survey data can be presented along well pairs (see page 15, Pad E).
Since the signal is proportional to Remaining Bitumen In Place, the difference from survey to
survey will indicate areas that are or have been drained.
Steam can be re-directed to unproduced bitumen.
Bitumen production from areas adjacent to the pad can be monitored.
Steam Front
Remaining 2013 Profile 2013
Profile 2015
Remaining 2015
Heel SAGD Well Pair Toe
PTAC Award
PTAC Award
November 2015 Final Report to PTAC on 2013 and 2015 Surveys 20/20
Commercialization of SME Technology Award
Sky Hunter Corporation (a private Canadian company) was honored to receive this recognition from
the Board of Directors and Executive of PTAC (Petroleum Technology Alliance of Canada). Sky Hunter
accepted this award at PTAC’s Annual General Meeting on May 26th-2014; at The Petroleum Club in
Calgary. “This technology offers significant reductions in costs and in environmental footprint as
compared to existing methods. Four initial air surveys were conducted and analyzed in 2013. The
results led to additional surveys in 2014 … Sky Hunter is currently building on this project to perform
new surveys for clients…” Sky Hunter was selected for successfully validating and commercializing their
innovative system which promotes the sustainable development of Canada’s hydrocarbon resources
with a revolutionary, patented, hydrocarbon mapping technology.
In commenting on the award, Sky Hunter stated: “We are delighted with this industry recognition of
our technology which in combination with a number of successful recent demonstrations of the
technology’s effectiveness has created new opportunities for Sky Hunter to partner with additional
operating companies engaged in both exploration, development and operations.” Sky Hunter’s aerial
survey system uses sophisticated proprietary techniques to identify hydrocarbon deposits from the
presence of molecules in the atmosphere over the deposit. Sky Hunter recently partnered with four
major oil sands operators to demonstrate the effectiveness of the Sky Hunter system over each of their
properties. One survey which was flown at 50m line spacing was able to accurately locate SAGD well
pairs, bypassed pay, mud channels and spent zones. This revolutionary technology was recently
patented in the USA (others pending) after thirteen years and over $10M invested in research and
development. Sky Hunter has proven capable of finding and mapping oil, NGLs and dry gas from an
airplane on and offshore.