Embed Size (px)
Citation preview
PT Bank Mandiri (Persero) TbkPT Bank Mandiri (Persero) TbkQ2 2010Results Presentation
23 J l 201023 July 2010
0
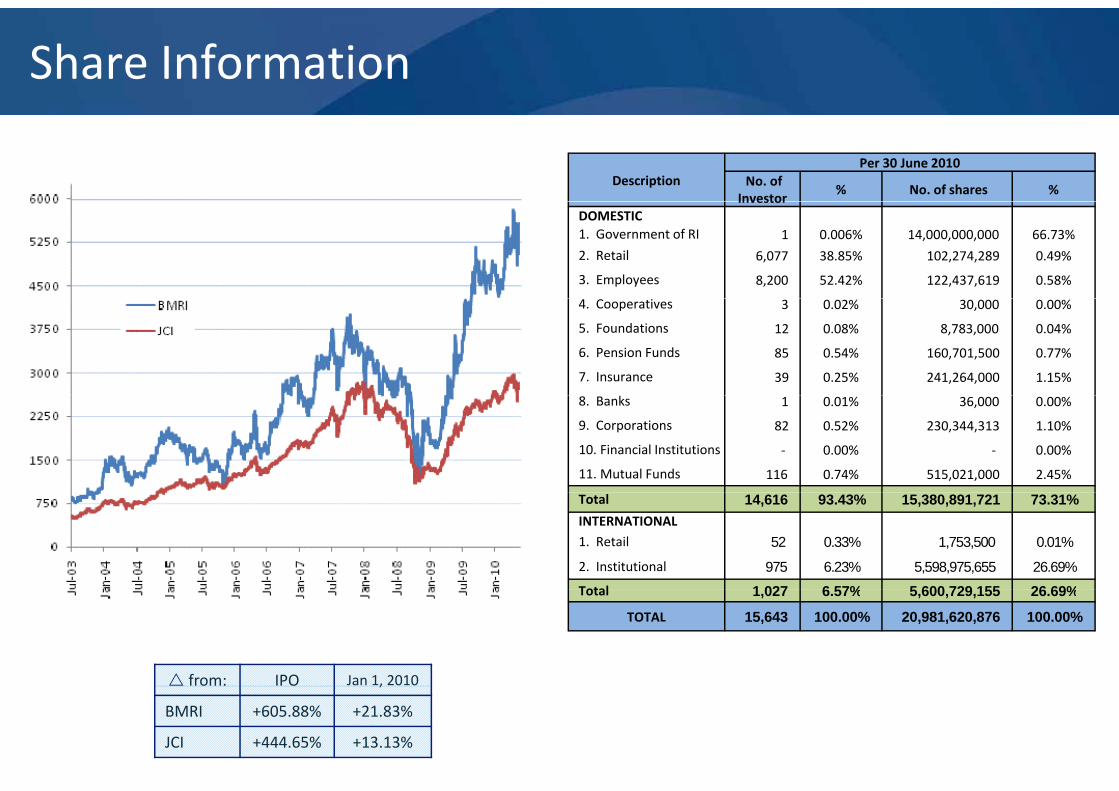
Share Information
DescriptionPer 30 June 2010
No. of Investor
% No. of shares %Investor
DOMESTIC1. Government of RI 1 0.006% 14,000,000,000 66.73%
2. Retail 6,077 38.85% 102,274,289 0.49%
3. Employees 8,200 52.42% 122,437,619 0.58%
4. Cooperatives 3 0.02% 30,000 0.00%
5. Foundations 12 0.08% 8,783,000 0.04%
6. Pension Funds 85 0.54% 160,701,500 0.77%
7. Insurance 39 0.25% 241,264,000 1.15%
8. Banks 1 0.01% 36,000 0.00%
9. Corporations 82 0.52% 230,344,313 1.10%
10. Financial Institutions ‐ 0.00% ‐ 0.00%
11. Mutual Funds 116 0.74% 515,021,000 2.45%
Total 14,616 93.43% 15,380,891,721 73.31%INTERNATIONAL1. Retail 52 0.33% 1,753,500 0.01%
2. Institutional 975 6.23% 5,598,975,655 26.69%
Total 1 027 6 57% 5 600 729 155 26 69%
from: IPO Jan 1, 2010
Total 1,027 6.57% 5,600,729,155 26.69%
TOTAL 15,643 100.00% 20,981,620,876 100.00%
84
,
BMRI +605.88% +21.83%
JCI +444.65% +13.13%
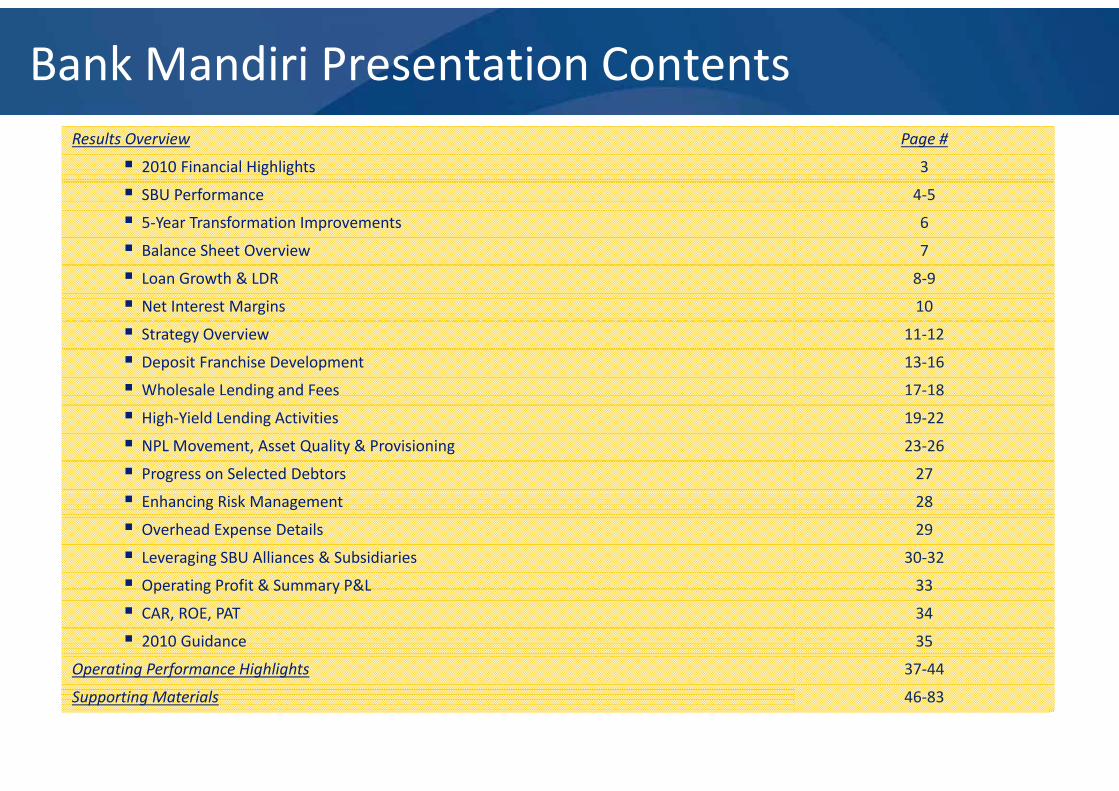
Bank Mandiri Presentation ContentsResults Overview Page #
2010 Financial Highlights 3
SBU Performance 4‐5
5‐Year Transformation Improvements 6
Balance Sheet Overview 7
Loan Growth & LDR 8‐9
Net Interest Margins 10
Strategy Overview 11‐12
Deposit Franchise Development 13‐16
Wholesale Lending and Fees 17‐18o esa e e d g a d ees 8
High‐Yield Lending Activities 19‐22
NPL Movement, Asset Quality & Provisioning 23‐26
Progress on Selected Debtors 27
Enhancing Risk Management 28
Overhead Expense Details 29
Leveraging SBU Alliances & Subsidiaries 30‐32
Operating Profit & Summary P&L 33Operating Profit & Summary P&L 33
CAR, ROE, PAT 34
2010 Guidance 35
Operating Performance Highlights 37‐44
1
Supporting Materials 46‐83
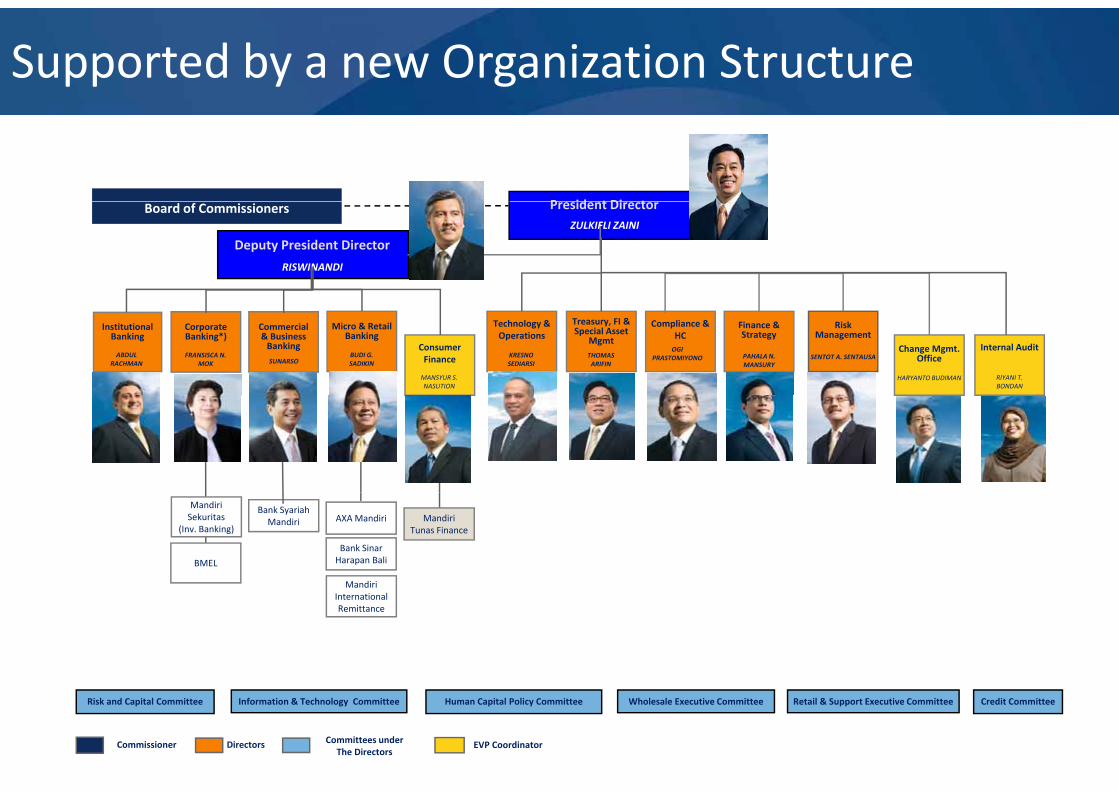
Supported by a new Organization Structure
P id t Di tBoard of Commissioners President Director
Deputy President Director
RISWINANDI
ZULKIFLI ZAINI
Corporate Banking*)
Commercial& Business Banking
Micro & RetailBanking
Risk Management
Finance &Strategy
Compliance & HC
Internal AuditConsumer Finance
Treasury, FI & Special Asset
MgmtChange Mgmt.
Office
Institutional Banking
Technology & Operations
ABDUL RACHMAN SUNARSO
BUDI G.SADIKIN
MANSYUR S. NASUTION
KRESNO SEDIARSI
FRANSISCA N. MOK
THOMAS ARIFIN
OGI PRASTOMIYONO PAHALA N.
MANSURY
HARYANTO BUDIMAN RIYANI T.BONDAN
SENTOT A. SENTAUSA
Bank SyariahMandiri AXA Mandiri
Bank SinarHarapan Bali
Mandiri
MandiriTunas Finance
Mandiri Sekuritas
(Inv. Banking)
BMEL
International Remittance
Commissioner Directors EVP Coordinator
Risk and Capital Committee Information & Technology Committee Human Capital Policy Committee Wholesale Executive Committee Retail & Support Executive Committee
Committees underThe Directors
Credit Committee
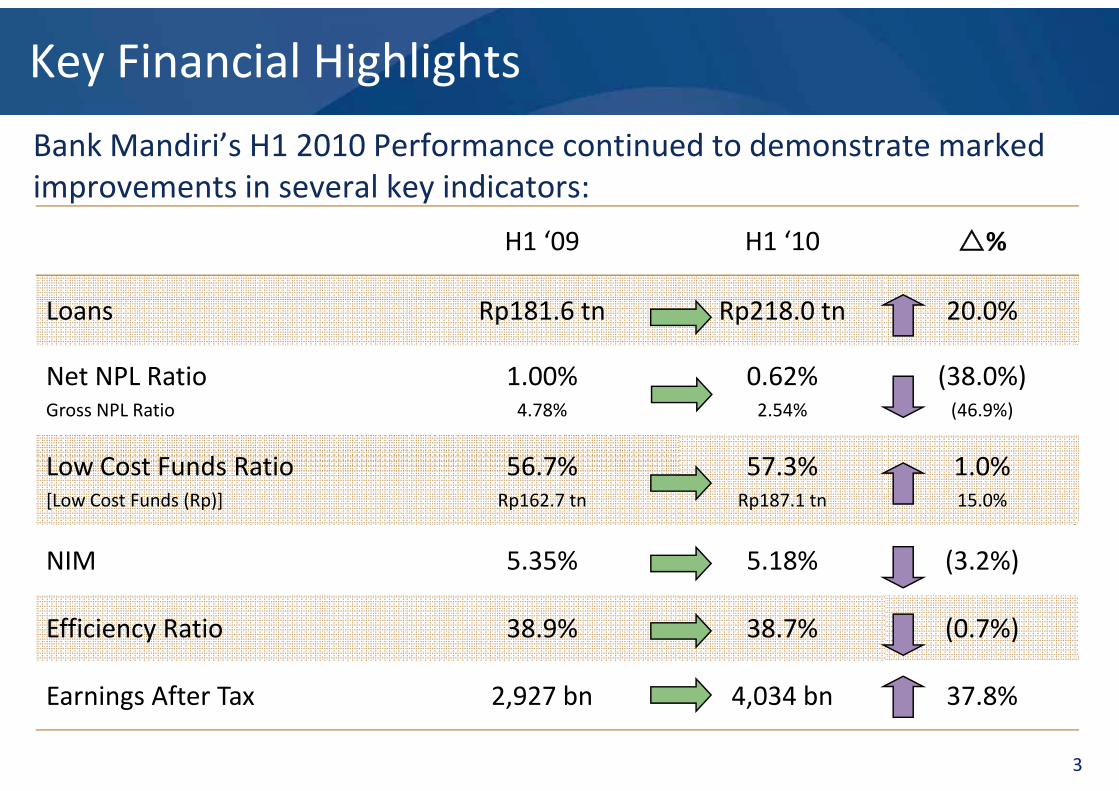
Key Financial Highlights
Bank Mandiri’s H1 2010 Performance continued to demonstrate marked improvements in several key indicators:p y
H1 ‘09 H1 ‘10 %
Loans Rp181.6 tn Rp218.0 tn 20.0%
Net NPL Ratio 1.00% 0.62% (38.0%)Gross NPL Ratio 4.78% 2.54% (46.9%)
Low Cost Funds Ratio 56.7% 57.3% 1.0%[Low Cost Funds (Rp)] Rp162.7 tn Rp187.1 tn 15.0%
NIM 5.35% 5.18% (3.2%)
Efficiency Ratio 38.9% 38.7% (0.7%)
f b b
3
Earnings After Tax 2,927 bn 4,034 bn 37.8%
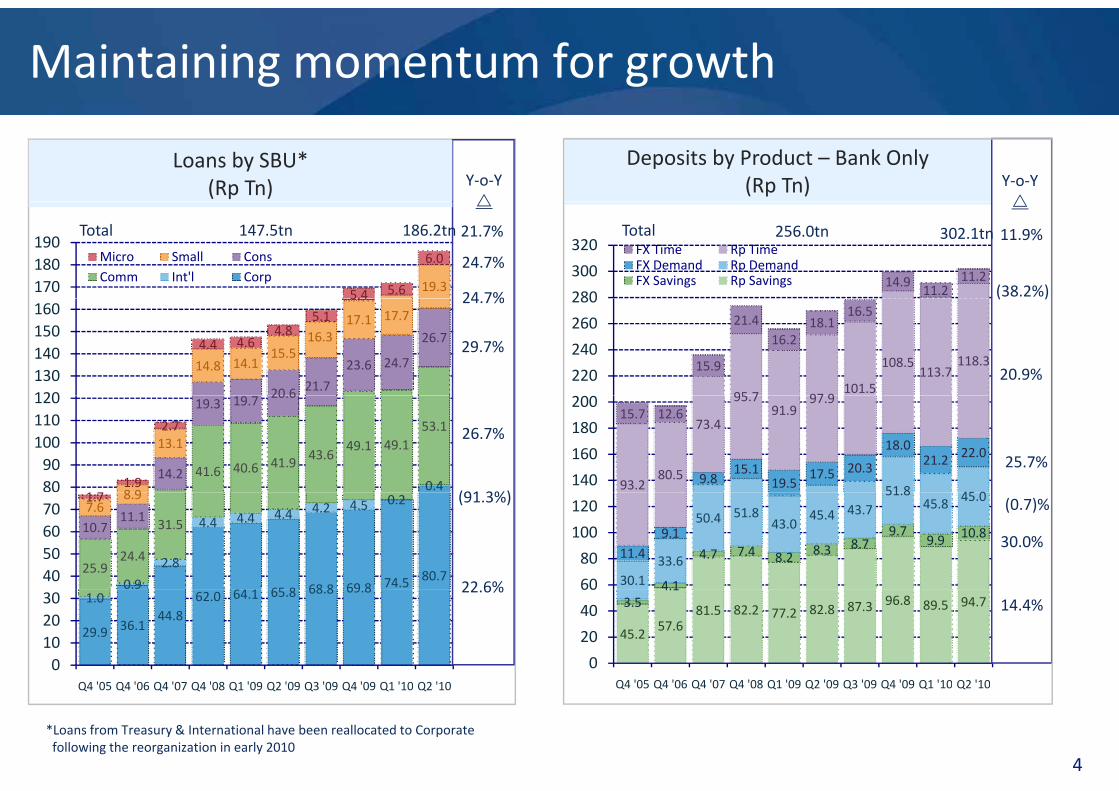
Maintaining momentum for growth
Y‐o‐Y
Y‐o‐Y
Loans by SBU*(Rp Tn)
Deposits by Product – Bank Only(Rp Tn)
14.911.2
11.2
280
300
320 FX Time Rp TimeFX Demand Rp DemandFX Savings Rp Savings19.35.4 5.6
6.0
170180190
Micro Small Cons Comm Int'l Corp
(38.2%)
24.7%
24 7%
21.7%147.5tn 186.2tnTotal Total 256.0tn 302.1tn 11.9%
95 7 97 9101.5
108.5113.7
118.315.9
21.416.2
18.116.5
220
240
260
280
20 6 21.7
23.6 24.7
26.7
14.8 14.115.5
16.317.1 17.7
4.4 4.64.8
5.1
5.4
120130140150160
( )
20.9%
24.7%
29.7%
51 8 45 09.8
15.119.5
17.5 20.3
18.021.2 22.0
93.280.5
73.4
95.791.9
97.915.7 12.6
140
160
180
200
0.441.6 40.6 41.9 43.6
49.1 49.153.1
14.2
19.3 19.7 20.6
8 9
13.1
11.9
2.7
8090
100110120
25.7%
26.7%
(91 3%)
4.1
4.7 7.4 8.2 8.3 8.79.7
9.9 10.8
30.133.6
50.4 51.843.0
45.4 43.751.8
45.8 45.0
11.49.1
60
80
100
120
65 8 68 8 69 8 74.5 80.70.9
2.8
4.4 4.4 4.4 4.2 4.5 0.2
25.924.4
31.510.711.1
7.68.91.7
40506070 (0.7)%
22 6%
(91.3%)
30.0%
45.2 57.681.5 82.2 77.2 82.8 87.3 96.8 89.5 94.73.5
4.1
0
20
40
60
Q4 '05 Q4 '06 Q4 '07 Q4 '08 Q1 '09 Q2 '09 Q3 '09 Q4 '09 Q1 '10 Q2 '10
29.9 36.144.8
62.0 64.1 65.8 68.8 69.81.0
0102030
Q4 '05 Q4 '06 Q4 '07 Q4 '08 Q1 '09 Q2 '09 Q3 '09 Q4 '09 Q1 '10 Q2 '10
14.4%22.6%
4
Q4 05 Q4 06 Q4 07 Q4 08 Q1 09 Q2 09 Q3 09 Q4 09 Q1 10 Q2 10Q4 05 Q4 06 Q4 07 Q4 08 Q1 09 Q2 09 Q3 09 Q4 09 Q1 10 Q2 10
*Loans from Treasury & International have been reallocated to Corporate following the reorganization in early 2010
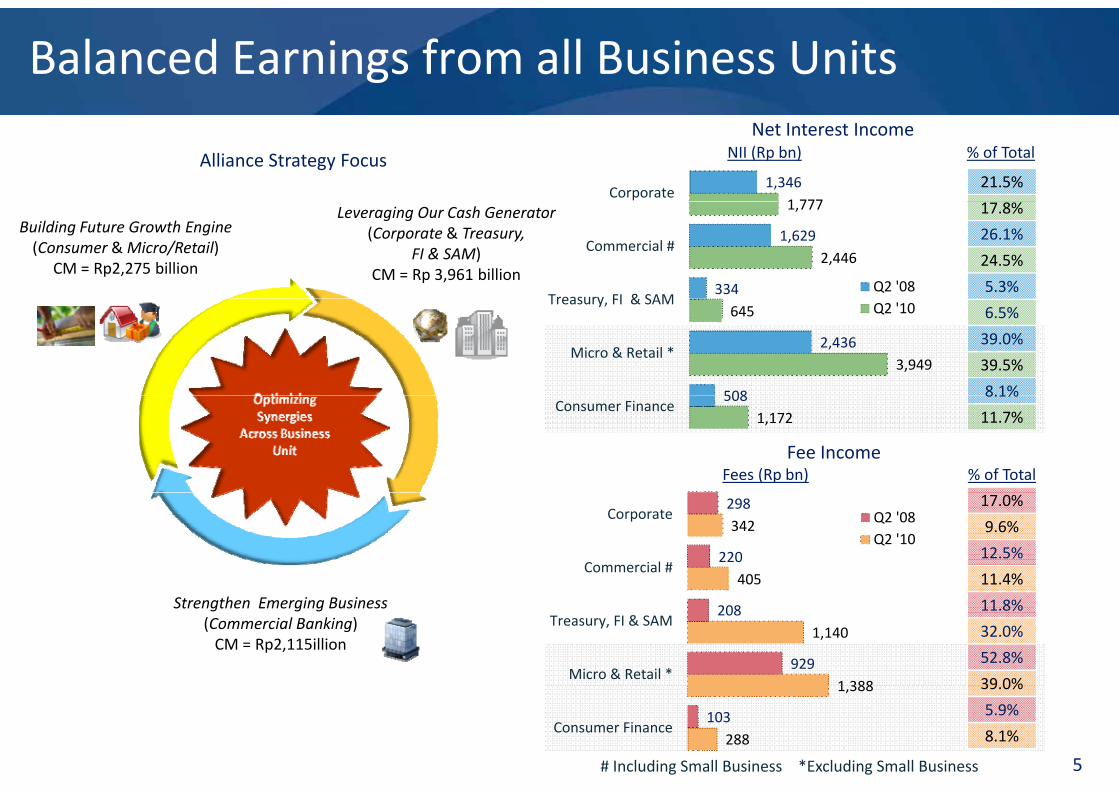
Balanced Earnings from all Business Units
21.5%1 777
1,346Corporate
Net Interest IncomeNII (Rp bn) % of TotalAlliance Strategy Focus
17.8%
26.1%
24.5%
5.3%
2,446
1,777
334
1,629
Treasury FI & SAM
Commercial #
Q2 '08
Building Future Growth Engine(Consumer & Micro/Retail)
CM = Rp2,275 billion
Leveraging Our Cash Generator(Corporate & Treasury,
FI & SAM) CM = Rp 3,961 billion
6.5%
39.0%
39.5%
8.1%
3,949
645
508
2,436Micro & Retail *
Treasury, FI & SAM Q2 '10
Fee IncomeFees (Rp bn) % of Total
8.1%
11.7%1,172508
Consumer Finance
17.0%
9.6%
12.5%
11.4%405
342
220
298
Commercial #
Corporate Q2 '08Q2 '10
11.8%
32.0%
52.8%
39 0%1 388
1,140
929
208
Micro & Retail *
Treasury, FI & SAMStrengthen Emerging Business
(Commercial Banking)CM = Rp2,115illion
39.0%
5.9%
8.1%288
1,388
103Consumer Finance
5# Including Small Business *Excluding Small Business
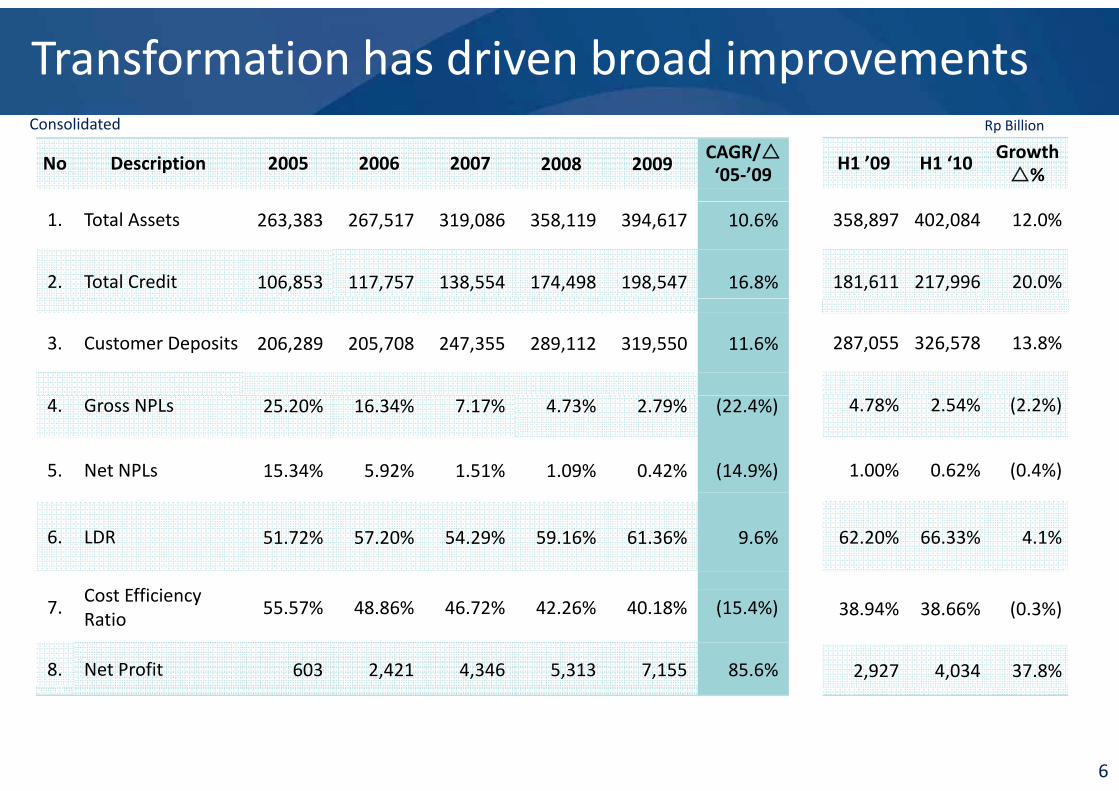
Transformation has driven broad improvements
No Description 2005 2006 2007 2008 2009CAGR/‘05‐’09
H1 ’09 H1 ‘10 Growth%
Consolidated Rp Billion
1. Total Assets 263,383 267,517 319,086 358,119 394,617 10.6%
2. Total Credit 106,853 117,757 138,554 174,498 198,547 16.8%
358,897 402,084 12.0%
181,611 217,996 20.0%
3. Customer Deposits 206,289 205,708 247,355 289,112 319,550 11.6% 287,055 326,578 13.8%
4. Gross NPLs 25.20% 16.34% 7.17% 4.73% 2.79% (22.4%)
5. Net NPLs 15.34% 5.92% 1.51% 1.09% 0.42% (14.9%)
4.78% 2.54% (2.2%)
1.00% 0.62% (0.4%)
6. LDR 51.72% 57.20% 54.29% 59.16% 61.36% 9.6%
C Effi i
62.20% 66.33% 4.1%
7.Cost Efficiency Ratio
55.57% 48.86% 46.72% 42.26% 40.18% (15.4%)
8. Net Profit 603 2,421 4,346 5,313 7,155 85.6%
38.94% 38.66% (0.3%)
2,927 4,034 37.8%
6
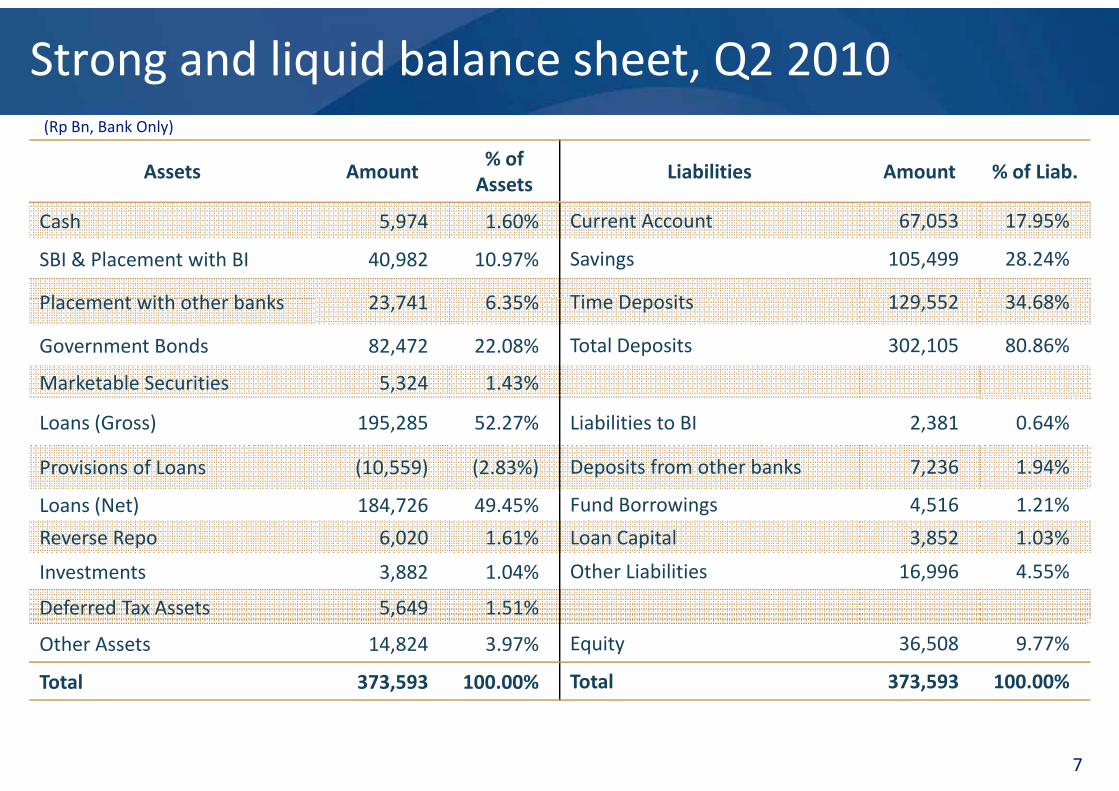
Strong and liquid balance sheet, Q2 2010
Assets Amount% of Assets
Liabilities Amount % of Liab.
(Rp Bn, Bank Only)
Cash 5,974 1.60% Current Account 67,053 17.95%
SBI & Placement with BI 40,982 10.97% Savings 105,499 28.24%
Pl t ith th b k 23 741 6 35% Time Deposits 129 552 34 68%Placement with other banks 23,741 6.35% Time Deposits 129,552 34.68%
Government Bonds 82,472 22.08% Total Deposits 302,105 80.86%
Marketable Securities 5,324 1.43%
Loans (Gross) 195,285 52.27% Liabilities to BI 2,381 0.64%
Provisions of Loans (10,559) (2.83%) Deposits from other banks 7,236 1.94%
Loans (Net) 184,726 49.45% Fund Borrowings 4,516 1.21%
Reverse Repo 6,020 1.61% Loan Capital 3,852 1.03%
Investments 3,882 1.04% Other Liabilities 16,996 4.55%
Deferred Tax Assets 5,649 1.51%
Other Assets 14,824 3.97% Equity 36,508 9.77%
Total 373,593 100.00% Total 373,593 100.00%
7
Total 373,593 100.00% Total 373,593 100.00%
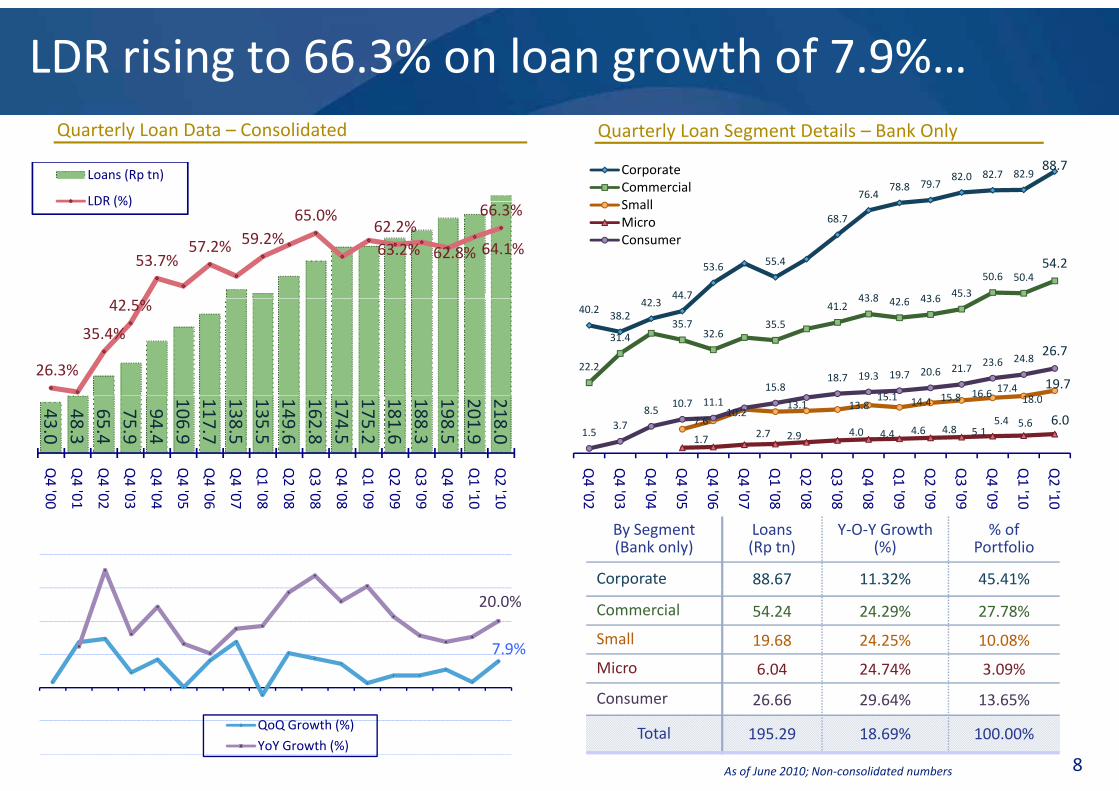
LDR rising to 66.3% on loan growth of 7.9%…
Loans (Rp tn)
LDR (%) 76.478.8 79.7
82.0 82.7 82.988.7Corporate
CommercialS ll
Quarterly Loan Data – Consolidated Quarterly Loan Segment Details – Bank Only
53.7%57.2% 59.2%
65.0%
63.2%62.2%
62.8% 64.1%
66.3%LDR (%)
44.7
53.6 55.4
68.7
43 8 42 6 43 6 45.3
50.6 50.454.2
SmallMicroConsumer
26.3%
35.4%
42.5% 40.2 38.242.3
44.7
22.2
31.435.7
32.635.5
41.243.8 42.6 43.6
15 1 15 8 16 6 17.48 0
19.715.818.7 19.3 19.7 20.6 21.7 23.6 24.8
26.7
43.048.365.475.994.4
106.9117.7138.5135.5149.6162.8174.5175.2181.6188.3198.5201.9218.0
Q4 '
Q4 '
Q4 '
Q4 '
Q4 '
Q4 '
Q4 '
Q4 '
Q1 '
Q2 '
Q3 '
Q4 '
Q1 '
Q2 '
Q3 '
Q4 '
Q1 '
Q2 '
7.610.2
13.1 13.815.1 14.4 15.8 16.6 18.0
1.7 2.7 2.9 4.0 4.4 4.6 4.8 5.15.4 5.6 6.0
1.53.7
8.510.7 11.1
Q4 '
Q4 '
Q4 '
Q4 '
Q4 '
Q4 '
Q1 '
Q2 '
Q3 '
Q4 '
Q1 '
Q2 '
Q3 '
Q4 '
Q1 '
Q2 '00 01 02 03 04 05 06 07 08 08 08 08 09 09 09 09 10 10
'02
'03
'04
'05
'06
'07
'08
'08
'08
'08
'09
'09
'09
'09
'10
'10
By Segment (Bank only)
Loans(Rp tn)
Y‐O‐Y Growth (%)
% of Portfolio
Corporate 88.67 11.32% 45.41%
7.9%
20.0% Commercial 54.24 24.29% 27.78%
Small 19.68 24.25% 10.08%
Micro 6.04 24.74% 3.09%
8
QoQ Growth (%)
YoY Growth (%)
Consumer 26.66 29.64% 13.65%
Total 195.29 18.69% 100.00%
As of June 2010; Non‐consolidated numbers
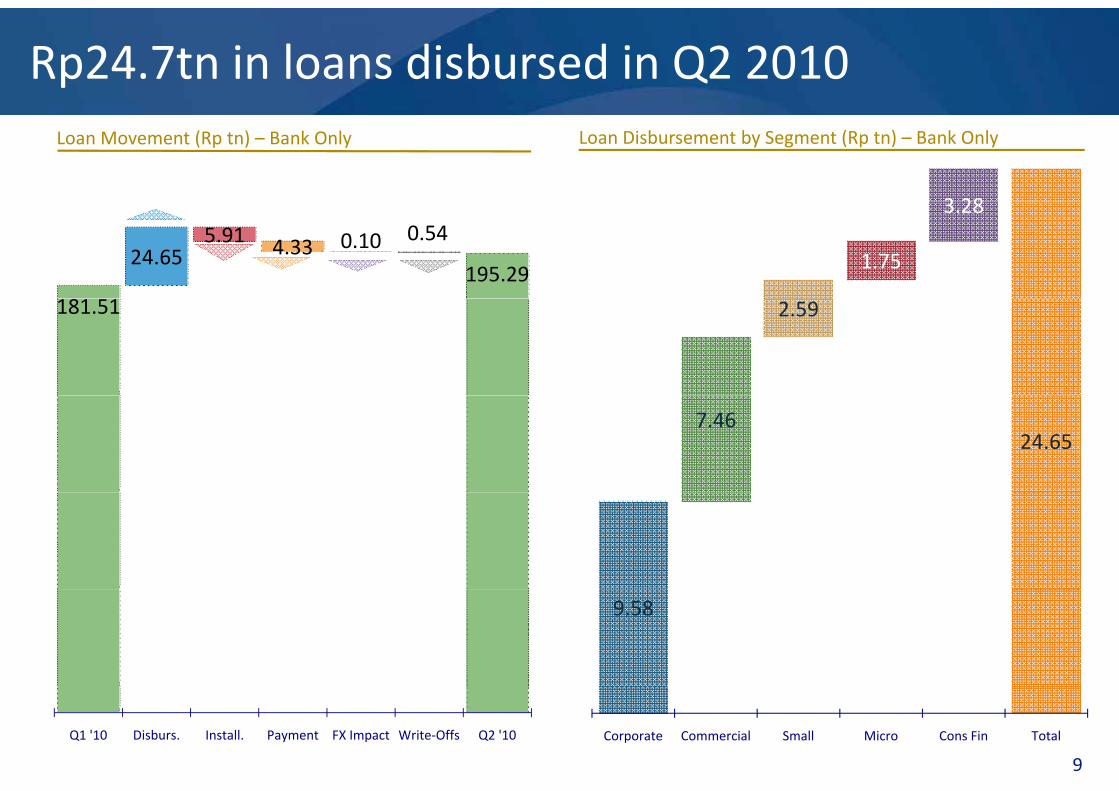
Rp24.7tn in loans disbursed in Q2 2010
3 28
Loan Movement (Rp tn) – Bank Only Loan Disbursement by Segment (Rp tn) – Bank Only
1.75
3.28
24.655.91 4.33 0.10 0.54
195.29
2.59181.51
7.4624.65
9.58
Corporate Commercial Small Micro Cons Fin Total
9
Q1 '10 Disburs. Install. Payment FX Impact Write‐Offs Q2 '10
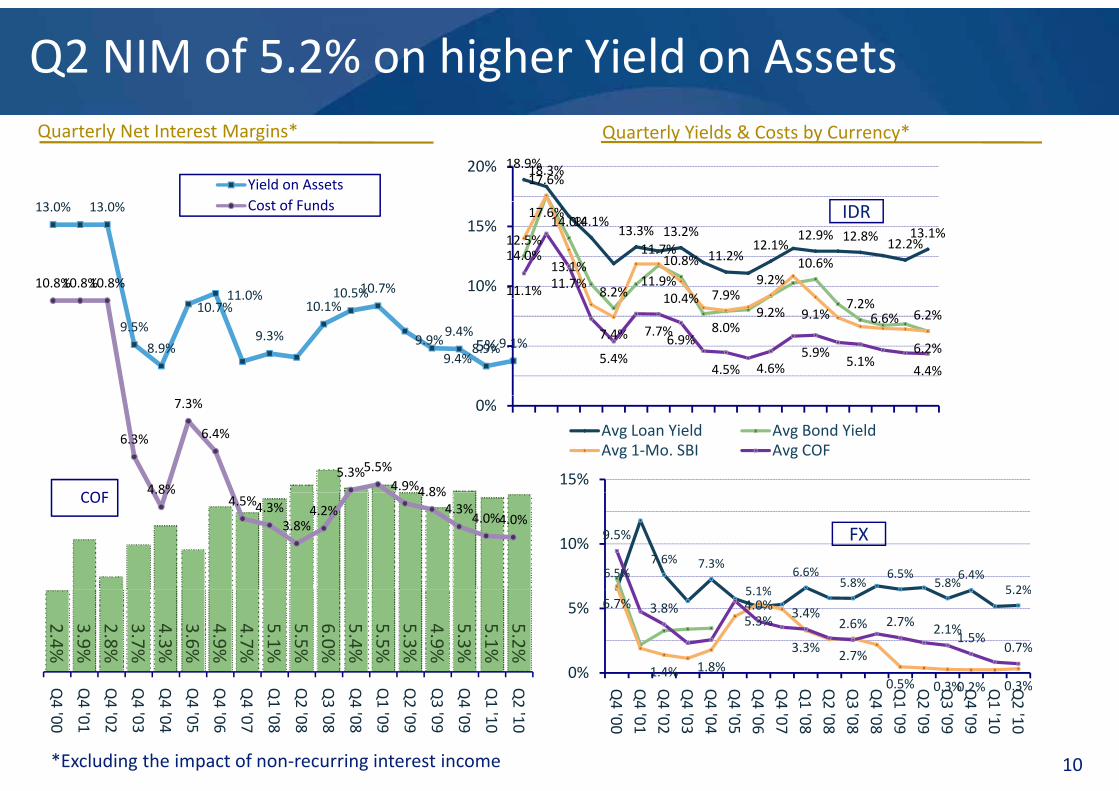
Q2 NIM of 5.2% on higher Yield on Assets
Yield on AssetsC t f F d
18.9%18.3%17.6%
20%
Quarterly Net Interest Margins* Quarterly Yields & Costs by Currency*
13.0% 13.0%
11.0% 10.5%10.7%10.8%10.8%10.8%
Cost of Funds14.1%
13.3% 13.2%
11.2%12.1%
12.9% 12.8% 12.2%13.1%12.5%
14.0%
8.2%
11.7%10.8%
7.9%9.2%
10.6%14.0%
17.6%
13.1%11.9%
10 4%11.1% 11.7%10%
15%IDR
9.5%
8.9%
10.7%11.0%
9.3%
10.1%
9.9%9.4%
9.4%8.9%9.1%
7.9%7.2%
6.2%7.4%
10.4%
8.0%9.2% 9.1% 6.6%
6.2%5.4%
7.7%6.9%
4.5% 4.6%5.9%
5.1%4.4%
5%
15%COF
6.3%
4.8%
7.3%
6.4%
5.3%5.5%4.9%4 8%
0%
Avg Loan Yield Avg Bond YieldAvg 1‐Mo. SBI Avg COF
6.5%7.6% 7.3%
5 1%
6.6%5.8%
6.5%5.8%
6.4%5 2%
9.5%10%
COF 4.8%4.5%4.3%
3.8%4.2%
4.8%4.3%
4.0%4.0%FX
5.1% 5.2%6.7%
1.4% 1.8%
5.3%
3.3% 2.7%
0 5% 0 3%0 2% 0 3%
3.8% 4.0% 3.4%2.6% 2.7% 2.1%
1.5%0.7%
0%
5%2.4%3.9%2.8%3.7%4.3%3.6%4.9%4.7%5.1%5.5%6.0%5.4%5.5%5.3%4.9%5.3%5.1%5.2%
0.5% 0.3%0.2% 0.3%Q4 '00
Q4 '01
Q4 '02
Q4 '03
Q4 '04
Q4 '05
Q4 '06
Q4 '07
Q1 '08
Q2 '08
Q3 '08
Q4 '08
Q1 '09
Q2 '09
Q3 '09
Q4 '09
Q1 '10
Q2 '10
Q4 '00
Q4 '01
Q4 '02
Q4 '03
Q4 '04
Q4 '05
Q4 '06
Q4 '07
Q1 '08
Q2 '08
Q3 '08
Q4 '08
Q1 '09
Q2 '09
Q3 '09
Q4 '09
Q1 '10
Q2 '10
10*Excluding the impact of non‐recurring interest income
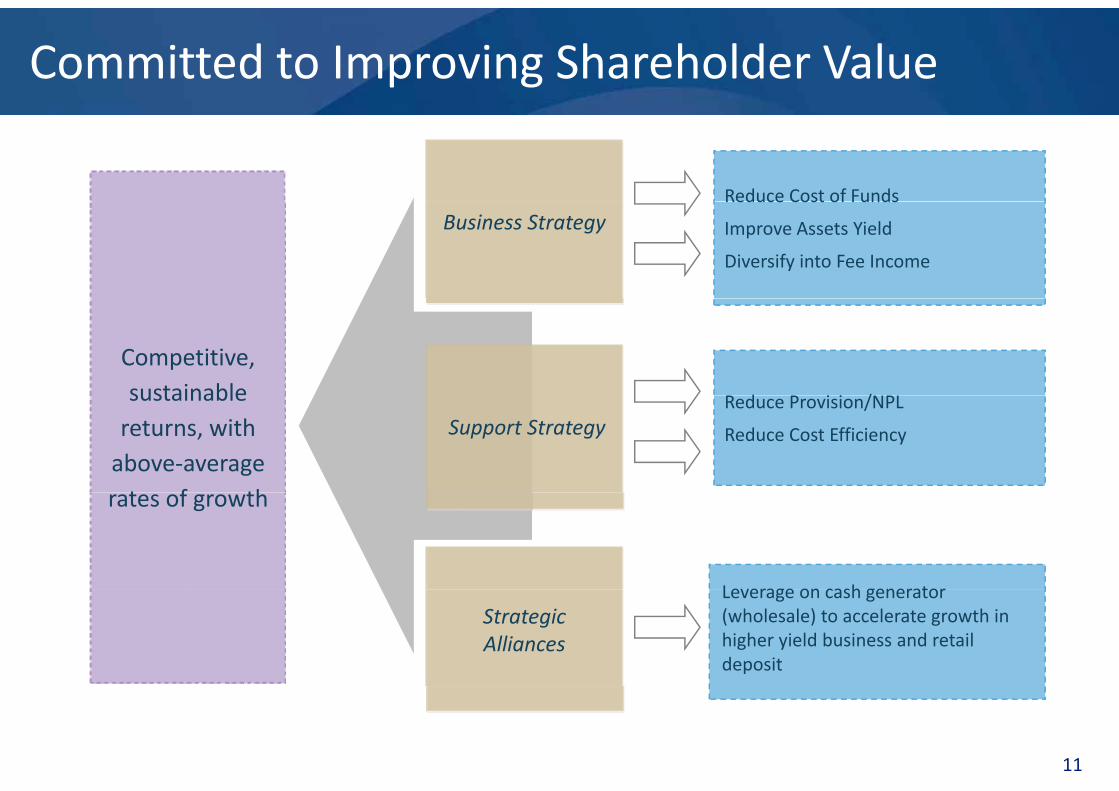
Committed to Improving Shareholder Value
Reduce Cost of FundsReduce Cost of Funds
Improve Assets Yield
Diversify into Fee Income
Business Strategy
d i i /
Competitive,sustainable Reduce Provision/NPL
Reduce Cost Efficiency
sustainable returns, withabove‐averaget f th
Support Strategy
Leverage on cash generator
rates of growth
Leverage on cash generator (wholesale) to accelerate growth in higher yield business and retail deposit
Strategic Alliances
11
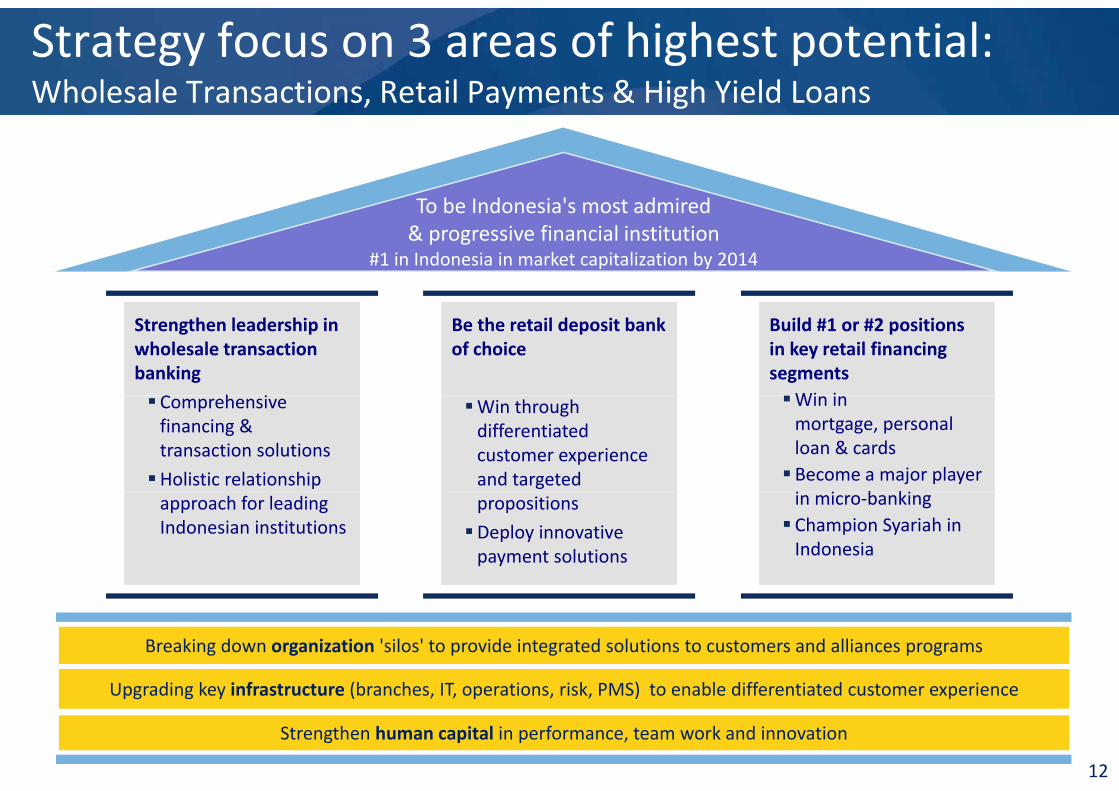
Strategy focus on 3 areas of highest potential:Wholesale Transactions, Retail Payments & High Yield Loans
T b I d i ' t d i d
, y g
To be Indonesia's most admired& progressive financial institution
#1 in Indonesia in market capitalization by 2014
Strengthen leadership in wholesale transaction banking
C h i
Build #1 or #2 positions in key retail financing segments
Wi i
Be the retail deposit bank of choice
Comprehensive financing & transaction solutions
Holistic relationship
Win in mortgage, personal loan & cards Become a major player i i b ki
Win through differentiated customer experience and targeted
approach for leading Indonesian institutions
in micro‐banking Champion Syariah in Indonesia
propositions
Deploy innovative payment solutions
Breaking down organization 'silos' to provide integrated solutions to customers and alliances programs
Upgrading ke infrastr ct re (branches IT operations risk PMS) to enable differentiated c stomer e perience
12
Upgrading key infrastructure (branches, IT, operations, risk, PMS) to enable differentiated customer experience
Strengthen human capital in performance, team work and innovation
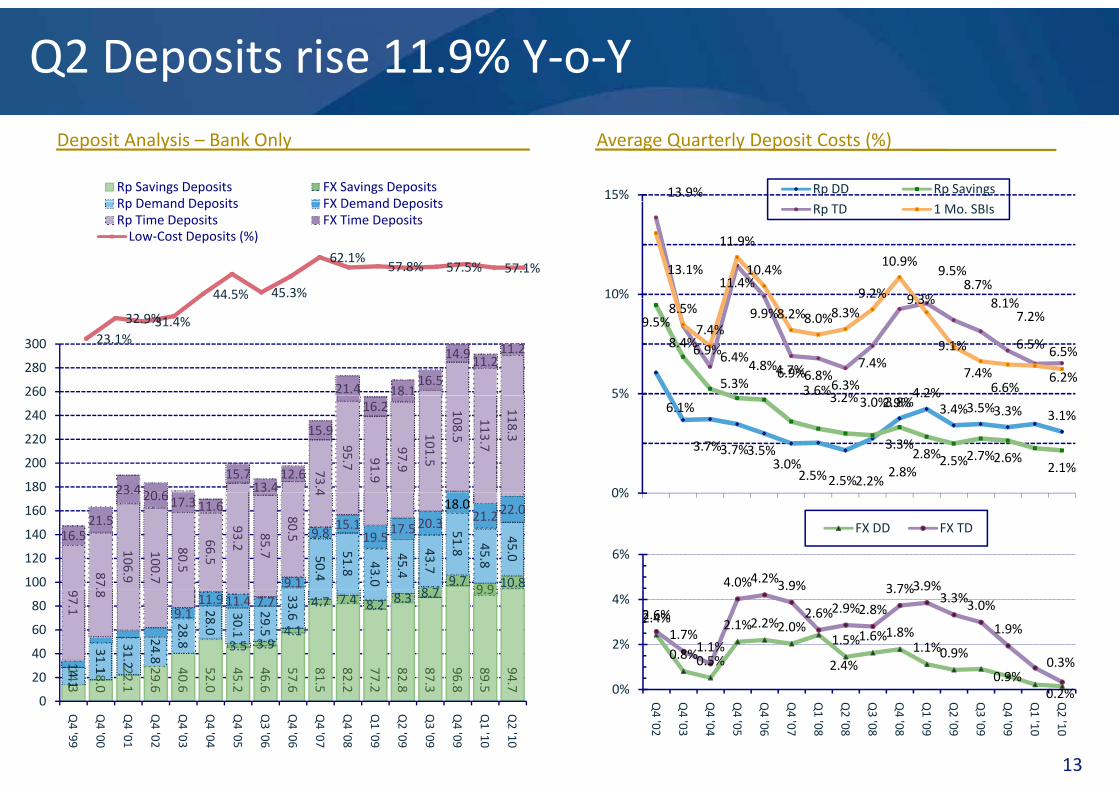
Q2 Deposits rise 11.9% Y‐o‐Y
Rp Savings Deposits FX Savings DepositsRp Demand Deposits FX Demand Deposits
Deposit Analysis – Bank Only
13.9%15% Rp DD Rp Savings
Average Quarterly Deposit Costs (%)
44.5% 45.3%
62.1%57.8% 57.5% 57.1%
Low‐Cost Deposits (%)
Rp Demand Deposits FX Demand DepositsRp Time Deposits FX Time Deposits
11.4%9 3%
9.5%8.7%
8 1%
13.1%
11.9%
10.4%
9.2%
10.9%
10%
Rp TD 1 Mo. SBIs
23.1%32.9%31.4%
44.5%
21.4 18.116.5
14.9 11.211.2
260
280
300
4 2%
9.5%
6.9%
5.3%4.8%4.7%
3.6%3 2%
8.4%6.4%
9.9%
6.9%6.8%6.3%
7.4%
9.3% 8.1%7.2%
6.5% 6.5%
8.5%
7.4%8.2%8.0%8.3%
9.1%
7.4%6.6%
6.2%5%
%
73.4
95.7 91.9
97.9
101.5
108.5
113.7
118.3
23 4 20 6
15.713.4
12.6
15.9
16.28
180
200
220
240
2606.1%
3.7%3.7%3.5%3.0%
2.5%2.5%2.2%2.8%
3.8%4.2%
3.4%3.5%3.3% 3.1%3.2%3.0%2.9%
3.3%2.8%2.5%2.7%2.6% 2.1%
0%
5%
8 79.7
9 9 10.8
50.4
51.8 43.0
45.4
43.7
51.8 45.8
45.0
9.1
9.815.1
19.517.5 20.3
18.021.2 22.0
87.
106.9
100.7
80.5
66.5
93.2
85.7
80.5
4
16.521.5
23.4 20.6 17.3 11.6
100
120
140
1600%
4.0%4.2%3.9% 3 7%3.9%
6%
FX DD FX TD
14.
18.0
22.
29.
40.
52. 0
45.
46.
57.
81. 5
82.
77.
82. 8
87.
96. 8
89.5
94.7
3.5 3.94.1
4.7 7.4 8.2 8.3 8.7 9.9
14.1
31.1
31.2
24.8
28.8
28.0
30.1
29.5
33.69.111.9 11.4 7.7
97.1
.8
20
40
60
802.4%
0.8%0.5%
2.1%2.2%2.0%
2.4%
1.5%1.6%1.8%1.1%0.9%
0.9%
2.6%1.7%
1.1%
3.9%
2.6%2.9%2.8%
3.7%3.9%3.3%3.0%
1.9%
0.3%
0%
2%
4%
3 0 1 6 6 0 2 6 6 5 2 2 8 3 8 5 71
0
Q4 '99
Q4 '00
Q4 '01
Q4 '02
Q4 '03
Q4 '04
Q4 '05
Q3 '06
Q4 '06
Q4 '07
Q4 '08
Q1 '09
Q2 '09
Q3 '09
Q4 '09
Q1 '10
Q2 '10
13
0.2%0%
Q4 '02
Q4 '03
Q4 '04
Q4 '05
Q4 '06
Q4 '07
Q1 '08
Q2 '08
Q3 '08
Q4 '08
Q1 '09
Q2 '09
Q3 '09
Q4 '09
Q1 '10
Q2 '10
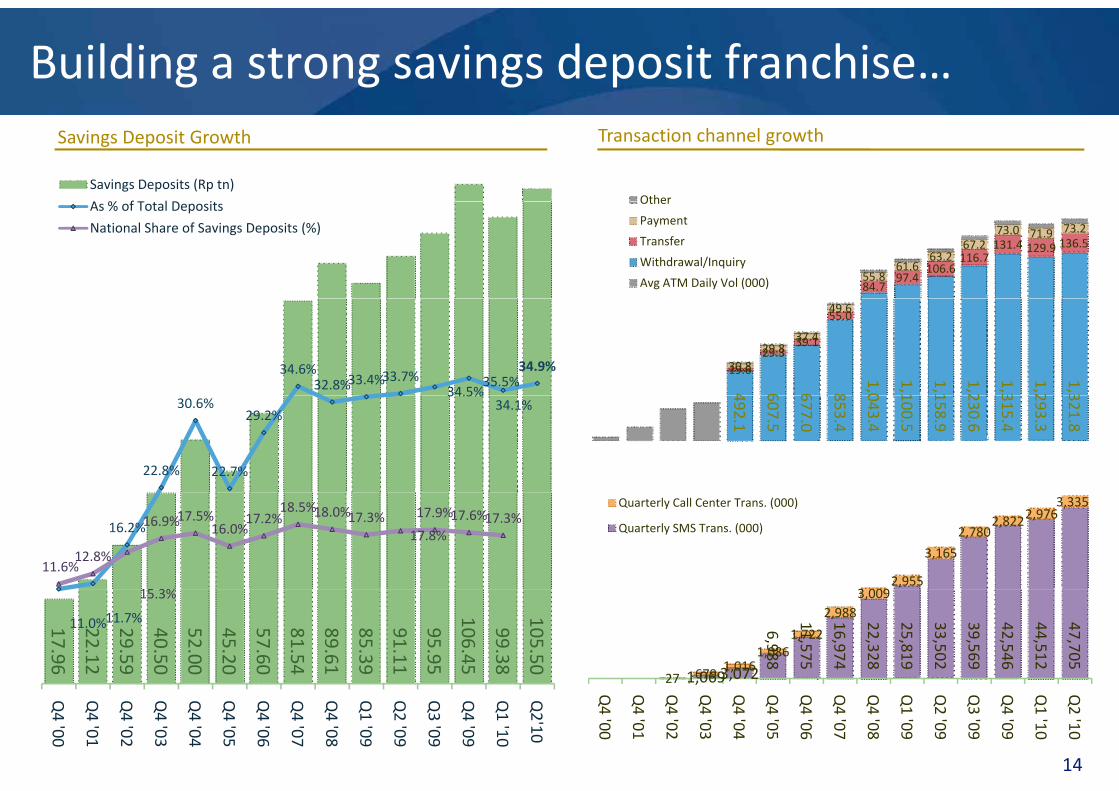
Building a strong savings deposit franchise…
Savings Deposits (Rp tn)
A % f T l D i
Savings Deposit Growth Transaction channel growth
OtherAs % of Total Deposits
National Share of Savings Deposits (%)
84.797.4
106.6116.7
131.4 129.9 136.5
55.861.6
63.267.2
73.0 71.9 73.2
Other
Payment
Transfer
Withdrawal/Inquiry
Avg ATM Daily Vol (000)
34.6%32.8%33.4%33.7% 34.5%
35.5%34.9%
4 6 6 8
1,0
1,1
1,1
1,2
1,3
1,2
1,3
19.629.3
39.1
55.0
30.829.8
37.4
49.6
22.8%
30.6%
22.7%
29.2%
34.5%34.1%
492.1
607.5
677.0
853.4
043.4
100.5
158.9
230.6
315.4
293.3
321.8
16.2%
11.6%12.8%
15 3%
16.9%17.5%16.0%17.2%
18.5%18.0%17.3%17.8%
17.9%17.6%17.3%
3 0092,955
3,165
2,7802,8222,976
3,335Quarterly Call Center Trans. (000)
Quarterly SMS Trans. (000)
17.96
22.12
29.59
40.50
52.00
45.20
57.60
81.54
89.61
85.39
91.11
95.95
106.45
99.38
105.50
11.0%11.7%
15.3%
1,0693,072
6,988
11,575
16,974
22,328
25,819
33,502
39,569
42,546
44,512
47,705
27 679 1,0161,086
1,722
2,9883,009
Q4 '00
Q4 '01
Q4 '02
Q4 '03
Q4 '04
Q4 '05
Q4 '06
Q4 '07
Q4 '08
Q1 '09
Q2 '09
Q3 '09
Q4 '09
Q1 '10
Q2'10
Q4 '00
Q4 '01
Q4 '02
Q4 '03
Q4 '04
Q4 '05
Q4 '06
Q4 '07
Q4 '08
Q1 '09
Q2 '09
Q3 '09
Q4 '09
Q1 '10
Q2 '10
14
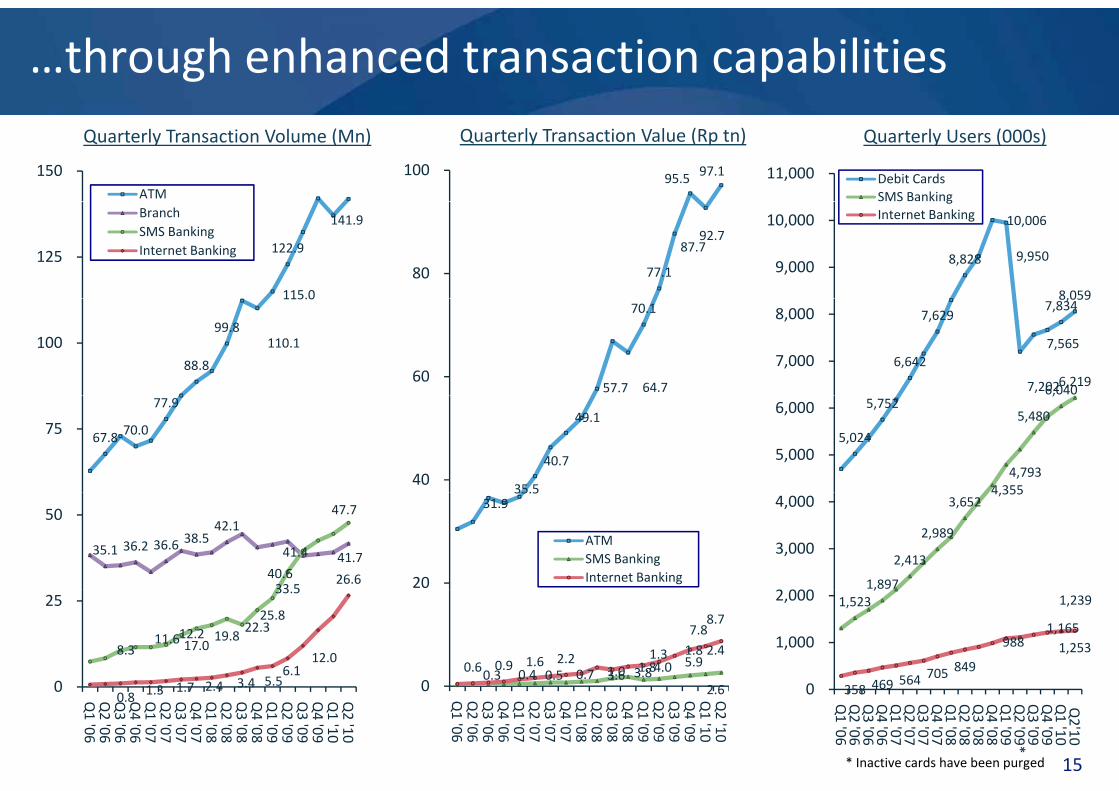
…through enhanced transaction capabilitiesQuarterly Transaction Volume (Mn)
150 ATM
95.5 97.1100 11,000 Debit CardsSMS Banking
Quarterly Transaction Value (Rp tn) Quarterly Users (000s)
115.0
122.9
141.9
125
BranchSMS BankingInternet Banking
77.1
87.792.7
80 8,828
10,006
9,950
8,059
9,000
10,000 g
Internet Banking
88.8
99.8110.1
115.0
100
57.7 64.7
70.1
60 6,642
7,629
7,202
7,565
7,8348,059
6,0406,219
7,000
8,000
67.8 70.0
77.9
75
35.5
40.7
49.1
40
5,024
5,752
4 3554,793
5,480
,
5,000
6,000
35.1 36.2 36.6 38.542.1
40.6
41.4 41.7
33 5
47.7
26.6
50 31.9
35.5
20
ATMSMS BankingInternet Banking 1,897
2,413
2,989
3,6524,355
3,000
4,000
8.311.612.217.0
19.822.3
25.8
33.5
1 3 1 7 2 4 3.4 5.56.1
12.0
0
25
0.3 0.4 0.5 0.7 1.0 1.81.3 1.8 2.4
2 6
0.6 0.9 1.6 2.23.6 3.84.0
5.9
7.88.7
0
1,523,
358 469 564 705 849
9881,165
1,239
1,253
0
1,000
2,000
15
0.8 1.3 1.7 2.4 3.40
Q1 '06
Q2 '06
Q3 '06
Q4 '06
Q1 '07
Q2 '07
Q3 '07
Q4 '07
Q1 '08
Q2 '08
Q3 '08
Q4 '08
Q1 '09
Q2 '09
Q3 '09
Q4 '09
Q1 '10
Q2 '10
2.60 Q1 '06
Q2 '06
Q3 '06
Q4 '06
Q1 '07
Q2 '07
Q3 '07
Q4 '07
Q1 '08
Q2 '08
Q3 '08
Q4 '08
Q1 '09
Q2 '09
Q3 '09
Q4 '09
Q1 '10
Q2 '10
358 4690
Q1 '06
Q2 '06
Q3 '06
Q4 '06
Q1 '07
Q2 '07
Q3 '07
Q4 '07
Q1 '08
Q2 '08
Q3 '08
Q4 '08
Q1 '09
Q2 '09*
Q3 '09
Q4 '09
Q1 '10Q2'10
* Inactive cards have been purged
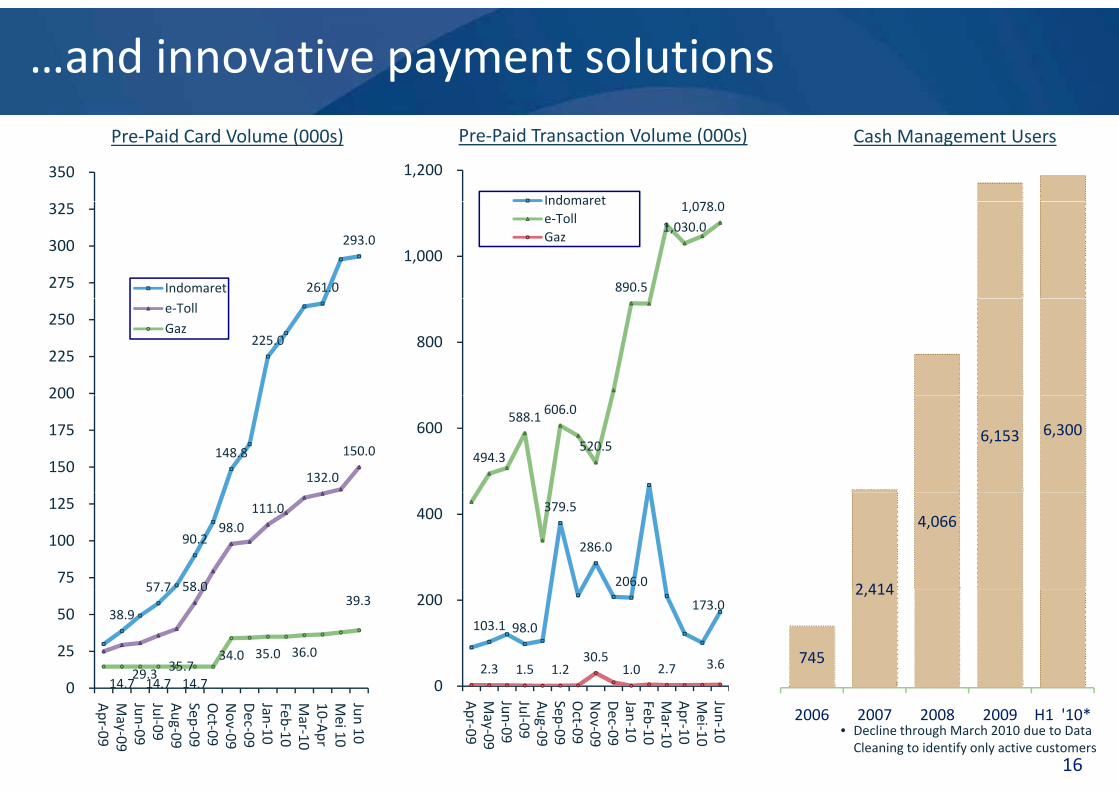
…and innovative payment solutionsPre‐Paid Card Volume (000s)
350 1,200
Indomaret
Pre‐Paid Transaction Volume (000s) Cash Management Users
261.0
293.0
275
300
325
Indomaret 890.5
1,030.0
1,078.0
1,000
Indomarete‐TollGaz
225.0
200
225
250 e‐TollGaz
800
148.8
132.0
150.0150
175
200
494.3
588.1 606.0
520.5600 6,153 6,300
57 7
90.2
58 0
98.0111.0
75
100
125 379.5
286.0
206.0
400
2 414
4,066
38.9
57.7
29.3 35.7
58.0
14 7 14 7 14 7
34.0 35.0 36.0
39.3
0
25
50 103.1 98.0
173.0
2.3 1.5 1.230.5
1.0 2.7 3.6
0
200
745
2,414
16
14.7 14.7 14.70
Apr‐09
May‐09
Jun‐09Jul‐09Aug‐09
Sep‐09Oct‐09
Nov‐09
Dec‐09
Jan‐10Feb‐10Mar‐10
10‐Apr
Mei 10
Jun 10
0
Apr‐09
May‐09
Jun‐09Jul‐09Aug‐09
Sep‐09Oct‐09
Nov‐09
Dec‐09
Jan‐10Feb‐10Mar‐10
Apr‐10
Mei‐10
Jun‐10
2006 2007 2008 2009 H1 '10*• Decline through March 2010 due to Data Cleaning to identify only active customers
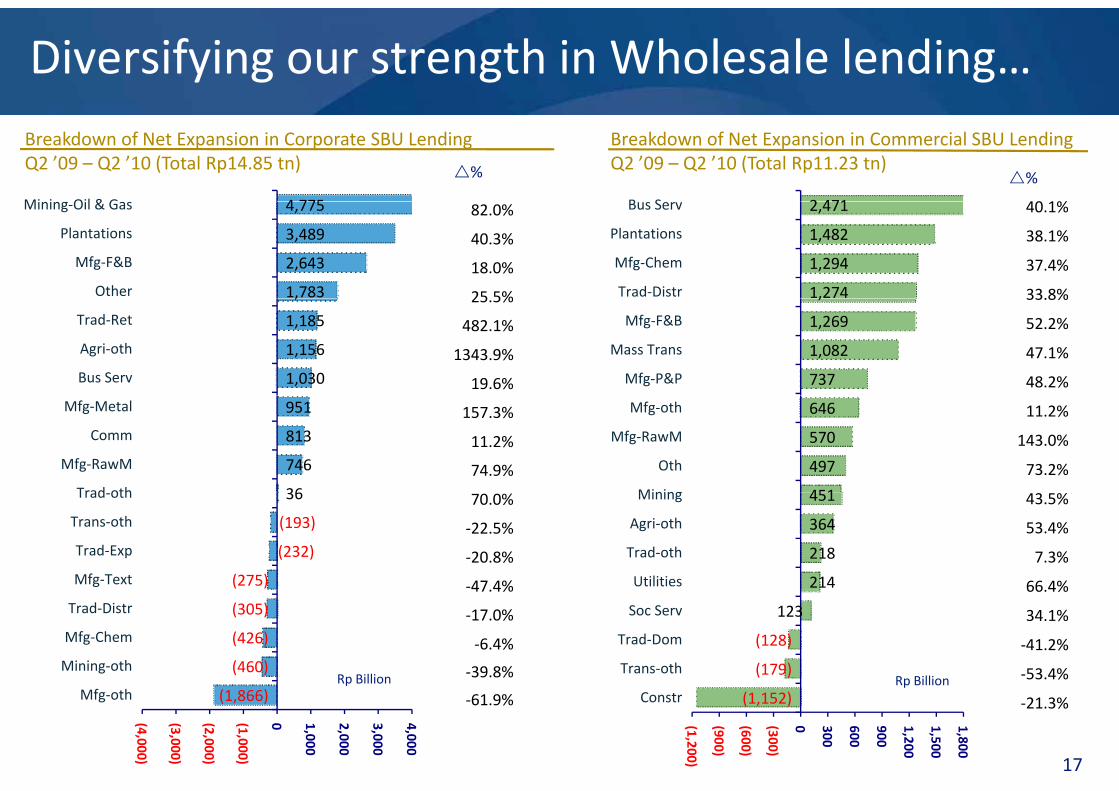
Diversifying our strength in Wholesale lending…Breakdown of Net Expansion in Corporate SBU LendingQ2 ’09 – Q2 ’10 (Total Rp14.85 tn)
4 775Mi i Oil & G
%
Breakdown of Net Expansion in Commercial SBU LendingQ2 ’09 – Q2 ’10 (Total Rp11.23 tn)
2 471B S
%
40 1%
1,783
2,643
3,489
4,775
Other
Mfg‐F&B
Plantations
Mining‐Oil & Gas 82.0%
40.3%
18.0%
25 5% 1,274
1,294
1,482
2,471
Trad‐Distr
Mfg‐Chem
Plantations
Bus Serv 40.1%
38.1%
37.4%
33.8%
1,030
1,156
1,185
,
Bus Serv
Agri‐oth
Trad‐Ret25.5%
482.1%
1343.9%
19.6% 737
1,082
1,269
,
Mfg‐P&P
Mass Trans
Mfg‐F&B
33.8%
52.2%
47.1%
48.2%
36
746
813
951
Trad oth
Mfg‐RawM
Comm
Mfg‐Metal 157.3%
11.2%
74.9%
451
497
570
646
Mining
Oth
Mfg‐RawM
Mfg‐oth 11.2%
143.0%
73.2%
(275)
(232)
(193)
36
Mfg‐Text
Trad‐Exp
Trans‐oth
Trad‐oth 70.0%
‐22.5%
‐20.8%
‐47 4% 214
218
364
451
Utilities
Trad‐oth
Agri‐oth
Mining 43.5%
53.4%
7.3%
66 4%
Rp Billion(460)
(426)
(305)
Mining‐oth
Mfg‐Chem
Trad‐Distr47.4%
‐17.0%
‐6.4%
‐39.8%Rp Billion(179)
(128)
123
Trans‐oth
Trad‐Dom
Soc Serv
66.4%
34.1%
‐41.2%
‐53.4%
17
p(1,866)
(4,000)
(3,000)
(2,000)
(1,000)
0 1,000
2,000
3,000
4,000 Mfg‐oth ‐61.9% (1,152)
(1,200)
(900)
(600)
(300)
0 300
600
900
1,200
1,500
1,800
Constr ‐21.3%
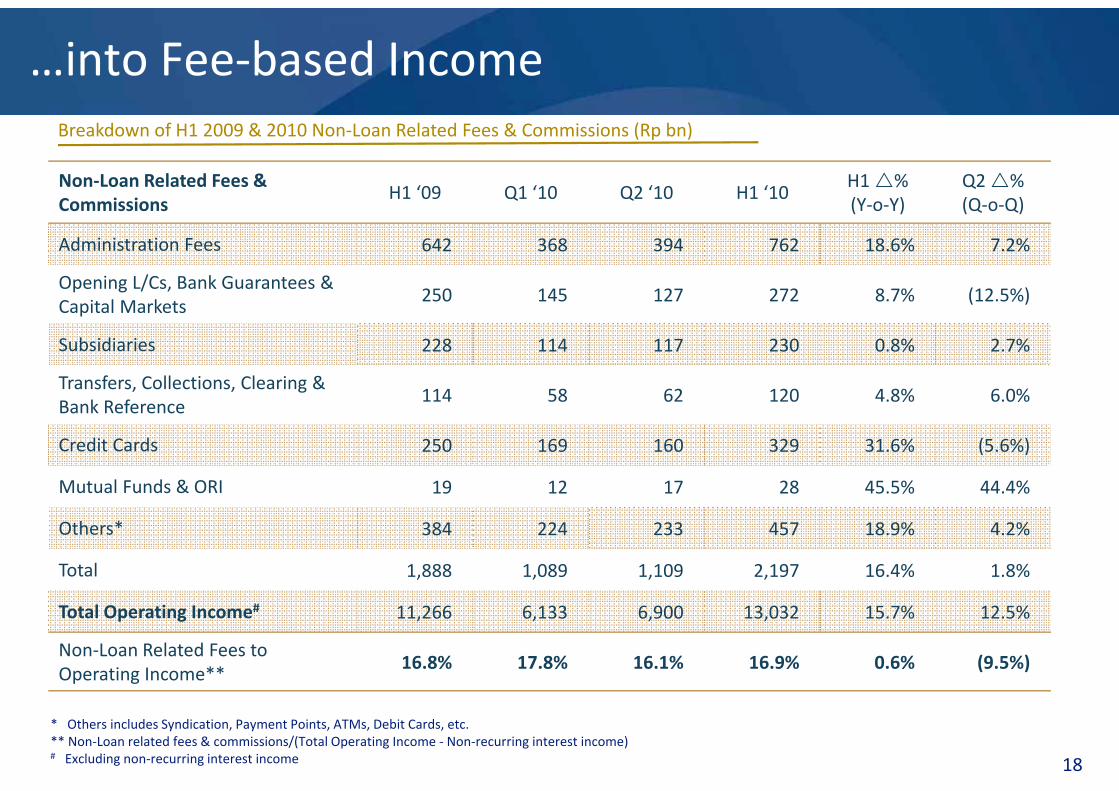
…into Fee‐based Income
Non‐Loan Related Fees & Commissions
H1 ‘09 Q1 ‘10 Q2 ‘10 H1 ‘10H1 %(Y o Y)
Q2 %(Q o Q)
Breakdown of H1 2009 & 2010 Non‐Loan Related Fees & Commissions (Rp bn)
Commissions (Y‐o‐Y) (Q‐o‐Q)
Administration Fees 642 368 394 762 18.6% 7.2%
Opening L/Cs, Bank Guarantees & 250 145 127 272 8 7% (12 5%)
Capital Markets250 145 127 272 8.7% (12.5%)
Subsidiaries 228 114 117 230 0.8% 2.7%
Transfers, Collections, Clearing & 114 58 62 120 4 8% 6 0%
Bank Reference114 58 62 120 4.8% 6.0%
Credit Cards 250 169 160 329 31.6% (5.6%)
Mutual Funds & ORI 19 12 17 28 45.5% 44.4%Mutual Funds & ORI 19 12 17 28 45.5% 44.4%
Others* 384 224 233 457 18.9% 4.2%
Total 1,888 1,089 1,109 2,197 16.4% 1.8%
Total Operating Income# 11,266 6,133 6,900 13,032 15.7% 12.5%
Non‐Loan Related Fees to Operating Income**
16.8% 17.8% 16.1% 16.9% 0.6% (9.5%)
18
* Others includes Syndication, Payment Points, ATMs, Debit Cards, etc.** Non‐Loan related fees & commissions/(Total Operating Income ‐ Non‐recurring interest income)# Excluding non‐recurring interest income

Building our high yield business in Micro & Small…Micro Credits
(Rp Bn)23.7%
5 310
13.74%
Consumer Loans(Rp Bn)
Small Business Credits(Rp Bn)
LoanYields
12.9%
4,839
6,036
1,197
24.7%18,109
23,419
5,310
29.32%
15,496
19,326
3,830
24.7%9
Q2 2009 Growth Q2 2010
Disbursement Breakdown (H1 2010)
9
Q2 2009 Growth Q2 2010
Disbursement Breakdown (H1 2010)
Q2 2009 Growth Q1 2010
Disbursement Breakdown (H1 2010)
*Excluding Credit Cards
Disbursement Breakdown (H1 2010) Disbursement Breakdown (H1 2010)
1 394
Disbursement Breakdown (H1 2010)
1,013 676
1,182
1,394
5,717
85 261520
1,9723,067
2,465
2,9893,855
82Rural Banks Micro Unsecured Micro TOTAL Mortgage Home Equity
LoanPayroll Loan Other Total
Non‐Prog
Program
Coops
Cash Coll
TOTA
L
19
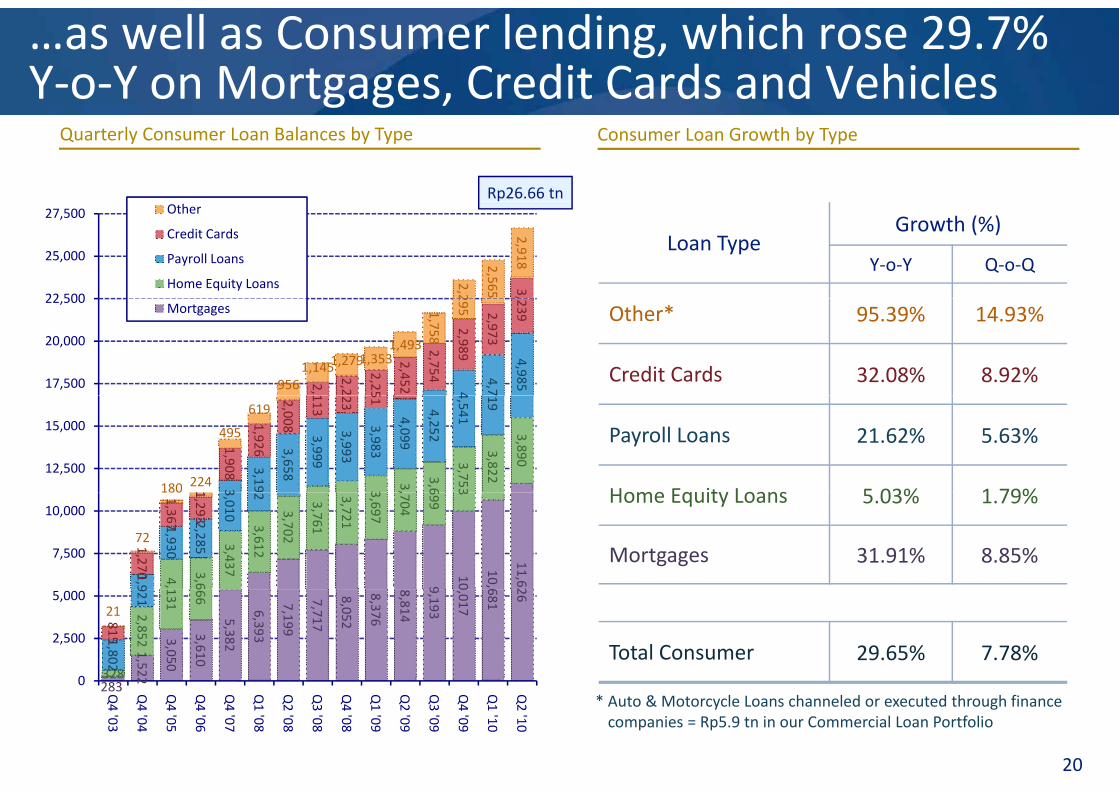
…as well as Consumer lending, which rose 29.7% Y‐o‐Y on Mortgages, Credit Cards and Vehiclesg g ,
Quarterly Consumer Loan Balances by Type Consumer Loan Growth by Type
Rp26.66 tn
3,
2,2
2,565
2,918
22 500
25,000
27,500 Other
Credit Cards
Payroll Loans
Home Equity Loans
Loan TypeGrowth (%)
Y‐o‐Y Q‐o‐Q
4
4,7
4,9852,
2,2
2,2 5
2,452
2,754
2,989
2,973
239
9561,1451,279
1,3531,493
1,758
295
17,500
20,000
22,500Mortgages Other* 95.39% 14.93%
Credit Cards 32.08% 8.92%
3 3,
3,6
3,753
3,822
3,890
3
3,19
3,658
3,999
3,993
3,983
4,099
4,252
4,541
719
1
1,908
1,926
2,008
113
23
51
180 224
495
619
12,500
15,000 Payroll Loans 21.62% 5.63%
Home Equity Loans 5 03% 1 79%
9
10
10,6
11,62
4,
3,6
3,437
3,612
3,702
3,761
3,721
3,697
,704
699
3
1,9
1,930
2,285
3,010
2
1,270
1,367
1,293
72
180
7,500
10,000Home Equity Loans 5.03% 1.79%
Mortgages 31.91% 8.85%
283
1,522
3,050
3,610
5,382
6,393
7,199
7,717
8,052
8,376
8,814
9,193
0,017
681
26
328
2,852
131
666
1,802
921
815
21
0
2,500
5,000
Total Consumer 29.65% 7.78%
20
283Q4 '03
Q4 '04
Q4 '05
Q4 '06
Q4 '07
Q1 '08
Q2 '08
Q3 '08
Q4 '08
Q1 '09
Q2 '09
Q3 '09
Q4 '09
Q1 '10
Q2 '10
* Auto & Motorcycle Loans channeled or executed through finance companies = Rp5.9 tn in our Commercial Loan Portfolio
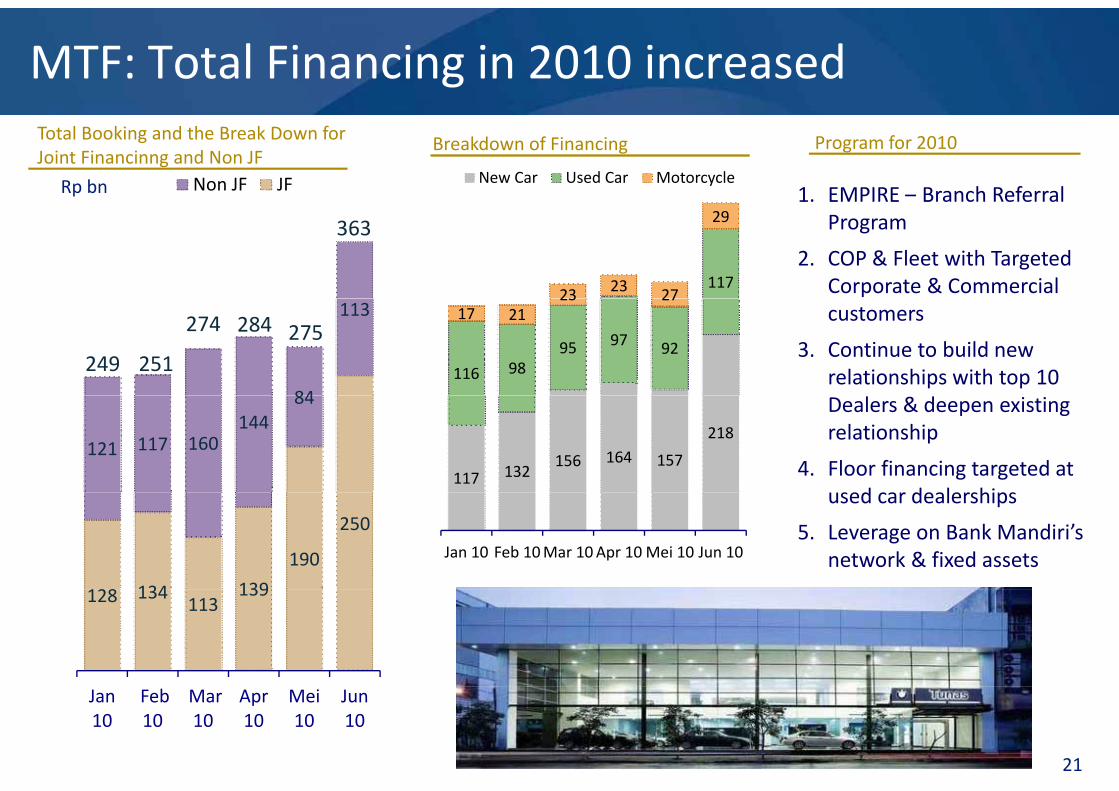
MTF: Total Financing in 2010 increased
Rp bn
Total Booking and the Break Down for Joint Financinng and Non JF
Breakdown of Financing Program for 2010
1. EMPIRE – Branch Referral Non JF JF New Car Used Car Motorcycle1. EMPIRE Branch Referral
Program
2. COP & Fleet with Targeted Corporate & Commercial
363
11723 23 27
29
customers
3. Continue to build new relationships with top 10
84
113
249
274 284
251275
116 9895 97 92
17 2123 27
Dealers & deepen existing relationship
4. Floor financing targeted at sed car dealerships
121 117 160144
84
117 132 156 164 157
218
used car dealerships
5. Leverage on Bank Mandiri’s network & fixed assets
128 134 139
190
250 Jan 10 Feb 10Mar 10Apr 10Mei 10 Jun 10
128 134 113
139
21
Jan 10
Feb 10
Mar 10
Apr 10
Mei 10
Jun 10
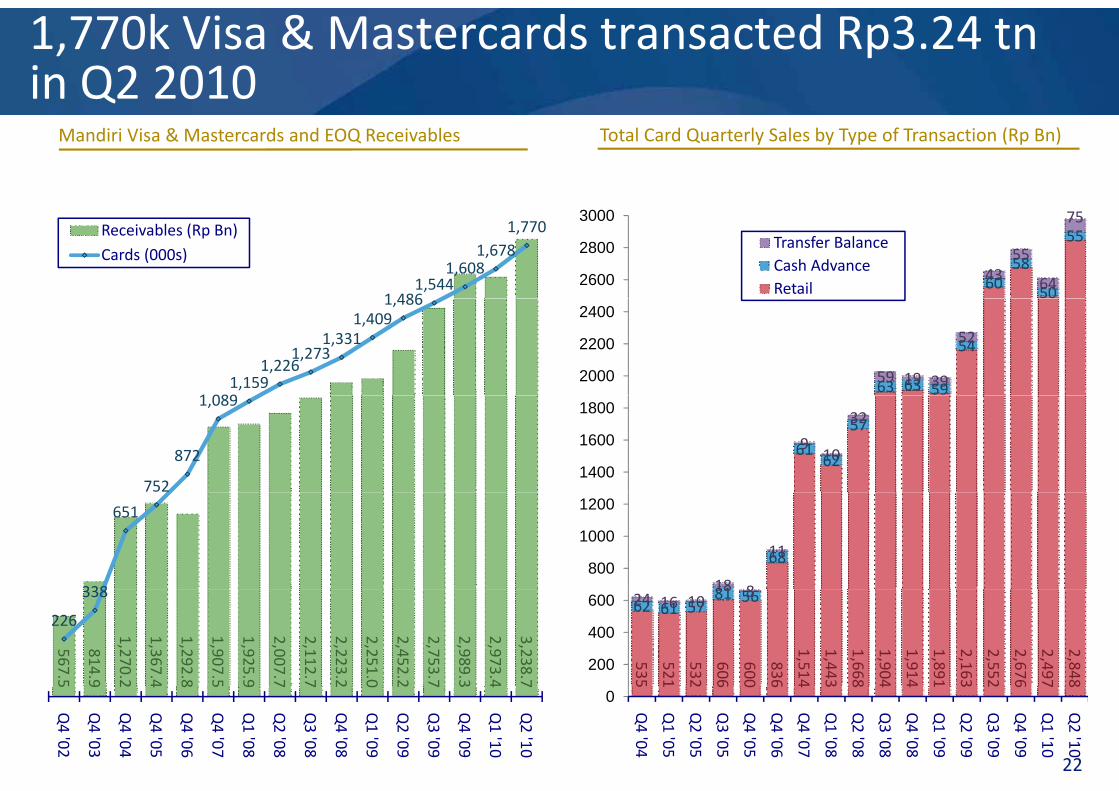
1,770k Visa & Mastercards transacted Rp3.24 tnin Q2 2010
Mandiri Visa & Mastercards and EOQ Receivables Total Card Quarterly Sales by Type of Transaction (Rp Bn)
1 4861,544
1,6081,678
1,770Receivables (Rp Bn)Cards (000s)
6058
50
55
4355
64
75
2600
2800
3000
Transfer BalanceCash AdvanceRetail
1 0891,159
1,2261,273
1,3311,409
1,486
63 63 59
54
59 19 39
52
2000
2200
2400
752
872
1,089
6162
579
10
32
1400
1600
1800
338
651
81
68
18 8
11800
1000
1200
567.5
814.9
1,270.2
1,367.4
1,292.8
1,907.5
1,925.9
2,007.7
2,112.7
2,223.2
2,251.0
2,452.2
2,753.7
2,989.3
2,973.4
3,238.7
226
338
535
521
532
606
600
836
1,514
1,443
1,668
1,904
1,914
1,891
2,163
2,552
2,676
2,497
2,848
62 61 5781 5624 16 1018 8
200
400
600
22
5 9 2 4 8 5 9 7 7 2 0 2 7 3 4 7
Q4 '02
Q4 '03
Q4 '04
Q4 '05
Q4 '06
Q4 '07
Q1 '08
Q2 '08
Q3 '08
Q4 '08
Q1 '09
Q2 '09
Q3 '09
Q4 '09
Q1 '10
Q2 '10
5 1 2 6 0 6 4 3 8 4 4 1 3 2 6 7 8
0
Q4 '04
Q1 '05
Q2 '05
Q3 '05
Q4 '05
Q4 '06
Q4 '07
Q1 '08
Q2 '08
Q3 '08
Q4 '08
Q1 '09
Q2 '09
Q3 '09
Q4 '09
Q1 '10
Q2 '10
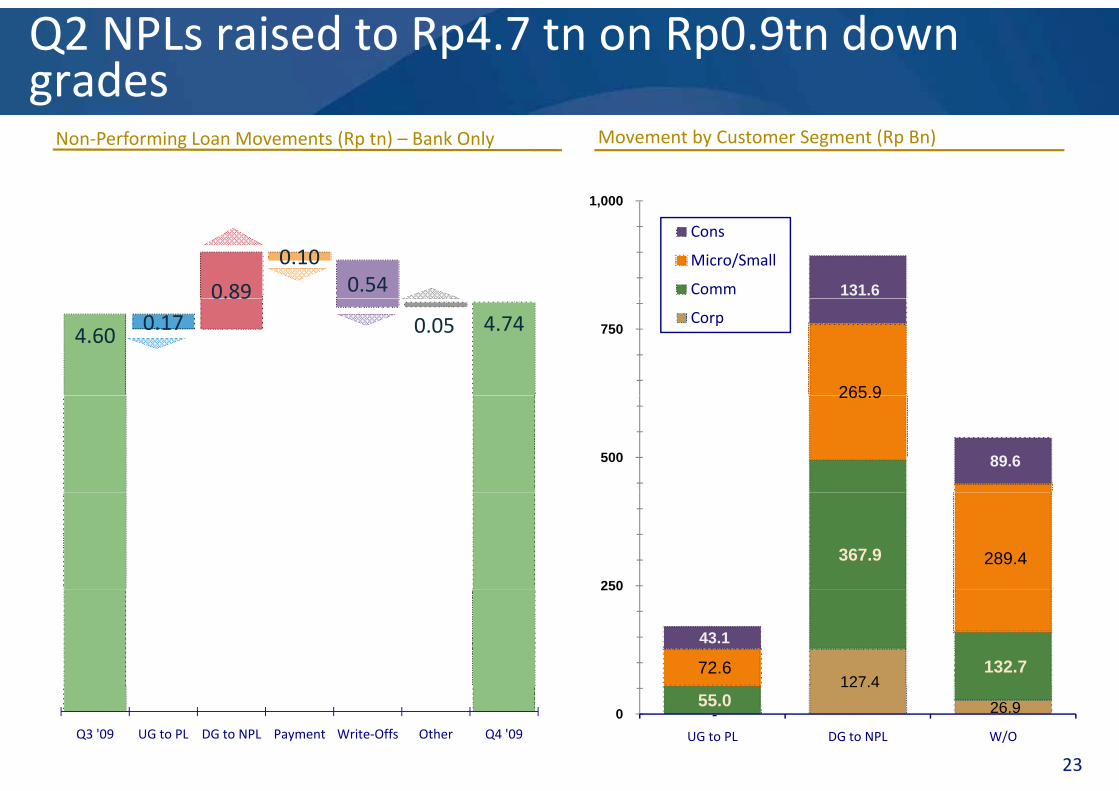
Q2 NPLs raised to Rp4.7 tn on Rp0.9tn down grades
1 000
Non‐Performing Loan Movements (Rp tn) – Bank Only
gMovement by Customer Segment (Rp Bn)
131.6
1,000
Cons
Micro/Small
Comm0.89
0.100.54
265 9
750 Corp
4.60 0.170.89
0.05 4.74
265.9
89.6 500
367.9 289.4 250
127.4132.7 72.6
43.1
250
23
-
127.4 26.9 55.0
0 UG to PL DG to NPL W/OQ3 '09 UG to PL DG to NPL Payment Write‐Offs Other Q4 '09

Gross NPLs declined to 2.54% with provisioning coverage at 206%
20,000 50%
NPL Movement ‐ Consolidated
gCategory 2 Loans – Bank Only
16,000
18,000
,
40%
Cat 2 %
190.4%
219.1%
206.0%
12,000
14,00035.7%
26 2%30%19
25.28%
146.7%138.9% 136.1%
8,000
10,000
26.2%24.8%
15 5%
20%
9.80%
16.34%
129.5%139.1%
128.8%116.0%
4,000
6,000
9.2%
15.0%
9.4%
12.9%
15.5%
11.9%11.5%10.0%9.2%
10.2% 9.7% 9.0% 10%
9.70% 7.308.60% 7.10
7.17 5.
70.0%
44.4%
4,03315,35012,65516,20210,9838,334
12,91216,96615,14814,05813,45113,50215,41216,33215,89518,14817,50617,41717,479
0
2,000
Q4
Q4
Q4
Q4
Q4
Q4
Q4
Q4
Q4
Q1
Q2
Q3
Q4
Q1
Q2
Q3
Q4
Q1
Q2
0%
% 0% 7% 5.14%4.74%4.44%4.73%85%4.78%3.79%2.79%2.56%2.54%
15.3%
0.56% 0.55%
44.4%
Q4
Q4
Q4
Q4
Q4
Q4
Q4
Q4
Q4
Q1
Q2
Q3
Q4
Q1
Q2
Q3
Q4
Q1
Q2 4 '994 '004 '014 '024 '034 '044 '054 '064 '071 '082 '083 '084 '081 '092 '093 '094 '091 '102 '10
2 ‐ Special Mention Loans (Rp Bn)24
4 '994 '004 '014 '024 '034 '044 '054 '064 '071 '082 '083 '084 '081 '092 '093 '094 '091 '102 '10
Gross NPL Ratio Net NPL Ratio Prov/NPL
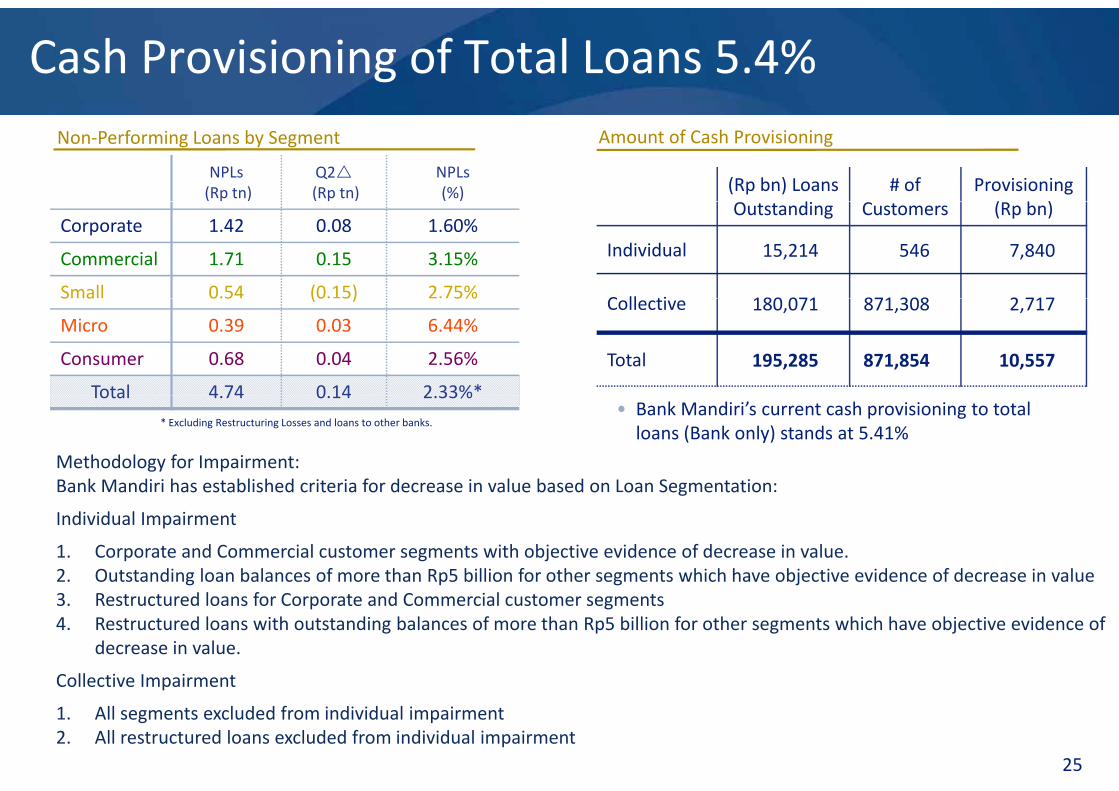
Cash Provisioning of Total Loans 5.4%
NPLs(Rp tn)
Q2(Rp tn)
NPLs(%)
Amount of Cash ProvisioningNon‐Performing Loans by Segment
(Rp bn) Loans d
# of Provisioning ( b )
Corporate 1.42 0.08 1.60%
Commercial 1.71 0.15 3.15%
Small 0.54 (0.15) 2.75%
Outstanding Customers (Rp bn)
Individual 15,214 546 7,840
C ll ti 180 071 871 308 2 717S a 0 5 (0 5) 5%
Micro 0.39 0.03 6.44%
Consumer 0.68 0.04 2.56%
Total 4 74 0 14 2 33%*
Collective 180,071 871,308 2,717
Total 195,285 871,854 10,557
Total 4.74 0.14 2.33%• Bank Mandiri’s current cash provisioning to total loans (Bank only) stands at 5.41%
Methodology for Impairment:Bank Mandiri has established criteria for decrease in value based on Loan Segmentation:
* Excluding Restructuring Losses and loans to other banks.
a a d as estab s ed c te a o dec ease a ue based o oa Seg e tat o
Individual Impairment
1. Corporate and Commercial customer segments with objective evidence of decrease in value.2. Outstanding loan balances of more than Rp5 billion for other segments which have objective evidence of decrease in value3. Restructured loans for Corporate and Commercial customer segments4. Restructured loans with outstanding balances of more than Rp5 billion for other segments which have objective evidence of
decrease in value.
Collective Impairment
25
Collective Impairment
1. All segments excluded from individual impairment2. All restructured loans excluded from individual impairment
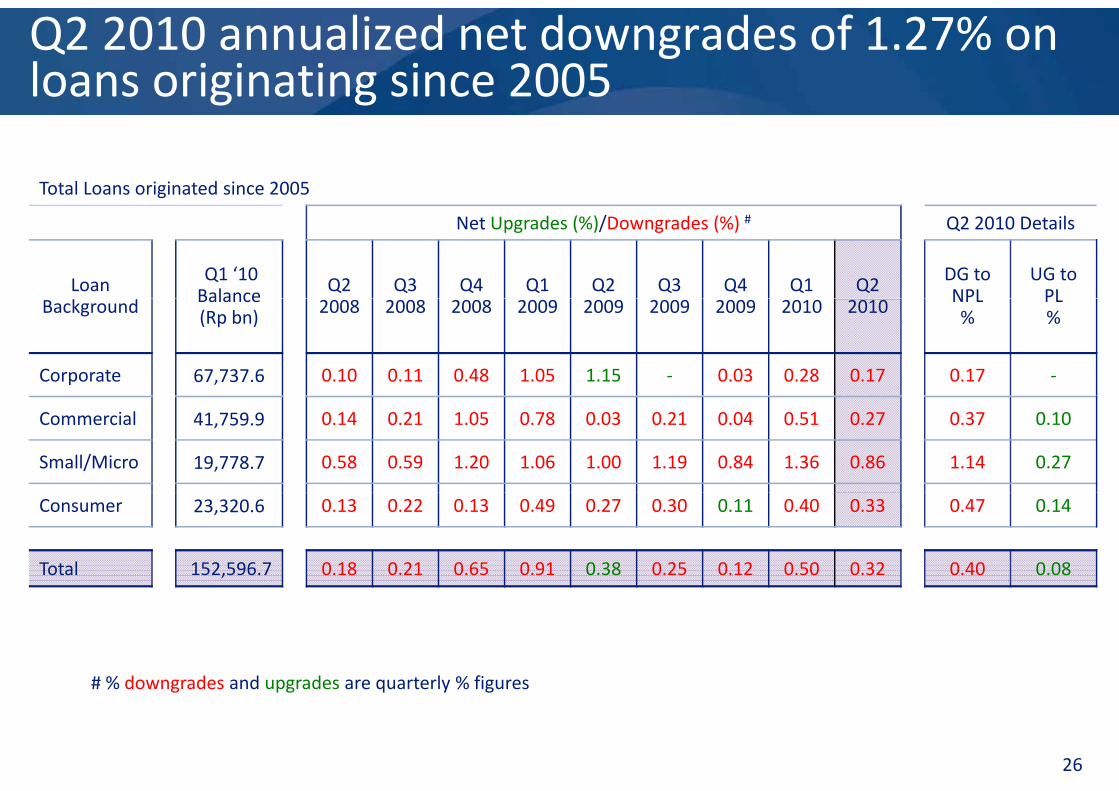
Q2 2010 annualized net downgrades of 1.27% on loans originating since 2005
Total Loans originated since 2005
g g
Net Upgrades (%)/Downgrades (%) # Q2 2010 Details
Loan Q1 ‘10 Balance Q2 Q3 Q4 Q1 Q2 Q3 Q4 Q1 Q2 DG to
NPLUG toPLBackground Balance
(Rp bn) 2008 2008 2008 2009 2009 2009 2009 2010 2010 NPL%
PL%
Corporate 67,737.6 0.10 0.11 0.48 1.05 1.15 ‐ 0.03 0.28 0.17 0.17 ‐
Commercial 41,759.9 0.14 0.21 1.05 0.78 0.03 0.21 0.04 0.51 0.27 0.37 0.10
Small/Micro 19,778.7 0.58 0.59 1.20 1.06 1.00 1.19 0.84 1.36 0.86 1.14 0.27
Consumer 23,320.6 0.13 0.22 0.13 0.49 0.27 0.30 0.11 0.40 0.33 0.47 0.14
Total 152,596.7 0.18 0.21 0.65 0.91 0.38 0.25 0.12 0.50 0.32 0.40 0.08
# % downgrades and upgrades are quarterly % figures
26
# % downgrades and upgrades are quarterly % figures
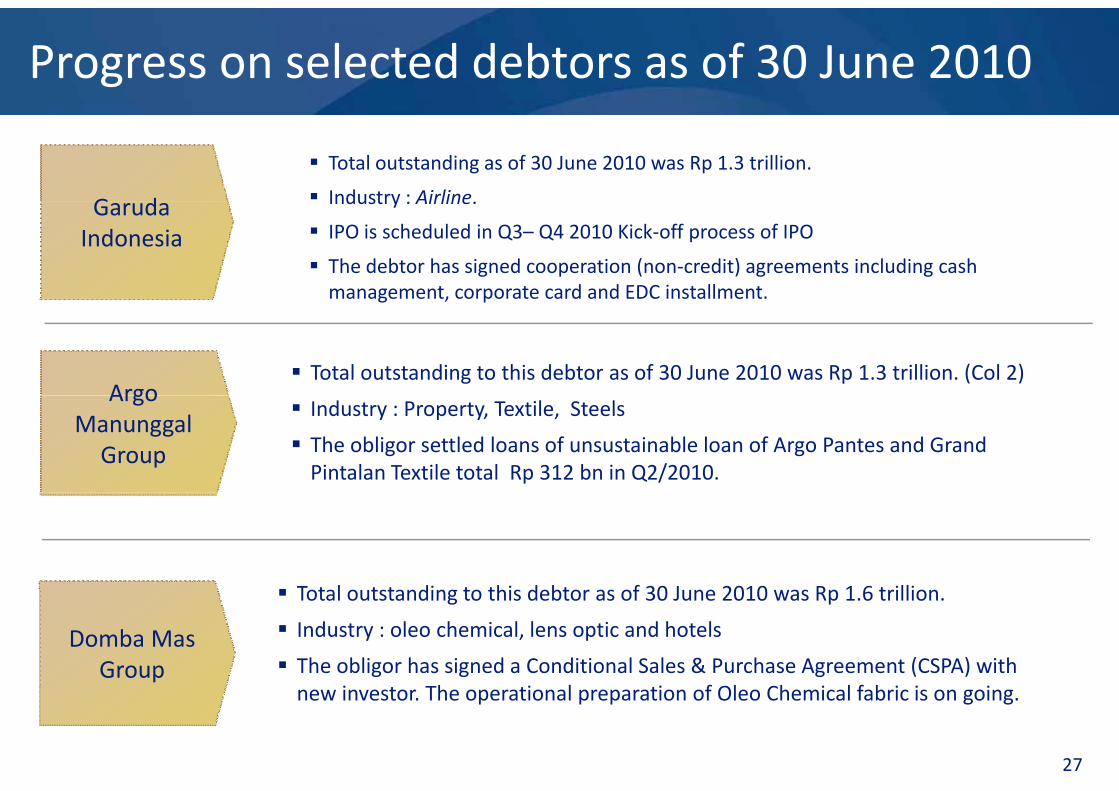
Progress on selected debtors as of 30 June 2010
Total outstanding as of 30 June 2010 was Rp 1.3 trillion.
Industry : Airline.G d Industry : Airline.
IPO is scheduled in Q3– Q4 2010 Kick‐off process of IPO
The debtor has signed cooperation (non‐credit) agreements including cash management, corporate card and EDC installment.
Garuda Indonesia
management, corporate card and EDC installment.
Argo Total outstanding to this debtor as of 30 June 2010 was Rp 1.3 trillion. (Col 2)
Argo Manunggal Group
Industry : Property, Textile, Steels
The obligor settled loans of unsustainable loan of Argo Pantes and Grand Pintalan Textile total Rp 312 bn in Q2/2010.
T t l t t di t thi d bt f 30 J 2010 R 1 6 t illi
Domba Mas Group
Total outstanding to this debtor as of 30 June 2010 was Rp 1.6 trillion.
Industry : oleo chemical, lens optic and hotels
The obligor has signed a Conditional Sales & Purchase Agreement (CSPA) with i Th i l i f Ol Ch i l f b i i i
27
new investor. The operational preparation of Oleo Chemical fabric is on going.

Strengthening Risk Management & Monitoring Systemy
Corporate Customer by Rating Summary of Risk Management Initiatives
• Wholesale Transaction: Optimize credit decision process by focusing on quantitative factors of analysis, redefining clear role of risk team , and aligning RM Organization into
High Risk (Rating C‐ G)
Medium Risk (Rating BBB – B)
Creditbusiness expansion
• High Yield Business: Assign dedicated team, set up loan factory, enhanced business process (incl. tools, monitoring & collection system, policy )
• Optimize capital by implementing ERM & VBA
Low Risk (Rating AAA – A)
15% 12% 11% 15% 15%100%
• Development of risk measurement system for derivative & structured product (Summit)
Optimize capital by implementing ERM & VBA• Consolidate risk management of subsidiaries
34%24% 21%
25% 24%
60%
80%
Market• Implement Market Risk Internal Model• Intraday Limit Monitoring• Enhance Policy & Procedure for Treasury & ALM • Enhance FTP (Fund Transfer Pricing) method• Develop liquidity stress test & safety level64% 68%
60% 61%
40%
%
Operational
• ORM implementation in all unit, incl. overseas offices & subsidiary
• Bring Op. Risk top issues into Management
Develop liquidity stress test & safety level• Develop measurement of capital for IRBB 51%
64% 60% 61%
20%
28
g p p g• Review Op. Risk on new procedures & new products0%
2006 2007 2008 2009 H1 '10
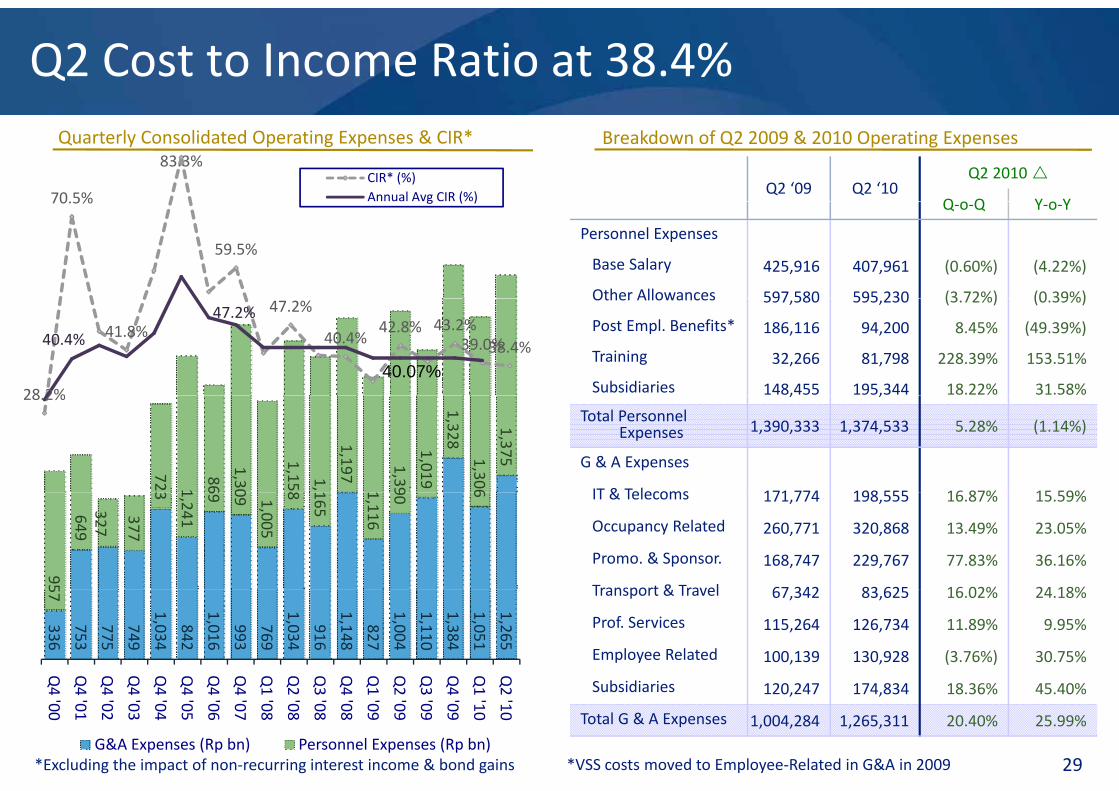
Q2 Cost to Income Ratio at 38.4%
70.5%
83.3%CIR* (%)Annual Avg CIR (%) Q2 ‘09 Q2 ‘10
Q2 2010
Q o Q Y o Y
Breakdown of Q2 2009 & 2010 Operating ExpensesQuarterly Consolidated Operating Expenses & CIR*
70.5%
59.5%
g ( ) Q‐o‐Q Y‐o‐Y
Personnel Expenses
Base Salary 425,916 407,961 (0.60%) (4.22%)
Other Allowances 597 580 595 230 (3 72%) (0 39%)
28 2%
41.8%
47.2%
40.4%42.8% 43.2%
39.0%38.4%40.4%
47.2%
40.07%
Other Allowances 597,580 595,230 (3.72%) (0.39%)
Post Empl. Benefits* 186,116 94,200 8.45% (49.39%)
Training 32,266 81,798 228.39% 153.51%
Subsidiaries 148,455 195,344 18.22% 31.58%
723 1
86
1,30
1,158
1,
1,197
1,39
1,019
1,328 1,306
1,375
28.2% , ,
Total Personnel Expenses 1,390,333 1,374,533 5.28% (1.14%)
G & A Expenses
IT & Telecoms 171 774 198 555 16 87% 15 59%
95
649 327
377
3
1,241
69
09 1,005
8 165
1,116
90
6 IT & Telecoms 171,774 198,555 16.87% 15.59%
Occupancy Related 260,771 320,868 13.49% 23.05%
Promo. & Sponsor. 168,747 229,767 77.83% 36.16%
Transport & Travel 67 342 83 625 16 02% 24 18%
336
753
775
749
1,034
842
1,016
993
769
1,034
916
1,148
827
1,004
1,110
1,384
1,051
1,265
57 Q Q Q Q Q Q Q Q Q Q Q Q Q Q Q Q Q Q
Transport & Travel 67,342 83,625 16.02% 24.18%
Prof. Services 115,264 126,734 11.89% 9.95%
Employee Related 100,139 130,928 (3.76%) 30.75%
Subsidiaries 120 247 174 834 18 36% 45 40%
Q4 '00
Q4 '01
Q4 '02
Q4 '03
Q4 '04
Q4 '05
Q4 '06
Q4 '07
Q1 '08
Q2 '08
Q3 '08
Q4 '08
Q1 '09
Q2 '09
Q3 '09
Q4 '09
Q1 '10
Q2 '10
G&A Expenses (Rp bn) Personnel Expenses (Rp bn)29
Subsidiaries 120,247 174,834 18.36% 45.40%
Total G & A Expenses 1,004,284 1,265,311 20.40% 25.99%
*Excluding the impact of non‐recurring interest income & bond gains *VSS costs moved to Employee‐Related in G&A in 2009
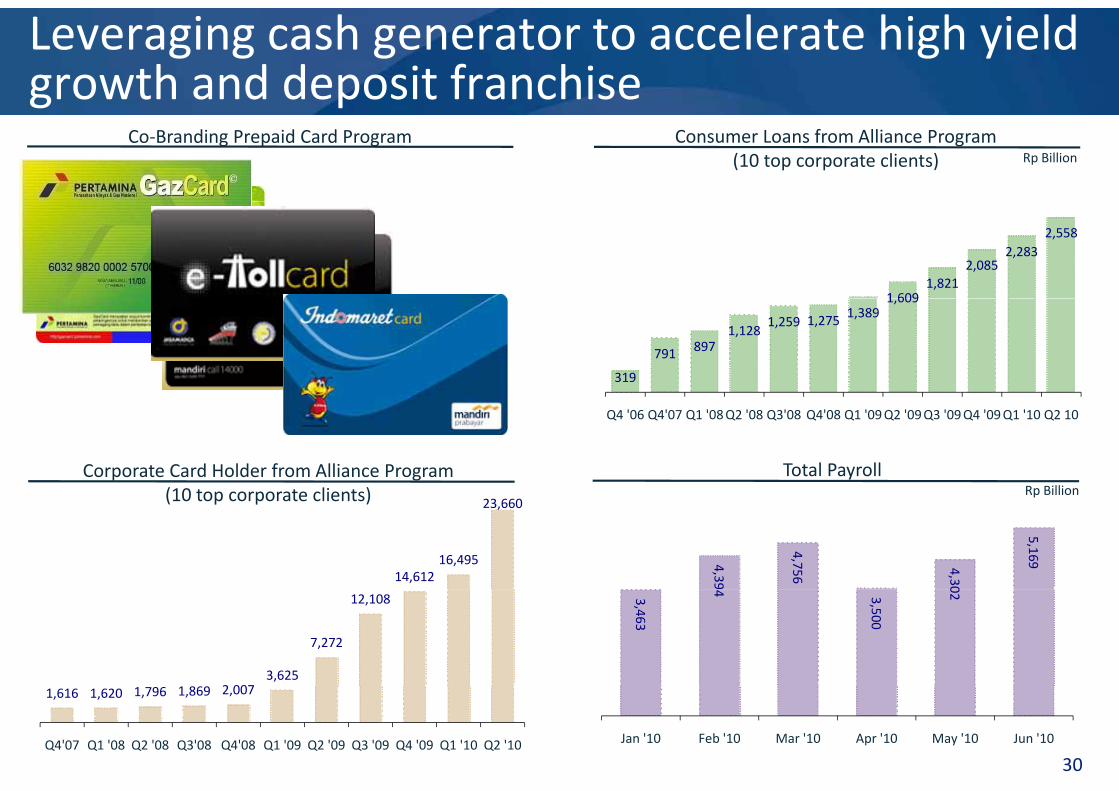
Leveraging cash generator to accelerate high yield growth and deposit franchise
Rp BillionConsumer Loans from Alliance Program
(10 top corporate clients)Co‐Branding Prepaid Card Program
g p
1 6091,821
2,085 2,283
2,558
319
791 897 1,128
1,259 1,275 1,389
1,609
Q4 '06 Q4'07 Q1 '08Q2 '08 Q3'08 Q4'08 Q1 '09Q2 '09Q3 '09Q4 '09Q1 '10 Q2 10
Total Payroll Rp Billion
Corporate Card Holder from Alliance Program(10 top corporate clients)
4,39
4,756
4,3 0
5,169
Rp Billion
14,612 16,495
23,660 (10 top corporate clients)3,463
4 3,500
02
2 0073,625
7,272
12,108
Jan '10 Feb '10 Mar '10 Apr '10 May '10 Jun '10
1,616 1,620 1,796 1,869 2,007
Q4'07 Q1 '08 Q2 '08 Q3'08 Q4'08 Q1 '09 Q2 '09 Q3 '09 Q4 '09 Q1 '10 Q2 '10
30
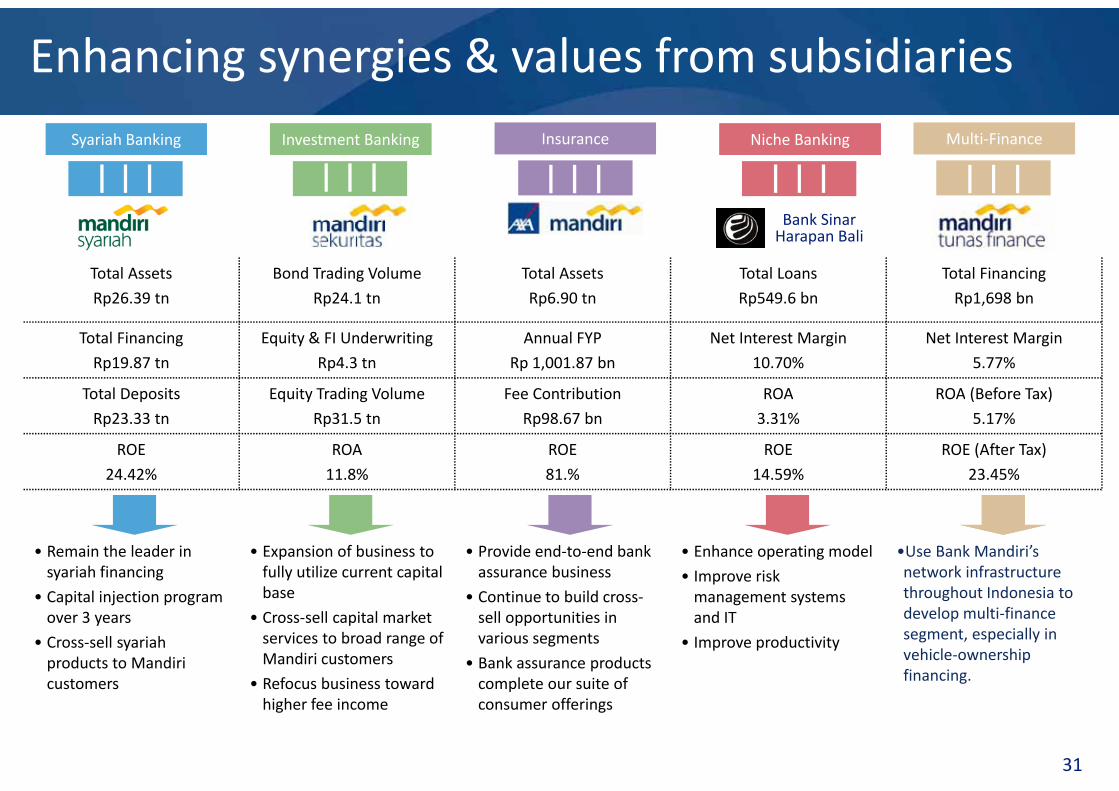
Enhancing synergies & values from subsidiariesInvestment BankingInvestment BankingSyariah BankingSyariah Banking InsuranceInsurance Niche BankingNiche Banking Multi‐FinanceMulti‐Finance
Total Assets
Rp26 39 tn
Bond Trading Volume
Rp24 1 tn
Total Assets
Rp6 90 tn
Total Loans
Rp549 6 bn
Total Financing
Rp1 698 bn
Bank Sinar Harapan Bali
Rp26.39 tn Rp24.1 tn Rp6.90 tn Rp549.6 bn Rp1,698 bn
Total Financing
Rp19.87 tn
Equity & FI Underwriting
Rp4.3 tn
Annual FYP
Rp 1,001.87 bn
Net Interest Margin
10.70%
Net Interest Margin
5.77%
Total Deposits Equity Trading Volume Fee Contribution ROA ROA (Before Tax)Total Deposits
Rp23.33 tn
Equity Trading Volume
Rp31.5 tn
Fee Contribution
Rp98.67 bn
ROA
3.31%
ROA (Before Tax)
5.17%
ROE
24.42%
ROA
11.8%
ROE
81.%
ROE
14.59%
ROE (After Tax)
23.45%
• Remain the leader in syariah financing
• Expansion of business to fully utilize current capital b
• Provide end‐to‐end bank assurance business
• Enhance operating model
• Improve risk
•Use Bank Mandiri’s network infrastructure th h t I d i t• Capital injection program
over 3 years
• Cross‐sell syariahproducts to Mandiri customers
base
• Cross‐sell capital market services to broad range of Mandiri customers
• Refocus business toward
• Continue to build cross‐sell opportunities in various segments
• Bank assurance products complete our suite of
management systems and IT
• Improve productivity
throughout Indonesia to develop multi‐finance segment, especially in vehicle‐ownership financing.
31
customers • Refocus business toward higher fee income
complete our suite of consumer offerings
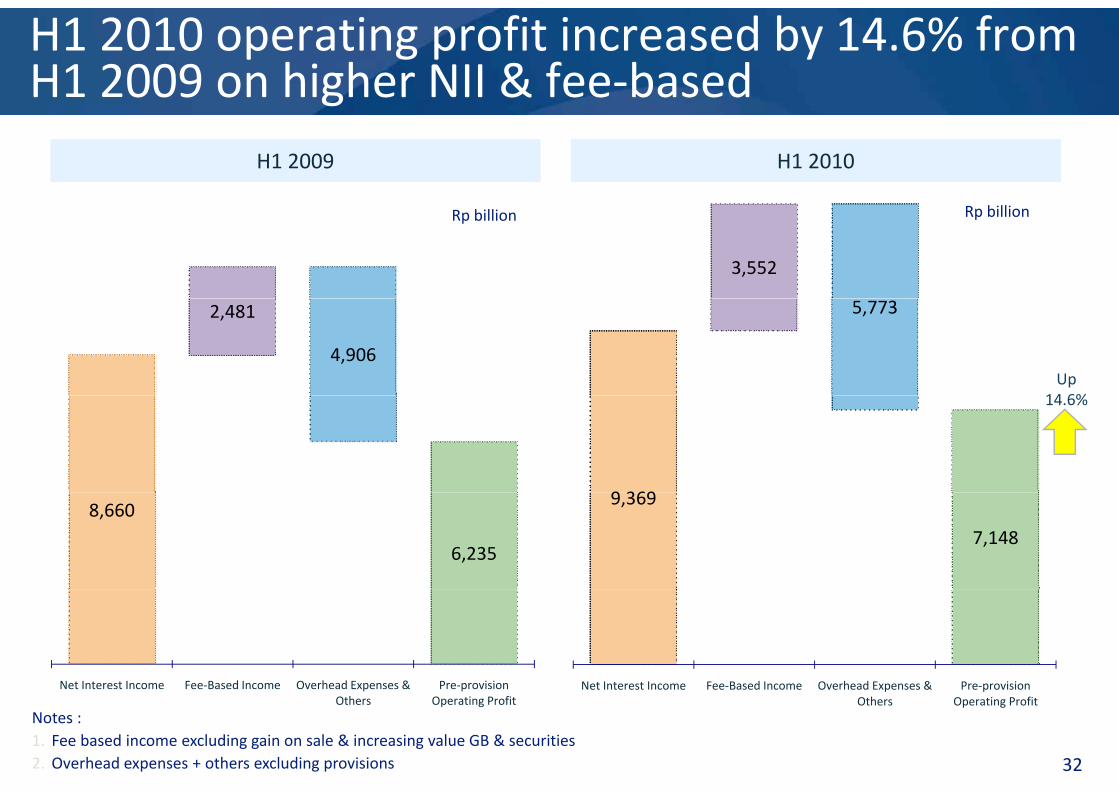
H1 2010 operating profit increased by 14.6% from H1 2009 on higher NII & fee‐basedg
H1 2010H1 2009
3,552
Rp billionRp billion
5,773
Up14 6%
2,481
4,906
9 369
14.6%
9,369
7,1488,660
6,235
Net Interest Income Fee‐Based Income Overhead Expenses & Pre‐provisionNet Interest Income Fee‐Based Income Overhead Expenses & Pre‐provision
32
Net Interest Income Fee‐Based Income Overhead Expenses & Others
Pre‐provision Operating Profit
Notes :1. Fee based income excluding gain on sale & increasing value GB & securities 2. Overhead expenses + others excluding provisions
Net Interest Income Fee‐Based Income Overhead Expenses & Others
Pre‐provision Operating Profit
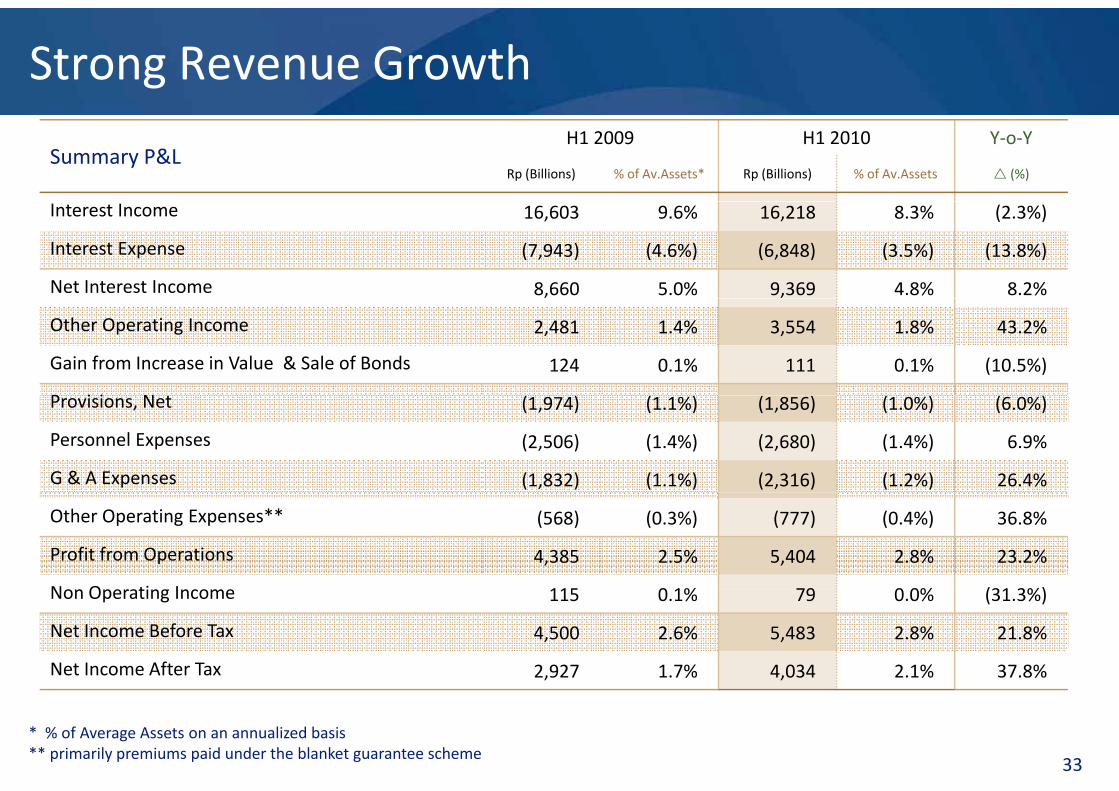
Strong Revenue Growth
Summary P&LH1 2009 H1 2010 Y‐o‐Y
Rp (Billions) % of Av.Assets* Rp (Billions) % of Av.Assets (%)
Interest Income 16,603 9.6% 16,218 8.3% (2.3%)
Interest Expense (7,943) (4.6%) (6,848) (3.5%) (13.8%)
Net Interest Income 8,660 5.0% 9,369 4.8% 8.2%
Other Operating Income 2,481 1.4% 3,554 1.8% 43.2%
Gain from Increase in Value & Sale of Bonds 124 0.1% 111 0.1% (10.5%)
P i i NProvisions, Net (1,974) (1.1%) (1,856) (1.0%) (6.0%)
Personnel Expenses (2,506) (1.4%) (2,680) (1.4%) 6.9%
G & A Expenses (1,832) (1.1%) (2,316) (1.2%) 26.4%
Other Operating Expenses** (568) (0.3%) (777) (0.4%) 36.8%
Profit from Operations 4,385 2.5% 5,404 2.8% 23.2%
N O ti I 115 0 1% 79 0 0% (31 3%)Non Operating Income 115 0.1% 79 0.0% (31.3%)
Net Income Before Tax 4,500 2.6% 5,483 2.8% 21.8%
Net Income After Tax 2,927 1.7% 4,034 2.1% 37.8%
33
* % of Average Assets on an annualized basis** primarily premiums paid under the blanket guarantee scheme
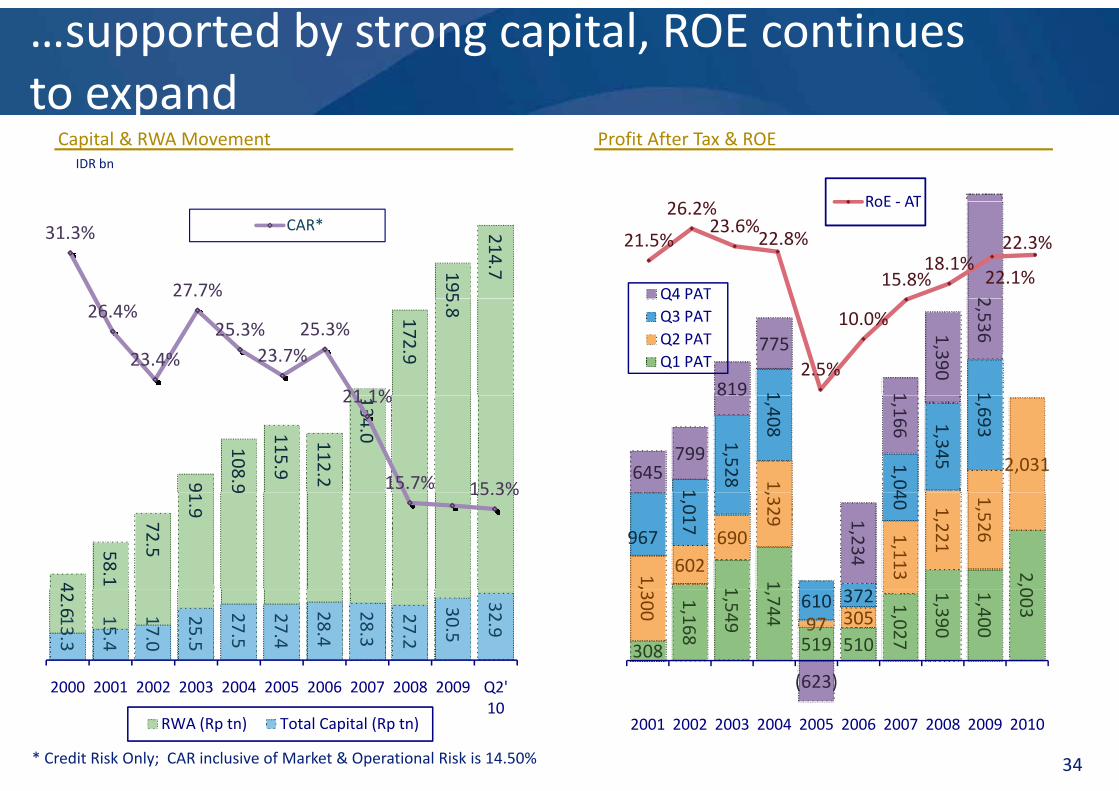
…supported by strong capital, ROE continues to expand
IDR bn
to expandCapital & RWA Movement Profit After Tax & ROE
26 2% RoE AT
195
214.7
31.3%
27.7%
CAR*
2Q4 PAT
21.5%
26.2%23.6%
22.8%
15.8%18.1%
22.1%
22.3%
RoE ‐ AT
172.9
5.826.4%
23.4%
25.3%23.7%
25.3%
21 1% 1 1819
775
1
1,390
2,536
Q4 PATQ3 PATQ2 PATQ1 PAT 2.5%
10.0%
9
108.9
115.9
112.2
134.0
21.1%
15.7% 15 3%
1,
2,031
1
1,528
1,408
1,0 4
1,345
1,693
645 799
8 9 1,166
4
58.1
72.5
1.9
9 15.3%
1 1 2,0
1,
602 690
,329 1,113
1,221
1,526 967
1,017
40 1,234
42.613.3
15.4
17.0
25.5
27.5
27.4
28.4
28.3
27.2
30.5
32.9
2000 2001 2002 2003 2004 2005 2006 2007 2008 2009 Q2'
308
1,168
1,549
1,744
519 510
1,027
1,390
1,400
003
300 97 305 610 372
(623)2000 2001 2002 2003 2004 2005 2006 2007 2008 2009 Q2 10
RWA (Rp tn) Total Capital (Rp tn)
(623)
2001 2002 2003 2004 2005 2006 2007 2008 2009 2010
34* Credit Risk Only; CAR inclusive of Market & Operational Risk is 14.50%
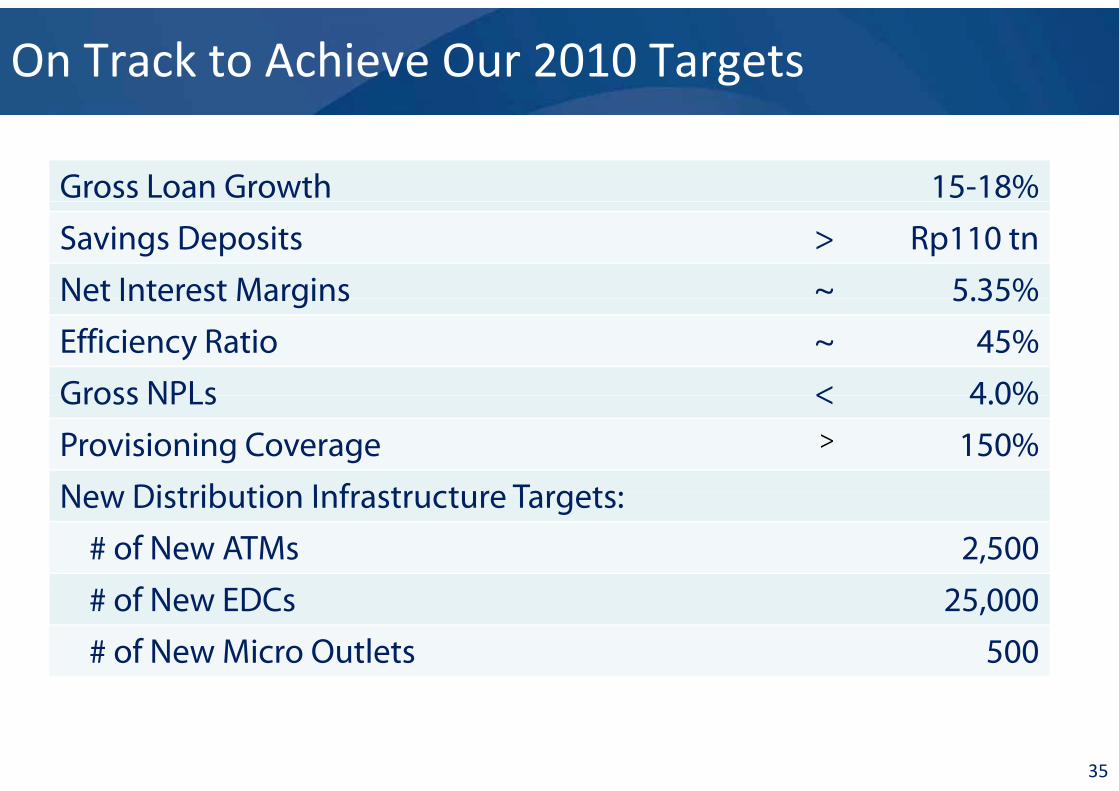
On Track to Achieve Our 2010 Targets
Gross Loan Growth 15-18%Savings Deposits > Rp110 tnNet Interest Margins ~ 5.35%Net Interest Margins 5.35%Efficiency Ratio ~ 45%Gross NPLs < 4 0%Gross NPLs < 4.0%Provisioning Coverage > 150%New Distribution Infrastructure Targets:New Distribution Infrastructure Targets:
# of New ATMs 2,500# f N EDC 25 000# of New EDCs 25,000# of New Micro Outlets 500
35
O iOperating PerformancePerformance Highlightsg g
36
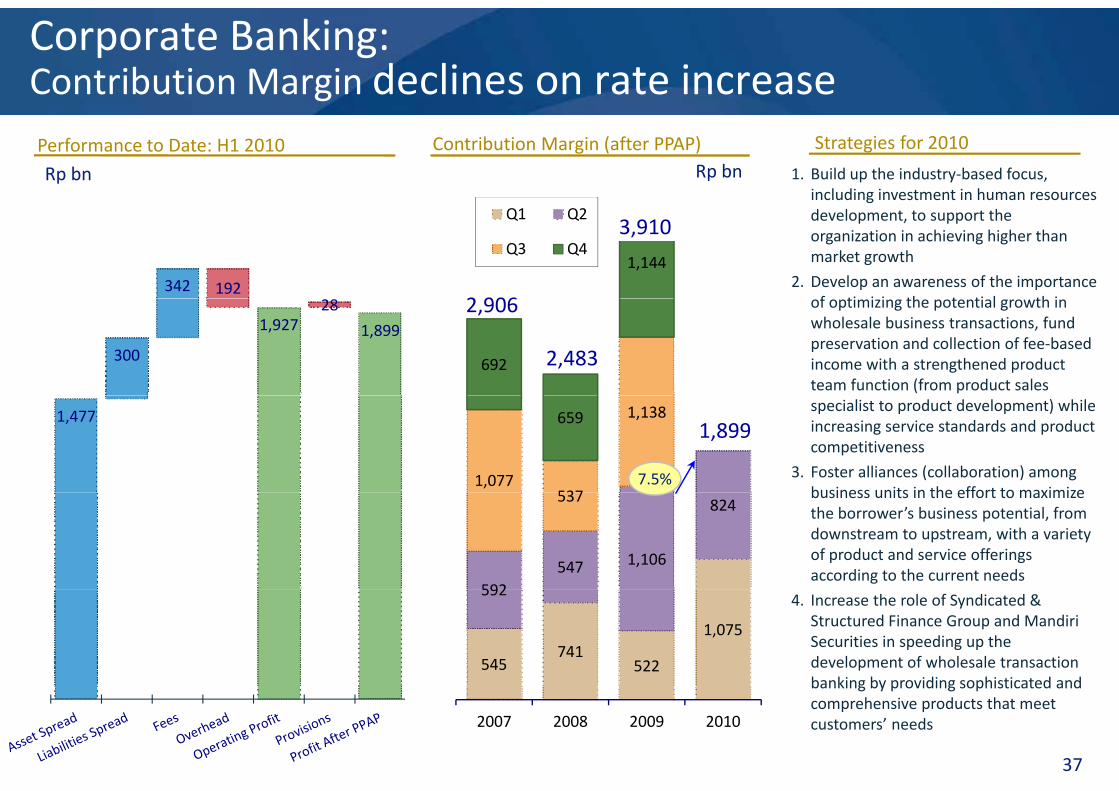
Corporate Banking:Contribution Margin declines on rate increase
Rp bn Rp bnPerformance to Date: H1 2010 Contribution Margin (after PPAP) Strategies for 2010
1. Build up the industry‐based focus, including investment in human resources
342 192
1,144
Q1 Q2
Q3 Q4
2 906
gdevelopment, to support the organization in achieving higher than market growth
2. Develop an awareness of the importance f ti i i th t ti l th i
3,910
300
1,92728
1,899
692
2,906
2,483
of optimizing the potential growth in wholesale business transactions, fund preservation and collection of fee‐based income with a strengthened product team function (from product sales
1,477
1,077537
1,138659
7.5%
specialist to product development) while increasing service standards and product competitiveness
3. Foster alliances (collaboration) among business units in the effort to maximize
1,899
592547 1,106
824537 business units in the effort to maximize the borrower’s business potential, from downstream to upstream, with a variety of product and service offerings according to the current needs
545 741
522
1,075
5924. Increase the role of Syndicated &
Structured Finance Group and Mandiri Securities in speeding up the development of wholesale transaction banking by providing sophisticated and
37
2007 2008 2009 2010
banking by providing sophisticated and comprehensive products that meet customers’ needs
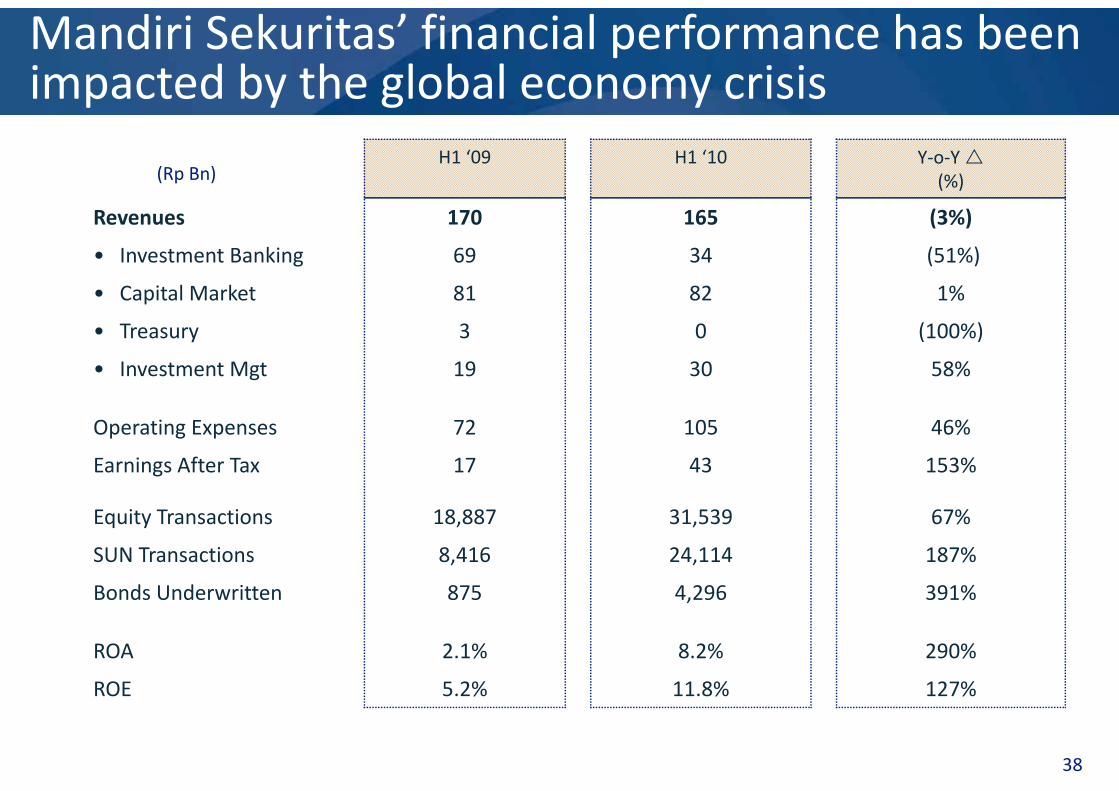
Mandiri Sekuritas’ financial performance has been impacted by the global economy crisis p y g y
H1 ‘09 H1 ‘10 Y‐o‐Y (%)(Rp Bn)
Revenues 170 165 (3%)
• Investment Banking 69 34 (51%)
• Capital Market 81 82 1%Capital Market 81 82 1%
• Treasury 3 0 (100%)
• Investment Mgt 19 30 58%
Operating Expenses 72 105 46%
Earnings After Tax 17 43 153%
Equity Transactions 18,887 31,539 67%
SUN Transactions 8,416 24,114 187%
Bonds Underwritten 875 4 296 391%Bonds Underwritten 875 4,296 391%
ROA 2.1% 8.2% 290%
ROE 5 2% 11 8% 127%ROE 5.2% 11.8% 127%
38
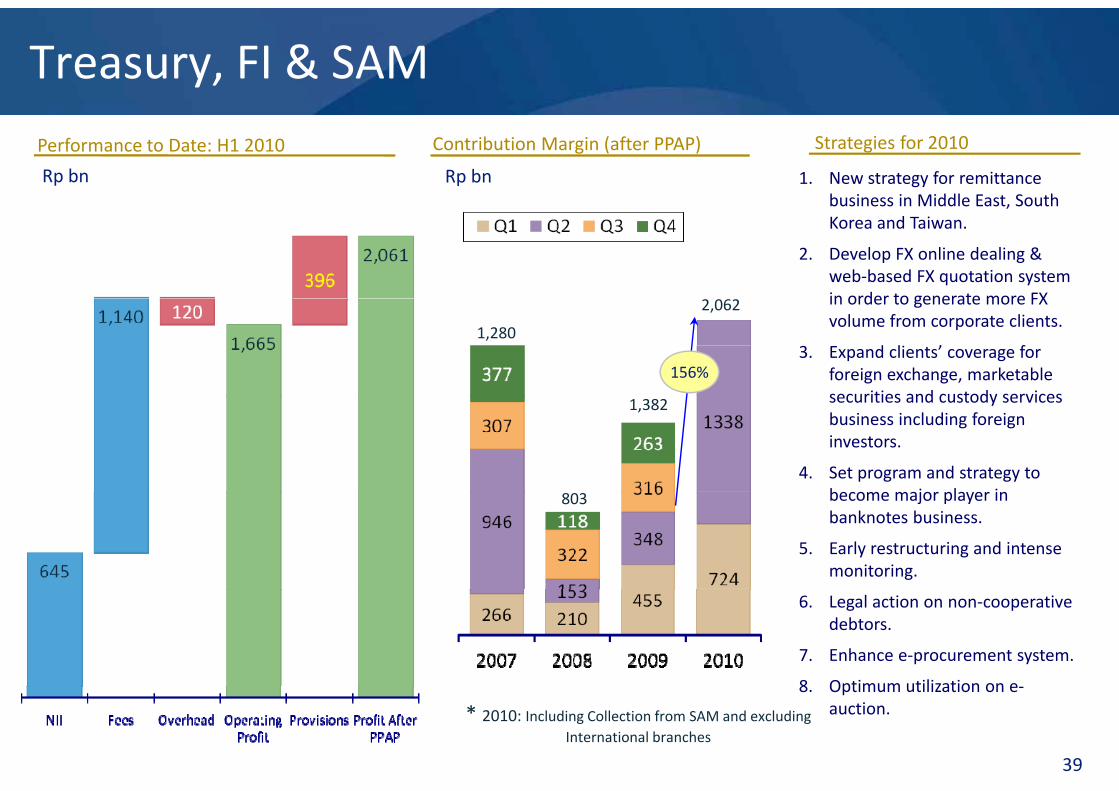
Treasury, FI & SAM
Rp bn Rp bn
Performance to Date: H1 2010 Contribution Margin (after PPAP) Strategies for 2010
1. New strategy for remittance business in Middle East Southbusiness in Middle East, South Korea and Taiwan.
2. Develop FX online dealing & web‐based FX quotation system in order to generate more FXin order to generate more FX volume from corporate clients.
3. Expand clients’ coverage for foreign exchange, marketable securities and custody services
1,280
2,062
156%
securities and custody services business including foreign investors.
4. Set program and strategy to become major player in
1,382
become major player in banknotes business.
5. Early restructuring and intense monitoring.
803
6. Legal action on non‐cooperative debtors.
7. Enhance e‐procurement system.
8 Optimum utilization on e
39
8. Optimum utilization on e‐auction.* 2010: Including Collection from SAM and excluding
International branches
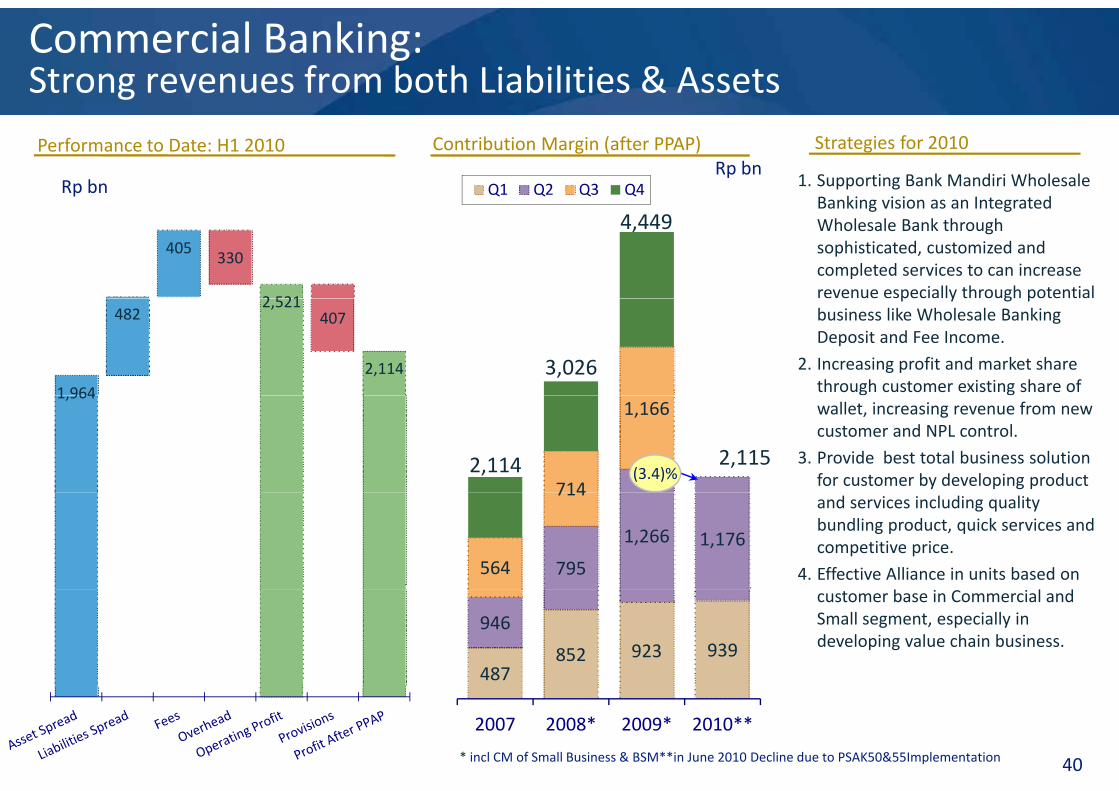
Commercial Banking:Strong revenues from both Liabilities & Assets
Q1 Q2 Q3 Q4Rp bnRp bn
Performance to Date: H1 2010 Contribution Margin (after PPAP) Strategies for 2010
1. Supporting Bank Mandiri Wholesale Banking vision as an Integrated
405330
2 521
Banking vision as an Integrated Wholesale Bank through sophisticated, customized and completed services to can increase revenue especially through potential
4,449
1 964
4822,521
407
2,114 3,026
p y g pbusiness like Wholesale Banking Deposit and Fee Income.
2. Increasing profit and market share through customer existing share of
714
1,1661,964
2,114 (3.4)%
wallet, increasing revenue from new customer and NPL control.
3. Provide best total business solution for customer by developing product
2,115
795
1,266 1,176564
714and services including quality bundling product, quick services and competitive price.
4. Effective Alliance in units based on
487 852 923 939
946customer base in Commercial and Small segment, especially in developing value chain business.
2007 2008* 2009* 2010**
* incl CM of Small Business & BSM**in June 2010 Decline due to PSAK50&55Implementation 40
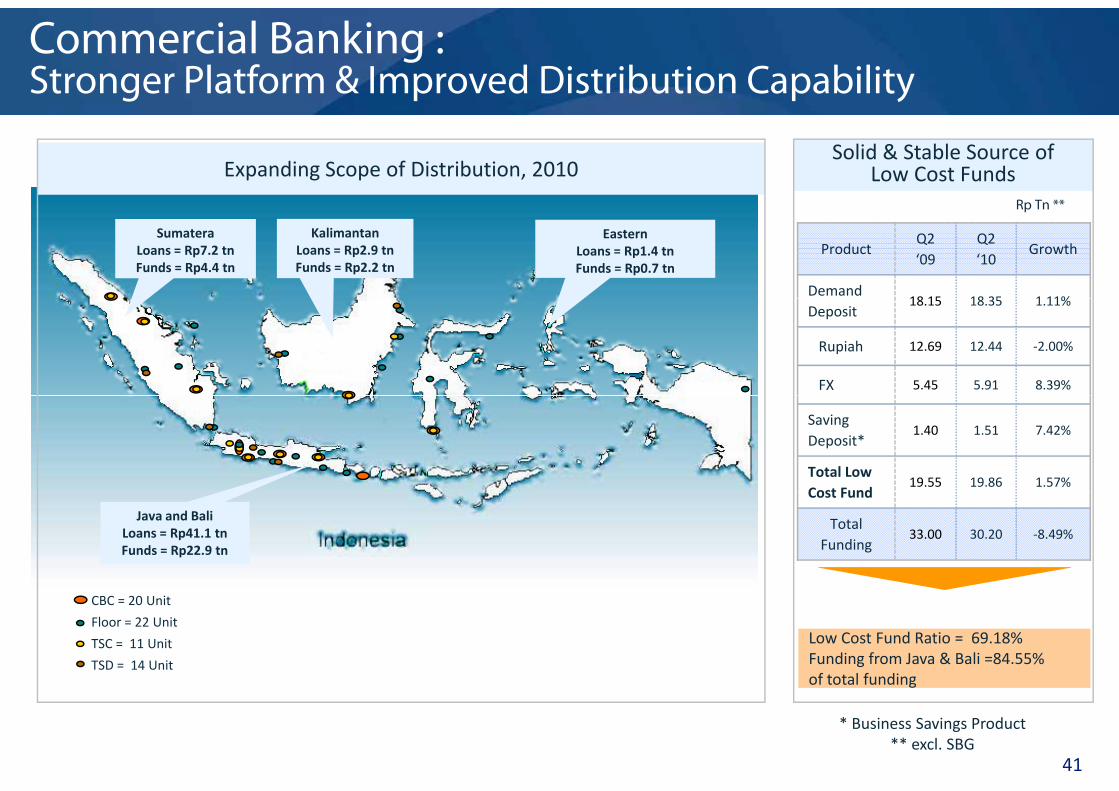
Commercial Banking :Stronger Platform & Improved Distribution Capability
Expanding Scope of Distribution, 2010Solid & Stable Source of
Low Cost FundsR T **
ProductQ2 ‘09
Q2 ‘10
Growth
Demand 18 15 18 35 1 11%
Rp Tn **
SumateraLoans = Rp7.2 tnFunds = Rp4.4 tn
KalimantanLoans = Rp2.9 tnFunds = Rp2.2 tn
EasternLoans = Rp1.4 tnFunds = Rp0.7 tn
Deposit18.15 18.35 1.11%
Rupiah 12.69 12.44 ‐2.00%
FX 5.45 5.91 8.39%
Saving Deposit*
1.40 1.51 7.42%
Total Low Cost Fund
19.55 19.86 1.57%Cost Fund
Total Funding
33.00 30.20 ‐8.49%Java and Bali
Loans = Rp41.1 tnFunds = Rp22.9 tn
CBC = 20 Unit
Floor = 22 Unit
TSC = 11 Unit
TSD = 14 Unit
Low Cost Fund Ratio = 69.18%Funding from Java & Bali =84.55% of total funding
41
g
* Business Savings Product** excl. SBG
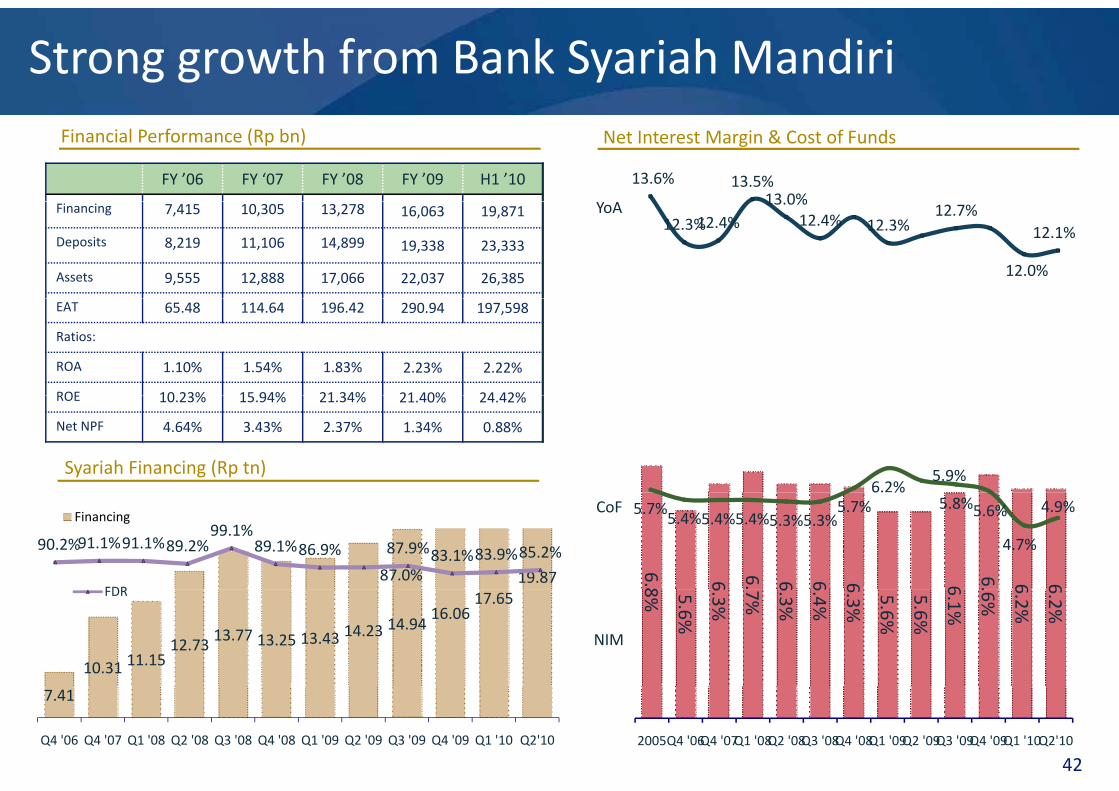
Strong growth from Bank Syariah Mandiri
13.6% 13.5%13 0%
Net Interest Margin & Cost of FundsFinancial Performance (Rp bn)
FY ’06 FY ‘07 FY ’08 FY ’09 H1 ’10
12.3%12.4%13.0%
12.4% 12.3%12.7%
12.0%
12.1%
YoAFinancing 7,415 10,305 13,278 16,063 19,871
Deposits 8,219 11,106 14,899 19,338 23,333
Assets 9,555 12,888 17,066 22,037 26,385
EAT 65.48 114.64 196.42 290.94 197,598
Ratios:
ROA 1.10% 1.54% 1.83% 2.23% 2.22%
ROE 10 23% 15 94% 21 34% 21 40% 24 42%
6.2%5.9%Syariah Financing (Rp tn)
ROE 10.23% 15.94% 21.34% 21.40% 24.42%
Net NPF 4.64% 3.43% 2.37% 1.34% 0.88%
6.8 6 6. 6 6 6 6 6. 6 6
5.7%5.4%5.4%5.4%5.3%5.3%
5.7%6. %
5.8%5.6%
4.7%
4.9%
19.87
Financing
90.2%91.1%91.1%89.2%99.1%
89.1%86.9%
87.0%
87.9%83.1%83.9%85.2%
FDR
CoF
8% 5.6%
6.3%
7%
6.3%
6.4%
6.3%
5.6%
5.6%
6.1%
.6%
6.2%
6.2%
10.31 11.1512.73
13.77 13.25 13.43 14.2314.94
16.0617.65FDR
NIM
2005Q4 '06Q4 '07Q1 '08Q2 '08Q3 '08Q4 '08Q1 '09Q2 '09Q3 '09Q4 '09Q1 '10Q2'10
7.41
Q4 '06 Q4 '07 Q1 '08 Q2 '08 Q3 '08 Q4 '08 Q1 '09 Q2 '09 Q3 '09 Q4 '09 Q1 '10 Q2'10
42
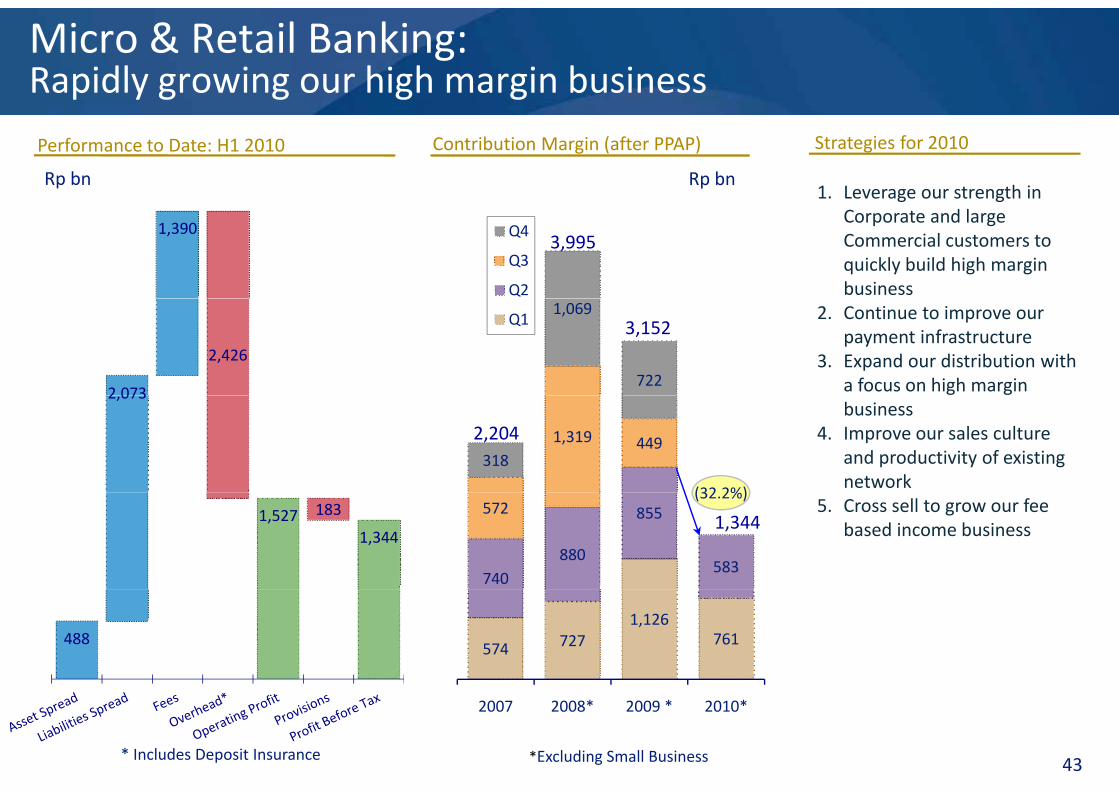
Micro & Retail Banking:Rapidly growing our high margin business
Performance to Date: H1 2010 Contribution Margin (after PPAP)
Rp bn Rp bn
Strategies for 2010
1. Leverage our strength in
Q4
Q3
Q2
1,3903,995
g gCorporate and large Commercial customers to quickly build high margin business
1,069
722
Q1
2 073
2,426
2. Continue to improve our payment infrastructure
3. Expand our distribution with a focus on high margin
3,152
1,319 449318
(32 2%)
2,073
2,204business
4. Improve our sales culture and productivity of existing network
740 880
855
583
572(32.2%)
1,527 183
1,344
5. Cross sell to grow our fee based income business1,344
574 727 1,126
761 488
2007 2008* 2009 * 2010*
*Excluding Small Business 43* Includes Deposit Insurance
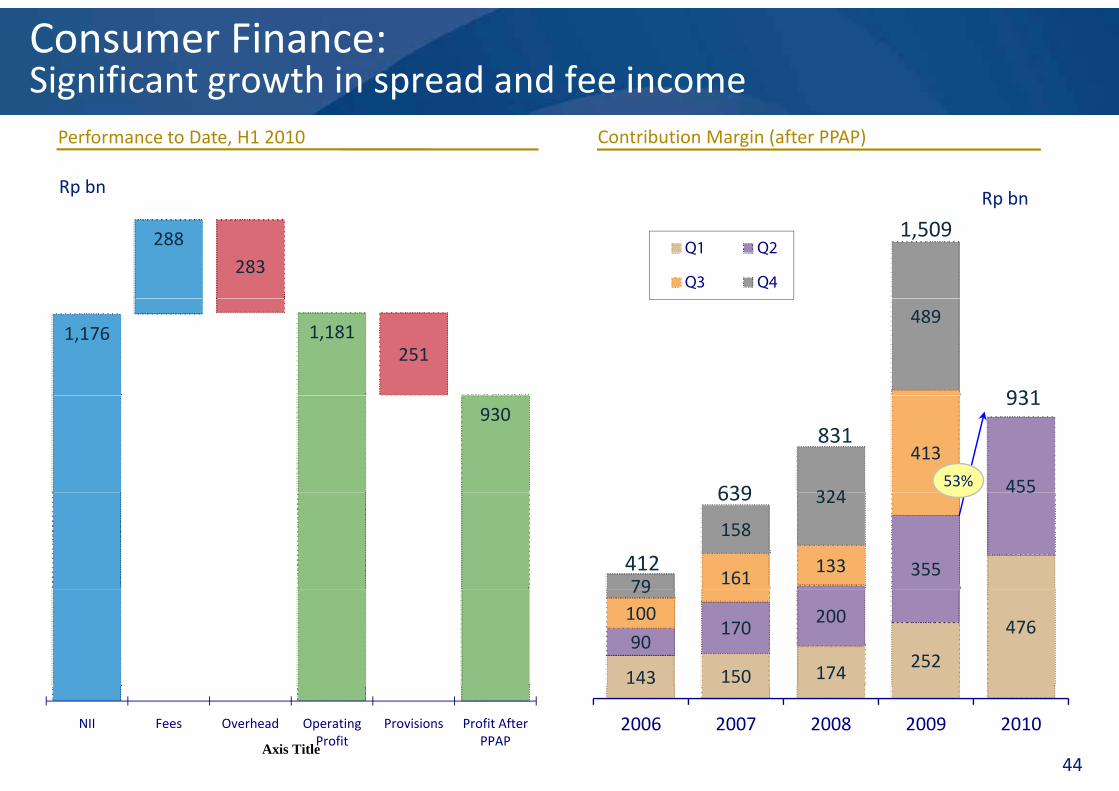
Consumer Finance:Significant growth in spread and fee income
Performance to Date, H1 2010 Contribution Margin (after PPAP)
Rp bnRp bnRp bn
288283
Q1 Q2
Q3 Q4
1,509
1,176 1,181251
489
931930
455
413
32463953%
831
931
355
455
161133
79
158
324
412
639
143 150 174 252
476 90
170200100
79
44
NII Fees Overhead Operating Profit
Provisions Profit After PPAPAxis Title
2006 2007 2008 2009 2010
S i M i lSupporting Materials
45

Key Quarterly Balance Sheet Items & Financial Ratios
IDR billion / % H1 ‘09 FY ‘09 H1 ‘10 Y‐o‐Y (%)
Gross Loans 181,611 198,547 217,996 20.03%
Government Bonds 88 243 89 133 83 536 (5 33%)Government Bonds 88,243 89,133 83,536 (5.33%)
Total Assets 358,897 394,617 402,084 12.03%
Customer Deposits 287,055 319,550 326,578 13.77%
T l E iTotal Equity 31,439 35,109 36,508 16.12%
RoA ‐ before tax (p.a.) 2.54% 2.96% 2.75%
RoE – after tax (p.a.) 18.70% 22.07% 22.33%
Cost to Income(1) 38.94% 40.18% 38.66%
NIM (p.a.) 5.35% 5.22% 5.18%
LDR 62.20% 61.36% 66.33%
Gross NPL / Total Loans 4.78% 2.79% 2.54%
Provisions / NPLs 136.13% 200.45% 205.97%
Tier 1 CAR(2) 12.62% 12.50% 11.85%
Total CAR(2) 14.10% 15.55% 14.58%
Total CAR incl. Market Risk 14.02% 15.43% 14.50%
EPS (Rp) 139.92 341.72 192.34 37.56%
46
S ( p) 139.92 341.72 192.34 37.56%
Book Value/Share (Rp) 1,503 1,677 1,741 15.83%(1) (G&A and employee expenses) / (Net Interest Income + Other Operating Income), excluding bond gains(2) Bank only – Not including Market Risk
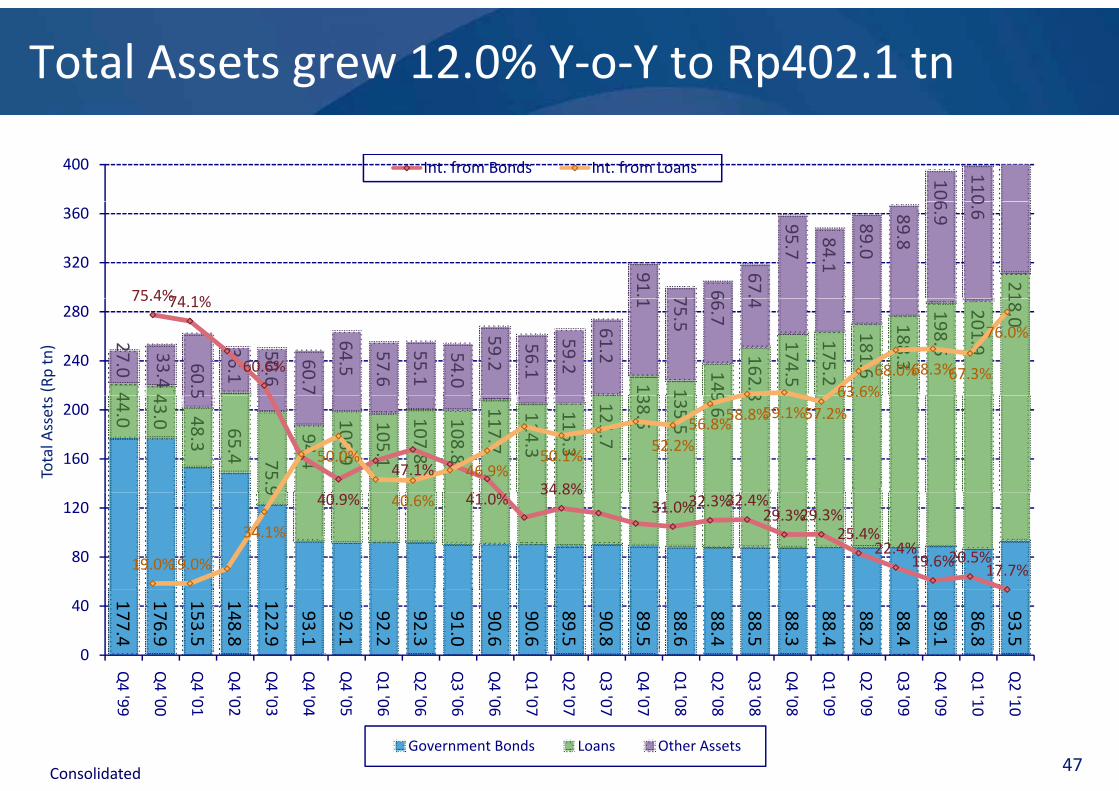
Total Assets grew 12.0% Y‐o‐Y to Rp402.1 tn
106
110400 Int. from Bonds Int. from Loans
21
91. 7 6
67.
95.7
84.1
89.0
89.8
6.9
0.6
320
360
75 4%74 1%
4 4 13 1
149
162.8
174.5
175.2
181.6
188.3
198.5
201.9
18.0
27.0
33.4
60. 5
36.1
50.6
60.7
64.5
57.6
55.1
54.0
59.2
56.1
59.2
61.2
1 75.5
66.7
4240
28075.4%74.1%
60.6%
63.6%68.0%68.3%67.3%
76.0%
(Rp tn)
44.0
43.0 48.3
65.4 75. 9
94.4
106.9
105.1
107.8
108.8
117.7
114.3
116.3
121.7
38.5
135.5
9.6
85
160
200
47.1%34 8%
50.0%46.9%
50.1%52.2%
56.8%58.8%59.1%57.2%
63.6%
Total A
ssets
9
80
120 40.9% 41.0%34.8%
31.0%32.3%32.4%29.3%29.3%25.4%
22.4%19.6%20.5%17.7%19.0%19.0%
34.1%
40.6%
177.4
176.9
153.5
148.8
122.9
93.1
92.1
92.2
92.3
91.0
90.6
90.6
89.5
90.8
89.5
88.6
88.4
88.5
88.3
88.4
88.2
88.4
89.1
86.8
93.5
0
40
Q4
Q4
Q4
Q4
Q4
Q4
Q4
Q1
Q2
Q3
Q4
Q1
Q2
Q3
Q4
Q1
Q2
Q3
Q4
Q1
Q2
Q3
Q4
Q1
Q24 '99
4 '00
4 '01
4 '02
4 '03
4 '04
4 '05
1 '06
2 '06
3 '06
4 '06
1 '07
2 '07
3 '07
4 '07
1 '08
2 '08
3 '08
4 '08
1 '09
2 '09
3 '09
4 '09
1 '10
2 '10
Government Bonds Loans Other Assets47Consolidated
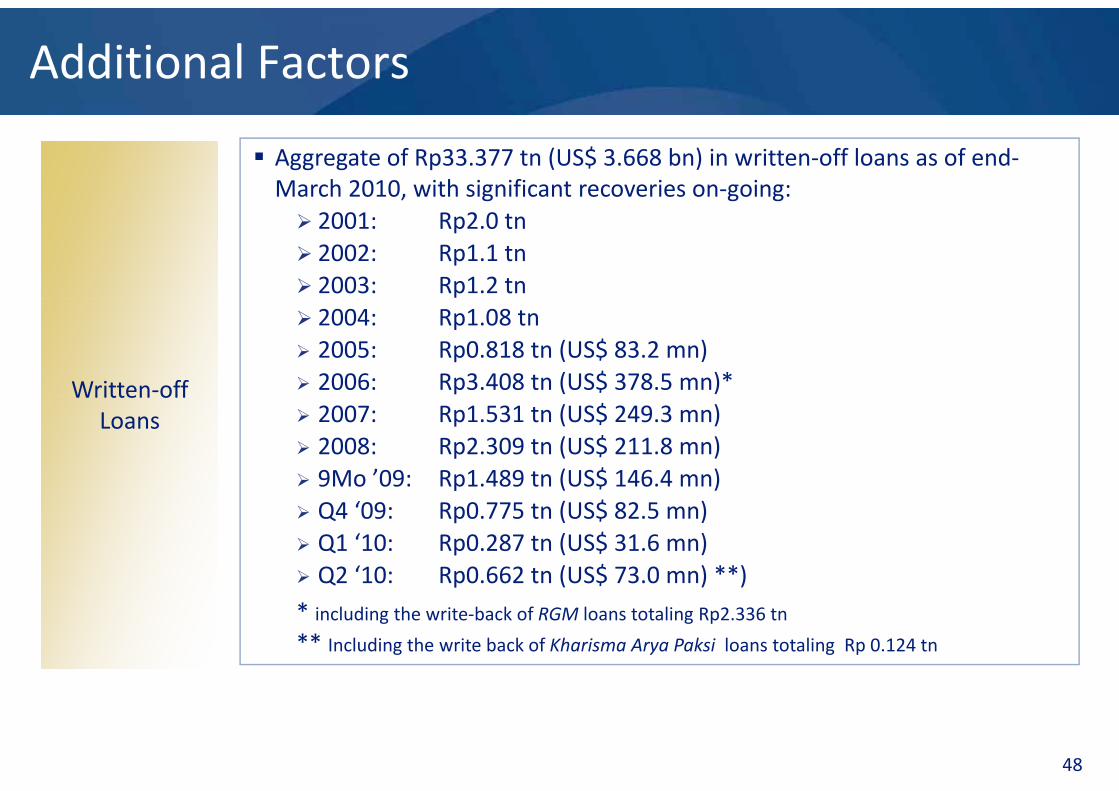
Additional Factors
Aggregate of Rp33.377 tn (US$ 3.668 bn) in written‐off loans as of end‐March 2010, with significant recoveries on‐going: 2001: Rp2.0 tn 2002: Rp1.1 tn 2003: Rp1.2 tn
Written‐offWritten‐off
2004: Rp1.08 tn 2005: Rp0.818 tn (US$ 83.2 mn) 2006: Rp3.408 tn (US$ 378.5 mn)*Written off
LoansWritten off
Loans 2007: Rp1.531 tn (US$ 249.3 mn) 2008: Rp2.309 tn (US$ 211.8 mn) 9Mo ’09: Rp1.489 tn (US$ 146.4 mn) Q4 ‘09: Rp0.775 tn (US$ 82.5 mn) Q1 ‘10: Rp0.287 tn (US$ 31.6 mn) Q2 ‘10: Rp0.662 tn (US$ 73.0 mn) **)
* including the write‐back of RGM loans totaling Rp2.336 tn
** Including the write back of Kharisma Arya Paksi loans totaling Rp 0.124 tn
48
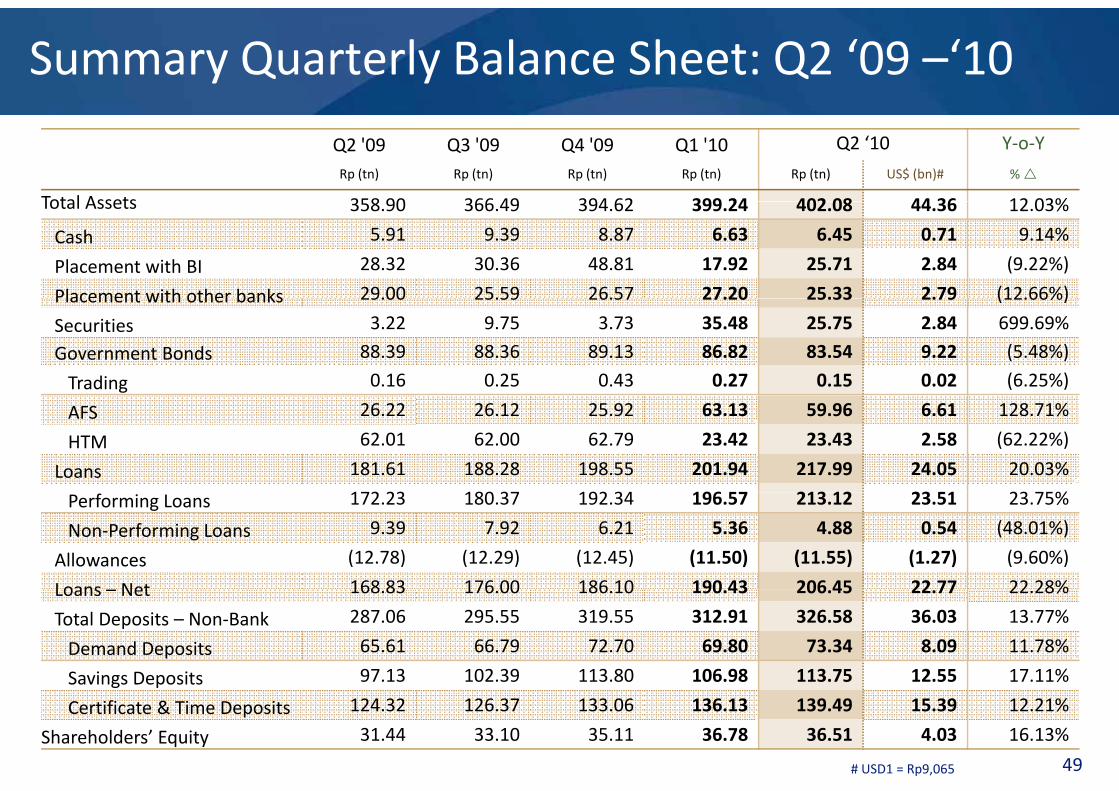
Summary Quarterly Balance Sheet: Q2 ‘09 –‘10
Q2 '09 Q3 '09 Q4 '09 Q1 '10 Q2 ‘10 Y‐o‐Y
Rp (tn) Rp (tn) Rp (tn) Rp (tn) Rp (tn) US$ (bn)# %
Total Assets 358 90 366 49 394 62 399 24 402 08 44 36 12 03%Total Assets 358.90 366.49 394.62 399.24 402.08 44.36 12.03%
Cash 5.91 9.39 8.87 6.63 6.45 0.71 9.14%
Placement with BI 28.32 30.36 48.81 17.92 25.71 2.84 (9.22%)
Placement with other banks 29.00 25.59 26.57 27.20 25.33 2.79 (12.66%)Placement with other banks 29.00 25.59 26.57 27.20 25.33 2.79 (12.66%)
Securities 3.22 9.75 3.73 35.48 25.75 2.84 699.69%
Government Bonds 88.39 88.36 89.13 86.82 83.54 9.22 (5.48%)
Trading 0.16 0.25 0.43 0.27 0.15 0.02 (6.25%)
AFS 26.22 26.12 25.92 63.13 59.96 6.61 128.71%
HTM 62.01 62.00 62.79 23.42 23.43 2.58 (62.22%)
Loans 181.61 188.28 198.55 201.94 217.99 24.05 20.03%
172 23 180 37 192 34 196 57 213 12 23 51 23 75%Performing Loans 172.23 180.37 192.34 196.57 213.12 23.51 23.75%
Non‐Performing Loans 9.39 7.92 6.21 5.36 4.88 0.54 (48.01%)
Allowances (12.78) (12.29) (12.45) (11.50) (11.55) (1.27) (9.60%)
Loans Net 168 83 176 00 186 10 190 43 206 45 22 77 22 28%Loans – Net 168.83 176.00 186.10 190.43 206.45 22.77 22.28%
Total Deposits – Non‐Bank 287.06 295.55 319.55 312.91 326.58 36.03 13.77%
Demand Deposits 65.61 66.79 72.70 69.80 73.34 8.09 11.78%
Savings Deposits 97.13 102.39 113.80 106.98 113.75 12.55 17.11%
49
g p
Certificate & Time Deposits 124.32 126.37 133.06 136.13 139.49 15.39 12.21%
Shareholders’ Equity 31.44 33.10 35.11 36.78 36.51 4.03 16.13%
# USD1 = Rp9,065
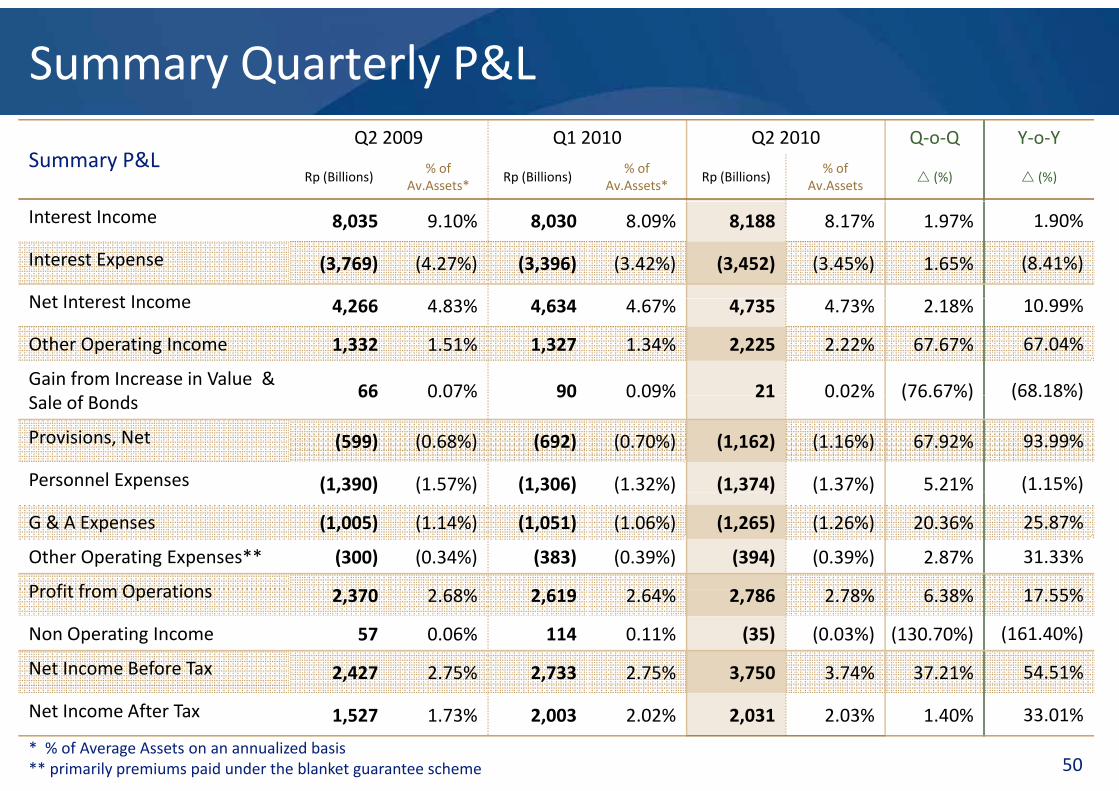
Summary Quarterly P&L
Summary P&LQ2 2009 Q1 2010 Q2 2010 Q‐o‐Q Y‐o‐Y
Rp (Billions)% of
Av.Assets*Rp (Billions)
% of Av.Assets*
Rp (Billions)% of
Av.Assets (%) (%)
Interest Income 8,035 9.10% 8,030 8.09% 8,188 8.17% 1.97% 1.90%
Interest Expense (3,769) (4.27%) (3,396) (3.42%) (3,452) (3.45%) 1.65% (8.41%)
Net Interest IncomeNet Interest Income 4,266 4.83% 4,634 4.67% 4,735 4.73% 2.18% 10.99%
Other Operating Income 1,332 1.51% 1,327 1.34% 2,225 2.22% 67.67% 67.04%
Gain from Increase in Value & l f d
66 0.07% 90 0.09% 21 0.02% (76.67%) (68.18%)Sale of Bonds
66 0.07% 90 0.09% 21 0.02% (76.67%) (68.18%)
Provisions, Net (599) (0.68%) (692) (0.70%) (1,162) (1.16%) 67.92% 93.99%
Personnel Expenses (1,390) (1.57%) (1,306) (1.32%) (1,374) (1.37%) 5.21% (1.15%)( , ) ( ) ( , ) ( ) ( , ) ( ) ( )
G & A Expenses (1,005) (1.14%) (1,051) (1.06%) (1,265) (1.26%) 20.36% 25.87%
Other Operating Expenses** (300) (0.34%) (383) (0.39%) (394) (0.39%) 2.87% 31.33%
Profit from Operations 2 370 2 68% 2 619 2 64% 2 786 2 78% 6 38% 17 55%Profit from Operations 2,370 2.68% 2,619 2.64% 2,786 2.78% 6.38% 17.55%
Non Operating Income 57 0.06% 114 0.11% (35) (0.03%) (130.70%) (161.40%)
Net Income Before Tax 2,427 2.75% 2,733 2.75% 3,750 3.74% 37.21% 54.51%
50
Net Income After Tax 1,527 1.73% 2,003 2.02% 2,031 2.03% 1.40% 33.01%
* % of Average Assets on an annualized basis** primarily premiums paid under the blanket guarantee scheme
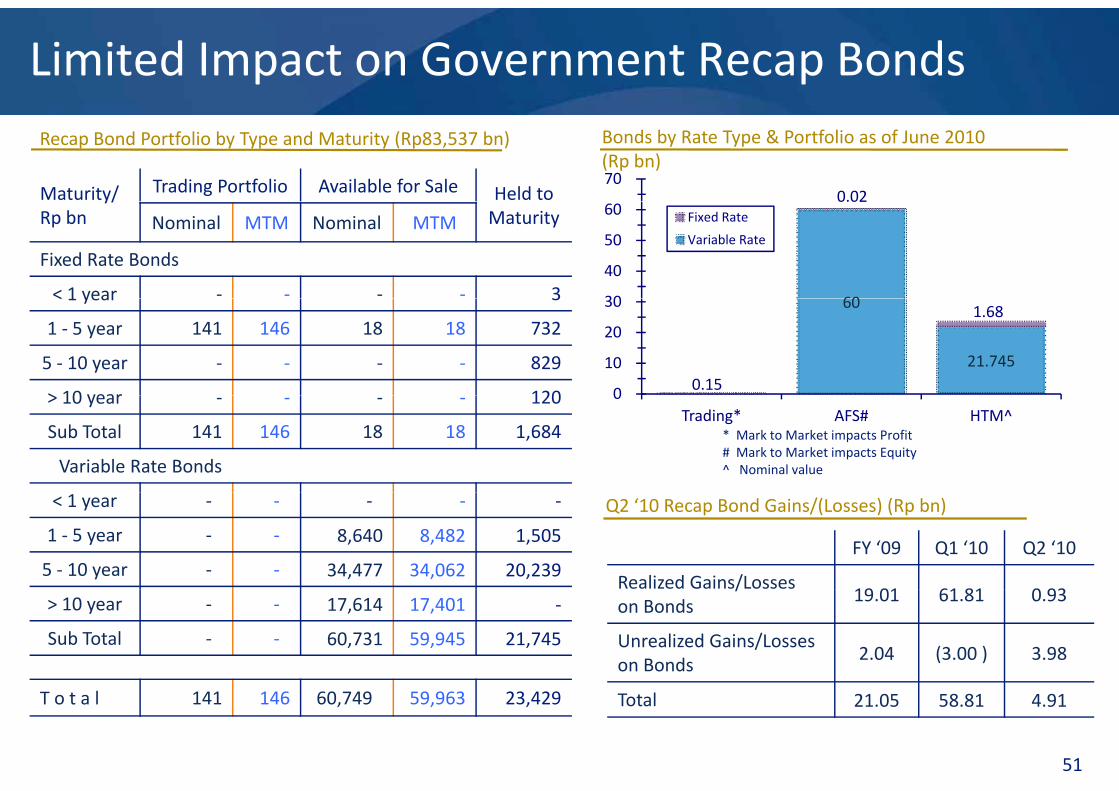
Limited Impact on Government Recap Bonds
Maturity/ Trading Portfolio Available for Sale Held to
Recap Bond Portfolio by Type and Maturity (Rp83,537 bn)
0.0270
Bonds by Rate Type & Portfolio as of June 2010(Rp bn)
y/Rp bn MaturityNominal MTM Nominal MTM
Fixed Rate Bonds
< 1 year ‐ ‐ ‐ ‐ 3 60
0.02
30
40
50
60 Fixed Rate
Variable Rate
< 1 year 3
1 ‐ 5 year 141 146 18 18 732
5 ‐ 10 year ‐ ‐ ‐ ‐ 829
> 10 year 120
60
21.7450.15
1.68
0
10
20
30
> 10 year ‐ ‐ ‐ ‐ 120
Sub Total 141 146 18 18 1,684
Variable Rate Bonds
* Mark to Market impacts Profit# Mark to Market impacts Equity^ Nominal value
0 Trading* AFS# HTM^
< 1 year ‐ ‐ ‐ ‐ ‐
1 ‐ 5 year ‐ ‐ 8,640 8,482 1,505
5 ‐ 10 year ‐ ‐ 34,477 34,062 20,239 FY ‘09 Q1 ‘10 Q2 ‘10
Realized Gains/Losses19 01 61 81 0 93
Q2 ‘10 Recap Bond Gains/(Losses) (Rp bn)
> 10 year ‐ ‐ 17,614 17,401 ‐
Sub Total ‐ ‐ 60,731 59,945 21,745
/on Bonds 19.01 61.81 0.93
Unrealized Gains/Losseson Bonds 2.04 (3.00 ) 3.98
51
T o t a l 141 146 60,749 59,963 23,429 Total 21.05 58.81 4.91
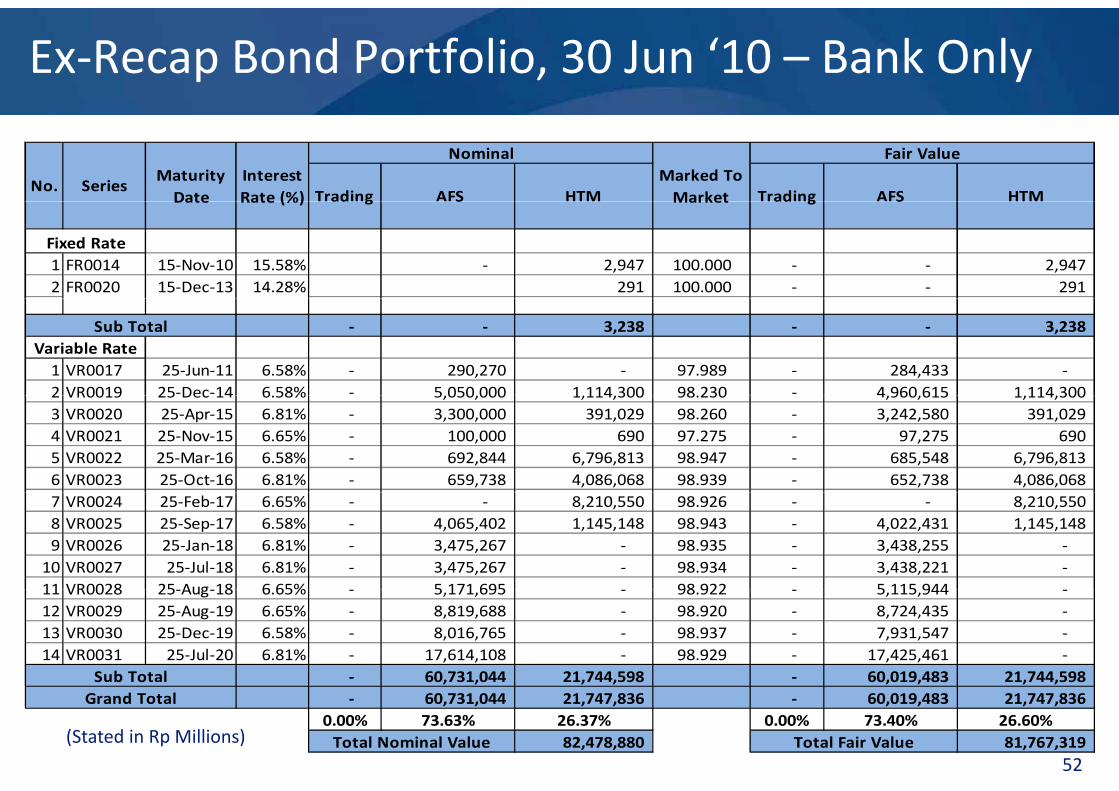
Ex‐Recap Bond Portfolio, 30 Jun ‘10 – Bank Only
SeriesMaturity Date
No.Trading AFS HTM Trading
Interest Rate (%)
Marked To Market
Fair ValueNominal
AFS HTM
1 FR0014 15‐Nov‐10 15.58% ‐ 2,947 100.000 ‐ ‐ 2,947 2 FR0020 15‐Dec‐13 14.28% 291 100.000 ‐ ‐ 291
Date ad g S ad gRate (%) Market S
Fixed Rate
‐ ‐ 3,238 ‐ ‐ 3,238
1 VR0017 25‐Jun‐11 6.58% ‐ 290,270 ‐ 97.989 ‐ 284,433 ‐ 2 VR0019 25‐Dec‐14 6 58% ‐ 5 050 000 1 114 300 98 230 ‐ 4 960 615 1 114 300
Variable RateSub Total
2 VR0019 25 Dec 14 6.58% 5,050,000 1,114,300 98.230 4,960,615 1,114,300 3 VR0020 25‐Apr‐15 6.81% ‐ 3,300,000 391,029 98.260 ‐ 3,242,580 391,029 4 VR0021 25‐Nov‐15 6.65% ‐ 100,000 690 97.275 ‐ 97,275 690 5 VR0022 25‐Mar‐16 6.58% ‐ 692,844 6,796,813 98.947 ‐ 685,548 6,796,813 6 VR0023 25‐Oct‐16 6.81% ‐ 659,738 4,086,068 98.939 ‐ 652,738 4,086,068 7 VR0024 25‐Feb‐17 6.65% ‐ ‐ 8,210,550 98.926 ‐ ‐ 8,210,550 8 VR0025 25‐Sep‐17 6.58% ‐ 4,065,402 1,145,148 98.943 ‐ 4,022,431 1,145,148 9 VR0026 25‐Jan‐18 6.81% ‐ 3,475,267 ‐ 98.935 ‐ 3,438,255 ‐ 10 VR0027 25‐Jul‐18 6.81% ‐ 3,475,267 ‐ 98.934 ‐ 3,438,221 ‐ 11 VR0028 25 Aug 18 6 65% 5 171 695 98 922 5 115 94411 VR0028 25‐Aug‐18 6.65% ‐ 5,171,695 ‐ 98.922 ‐ 5,115,944 ‐ 12 VR0029 25‐Aug‐19 6.65% ‐ 8,819,688 ‐ 98.920 ‐ 8,724,435 ‐ 13 VR0030 25‐Dec‐19 6.58% ‐ 8,016,765 ‐ 98.937 ‐ 7,931,547 ‐ 14 VR0031 25‐Jul‐20 6.81% ‐ 17,614,108 ‐ 98.929 ‐ 17,425,461 ‐
‐ 60,731,044 21,744,598 ‐ 60,019,483 21,744,598 Sub Total
52
‐ 60,731,044 21,747,836 ‐ 60,019,483 21,747,836 0.00% 73.63% 26.37% 0.00% 73.40% 26.60%
82,478,880 81,767,319 Total Fair ValueTotal Nominal Value
Grand Total
(Stated in Rp Millions)
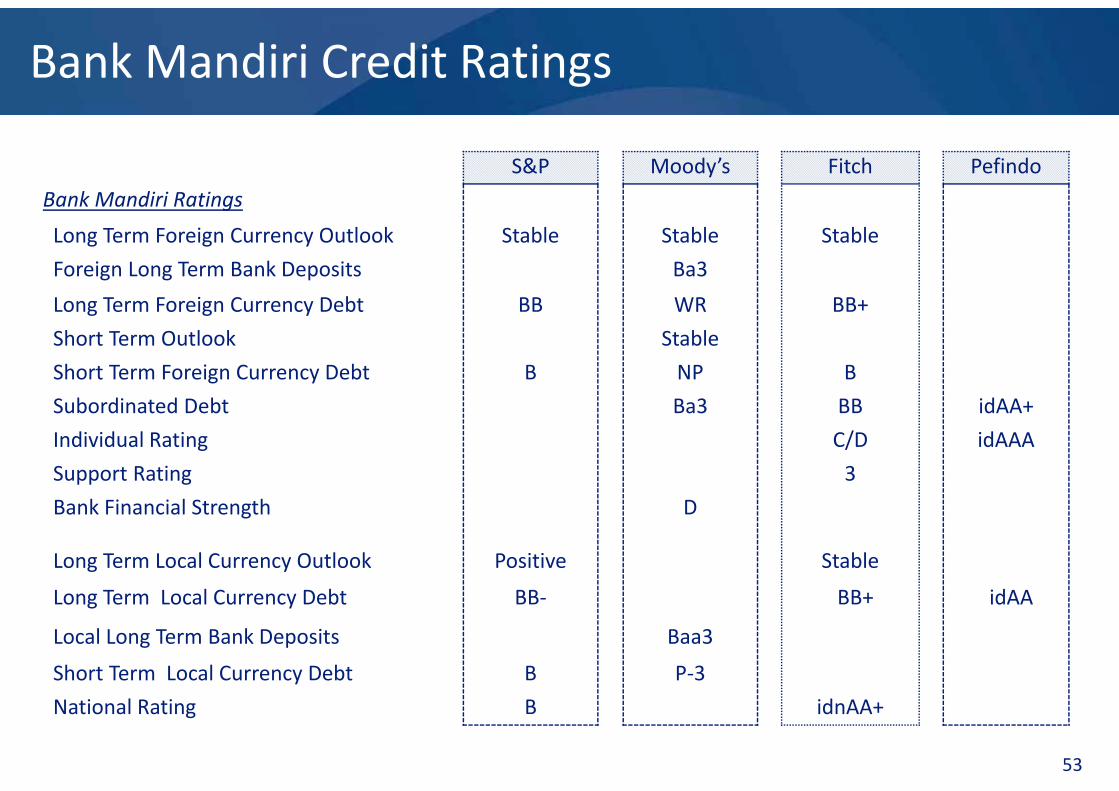
Bank Mandiri Credit Ratings
S&P Moody’s Fitch Pefindo
Bank Mandiri RatingsBank Mandiri Ratings
Long Term Foreign Currency Outlook Stable Stable Stable
Foreign Long Term Bank Deposits Ba3
L T F i C D bt BB WR BBLong Term Foreign Currency Debt BB WR BB+
Short Term Outlook Stable
Short Term Foreign Currency Debt B NP B
Subordinated Debt Ba3 BB idAA+
Individual Rating C/D idAAA
Support Rating 3
Bank Financial Strength D
Long Term Local Currency Outlook Positive Stable
l b dLong Term Local Currency Debt BB‐ BB+ idAA
Local Long Term Bank Deposits Baa3
Short Term Local Currency Debt B P‐3
53
National Rating B idnAA+
Corporate Actions
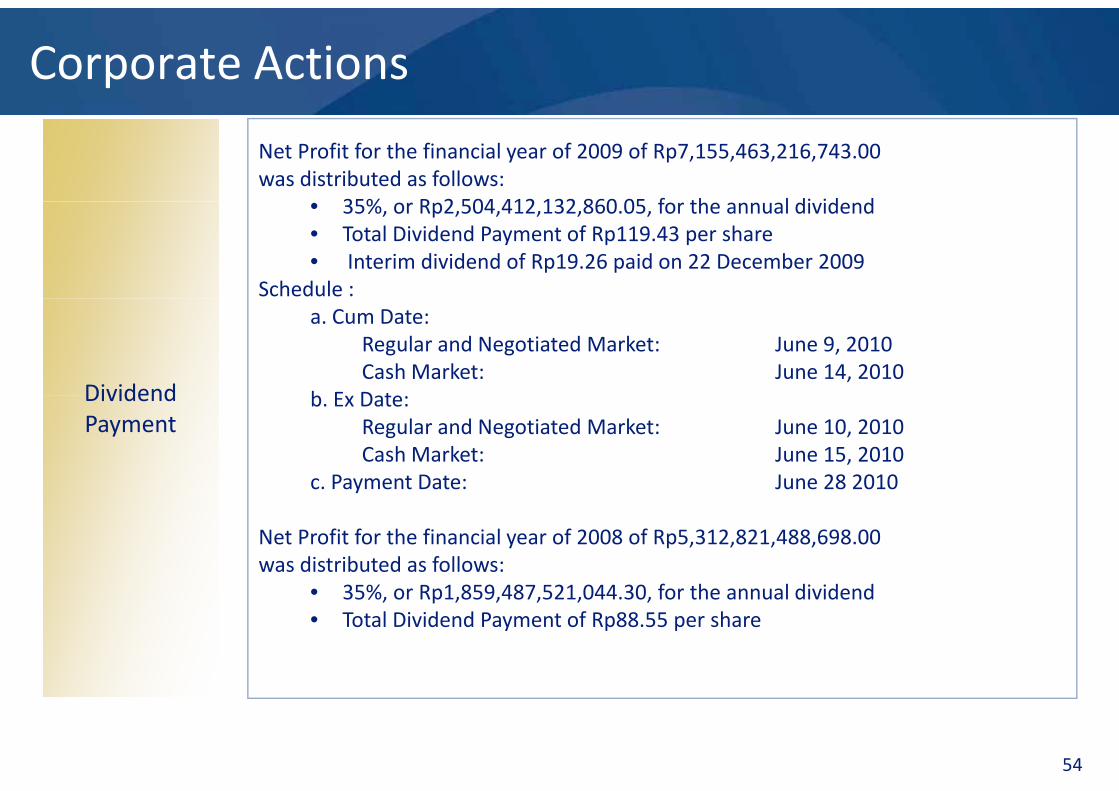
Net Profit for the financial year of 2009 of Rp7,155,463,216,743.00was distributed as follows:
35% R 2 504 412 132 860 05 f th l di id d• 35%, or Rp2,504,412,132,860.05, for the annual dividend• Total Dividend Payment of Rp119.43 per share • Interim dividend of Rp19.26 paid on 22 December 2009
Schedule :
DividendDividend
a. Cum Date: Regular and Negotiated Market: June 9, 2010Cash Market: June 14, 2010
b E D tDividendPaymentDividendPayment
b. Ex Date: Regular and Negotiated Market: June 10, 2010Cash Market: June 15, 2010
c. Payment Date: June 28 2010y
Net Profit for the financial year of 2008 of Rp5,312,821,488,698.00was distributed as follows:
• 35% or Rp1 859 487 521 044 30 for the annual dividend• 35%, or Rp1,859,487,521,044.30, for the annual dividend• Total Dividend Payment of Rp88.55 per share
54
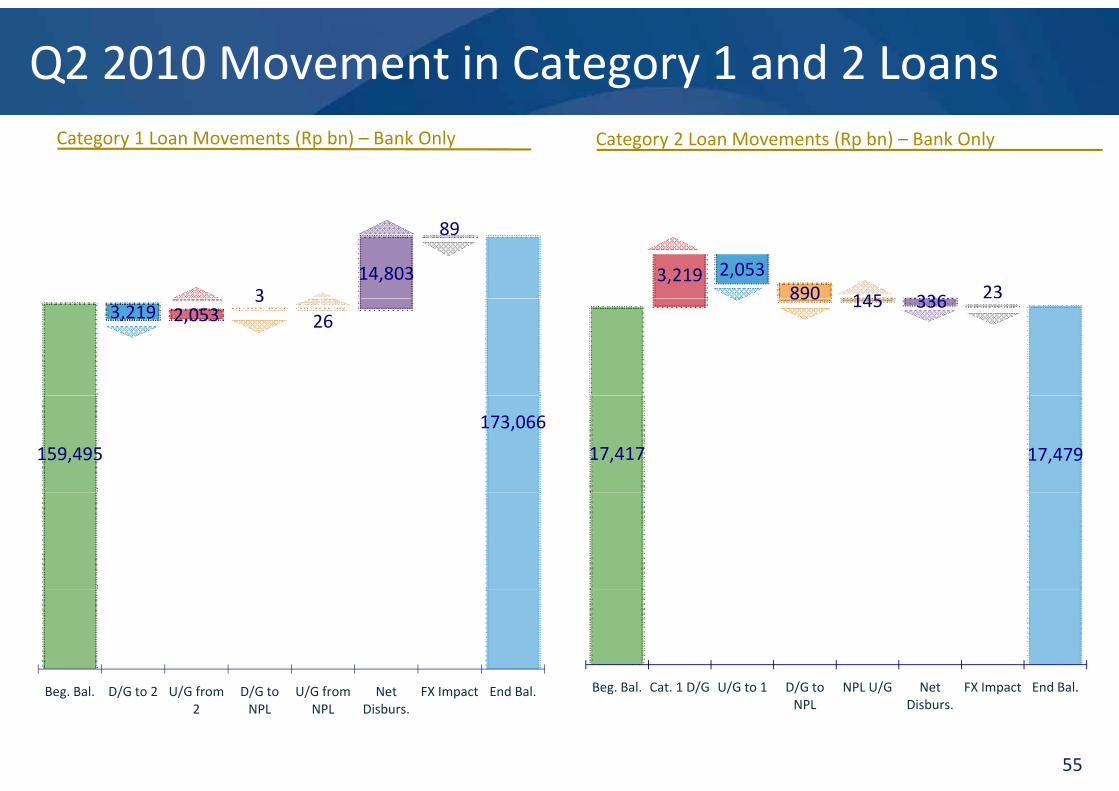
Q2 2010 Movement in Category 1 and 2 LoansCategory 1 Loan Movements (Rp bn) – Bank Only Category 2 Loan Movements (Rp bn) – Bank Only
314,803
89
3,219 2,053890 145 336 23
3,219 2,0533
26890 145 336
159,495
173,066
17,417 17,479
/ / / / Beg Bal Cat 1 D/G U/G to 1 D/G to NPL U/G Net FX Impact End Bal
55
Beg. Bal. D/G to 2 U/G from 2
D/G to NPL
U/G from NPL
Net Disburs.
FX Impact End Bal. Beg. Bal. Cat. 1 D/G U/G to 1 D/G to NPL
NPL U/G Net Disburs.
FX Impact End Bal.
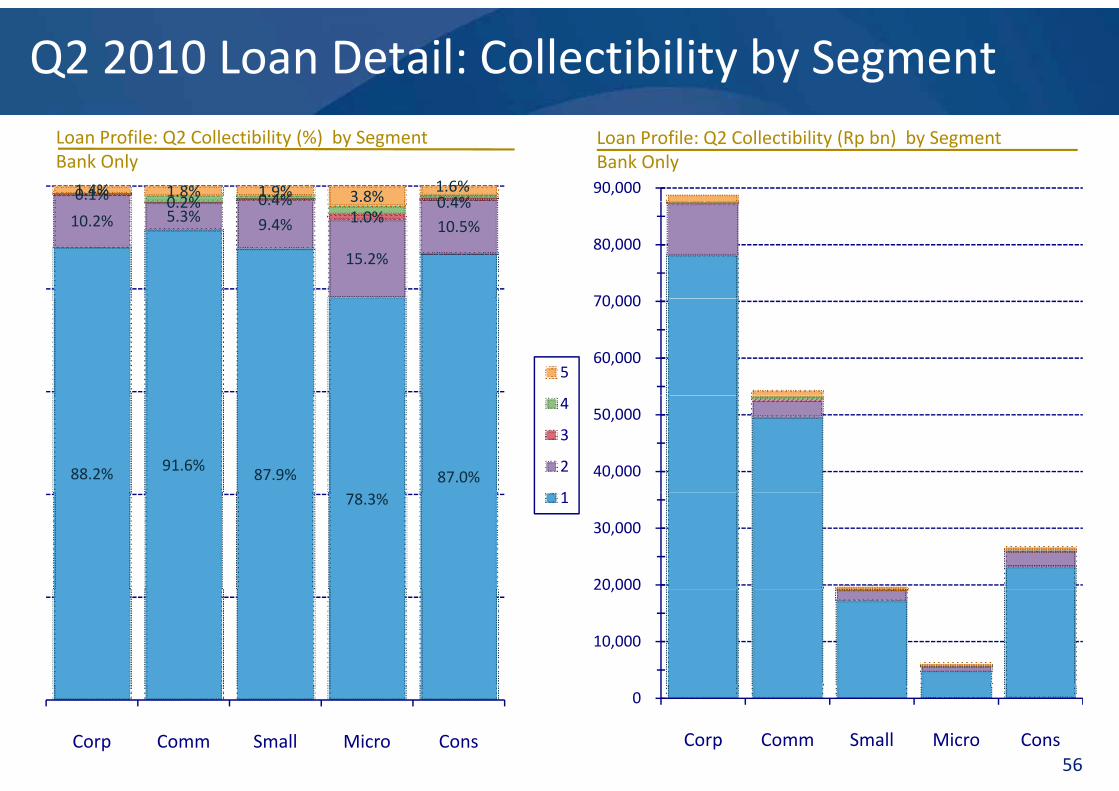
Q2 2010 Loan Detail: Collectibility by SegmentLoan Profile: Q2 Collectibility (%) by SegmentBank Only
0.1% 0 2% 0 4% 0 4%1.4% 1.8% 1.9% 3.8%
1.6% 90,000
Loan Profile: Q2 Collectibility (Rp bn) by SegmentBank Only
10.2% 5.3% 9.4%
15.2%
10.5%0.2% 0.4%
1.0%0.4%3.8%
70 000
80,000
560,000
70,000
88.2% 91.6% 87.9% 87.0%
4
3
2
1
40,000
50,000
78.3% 1
20,000
30,000
10,000
20,000
56Corp Comm Small Micro Cons
0
Corp Comm Small Micro Cons
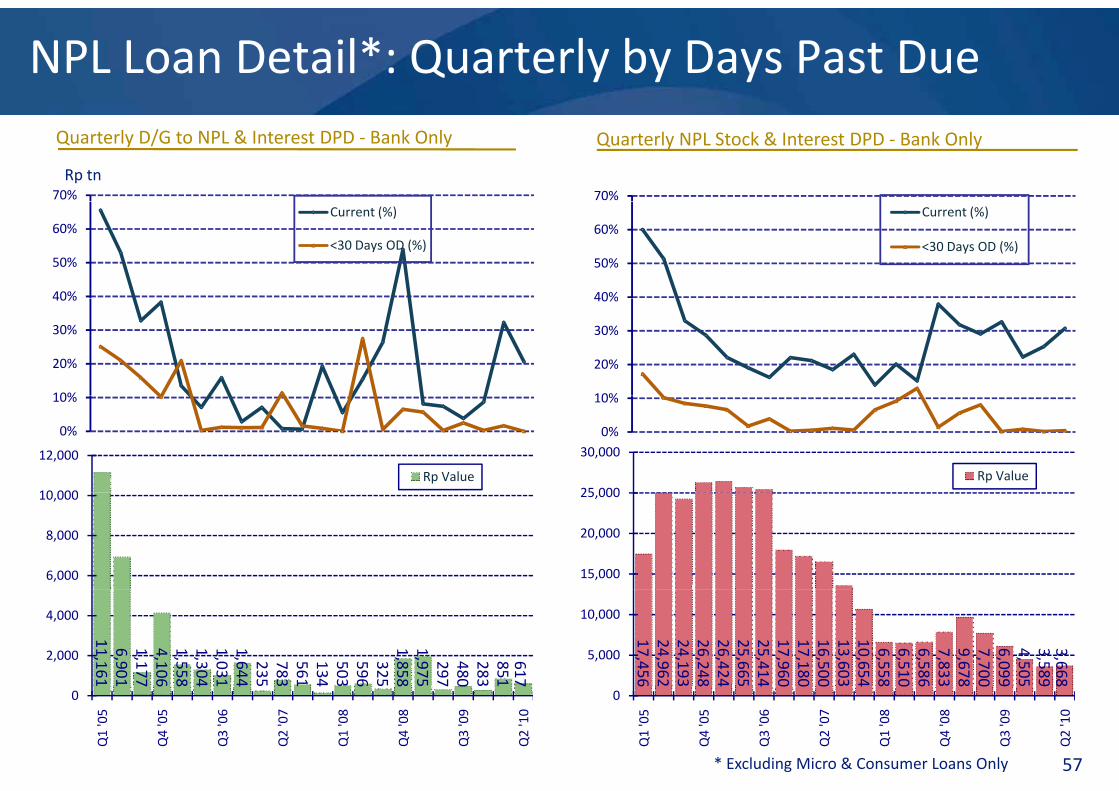
NPL Loan Detail*: Quarterly by Days Past Due
70%
Quarterly D/G to NPL & Interest DPD ‐ Bank Only Quarterly NPL Stock & Interest DPD ‐ Bank Only
Rp tn70%
40%
50%
60%Current (%)
<30 Days OD (%)
40%
50%
60%Current (%)
<30 Days OD (%)
10%
20%
30%
40%
10%
20%
30%
40%
0%
10%
10 000
12,000
Rp Value25 000
30,000
Rp Value
0%
10%
6,000
8,000
10,000
15,000
20,000
25,000
11,1616,9011,1774,1061,5581,3041,0311,64423578356 113450359 6325
1,85 81,97529748028385 1617
2,000
4,000
17,45624,96224,19326,24 826,42425,66525,41 417,96017,18016,50013,60310,65 46,5586,5106,5867,8339,67 87,7006,0994,5053,58 93,668
5,000
10,000
57
1 7 6 8 4 1 4 1 4 6 8 7 0 1 7
0
Q1 '05
Q4 '05
Q3 '06
Q2 '07
Q1 '08
Q4 '08
Q3 '09
Q2 '10
6 2 8 4 4 0 0 0 4 8 0 6 8 0 9 9 8
0
Q1 '05
Q4 '05
Q3 '06
Q2 '07
Q1 '08
Q4 '08
Q3 '09
Q2 '10
* Excluding Micro & Consumer Loans Only
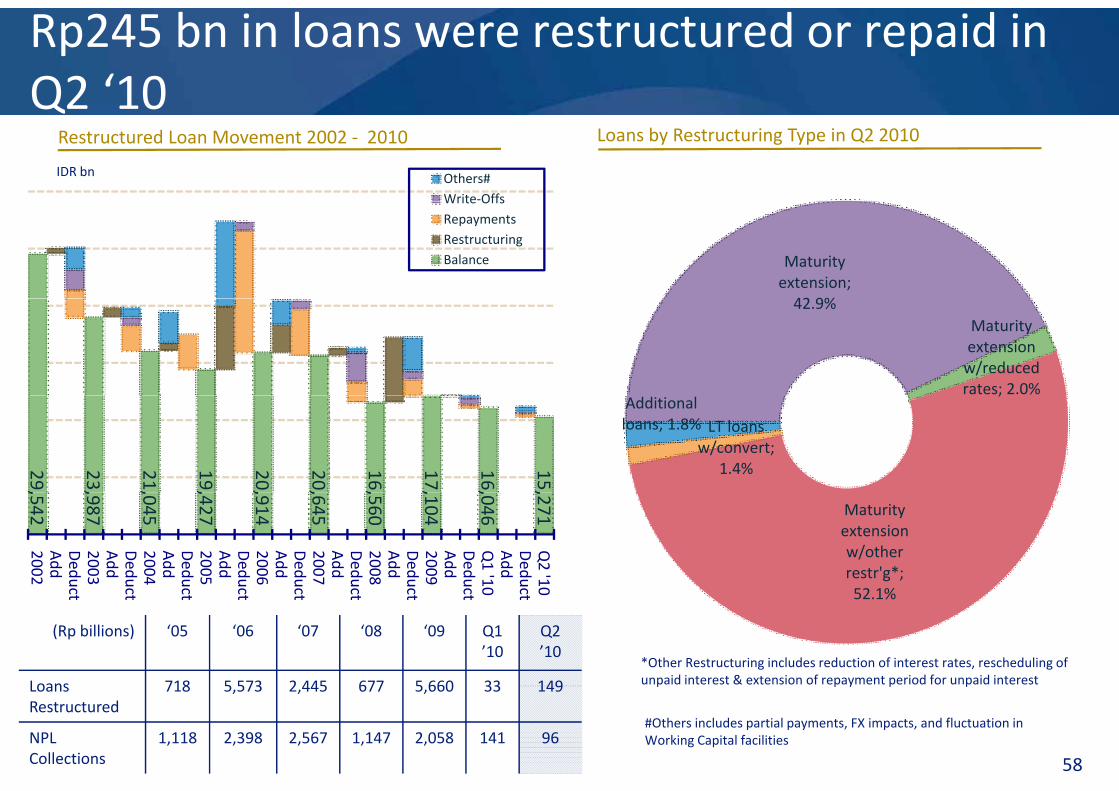
Rp245 bn in loans were restructured or repaid in Q2 ‘10
Others#Write‐Offs
Q2 10IDR bn
Loans by Restructuring Type in Q2 2010Restructured Loan Movement 2002 ‐ 2010
Write OffsRepaymentsRestructuringBalance Maturity
extension; 42 9%42.9%
Maturity extension w/reduced rates; 2.0%
29,
23,
21,
19,
20,
20,
16,
17,
16,
15,
;
LT loans w/convert;
1.4%
Additional loans; 1.8%
,542
,987
,045
,427
,914
,645
,560
,104
,046
,271
2002Add
Deduc
2003Add
Deduc
2004Add
Deduc
2005Add
Deduc
2006Add
Deduc
2007Add
Deduc
2008Add
Deduc
2009Add
Deduc
Q1 '10
Add
Deduc
Q2 '10
Maturity extension w/other restr'g*; 52 1%
ct ct ct ct ct ct ct ct 0 ct 052.1%
*Other Restructuring includes reduction of interest rates, rescheduling of unpaid interest & extension of repayment period for unpaid interest
(Rp billions) ‘05 ‘06 ‘07 ‘08 ‘09 Q1 ’10
Q2 ’10
Loans 718 5 573 2 445 677 5 660 33 149
58
#Others includes partial payments, FX impacts, and fluctuation in Working Capital facilities
p p y p pLoans Restructured
718 5,573 2,445 677 5,660 33 149
NPLCollections
1,118 2,398 2,567 1,147 2,058 141 96
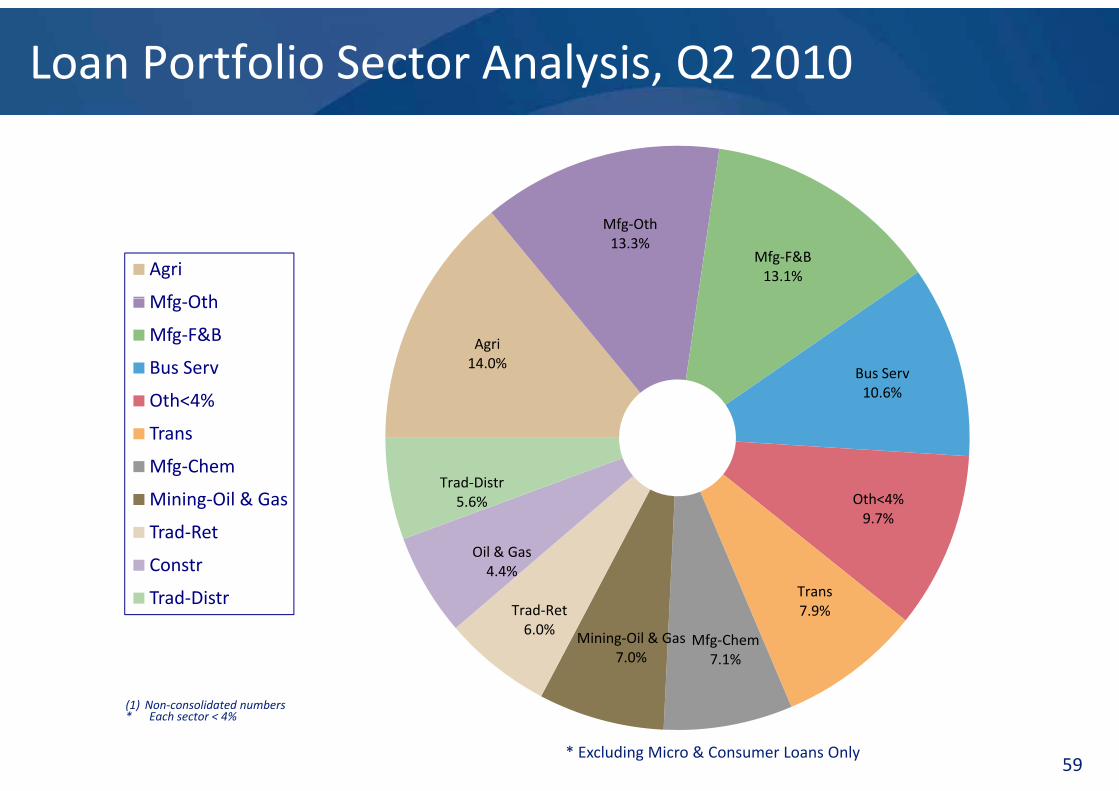
Loan Portfolio Sector Analysis, Q2 2010
Mfg‐Oth13.3%
Mfg‐F&B13.1%Agri
Mfg Oth
Agri14.0%
Bus Serv10 6%
Mfg‐Oth
Mfg‐F&B
Bus Serv
Oth 4% 10.6%
Trad‐Distr
Oth<4%
Trans
Mfg‐Chem
i i il & Oth<4%9.7%
Trans
Oil & Gas4.4%
5.6%Mining‐Oil & Gas
Trad‐Ret
ConstrTrans7.9%
Mfg‐Chem7.1%
Mining‐Oil & Gas7.0%
Trad‐Ret6.0%
Trad‐Distr
59
(1) Non‐consolidated numbers* Each sector < 4%
* Excluding Micro & Consumer Loans Only
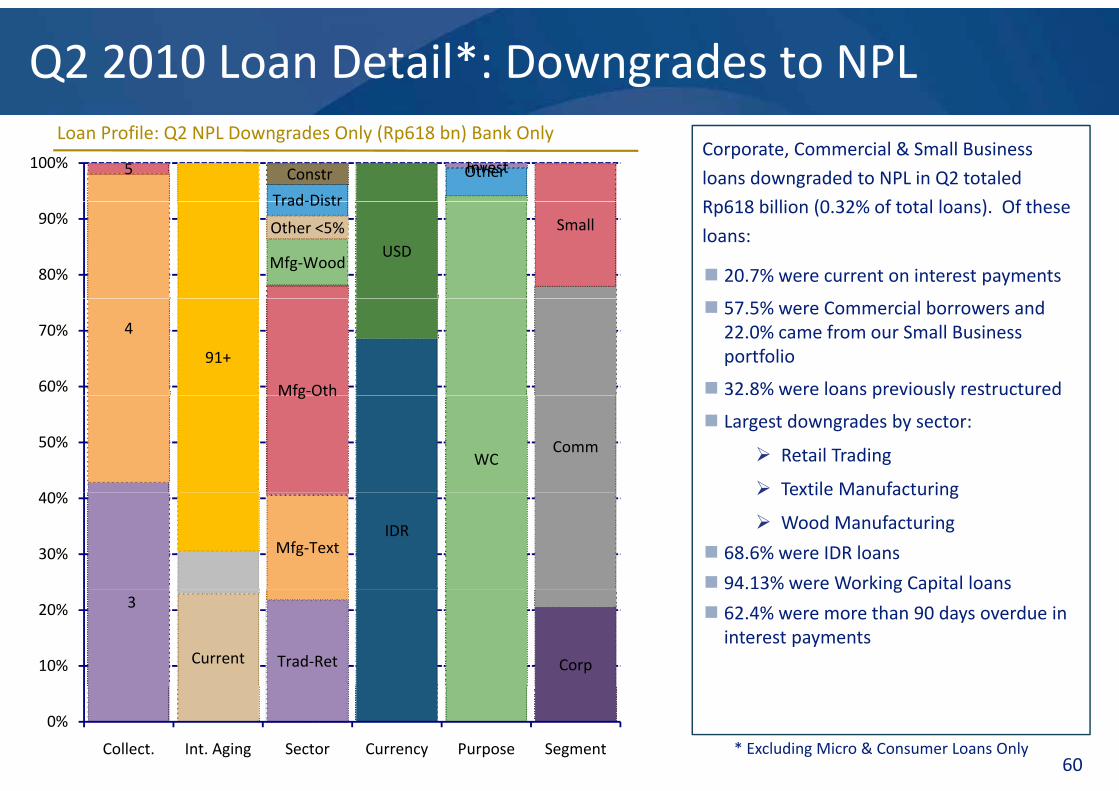
Q2 2010 Loan Detail*: Downgrades to NPL
5
Trad‐Distr
Constr InvestOther100%
Loan Profile: Q2 NPL Downgrades Only (Rp618 bn) Bank OnlyCorporate, Commercial & Small Business
loans downgraded to NPL in Q2 totaled
R 618 billi (0 32% f t t l l ) Of th
Mfg‐Wood
Other <5%
Trad‐Distr
USD
Small
80%
90%Rp618 billion (0.32% of total loans). Of these
loans:
20.7% were current on interest payments
4
91+
Mfg‐Oth60%
70% 57.5% were Commercial borrowers and 22.0% came from our Small Business portfolio
32.8% were loans previously restructuredMfg Oth
WCComm
40%
50%
p y
Largest downgrades by sector:
Retail Trading
Textile Manufacturing
Mfg‐TextIDR
30%
40% Textile Manufacturing
Wood Manufacturing
68.6% were IDR loans
94.13% were Working Capital loans3
Current Trad‐Ret Corp10%
20%
9 . 3% e e o g Cap ta oa s
62.4% were more than 90 days overdue in interest payments
60
0%
Collect. Int. Aging Sector Currency Purpose Segment * Excluding Micro & Consumer Loans Only
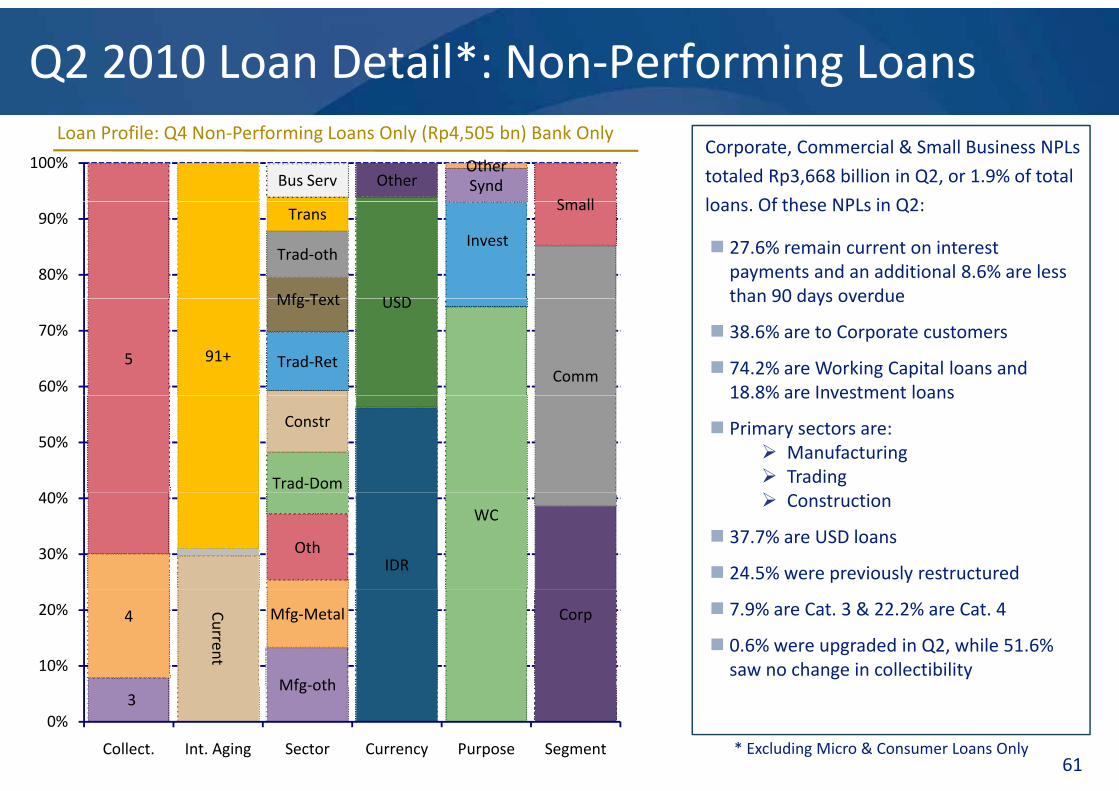
Q2 2010 Loan Detail*: Non‐Performing Loans
Bus Serv Other SyndOther
S ll
100%
Loan Profile: Q4 Non‐Performing Loans Only (Rp4,505 bn) Bank OnlyCorporate, Commercial & Small Business NPLs
totaled Rp3,668 billion in Q2, or 1.9% of total
loans Of these NPLs in Q2
Mfg Text
Trad‐oth
Trans
USD
Invest
Small
80%
90%
27.6% remain current on interest payments and an additional 8.6% are less than 90 days overdue
loans. Of these NPLs in Q2:
5 91+ Trad‐Ret
Mfg‐Text USD
Comm60%
70%
than 90 days overdue
38.6% are to Corporate customers
74.2% are Working Capital loans and 18 8% are Investment loans
Trad‐Dom
Constr
40%
50%
18.8% are Investment loans
Primary sectors are: Manufacturing Trading
OthIDR
WC
30%
40% Construction
37.7% are USD loans
24.5% were previously restructured
4 Current
Mfg‐oth
Mfg‐Metal Corp
10%
20% 7.9% are Cat. 3 & 22.2% are Cat. 4
0.6% were upgraded in Q2, while 51.6% saw no change in collectibility
61
3Mfg‐oth
0%
Collect. Int. Aging Sector Currency Purpose Segment * Excluding Micro & Consumer Loans Only
Q2 2010 Loan Detail*: Downgrades to Cat. 2
61+ Mfg‐F&B USD ConsumerProgram100%
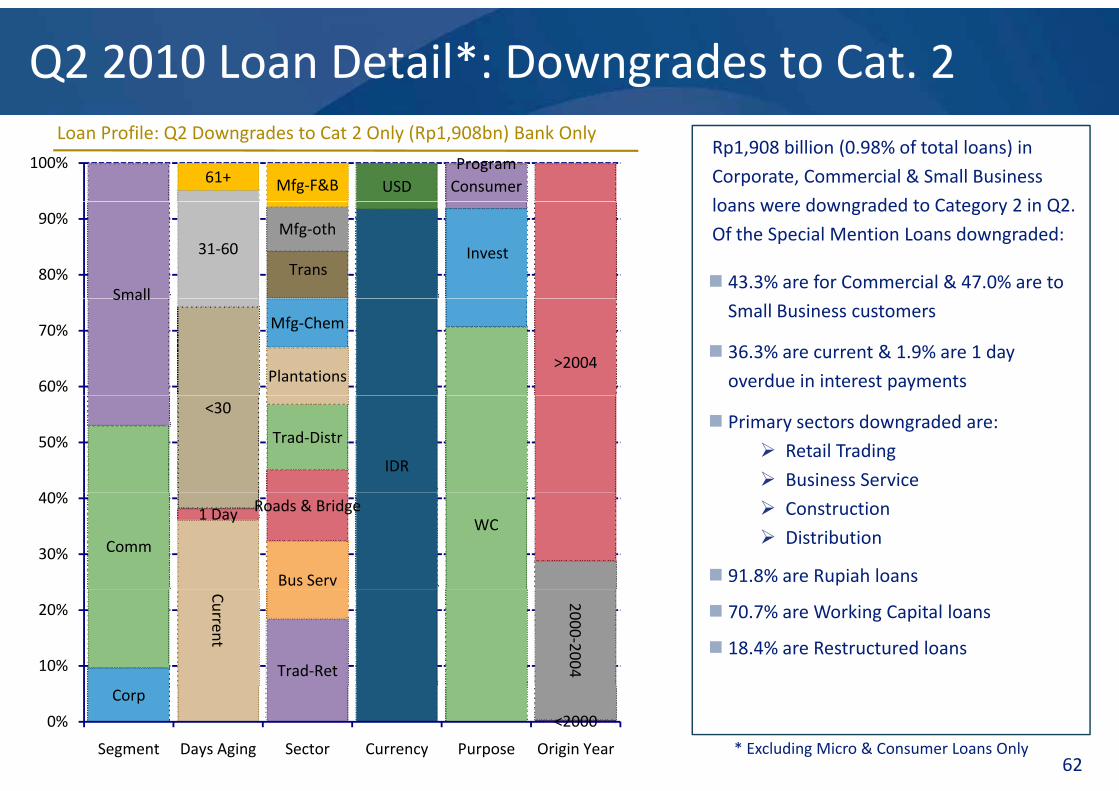
Loan Profile: Q2 Downgrades to Cat 2 Only (Rp1,908bn) Bank OnlyRp1,908 billion (0.98% of total loans) in
Corporate, Commercial & Small Business
l d d d t C t 2 i Q2
Small
31‐60Trans
Mfg‐othInvest
80%
90%loans were downgraded to Category 2 in Q2.
Of the Special Mention Loans downgraded:
43.3% are for Commercial & 47.0% are to Small
Plantations
Mfg‐Chem
>200460%
70%Small Business customers
36.3% are current & 1.9% are 1 day
overdue in interest payments<30
Trad‐Distr
IDR
40%
50% Primary sectors downgraded are:
Retail Trading
Business Service
Comm
1 Day
Bus Serv
Roads & BridgeWC
30%
40% Construction
Distribution
91.8% are Rupiah loans
Current
Trad‐Ret
2000‐200410%
20% 70.7% are Working Capital loans
18.4% are Restructured loans
62
Corp
<20000%
Segment Days Aging Sector Currency Purpose Origin Year * Excluding Micro & Consumer Loans Only
Q2 2010 Loan Detail*: Category 2 Loans
Small 61+ Oth<5% Synd
ConsumerProgram100%
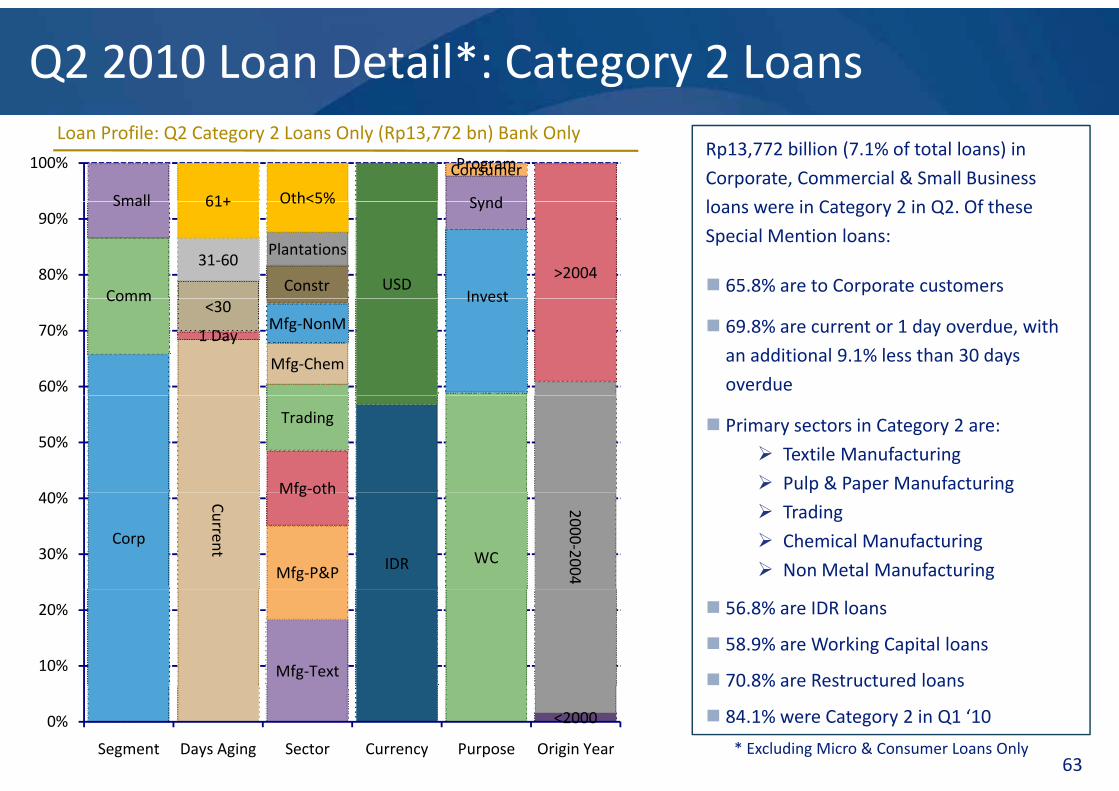
Loan Profile: Q2 Category 2 Loans Only (Rp13,772 bn) Bank OnlyRp13,772 billion (7.1% of total loans) in
Corporate, Commercial & Small Business
l i C t 2 i Q2 Of th
Comm
Small
31‐60
61+
Constr
Plantations
Oth<5%
USDInvest
Synd
>200480%
90%loans were in Category 2 in Q2. Of these
Special Mention loans:
65.8% are to Corporate customersComm
1 Day
<30
Mfg‐Chem
Mfg‐NonM
Invest
60%
70% 69.8% are current or 1 day overdue, with
an additional 9.1% less than 30 days
overdue
Mfg‐oth
Trading
40%
50% Primary sectors in Category 2 are:
Textile Manufacturing
Pulp & Paper Manufacturing
Corp
Current
Mfg‐P&P
Mfg oth
IDR WC2000‐2004
30%
40%p p g
Trading
Chemical Manufacturing
Non Metal Manufacturing
Mfg‐Text10%
20% 56.8% are IDR loans
58.9% are Working Capital loans
70.8% are Restructured loans
63
<20000%
Segment Days Aging Sector Currency Purpose Origin Year * Excluding Micro & Consumer Loans Only
70.8% are Restructured loans
84.1% were Category 2 in Q1 ‘10
Q2 2010 Loan Detail*: Upgrades to PL
Soc ServMfg‐oth
USD
100%
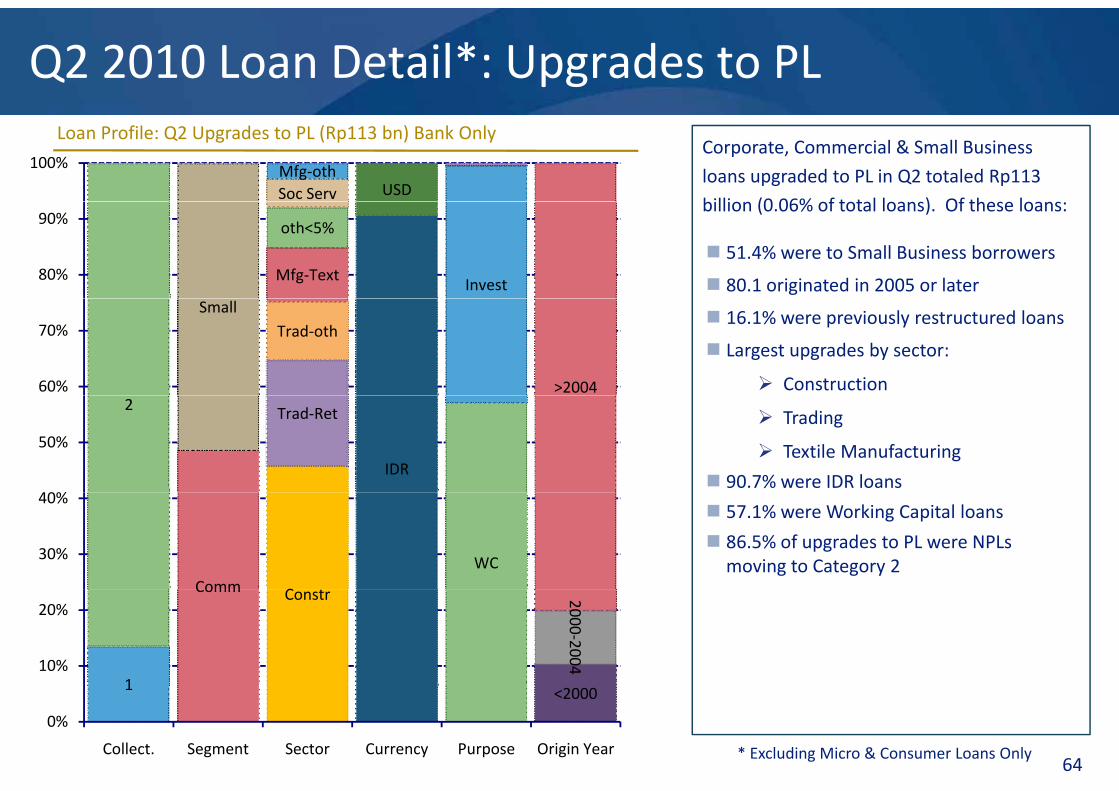
Loan Profile: Q2 Upgrades to PL (Rp113 bn) Bank OnlyCorporate, Commercial & Small Business
loans upgraded to PL in Q2 totaled Rp113
billi (0 06% f t t l l ) Of th l
Mfg‐Text
oth<5%
Invest80%
90%billion (0.06% of total loans). Of these loans:
51.4% were to Small Business borrowers
80.1 originated in 2005 or laterSmall
Trad‐oth
>200460%
70% 16.1% were previously restructured loans
Largest upgrades by sector:
Construction2 Trad‐Ret
IDR
40%
50% Trading
Textile Manufacturing
90.7% were IDR loans
Comm C
WC30%
40% 57.1% were Working Capital loans
86.5% of upgrades to PL were NPLs moving to Category 2
1
Comm Constr 2000‐200410%
20%
64
1 <2000
0%
Collect. Segment Sector Currency Purpose Origin Year * Excluding Micro & Consumer Loans Only
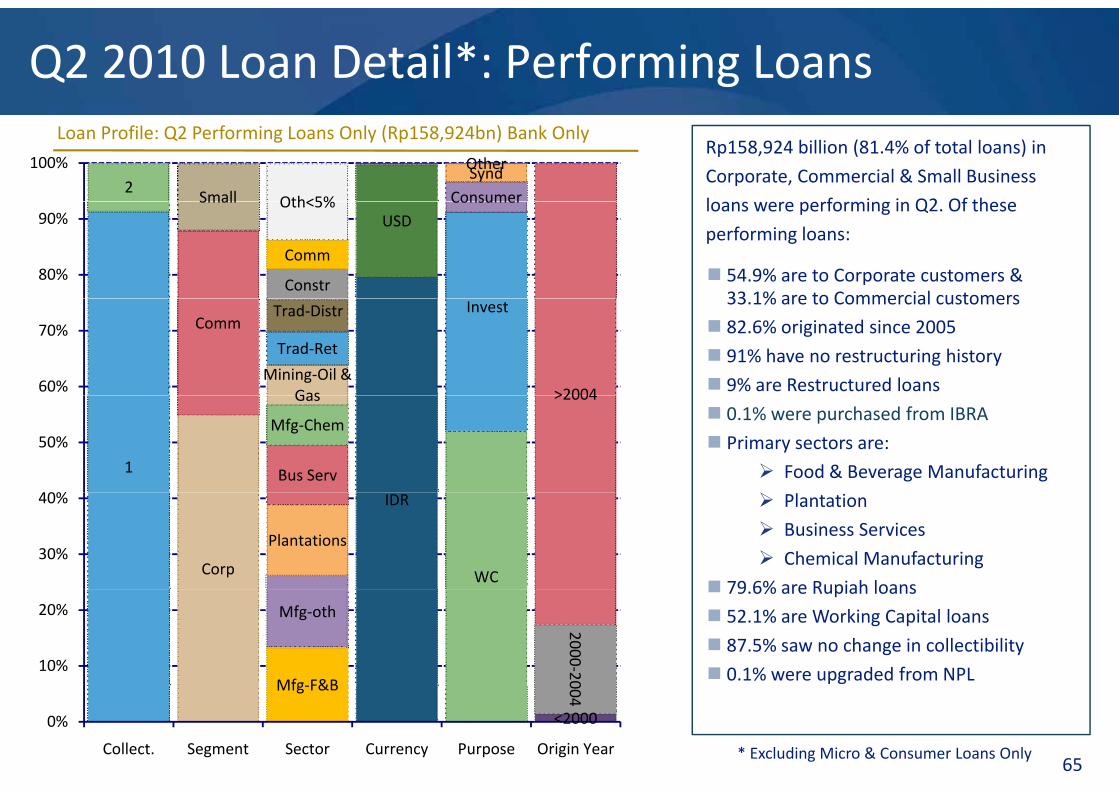
Q2 2010 Loan Detail*: Performing Loans
2Small Oth<5% Consumer
SyndOther100%
Loan Profile: Q2 Performing Loans Only (Rp158,924bn) Bank OnlyRp158,924 billion (81.4% of total loans) in
Corporate, Commercial & Small Business
l f i i Q2 Of thSmall
Constr
Comm
Oth<5%USD
Consumer
80%
90%loans were performing in Q2. Of these
performing loans:
54.9% are to Corporate customers & 33 1% are to Commercial customers
Comm
Mining‐Oil & Gas
Trad‐Ret
Trad‐Distr Invest
>200460%
70%
33.1% are to Commercial customers
82.6% originated since 2005
91% have no restructuring history
9% are Restructured loans
1 Bus Serv
Mfg‐Chem
Gas >2004
40%
50%
0.1% were purchased from IBRA
Primary sectors are:
Food & Beverage Manufacturing
Corp
Plantations
IDR
WC30%
40% Plantation
Business Services
Chemical Manufacturing
79 6% are Rupiah loans
Mfg‐F&B
Mfg‐oth
2000‐2010%
20% 79.6% are Rupiah loans
52.1% are Working Capital loans
87.5% saw no change in collectibility
0.1% were upgraded from NPL
65
Mfg‐F&B
<2000
004
0%
Collect. Segment Sector Currency Purpose Origin Year * Excluding Micro & Consumer Loans Only
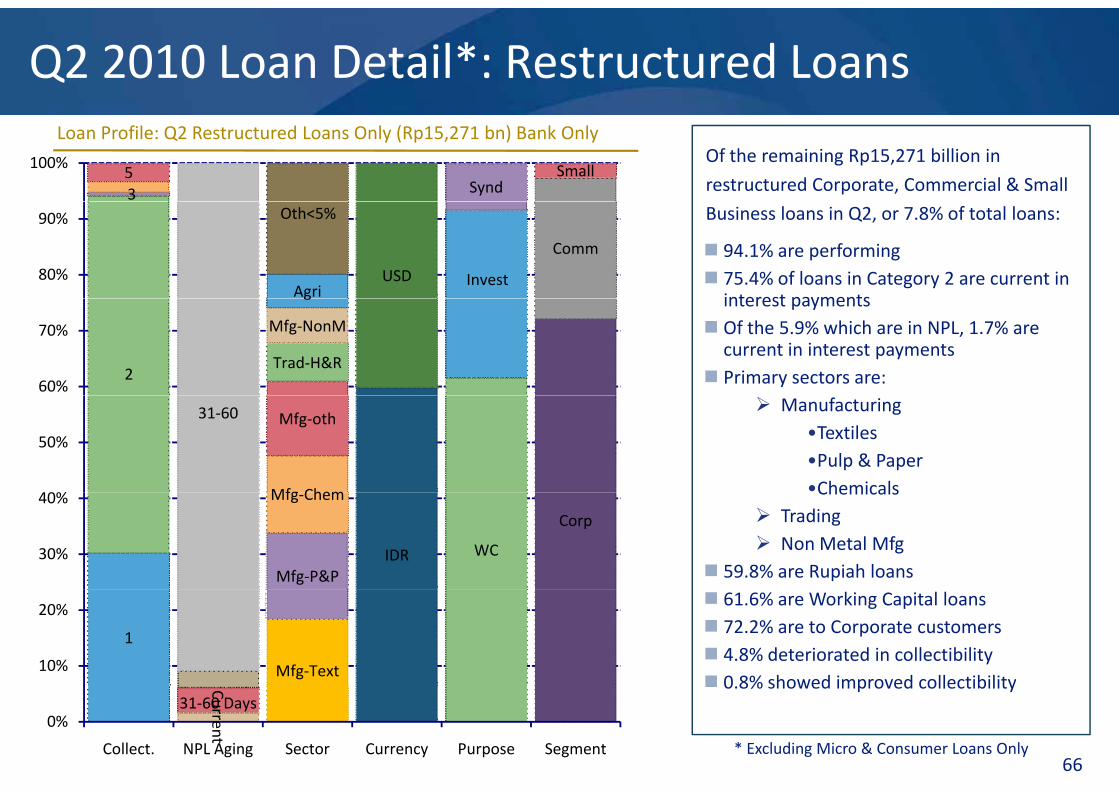
Q2 2010 Loan Detail*: Restructured Loans
35
SyndSmall100%
Loan Profile: Q2 Restructured Loans Only (Rp15,271 bn) Bank OnlyOf the remaining Rp15,271 billion in
restructured Corporate, Commercial & Small
Agri
Oth<5%
USD Invest
Comm
80%
90% Business loans in Q2, or 7.8% of total loans:
94.1% are performing 75.4% of loans in Category 2 are current in interest payments
2Trad‐H&R
Mfg‐NonM
g
60%
70%
interest payments Of the 5.9% which are in NPL, 1.7% are current in interest payments
Primary sectors are:
31‐60
Mfg Chem
Mfg‐oth
40%
50%
Manufacturing•Textiles•Pulp & Paper•Chemicals
Mfg‐P&P
Mfg‐Chem
IDR WC
Corp
30%
40% Chemicals Trading Non Metal Mfg
59.8% are Rupiah loans
1
Mfg‐Text10%
20% 61.6% are Working Capital loans 72.2% are to Corporate customers 4.8% deteriorated in collectibility 0 8% showed improved collectibility
66
Current
31‐60 Days0%
Collect. NPL Aging Sector Currency Purpose Segment * Excluding Micro & Consumer Loans Only
0.8% showed improved collectibility

Q2 2010 Loan Detail: Corporate Loans
2
5
61+ Oth<5%Synd
Consumer100%
Loan Profile: Q2 Corporate Loans Only (Rp88,672 bn) Bank OnlyRp88,672 billion in loans were in the
Corporate portfolio in Q2, or 45.4% of total 2
1 Day<3031‐60
61+
Mfg‐Chem
Trading
Oth<5%
USD80%
90%
98.4% are performing loans, with 10.2% in Category 2
loans. Of the Corporate Loans in Q2:
Comm
Bus ServInvest
>200460%
70% 79.1% of Category 2 loans are current in interest payments
66.6% of NPLs are current in interest payments
1 Cu
Mining‐Oil &
Mfg‐oth
2004
40%
50%
payments
Primary sectors in Corporate are: Food & Beverage Mfg Plantationrrent
Plantations
Mining‐Oil & Gas
IDR
WC
30%
40% Oil‐Gas Transportation
68.4% are Rupiah loans
Mfg‐F&B
WC
2000‐200
10%
20% 49.1% are Working Capital loans
12.4% are Restructured loans
0.0% were purchased from IBRA
67
<2000
04
0%
Collect. Cat. 2 Aging Sector Currency Purpose Origin Year
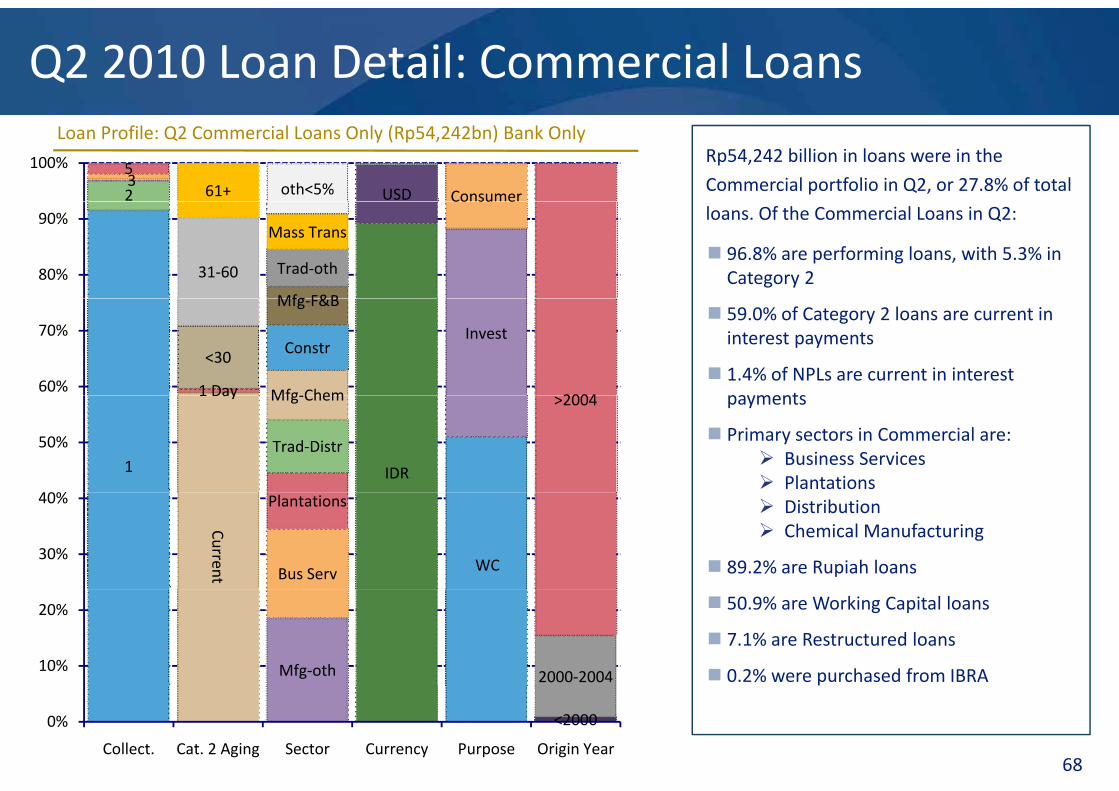
Q2 2010 Loan Detail: Commercial Loans
235
61+ oth<5% USD Consumer
100%
Loan Profile: Q2 Commercial Loans Only (Rp54,242bn) Bank OnlyRp54,242 billion in loans were in the
Commercial portfolio in Q2, or 27.8% of total
31‐60
Mfg F&B
Trad‐oth
Mass Trans
Co su e
80%
90%
96.8% are performing loans, with 5.3% in Category 2
loans. Of the Commercial Loans in Q2:
1 Day
<30
Mfg Chem
Constr
Mfg‐F&B
Invest
200460%
70% 59.0% of Category 2 loans are current in interest payments
1.4% of NPLs are current in interest payments
1
1 Day
Trad‐Distr
Mfg‐Chem
IDR
>2004
40%
50%
payments
Primary sectors in Commercial are: Business Services Plantations
Current Bus Serv
Plantations
WC30%
40% Distribution Chemical Manufacturing
89.2% are Rupiah loans
Mfg‐oth 2000‐200410%
20% 50.9% are Working Capital loans
7.1% are Restructured loans
0.2% were purchased from IBRA
68
<20000%
Collect. Cat. 2 Aging Sector Currency Purpose Origin Year
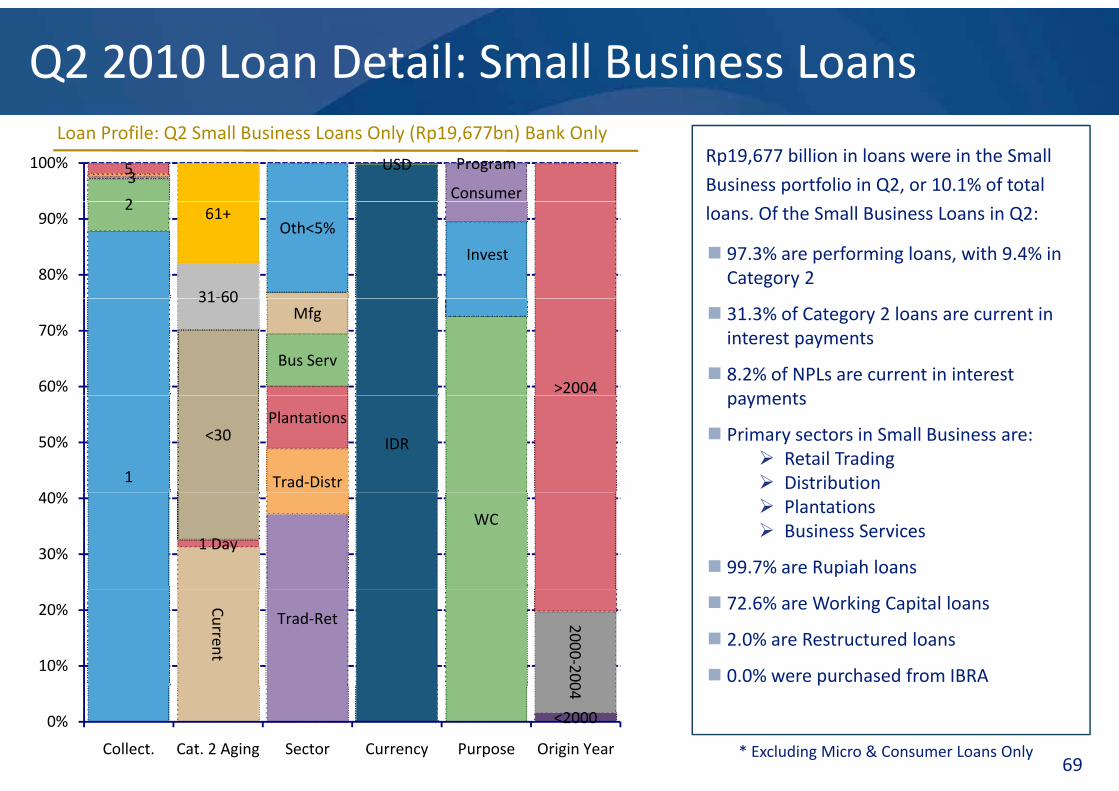
Q2 2010 Loan Detail: Small Business Loans
2
35USD
Consumer
Program100%
Loan Profile: Q2 Small Business Loans Only (Rp19,677bn) Bank OnlyRp19,677 billion in loans were in the Small
Business portfolio in Q2, or 10.1% of total 2
31‐60
61+Oth<5%
Invest80%
90%
97.3% are performing loans, with 9.4% in Category 2
loans. Of the Small Business Loans in Q2:
31 60
Bus Serv
Mfg
>200460%
70% 31.3% of Category 2 loans are current in interest payments
8.2% of NPLs are current in interest payments
1
<30
Trad‐Distr
Plantations
IDR
40%
50%
payments
Primary sectors in Small Business are: Retail Trading Distribution
1 DayWC
30%
40% Plantations Business Services
99.7% are Rupiah loans
Current
Trad‐Ret 2000‐200
10%
20% 72.6% are Working Capital loans
2.0% are Restructured loans
0.0% were purchased from IBRA
69
<2000
04
0%
Collect. Cat. 2 Aging Sector Currency Purpose Origin Year * Excluding Micro & Consumer Loans Only
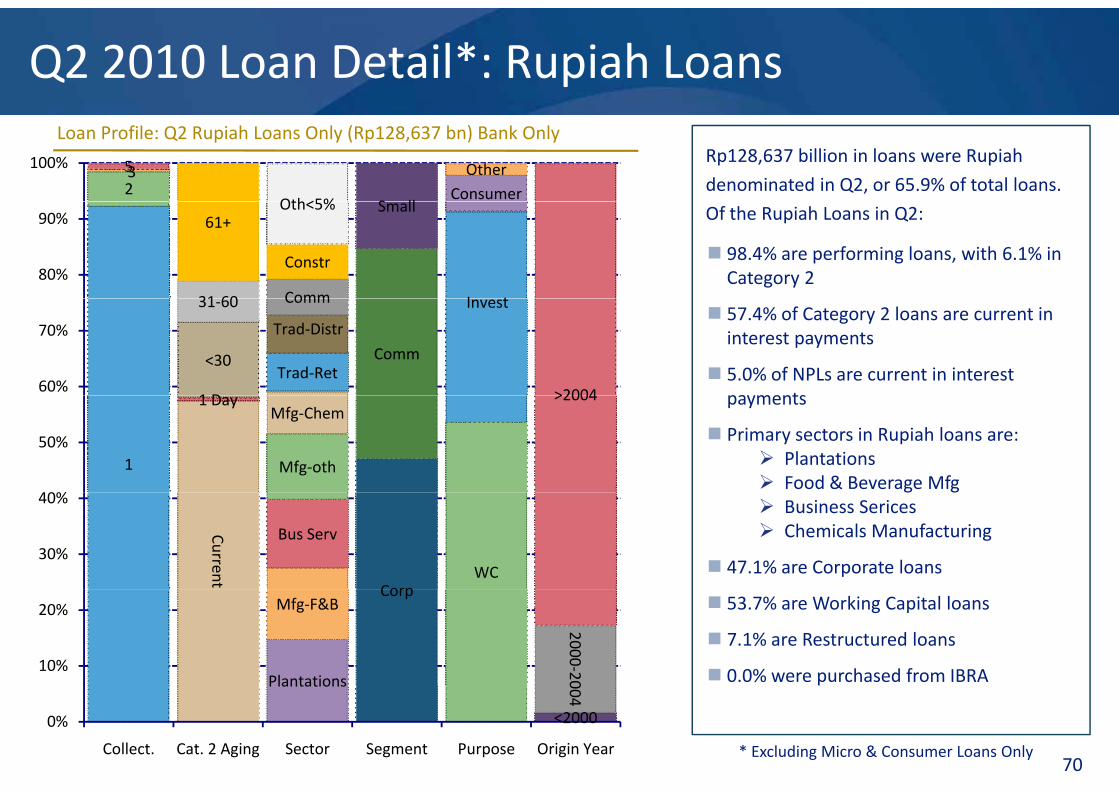
Q2 2010 Loan Detail*: Rupiah Loans
235
Oth<5% S llConsumerOther100%
Loan Profile: Q2 Rupiah Loans Only (Rp128,637 bn) Bank OnlyRp128,637 billion in loans were Rupiah
denominated in Q2, or 65.9% of total loans.
31 60
61+
Comm
Constr
Oth<5% Small
I t
80%
90%
98.4% are performing loans, with 6.1% in Category 2
Of the Rupiah Loans in Q2:
1 D
<30
31‐60
Trad‐Ret
Trad‐Distr
Comm
Comm
Invest
>200460%
70% 57.4% of Category 2 loans are current in interest payments
5.0% of NPLs are current in interest payments
1
1 Day
Mfg‐oth
Mfg‐Chem>2004
40%
50%
payments
Primary sectors in Rupiah loans are: Plantations Food & Beverage Mfg
Current
Bus Serv
CorpWC
30%
40%g g
Business Serices Chemicals Manufacturing
47.1% are Corporate loans
Plantations
Mfg‐F&BCorp
2000‐2010%
20% 53.7% are Working Capital loans
7.1% are Restructured loans
0.0% were purchased from IBRA
70
Plantations
<2000
004
0%
Collect. Cat. 2 Aging Sector Segment Purpose Origin Year * Excluding Micro & Consumer Loans Only

Q2 2010 Loan Detail*: FX Loans
35 61+ Small
SyndOther100%
Loan Profile: Q2FX Loans Only (Rp33,955bn) Bank OnlyRp33,955 billion in loans were FX
denominated in Q2, or 17.4% of total loans.
21 Day<30
31‐60oth<5%
Comm
80%
90%
95.3% are performing loans, with 17.5% in Category 2
Of the FX Loans in Q2:
P&P
Chem
Mfg‐oth Invest
>200460%
70% 83.2% of Category 2 loans are current in interest payments
56.7% of NPLs are current in interest payments
Curr
Trading
Text
Corp40%
50%
payments
Primary sectors in FX loans are: Oil & Gas Food & Beverage Mfg
1
rent
F&B
Corp
WC
30%
40%g g
Trading Textile Manufacturing Pulp & Paper Mfg
82 6% are Corporate loans
Oil & Gas
WC
2000‐200
10%
20% 82.6% are Corporate loans
48.5% are Working Capital loans
18.1% are Restructured loans
71
<2000
04
0%
Collect. Cat. 2 Aging Sector Segment Purpose Origin Year
0.3% were purchased from IBRA
* Excluding Micro & Consumer Loans Only
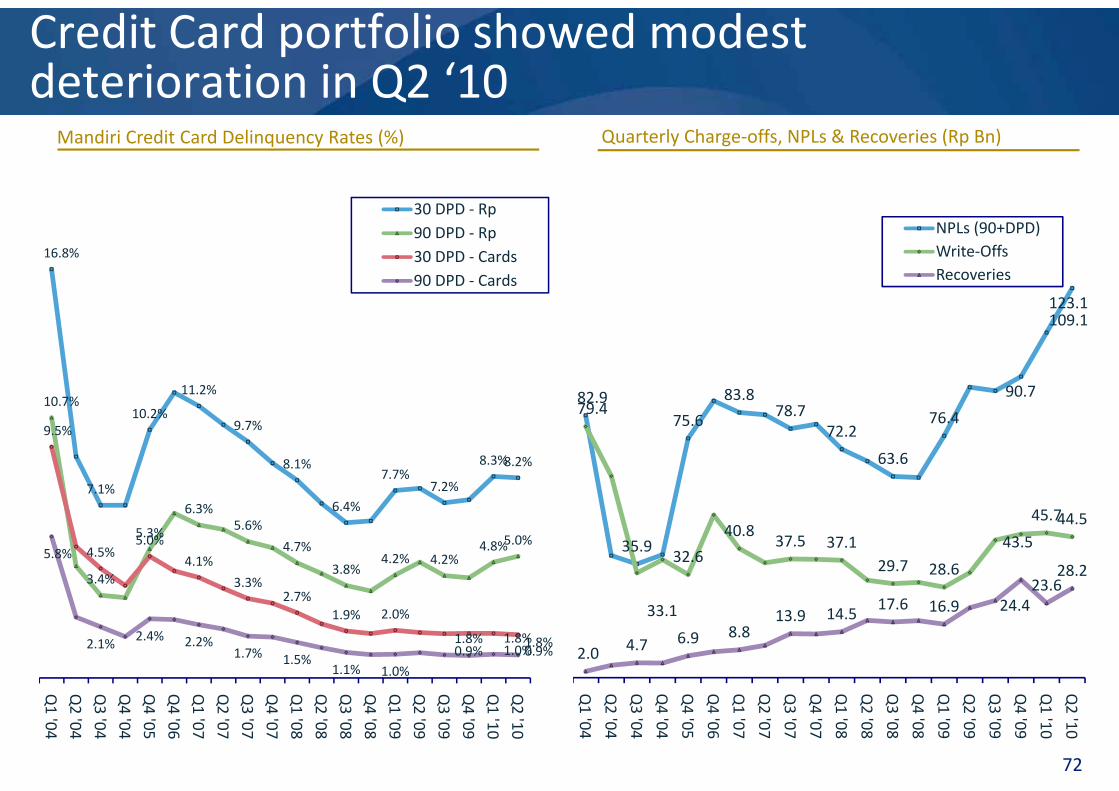
Credit Card portfolio showed modest deterioration in Q2 ‘10
Mandiri Credit Card Delinquency Rates (%) Quarterly Charge‐offs, NPLs & Recoveries (Rp Bn)
123 1
NPLs (90+DPD)Write‐OffsRecoveries
16.8%
30 DPD ‐ Rp90 DPD ‐ Rp30 DPD ‐ Cards90 DPD ‐ Cards
82 9 83 8 90.7
109.1123.1
11.2% 82.975.6
83.878.7
72.2
63.6
76.4
90.779.4
7.1%
10.2%9.7%
8.1%7.7%
7.2%
8.3%8.2%
10.7%
9.5%
35.932.6
40.837.5 37.1
29.7 28.6
43.5
45.744.5
23.628.2
7.1%6.4%
3.4%
5.3%
6.3%5.6%
4.7%
3.8%4.2% 4.2%
4.8%5.0%4.5%5.0%
4.1%
3.3%
5.8%
33.1
2.0 4.7 6.9 8.813.9 14.5 17.6 16.9 24.4
23.62.7%
1.9% 2.0%
1.8% 1.8%1.8%2.1% 2.4% 2.2%1.7% 1.5%
1.1% 1.0%0.9% 1.0%0.9%
72
Q1 '04
Q2 '04
Q3 '04
Q4 '04
Q4 '05
Q4 '06
Q1 '07
Q2 '07
Q3 '07
Q4 '07
Q1 '08
Q2 '08
Q3 '08
Q4 '08
Q1 '09
Q2 '09
Q3 '09
Q4 '09
Q1 '10
Q2 '10
Q1 '04
Q2 '04
Q3 '04
Q4 '04
Q4 '05
Q4 '06
Q1 '07
Q2 '07
Q3 '07
Q4 '07
Q1 '08
Q2 '08
Q3 '08
Q4 '08
Q1 '09
Q2 '09
Q3 '09
Q4 '09
Q1 '10
Q2 '10

Regs. on Asset Classification: PBI No 7/2/PBI/2005
Classificationby Aging ofClassificationby Aging of
Classification by Payment History Previously Current No change to BI Prov. Req.
Category 1 ‐ Current Current Current 1%
Category 2 – Special Mention 1 – 90 days 1 – 90 days 5%by Aging of
Interest Payments#by Aging of
Interest Payments#
Business Outlook Fi i l C diti Payment Ability
Category 3 – Sub‐Standard 91 – 180 days 91 – 120 days 15%
Category 4 ‐ Doubtful 181 – 270 days 121 – 180 days 50%
Category 5 ‐ Loss 271+ days 181+ days 100%
DetailedClassification Guidance#
DetailedClassification Guidance#
Business Outlook Business growth potential Market condition & debtor
position in the market Management quality
Financial Condition Profitability Capital structure Cash flow Sensitivity to market risk
Payment Ability On time payment Availability of debtor’s financial information Completeness of credit documentation Compliance toward credit agreement
BI CollectibilityBI Collectibility
Guidance#Guidance# Group support Environmental factors
Nature of payment source Appropriateness of funds usage
In instances where there is disagreement in the determination of earning asset collectibility between the bank, its BI Collectibilitytakes precedence# BI Collectibility
takes precedence#
One Debtor OneOne Debtor One
g g y ,external auditors and BI, the bank must adopt BI’s determination
The Bank must classify all of its earning assets to a single debtor at the level of the lowest quality asset For debtors with exposures to more than one bank all banks must adopt the lowest classification applied by anyOne Debtor, One
Project Concept*One Debtor, One Project Concept*
For debtors with exposures to more than one bank, all banks must adopt the lowest classification applied by any one bank to the debtor.
All earning assets related to a particular project must be classified at the same level
Banks must require debtors to submit current financial statements
73
Completeness of Financial Report*Completeness of Financial Report*
Banks must require debtors to submit current financial statements Failure to submit financial statements must result in an automatic downgrade of collectibility by one level, or to a
maximum classification of sub‐standard
# Implemented in Q1 2005 * Implemented in Q2 2005
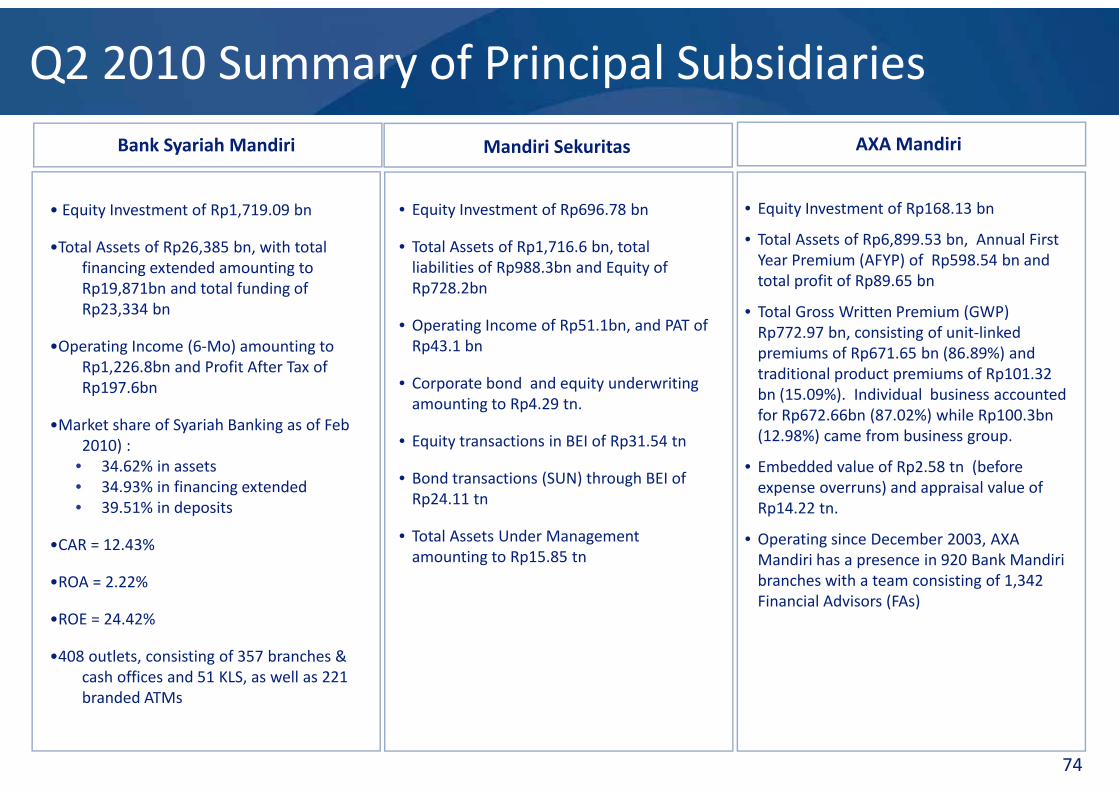
Q2 2010 Summary of Principal SubsidiariesBank Syariah Mandiri Mandiri Sekuritas AXA Mandiri
• Equity Investment of Rp696.78 bn
• Total Assets of Rp1,716.6 bn, total liabilities of Rp988.3bn and Equity of Rp728.2bn
• Equity Investment of Rp168.13 bn
• Total Assets of Rp6,899.53 bn, Annual First Year Premium (AFYP) of Rp598.54 bn and total profit of Rp89.65 bn
• Equity Investment of Rp1,719.09 bn
•Total Assets of Rp26,385 bn, with total financing extended amounting to Rp19,871bn and total funding of
• Operating Income of Rp51.1bn, and PAT of Rp43.1 bn
• Corporate bond and equity underwriting
• Total Gross Written Premium (GWP) Rp772.97 bn, consisting of unit‐linked premiums of Rp671.65 bn (86.89%) and traditional product premiums of Rp101.32 bn (15 09%) Individual business accounted
Rp23,334 bn
•Operating Income (6‐Mo) amounting to Rp1,226.8bn and Profit After Tax of Rp197.6bn
amounting to Rp4.29 tn.
• Equity transactions in BEI of Rp31.54 tn
• Bond transactions (SUN) through BEI of
bn (15.09%). Individual business accounted for Rp672.66bn (87.02%) while Rp100.3bn (12.98%) came from business group.
• Embedded value of Rp2.58 tn (before expense overruns) and appraisal value of
p
•Market share of Syariah Banking as of Feb 2010) :
• 34.62% in assets• 34.93% in financing extended
Rp24.11 tn
• Total Assets Under Management amounting to Rp15.85 tn
expense overruns) and appraisal value of Rp14.22 tn.
• Operating since December 2003, AXA Mandiri has a presence in 920 Bank Mandiribranches with a team consisting of 1,342
3 93% a c g e e ded• 39.51% in deposits
•CAR = 12.43%
•ROA = 2.22%Financial Advisors (FAs)
•ROE = 24.42%
•408 outlets, consisting of 357 branches & cash offices and 51 KLS, as well as 221
74
branded ATMs
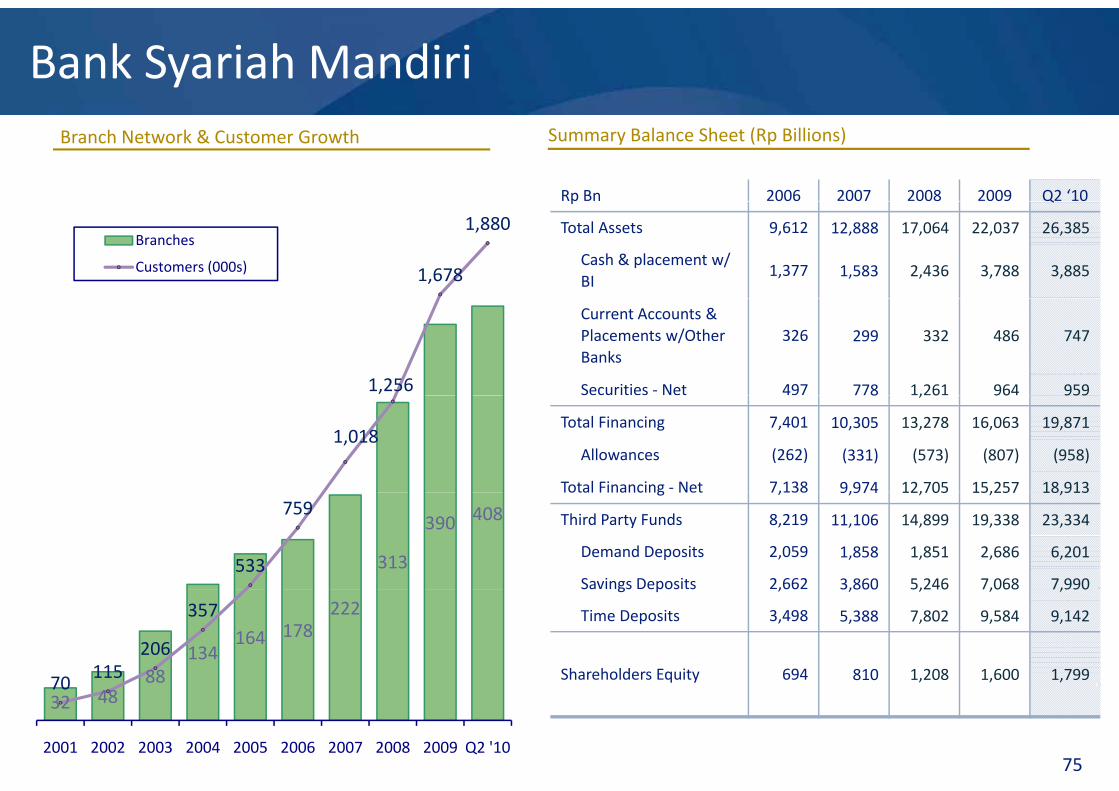
Bank Syariah MandiriBranch Network & Customer Growth Summary Balance Sheet (Rp Billions)
Rp Bn 2006 2007 2008 2009 Q2 ‘10
1,678
1,880Branches
Customers (000s)
p Q
Total Assets 9,612 12,888 17,064 22,037 26,385
Cash & placement w/ BI
1,377 1,583 2,436 3,788 3,885
1,256
Current Accounts & Placements w/Other Banks
326 299 332 486 747
Securities ‐ Net 497 778 1,261 964 959
1,018
8 , 6 96 959
Total Financing 7,401 10,305 13,278 16,063 19,871
Allowances (262) (331) (573) (807) (958)
Total Financing ‐ Net 7,138 9,974 12,705 15,257 18,913
313
390 408
533
759Total Financing Net 7,138 9,974 12,705 15,257 18,913
Third Party Funds 8,219 11,106 14,899 19,338 23,334
Demand Deposits 2,059 1,858 1,851 2,686 6,201
Savings Deposits 2,662 3,860 5,246 7,068 7,990
88134
164 178222
70 115206
357Sa gs epos s ,66 3,860 5,246 7,068 7,990
Time Deposits 3,498 5,388 7,802 9,584 9,142
Shareholders Equity 694 810 1,208 1,600 1,799
75
32 4870
2001 2002 2003 2004 2005 2006 2007 2008 2009 Q2 '10
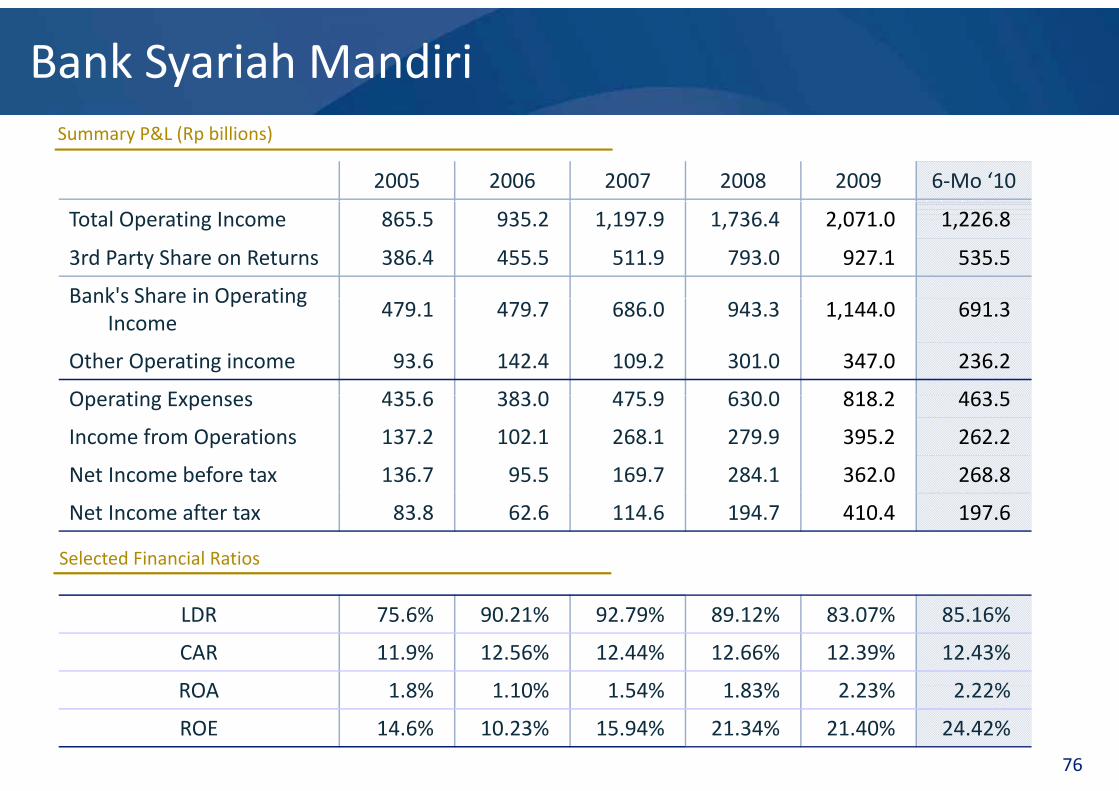
Bank Syariah MandiriSummary P&L (Rp billions)
2005 2006 2007 2008 2009 6‐Mo ‘10
Total Operating Income 865.5 935.2 1,197.9 1,736.4 2,071.0 1,226.8
3rd Party Share on Returns 386.4 455.5 511.9 793.0 927.1 535.5
Bank's Share in OperatingBank s Share in Operating Income
479.1 479.7 686.0 943.3 1,144.0 691.3
Other Operating income 93.6 142.4 109.2 301.0 347.0 236.2
Operating Expenses 435 6 383 0 475 9 630 0 818 2 463 5Operating Expenses 435.6 383.0 475.9 630.0 818.2 463.5
Income from Operations 137.2 102.1 268.1 279.9 395.2 262.2
Net Income before tax 136.7 95.5 169.7 284.1 362.0 268.8
Net Income after tax 83.8 62.6 114.6 194.7 410.4 197.6
Selected Financial Ratios
LDR 75.6% 90.21% 92.79% 89.12% 83.07% 85.16%
CAR 11.9% 12.56% 12.44% 12.66% 12.39% 12.43%
ROA 1 8% 1 10% 1 54% 1 83% 2 23% 2 22%
76
ROA 1.8% 1.10% 1.54% 1.83% 2.23% 2.22%
ROE 14.6% 10.23% 15.94% 21.34% 21.40% 24.42%
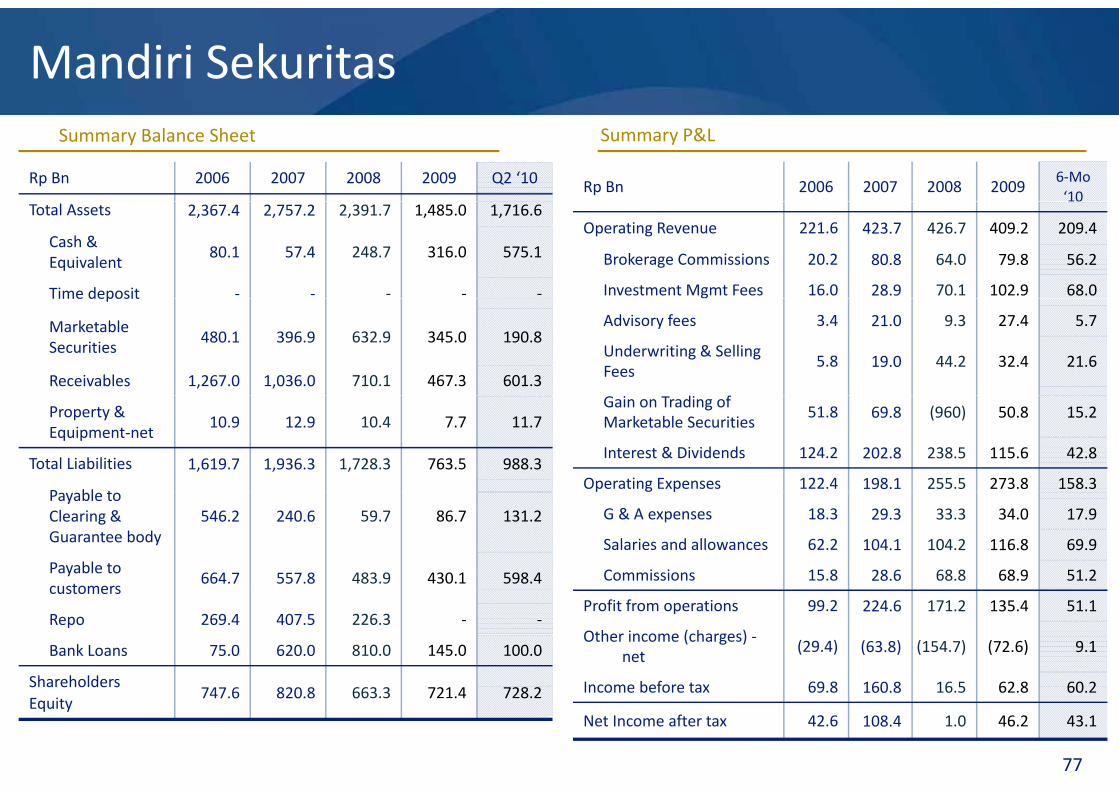
Mandiri SekuritasSummary P&L
Rp Bn 2006 2007 2008 20096‐Mo ‘10
Rp Bn 2006 2007 2008 2009 Q2 ‘10
Summary Balance Sheet
Operating Revenue 221.6 423.7 426.7 409.2 209.4
Brokerage Commissions 20.2 80.8 64.0 79.8 56.2
Investment Mgmt Fees 16.0 28.9 70.1 102.9 68.0
Total Assets 2,367.4 2,757.2 2,391.7 1,485.0 1,716.6
Cash & Equivalent
80.1 57.4 248.7 316.0 575.1
Time deposit ‐ ‐ ‐ ‐ ‐
Advisory fees 3.4 21.0 9.3 27.4 5.7
Underwriting & Selling Fees
5.8 19.0 44.2 32.4 21.6
Time deposit
Marketable Securities
480.1 396.9 632.9 345.0 190.8
Receivables 1,267.0 1,036.0 710.1 467.3 601.3Gain on Trading of Marketable Securities
51.8 69.8 (960) 50.8 15.2
Interest & Dividends 124.2 202.8 238.5 115.6 42.8
Operating Expenses 122.4 198.1 255.5 273.8 158.3
Property & Equipment‐net
10.9 12.9 10.4 7.7 11.7
Total Liabilities 1,619.7 1,936.3 1,728.3 763.5 988.3
P bl tG & A expenses 18.3 29.3 33.3 34.0 17.9
Salaries and allowances 62.2 104.1 104.2 116.8 69.9
Commissions 15.8 28.6 68.8 68.9 51.2
Payable to Clearing & Guarantee body
546.2 240.6 59.7 86.7 131.2
Payable to customers
664.7 557.8 483.9 430.1 598.4
Profit from operations 99.2 224.6 171.2 135.4 51.1
Other income (charges) ‐net
(29.4) (63.8) (154.7) (72.6) 9.1
Income before tax 69 8 160 8 16 5 62 8 60 2
customers
Repo 269.4 407.5 226.3 ‐ ‐
Bank Loans 75.0 620.0 810.0 145.0 100.0
Shareholders
77
Income before tax 69.8 160.8 16.5 62.8 60.2
Net Income after tax 42.6 108.4 1.0 46.2 43.1
Shareholders Equity
747.6 820.8 663.3 721.4 728.2
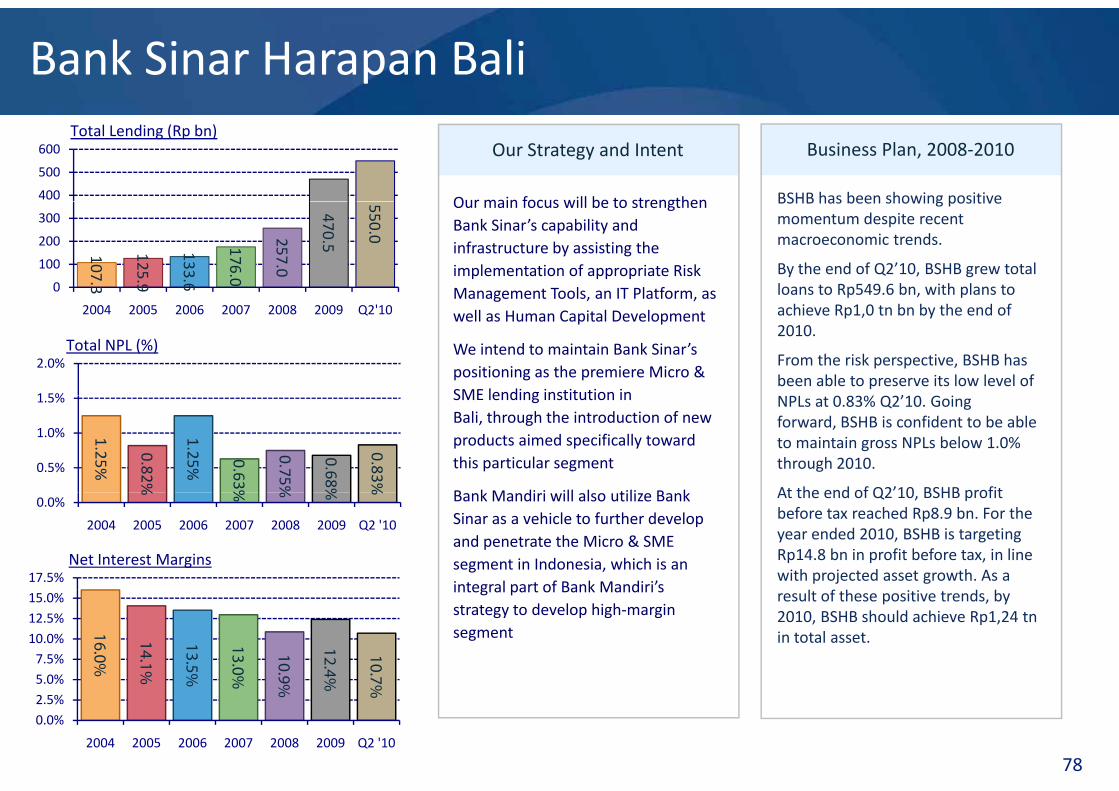
Bank Sinar Harapan Bali
Our Strategy and Intent Business Plan, 2008‐2010
400
500
600Total Lending (Rp bn)
Our main focus will be to strengthen BSHB has been showing positive
107.3
125.9
133.6
176.0
257.0
470.5
550.0
0
100
200
300Our main focus will be to strengthen Bank Sinar’s capability and infrastructure by assisting the implementation of appropriate Risk Management Tools, an IT Platform, as
BSHB has been showing positive momentum despite recent macroeconomic trends.
By the end of Q2’10, BSHB grew total loans to Rp549.6 bn, with plans to
2004 2005 2006 2007 2008 2009 Q2'10
1 5%
2.0%Total NPL (%)
Management Tools, an IT Platform, as well as Human Capital Development
We intend to maintain Bank Sinar’spositioning as the premiere Micro & SME lending institution in
achieve Rp1,0 tn bn by the end of 2010.
From the risk perspective, BSHB has been able to preserve its low level of
’
1.25%
0.82%
1.25% 0.63%
0.75%
0.68%
0.83%
0.5%
1.0%
1.5% SME lending institution in Bali, through the introduction of new products aimed specifically toward this particular segment
B k M di i ill l tili B k
NPLs at 0.83% Q2’10. Going forward, BSHB is confident to be able to maintain gross NPLs below 1.0% through 2010.
At the end of Q2’10 BSHB profit
% % % % %
0.0%
2004 2005 2006 2007 2008 2009 Q2 '10
17.5%Net Interest Margins
Bank Mandiri will also utilize Bank Sinar as a vehicle to further develop and penetrate the Micro & SMEsegment in Indonesia, which is an integral part of Bank Mandiri’s
At the end of Q2 10, BSHB profit before tax reached Rp8.9 bn. For the year ended 2010, BSHB is targeting Rp14.8 bn in profit before tax, in line with projected asset growth. As a
16.0%
14.1%
13.5%
13.0%
10.9%
12.4%
10.7%5.0%7.5%10.0%12.5%15.0%
integral part of Bank Mandiri sstrategy to develop high‐margin segment
result of these positive trends, by 2010, BSHB should achieve Rp1,24 tnin total asset.
78
% % % % %0.0%2.5%
2004 2005 2006 2007 2008 2009 Q2 '10
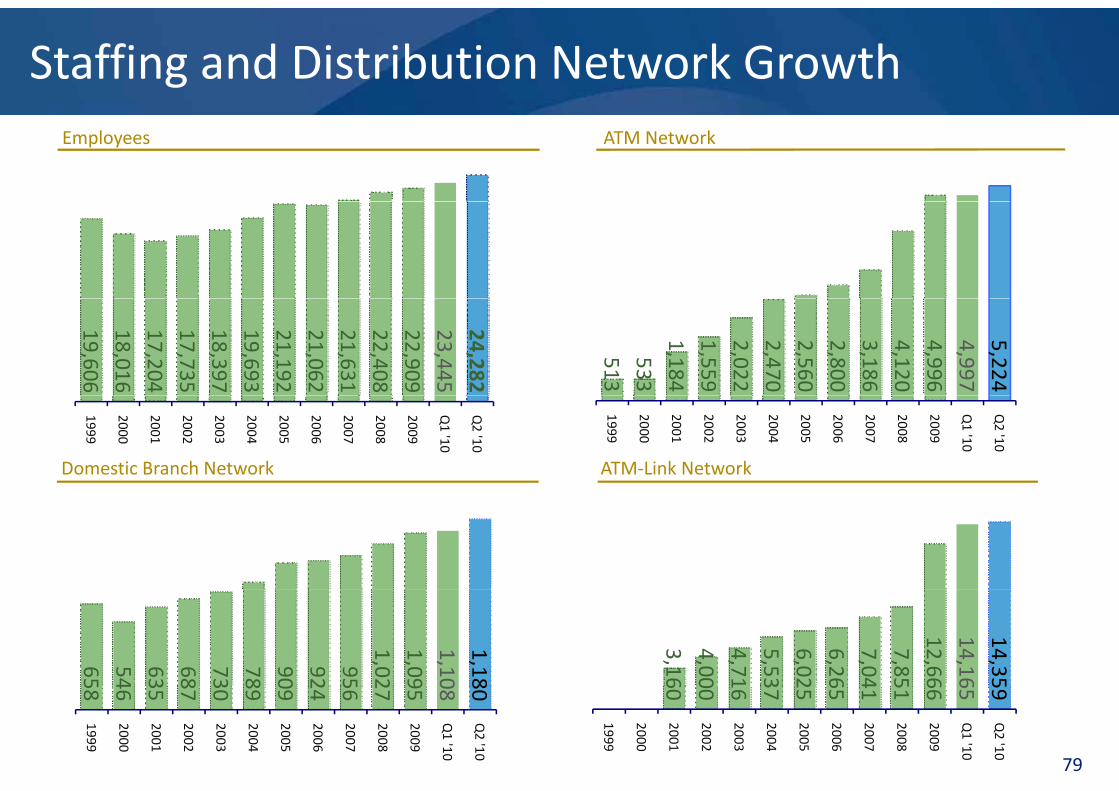
Staffing and Distribution Network GrowthEmployees ATM Network
19,60618,01617,20417,73518,39719,69321,19221,06221,63122,40822,90923,44524,282
513533
1,1841,5592,0222,4702,5602,8003,1864,1204,9964,9975,224
1999
2000
2001
2002
2003
2004
2005
2006
2007
2008
2009
Q1 '10
Q2 '10
1999
2000
2001
2002
2003
2004
2005
2006
2007
2008
2009
Q1 '10
Q2 '10
Domestic Branch Network ATM‐Link Network
65 54 63 68 73 78 90 92 951,021,091,101,18
3,164,004,715,536,026,267,047,85
12,6614,1614,35
79
58 46 35 87 30 89 09 24 56 27 95 08 80
1999
2000
2001
2002
2003
2004
2005
2006
2007
2008
2009
Q1 '10
Q2 '10
60 00 16 37 25 65 41 51 66 65 59
1999
2000
2001
2002
2003
2004
2005
2006
2007
2008
2009
Q1 '10
Q2 '10
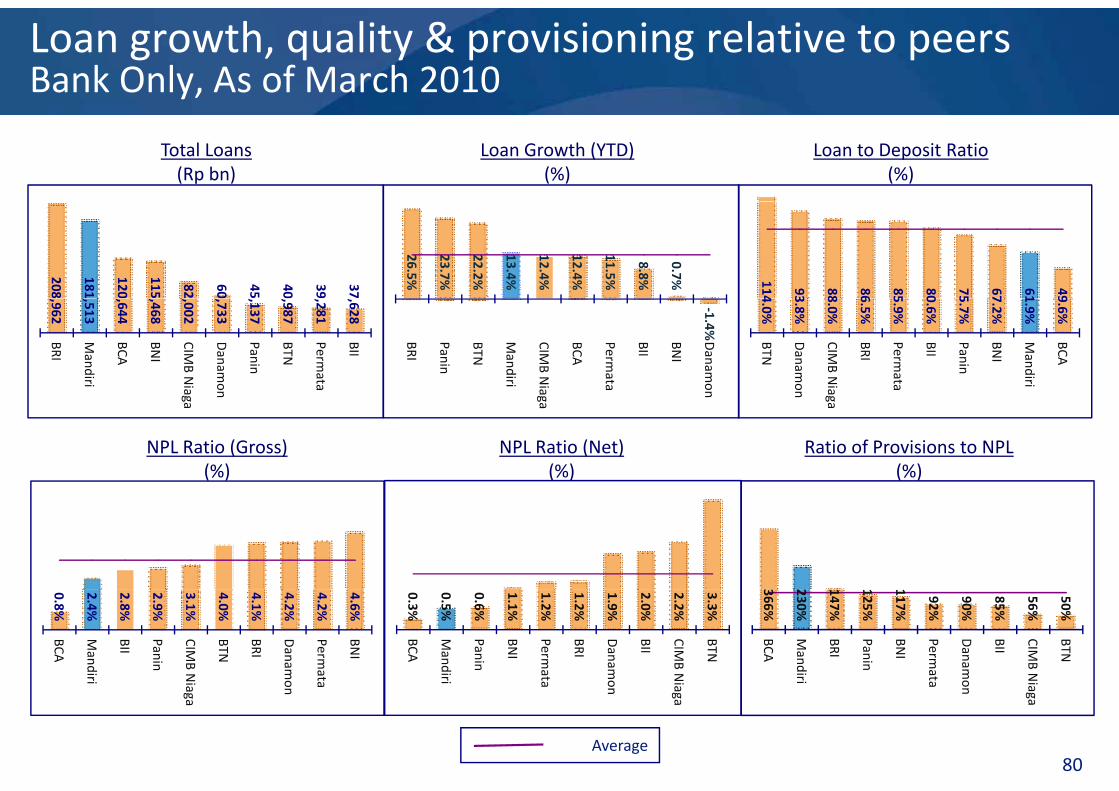
Loan growth, quality & provisioning relative to peersBank Only, As of March 2010
Total Loans(Rp bn)
Loan Growth (YTD)(%)
Loan to Deposit Ratio(%)
208
181
120
115 82 60 45 40 39 37
26.5%
23.7%
22.2%
13.4%
12.4%
12.4%
11.5%
8.8%
0.7% 114 93 88 86 85 80 75 67 61 49,962
,513
,644
,468
,002
,733
,137
,987
,281
,628
BRI
Mandiri
BCA
BNI
CIMB N
ia
Danam
o n
Panin
BTN
Permata
BII
‐1.4%
BRI
Panin
BTN
Mandiri
CIMB N
ia
BCA
Permata
BII
BNI
Danam
o n
4.0%
3.8%
8.0%
6.5%
5.9%
0.6%
5.7%
7.2%
1.9%
9.6%
BTN
Danam
on
CIMB N
ia
BRI
Permata
BII
Panin
BNI
Mandiri
BCA
Ratio of Provisions to NPL(%)
ga
n ga
n
NPL Ratio (Net)(%)
n ga
NPL Ratio (Gross)(%)
366%
230%
147%
125%
117%
92%
90%
85%
56%
50%
BCA
Mandiri
BRI
Panin
BNI
Permat a
Danam
o
BII
CIMB N
i a
BTN
0.3%
0.5%
0.6%
1.1%
1.2%
1.2%
1.9%
2.0%
2.2%
3.3%
BCA
Mandiri
Panin
BNI
Permat a
BRI
Danam
o
BII
CIMB N
i
BTN
0.8%
2.4%
2.8%
2.9%
3.1%
4.0%
4.1%
4.2%
4.2%
4.6%
BCA
Mandiri
BII
Panin
CIMB N
i
BTN
BRI
Danam
o
Permata
BNI
80
a on aga
a on aga
aga
on a
Average
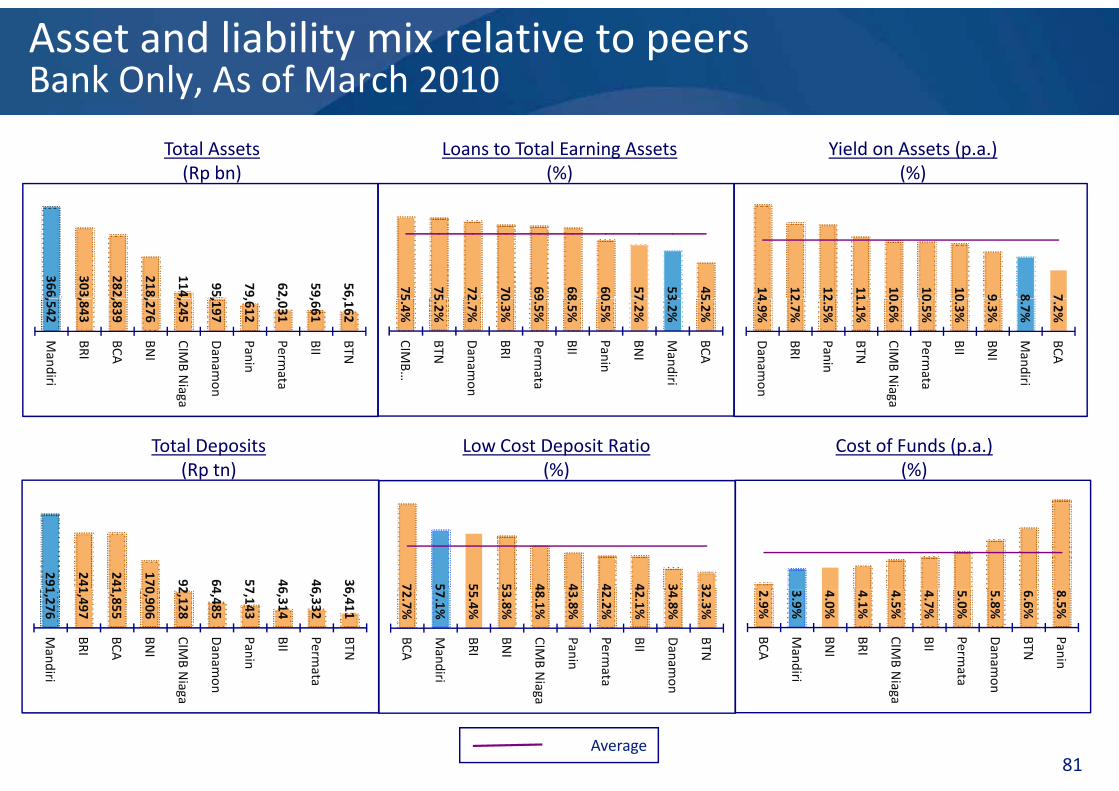
Asset and liability mix relative to peersBank Only, As of March 2010
Loans to Total Earning Assets(%)
Total Assets(Rp bn)
Yield on Assets (p.a.)(%)
75 75 72 70 69 68 60 57 53 45
366,
303,
282,
218,
114,
95,
79,
62,
59,
56,
14 12 12 11 10 10 10 9 8 75.4%
5.2%
2.7%
0.3%
9.5%
8.5%
0.5%
7.2%
3.2%
5.2%
CIMB …
BTN
Danam
on
BRI
Permata
BII
Panin
BNI
Mandiri
BCA
,542
,843
,839
,276
,245
,197
,612
,031
,661
,162
Mandiri
BRI
BCA
BNI
CIMB N
ia g
Danam
on
Panin
Permata
BII
BTN
4.9%
2.7%
2.5%
1.1%
0.6%
0.5%
0.3%
9.3%
8.7%
7.2%
Danam
o n
BRI
Panin
BTN
CIMB N
iag
Permata
BII
BNI
Mandiri
BCA
ga
n
Cost of Funds (p.a.)(%)
Low Cost Deposit Ratio(%)
n ga
Total Deposits(Rp tn)
7 5 5 5 4 4 4 4 3 3
291
241
241
170 92 64 57 46 46 36 2.9%
3.9%
4.0%
4.1%
4.5%
4.7%
5.0%
5.8%
6.6%
8.5%
BCA
Mandiri
BNI
BRI
CIMB N
i a
BII
Permata
Danam
o
BTN
Panin
72.7%
57.1%
55.4%
53.8%
48.1%
43.8%
42.2%
42.1%
34.8%
32.3%
BCA
Mandiri
BRI
BNI
CIMB N
i a
Panin
Permata
BII
Danam
o
BTN
1,276
1,497
1,855
0,906
2,128
4,485
7,143
6,314
6,332
6,411
Mandiri
BRI
BCA
BNI
CIMB N
i a
Danam
o
Panin
BII
Permata
BTN81
aga
naga
naga
n
Average
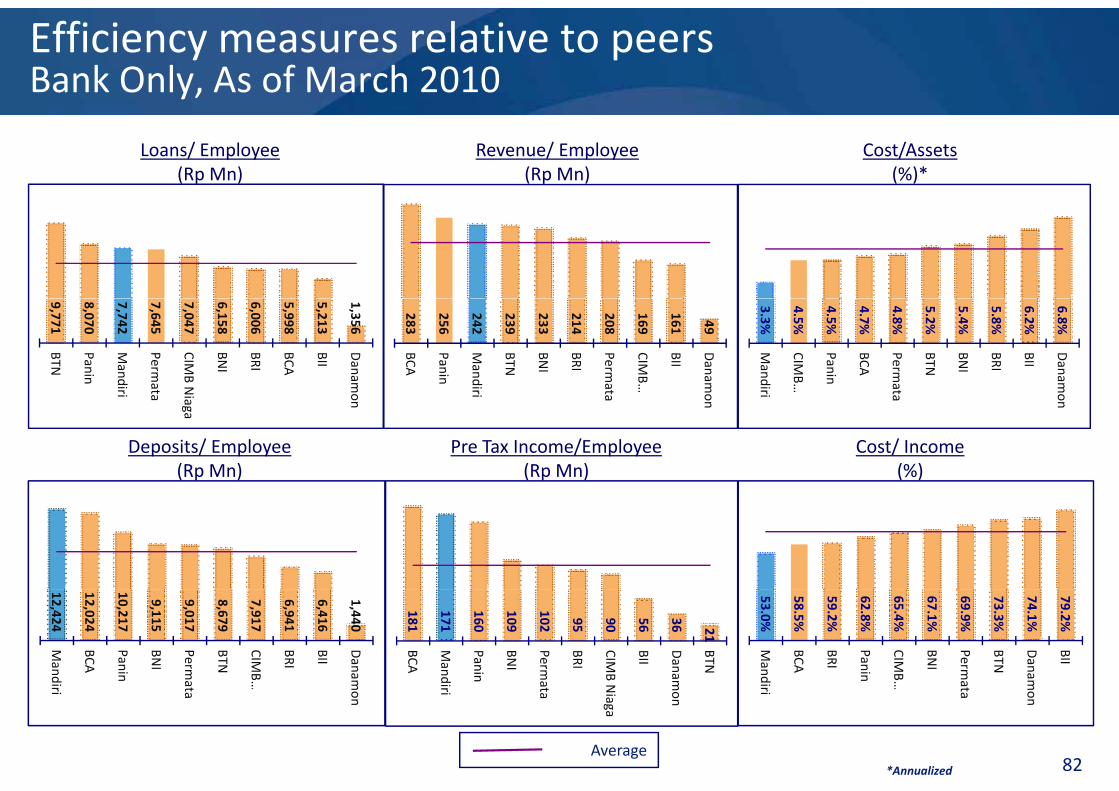
Efficiency measures relative to peersBank Only, As of March 2010
Revenue/ Employee(Rp Mn)
Loans/ Employee(Rp Mn)
Cost/Assets(%)*
283
256
242
239
233
214
208
169
161 49
BCA
Panin
Mandir i
BTN
BNI
BRI
Permat a
CIMB …
BII
Danam
o
9,771
8,070
7,742
7,645
7,047
6,158
6,006
5,998
5,213
1,356
BTN
Panin
Mandiri
Permata
CIMB N
BNI
BRI
BCA
BII
Danam
o
3.3%
4.5%
4.5%
4.7%
4.8%
5.2%
5.4%
5.8%
6.2%
6.8%
Mandiri
CIMB …
Panin
BCA
Permat a
BTN
BNI
BRI
BII
Danam
oi a oni a iaga
on
Cost/ Income(%)
Deposits/ Employee(Rp Mn)
Pre Tax Income/Employee(Rp Mn)
i a on
53.0%
58.5%
59.2%
62.8%
65.4%
67.1%
69.9%
73.3%
74.1%
79.2%
Mandi
BCA
BRI
Panin
CIMB …
BNI
Perma
BTN
Dana m
BII
12,424
12,024
10,217
9,115
9,017
8,679
7,917
6,941
6,416
1,440
Mandi
BCA
Panin
BNI
Perma
BTN
CIMB …
BRI
BII
Dana m
181
171
160
109
102 95 90 56 36 21
BCA
Mandi
Panin
BNI
Perma
BRI
CIMB N
BII
Danam
BTN
82
ri
… ata
mon
ri
ata
… mon
iri
ata Niaga
mon
*Annualized
Average
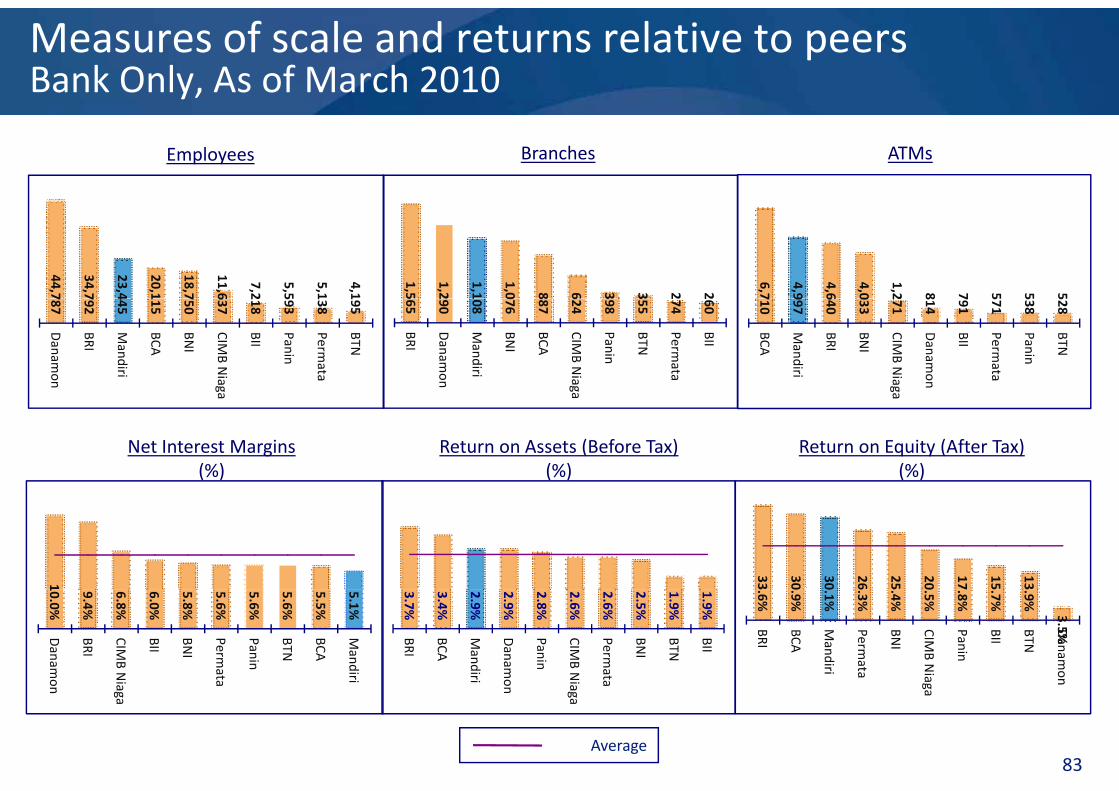
Measures of scale and returns relative to peersBank Only, As of March 2010
BranchesEmployees ATMs
1,5
1,2
1,1
1,0 8 6 3 3 2 2
44,7
34,7
23,4
20,1
18,7
11,6
7,2
5,5
5,1
4,1
6,7
4,9
4,6
4,0
1,2 8 7 5 5 5565
290
108
076
887
624
398
355
274
260
BRI
Danam
on
Mandiri
BNI
BCA
CIMB N
iag a
Panin
BTN
Permata
BII
787
792
445
115
750
637
218
593
138
195
Danam
on
BRI
Mandiri
BCA
BNI
CIMB N
iaga
BII
Panin
Permata
BTN
710
997
640
033
271
814
791
571
538
528
BCA
Mandiri
BRI
BNI
CIMB N
iag a
Danam
on
BII
Permata
Panin
BTN
aa
Return on Equity (After Tax)(%)
Net Interest Margins(%)
Return on Assets (Before Tax)(%)
a
33 30 30 26 25 20 17 15 131 3.6%
0.9%
0.1%
6.3%
5.4%
0.5%
7.8%
5.7%
3.9%
3.5%BRI
BCA
Mandiri
Permata
BNI
CIMB N
iag
Panin
BII
BTN
Danam
on
10.0%
9.4%
6.8%
6.0%
5.8%
5.6%
5.6%
5.6%
5.5%
5.1%
Danam
o
BRI
CIMB N
i a
BII
BNI
Permata
Panin
BTN
BCA
Mandiri
3.7%
3.4%
2.9%
2.9%
2.8%
2.6%
2.6%
2.5%
1.9%
1.9%
BRI
BCA
Mandiri
Danam
o
Panin
CIMB N
i a
Permata
BNI
BTN
BII
83
gan aga
n aga
Average
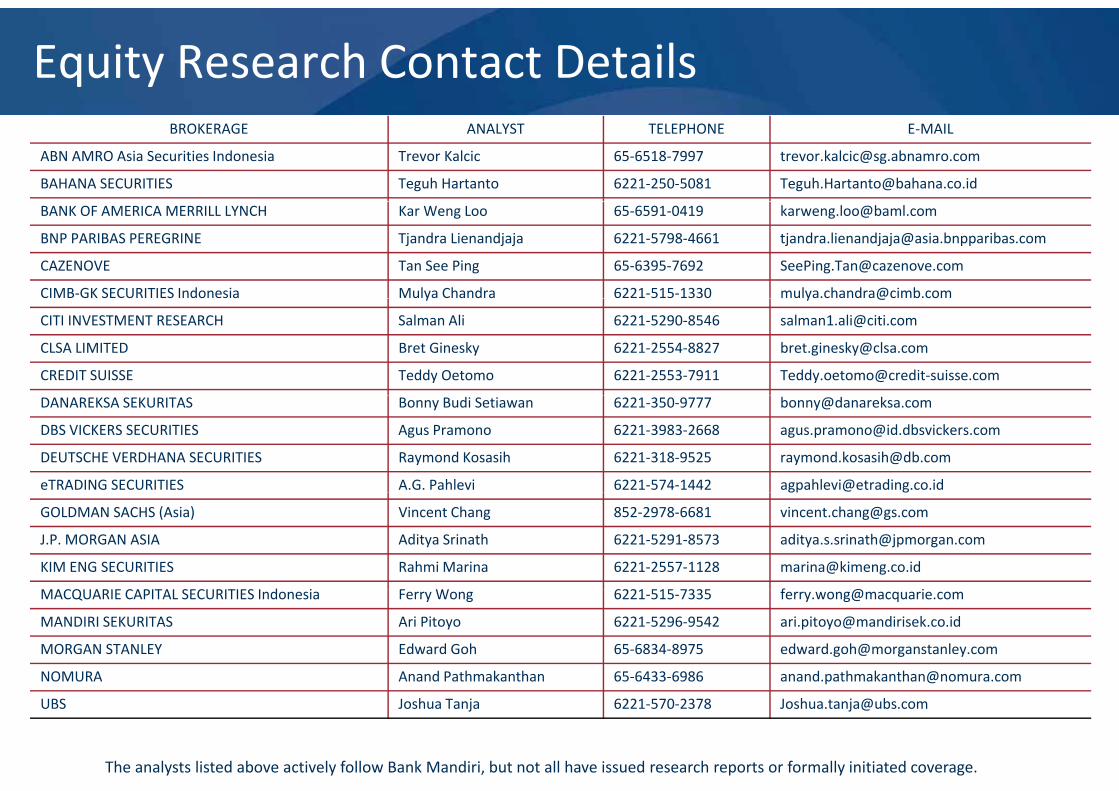
Equity Research Contact DetailsBROKERAGE ANALYST TELEPHONE E‐MAIL
ABN AMRO Asia Securities Indonesia Trevor Kalcic 65‐6518‐7997 [email protected]
BAHANA SECURITIES Teguh Hartanto 6221‐250‐5081 [email protected]
BANK OF AMERICA MERRILL LYNCH Kar Weng Loo 65‐6591‐0419 [email protected]
BNP PARIBAS PEREGRINE Tjandra Lienandjaja 6221‐5798‐4661 [email protected]
CAZENOVE Tan See Ping 65‐6395‐7692 [email protected]
CIMB‐GK SECURITIES Indonesia Mulya Chandra 6221‐515‐1330 [email protected] y @
CITI INVESTMENT RESEARCH Salman Ali 6221‐5290‐8546 [email protected]
CLSA LIMITED Bret Ginesky 6221‐2554‐8827 [email protected]
CREDIT SUISSE Teddy Oetomo 6221‐2553‐7911 Teddy.oetomo@credit‐suisse.com
DANAREKSA SEKURITAS Bonny Budi Setiawan 6221‐350‐9777 [email protected]
DBS VICKERS SECURITIES Agus Pramono 6221‐3983‐2668 [email protected]
DEUTSCHE VERDHANA SECURITIES Raymond Kosasih 6221‐318‐9525 [email protected]
eTRADING SECURITIES A.G. Pahlevi 6221‐574‐1442 [email protected] g
GOLDMAN SACHS (Asia) Vincent Chang 852‐2978‐6681 [email protected]
J.P. MORGAN ASIA Aditya Srinath 6221‐5291‐8573 [email protected]
KIM ENG SECURITIES Rahmi Marina 6221‐2557‐1128 [email protected]
MACQUARIE CAPITAL SECURITIES I d i F W 6221 515 7335 f @ iMACQUARIE CAPITAL SECURITIES Indonesia Ferry Wong 6221‐515‐7335 [email protected]
MANDIRI SEKURITAS Ari Pitoyo 6221‐5296‐9542 [email protected]
MORGAN STANLEY Edward Goh 65‐6834‐8975 [email protected]
NOMURA Anand Pathmakanthan 65‐6433‐6986 [email protected]
85
UBS Joshua Tanja 6221‐570‐2378 [email protected]
The analysts listed above actively follow Bank Mandiri, but not all have issued research reports or formally initiated coverage.