Embed Size (px)
Citation preview
PT ASTRA INTERNATIONAL TBK First Half 2018 - Results Presentation
The materials in this presentation have been prepared by PT Astra International Tbk (Astra) and are general background information about Astra Group business performances current as at the date of this presentation and are subject to change without prior notice. This information is given in summary form and does not purport to be complete. Information in this presentation, including forecast financial information, should not be considered as advice or a recommendation to investors or potential investors in relation to holding, purchasing or selling securities or other financial products or instruments and does not take into account their particular investment objectives, financial situation or needs. Before acting on any information, readers should consider the appropriateness of the information having regard to these matters, any relevant offer document and in particular, readers should seek independent financial advice. This presentation may contain forward looking statements including statements regarding our intent, belief or current expectations with respect to Astra businesses and operations, market conditions, results of operation and financial condition, capital adequacy, specific provisions and risk management practices. Readers are cautioned not to place undue reliance on these forward looking statements; past performance is not a reliable indication of future performance. Astra does not undertake any obligation to publicly release the result of any revisions to these forward looking statements to reflect events or circumstances after the date hereof to reflect the occurrence of unanticipated events. We disclaim any responsibility or liability whatsoever arising which may be brought or suffered by any person as a result of acting in reliance upon the whole or any part of the contents of this report and neither Astra and/or its affiliated companies and/or their respective employees and/or agents accepts liability for any errors, omissions, negligent or otherwise, in this report and any inaccuracy herein or omission here from which might otherwise arise.
Disclaimer
1
2
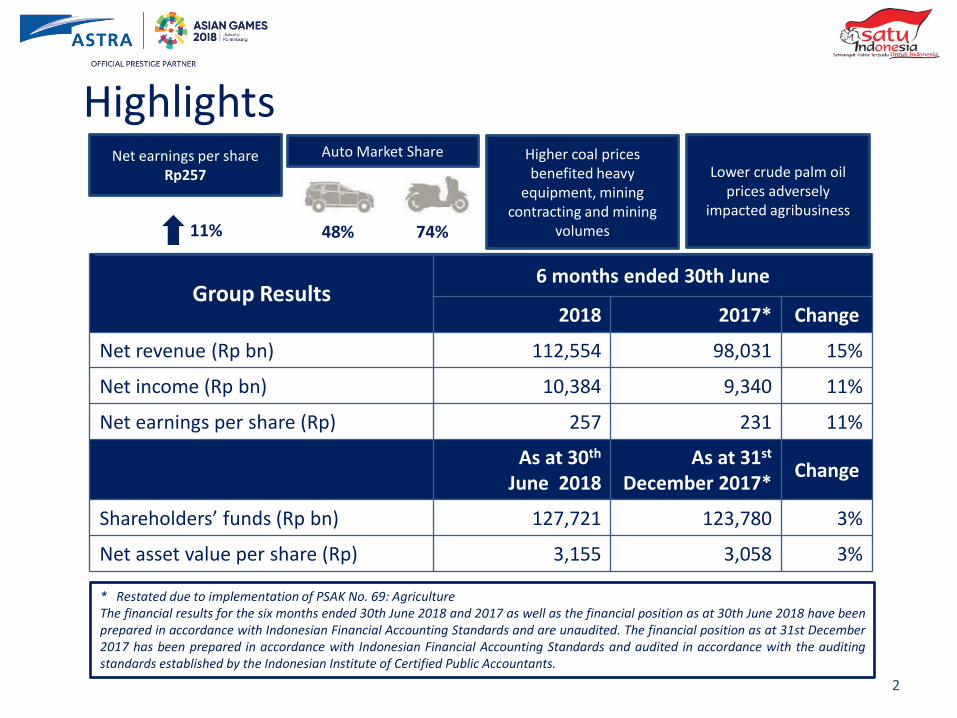
Group Results 6 months ended 30th June
2018 2017* Change
Net revenue (Rp bn) 112,554 98,031 15%
Net income (Rp bn) 10,384 9,340 11%
Net earnings per share (Rp) 257 231 11%
As at 30th June 2018
As at 31st December 2017*
Change
Shareholders’ funds (Rp bn) 127,721 123,780 3%
Net asset value per share (Rp) 3,155 3,058 3%
* Restated due to implementation of PSAK No. 69: Agriculture The financial results for the six months ended 30th June 2018 and 2017 as well as the financial position as at 30th June 2018 have been prepared in accordance with Indonesian Financial Accounting Standards and are unaudited. The financial position as at 31st December 2017 has been prepared in accordance with Indonesian Financial Accounting Standards and audited in accordance with the auditing standards established by the Indonesian Institute of Certified Public Accountants.
Net earnings per share
Rp257
11% 48% 74%
Auto Market Share Higher coal prices benefited heavy
equipment, mining contracting and mining
volumes
Highlights
Lower crude palm oil prices adversely
impacted agribusiness
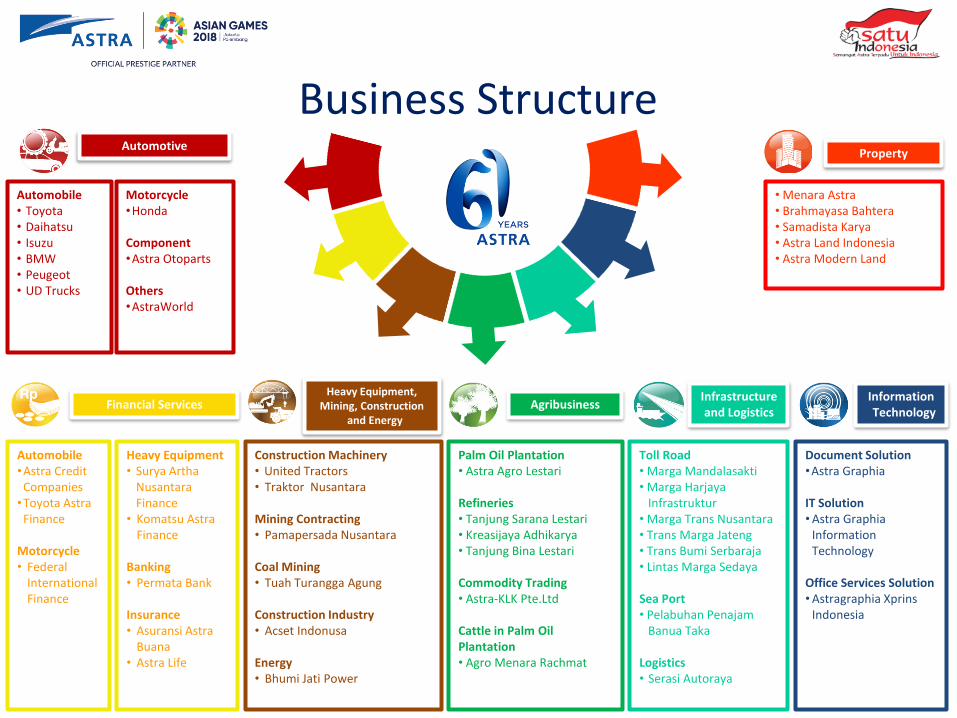
Business Structure
Automobile • Toyota • Daihatsu • Isuzu • BMW • Peugeot • UD Trucks
Other
Motorcycle •Honda
Component •Astra Otoparts
Others •AstraWorld
Automobile •Astra Credit
Companies •Toyota Astra
Finance
Motorcycle • Federal
International Finance
Heavy Equipment • Surya Artha
Nusantara Finance
• Komatsu Astra Finance
Banking • Permata Bank
Insurance • Asuransi Astra
Buana • Astra Life
Construction Machinery • United Tractors • Traktor Nusantara
Mining Contracting • Pamapersada Nusantara Coal Mining • Tuah Turangga Agung
Construction Industry • Acset Indonusa
Energy • Bhumi Jati Power
Palm Oil Plantation • Astra Agro Lestari Refineries • Tanjung Sarana Lestari • Kreasijaya Adhikarya • Tanjung Bina Lestari Commodity Trading • Astra-KLK Pte.Ltd
Cattle in Palm Oil Plantation • Agro Menara Rachmat
Toll Road • Marga Mandalasakti • Marga Harjaya Infrastruktur • Marga Trans Nusantara • Trans Marga Jateng • Trans Bumi Serbaraja • Lintas Marga Sedaya
Sea Port • Pelabuhan Penajam Banua Taka Logistics • Serasi Autoraya
Document Solution •Astra Graphia
IT Solution •Astra Graphia
Information Technology
Office Services Solution •Astragraphia Xprins
Indonesia
• Menara Astra • Brahmayasa Bahtera • Samadista Karya • Astra Land Indonesia • Astra Modern Land
Financial Services Heavy Equipment,
Mining, Construction and Energy
Agribusiness Infrastructure and Logistics
Information Technology
Automotive Property
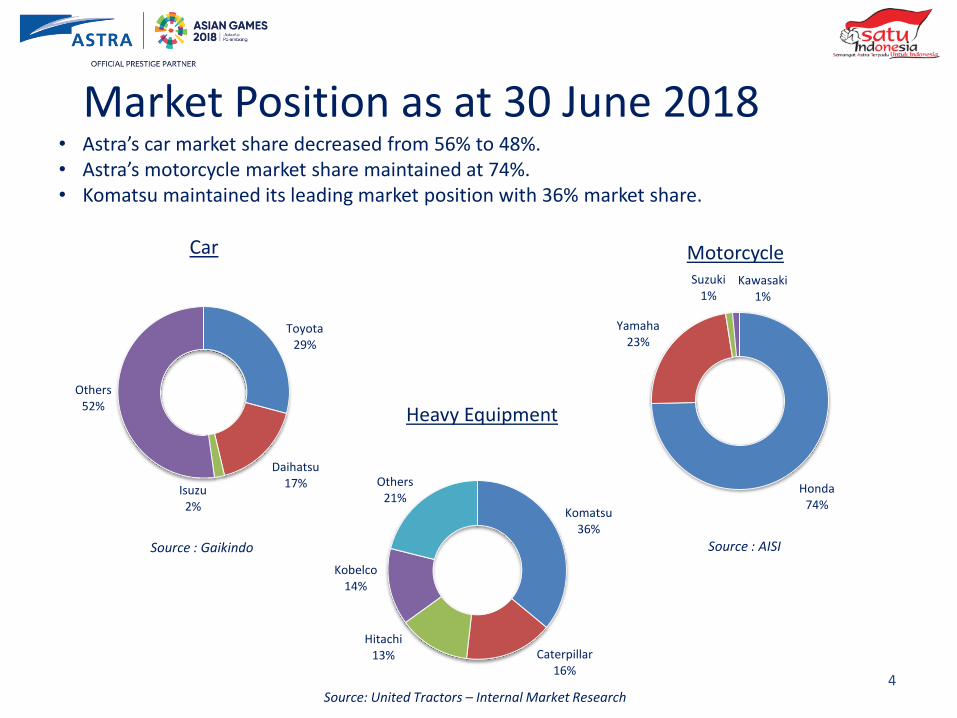
Toyota 29%
Daihatsu 17%
Isuzu 2%
Others 52%
Car
• Astra’s car market share decreased from 56% to 48%. • Astra’s motorcycle market share maintained at 74%. • Komatsu maintained its leading market position with 36% market share.
Source : Gaikindo
Honda 74%
Yamaha 23%
Suzuki 1%
Kawasaki 1%
Motorcycle
Source : AISI
Source: United Tractors – Internal Market Research
Heavy Equipment
4
Komatsu 36%
Caterpillar 16%
Hitachi 13%
Kobelco 14%
Others 21%
Market Position as at 30 June 2018
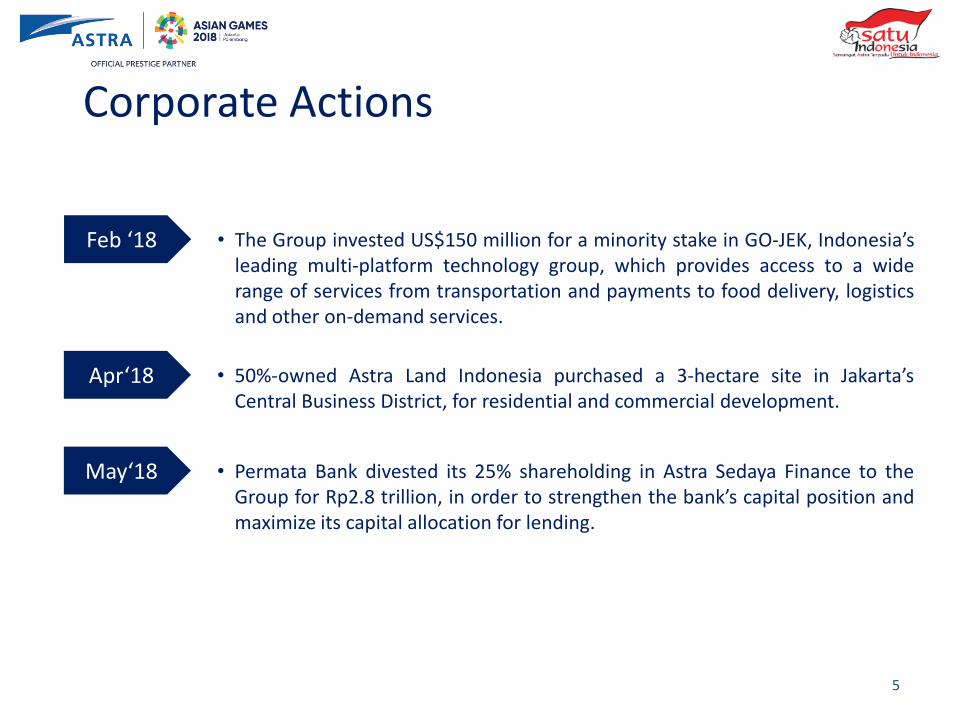
Feb ‘18 • The Group invested US$150 million for a minority stake in GO-JEK, Indonesia’s leading multi-platform technology group, which provides access to a wide range of services from transportation and payments to food delivery, logistics and other on-demand services.
5
Corporate Actions
May‘18 • Permata Bank divested its 25% shareholding in Astra Sedaya Finance to the Group for Rp2.8 trillion, in order to strengthen the bank’s capital position and maximize its capital allocation for lending.
Apr‘18 • 50%-owned Astra Land Indonesia purchased a 3-hectare site in Jakarta’s Central Business District, for residential and commercial development.
Financial Performance
6
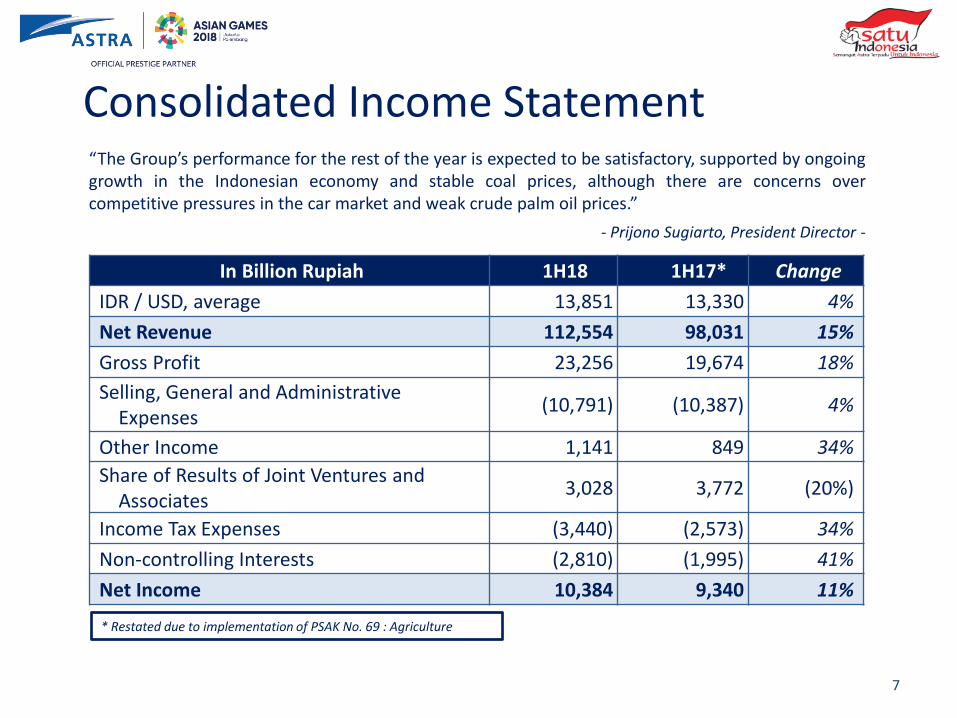
In Billion Rupiah 1H18 1H17* Change
IDR / USD, average 13,851 13,330 4%
Net Revenue 112,554 98,031 15%
Gross Profit 23,256 19,674 18%
Selling, General and Administrative Expenses
(10,791) (10,387) 4%
Other Income 1,141 849 34%
Share of Results of Joint Ventures and Associates
3,028 3,772 (20%)
Income Tax Expenses (3,440) (2,573) 34%
Non-controlling Interests (2,810) (1,995) 41%
Net Income 10,384 9,340 11%
“The Group’s performance for the rest of the year is expected to be satisfactory, supported by ongoing growth in the Indonesian economy and stable coal prices, although there are concerns over competitive pressures in the car market and weak crude palm oil prices.” - Prijono Sugiarto, President Director -
7
Consolidated Income Statement
* Restated due to implementation of PSAK No. 69 : Agriculture
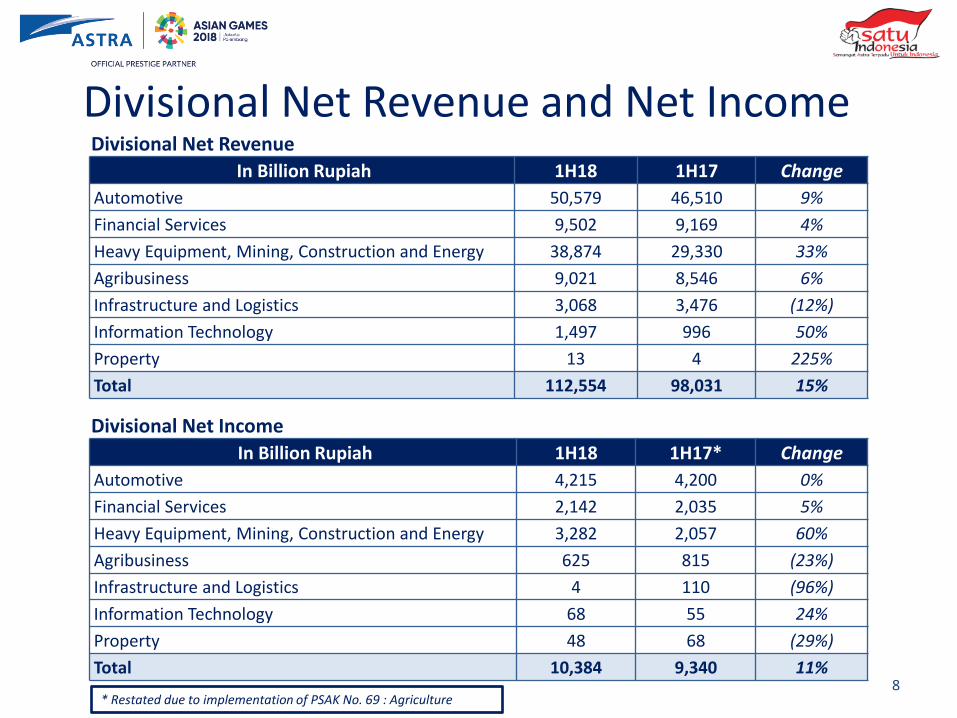
In Billion Rupiah 1H18 1H17 Change
Automotive 50,579 46,510 9%
Financial Services 9,502 9,169 4%
Heavy Equipment, Mining, Construction and Energy 38,874 29,330 33%
Agribusiness 9,021 8,546 6%
Infrastructure and Logistics 3,068 3,476 (12%)
Information Technology 1,497 996 50%
Property 13 4 225%
Total 112,554 98,031 15%
Divisional Net Income
In Billion Rupiah 1H18 1H17* Change
Automotive 4,215 4,200 0%
Financial Services 2,142 2,035 5%
Heavy Equipment, Mining, Construction and Energy 3,282 2,057 60%
Agribusiness 625 815 (23%)
Infrastructure and Logistics 4 110 (96%)
Information Technology 68 55 24%
Property 48 68 (29%)
Total 10,384 9,340 11%
Divisional Net Revenue
8
Divisional Net Revenue and Net Income
* Restated due to implementation of PSAK No. 69 : Agriculture
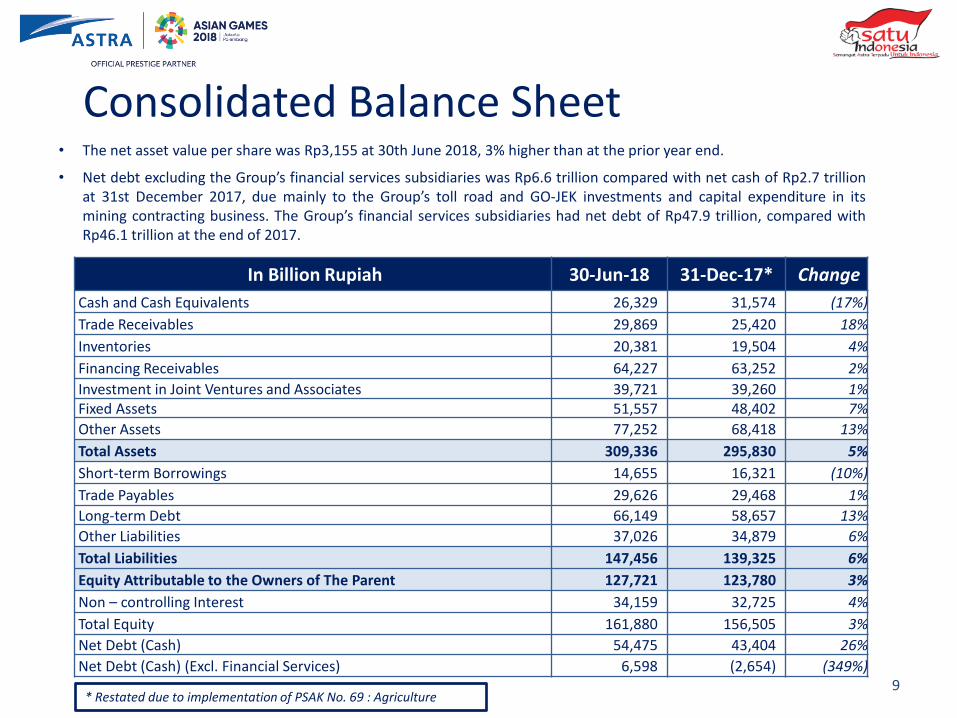
• The net asset value per share was Rp3,155 at 30th June 2018, 3% higher than at the prior year end.
• Net debt excluding the Group’s financial services subsidiaries was Rp6.6 trillion compared with net cash of Rp2.7 trillion at 31st December 2017, due mainly to the Group’s toll road and GO-JEK investments and capital expenditure in its mining contracting business. The Group’s financial services subsidiaries had net debt of Rp47.9 trillion, compared with Rp46.1 trillion at the end of 2017.
In Billion Rupiah 30-Jun-18 31-Dec-17* Change
Cash and Cash Equivalents 26,329 31,574 (17%)
Trade Receivables 29,869 25,420 18%
Inventories 20,381 19,504 4%
Financing Receivables 64,227 63,252 2%
Investment in Joint Ventures and Associates 39,721 39,260 1% Fixed Assets 51,557 48,402 7%
Other Assets 77,252 68,418 13%
Total Assets 309,336 295,830 5%
Short-term Borrowings 14,655 16,321 (10%)
Trade Payables 29,626 29,468 1%
Long-term Debt 66,149 58,657 13%
Other Liabilities 37,026 34,879 6%
Total Liabilities 147,456 139,325 6%
Equity Attributable to the Owners of The Parent 127,721 123,780 3%
Non – controlling Interest 34,159 32,725 4%
Total Equity 161,880 156,505 3%
Net Debt (Cash) 54,475 43,404 26%
Net Debt (Cash) (Excl. Financial Services) 6,598 (2,654) (349%) 9
Consolidated Balance Sheet
* Restated due to implementation of PSAK No. 69 : Agriculture
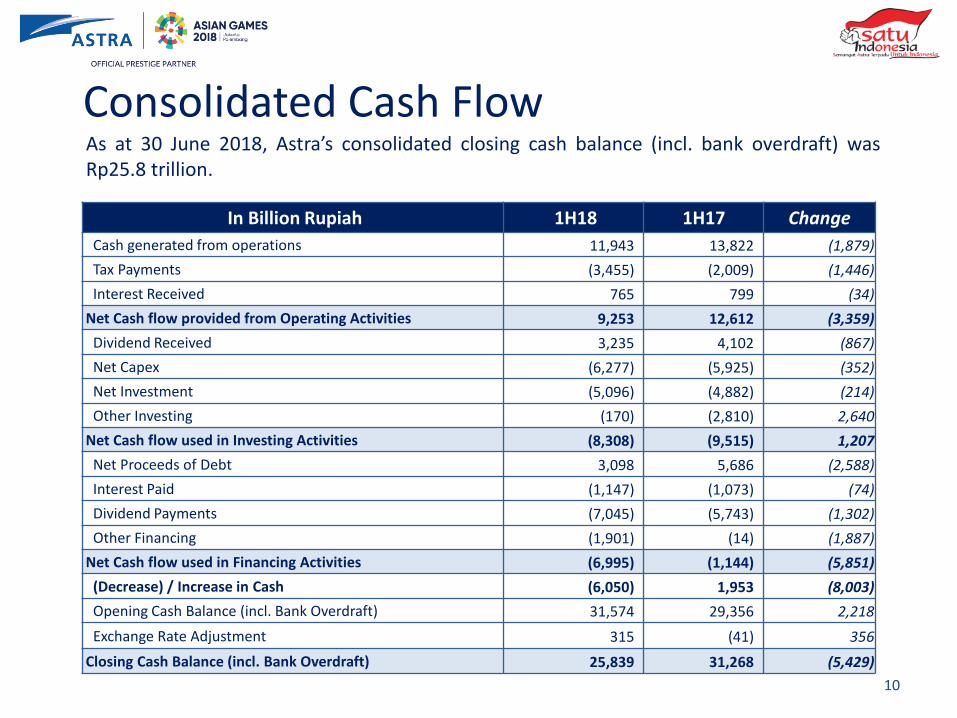
In Billion Rupiah 1H18 1H17 Change
Cash generated from operations 11,943 13,822 (1,879)
Tax Payments (3,455) (2,009) (1,446)
Interest Received 765 799 (34)
Net Cash flow provided from Operating Activities 9,253 12,612 (3,359)
Dividend Received 3,235 4,102 (867)
Net Capex (6,277) (5,925) (352)
Net Investment (5,096) (4,882) (214)
Other Investing (170) (2,810) 2,640
Net Cash flow used in Investing Activities (8,308) (9,515) 1,207
Net Proceeds of Debt 3,098 5,686 (2,588)
Interest Paid (1,147) (1,073) (74)
Dividend Payments (7,045) (5,743) (1,302)
Other Financing (1,901) (14) (1,887)
Net Cash flow used in Financing Activities (6,995) (1,144) (5,851)
(Decrease) / Increase in Cash (6,050) 1,953 (8,003)
Opening Cash Balance (incl. Bank Overdraft) 31,574 29,356 2,218
Exchange Rate Adjustment 315 (41) 356
Closing Cash Balance (incl. Bank Overdraft) 25,839 31,268 (5,429)
As at 30 June 2018, Astra’s consolidated closing cash balance (incl. bank overdraft) was Rp25.8 trillion.
10
Consolidated Cash Flow
Business Updates
11
Astra’s car sales were 10% higher at 421,000 units, resulting in an increase in market share from 50% to 54%.
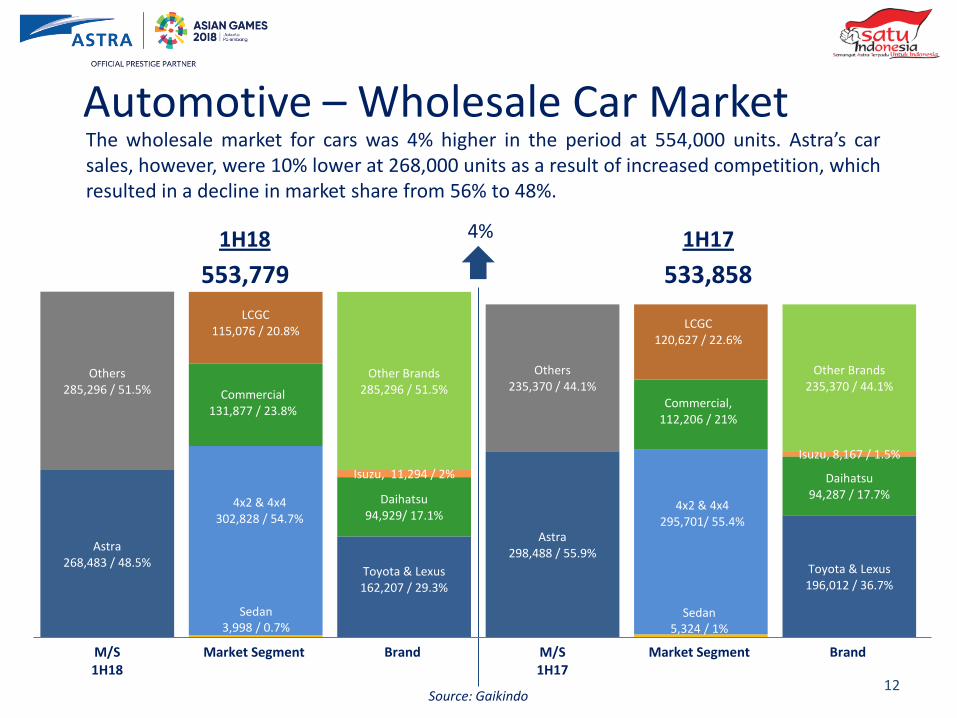
Astra 268,483 / 48.5%
Astra 298,488 / 55.9%
Others 285,296 / 51.5%
Others 235,370 / 44.1%
4x2 & 4x4 302,828 / 54.7%
4x2 & 4x4
295,701/ 55.4%
Commercial 131,877 / 23.8%
Commercial, 112,206 / 21%
LCGC 115,076 / 20.8%
LCGC 120,627 / 22.6%
Toyota & Lexus 162,207 / 29.3%
Toyota & Lexus 196,012 / 36.7%
Daihatsu 94,929/ 17.1%
Daihatsu 94,287 / 17.7%
Isuzu, 11,294 / 2%
Isuzu, 8,167 / 1.5%
Other Brands 285,296 / 51.5%
Other Brands 235,370 / 44.1%
M/S 1H18
Market Segment
Brand
M/S 1H17
Market Segment
Brand
Sedan 5,324 / 1%
Sedan 3,998 / 0.7%
1H18 1H17
The wholesale market for cars was 4% higher in the period at 554,000 units. Astra’s car sales, however, were 10% lower at 268,000 units as a result of increased competition, which resulted in a decline in market share from 56% to 48%.
4%
Source: Gaikindo 12
Automotive – Wholesale Car Market
533,858 553,779
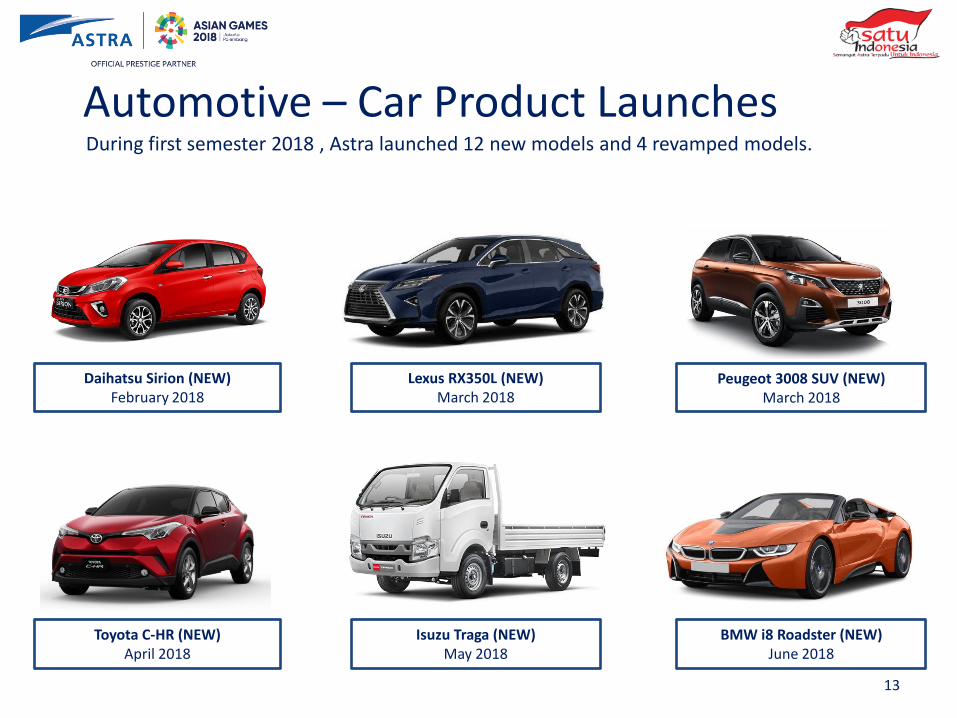
Peugeot 3008 SUV (NEW) March 2018
Daihatsu Sirion (NEW) February 2018
During first semester 2018 , Astra launched 12 new models and 4 revamped models.
Lexus RX350L (NEW) March 2018
13
Toyota C-HR (NEW) April 2018
Isuzu Traga (NEW) May 2018
BMW i8 Roadster (NEW) June 2018
Automotive – Car Product Launches
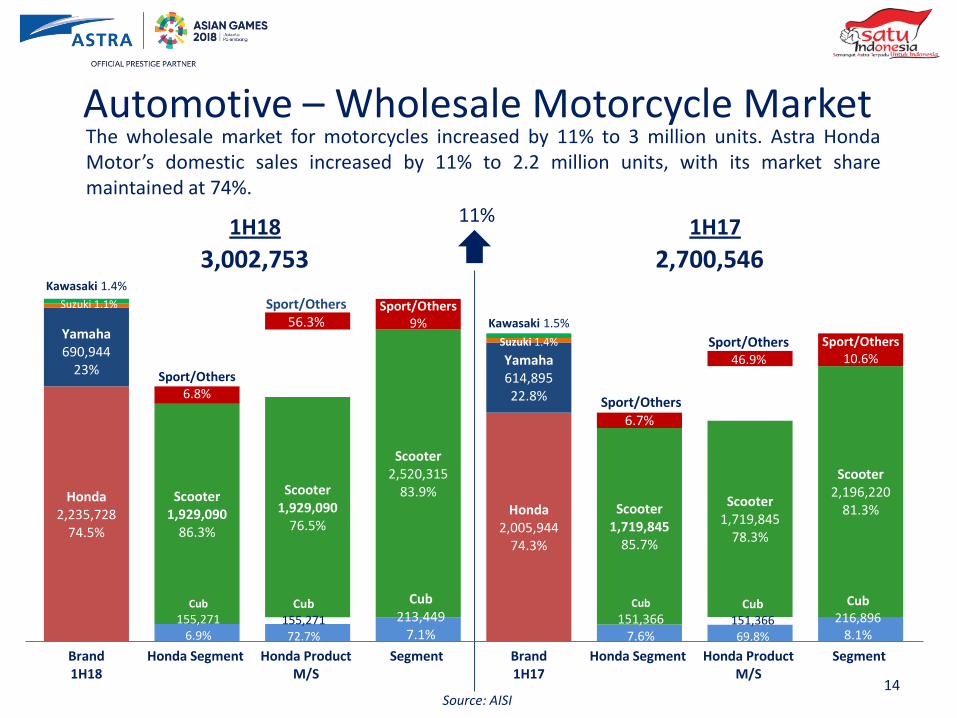
Honda 2,235,728
74.5%
Honda 2,005,944
74.3%
Yamaha 690,944
23%
Yamaha 614,895 22.8%
Kawasaki 1.4%
Suzuki 1.4%
Suzuki 1.1%
Kawasaki 1.5%
Cub
155,271 6.9%
Cub
151,366 7.6%
Scooter 1,929,090
86.3%
Scooter 1,719,845
85.7%
Sport/Others 6.8%
Sport/Others 6.7%
Cub 155,271 72.7%
Cub 151,366 69.8%
Scooter 1,929,090
76.5%
Scooter 1,719,845
78.3%
Sport/Others 56.3%
Sport/Others 46.9%
Cub 213,449
7.1%
Cub 216,896
8.1%
Scooter 2,520,315
83.9% Scooter
2,196,220 81.3%
Sport/Others 9%
Sport/Others 10.6%
Brand 1H18
Honda Segment
Honda Product M/S
Segment
Brand 1H17
Honda Segment
Honda Product M/S
Segment
Source: AISI
1H18 1H17
2,700,546 3,002,753
The wholesale market for motorcycles increased by 11% to 3 million units. Astra Honda Motor’s domestic sales increased by 11% to 2.2 million units, with its market share maintained at 74%.
11%
14
Automotive – Wholesale Motorcycle Market
Honda CMX 500 Rebel March 2017
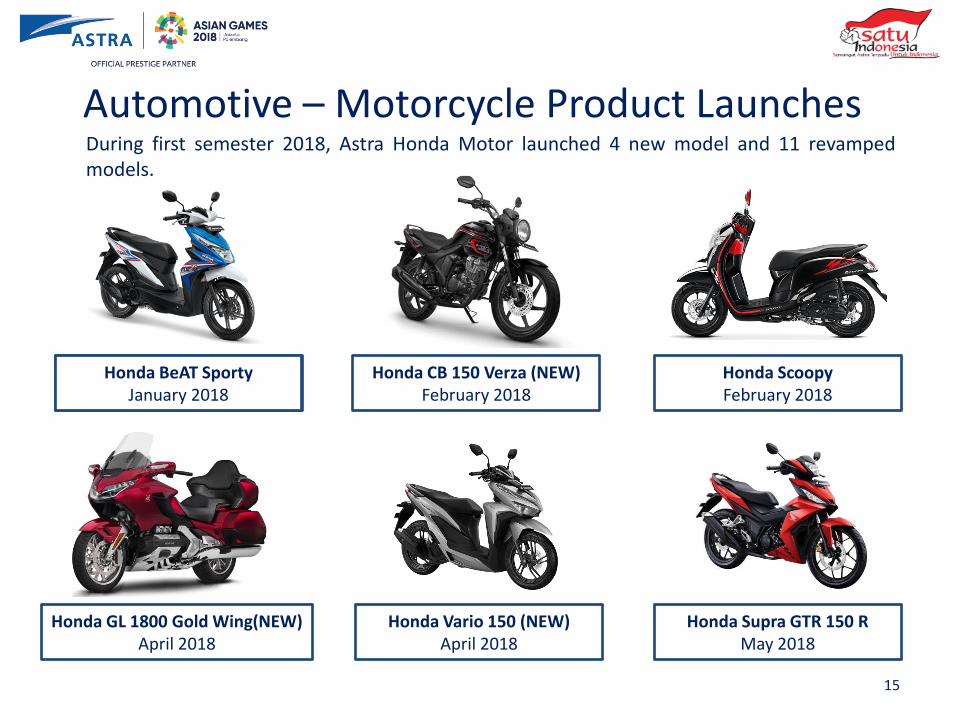
Honda CB 150 Verza (NEW) February 2018
During first semester 2018, Astra Honda Motor launched 4 new model and 11 revamped models.
15
Honda Vario 150 (NEW) April 2018
Honda Supra GTR 150 R May 2018
Honda GL 1800 Gold Wing(NEW) April 2018
Honda Scoopy February 2018
Honda BeAT Sporty January 2018
Automotive – Motorcycle Product Launches
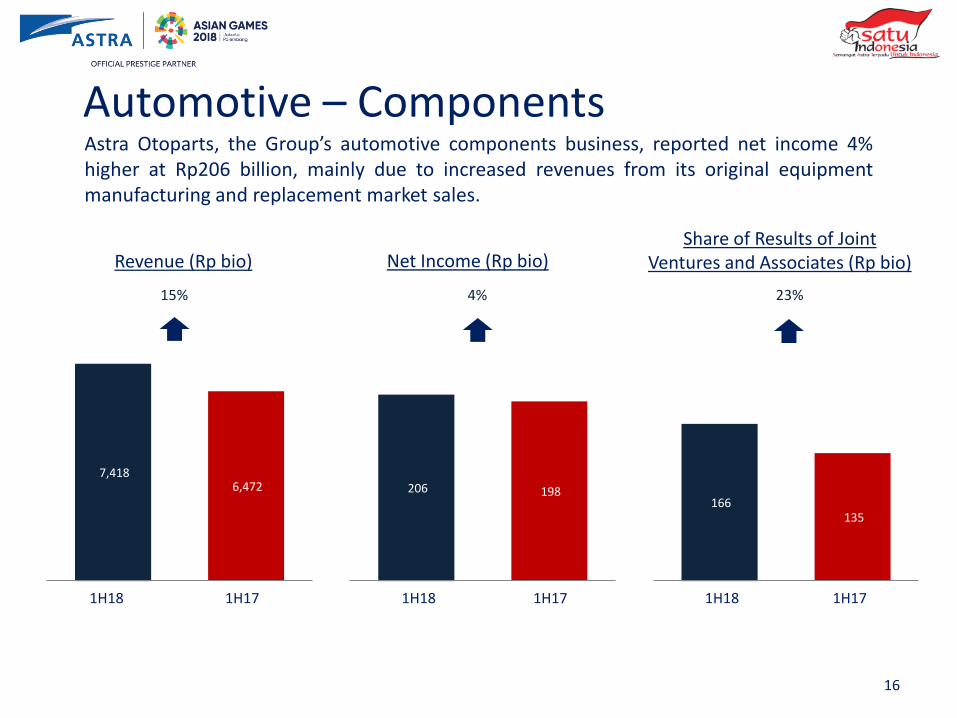
166 135
1H18 1H17
206 198
1H18 1H17
7,418 6,472
1H18 1H17
Astra Otoparts, the Group’s automotive components business, reported net income 4% higher at Rp206 billion, mainly due to increased revenues from its original equipment manufacturing and replacement market sales.
16
Net Income (Rp bio) Revenue (Rp bio)
15% 4%
Share of Results of Joint Ventures and Associates (Rp bio)
23%
1H18 1H17 1H18 1H17 1H18 1H17
Automotive – Components
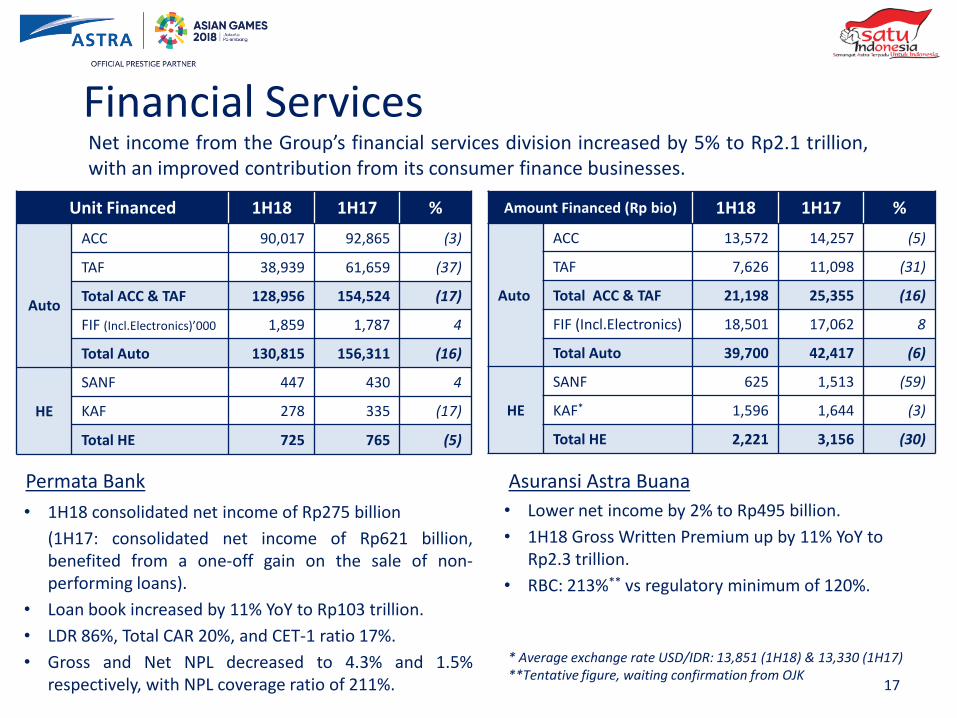
Net income from the Group’s financial services division increased by 5% to Rp2.1 trillion, with an improved contribution from its consumer finance businesses. .
17
Financial Services
Permata Bank
* Average exchange rate USD/IDR: 13,851 (1H18) & 13,330 (1H17) **Tentative figure, waiting confirmation from OJK
Asuransi Astra Buana
• Lower net income by 2% to Rp495 billion.
• 1H18 Gross Written Premium up by 11% YoY to Rp2.3 trillion.
• RBC: 213%** vs regulatory minimum of 120%.
Unit Financed 1H18 1H17 %
Auto
ACC 90,017 92,865 (3)
TAF 38,939 61,659 (37)
Total ACC & TAF 128,956 154,524 (17)
FIF (Incl.Electronics)’000 1,859 1,787 4
Total Auto 130,815 156,311 (16)
HE
SANF 447 430 4
KAF 278 335 (17)
Total HE 725 765 (5)
Amount Financed (Rp bio) 1H18 1H17 %
Auto
ACC 13,572 14,257 (5)
TAF 7,626 11,098 (31)
Total ACC & TAF 21,198 25,355 (16)
FIF (Incl.Electronics) 18,501 17,062 8
Total Auto 39,700 42,417 (6)
HE
SANF 625 1,513 (59)
KAF* 1,596 1,644 (3)
Total HE 2,221 3,156 (30)
• 1H18 consolidated net income of Rp275 billion
(1H17: consolidated net income of Rp621 billion, benefited from a one-off gain on the sale of non-performing loans).
• Loan book increased by 11% YoY to Rp103 trillion.
• LDR 86%, Total CAR 20%, and CET-1 ratio 17%.
• Gross and Net NPL decreased to 4.3% and 1.5% respectively, with NPL coverage ratio of 211%.
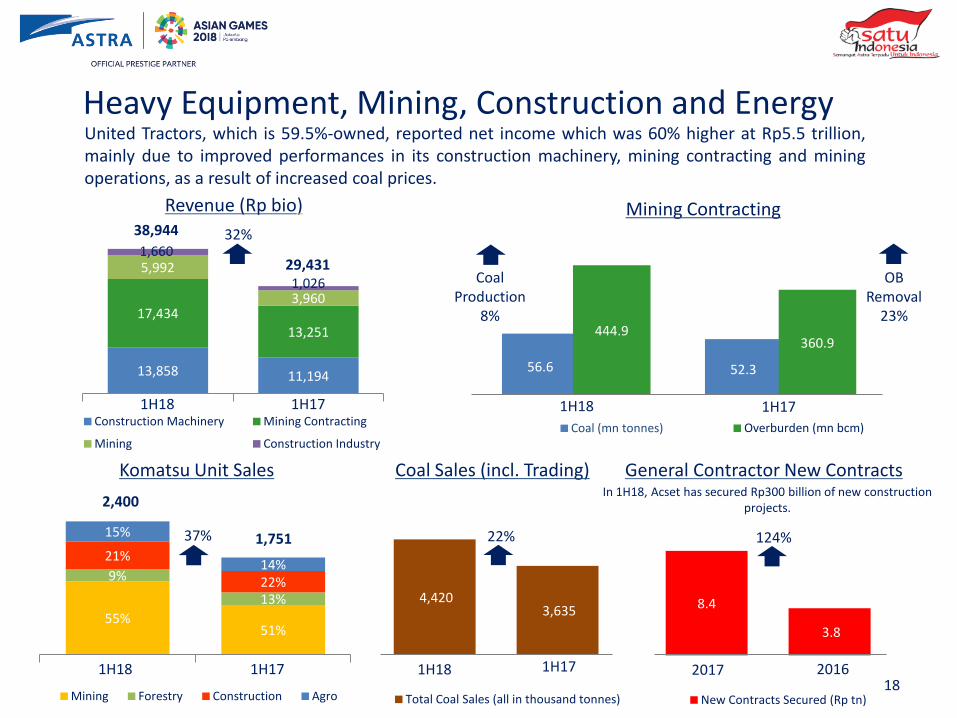
8.4
3.8
New Contracts Secured (Rp tn)
56.6 52.3
Coal (mn tonnes)
444.9 360.9
Overburden (mn bcm)
4,420 3,635
Total Coal Sales (all in thousand tonnes) 18
13,858 11,194
17,434
13,251
5,992
3,960
1,660
1,026
Construction Machinery Mining Contracting
Mining Construction Industry
55% 51%
9%
13%
21%
22%
15%
14%
Mining Forestry Construction Agro
Mining Contracting
Coal Sales (incl. Trading) Komatsu Unit Sales
2,400
Revenue (Rp bio)
1H18 1H17 1H18 1H17
1H18 1H17 1H18 1H17
32%
Coal Production
8%
OB Removal
23%
22% 37%
United Tractors, which is 59.5%-owned, reported net income which was 60% higher at Rp5.5 trillion, mainly due to improved performances in its construction machinery, mining contracting and mining operations, as a result of increased coal prices.
38,944
29,431
1,751
General Contractor New Contracts
Heavy Equipment, Mining, Construction and Energy
2016 2017
In 1H18, Acset has secured Rp300 billion of new construction projects.
124%
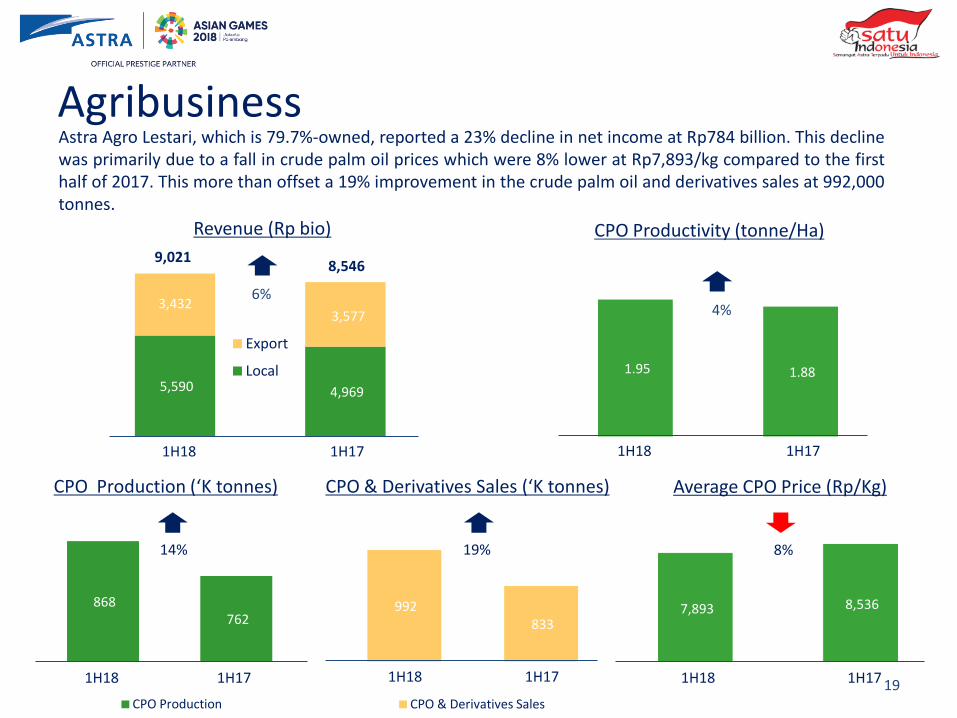
7,893 8,536 992 833
CPO & Derivatives Sales
19
868 762
CPO Production
1.95 1.88 5,590 4,969
3,432 3,577
Export
Local
Revenue (Rp bio)
CPO Production (‘K tonnes)
CPO Productivity (tonne/Ha)
1H18 1H17
6% 4%
14%
1H18 1H17
1H18 1H17 1H18 1H17
19%
Astra Agro Lestari, which is 79.7%-owned, reported a 23% decline in net income at Rp784 billion. This decline was primarily due to a fall in crude palm oil prices which were 8% lower at Rp7,893/kg compared to the first half of 2017. This more than offset a 19% improvement in the crude palm oil and derivatives sales at 992,000 tonnes.
CPO & Derivatives Sales (‘K tonnes)
1H18 1H17
Agribusiness
Average CPO Price (Rp/Kg)
8%
9,021 8,546
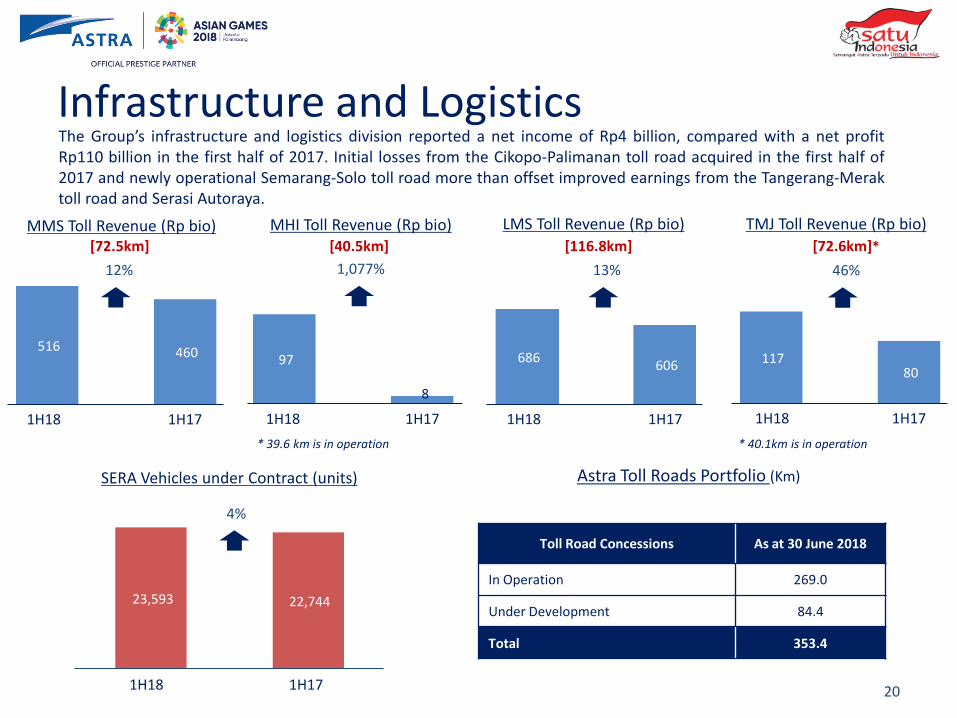
23,593 22,744
117 80
516 460
SERA Vehicles under Contract (units)
MMS Toll Revenue (Rp bio)
1H18 1H17
1H18 1H17
4%
12%
Infrastructure and Logistics
97
8
MHI Toll Revenue (Rp bio)
1H18 1H17
686 606
LMS Toll Revenue (Rp bio)
1H18 1H17
13% 1,077% 1H18 1H17
TMJ Toll Revenue (Rp bio)
46%
Toll Road Concessions As at 30 June 2018
In Operation 269.0
Under Development 84.4
Total 353.4
20
The Group’s infrastructure and logistics division reported a net income of Rp4 billion, compared with a net profit Rp110 billion in the first half of 2017. Initial losses from the Cikopo-Palimanan toll road acquired in the first half of 2017 and newly operational Semarang-Solo toll road more than offset improved earnings from the Tangerang-Merak toll road and Serasi Autoraya.
Astra Toll Roads Portfolio (Km)
[72.5km] [116.8km] [72.6km]*
* 40.1km is in operation
[40.5km]
* 39.6 km is in operation
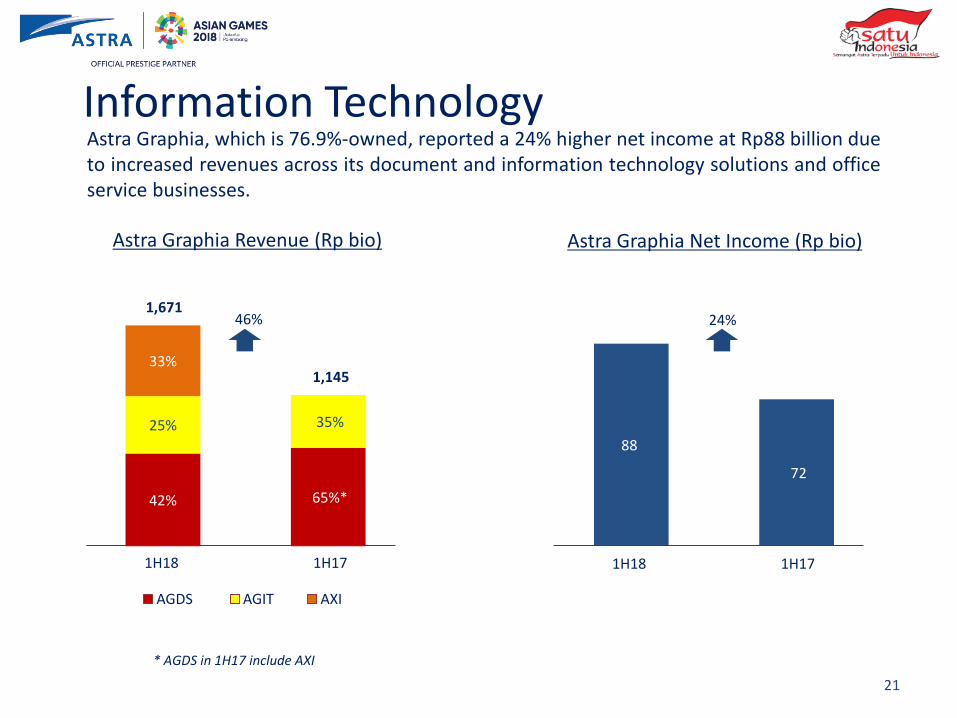
37% 1,543
25% 1,134
38% 113
AGDS AGIT AXI
42% 65%*
25% 35%
33%
Astra Graphia Revenue (Rp bio)
1H18 1H17
1,671
1,145
46%
88
72
Astra Graphia Net Income (Rp bio)
1H18 1H17
24%
Astra Graphia, which is 76.9%-owned, reported a 24% higher net income at Rp88 billion due to increased revenues across its document and information technology solutions and office service businesses.
21
Information Technology
* AGDS in 1H17 include AXI
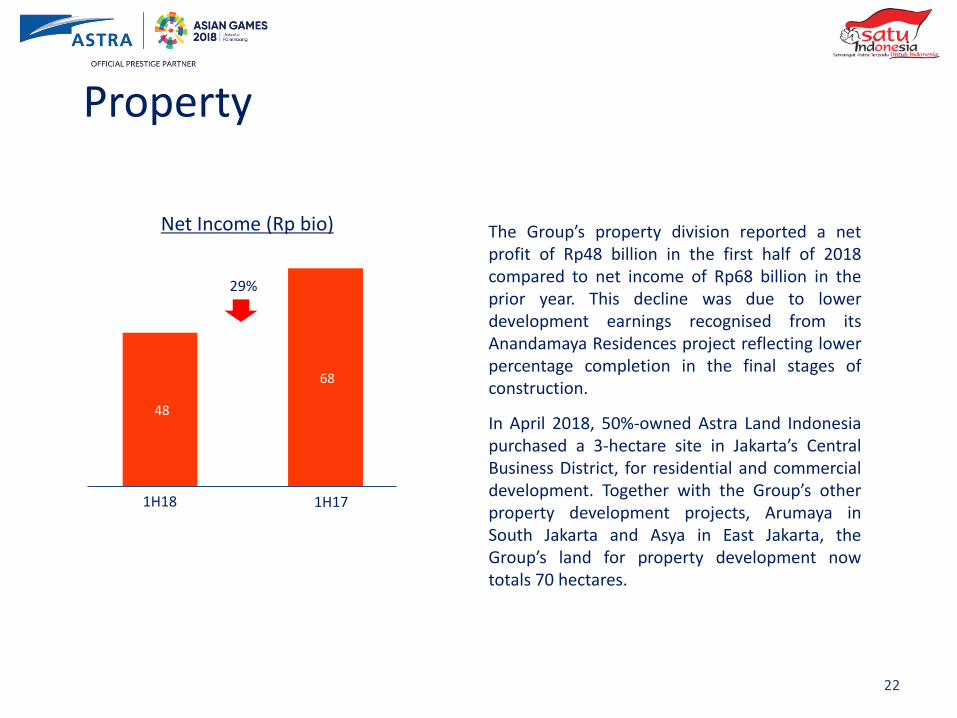
48
68
Net Income (Rp bio)
1H18 1H17
In April 2018, 50%-owned Astra Land Indonesia purchased a 3-hectare site in Jakarta’s Central Business District, for residential and commercial development. Together with the Group’s other property development projects, Arumaya in South Jakarta and Asya in East Jakarta, the Group’s land for property development now totals 70 hectares.
29%
The Group’s property division reported a net profit of Rp48 billion in the first half of 2018 compared to net income of Rp68 billion in the prior year. This decline was due to lower development earnings recognised from its Anandamaya Residences project reflecting lower percentage completion in the final stages of construction.
22
Property
Appendices
23
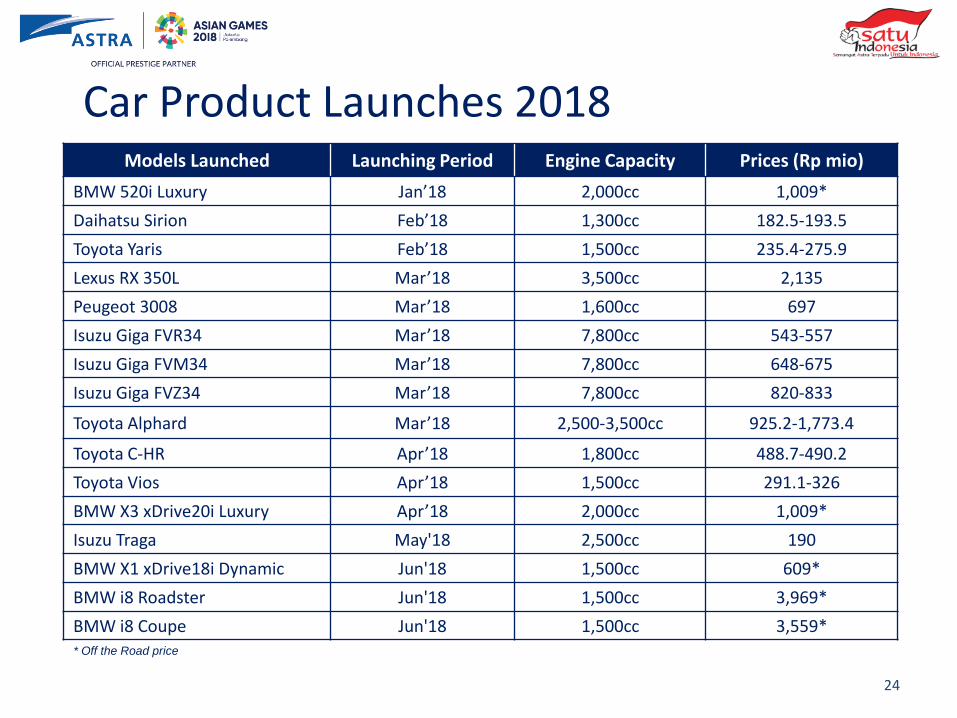
Models Launched Launching Period Engine Capacity Prices (Rp mio)
BMW 520i Luxury Jan’18 2,000cc 1,009*
Daihatsu Sirion Feb’18 1,300cc 182.5-193.5
Toyota Yaris Feb’18 1,500cc 235.4-275.9
Lexus RX 350L Mar’18 3,500cc 2,135
Peugeot 3008 Mar’18 1,600cc 697
Isuzu Giga FVR34 Mar’18 7,800cc 543-557
Isuzu Giga FVM34 Mar’18 7,800cc 648-675
Isuzu Giga FVZ34 Mar’18 7,800cc 820-833
Toyota Alphard Mar’18 2,500-3,500cc 925.2-1,773.4
Toyota C-HR Apr’18 1,800cc 488.7-490.2
Toyota Vios Apr’18 1,500cc 291.1-326
BMW X3 xDrive20i Luxury Apr’18 2,000cc 1,009*
Isuzu Traga May'18 2,500cc 190
BMW X1 xDrive18i Dynamic Jun'18 1,500cc 609*
BMW i8 Roadster Jun'18 1,500cc 3,969*
BMW i8 Coupe Jun'18 1,500cc 3,559*
24
Car Product Launches 2018
* Off the Road price
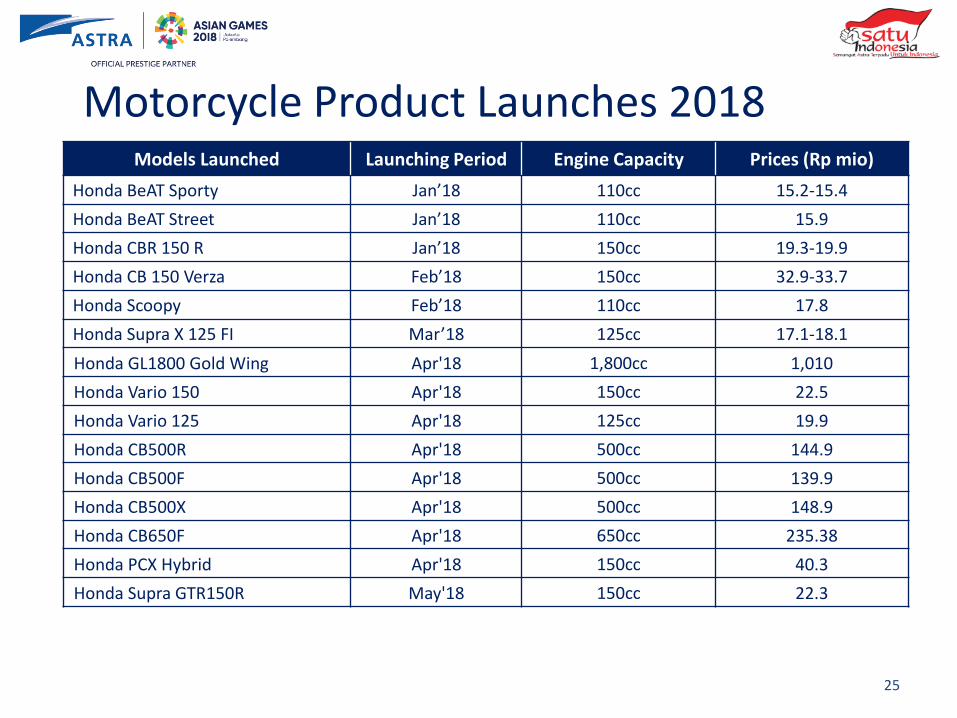
Models Launched Launching Period Engine Capacity Prices (Rp mio)
Honda BeAT Sporty Jan’18 110cc 15.2-15.4
Honda BeAT Street Jan’18 110cc 15.9
Honda CBR 150 R Jan’18 150cc 19.3-19.9
Honda CB 150 Verza Feb’18 150cc 32.9-33.7
Honda Scoopy Feb’18 110cc 17.8
Honda Supra X 125 FI Mar’18 125cc 17.1-18.1
Honda GL1800 Gold Wing Apr'18 1,800cc 1,010
Honda Vario 150 Apr'18 150cc 22.5
Honda Vario 125 Apr'18 125cc 19.9
Honda CB500R Apr'18 500cc 144.9
Honda CB500F Apr'18 500cc 139.9
Honda CB500X Apr'18 500cc 148.9
Honda CB650F Apr'18 650cc 235.38
Honda PCX Hybrid Apr'18 150cc 40.3
Honda Supra GTR150R May'18 150cc 22.3
25
Motorcycle Product Launches 2018
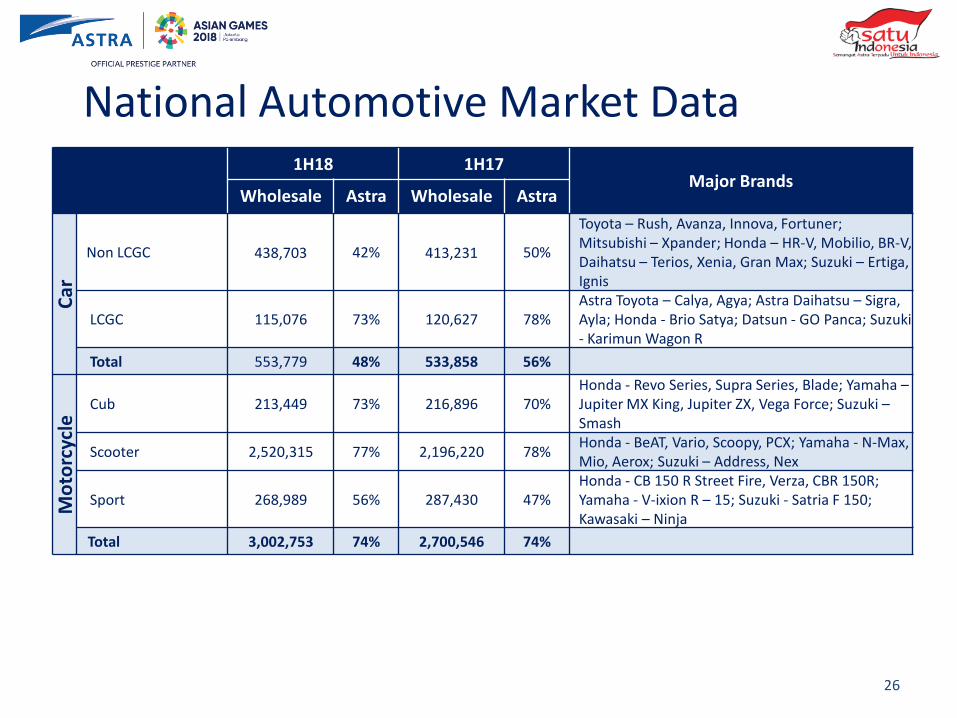
1H18 1H17 Major Brands
Wholesale Astra Wholesale Astra
Car
Non LCGC 438,703 42% 413,231 50%
Toyota – Rush, Avanza, Innova, Fortuner; Mitsubishi – Xpander; Honda – HR-V, Mobilio, BR-V, Daihatsu – Terios, Xenia, Gran Max; Suzuki – Ertiga, Ignis
LCGC 115,076 73% 120,627 78% Astra Toyota – Calya, Agya; Astra Daihatsu – Sigra, Ayla; Honda - Brio Satya; Datsun - GO Panca; Suzuki - Karimun Wagon R
Total 553,779 48% 533,858 56%
Mo
torc
ycle
Cub 213,449 73% 216,896 70% Honda - Revo Series, Supra Series, Blade; Yamaha – Jupiter MX King, Jupiter ZX, Vega Force; Suzuki – Smash
Scooter 2,520,315 77% 2,196,220 78% Honda - BeAT, Vario, Scoopy, PCX; Yamaha - N-Max, Mio, Aerox; Suzuki – Address, Nex
Sport 268,989 56% 287,430 47% Honda - CB 150 R Street Fire, Verza, CBR 150R; Yamaha - V-ixion R – 15; Suzuki - Satria F 150; Kawasaki – Ninja
Total 3,002,753 74% 2,700,546 74%
26
National Automotive Market Data
27
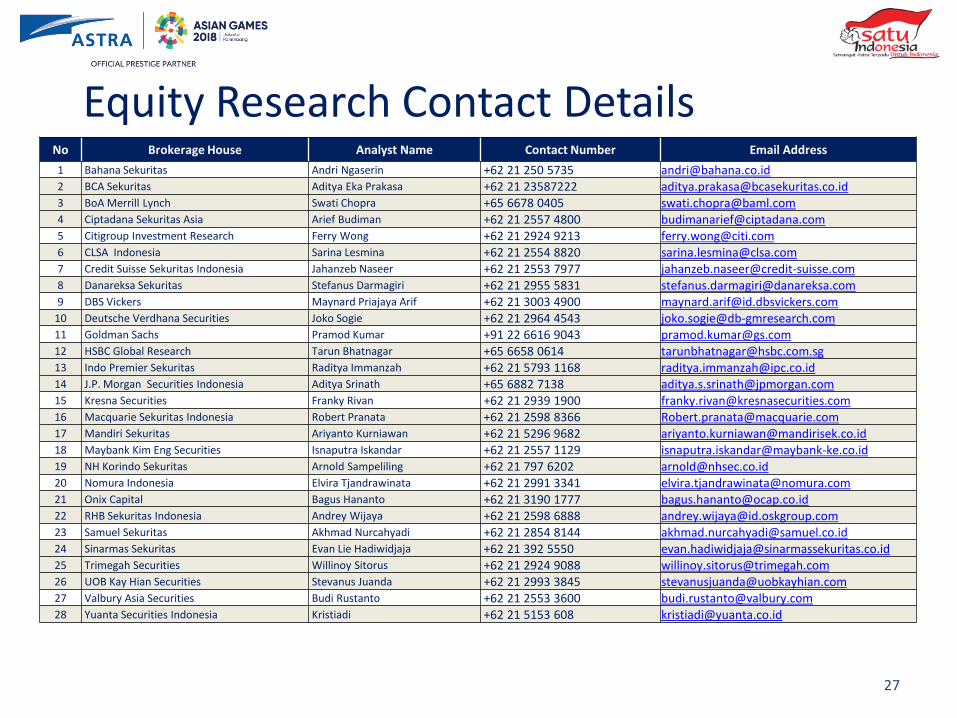
No Brokerage House Analyst Name Contact Number Email Address
1 Bahana Sekuritas Andri Ngaserin +62 21 250 5735 [email protected] 2 BCA Sekuritas Aditya Eka Prakasa +62 21 23587222 [email protected] 3 BoA Merrill Lynch Swati Chopra +65 6678 0405 [email protected] 4 Ciptadana Sekuritas Asia Arief Budiman +62 21 2557 4800 [email protected] 5 Citigroup Investment Research Ferry Wong +62 21 2924 9213 [email protected] 6 CLSA Indonesia Sarina Lesmina +62 21 2554 8820 [email protected] 7 Credit Suisse Sekuritas Indonesia Jahanzeb Naseer +62 21 2553 7977 [email protected] 8 Danareksa Sekuritas Stefanus Darmagiri +62 21 2955 5831 [email protected] 9 DBS Vickers Maynard Priajaya Arif +62 21 3003 4900 [email protected]
10 Deutsche Verdhana Securities Joko Sogie +62 21 2964 4543 [email protected] 11 Goldman Sachs Pramod Kumar +91 22 6616 9043 [email protected] 12 HSBC Global Research Tarun Bhatnagar +65 6658 0614 [email protected] 13 Indo Premier Sekuritas Raditya Immanzah +62 21 5793 1168 [email protected] 14 J.P. Morgan Securities Indonesia Aditya Srinath +65 6882 7138 [email protected] 15 Kresna Securities Franky Rivan +62 21 2939 1900 [email protected] 16 Macquarie Sekuritas Indonesia Robert Pranata +62 21 2598 8366 [email protected] 17 Mandiri Sekuritas Ariyanto Kurniawan +62 21 5296 9682 [email protected] 18 Maybank Kim Eng Securities Isnaputra Iskandar +62 21 2557 1129 [email protected] 19 NH Korindo Sekuritas Arnold Sampeliling +62 21 797 6202 [email protected] 20 Nomura Indonesia Elvira Tjandrawinata +62 21 2991 3341 [email protected] 21 Onix Capital Bagus Hananto +62 21 3190 1777 [email protected] 22 RHB Sekuritas Indonesia Andrey Wijaya +62 21 2598 6888 [email protected] 23 Samuel Sekuritas Akhmad Nurcahyadi +62 21 2854 8144 [email protected] 24 Sinarmas Sekuritas Evan Lie Hadiwidjaja +62 21 392 5550 [email protected] 25 Trimegah Securities Willinoy Sitorus +62 21 2924 9088 [email protected] 26 UOB Kay Hian Securities Stevanus Juanda +62 21 2993 3845 [email protected] 27 Valbury Asia Securities Budi Rustanto +62 21 2553 3600 [email protected] 28 Yuanta Securities Indonesia Kristiadi +62 21 5153 608 [email protected]
Equity Research Contact Details
For further information please contact:
PT Astra International Tbk
Corporate Investor Relations
P: (+62 21) 652 2555
F: (+62 21) 6530 4953
28