Embed Size (px)
Citation preview

University of BoltonUBIR: University of Bolton Institutional Repository
Psychology: Reports Psychology
2006
Relationships between demographiccharacteristics, job-seeking behaviours and job-seeking outcomes among new UK graduates.John P. CharltonUniversity of Bolton, [email protected]
Susan TaylorUniversity of Bolton
Audrey PetersonUniversity of Bolton
Andrea Taylor
Rob RanyardUniversity of Bolton, [email protected]
See next page for additional authors
This Report is brought to you for free and open access by the Psychology at UBIR: University of Bolton Institutional Repository. It has been acceptedfor inclusion in Psychology: Reports by an authorized administrator of UBIR: University of Bolton Institutional Repository. For more information,please contact [email protected].
Digital Commons CitationCharlton, John P.; Taylor, Susan; Peterson, Audrey; Taylor, Andrea; Ranyard, Rob; and Hewson, Claire. "Relationships betweendemographic characteristics, job-seeking behaviours and job-seeking outcomes among new UK graduates.." (2006). Psychology:Reports. Paper 4.http://digitalcommons.bolton.ac.uk/psych_reports/4

AuthorsJohn P. Charlton, Susan Taylor, Audrey Peterson, Andrea Taylor, Rob Ranyard, and Claire Hewson
This report is available at UBIR: University of Bolton Institutional Repository: http://digitalcommons.bolton.ac.uk/psych_reports/4

Research Report
Relationships Between Demographic Characteristics, Job-Seeking
Behaviours and Job-Seeking Outcomes Among New UK
Graduates
John P. Charlton, Susan Taylor, Audrey Peterson,
Andrea Taylor, Rob Ranyard & Claire Hewson
Department of Psychology & Life Sciences
University of Bolton

2
Summary
This is the second in a series of three research reports resulting from a project funded by the
European Social Fund and the University of Bolton which sought to provide information of
use in reducing the difference in post-higher education employment rates between White
British and ethnic minority UK graduates. The first report dealt with the analysis of a large
data set concerning differences in factors which may have an influence upon peoples’ job-
seeking activities and the types of job that they are likely to target. This second report
concerns graduates’ job-seeking behaviours and their outcomes, and details how some of the
factors considered in the first report relate to these behaviours and outcomes. Both this report
and the first report are largely quantitative in nature. However, in a third report we take a
more qualitative approach, presenting a small number of case studies viewing things from the
employer’s perspective. In all three reports discussion of theoretical issues is limited, priority
being given to the reporting of a wide range of statistical analyses before we submit more
theoretically orientated reports focussing upon selected aspects of the data for journal
publication at a later date.
The data considered in the present report was obtained from a sample of 140 UK
students graduating from English and Welsh universities in 2004 and 2005 who, shortly
before their graduation, provided data via paper questionnaires and, for some participants, via
the Internet, relating to their demographic characteristics, their perceptions of the difficulties
that would be experienced by people of their ethnicity in obtaining various jobs, and their
occupational values. People were also asked to complete a structured dairy about their job-
seeking activities for up to six months after their graduation.
It was found that a six percentage-point difference exists whereby ethnic minority
graduates were less likely to have found jobs six months after graduation. This mirrors the
national statistics. However, ethnic minority graduates who did find a job were more likely to
have obtained a graduate-level job than the White British graduates, this suggesting that
although the headline statistics show an ethnic minority disadvantage in post-HE job-seeking
outcomes with respect to employment rates six months after graduation, the picture may not
be as discouraging for ethnic minority graduates when quality of job-seeking outcomes for
those finding employment is considered.
White graduates were found to make greater use of Job Centres when applying for
jobs, and greater use of Job Centres was found to be associated with a lower likelihood of
obtaining a graduate-level job. However, despite these two findings, ethnic differences in Job
Centre usage were not found to explain the ethnic difference in success in obtaining graduate-
level jobs.
While in our first report we found that ethnic minority graduates perceive it as more
difficult for someone of their own ethnicity to obtain jobs than White graduates, in the present
analyses we found little evidence that perceived difficulties in obtaining jobs had an influence
on either job-seeking success or job-seeking methods used. Thus, there was no self-fulfilling
prophecy effect whereby perceptions of difficulties led to poorer job-seeking outcomes.
Therefore greater ethnic minority perceptions of difficulties do not appear to lead to
disadvantage. Also, there was little evidence that ethnic minority graduates were more likely
to use their friends and family and / or local community contacts to obtain jobs because of
fears of discrimination if they competed more widely in the job market. However, although
such evidence was statistically unreliable, there was a small amount of evidence that where
ethnic minority graduates do use personal contacts this may result in a disadvantage in terms
of status of job obtained compared to similar usage by White graduates. Nevertheless, given
that ethnic minority graduates’ job-seeking resulted in a greater likelihood of obtaining a

3
graduate job relative to White graduates, any such effects were more than counterbalanced by
other factors.
The data did not bear out the notions that women graduates are likely to enjoy less
success in the graduate job market because they fear they will experience gender
discrimination in applying for higher status posts or because they stereotype such posts as
being more suitable for men. Indeed, in general, few statistically reliable gender differences
were found. Thus, for example, although there appeared to be a large amount of Internet
usage in making job applications such usage did not vary very much across gender and ethnic
boundaries. This suggests that although females have often been shown to be less positively
disposed towards using computers than males, and ethnic minority graduates may be
disproportionately likely to come from less wealthy social backgrounds and therefore may
have less ready access to computers, neither of these differences seems to be having a
negative impact upon these demographic groups’ use of the Internet for job-seeking. Rather, it
is concluded that the increasing tendency of companies to use the Internet for recruitment may
actually be helpful in resolving inequalities in access to jobs.
A large number of other findings are discussed, and as concrete illustrations of job-
seeking behaviours, descriptions of the job-seeking processes engaged in by four ethnic
minority graduates are presented in an appendix.

4
Contents
1. General introduction ………………………………………………………………… 5
2. The graduates participating …………………………………………………………. 6
3. The materials used and the data collection procedure ………………………………. 8
4. Findings ……………………………………………………………………………...10
4.1 Predictors of job-seeking behaviours ……………………………………….. 10
4.1.1 Relationships between perceived difficulties in obtaining
jobs and job-seeking behaviours …………………..………………... 10
4.1.2 Ethnicity and job-seeking behaviours …………………………………... 16
4.1.3 Gender and job-seeking behaviours ……………………………………. 18
4.2. Predictors of job-seeking outcomes ………………………………………… 21
4.2.1. Demographic factors and job-seeking outcomes ……………………….. 21
4.2.2 Job-seeking behaviours and job-seeking outcomes …………………….. 24
4.2.3 Perceived difficulties in acquiring a job and job-seeking outcomes …… 29
4.2.4 Occupational values and job-seeking outcomes …………………………31
4.2.5 Do differences in Job Centre usage explain the ethnic difference
in Employment Quality? ……………………………………………. 35
5. General conclusions ………………………………………………………………… 35
References ……………………………………………………………………………… 38
Appendix: Descriptions of Selected Cases ……………………………………………... 39

5
Section One: General introduction
With the expansion of British higher education (HE) into a mass education system in the last
two decades, when they approach the stage of leaving, many students are likely to view their
forthcoming attempts to embark upon a career by entering the job market with foreboding
(see e.g. Buckham, 1998). This is likely to be particularly true of students from ethnic
minority backgrounds since, despite equal opportunities legislation, UK first destination
statistics published by the Higher Education Statistics Agency (HESA) show more
unemployment among ethnic minorities. For example, statistics for 2000/2001 showed 11.4%
of ethnic minority graduates as still seeking work six months after graduation compared with
6.5% of White graduates (HESA, 2002). Higher ethnic minority unemployment among
graduates mirrors the situation for ethnic Pakistani, Bangladeshi and Black Caribbean adults
more generally, these groups experiencing '…significantly higher unemployment and lower
earnings than Whites' (Cabinet Office Strategy Unit, 2003). There is also evidence that
members of some ethnic minority groups may be less likely to obtain employment at a level
that is commensurate with their education, and that members of the White majority are more
likely than members of other ethnic groups to be in jobs for which they are under-qualified
(Battu & Sloane, 2004). Consistent with this, ethnic minority graduates have more difficulty
accessing graduate-level jobs than do White graduates (Connor, La Valle, Tackey &
Perryman, 1996). Research by the Centre for Higher Education Research and Information
(CHERI, 2002) reveals that some part of the labour market disadvantage experienced by
graduates from ethnic minority backgrounds and those from less advantaged socio-economic
backgrounds is due to educational factors such as institution, subject studied, entry
qualifications and degree level. However, even controlling for such factors, socio-economic
background, age and ethnicity affect employment prospects (CHERI, 2002).
The work presently described was part of a project examining ethnicity and gender
differences between graduating UK students entering the job market, and was carried out with
the aim of providing information to parties concerned with reducing the ethnic inequalities
previously mentioned. While the reduction of these inequalities is obviously important for
improving the life chances of individual ethnic minority graduates, it is also important for
societal well-being generally. Further, it is particularly important to study the transition
between higher education and work because a person’s choice of career made at the start of
their working life is likely to be the most important occupational decision they will ever
make, and choosing a job with few prospects or a job that constitutes a poor fit with one’s
personal characteristics, expectations or needs is likely to culminate in job dissatisfaction
(Melamed, 1996), and may have detrimental effects far into the future.
In a first report resulting from the project we have reported the results of analyses of a
large data set concerning ethnicity and gender differences in perceived difficulties in
obtaining a job, occupational values and influences on type of job targeted. Among other
things, these results showed that graduating students of both sexes perceive it as more
difficult for females than males to acquire jobs, and that graduating Black and Pakistani /
Bangladeshi students (but not Indian students) perceive greater difficulty than members of the
White majority. Gender stereotyping of jobs was also found to exist, with professional mainly
non-person-centred jobs being seen as more difficult to obtain by females and more person-
centred jobs being seen as more difficult to obtain by males. Findings involving occupational
values included the observation that, females, and to a lesser extent ethnic minorities, attach
greater value to equality in the workplace. As would be expected, it was also found that,
relative to White graduates, ethnic minority graduates’ choices of job to target are more
influenced by the experience of, or possibility of, discrimination, and the same was also true
for White British females when compared with males from the same ethnic group.

6
Importantly, the influence of friends, family and community was found to be greater for
ethnic minority graduates, and their choices were also said to be more dependent upon
geographical constraints and financial considerations.
In this report, which presents and discusses further analyses of data for a subset of the
people providing data for the first report, we examine recent graduates’ job-seeking
behaviours and their outcomes and consider how some of the factors considered in the first
report relate to these behaviours and outcomes.
Section Two: The graduates participating
Data was collected for people graduating in both 2004 and 2005. Requirements for
participation were that people had to be graduating (or recently graduated) full-time, final
year students, and had to be seeking or intending to seek employment in the UK.
Data collection was in two phases. In the first phase people were asked to complete a
questionnaire booklet or Internet questionnaire (see below) and offered entry to a simple
competition with a total of £350 in three cash prizes as an incentive. In this phase people were
also asked whether they would agree to participate in a second phase which involved
completing a job-seeking diary for up to six months after their graduation (see below) with a
£50 incentive being offered for participation. As would be expected, there was a large drop in
the numbers of people participating between the first and second phases of the study, only
around 13% of people who participated in the first phase also participating in the second
phase. A separate research report deals with the analyses relating to the data set obtained for
the first phase only, which was obviously larger than the data set presently considered in
terms of the number of graduates involved (see Charlton, Taylor, Ranyard & Hewson, 2006),
although two factor analyses reported below did use the data set from the first phase.
A total of 157 people graduating from 13 English and Welsh universities agreed to
participate in both phases. However, the analyses reported here excluded groups such as
White Europeans and only considered data for the same ethnic minority groupings as those
considered by Battu and Sloane (2004). A gender by ethnicity breakdown of these graduates
is presented in Table 1. Missing data for some participants also resulted in sample sizes for
analyses reported deviating from the total numbers of participants recruited. Because of the
low sample sizes for the ethnic minority groups it was necessary to combine them into a
single group for the analyses reported. Summarising the figures in Table 1, in the data set
analysed, for the White group there were 28 males (mean age on starting university = 21.36
years, SD = 6.34 years) and 89 females (mean age on starting university = 20.70 years, SD =
6.39 years). For the ethnic minority group there were 8 males (mean age on starting university
= 24.88 years, SD = 9.76 years) and 15 females (mean age on starting university = 22.20
years, SD = 6.16 years).
Frequencies for socio-economic background across the two main ethnic
categorisations in the analyses are given in Table 2. The occupational classifications in this
table are those defined by the tripartite classification of the UK Office for National Statistics
based upon previous occupation for mature students or occupation of highest household
earner for students under 21 on starting their course.

7
Table 1: Sample sizes by gender and ethnicity of the participants for whom data was
analysed.
_________________________________________________________
Gender
Male Female Total
_________________________________________________________
Ethnicity
White British 28 89 117
Indian 4 5 9
Pakistani / Bangladeshi 0 2 2
Caribbean 0 4 4
African 3 3 6
Chinese 1 1 2
Total 36 104 140
_________________________________________________________
Table 2: Frequency statistics for socio-economic background across the two ethnic
categorisations for whom data was analysed (percentages within ethnic groups are
given in parentheses under the two ethnicity columns).
____________________________________________________________________
Ethnicity
White British Minority Total
___________________________________________________________________
Socio-economic background
Managerial and professional occupations 62 (53%) 7 (30%) 69 (49%)
Intermediate occupations 18 (15%) 7 (30%) 25 (18%)
Routine and semi-routine occupations 15 (13%) 3 (13%) 18 (13%)
Never worked or long-term unemployed 2 (2%) 2 (9%) 4 (3%)
Not stated or unclear 20 (17%) 4 (17%) 24 (17%)
Total 117 23 140
___________________________________________________________________
From Table 2 it can be seen that there were proportionately more people from the
most advantaged socio-economic background (managerial and professional occupations)
among the White participants compared to the ethnic minority participants and that this was
reversed for the second most advantaged background classification (intermediate
occupations). The ethnic minority category also included proportionately more people in the
never worked or long-term unemployed category.

8
Section Three: The Materials Used and the Data Collection Procedure
Two types of data were collected. First, psychological and demographic data using
questionnaire booklets and/ or Internet questionnaires, and, second, job-seeking methods and
outcomes data using a job-seeking diary.
With respect to the booklets / questionnaires, for the 2004 cohort a paper questionnaire
booklet was used. The 2005 participants were given the choice of completing either a paper
booklet or an Internet-based questionnaire. The contents of these materials differed across the
two cohorts. To increase sample sizes, for the 2005 cohort there were only around half as
many questions in an initial paper-based questionnaire booklet and an Internet-based
questionnaire as there were in the 2004 version. For the 2005 cohort, people who volunteered
to take part in the job-seeking phase of the project were sent a further paper booklet
containing the questions omitted from the initial booklet / Internet questionnaire so that the
data sets for both cohorts were the same.
In the interests of brevity, we confine ourselves here to a description of the
questionnaire booklet used for the 2004 cohort. However, in one form or another the 2005
graduates eventually provided the same data.
The questionnaire booklet consisted of six questionnaires. However, only the first
three questionnaires are relevant to the present report and therefore we restrict ourselves to a
description of these.
The first questionnaire elicited demographic information: gender, nationality, socio-
economic background (the occupation of the highest household earner if the participant was
21 years or below on entry to HE, or the participant’s previous occupation if they were above
21 on entry), age on commencement of course, HE course details, and self-reported ethnic
background.
The second questionnaire consisted of two subsections. One asked people to rate 20
occupations, according to how difficult people thought it currently was in the UK for suitably
qualified men of their ethnic group to obtain each job. The other asked people to rate the same
occupations according to how difficult they thought it was in the UK for women of their
ethnic group to obtain each job. The 20 occupations were selected from the eight analytic
class categorisation in The National Statistics Socio-Economic Classification User Manual
(Office for National Statistics, 2004). Six of the occupations (Accountant, Architect, Doctor,
Psychologist, Solicitor, and University Lecturer) were drawn from Analytic Class 1,
subdivision 1.2 (Higher professional occupations), ten (Air Traffic Controller, Newspaper
Journalist, Physiotherapist, Social Worker, Hospital Laboratory Technician, Manager in a
Private Company, Paramedic, Sales Representative, and Youth and Community Worker) from
Analytic Class 2 (Lower managerial and professional occupations), two (Call Centre
Operative and Police Officer) from Analytic Class 3 (Intermediate occupations), one (Small
Business Owner) from Analytic Class 4 (Small employers and own account workers), and one
(Electrician) from Analytic Class 5 (Lower supervisory and technical occupations). These
jobs were selected because it was considered that they represented a spectrum of jobs that
participants would be familiar with and that participants would have an understanding of what
they entail. The occupations from the different analytic classes were combined and presented
in alphabetical order. Responses were on a 5-point rating scale (1 = Not at all difficult; 2 =
Not very difficult; 3 = Moderately difficult; 4 = Very difficult; 5 = Extremely difficult).
Questionnaire Three elicited data on participants’ occupational values by virtue of
asking them to rate 20 characteristics of occupations according to their perceptions of the
characteristics’ importance. Ratings were on a seven-point scale with three verbal labels
ranging from Of no Importance, through Moderately Important, to Extremely Important
defining the lowest, middle and highest points of the scale.

9
The other instrument relevant to the present report was the job-seeking diary.
Graduates completed this for six months after graduating or until they obtained a job which
they intended to be their permanent job for the foreseeable future, whichever was sooner. The
diary was in the form of a booklet and was in three parts. The first part obtained information
on job-seeking methods and contacts with employers and consisted of 25 pages in which
graduates recorded the job-seeking method that they used in connection with each job
application that they made, the outcomes of these applications, and ratings of possible reasons
for any lack of success (if this part of the diary became full, graduates requested another
diary). In the second part of the diary, graduates recorded all the time they spent each week
looking for employment, to the nearest hour, regardless of whether this resulted in contact
with an employer and/or a job application. In the final part, the graduate provided details of
any job that they took that they intended to be their permanent job for the foreseeable future
(i.e. a job that they did not intend to be a stop-gap job until they could find something better
or more suitable).
As previously mentioned, participants were recruited over a two year period. In year 1
(2004) two universities, one pre-1992 university and one post-1992 university, agreed to
collaborate with the researching institution in recruitment of their own graduates. People
received details about participation by mail from their university, together with a request form
for participation to be returned to the researching institution. The paper questionnaires were
sent out by and returned completed to, the researchers mainly by post.
A second round of data collection was undertaken in 2005 to increase participant
numbers. First, two different universities from the previous year agreed to collaborate with
paper questionnaire data collection. Both of these were post-1992 universities, one in the
English Midlands and one in London. In these universities, questionnaires were distributed
and collected by two paid data collectors per institution. These data collectors were instructed
to target a purposive sample (equal numbers of males and females from the four ethnic
categories under investigation). Students who expressed an interest in participating and were
eligible were presented with the paper questionnaires. Information presented with the
questionnaire gave brief details of the purpose of the research, and assurances of
confidentiality and anonymity were offered. Those who met the criteria, and decided to
participate were offered the option of being entered into a simple competition / prize draw for
a cash prize. Second, an institution-wide sweep at the university hosting the research was
done, researchers gaining permission to enter classes at the beginning of lectures to distribute
and collect questionnaires. Finally, to further increase representative participation, an
electronic version of the questionnaire was placed on the Internet. Universities and their
careers centres across the UK were supplied with a flyer containing the Web address to pass
to their final year students. Students who completed the Web questionnaire submitted their
responses simply by clicking an appropriate button on completion.
The graduating students volunteered for the second phase of the study by completing
a form along with the first phase questionnaires. They were then sent job-seeking diaries
directly by the researchers and asked to commence completion of the diary as soon as they
started to look for work and to submit the diary by post either when they found a job that they
considered to be permanent or after six months. A slip in the diary allowed participants to
request another diary if they filled their initial diary. Six months after graduation, those
participants who had not submitted diaries were asked to do so. On receipt of the completed
diary / diaries all participants completing diaries were sent a £50 cheque.
10
Section Four: Findings
In this section we present our findings. Following the logical temporal sequence, in a first
subsection we detail our findings for job-seeking behaviours and then in a second subsection
move on to consider job-seeking outcomes.
4.1 Predictors of job-seeking behaviours
4.1.1 Relationships between perceived difficulties in obtaining jobs and job-seeking
behaviours
US studies show that racial discrimination has a great influence upon career-related
behaviours and that it limits the career options that ethnic minorities consider (Swanson &
Fouad, 1999). Thus, in this first group of analyses we considered whether a finding in our first
research report, that graduating members of ethnic minorities perceive that it is harder for
them to get jobs, has implications for the way in which they go about job-seeking.
Specifically, one possibility we considered was whether the fact that ethnic minorities
perceive themselves to be at a disadvantage in the open job market leads some members of
minority groups to restrict their job search activities to ‘word of mouth’ methods (e.g. by
canvassing family members, friends and members of their own ethnic community as to the
availability of job opportunities). We reasoned that, if this was true, this might restrict the
quantity and quality of jobs applied for, and lead to a certain amount of job segregation along
ethnic lines. This possibility was thought to be particularly important since, although towards
the turn of the millennium there had been some alleviation of the situation whereby members
of Caribbean and South Asian communities which first came to Britain after the second world
war were largely employed in low status manual jobs, in general, members of these
communities still occupy a disproportionate number of lower status jobs (Modood, 1998).
Therefore any job opportunities that ethnic minority job-seekers access via their social
networks will also have a disproportionate tendency to be low status. Hence, if ethnic
minorities were shown to have a greater tendency to use social networks as a means of job-
seeking this could result in a cycle which might lock these members of society into lower
status jobs. (Note that, although according to the present reasoning White middle class people
would be less likely to resort exclusively to social networking to uncover job opportunities, to
the extent that they did use such methods, since members of their social network occupy
relatively high status jobs, in stark contrast to the situation that exists for most ethnic minority
people, this would afford them access to more desirable job opportunities.)
Because it was reasonable to suppose that different perceptions might exist for
different types of job, prior to considering relationships between perceived difficulties in
obtaining jobs and job-seeking behaviours it was useful to perform Principal Components
Analysis (PCA) on the perceived difficulties data for the 20 jobs for which data was
collected1. The PCA was performed upon the own gender responses of participants (i.e. for
male respondents, the data for perceptions of the difficulties experienced by males of the
respondents’ own ethnicity, and for female respondents, the data for perceptions of the
difficulties experienced by females of the respondents’ own ethnicity. Using Kaiser’s
criterion, this obliquely rotated (Direct Oblimin) analysis, performed on responses for 287
participants, revealed four components accounting for around 40%, 10%, 8% and 5% of item
1 Note that the present analysis differs from an analysis reported in the first research report in this series in that
the previous analysis involved data from a larger sample on a subset of 10 of the present 20 jobs.

11
variance, the factors accounting for around 64% of item variance overall. These factors were
respectively interpreted as reflecting high status / graduate jobs, caring / socially orientated
jobs, non-graduate jobs, and commercial jobs. It is interesting to note that from Table 3, which
contains the component correlations, it can be seen that there is a medium sized positive
correlation between perceived difficulty in obtaining graduate and non-graduate jobs, this
indicating that, to some extent, participants who saw graduate jobs as difficult to obtain also
tended to see non-graduate jobs as difficult to obtain.
From Table 4, which shows the (rotated) component pattern matrix loadings for the
analysis, it can be seen that although, as is desirable, all variables had at least one high
component loading (defined here as loadings greater than +/- .32), there were some complex
items: items with more than one component loading highly upon them2.
Table 3: Correlations between components in the PCA for perceived difficulties in obtaining
20 jobs.
_________________________________________________________________
High status / Caring / Non-graduate
graduate socially orientated
_________________________________________________________________
High status / graduate ----
Caring / .19 ----
Socially orientated
Non-graduate .43 .06 ----
Commercial .27 .13 .29
_________________________________________________________________
2 While this is not a desirable psychometric property of an instrument where scores for different items are to be
summated to form different subscale scores, this was not considered particularly important in the current
instance since component scores (calculated using the regression method) rather than summated scores were
used (this was the case because summation would have resulted in the derivation of some subscales with
undesirably low numbers of items, which, for example, would have been likely to have resulted in low internal
consistencies for such subscales).

12
Table 4: Component pattern matrix loadings for the analysis of own gender responses for perceived difficulties in obtaining 20 jobs.
____________________________________________________________________________________________________________________
Component 1 Component 2 Component 3 Component 4 Extraction
High status / graduate Caring / socially orientated Non-graduate Commercial h2
____________________________________________________________________________________________________________________
Solicitor .82 .02 .05 -.09 .65
Psychologist .75 .30 -.05 .02 .65
University lecturer .75 .09 .04 .03 .76
Architect .72 -.30 .21 .11 .71
Doctor .72 .01 .09 -.08 .55
Accountant .72 -.25 .01 .25 .69
Newspaper journalist .68 .12 .16 -.07 .58
Physiotherapist .66 .39 .04 -.02 .61
Air traffic controller .62 -.38 .13 .24 .58
Nurse .07 .74 .07 .13 .64
Youth and community worker -.04 .55 .40 .22 .63
Social worker .51 .52 -.16 .05 .70
Small business owner .10 .12 .75 -.17 .58
Electrician .02 -.34 .74 .08 .72
Hospital laboratory technician .02 .15 .66 .15 .58
Manager in a private company .29 -.07 .62 -.08 .61
Police officer .17 .14 .55 .20 .60
Paramedic .18 .40 .45 .19 .69
Call centre operative .10 .12 -.21 .83 .64
Sales representative -.12 .01 .30 .66 .59

13
In order to consider whether perceived difficulties in obtaining jobs might influence
the types of job seeking-behaviour engaged in, Pearson’s r correlation coefficients were
computed for the relationships between the component scores for the four types of job shown
in the PCA above and the number of times each of eleven specific job-seeking methods listed
in the job-seeking diary was used as a percentage of the total number of jobs applied for (see
Table 5). Note that a higher score for the perceived job difficulties components indicates the
perception of greater difficulty, and that a higher score on the job-seeking methods variables
indicates greater use of methods. Similar analyses were also performed for relationships
between perceived difficulties and more general job-seeking behaviours: number of
applications made and average number of hours per week spent searching for a job. Again,
the resulting coefficients are shown in Table 5. None of these coefficients was significant,
however several of them were of a size deemed by Cohen (1988) to represent a small effect (r
= .1), and therefore were not necessarily statistically negligible even though they were non-
significant.
Table 5: Pearson’s r coefficients for relationships between perceived difficulties in obtaining
jobs and job-seeking behaviours for the sample as a whole.
___________________________________________________________________________
Type of Job
Higher status/ Caring / Non-graduate Commercial
graduate socially orientated
____________________________________________________________________________
Specific job-seeking method
Speculative phonea -.11 -.14 -.05 .05
Family/friendsa -.13 .10 -.17 -.07
Interneta .12 .13 .05 .08
Newspaper/Journala .10 -.12 .11 -.02
Job Centrea -.10 .10 -.09 -.11
Graduate recruitment faira -.03 -.03 -.05 .02
Letter / CVa -.03 -.05 -.07 .05
Recruitment agencya -.08 -.09 -.11 -.07
e-mail / CVa -.04 .12 -.07 -.13
Local community contactsa .03 .13 .11 -.01
Othera -.05 -.12 .11 .12
General job-seeking
Number of job applicationsb .06 .07 .09 .06
Mean number of hours .14 .11 .11 .10
per week spent searchingc
___________________________________________________________________________
aN = 129,
bN = 124,
cN = 135, p > .05 in all cases
___________________________________________________________________________
14
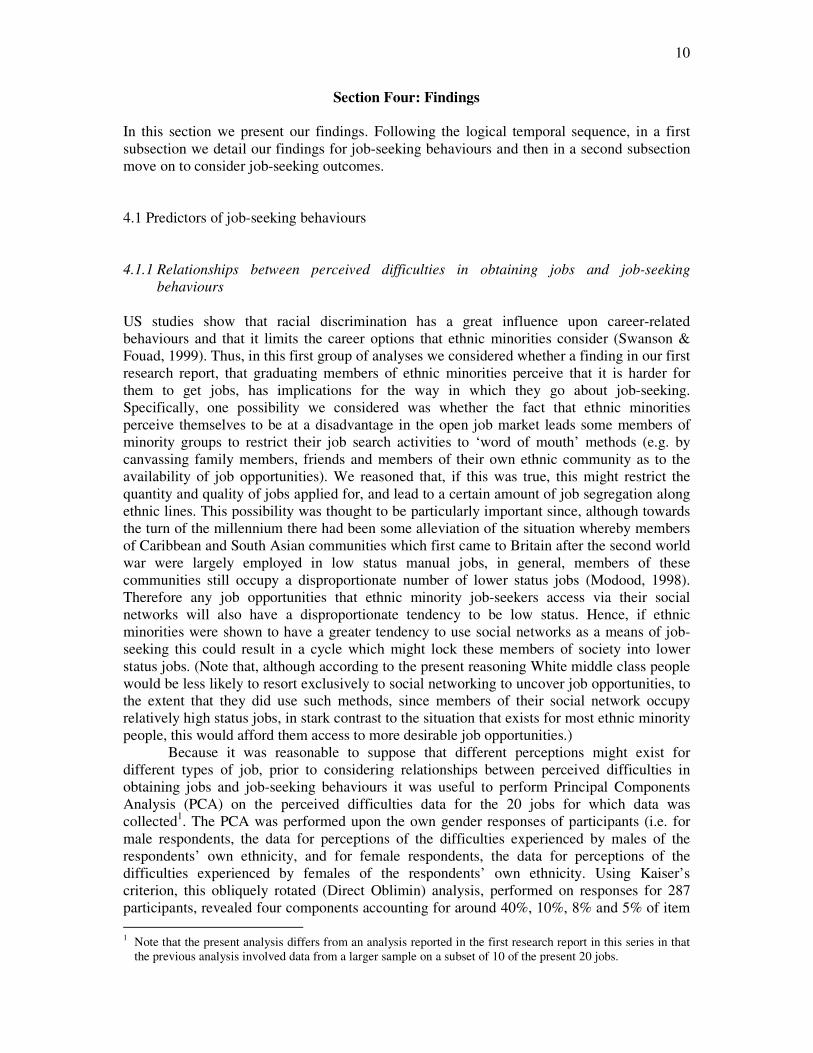
From the results in Table 5 it can be concluded that perceptions of difficulties in
obtaining jobs are not very highly related to the types of job-seeking methods that graduates
adopt. It is particularly interesting to note that there was little evidence that perceptions of
greater difficulty result in a greater likelihood of using family and friends as an avenue of job-
seeking, a situation which, if it existed, might lead to the perpetuation of ethnic minority
disadvantage (nevertheless below we report analyses with participants split into White ethnic
majority and ethnic minority groups to consider whether ethnicity-specific relationships
exist). It is also worth noting that the fact that there are small / negligible correlations between
the perceptions of difficulty in obtaining jobs variables and both number of job applications
made and average time per week spent job-seeking shows that perceptions of difficulty
neither act as a motivator for people to increase their job-seeking efforts, or as a demotivator
in making people think that job-seeking is futile.
Table 6: Spearman’s rho coefficients for relationships between perceived difficulties in
obtaining jobs and job-seeking behaviours for the White subsample only.
___________________________________________________________________________
Type of Job
Higher status/ Caring / Non-graduate Commercial
graduate socially orientated
___________________________________________________________________________
Specific job-seeking method
Speculative phone -.04 -.12 -.07 .05
Family/friends -.08 .13 -.12 -.03
Internet .09 .09 .00 -.06
Newspaper/Journal .18 -.03 .18 .02
Job Centre -.05 .19 -.12 -.02
Graduate recruitment fair .07 -.03 .12 .09
Letter / CV -.10 -.08 -.12 .02
Recruitment agency -.11 -.07 -.09 .07
e-mail / CV -.08 .10 -.15 -.11
Local community contacts .07 .03 .11 .08
Other -.05 -.23* .06 .20*
General job-seeking
Number of job applicationsa .20* .09 .09 .06
Mean number of hours .05 .19 .05 -.10
per week spent searchingb
__________________________________________________________________________
n = 108 apart from an = 106,
bn = 113, *p ≤ .05 (df = 106) two-tailed
__________________________________________________________________________

15
To examine whether there were any relationships between perceived difficulties in
obtaining jobs and job-seeking behaviours that were specific to the White majority and the
ethnic minority groups, two sets of Spearman’s rho analyses were performed separately for
these two groups. Spearman’s rho was preferred to Pearson’s r for these analyses because
scatterplots showed that outliers for some of the variables in the analyses for the ethnic
minority group would have had a disproportionate influence upon the magnitude of Pearson’s
r coefficients given the low sample sizes for this group. To facilitate comparisons across
ethnic groups, Spearman’s rho coefficients were also calculated for the White group. The
results of these analyses are shown in tables 6 and 7.
Table 6 shows that in addition to there being a number of coefficients for the White
group which represented small effect sizes, there were three significant coefficients. However,
it is difficult to draw conclusions from two of these significant coefficients since these merely
showed that for White graduating students increasing perceptions that it was harder to obtain
caring / socially-orientated jobs were associated with a slight tendency to make a smaller
proportion of applications by methods other than those specifically mentioned on the
questionnaire, while perceptions that it was harder to obtain commercial jobs were slightly
related to a tendency to make a greater proportion of applications by methods other than those
specifically mentioned on the questionnaire. The third significant coefficient showed that
perceptions that it was more difficult to obtain a graduate job were slightly related to a
tendency to make a greater number of applications. This may indicate that among the White
group, graduates’ greater perceptions of difficulty with respect to the types of jobs that they
were particularly likely to be targeting (graduate-level jobs) resulted in greater job-seeking
efforts.
Although Table 7 shows some sizable relationships between perceived difficulties and
job-seeking variables for the ethnic minority participants, because of low power associated
with small sample sizes the only significant relationship was one whereby people who
perceived greater difficulty in obtaining non-graduate jobs used family and friends as a job-
seeking method less frequently. Although, the coefficient was non-significant, there was also
a medium-sized relationship in the same direction involving higher status / graduate jobs.
Thus, overall, this pattern seems to indicate that far from ethnic minorities having a tendency
to be disadvantaged by using family and friends (who are disproportionately likely to be able
to provide leads only for lower status jobs relative to the rest of the population given their
greater probability of having such jobs themselves) when they perceive difficulty in obtaining
a specific type of job, they may in fact be less likely to use family and friends in such
circumstances. Although we have no such evidence in the present data set, one interpretation
of this is that ethnic minorities who perceive difficulties in certain occupational areas refrain
from using close contacts because these contacts are not able to give them useful assistance.

16
Table 7: Spearman’s rho coefficients for relationships between perceived difficulties in
obtaining jobs and job-seeking behaviours for the ethnic minority subsample only (n
= 21).
___________________________________________________________________________
Type of Job
Higher status/ Caring / Non-graduate Commercial
graduate socially orientated
___________________________________________________________________________
Specific job-seeking method
Speculative phonea -.29 .17 -.24 -.13
Family/friendsa -.37 -.04 -.56** -.25
Interneta -.01 .36 -.07 .16
Newspaper/Journala .40 -.36 .22 .13
Job Centrea .07 .15 -.07 .15
Graduate recruitment faira ---- ---- ---- ----
Letter / CVa -.13 -.12 -.08 .17
Recruitment agencya -.30 -.10 -.26 -.07
e-mail / CVa .22 .28 .10 -.06
Local community contactsa -.06 .30 -.20 -.39
Othera -.13 -.40 -.01 .00
General job-seeking
Number of job applicationsb .33 -.09 .28 .04
Mean number of hours -.15 -.13 .13 .19
per week spent searchingc
___________________________________________________________________________
an = 21,
bn = 18,
cn = 22, **p < .01 (df = 19) two-tailed
___________________________________________________________________________
4.1.2 Ethnicity and job-seeking behaviours
While the above analyses did not show that ethnic minority graduates who perceived greater
difficulty in obtaining jobs were more likely to use family and friends in their job searches, it
was still useful to consider whether differences in job-seeking methods exist between ethnic
majority and ethnic minority graduates (of course, this analysis would take on particular
importance if certain methods were shown to be more effective than other methods – see
later). In particular, it was thought that because other analyses reported elsewhere (Taylor,
Ranyard & Charlton, 2006; Charlton et al., 2006) showed that graduating ethnic minorities
perceived that it was more difficult to obtain jobs than the White group did, then ethnic
minority graduates might be more inclined to search for jobs within their own ethnic
community, using family and friends and local community contacts to circumvent the
difficulties they perceive might exist in the wider job market.

17
Table 8: Descriptive statistics (percentage of times a method was used for a job application),
effect sizes (ES) and t-test results (mainly two-tailed) for differences in job-seeking
methods employed between White (n = 112) and ethnic minority graduates (n = 22).
____________________________________________________________________
Ethnic Group
___________________________
White Minority ES t-test (df=132)
Mean SD Mean SD d t p
_____________________________________________________________________
Job-seeking method
Speculative phone 2.59 7.67 1.15 4.75 .23 0.85 .40
Family/friends 3.12 8.76 3.90 8.73 -.09 0.38 .35a
Internet 34.51 28.99 38.04 32.26 -.12 0.51 .61
Newspaper/Journal 23.16 26.65 15.40 24.34 .30 1.27 .21
Job Centre 3.50 9.35 0.70 3.28 .40 2.48 .02b
Graduate recruitment fair 0.65 3.68 0.00 0.00 .25 0.83 .41
Letter / CV 6.60 18.39 11.09 20.87 -.23 1.02 .31
Recruitment agency 12.35 21.69 17.20 28.08 -.19 0.91 .36
e-mail / CV 5.30 11.75 5.24 14.77 .00 0.02 .98
Local community contacts 2.83 14.92 4.55 12.79 -.12 0.51 .31a
Other 5.40 14.16 2.74 8.02 .23 0.85 .40
_____________________________________________________________________
aone-tailed,
bdf = 95.52 (t-test does not assume equal variances)
_____________________________________________________________________
Descriptive statistics for these analyses are provided in Table 8 along with the
independent samples t-test results associated with these statistics. These analyses showed that
the only significant difference was in the percentage of applications made through Job
Centres, with White graduates tending to use this method more of the time, this effect being
between a small effect size (d = .2) and a medium effect size (d =. 5) as defined by Cohen
(1988). Although the directions of differences in means supported the hypotheses that ethnic
minority graduates would use family and friends and local community contacts to a greater
extent than White graduates, the differences were non-significant and the effect sizes were
lower than those considered by Cohen (1988) to be small. On the other hand, the effects
whereby the ethnic minority group made more applications by speculative approaches using
letters and CVs and the White group made greater use of speculative telephone calls, graduate
recruitment fair applications, and newspapers and other journals exceeded Cohen’s criterion
for a small effect, although again these differences were non-significant and therefore
unreliable.
A further group of independent samples t-tests were used to analyse ethnic differences
in salaries of jobs applied for (where participants quoted a salary range, the mean was used),
time elapsed from first job application until attaining a job, and number of applications made
until attaining a job. The results of these tests are shown in Table 9. From the table it can be

18
seen that, contrary to expectations, the mean salary of jobs for which ethnic minorities applied
was significantly greater than the corresponding mean for members of the White group. In
Cohen’s (1988) terms, this constituted a medium effect size (as defined by d = .5). On the
other hand, it took both longer and a greater number of applications for members of ethnic
minorities to obtain jobs. While neither of these latter results was significant, the effect sizes
for these two indices were both greater than Cohen’s definition of a small effect (d = .2).
Table 9: Descriptive statistics, effect sizes (ES) and t-test results (two-tailed) for differences
in assorted job-seeking indices for White and ethnic minority graduates.
________________________________________________________________________
Ethnic Group
___________________________________
White Minority ES t-test
n Mean SD n Mean SD d t p
_________________________________________________________________________
Index
Mean salary (£) 77 16122 4433 18 19328 5538 -.64 2.63 .01a
Time elapsed (weeks) 90 8.74 10.16 18 13.72 14.17 -.40 1.42 .17b
Applications (number) 94 8.56 7.76 18 11.39 15.63 -.23 1.15 .25c
________________________________________________________________________
adf = 93,
bdf = 20.63 (t-test does not assume equal variances),
cdf = 110
________________________________________________________________________
In summary, while, in terms of percentages of all job-seeking methods used by each
participant, ethnic minority graduates did use their family and friends and local community
contacts slightly more than White graduates, the size of these effects was minimal and the
differences were non-significant. There was therefore little evidence supporting the idea that
ethnic minorities have a greater propensity to use such methods because, for example, they
feel they will be discriminated against if they use other methods which will entail them
competing with White graduates in the graduate job market. However, one difference that did
exist was that White graduates used Job Centres more. This may be of some importance since
Job Centres tend to advertise a preponderance of local jobs of a non-graduate nature. Thus,
factors such as demography not withstanding, greater use of this source of leads by the White
majority may make them less likely to obtain graduate jobs. A second finding was that it took
longer for ethnic minority graduates to obtain jobs. However, this may not necessarily have
been a bad thing: it may indicate greater ambition and a willingness not to settle for less
desirable jobs.
4.1.3 Gender and job-seeking behaviours
Although we had no specific expectations about the nature of any gender differences in job-
seeking methods, eleven independent samples t-tests were carried-out to investigate whether

19
any differences existed. The results of these tests (see Table 10) revealed only one-significant
difference, with females being more likely to use methods other than those listed, the effect
here approaching a medium size. Although other findings were non-significant, it is worth
noting that several of the effects equalled or exceeded Cohen’s criterion for a small effect.
Thus, the effects whereby, relative to females, males made a proportionately greater number
of applications via family and friends and recruitment agencies, but proportionately fewer
numbers of applications informally by telephone and via graduate recruitment fairs all
exceeded .2, although none of these effects was statistically reliable.
Table 10: Descriptive statistics (percentage of times a method was used for a job
application), effect sizes (ES) and t-test results (two-tailed) for differences in job
seeking methods employed between male (n = 34) and female graduates (n = 100).
____________________________________________________________________
Gender
___________________________
Male Female ES t-test (df=132)
Mean SD Mean SD d t p
_____________________________________________________________________
Job-seeking method
Speculative phone 1.36 4.72 2.69 7.96 -.20 0.92 .36
Family/friends 5.90 11.59 2.34 7.36 .37 1.68 .10a
Internet 32.01 24.32 36.13 31.04 -.15 0.79 .43b
Newspaper/Journal 18.87 28.55 22.91 25.64 -.15 0.77 .44
Job Centre 4.00 7.98 2.71 8.95 .15 0.74 .46
Graduate recruitment fair 0.00 0.00 0.73 3.89 -.27 1.88 .06c
Letter / CV 8.95 21.34 6.79 17.95 .11 0.58 .57
Recruitment agency 16.75 25.97 11.92 21.64 .20 1.07 .29
e-mail / CV 6.36 11.31 4.92 12.57 .12 0.59 .55
Local community contacts 4.53 18.92 2.62 12.83 .12 0.66 .51
Other 1.26 3.89 6.23 15.11 -.45 3.01 <.01
_____________________________________________________________________
adf = 42.42,
bdf = 72.27,
cdf = 99.00,
ddf = 126.86 (t-test does not assume equal variances)
_____________________________________________________________________
One curiosity of the statistics in Table 10 is that they show that none of the males
made applications through graduate recruitment fairs. This resulted in their being no variance
in the male data for this variable. Because of this abnormality a non-parametric Mann-
Whitney test was also performed. However, this resulted in a conclusion similar to that which
can be drawn from the t-test which is reported.
Three further independent samples t-tests were performed to test for gender
differences in mean salary of jobs applied for, time elapsed from start of job-seeking until a
final permanent job was obtained, and number of applications made until the final job was
obtained. Since, as was mentioned in the Introduction, statistics show that females may be

20
more inclined to apply for posts in less highly remunerated occupational areas, it was
expected that the mean salary of jobs applied for by males would be greater than that for
females. However, tests for the other two indices were non-directional. The results of the tests
(see Table 11) revealed no significant differences, although the result of the one-tailed test for
mean salary of jobs applied was marginal, the effect exceeded Cohen’s (1988) criterion for a
small effect, and the means showed that, as was expected, the mean salary of jobs applied for
by men was greater than that of jobs applied for by women (the difference being £1619).
Table 11: Descriptive statistics, effect sizes (ES) and t-test results (two-tailed) for gender
differences in assorted job-seeking indices.
____________________________________________________________________
Gender
________________________________
Male Female ES t-test
n Mean SD n Mean SD d t p
_____________________________________________________________________
Index
Mean salary (£) 22 17974 5918 73 16355 4387 .31 1.39 .09a
Time elapsed (weeks) 24 9.38 7.14 84 9.63 11.92 -.03 0.13 .90b
Applications (number) 26 9.46 7.93 86 8.92 9.88 .06 0.26 .80c
_____________________________________________________________________
adf = 93 - one-tailed,
bdf = 63.15 (two-tailed, t-test does not assume equal variances),
cdf = 110 – two-tailed
_____________________________________________________________________
From the above analyses, perhaps the main conclusion that can be drawn is that there
are few differences in the way in which men and women graduates go about seeking
employment on leaving higher education. However, one difference seems to be that women
make use of more diverse methods, given that they were more inclined to use (unspecified)
methods other than those which were explicitly identified on the question. Although the
evidence was not statistically reliable, there was also a hint that women sought jobs with
lower salaries, perhaps because they perceived the possibility of discrimination in more
highly remunerated occupational areas. Such an explanation would fit in with other data
collected for the present project, which showed that both males and females perceive it more
difficult for female job-seekers to obtain jobs – for more on this see Taylor et al. (2006) and
Charlton et al. (2006).
Another observation that flows from both the analysis for gender differences here and
for the previous analysis of ethnicity is that the Internet is being used extensively for job
applications. But even though ethnic minorities tend to come from less wealthy social
backgrounds, the present data shows that this does not appear to result in disadvantage. In fact
the ethnicity analysis showed that minorities use the Internet more, although the difference is
non-significant. Also, given the large amount of literature showing that males are more
positively disposed towards computers (see e.g. Brosnan, 1998) it was interesting to find that

21
females used the Internet for job applications to a greater extent, although again the difference
was non-significant. This supports previous findings that females are just as likely, if not
more likely, to use computers as tools as males are (see e.g. Cooper & Weaver, 2003).
4.2 Predictors of job-seeking outcomes
4.2.1 Demographic factors and job-seeking outcomes
The analyses involving relationships between demographic factors and job-seeking outcomes
sought to test hypotheses concerning four demographic-related variables. First, we sought to
identify whether, as would be consistent with national statistics, ethnic minority graduates
were less successful in their post-HE job-seeking than White graduates. Second, we examined
whether women graduates tended to be less successful than male graduates, because, for
example, perhaps they perceive more prestigious jobs as lying within the male domain, or
alternatively perhaps because they fear they will be unsuccessful in certain areas because of
employer discrimination. Third, we considered whether socio-economic status was related to
success, the expectation being that those from higher status backgrounds would fare better.
Finally, we considered whether graduates from pre-1992 universities enjoyed more success
than those from post-1992 universities.
There were two main job outcome variables, both of which were dichotomous. First,
the national statistics referred to in the Introduction concern ethnic differences in
unemployment six months after graduation, and therefore we considered differences in the
proportions of the White and ethnic minority graduates who were gainfully occupied in any
capacity (in graduate, non-graduate or voluntary work, continuing education, etc.) and those
who were still seeking work six months after graduation. This job outcome variable is
henceforth referred to as Employment Status. The second job outcome variable was more
stringent, contrasting graduates obtaining a graduate-level job (whose job search can be
considered to have been particularly successful) and graduates who had obtained either a non-
graduate job or were unemployed (whose job search can be considered to have been relatively
unsuccessful). This job outcome variable is henceforth referred to as Employment Quality.
Considering outcomes in terms of whether or not people had obtained a graduate job six
months after graduating in addition to in terms of whether people were simply employed or
unemployed, was thought desirable since presumably most people entering university do so at
least partially with the expectation that obtaining a degree will pay dividends in terms of
equipping them to obtain a better job. In considering job-seeking outcomes, parallel analyses
are reported for both job outcome variables. Note that, ideally, independent analyses would
have been performed for Employment Status and Employment Quality by excluding
unemployed people from the Employment Quality analyses and comparing only those
graduates obtaining graduate-level and non-graduate-level jobs. However, because of the low
sample sizes that would have resulted it was necessary to include unemployed graduates in
the less successful category for the Employment Quality variable. It is therefore useful to bear
in mind that there is some degree of overlap between the analyses for the two job-seeking
outcome variables.
Eight cross-tabular analyses were performed to examine the associations between the
two different types of job-seeking outcome and ethnicity, gender, socio-economic status and
type of university attended.
The first analysis, for the Employment Status variable, showed that of the 140 people
for whom there was relevant data, 104 (89%) of the 117 White graduates were gainfully
occupied, and 19 (83%) of the 23 ethnic minority graduates were gainfully occupied. With 13

22
(11%) of White graduates and 4 (17%) of ethnic minority graduates still seeking work then,
this reflected the generally recognised national situation whereby there is greater
unemployment of ethnic minority graduates six months after graduation. However, a chi-
square test showed no statistically reliable association between ethnicity and employment
status (χ2= 0.71, df =1, p = .40 two-sided), and the effect size (w = .07) did not exceed
Cohen’s (1988) benchmark (w = .10) for a small effect size.
A similar analysis for Employment Quality showed that 49 of the 117 White graduates
(42% of the White graduates) obtained a graduate job, while of the 23 ethnic minority
graduates, 15 (65% of the ethnic minority graduates) obtained a graduate job. The associated
chi-square statistic was significant (χ2=4.22, df =1, p =.04 two-sided, effect size w = .17).
Hence, there was a 23 percentage-point difference, with an unexpected reversal of the result
for Employment Status occurring in that a greater proportion of ethnic minority graduates
obtained graduate jobs. This effect exceeded Cohen’s (1988) benchmark for a small effect
size. It should be noted that the possibility that this difference existed because more ethnic
minorities attended pre-1992 universities was excluded by a chi-square test of association,
which showed that proportionately slightly more of the White graduates in the sample for
which job outcome data was available had attended such universities as opposed to post-1992
universities.
Analysis examining the association between Employment Status and gender revealed
that 7 (19.4%) male and 10 (9.6%) female graduates were unemployed. However, although
the effect was greater than that considered by Cohen (1988) to indicate a small effect, the ten
percentage-point difference whereby there was greater male unemployment was not quite
large enough to yield a significant chi-square test result (χ2=2.42, df =1, p =.12 two-sided,
effect size w = .13).
The Employment Quality by gender analysis showed that of 36 male graduates, 18
(50%) obtained a graduate job, and of 104 female graduates, 46 (44%) obtained a graduate
job. The chi-square test showed that this six-percentage point difference did not represent a
significant association between gender and job status (χ2= 0.36, df =1, p = .55 two-sided,
effect size w = .05), there therefore being no reliable difference in the extent to which males
were more likely to obtain a graduate job, and a minimal effect size.
Moving on to socio-economic background, the analysis for Employment Status
showed that out of 69 graduates from managerial and professional social backgrounds 8
(12%) were unemployed, of 25 graduates from backgrounds characterised as intermediate
occupations 6 (24%) were unemployed, and of 18 graduates from backgrounds characterised
as routine or semi-routine occupations none were unemployed. Despite, these seemingly large
disparities, particularly the 24 percentage-point difference whereby people from intermediate
backgrounds were more likely to be unemployed than those from the least wealthy
backgrounds, a chi-square test showed a very marginally non-significant association between
socio-economic background and Employment Status (χ2=5.65, df =2, p =.06 two-sided), and a
small to medium effect size (w = .23). Post hoc power calculations showed power of .58 for
the observed effect size, and therefore it can be concluded that while an effect may exist, there
was only a moderate chance of significance testing detecting this effect with the current
overall sample size (N = 112).
Analysis of the association between Employment Quality and socio-economic
background showed that of the 69 graduates from a managerial and professional social
background 33 (48%) obtained a graduate-level job, of the 25 graduates from a social
background characterised by an intermediate occupation 9 (36%) obtained a graduate-level
job, and of the 18 graduates from a social background characterised by routine and semi-
routine occupations 6 (33%) obtained a graduate-level job. The chi-square test showed a non-
significant association between socio-economic status and job status (χ2=1.84, df =2, p =.40,

23
effect size w = .13). There was therefore no statistically reliable association between socio-
economic status and the extent to which people obtained graduate-level jobs. However, it
should be noted that there was a 12 percentage-point difference in success rates between the
managerial and professional group and the intermediate occupational background, and a 15
percentage-point difference in success rates between the managerial and professional group
and the graduates from a routine and semi-routine occupational background, and that the
effect size for the analysis as a whole exceeded Cohen’s (1988) definition of a small effect
size. Note that at .21 for the observed effect size, the power of this analysis was low and that
there was little chance of significance testing detecting this effect with the current overall
sample size (N = 112). In fact further power calculations showed that a total sample size of
571 is necessary to detect an effect of the observed size with (the generally recommended) .80
power.
The final pair of cross-tabular analyses focussed upon type of university attended. The
first analysis, for Employment Status, revealed that of 86 graduates attending pre-1992
universities 11 (13%) were unemployed and of 26 graduates attending post-1992 universities
3 (12%) were unemployed. Given this very small proportional difference, it was unsurprising
to find that a chi-square test yielded a non-significant result and that there was a minimal
effect size (χ2= 0.03, df =1, p = .87 two-sided, effect size w = .02). There was therefore no
evidence that graduates from pre-1992 universities were less likely to be unemployed than
those form post-1992 universities.
The university type by Employment Quality analysis showed that of the 86 graduates
who had attended pre-1992 universities, 37 (43%) obtained a graduate job, and of the 26
graduates who had attended post-1992 universities, 11 (42%) obtained a graduate job. Again,
given these frequencies, it was not surprising to find that a chi-square test showed a non-
significant association between type of university attended and job status (χ2= 0.00, df =1, P=
.95 two-sided, effect size w = .01). From these results it can be concluded that there was no
association between type of university attended and the extent to which people obtained
graduate-level jobs, and that, again, there was no evidence that graduates from pre-1992
universities have an advantage over those from post-1992 universities with respect to the
quality of jobs they obtained.
Although the samples were small, the above results showing that White graduates
were more likely than ethnic minority graduates to be gainfully occupied six months after
leaving higher education were consistent with national statistics showing greater
unemployment among ethnic minority graduates for the same time frame. At 11%
unemployment for the White group and 17% unemployment for the ethnic minority group the
six percentage-point difference was similar to the five point difference in the HESA (2002)
national statistics (however, low power because of small sample sizes meant that the current
analysis did not show a significant association between ethnicity and employment status). On
the other hand, when the two ethnic groups were compared in terms of having obtained and
not having obtained a graduate-level job there was a significant, 23 percentage-point, ethnic
minority advantage, with 58% of the White group not obtaining a graduate-level job but only
35% of the ethnic minority group not obtaining a graduate-level job. While too much
emphasis should not be placed on this difference in findings because of the low sample sizes,
such differences highlight the necessity of taking into account the exact nature of indices that
are being considered when ethnic differences in graduate employment rates are being
discussed, and suggest that for some indices ethnic minorities might actually fare better. Thus,
for example, in the present instance, while proportionately more ethnic minority graduates
were still looking for work six months after graduating, excluding all other categories in
calculations, of those ethnic minorities who did find work proportionately fewer had to settle
for non-graduate jobs (21% were in non-graduate jobs and 79% were in graduate jobs) than

24
was the case for the White ethnic majority graduates (where 52% were in non-graduate jobs
and 48% were in graduate jobs).
While again low sample sizes were a problem, analyses with respect to socio-
economic background showed that people from the more privileged backgrounds (managerial
and professional) may be more successful in obtaining higher quality jobs than graduates
from less privileged backgrounds (with a background characterised by employment in
intermediate or routine and semi-routine occupations). On the other hand, as far as
employment status was concerned, there was some evidence that people from intermediate-
level occupational backgrounds fared less well in terms of being in employment of any type,
particularly with respect to those from more lowly backgrounds. While it may be that one
reason for this result is that the latter people would have to take-up employment of any kind
(irrespective of whether it was graduate-level), the employment quality analysis does not
support such an idea, there being only a three percentage-point difference, in favour of the
higher social grouping, in the extent to which people from the two groups obtained graduate-
level jobs.
The analyses examining gender differences in job-seeking success did not indicate that
women were less successful, either in terms of obtaining employment of any type or in terms
of obtaining graduate-level employment. In fact, with respect to the former measure of
success, albeit that the evidence was statistically unreliable, there was a small amount of
evidence that women fared better. Hence, there was no support for the ideas that women
graduates are less successful in post-HE job-seeking, because, for example, they are reluctant
to apply for more prestigious jobs owing to perceptions of such jobs as being stereotypically
male, or because they fear that their applications for such jobs will be unsuccessful because of
employer discrimination.
Finally, graduates from pre-1992 universities did not enjoy more success than those
from post-1992 universities on either of the job-seeking outcome measures considered. Also,
other analyses showed that attendance at a pre-1992 or post-1992 university was unlikely to
account for any effects of gender and SES (but unfortunately, cell sizes were too low to
examine this issue in any great depth).
4.2.2 Job-seeking behaviours and job-seeking outcomes
At a general level the examination of relationships between relative frequency of different
types of job-seeking behaviour and outcomes was exploratory, there being no hypotheses as
to which behaviours would prove most successful. This was entirely the case for the
Employment Status variable. However, for the Employment Quality variable, at a more
detailed level, it was thought that an interaction might occur whereby use of friends and
family and local community contacts would result in relative success for White graduates but
relative lack of success for ethnic minority graduates because, for example, the contacts of the
former group would be likely to hold positions higher-up in organisations and would be more
likely to be employed by well-paying employers with good career structures (such as blue
chip companies) than the contacts of the latter group. This was thought to be possible since
for historic reasons members of ethnic minorities have tended to occupy less attractive jobs
and members of these communities have often found it difficult to break-out of such areas of
employment.

25
Table 12: Descriptive statistics (percentage of times a method was used for a job
application), effect sizes (ES) and t-test results (two-tailed) for differences in job
seeking methods used by unemployed (n = 16) and employed (n = 118) graduates.
____________________________________________________________________
Status
___________________________
Unemployed Employed ES t-test (df=132)
Mean SD Mean SD d t p
_____________________________________________________________________
Job-seeking method
Speculative phone 6.70 12.90 1.76 6.00 .49 1.51 .15a
Family/friends 1.25 5.00 3.52 9.09 -.31 -0.98 .33
Internet 45.61 24.08 33.66 29.91 .44 1.53 .13
Newspaper/Journal 11.93 12.65 23.24 27.45 -.53 2.79 .01b
Job Centre 1.48 4.25 3.25 9.13 -.25 -0.76 .45
Graduate recruitment fair 0.00 0.00 0.62 3.59 -.24 -0.69 .49
Letter / CV 8.02 12.60 7.24 19.53 .05 0.16 .88
Recruitment agency 5.68 10.88 14.16 23.83 -.46 -2.43 .02c
e-mail / CV 7.10 12.15 5.04 12.28 .17 0.63 .53
Local community contacts 8.63 21.12 2.36 13.38 .35 1.16 .26d
Other 3.60 8.69 5.15 13.89 -.13 -0.44 .66
_____________________________________________________________________
adf = 15.89,
b df =38.27,
cdf = 38.73,
d df =16.67 (t-tests do not assume equal variances)
_____________________________________________________________________
To examine the extent to which different job-seeking behaviours were associated with
different job-seeking outcomes, two sets of eleven independent samples t-tests were
conducted, with job-seeking outcomes (for one set of analyses, Employment Status; employed
vs. unemployed, and for the other set of analyses, Employment Quality; graduate job vs. no
graduate job) as the independent variables and number of times each of the eleven job-seeking
methods was used as a percentage of the total number of jobs applied for, as the dependent
variables. Note that separate t-tests were preferred to MANOVA because of the large number
of dependent variables relative to the sample size. The results of the t-tests are given in tables
12 and 13. Table 12 reveals that people who were successful in finding employment made
significantly more applications based upon advertisements in newspapers and other printed
media, and through recruitment agencies than those who were unemployed. In addition to
these two observations, it can also be seen that there was also a non-significant but medium-
sized effect (defined as d = .5 by Cohen [1988]) whereby unemployed people made more
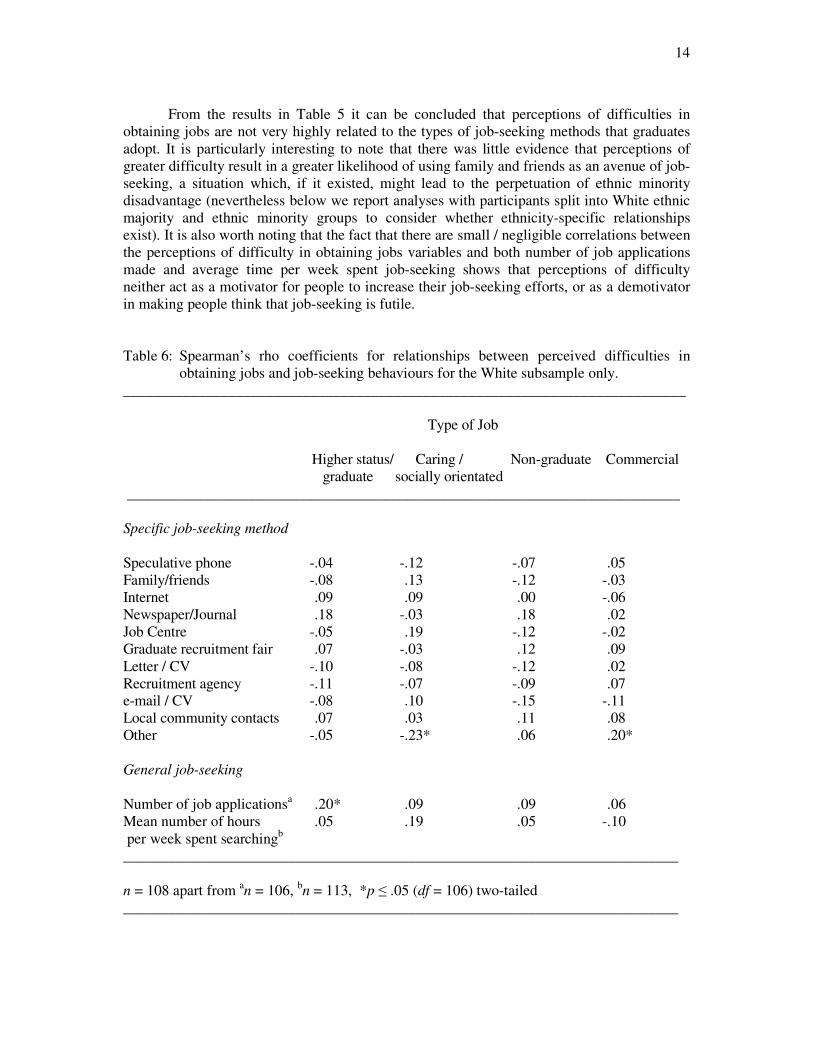
applications via speculative telephone calls. Table 13 shows that the only significant
differences in job-seeking methods between people who obtained and did not obtain graduate-
level jobs were those for applying through the Job Centre and through letter and CV. For each
of these two methods, the percentage of applications made by people who were unsuccessful
in obtaining a graduate job was greater than for those who were relatively successful. Using
Cohen’s (1988) effect size definitions, the size of the effect for Job Centre usage can be said
26
to be approaching a medium effect size, and that for usage of letters and CVs at least an effect
size well encompassed within the definition of a small effect (defined as d = .2).
Finally it is useful to observe that the tables for both job outcome variables show that
for both relatively successful and unsuccessful graduates, by far the most commonly used
method was application via the Internet and that there was also a reasonable amount of usage
of advertisements placed in newspapers or other printed media.
Table 13: Descriptive statistics (percentage of times a method was used for a job
application), effect sizes (ES) and t-test results (two-tailed) for differences in job-
seeking methods employed between those not obtaining graduate jobs (n = 73) and
those obtaining such jobs (n = 61).
______________________________________________________________________
Status
___________________________
No Graduate Job Graduate Job ES t-test (df=132)
Mean SD Mean SD d t p
_______________________________________________________________________
Job-seeking method
Speculative phone 1.94 6.63 2.85 8.01 -.12 0.72 .48
Family/friends 2.37 6.57 4.29 10.72 -.22 1.22 .23a
Internet 34.80 27.47 35.44 31.88 -.02 0.13 .90
Newspaper/Journal 22.75 24.77 20.85 28.31 .07 0.41 .68
Job Centre 4.67 10.91 1.08 4.25 .43 2.59 .01b
Graduate recruitment fair 0.59 4.06 0.49 2.33 .03 0.19 .85
Letter / CV 10.31 23.34 3.77 10.32 .36 2.16 .03c
Recruitment agency 9.99 17.71 16.92 27.39 -.30 1.70 .09d
e-mail / CV 5.28 11.70 5.29 12.94 .00 0.01 1.00
Local community contacts 2.15 10.36 4.25 18.41 -.14 0.83 .41
Other 5.13 14.60 4.77 11.81 .03 0.16 .88
_______________________________________________________________________
adf = 95.72,
b df =96.72,
cdf = 102.87,
d df =99.16 (t-tests do not assume equal variances)
_____________________________________________________________________
Two further independent samples t-tests were conducted on total number of job
applications made. For the Employment Status independent variable unemployed graduates
(M = 8.24, SD = 6.50, n = 17) had not made as many applications as the employed graduates
(M = 10.11, SD = 9.58, n = 123), however although the effect size (d = .23) was greater than
Cohen’s (1988) criterion for a small effect (d = .2), the t-test result showed that the difference
was non-significant, t (138) = 0.78, p = .44 two-tailed. A parallel test for the Employment
Quality independent variable showed that people who had not obtained a graduate job (M =
10.95, SD = 8.81, n = 76) had made more applications than those who had (M = 8.61, SD =
9.70, n = 64), but that, again, the difference was non-significant, t (138) = 1.49, p = .14 two-
27
tailed. Nevertheless the effect size (d =.25) was greater than Cohen’s definition of a small
effect.
A final pair of t-tests on job-seeking behaviours took the form of tests comparing
mean number of hours per week spent searching for a job. Descriptive statistics associated
with the first test, for the Employment Status independent variable, indicated that there was
very little difference between the unemployed (M = 6.76 hours, SD = 7.48 hours, n = 16) and
employed graduates (M = 6.25 hours, SD = 4.73 hours, n = 113), and this was confirmed by
the minimal effect size (d =.08) and the non-significant t-test result, t (16.74, equal variances
not assumed) = 0.27, p = .79 two-tailed. The similar test for the Employment Quality
independent variable showed that the relatively unsuccessful graduates (M = 6.15 hours, SD =
5.27 hours, n = 71) spent marginally less time per week searching than the relatively
successful graduates (M = 6.52 hours, SD = 4.96 hours, n = 58), but that the difference was
non-significant, t (127) = 0.41, p = .69 two-tailed, and the effect size was again negligible (d
=.07).
Of the eleven job-seeking methods considered, two that were of particular interest in
the present context were firstly, use of family and friends, and, secondly use of local
community contacts. This was the case since one issue considered to be important at the
inception of the project was that, given the possibility that they would have contacts in higher
status jobs, use of personal contacts might be advantageous to White graduates in securing
them graduate-level employment, but that, because of the generally lower socio-economic
status of ethnic minorities in the UK, the personal contacts of ethnic minority graduates would
be in lower status jobs, and therefore using these contacts might be less useful in securing
graduate-level employment for members of ethnic minorities. To test this hypothesis, two 2 x
2 between participants ANOVAs were performed separately for the use of family and friends,
and use of local community contacts dependent variables, with ethnicity (White Majority vs.
Ethnic Minority) and Employment Quality (Graduate Job vs. No Graduate Job) as the
between participants factors. Descriptive statistics for both of these analyses are shown in
Table 14.
The first ANOVA, for use of friends and family, revealed no significant main effects
for ethnicity, F(1,130) = 0.09, p = .77, partial η2 < .01, and Employment Quality, F(1,130) =
0.24, p = .63, partial η2 < .01. Neither was there a significant interaction between ethnicity
and Employment Quality, F(1,130) = 0.34, p = .56, partial η2 < .01. Thus, although, as
hypothesised, the upper portion of Table 14 shows that the White graduates who obtained
graduate jobs used family and friends proportionately more than graduates of the same
ethnicity who did not obtain graduate jobs, and that this difference was reversed for the ethnic
minority graduates, this interaction was not statistically reliable.
A similar situation existed for use of local community contacts. So again, although the
pattern of means in the lower portion of Table 14 was the same as for the first analysis as
hypothesised, there were no significant main effects for ethnicity, F(1,130) = 0.41, p = .52,
partial η2 < .01, and Employment Quality, F(1,130) = 0.13, p = .72, partial η
2 < .01, and there
was no significant interaction between ethnicity and Employment Quality, F(1,130) = 1.77,
p = .19, partial η2 = .01. Noting that the interaction for this second analysis was not too far
from significance, and that there was a lack of power in the analysis because of the low
numbers of ethnic minority graduates involved, it was thought useful to calculate effect sizes
in terms of Cohen’s d with respect to each ethnic group for each dependent variable. Here
then, for White graduates the effect size for the difference between people with a graduate job
and those without a graduate job with respect to percentage of applications made through
family and friends was d = .25, and that for percentage of applications made through local
community contacts was d = .22. For ethnic minority graduates the effect size for family and
friends was d = .02 and that for local community contacts was d = .42. Thus, apart from the

28
difference between ethnic minority graduates that obtained and did not obtain graduate jobs
concerning the use of family and friends (which although in the correct direction was
minimal), each of the four effects was in the direction hypothesised and of a size considered
by Cohen (1988) to equate to at least a statistically small effect (d = .2), and that for the use of
local community contacts by ethnic minorities bordered on a medium effect size (d = .5).
There was, then, some evidence in favour of the hypothesis that use of personal contacts by
ethnic minorities may result in disadvantage in the labour market.
Table 14: Descriptive statistics for the ethnicity by Employment Quality ANOVAs for
differences in the extent to which family and friends, and the local community
were used in the job application process (as a percentage of number of applications
made by each person).
__________________________________________________________________
No Graduate Job Graduate Job
n M SD n M SD
___________________________________________________________________
Family and friends
Ethnic Group
White 65 2.17 6.52 47 4.43 11.08
Ethnic minority 8 4.03 7.20 14 3.83 9.75
Local community
Ethnic Group
White 65 1.39 8.98 47 4.81 20.45
Ethnic minority 8 8.33 17.82 14 2.38 8.91
__________________________________________________________________
To summarise the foregoing results, the analysis of differences in job-seeking methods
between people obtaining and not obtaining graduate jobs showed that the only statistically
reliable differences were for use of Job Centres and use of a speculative approach by letter
and CV, both of which tended to be associated with being less successful. For Job Centres at
least this seems reasonable given that jobs that are available via this avenue often tend to be
lower grade jobs. While people who obtained graduate jobs tended to make slightly more use
of family and friends and local community contacts, neither of these results was reliable,
although the result for family and friends constituted a small effect. However, the ethnicity by
Employment Quality analysis hinted that there may be something to the idea that White
graduates are advantaged in the labour market by using their personal contacts, whereas
members of ethnic minorities may be disadvantaged (although there were no significant
interactions).

29
Another of the above results worth commenting on is that people who did not obtain
graduate jobs made more applications than the relatively successful graduates. Although this
finding was non-significant, the effect size was greater than Cohen’s (1988) definition of a
small effect. Were this finding shown to be robust, it would be open to at least two
interpretations. It might simply be that better candidates need fewer applications to get better
jobs, or it might be that people who produce a small number of applications produce well
targeted high-quality applications, and because of their quality these applications are more
likely to be successful.
For the Employment Status variable, there were two reliable differences in the job-
seeking methods of graduates who were employed and unemployed six months after
graduation: relative to those who were unemployed, employed graduates made more
applications via advertisements in newspapers and other printed media, and via recruitment
agencies.
4.2.3 Perceived difficulties in acquiring a job and job-seeking outcomes
The next set of relationships we looked at was whether graduates’ perceptions of the
difficulties that a person of their gender and ethnicity would have in obtaining jobs were
related to job-seeking outcomes. Again, two parallel analyses were performed for the
Employment Status and Employment Quality variables. Here, it was not necessarily thought
that employment status would be affected by perceived difficulties because the analysis of
job-seeking behaviours showed that there was no relationship between perceptions of
difficulty in obtaining jobs and effort put in to job-seeking in terms of both number of job
applications made and average time per week spent job-seeking. However, for employment
quality it was thought that a self-fulfilling prophecy effect might occur whereby greater
perceived difficulties could be related to lesser success in terms of not obtaining a graduate-
level post because greater perceptions of difficulty might tend to restrict people to looking for
lower-level jobs.
Using the component scores from the principal components analysis of the gender-
specific perceived difficulties in obtaining jobs data previously reported in the subsection
examining relationships between perceived difficulties in obtaining jobs and job-seeking
behaviours, a first MANOVA, for employment status, was performed in order to examine
differences in perceptions of difficulty in getting jobs between the graduates who were
employed and those who were not employed. Factor scores from the previously mentioned
factor analysis of the perceived difficulties data were dependent variables. The MANOVA
showed a negligible and non-significant multivariate effect, F (4,130) = 0.00 (rounded), p =
.98, partial η2eta < .001. This reflecting non-significant univariate effects for all variables;
high status / graduate jobs, F (1,135) = 0.01, p = .92, partial η2 < .001; caring / socially
orientated jobs, F (1,135) = 0.09, p = .76, partial η2 < .001; non-graduate jobs, F (1,135) =
0.04, p = .85, partial η2 < .001; and commercial jobs, F (1,135) = 0.20, p = .65, partial η
2 <
.001. Table 15 contains the descriptive statistics associated with this analysis and
demonstrates the negligible differences in the means.
The second MANOVA with Employment Quality as the independent variable and,
again, factors scores for perceptions of difficulty in getting the four types of job as the
dependent variables, showed a non-significant multivariate effect, F (4,130) = 1.13, p = .34,
partial η2eta = .03. This reflecting non-significant univariate effects for all variables; high
status / graduate jobs, F (1,133) = 0.11, p = .75, partial η2 < .001; caring / socially orientated
jobs, F (1,133) = 1.99, p = .16, partial η2 = .02; non-graduate jobs, F (1,133) = 0.58, p = .45,

30
partial η2 < .001; and commercial jobs, F (1,133) = 0.16, p = .69, partial η
2 < .001. The
descriptive statistics for this analysis are shown in Table 16.
Table 15: Descriptive statistics for the MANOVA for differences in perceived difficulty in
obtaining jobs (factor scores) between unemployed and employed graduates.
__________________________________________________________________
Unemployed (n = 17) Employed (n = 118)
M SD M SD
___________________________________________________________________
Type of job
High status / graduate -.17 0.91 -.20 1.03
Caring / socially orientated -.04 0.92 -.12 1.00
Non-graduate -.21 0.93 -.16 0.98
Commercial .02 0.82 -.09 1.01
__________________________________________________________________
Table 16: Descriptive statistics for the MANOVA for differences in perceived difficulty in
obtaining jobs (factor scores) between people with and without graduate jobs.
__________________________________________________________________
No Graduate Job (n = 73) Graduate Job (n = 62)
M SD M SD
___________________________________________________________________
Type of job
High status / graduate -0.22 0.99 -0.17 1.05
Caring / socially orientated 0.00 0.93 -0.24 1.04
Non-graduate -0.11 0.95 -0.24 1.00
Commercial -0.11 0.99 -0.04 0.99
__________________________________________________________________
The results for both job outcome variables, then, showed that the extent to which
graduates perceived it difficult for someone with their demographic characteristics to get
different types of job made little difference as to whether they were unemployed or in some
type of gainful employment, or whether they managed to obtain a graduate-level post or not.
As mentioned previously, given the previous results showing no relationships between
perceived difficulties and job-seeking efforts, the former results for employment status were
unsurprising. However, the latter results for employment quality added to this showing that
there seems to be no self-fulfilling prophecy effect whereby perceptions of difficulties leads
graduates to aim low in the job market.

31
4.2.4 Occupational values and job-seeking outcomes
Although there was little rationale for conducting analyses examining relationships between
occupational values and job-seeking behaviours, it was possible to conceive of the possibility
that occupational values might have a bearing upon the nature of jobs that people sought and
eventually obtained. However, prior to this, in order to reduce the number of dimensions to be
considered, the occupational values data was factor analysed using Principal Axis Factoring
(PAF), with Direct Oblimin (oblique) rotation. With a sample size of 1203 participants (which
included all graduates who participated in the project as a whole), five factors accounting for
around 41% of item variance were identified. Factor correlations (see Table 17) showed that
the oblique rotation was warranted. From the factor loadings in Table 18, Factor 1 (which
accounted for around 19% of variance) was interpreted as workplace equality, Factor 2
(around 10% of variance) as social concerns, Factor 3 (around 6% of variance) as conferment
of social status, Factor 4 (around 4% of variance) as low stress and Factor 5 (3% of variance)
as personal attribute match.
Table 17: Correlations between factors in the PAF for occupational values.
______________________________________________________________________
Workplace Social Conferment of Low stress
equality concerns social status
______________________________________________________________________
Workplace equality ----
Social concerns .09 ----
Conferment of social status .11 .19 ----
Low stress -.23 -.33 -.25 ----
Personal attribute match .36 .00 .12 -.09
_____________________________________________________________________
In the analyses reported subsequently factor scores derived from the factor analysis of
occupational values were used as variables. This was preferred to a summation procedure
because at least some of the subscales resulting from such a procedure would be likely to have
had low internal consistencies owing to low numbers of items.

32
Table 18: Factor pattern matrix loadings for the PAF of occupational values.
___________________________________________________________________________________________________________________________________________
Factor 1 Factor 2 Factor 3 Factor 4 Factor 5
Workplace Social Conferment of Low stress Personal Extraction
equality concerns social status attribute match h2
___________________________________________________________________________________________________________________________________________
A low level of sexism in the workplace .85 .09 -.08 -.05 -.10 .70
A low level of racism .74 .08 -.05 -.04 .01 .57
A safe working environment .62 -.03 .02 -.16 .11 .52
Top positions accessible to all .44 .00 .19 -.07 .03 .29
A job in which you are part of the .16 .57 -.08 -.06 .14 .42
community
A mixture of people from different .28 .50 .02 -.02 -.03 .37
ethnic groups in the occupation
The opportunity to work with family -.19 .50 .03 -.22 -.06 .39
members or friends
Socially useful .27 .36 .04 -.10 .15 .33
A job done mainly by someone of -.23 .32 .05 -.21 -.15 .26
your own sex
High status -.05 .06 .79 .12 -.01 .60
High income .03 -.25 .72 -.17 .02 .59
Managing others .03 .35 .43 .17 .07 .33
A fashionable job -.14 .23 .35 -.28 -.15 .37
Having high control over your .17 -.04 .31 -.23 .06 .25
workload
A job that is easy to obtain .00 .11 -.05 -.61 -.03 .42
Low stress .12 .03 -.07 -.55 -.01 .34
Flexible working hours .03 .08 .07 -.50 .10 .33
High job security .14 -.09 .13 -.41 .14 .28
A job that enables you to use your .18 -.05 .06 .11 .73 .67
talents and abilities
A job related to your degree subject -.13 .05 -.02 -.08 .48 .21
____________________________________________________________________________________________________________________

33
No specific hypotheses were forwarded with respect to occupational values and the
Employment Status variable (i.e. whether differences in occupational values would have an
impact upon whether people were employed or unemployed at the end of the six month post-
graduation period). On the other hand, given the nature of the factors emerging from the
factor analysis, it was thought that two ways in which occupational values might be related to
Employment Quality could be that people who set greater store by conferment of social status
would be more likely to obtain graduate jobs because they would have greater motivation to
obtain such jobs than people who were less concerned in having a job which confers high
social status, and that people who put a greater value on obtaining a low stress job would be
less likely to obtain graduate jobs because they would not want the pressure that may go with
a graduate-level job. A third way in which it was thought that the two groups of graduates
might differ involved the personal attribute match factor: people who place greater value on
getting a job which matches their personal attributes should be more likely to obtain graduate
jobs since such jobs should be more likely to be obtained by people who have a relevant
degree, and who apply for jobs relevant to their degree.
To examine differences in occupational values between people who were employed
and unemployed six months after graduating a single factor MANOVA was performed with
Employment Status as a between subjects factor, and mean scores on the occupational values
subscales as dependent variables. The results of the MANOVA showed that there was a
significant multivariate effect, F (5,76) = 3.82, p < .01, partial η2 = .20, for Employment
Status. Univariate tests showed that this effect was attributable to significant effects for both
importance of equality in the workplace, F (1,80) = 7.80, p = .01, partial η2 = .09, and match
with personal attributes, F (1,80) = 10.46, p < .01, partial η2 = .12. The means in Table 19
show that the employed graduates placed a greater emphasis upon both of the aforementioned
occupational values than the unemployed graduates did. Univariate tests for the three other
occupational values were all non-significant: importance of social concerns, F (1,80) = 0.14, p
= .71, partial η2 < .001, importance of conferment of social status, F (1,80) < 0.01 p = .98,
partial η2 < .01 and importance attached to the job being low in stress, F (1,80) = 0.68, p =
.41, partial η2 = .01.
Table 19: Descriptive statistics for the MANOVA for differences in occupational values
between the two Employment Status groups.
__________________________________________________________________
Unemployed (n = 12) Employed (n = 70)
M SD M SD
___________________________________________________________________
Occupational value
Equality in the workplace 5.13 1.07 6.03 1.02
Social concerns 3.30 1.63 3.43 1.01
Conferment of social status 4.12 1.26 4.13 0.92
Low stress 4.40 0.91 4.68 1.12
Match with personal attributes 4.54 1.30 5.69 1.11
__________________________________________________________________

34
For the Employment Quality variable, again a single factor MANOVA was performed
with Employment Quality (graduate job vs. no graduate job) as a between subjects factor, and
mean scores on the occupational values subscales as dependent variables. The MANOVA
revealed a significant multivariate effect, F (5,76) = 2.65, p = .03, partial η2 = .15, with
univariate tests showing a significant effect for importance of a match with personal
attributes, F (1,80) = 8.11, p = .01, partial η2 = .09, a marginally non-significant effect for
importance of conferment of social status, F (1,80) = 3.70, p = .06, partial η2 = .04, and non-
significant effects for importance of equality in the workplace, F (1,80) = 0.01, p = .94, partial
η2 < .001, importance of social concerns, F (1,80) = 0.18, p = .68, partial η
2 < .001, and
importance attached to the job being low in stress, F (1,80) = 0.37, p = .55, partial η2 = .01.
From Table 20 it can be seen that graduates who were relatively successful in the labour
market attached more importance to having a job which matched their personal attributes than
those who were relatively unsuccessful. With respect to the marginally non-significant result
for conferment of social status, again it can be seen that the relatively successful graduates
attached more importance to this aspect of occupations.
From these analyses it was concluded that of the three ways in which it was thought
that relatively successful and unsuccessful graduates might differ with respect to their
occupational values, the above results did reflect the supposition that people who place
greater value on getting a job which matches their personal attributes are more likely to be
successful, since graduate jobs are more likely to go to people who have a relevant degree and
who apply for jobs relevant to their degree. Although the result was marginally non-
significant, conferment of social status was also valued more highly by successful graduates
as had been thought likely. However, while relatively unsuccessful graduates were shown to
have a slightly greater preference for low stress job characteristics this finding did not
approach significance.
Table 20: Descriptive statistics for the MANOVA for differences in occupational values
between the two Employment Quality groups.
__________________________________________________________________
No Graduate Job (n = 48) Graduate Job (n = 34)
M SD M SD
___________________________________________________________________
Occupational value
Equality in the workplace 5.90 1.05 5.88 1.12
Social concerns 3.45 1.19 3.35 0.99
Conferment of social status 3.95 1.01 4.36 0.86
Low stress 4.70 0.89 4.54 1.33
Match with personal attributes 5.22 1.23 5.96 1.03
__________________________________________________________________
Although the results for the Employment Status independent variable were of less
theoretical and applied interest than those for Employment Quality, it is worth noting that
graduates who were employed six months after graduation deemed equality in the workplace
35
and the match of jobs with their personal attributes to be more important than those who were
unemployed at the same point in time.
4.2.5 Do differences in Job Centre usage explain the ethnic difference in Employment
Quality?
The bivariate analyses for Employment Quality showed that there was an association between
ethnicity and labour market success, with, against expectations, ethnic minority graduates
enjoying greater success in obtaining graduate-level jobs. The analyses also showed that
percentage of job applications made through Job Centres and by speculative approaches using
a letter and CV were associated with relative lack of success. Finally, graduates who
considered it important that a job should match their personal attributes were more successful.
In an earlier part of the report, analyses also revealed an ethnicity difference in percentage of
job applications made through Job Centres (but not in speculative approaches using a letter
and CV) with White graduates using Job Centres more. While not contained in this report, an
analysis contained in the first report in the series showed no difference between White
graduates and ethnic minority graduates with respect to the importance of a job’s match with
personal attributes when job-seeking. Given these findings, of all the variables considered,
only percentage of job applications made through Job Centres was a possible candidate for
explaining the ethnic difference in employment quality outcome. To assess whether this
variable provided an explanation, a partial correlation analysis was performed. The first-order
partial correlation coefficient with Job Centre usage partialled out of the relationship between
ethnicity and Employment Quality attained a value of r(131) = .14 (p = .11 two-tailed). This
coefficient was not substantially smaller than the zero-order Pearson’s r correlation between
ethnicity and Employment Quality, r(132) = .16, p = .06 two-tailed (note that, in contrast to
the earlier marginally significant relationship, in this analysis the zero-order relationship
between these two variables was marginally non-significant, because of the slightly smaller
sample size). It can therefore be concluded that Job Centre usage did not have much of a role
in explaining the relationship between ethnicity and quality of employment obtained3.
Section Five: General conclusions
Although many conclusions were drawn when discussing results in the previous section, this
final section of the main report draws together some of the more important points made.
The major observation upon which the present project was based was that, in terms of
whether graduates are in employment six months after graduation, ethnic minority graduates
are less successful in the job market after leaving higher education than White graduates. A
difference of roughly the same size as that found in the national statistics was reflected in the
present data set, although the effect was not very great in statistical terms and the difference
was not large enough to be statistically significant with the present sample sizes.
In addition to the variable contrasting unemployed graduates with gainfully employed
graduates, a second outcome variable took the form of one contrasting people who obtained a
3 Although it was not technically correct to conduct correlational analyses on these data, these statistics are
reported in the interests of brevity, since the conclusions that resulted from a more complicated hierarchical
logistic regression analysis conducted to answer the same question were the same as those for the analysis
reported here.

36
graduate job with those who did not. Here, ethnic minority graduates were found to be
disproportionately more likely to have obtained graduate jobs six months after graduating.
The difference in findings with respect to the two above job-seeking outcome indices
suggests that while the headline statistics show an ethnic minority disadvantage in post-HE
job-seeking outcomes in terms of ethnic minority graduates being more likely to be
unemployed six months after graduation, the picture may not be as discouraging for ethnic
minority graduates when quality of job-seeking outcomes is considered.
Apart from the above result for the ethnic minority advantage in obtaining graduate
jobs, there were no large and statistically reliable differences concerning gender, socio-
economic background, or type of university attended (pre- or post-1992) with respect to either
employment status (whether people were gainfully employed or not) or employment quality
(whether or not they had a graduate job). Although it has to be borne in mind that the analyses
reported in this paper involved rather small samples, the most interesting observation made
here was that the evidence did not bear out the notions that women graduates are likely to
enjoy less success in the graduate job market because they fear they will experience gender
discrimination in applying for higher status posts or because they stereotype such posts as
being more suitable for men.
When relationships between job-seeking methods and job-seeking outcomes were
considered, the only statistically significant differences were that gainfully employed
graduates had made greater use of recruitment agencies and newspapers and other printed
media relative to those who were not employed, and that people who did not obtain graduate
jobs made more use of Job Centres. These results may suggest that the former two methods of
job-seeking are useful if a graduate simply wants a job of any type and that using Job Centres
is not a particularly good method of finding graduates jobs, as would seem intuitively the
case.
Analysis of ethnic differences in job-seeking methods showed that there was little
evidence that ethnic minority graduates were more likely to use their friends and family and /
or local community contacts to obtain jobs because of fears of discrimination if they
competed more widely in the job market. Also, while in our first report we have shown that
ethnic minority graduates perceive it to be more difficult for someone of their own ethnicity
to obtain jobs than do White graduates, in the present analyses we found little evidence that
perceived difficulties in obtaining jobs had an influence on the job-seeking methods used. For
example, perceptions of greater difficulty do not appear to make people more likely to use
members of their family or friends when finding posts to apply for. However, although the
evidence was not statistically reliable, differences in effect sizes in separate analyses for the
two ethnic groups for relationships between employment quality (graduate job or no graduate
job) and usage of personal contacts showed that ethnic minority graduates’ use of such
contacts may result in a slight disadvantage compared to similar usage by White graduates. In
summary, there was not much overall support for the idea that ethnic minority graduates are
disadvantaged in their job searches because their perception that it will be more difficult for
them to obtain a job leads them to use personal contacts who, because they have a
disproportionate tendency to be in lower status jobs, are not well placed to provide good job
opportunities. But there was some support for the final link in this casual chain: the idea that
ethnic minorities’ usage of personal contacts may put them at a disadvantage relative to the
White majority. Of course, given that ethnic minority graduates’ job-seeking resulted in a
greater likelihood of obtaining a graduate job relative to White graduates, any such effects
were obviously more than counterbalanced by other factors.
As an addendum to the above observations concerning perceptions of difficulties in
obtaining jobs, it is also useful to recall that, irrespective of demographic characteristics, there

37
was no self-fulfilling prophecy effect whereby perceptions of difficulties lead to poorer job-
seeking outcomes for either of the two types of outcome considered.
The only ethnic difference in job-seeking methods that existed was that White
graduates were more likely to make applications using Job Centres than ethnic minority
graduates. Given that greater use of Job Centres was associated with a lesser likelihood of
obtaining a graduate job and that White graduates were also less likely to obtain graduate
jobs, an obvious interpretation would be that because graduate jobs are less likely to be
advertised in Job Centres, White graduates’ greater use of Job Centres put them at a
disadvantage. However, there was little support for such an assertion, the relationship
between ethnicity and finding a graduate job diminishing only slightly when Job Centre usage
was statistically controlled.
Consistent with the fact that White graduates were more likely to use Job Centres and
the above characterisation of the types of jobs that are available in Job Centres, ethnic
minority graduates also sought higher salaries. As was also true of the finding that ethic
minority graduates obtained proportionately more graduate jobs, this does not support the
notion that ethnic minority graduates target lower status jobs because they perceive
themselves to be at a disadvantage in the job market. However, we plan to check whether
demographic factors and types of subject studied can explain this (for example, it may be that
the ethnic minority graduates were disproportionately based in London where salaries are
higher, and / or that the ethnic minority graduates tended to study academic disciplines that
equipped them for applying for posts in more highly remunerated occupations).
In general, there was an absence of gender differences in the job-seeking methods
used by the graduates. However, the data showed that across all gender and ethnic groups
there was a large amount of Internet usage during job-seeking. The fact that no differences
existed in usage of this method was encouraging since it might have been assumed that
females and ethnic minorities would be placed at a disadvantage by the increasing usage of
the Internet as a recruitment tool by all types of organisation. So, far from the increasing
tendency of companies to use the Internet for recruitment being a factor that might possibly
exacerbate inequalities in access to jobs, the present evidence suggests that such a trend may
help to level the playing field.
In ending this report, it is important to note that for the purposes of the present
analyses involving the employment quality variable any graduate who did not obtain a (self-
declared) graduate-level job was categorised as being relatively unsuccessful. Whether any
particular graduate themselves sees their taking up of a job that does not require a degree as
meaning that they have been unsuccessful is a different matter. In fact, entering employment
at a non-graduate level does not necessarily make for medium-term / long-term problems.
Aiming low can be a useful strategy in that people of graduate calibre can often rise quickly
in a company if they prove their worth. So this might be a useful strategy for people who find
it difficult to compete in the graduate job market either because they lack self-confidence, or
do not fit the perceived demographic profile that might be expected by employers of
graduates (e.g. white, middle class, with the lack of any pronounced regional or foreign
accent). Of course, any graduate intending to pursue such a strategy should ensure that there
are sufficient prospects for promotion within companies or organisations to which they apply
for employment.

38
References
Battu, H., & Sloane, P.J. (2004). Over-education and ethnic minorities in Britain. The
Manchester School, 72, 535-559.
Brosnan, M. (1998). Technophobia: The psychological impact of information technology.
London: Routledge.
Buckham, L. (1998). ‘Perhaps we’re thinking there isn’t a career out there for us’: A study of
undergraduates’ attitudes to their future prospects. British Journal of Guidance &
Counselling, 26, 417-433.
Cabinet Office Strategy Unit. (2003). Ethnic minorities and the labour market. London:
Cabinet Office.
Centre for Higher Education Research and Information (2002). Access to what? How to
convert educational opportunity into employment opportunity for groups from
disadvantaged backgrounds. Retrieved Dec. 22nd, 2004 from
http://www.staffs.ac.uk/institutes/access/docs/Event7JB2.doc.
Charlton, J.P., Taylor, S., Ranyard, R., & Hewson, C. (2006). Ethnic differences in post-
higher education employment: A study of differences in perceived difficulties in obtaining
jobs, occupational values, and influences on job choice. Available at
http://www.bolton.ac.uk/uni/research/psych/behavior.html.
Cohen, J. (1988). Statistical power analysis for the behavioral sciences (2nd ed.). Hillsdale,
NJ: Lawrence Erlbaum.
Connor, H., La Valle, I., Tackey, N.D., & Perryman, S. (1996). Ethnic minority graduates:
Differences by degree. Labour Market Trends, September, 395-6.
Cooper, J., & Weaver, K.D. (2003). Gender and computers: Understanding the digital divide.
Mahwah, NJ: Lawrence Erlbaum.
Fouad, N.A., & Bingham, R. (1995). Career counseling with racial/ethnic minorities. In W.B.
Walsh & S.H. Ospinow (Eds.), Handbook of vocational psychology (2nd ed., pp.331-366).
Hillsdale, NJ: Lawrence Erlbaum.
HESA. (2002). First Destinations Returns. Cheltenham, England: HESA.
HESA (2004) Students in Higher Education Institutions 2002 - 2003 re-issue. Retrieved
February 24, 2006, from http://www.eoc.org.uk/pdf/facts_about_GB_2005.pdf
Melamed, T. (1996). Career success: An assessment of a gender-specific model. Journal of
Occupational and Organizational Psychology, 69, 217-226.
Modood, T. (1998). Ethnic diversity and racial disadvantage in employment. In T.
Blackstone, B. Parekh & P. Sanders, Race relations in Britain: A developing agenda
(pp.53-73). London: Routledge.
Office for National Statistics (2004). NS-SEC Classes and Collapses (subsection 3.5). The
National Statistics Socio-Economic Classification User Manual Version 1.1. London:
National Statistics Publication. Retrieved 1st September 2004 from
http://www.statistics.gov.uk/methods_quality/ns_sec/downloads/NS_SEC_USER_VE
R1_V1.pdf
Prospects (2003). Retrieved February 24, 2006, from
http://www.prospects.ac.uk/cms/ShowPage/Home_page/Members___Log_in/Labour_
market_information/Graduate_Market_Trends/Female_graduates_in_the_labour_market_
_Summer_03_/p!eafecX.
Swanson, J.L., & Fouad, N.A. (1999). Career theory and practice. Thousand Oaks, CA: Sage.
Taylor, S., Ranyard, R., & Charlton, J.P. (2006). Graduate Entry into the UK labour market:
Demographic differences in perceptions of disadvantage. Proceedings of the 2006 IAREP
/ SABE Conference. Paris: University of Paris 1 / University of Paris 5. Available at
http://www.bolton.ac.uk/uni/research /psych/behavior.html.

39
Appendix
Descriptions of Selected Cases
Although useful for obtaining insight into overall patterns of job-seeking behaviours, the
quantitative analyses that form the bulk of this report do not provide much detail of job-
seeking behaviours at an individual level. The case descriptions of the four ethnic minority
graduate job-seekers contained in this appendix are therefore provided for those readers with
an interest in considering some individual patterns of behaviour.
In selecting the cases for this appendix it was considered useful to include profiles of
graduates from different minority ethnic groups, although no comment is made on the extent
to which these profiles shed light upon the reasons why the graduates’ job searches were more
or less successful than those of others4. In the interests of brevity outcomes of job applications
that did not reach the interview stage are not explicitly mentioned.
In considering the graduates’ job-seeking behaviours, both the data from the
quantitative and qualitative data from job-seeking diaries and the quantitative data from other
questionnaires is considered (although data on occupational values is not considered because
it was missing for a number of the people chosen). With respect to quantitative data from both
sources, using the data set as a whole (i.e. using the combined data for all ethnic majority and
ethnic minority groups) we calculated graduates’ z-scores for various measures, and for each
participant profiled we focussed upon variables where z-scores exceeded +/- 1.00 (i.e. scores
which were greater or less than one standard deviation from the mean for the whole data set).
The z-scores, and for some variables the raw scores that the z-scores represent, are presented
in Tables A1 to A5.
Graduate 1: A female Black Caribbean graduate who obtained a graduate-level post.
This person was 37 years old upon entering her BSc Sociology course at a post-1992
university in London. She gained entry to university with a certificate in Urban Community
Studies and a Diploma in Race and Racism, and had been a manager of a children’s home
prior to entering university. She was the first person in her family to have undertaken an HE
course, intended to lived in her own home upon graduating (as opposed, for example, to living
with her parents), and considered herself to be working class. She graduated with an upper
second class degree. Upon leaving university she did not intend to target any specific type of
job. Her degree subject was of some relevance to all of the jobs she had applied for. All of the
jobs were in the London area, and apart from one post were at graduate-level and largely in
the public sector. Her first four applications were for jobs as a personal advisor, fund
programme manager, job network officer and behavioural support worker. These jobs offered
salaries which tended to be in the £20,000 - £30,000 range (and her z-score data in Table A1
show that overall she tended to apply for jobs with higher salaries than most other
participants, probably because of her previous experience), and had been advertised in
newspapers or other paper media. Subsequent to lack of success with these applications she
registered with four recruitment agencies with the aim of obtaining employment in the area of
social care (in fact, the z-score data in Table A2 shows that she had a greater tendency to use
4 It was originally intended to include the profiles of relatively successful and unsuccessful ethnic minority
graduates paired for gender and ethnicity in this appendix. However, after the pairs were formed and the case
studies were written and shown to the graduates concerned, two of the less successful graduates (i.e. graduates
who did not graduate-level jobs) failed to give permission for their case studies to be included in a document
that was to be made publicly available and therefore it was necessary to exclude these cases.

40
recruitment agencies than most other participants). Contact with one of these agencies
resulted in an interview for a graduate-level post as a housing support worker dealing with
anti-social behaviour (salary unknown), but this did not result in a job offer (apart from the
job she obtained, from all of the applications made this was the only post for which she was
invited for interview). In addition to using recruitment agencies, she still persisted with other
job search methods and applied for a post as a local authority research officer (salary £20,000)
via a newspaper advertisement and a post as a director of a community action project (salary
£30,000) via the Internet. Two weeks after making her first job application, and after making
ten job applications, via a recruitment agency, she was successful in obtaining a job as a
housing officer with a housing association in her home town area (London) at a salary of
£24,000 per annum.
Relative to the sample as a whole, the z-score data in Table A4 shows that while she
did not think that her age or gender were responsible for her failure to obtain jobs that she
applied for, she did think that her ethnicity and religion may have been problematic. This was
the case even though her data on the perceived difficulties in obtaining a job questionnaire
(see Table A3) indicated that she was not particularly extreme in her perceptions that
someone of her gender and ethnicity would find it difficult to get a graduate job. In fact she
thought that it would be particularly easy for someone with her gender and ethnicity
characteristics to get a caring / socially orientated job. But given that she did not score
particularly highly as far as any of the possible non-demographic reasons for failure to secure
jobs were concerned (being under- or over-qualified, quality of applications, interview
performance or lack of experience: see Table A5), her ethnicity and religion seemed to be
particularly salient to her as reasons for not obtaining the posts she applied for.
To summarise, the fact she thought that her gender and ethnicity might be causing
problems in gaining employment did not deter this person from persevering in applying for
jobs with a reasonably high status and reasonable salaries (this is likely to have been
attributable to the fact that she had been a mature student and had held a responsible job prior
to entering university and was therefore not prepared to apply for low-grade employment),
and this behaviour paid off, with success in obtaining a graduate-level job coming quite
quickly, albeit as the result of a lot of effort.
Graduate 2: A male Indian graduate who obtained a graduate-level post.
This graduate was aged 18 when he started his BA Economics and Management course at a
pre-1992 university in West Yorkshire. His highest earning parent was an accountant, and
both of his parents had attended university, but the graduate thought of himself as working
class. He entered university with A’ levels. After graduating he intended to share rented
private accommodation, and obtain employment in the advertising industry in an accounts
management department. Subsequent to graduating with an upper second class degree, all of
the posts that this person applied for were for non-public sector companies in London. The
first two posts applied for were graduate-level jobs in accounts management discovered on
the Internet, the first one at a salary of £18,000, and the second at an unknown salary. The
next three applications were for posts in advertising, which appear to have been less relevant
to this person’s degree subject. Two of these jobs were accessed through a recruitment agency
and one was accessed through a newspaper or other printed media. The first advertising post
was an advertising trainee which offered a salary of £16,500 and did not require a degree. The
other two advertising posts were both at graduate-level, one as a trainee advertising executive
(salary £18,000) and one in television advertising sales (salary unknown). Although an
interview was obtained for the former of these two jobs, he did not attend the interview

41
because he did not want the job. Next he applied for a post as a Junior Analyst that he found
on the Internet (a non-graduate-level post with an unknown salary) but the vacancy had
already been filled when his application was received. The next two applications were to two
companies offering non-graduate-level jobs in event staffing, both of which were sought out
using a speculative approach by telephone (these two applications made over the telephone
constituted over one-fifth of his job applications, and this relatively high proportionate use of
the telephone is reflected in his rather high z-score for this activity shown in Table A2). The
rate of pay for the first of these jobs was £6 per hour with an estimated salary of £12,480 per
annum, and the pay for the other post varied (although it was not stated in the person’s job
seeking diary, it seems likely that these two jobs only offered employment on an irregular
basis). Job offers were received for both of these posts, however, shortly after these offers,
five weeks after first applying for a job, and after nine job applications, using a speculative
approach by letter and CV he obtained and accepted a graduate-level job in his home area
(London) as a television assistant on a salary of £16,500 per annum.
Examination of the z-scores concerning this person’s opinions as to why he failed to
obtain jobs that he applied for showed that he did not consider that his demographic profile
was particularly problematic (see Table A4) and this was also true for the non-demographic
reasons (see Table A5). In fact, this person seemed particularly confident that his interview
performance was not letting him down. In general the aforementioned lack of concern about
the possibility that his demographic characteristics might have been responsible for him not
obtaining jobs was reflected in the perception of difficulties in obtaining jobs data (see Table
A3) which showed that, apart from his perception that people of his gender and ethnicity
might have problems getting caring socially / socially orientated jobs (a perception that was
not relevant to his job search given the types of job that he was targeting), this person did not
see any particular problem with people like himself getting jobs.
In summary, this person persisted in applying for the types of job that he intended to
target upon leaving university, while, when it became apparent that success might not come
quickly, also being prepared for less regular lower-level work to tide him over until he had
achieved what he set out to (which he ultimately did). Also, this case illustrates the value of a
speculative approach and perseverance. With respect to this latter point, part of the reason
behind this person’s ultimate success may have been the amount of job seeking he did, the
relevant z-score in Table A1 showing that he was quite highly placed in the distribution of
people with respect to the number of hours per week he devoted to job-seeking.
Graduate 3: A female Pakistani graduate who obtained a graduate-level post.
This person was aged 19 when she commenced her BSc Business Management and
Marketing course at a pre-1992 university in London. Her highest earning parent was a
Mechanical Engineer, she entered university with A’ levels and at least one of her siblings
had previously entered HE. She did not think of herself as belonging to any specific social
class. She did not have any specific ideas about the type of work that she would target when
she left HE, and it was not known whether she planned to live at home or elsewhere.
Subsequent to graduating with an upper second class degree she made ten job applications.
The amount of time per week she spent searching for jobs was rather low compared to other
graduates (see Table A1). Of the nine posts she applied for before she was successful, all were
in London, and she learned of six posts via the Internet and three via newspapers or other
paper media. Her use of the Internet in this respect was comparatively high compared to that
of the graduates as a whole (see Table A2). Six of the applications involved public service
jobs, three of them being with local authorities (two graduate-level posts as an Administrative

42
Clerk / Officer at salaries of £18,000, and one graduate-level post as a Referrals Officer at a
salary of £18,000, and one of them being a graduate-level post in national government as an
Executive Officer (salary again £18,000). The other two public service jobs were both
graduate-level posts with non-public sector organisations; one as a Primary Learning Mentor
(salary £21,000) and one as a School Home Support Assistant (salary £18,000). The three
non-public service posts applied for were varied; one was a non-graduate post as a part-time
administrator (salary £14,000) with a company whose business is unknown, one was with a
nationally known private sector employment agency as a Trainee Recruitment Consultant (it
is unknown whether this was a graduate-level job, salary £18,000), and one was for a place on
the graduate training scheme of a nationally known supermarket (salary £21,000). She
obtained an interview for this latter post, but was unsuccessful. However, three weeks after
starting her job search she obtained a post as a teacher at an Islamic girls’ primary school
within her home area (London) with an unknown salary, a job which she had first seen on the
Internet.
The quantitative demographic data (Table A4) showed that although she seemed to be
confident that her age was not a factor in preventing her getting the job that she was
unsuccessful in applying for, she though that her ethnicity was particularly problematic (and
also her religion too, but to a less extreme extent). This was consistent with the data on
perceptions of difficulty in obtaining a job, which placed her perceptions of the difficulties
that would be experienced by someone of her own gender and ethnicity as being above the
mean for all four of these factors (Table A3), and showed that these perceptions were
particularly salient as far as caring / socially orientated and high status graduate jobs were
concerned. However, this latter perception did not deter her from applying for graduate-level
posts. She also held the opinion that both the quality of her job applications and her
performance in interviews might be important factors in her failure to obtain jobs that she
applied for.
Summarising, this graduate appears to have perceived that her ethnicity was likely to
be an issue when applying for jobs, although this did not deter her from applying for a range
of positions. When she failed to get many responses she applied for (and obtained) a job in
her own religious community.
Graduate 4: A female Pakistani graduate who did not obtain a graduate-level post.
This person had again entered HE at the age of 19, when she enrolled in a BSc Honours
Psychology course at a post-1992 university in London. Her father was a market trader, no
members of her family had previously entered HE, and the graduate thought of herself as
working class. Entering university with A’ levels, she did not have any firm ideas about the
type of work that she planned to go into when she left university, and it was not known
whether she planned to live at home or elsewhere. Leaving university with an upper second
class degree, all of the posts that this person applied for were seen on the Internet (hence her
high z-score for this job-seeking method in Table A2) and the first seven were in London.
Only the first post (a graduate-level post as an Assistant Psychologist at an NHS Trust, salary
£14,275 per annum) was closely related to her degree. On failing to obtain an interview for
this job she applied for a number of educational posts in London through educational
employment agencies; daily paid Special Needs Assistant post (daily pay £50.00 - £65.00,
whether this was graduate-level is unknown), graduate-level Classroom Assistant (£7.00 per
hour), and graduate-level Learning Support Assistant post (£7.00 per hour). Subsequently, she
applied for an unspecified post through or with (this was unclear in the diary) a more general
London-based recruitment agency (salary £30,000) per year, before applying for a graduate-

43
level job as a Social Work Assistant (pay £7.50 – 10.50 per hour) using a Health and Social
Care Recruitment Agency. After applying for another graduate-level Teaching Assistant post
in London (salary unknown), she then used the same educational recruitment agency that she
had used to apply for most of the other educational posts in London to apply for a graduate-
level job as a Primary Support Assistant in Derbyshire (pay £45 per day). Following the lack
of success of all these efforts she applied for six posts with her home area local authority (in
Buckinghamshire); part-time, non-graduate-level, Library Assistant (salary £12,873 – 15,201
pro rata, number of hours unspecified), non-graduate-level Learning Support Assistant (salary
£7,092 – 8,374), non-graduate-level Library Shelver (salary unknown), graduate-level
Learning Support Assistant (salary £12,000 – 18,000), non-graduate-level, Administration
Assistant (salary unknown). Finally, after applying for 14 jobs in approximately 20 weeks, an
application to her local authority for a non-graduate job as a receptionist on a salary of
£12,000 per annum was successful. She first became aware of this post via the Internet and
this appears to be the only post for which an interview was forthcoming.
With respect to her opinions as to why she failed to obtain posts that she applied for,
the quantitative data for demographic reasons (see Table A4) showed that she considered all
four attributes (her age, ethnicity, gender and religion) to be particularly relevant. Such
opinions were also reflected on the difficulties questionnaire where her responses showed that
she thought that someone of her gender and ethnicity would find it particularly difficult to
obtain caring / socially orientated, non-graduate and commercial jobs, but not high status
graduate jobs. The data also showed that she considered both the quality of her job
applications and lack of experience to be instrumental in her failure to obtain posts that she
applied for.
Summing-up, after initially persisting in applying for a number of posts that were
somewhat related to her degree but failing to obtain any of these posts, and being prepared to
look outside her home area in doing this, this person eventually seems to have settled for
applying for a series of non-graduate posts in her home area, which ultimately resulted in
some degree of success.

44
Table A1: Major indices for job searches of case study participants
____________________________________________________________________________________________________________
Mean salary of Time until job Number of applications Mean job search
jobs applied for time per week
____________________________________________________________________________________________________________
£(k) z Weeks z Number z Hours z
Graduate
1. Caribbean Female (graduate post) 24.63 2.44 2 -0.72 10 0.11 4.00 -0.43
2. Indian Male (graduate post) 16.30 0.01 5 -0.44 9 0.00 13.17 1.38
3. Pakistani Female (graduate post) 18.22 0.58 3 -0.62 10 0.11 0.88 -1.05
4. Pakistani Female (non-graduate post) 14.19 -0.60 ------ ------ ------ ------ ------ ------
_____________________________________________________________________________________________________________

45
Table A2: Job search methods used by case study participants (continued overleaf)
_________________________________________________________________________________________________________
Percentage of Applications
Phone Family & Friends Internet Newspaper etc Job Centre
% z % z % z % z % z
_________________________________________________________________________________________________________
Graduate
1. Caribbean Female (graduate post) 0 -0.32 0 -0.40 9 -0.92 45 0.98 0 -0.36
2. Indian Male (graduate post) 22 2.34 0 -0.40 33 -0.11 11 -0.34 0 -0.36
3. Pakistani Female (graduate post) 0 -0.32 0 -0.40 70 1.13 30 0.39 0 -0.36
4. Pakistani Female (non-graduate post) 0 -0.32 0 -0.40 100 2.14 0 -0.77 0 -0.36
_________________________________________________________________________________________________________

46
Table A2 (continued): Job search methods used by case study participants
_________________________________________________________________________________________________________________
Percentage of Applications
Recruitment Speculative Recruitment e-mail/CV Local Other
Fair Letter /CV Agency Community
% z % z % z % z % z % z
_________________________________________________________________________________________________________________
Graduate
1. Caribbean Female (graduate post) 0 -0.20 0 -0.43 45 1.41 0 -0.43 0 -0.22 0 -0.38
2. Indian Male (graduate post) 0 -0.20 0 -0.43 22 0.39 11 0.55 0 -0.22 0 -0.38
3. Pakistani Female (graduate post) 0 -0.20 0 -0.43 0 -0.58 0 -0.43 0 -0.22 0 -0.38
4. Pakistani Female (non-graduate post) 0 -0.20 0 -0.43 0 -0.58 0 -0.43 0 -0.22 0 -0.38
_________________________________________________________________________________________________________________

47
Table A3: Gender specific perceptions of difficulty in obtaining jobs for case study participants (z-scores).
_________________________________________________________________________________________
Type of Job
High Status Caring / Socially Non- Commercial
(Graduate) Orientated Graduate
_________________________________________________________________________________________
Graduate
1. Caribbean Female (graduate post) 0.85 -2.31 -0.14 -0.27
2. Indian Male (graduate post) -0.25 1.25 -0.48 -0.03
3. Pakistani Female (graduate post) 1.24 1.11 0.89 0.70
4. Pakistani Female (non-graduate post) 0.74 1.32 2.69 4.83
________________________________________________________________________________________

48
Table A4: Demographic reasons for not obtaining jobs among case study participants
____________________________________________________________________________________________
Mean raw scale scores (R) and z-scores of means
Age Ethnicity Gender Religion
R z R z R z R z
____________________________________________________________________________________________
Graduate
1. Caribbean Female (graduate post) 2.00 -0.23 2.33 1.35 2.00 0.88 2.00 1.32
2. Indian Male (graduate post) 2.00 -0.23 1.80 0.58 1.00 -0.59 1.00 -0.43
3. Pakistani Female (graduate post) 1.00 -1.11 2.13 1.05 1.13 -0.40 1.75 0.88
4. Pakistani Female (non-graduate post) 4.83 2.26 2.33 1.35 2.67 1.86 2.83 2.77
_____________________________________________________________________________________________

49
Table A5: Non-demographic reasons for not obtaining jobs among case study participants
______________________________________________________________________________________________________________
Mean raw scale scores (R) and z-scores of means
Under Qualified Quality of Over Qualified Interview Lack of Experience
Application Performance
R z R z R z R z R z
______________________________________________________________________________________________________________
Graduate
1. Caribbean Female (graduate post) 3.67 0.54 2.33 -0.34 3.00 0.92 ----- ----- 5.67 0.83
2. Indian Male (graduate post) 3.25 0.24 3.80 0.83 1.20 -0.67 1.00 -1.61 3.40 -0.75
3. Pakistani Female (graduate post) 3.00 0.06 4.75 1.59 1.38 -0.51 7.00 2.01 5.38 0.63
4. Pakistani Female (non-graduate post) 3.33 0.30 4.50 1.39 2.50 0.48 ----- ----- 6.17 1.18
_____________________________________________________________________________________________________________