Embed Size (px)
Citation preview
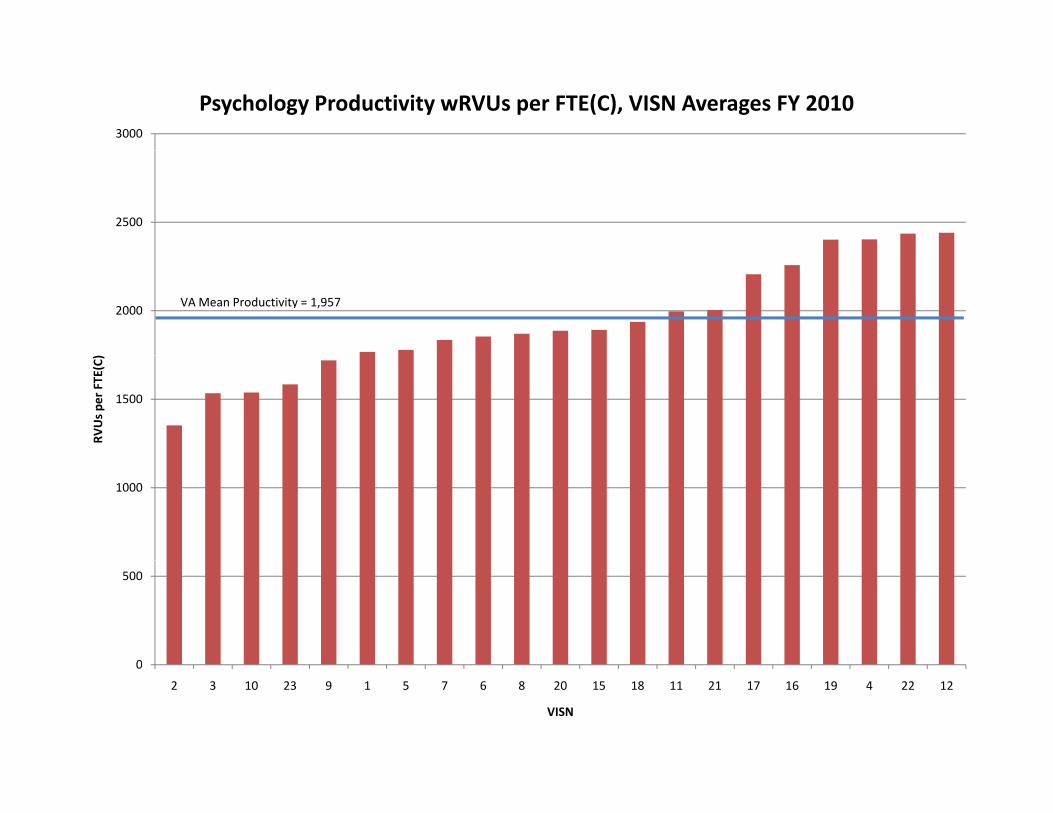
3000
Psychology Productivity wRVUs per FTE(C), VISN Averages FY 2010
2500
2000VA Mean Productivity = 1,957
1500
RVUs pe
r FTE(C)
1000
0
500
0
2 3 10 23 9 1 5 7 6 8 20 15 18 11 21 17 16 19 4 22 12
VISN
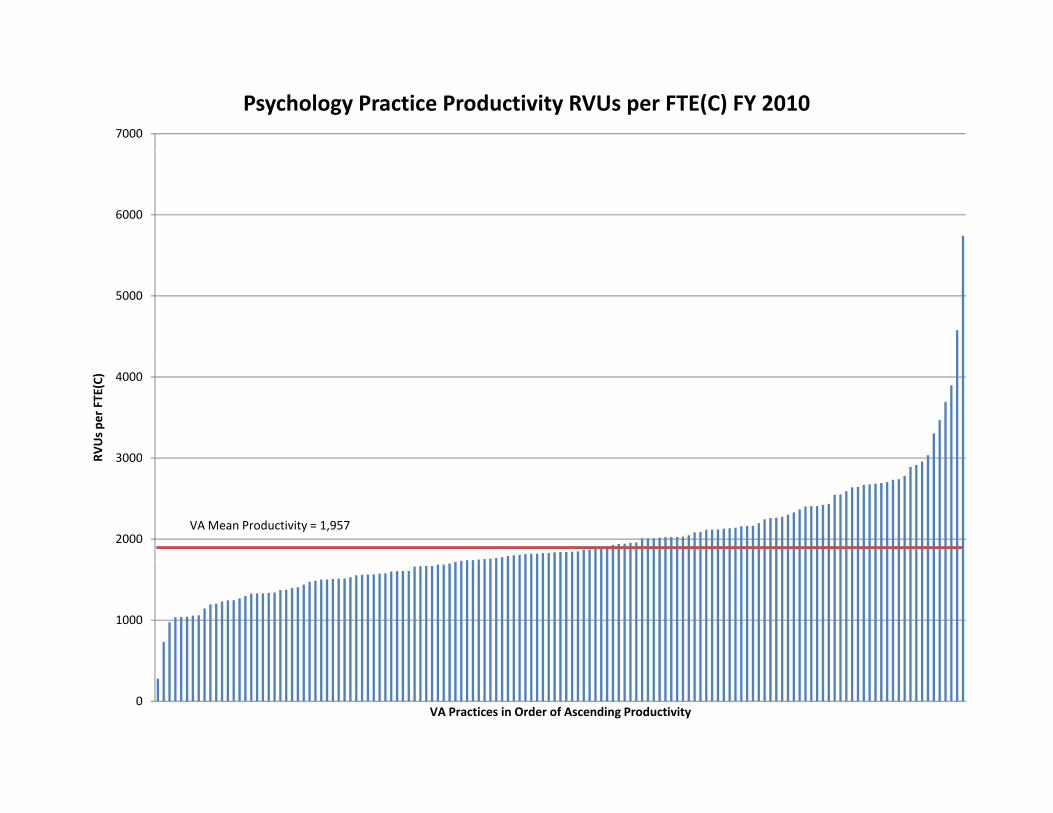
7000
Psychology Practice Productivity RVUs per FTE(C) FY 2010
6000
5000
3000
4000
RVUs pe
r FTE(C)
2000
3000R
VA Mean Productivity = 1,957
1000
0VA Practices in Order of Ascending Productivity
4000
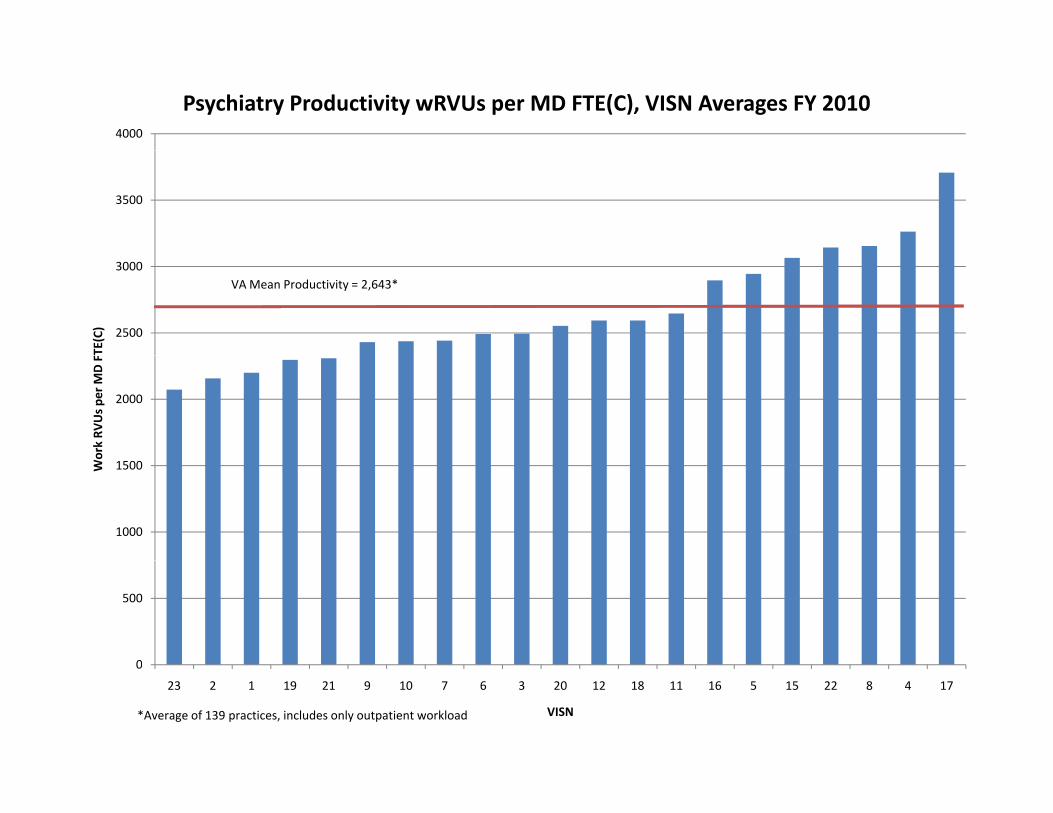
Psychiatry Productivity wRVUs per MD FTE(C), VISN Averages FY 2010
3500
2500
3000
TE(C)
VA Mean Productivity = 2,643*
2000
ork RV
Us pe
r MD F
1000
1500Wo
0
500
0
23 2 1 19 21 9 10 7 6 3 20 12 18 11 16 5 15 22 8 4 17
VISN*Average of 139 practices, includes only outpatient workload
5,000
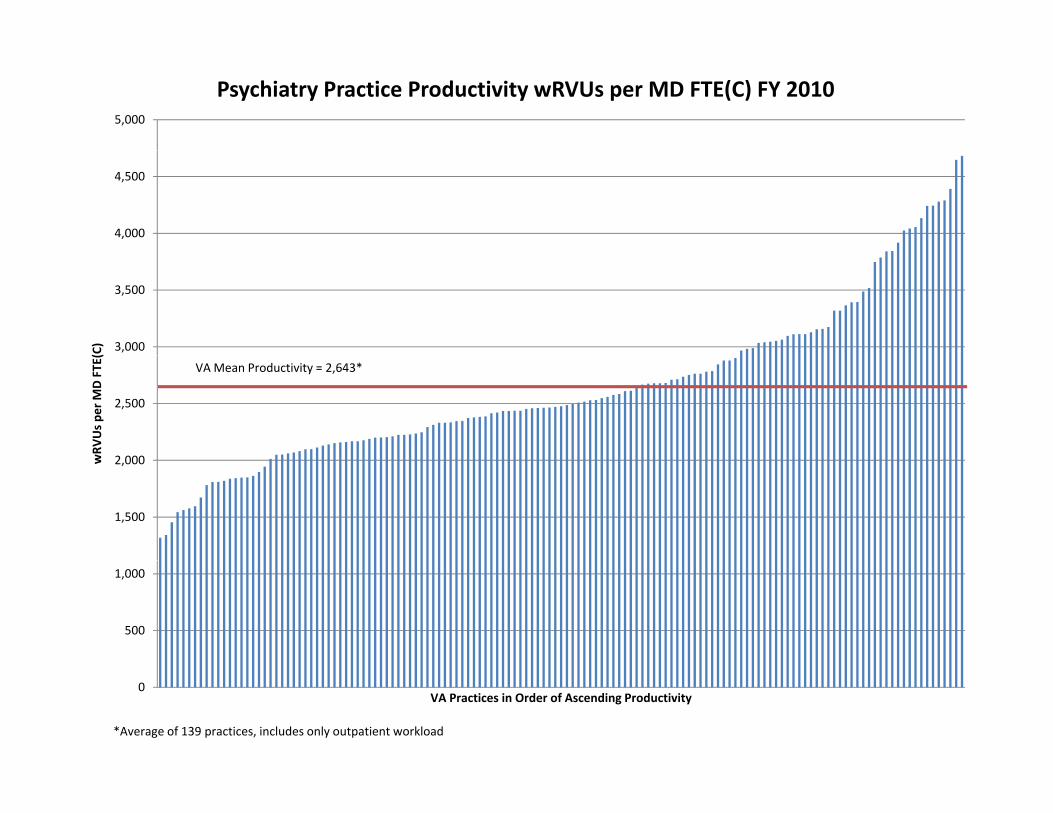
Psychiatry Practice Productivity wRVUs per MD FTE(C) FY 2010
4,000
4,500
3,000
3,500
(C)
2 000
2,500
wRV
Us pe
r MD FTE(
VA Mean Productivity = 2,643*
1,500
2,000w
500
1,000
0VA Practices in Order of Ascending Productivity
*Average of 139 practices, includes only outpatient workload
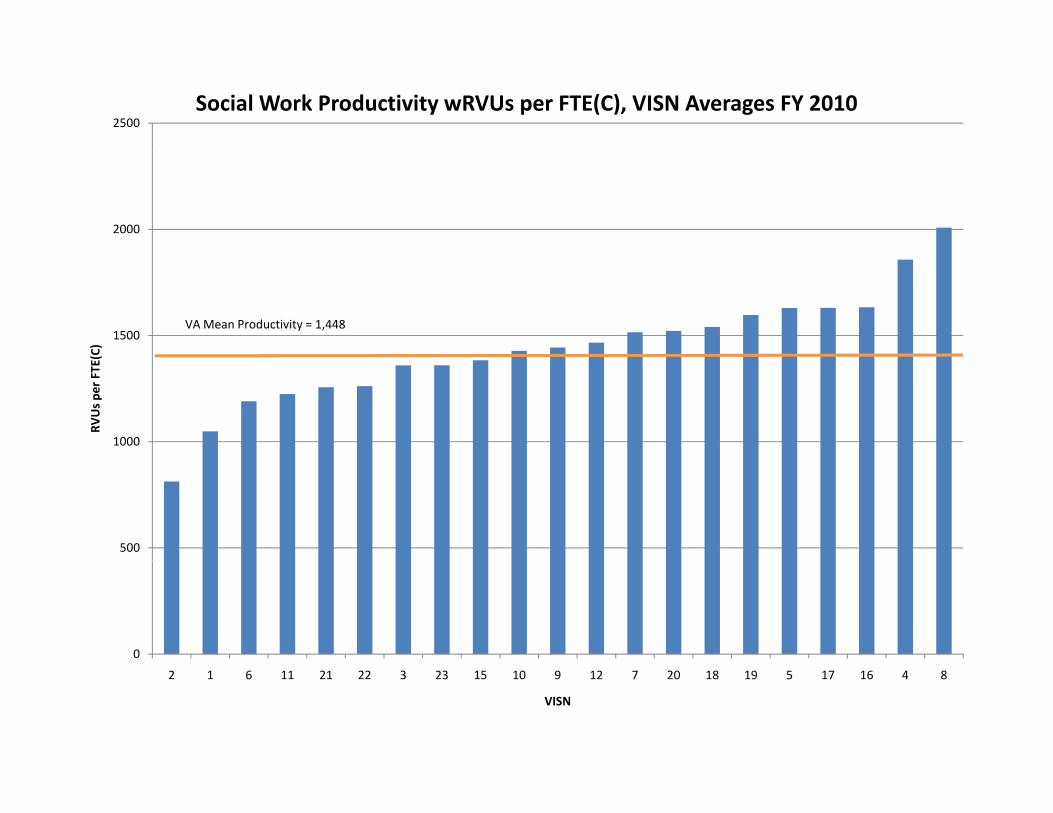
2500Social Work Productivity wRVUs per FTE(C), VISN Averages FY 2010
2000
1500
C)
VA Mean Productivity = 1,448
1000
RVUs pe
r FTE(
500
0
2 1 6 11 21 22 3 23 15 10 9 12 7 20 18 19 5 17 16 4 8
VISN

8000
Clinical Nurse Specialist wRVUs per FTE(c), VISN Averages, FY2010
7000
5000
6000
)
4000
RVUs per FTE(C)
2000
3000
VA Mean Productivity = 2,117
0
1000
0
17 6 5 3 23 21 10 22 12 11 20 2 1 18 4 19 16 8 15 7 9
VISN

4000
Nurse Practitioner wRVUs per FTE(C), VISN Averages FY 2010
3500
2500
3000
)
2000
RVUs per FTE(c)
VA Mean Productivity = 1,966
1000
1500
0
500
0
19 11 6 7 2 9 3 18 10 8 12 16 20 21 1 4 15 5 23 17 22
VISN
4500
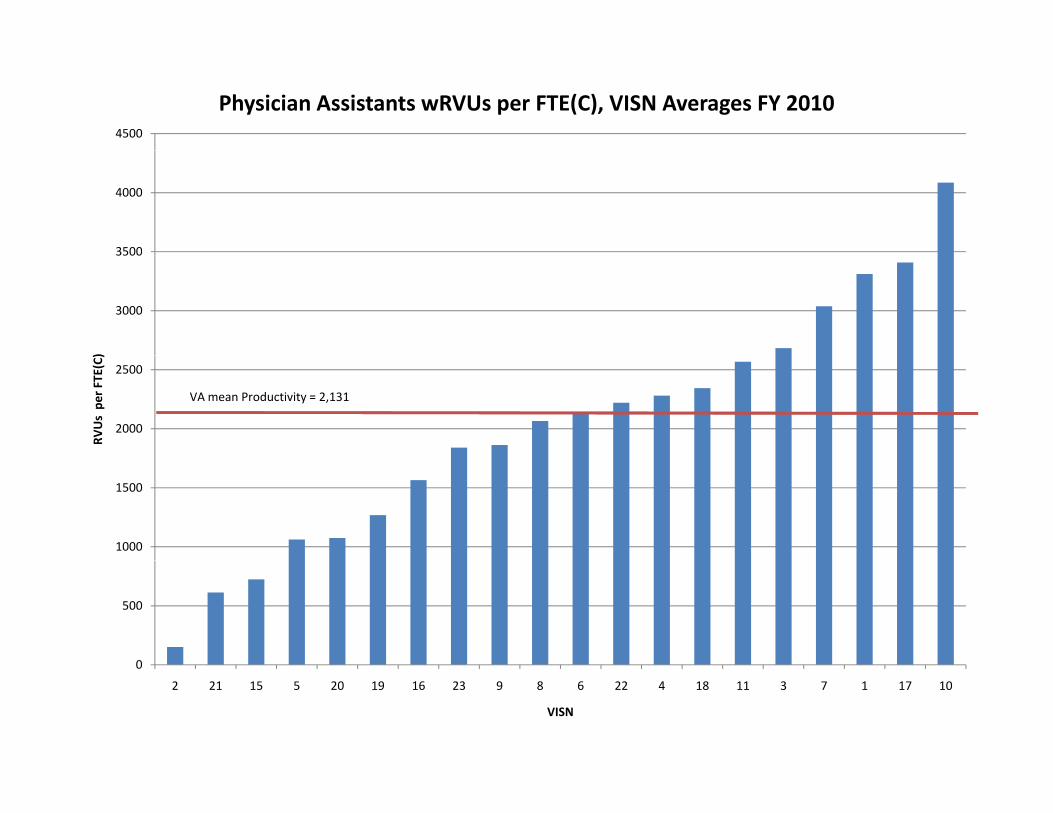
Physician Assistants wRVUs per FTE(C), VISN Averages FY 2010
3500
4000
3000
3500
)
2000
2500
RVUs per FTE(C)
VA mean Productivity = 2,131
1000
1500
0
500
0
2 21 15 5 20 19 16 23 9 8 6 22 4 18 11 3 7 1 17 10
VISN
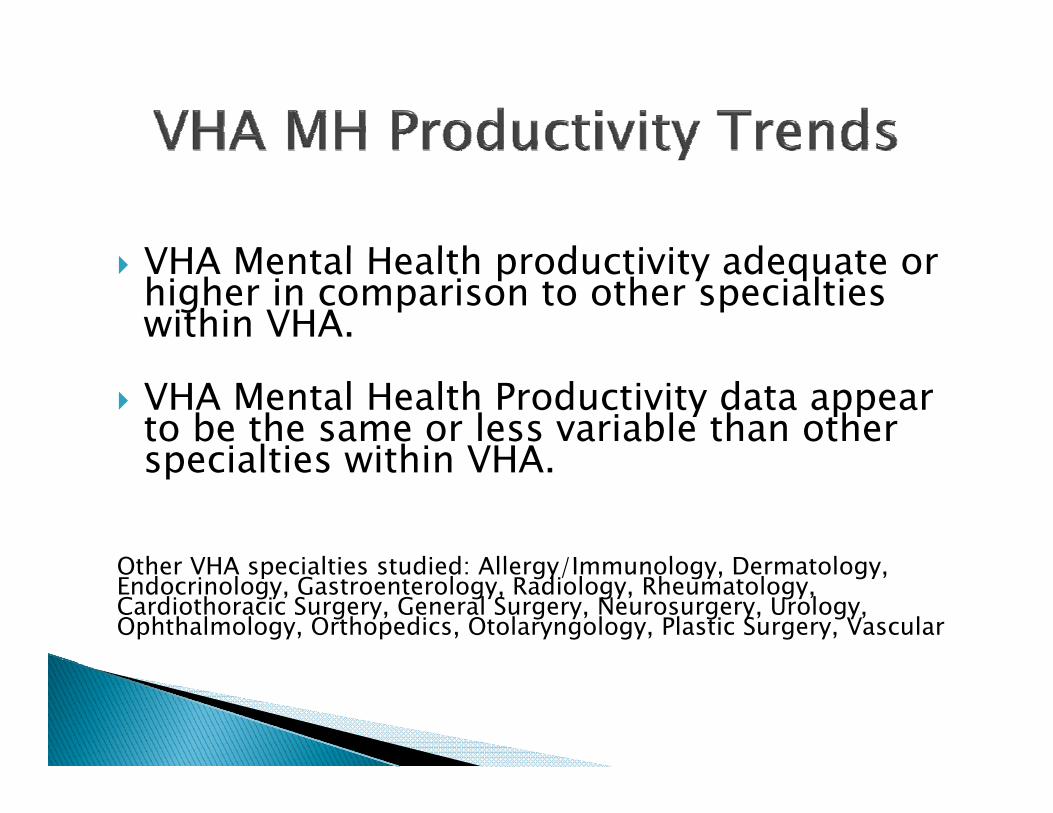
VHA M t l H lth d ti it d t VHA Mental Health productivity adequate or higher in comparison to other specialties within VHA.
VHA Mental Health Productivity data appear to be the same or less variable than other specialties within VHAspecialties within VHA.
Oth VHA i lti t di d All /I l D t lOther VHA specialties studied: Allergy/Immunology, Dermatology, Endocrinology, Gastroenterology, Radiology, Rheumatology, Cardiothoracic Surgery, General Surgery, Neurosurgery, Urology, Ophthalmology, Orthopedics, Otolaryngology, Plastic Surgery, Vascular
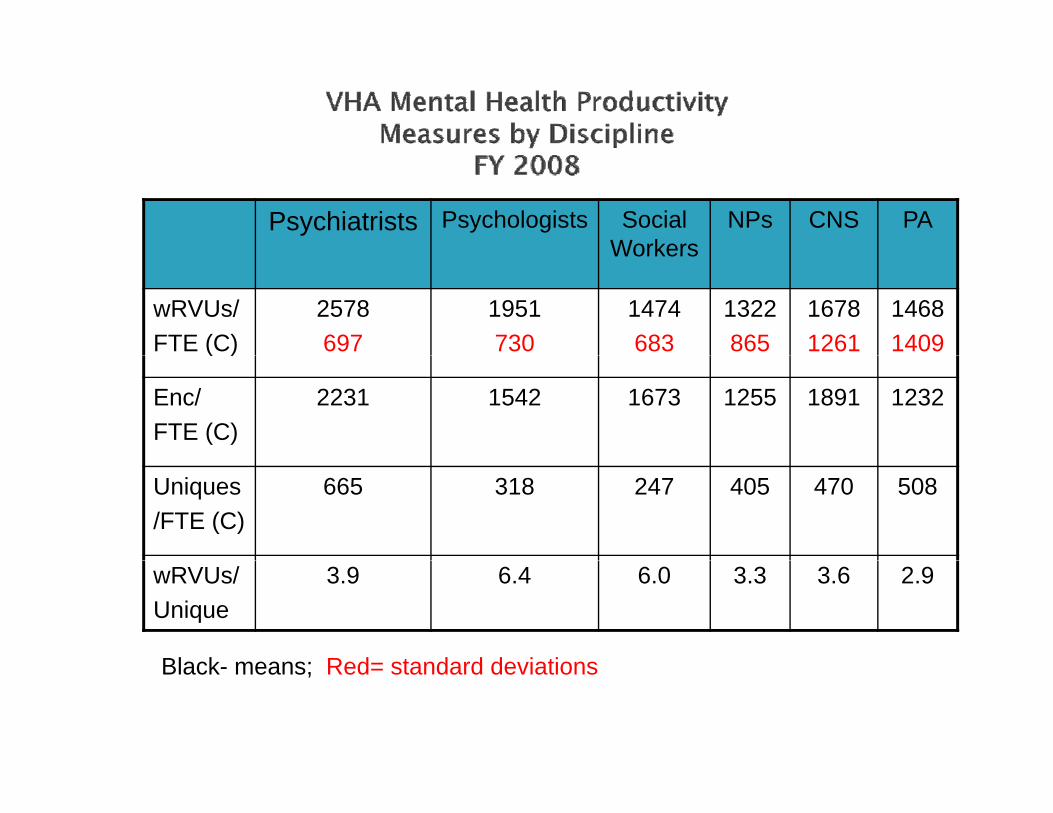
Psychiatrists Psychologists Social Workers
NPs CNS PAWorkers
wRVUs/FTE (C)
2578697
1951730
1474683
1322865
16781261
14681409( )
Enc/FTE (C)
2231 1542 1673 1255 1891 1232
Uniques/FTE (C)
665 318 247 405 470 508
wRVUs/Unique
3.9 6.4 6.0 3.3 3.6 2.9
Black means; Red= standard deviationsBlack- means; Red= standard deviations
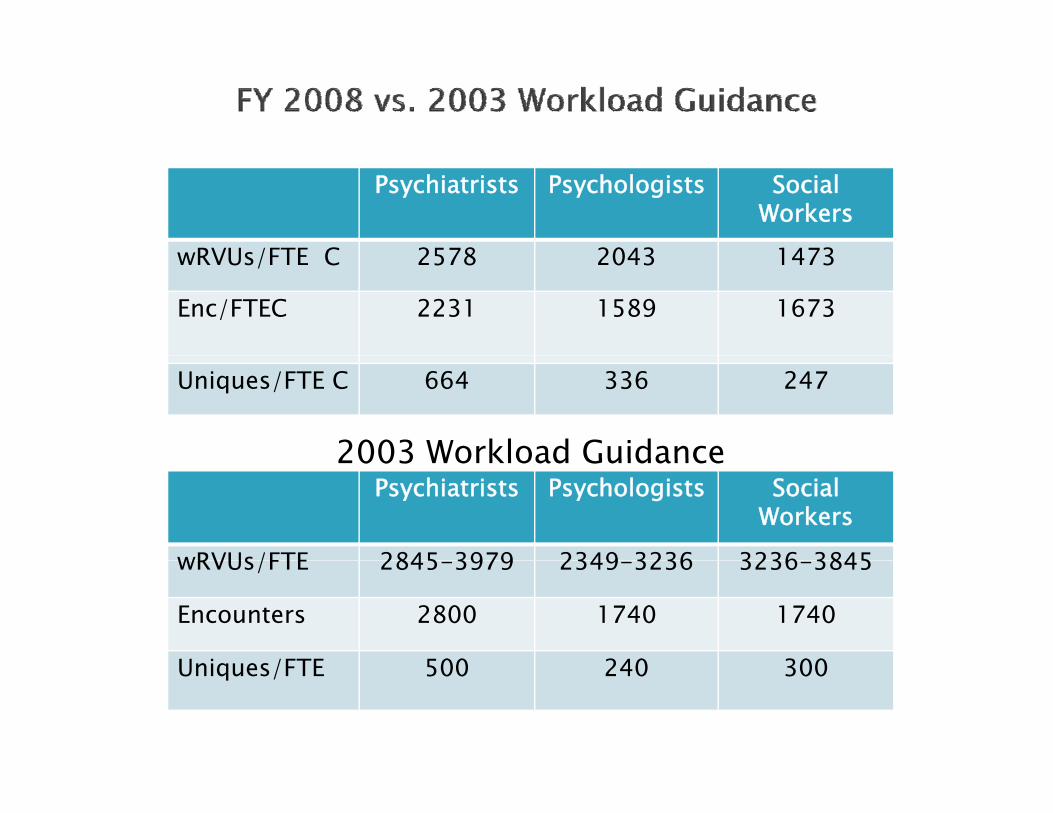
Psychiatrists Psychologists Social Workers
wRVUs/FTE C 2578 2043 1473wRVUs/FTE C 2578 2043 1473
Enc/FTEC 2231 1589 1673
Uniques/FTE C 664 336 247
2003 Workload Guidance2003 Workload GuidancePsychiatrists Psychologists Social
Workers
wRVUs/FTE 2845 3979 2349 3236 3236 3845wRVUs/FTE 2845-3979 2349-3236 3236-3845
Encounters 2800 1740 1740
Uniq es/FTE 500 240 300Uniques/FTE 500 240 300
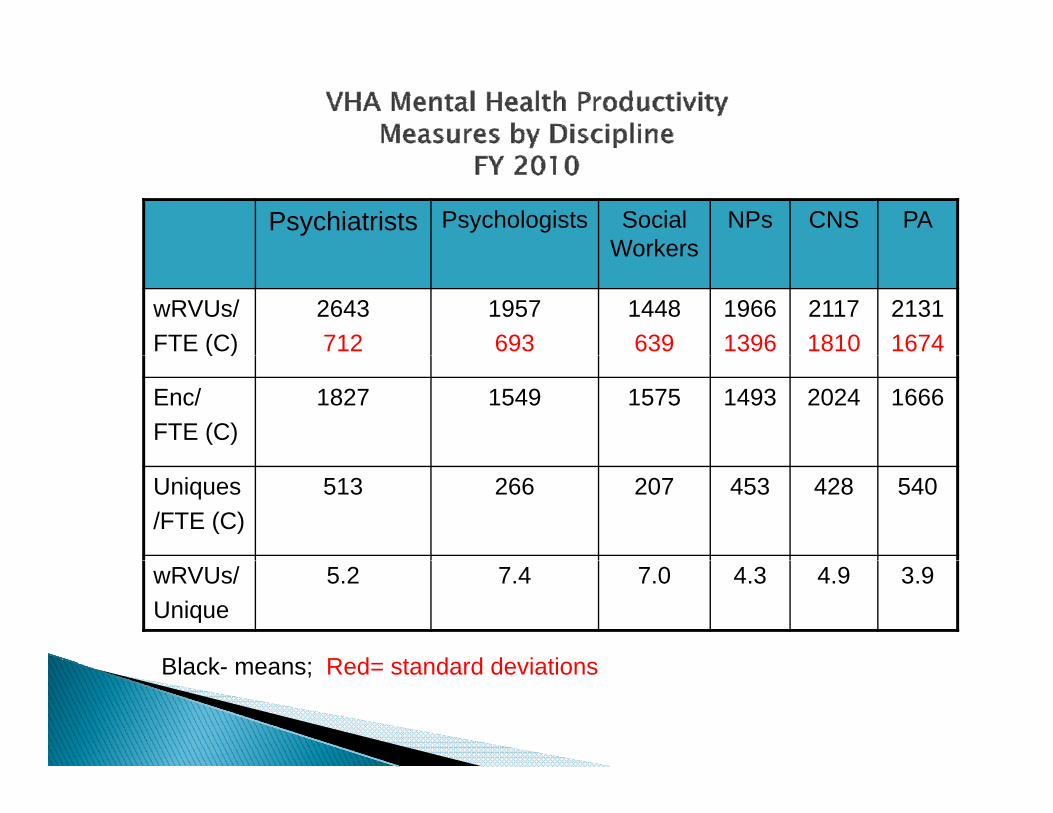
Psychiatrists Psychologists Social Workers
NPs CNS PAWorkers
wRVUs/FTE (C)
2643712
1957693
1448639
19661396
21171810
21311674( )
Enc/FTE (C)
1827 1549 1575 1493 2024 1666
Uniques/FTE (C)
513 266 207 453 428 540
wRVUs/Unique
5.2 7.4 7.0 4.3 4.9 3.9
Black means; Red= standard deviationsBlack- means; Red= standard deviations

Psychiatrists Psychologists Social Workers
wRVUs/FTE C 2578 1951 1474/
Enc/FTE C 2231 1542 1673
FY 2006 MGMAFY 2006- MGMAPsychiatrists Psychologists Social Workers
Private wRVUs/FTE
3619 2584 2371
Academic 2589 1827 NAwRVUs/FTEPriv. Enc/FTE 2197 1263 1219
Aca. Enc/FTE 1809 NA NA
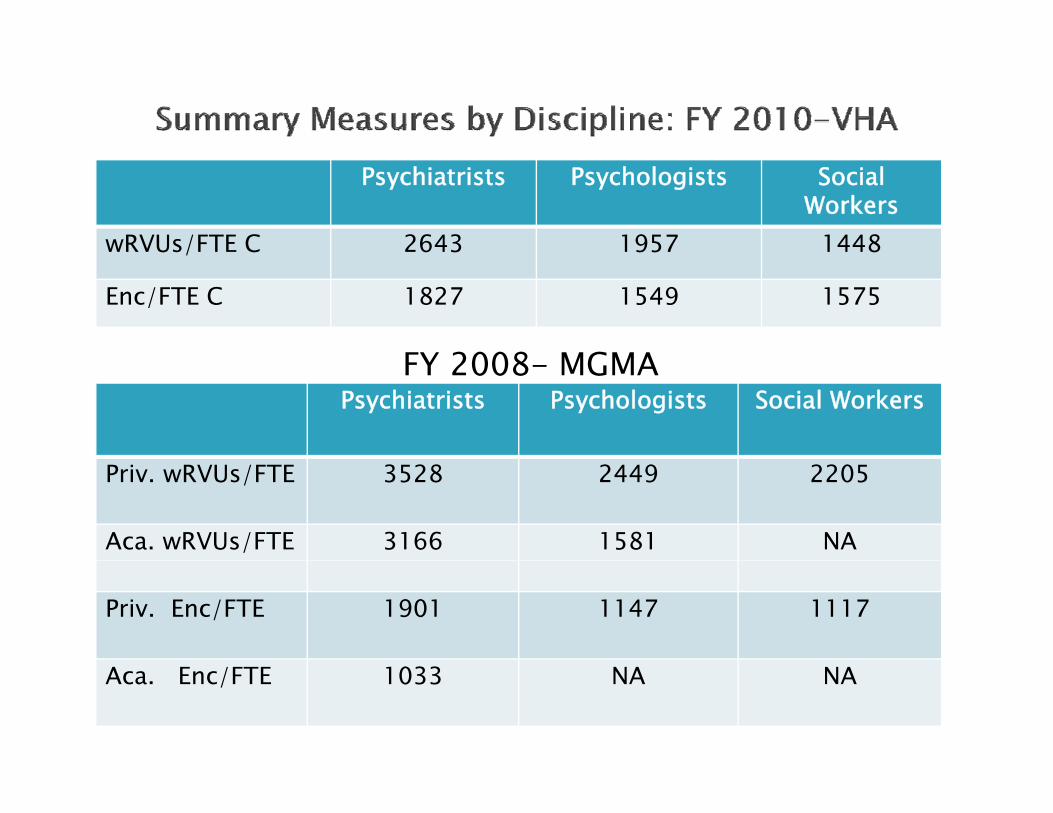
Psychiatrists Psychologists Social Workers
wRVUs/FTE C 2643 1957 1448/
Enc/FTE C 1827 1549 1575
FY 2008 MGMAFY 2008- MGMAPsychiatrists Psychologists Social Workers
Priv. wRVUs/FTE 3528 2449 2205
Aca. wRVUs/FTE 3166 1581 NA
Priv. Enc/FTE 1901 1147 1117
Aca. Enc/FTE 1033 NA NA
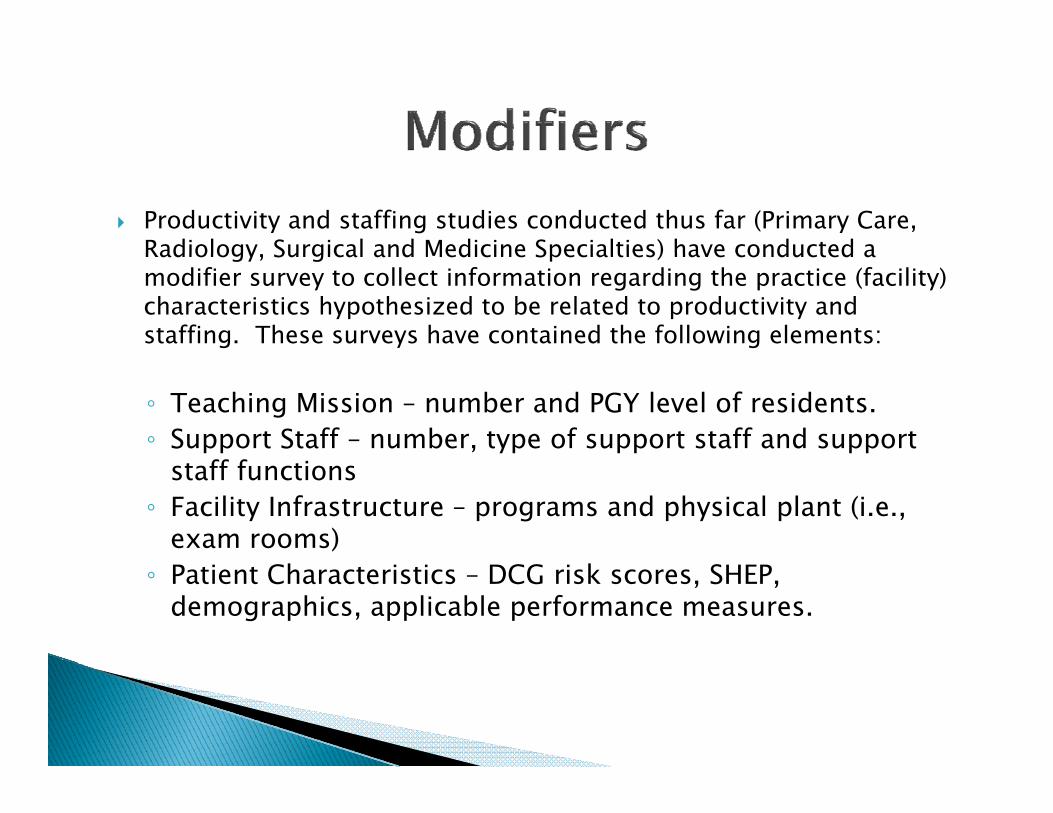
Productivity and staffing studies conducted thus far (Primary Care, Radiology Surgical and Medicine Specialties) have conducted aRadiology, Surgical and Medicine Specialties) have conducted a modifier survey to collect information regarding the practice (facility) characteristics hypothesized to be related to productivity and staffing. These surveys have contained the following elements:
◦ Teaching Mission – number and PGY level of residents.◦ Support Staff – number, type of support staff and support
staff functions◦ Facility Infrastructure – programs and physical plant (i.e.,
exam rooms) ◦ Patient Characteristics – DCG risk scores, SHEP,
demographics, applicable performance measures.
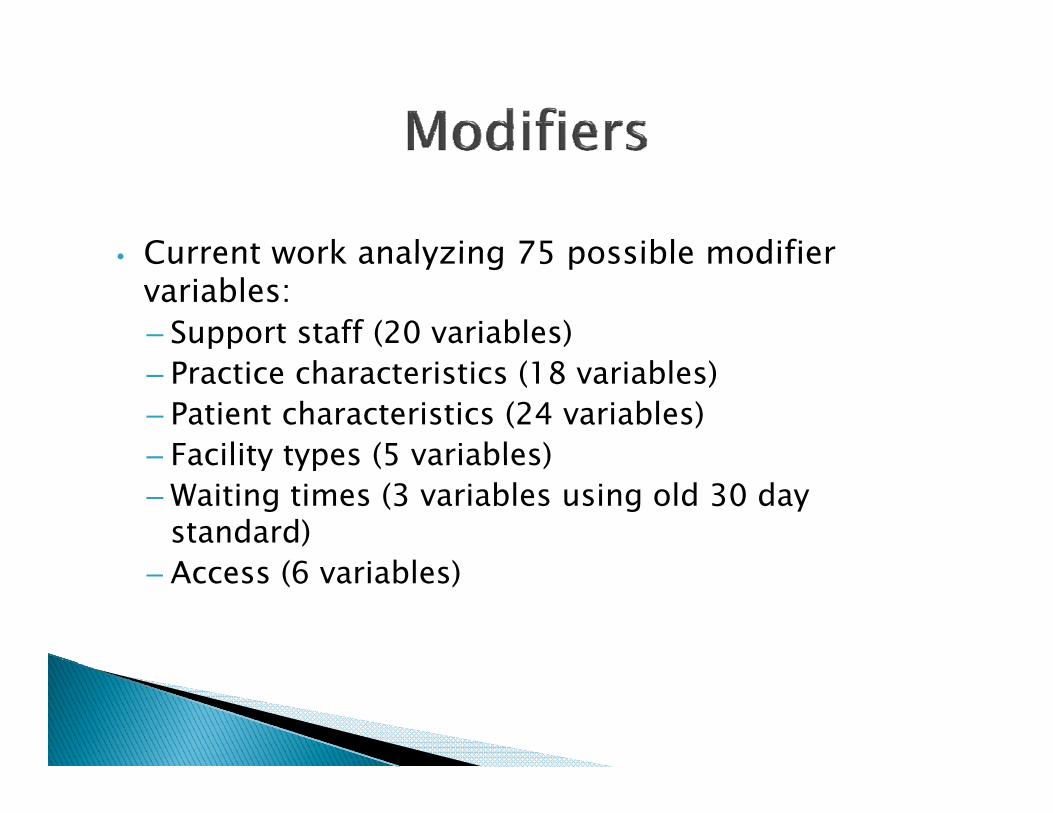
Current work analyzing 75 possible modifier• Current work analyzing 75 possible modifier variables:– Support staff (20 variables)– Practice characteristics (18 variables)– Patient characteristics (24 variables)– Facility types (5 variables)– Facility types (5 variables)– Waiting times (3 variables using old 30 day
standard)(6 bl )– Access (6 variables)
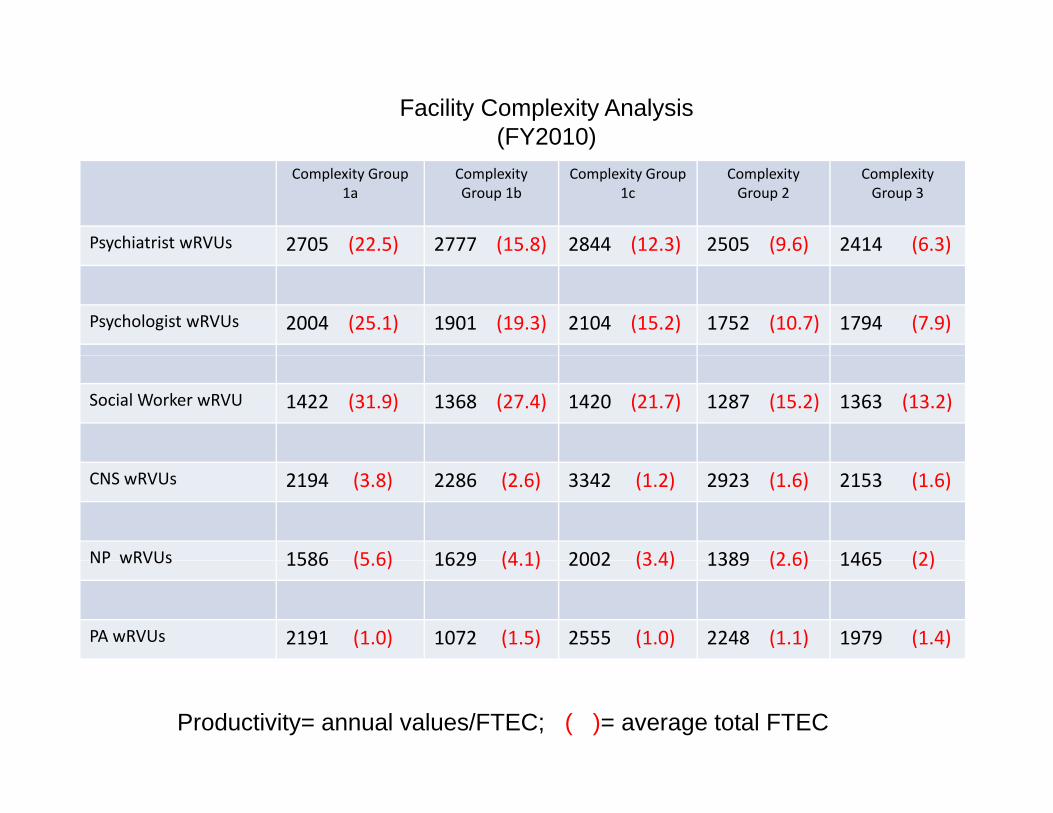
HosHhhhhhhH HFacility Complexity Analysis
(FY2010)Complexity Group
1aComplexity Group 1b
Complexity Group 1c
Complexity Group 2
Complexity Group 3
Psychiatrist wRVUs 2705 (22.5) 2777 (15.8) 2844 (12.3) 2505 (9.6) 2414 (6.3)( ) ( ) ( ) ( ) ( )
Psychologist wRVUs 2004 (25.1) 1901 (19.3) 2104 (15.2) 1752 (10.7) 1794 (7.9)
Social Worker wRVU 1422 (31.9) 1368 (27.4) 1420 (21.7) 1287 (15.2) 1363 (13.2)
CNS wRVUs 2194 (3.8) 2286 (2.6) 3342 (1.2) 2923 (1.6) 2153 (1.6)
NP wRVUs 1586 (5 6) 1629 (4 1) 2002 (3 4) 1389 (2 6) 1465 (2)NP wRVUs 1586 (5.6) 1629 (4.1) 2002 (3.4) 1389 (2.6) 1465 (2)
PA wRVUs 2191 (1.0) 1072 (1.5) 2555 (1.0) 2248 (1.1) 1979 (1.4)
Productivity= annual values/FTEC; ( )= average total FTEC

Data validation
◦ Totally dependent on quality of data entered into National Database
Workload- encounter forms, cpt codes
Workforce- labor mapping, person class designation
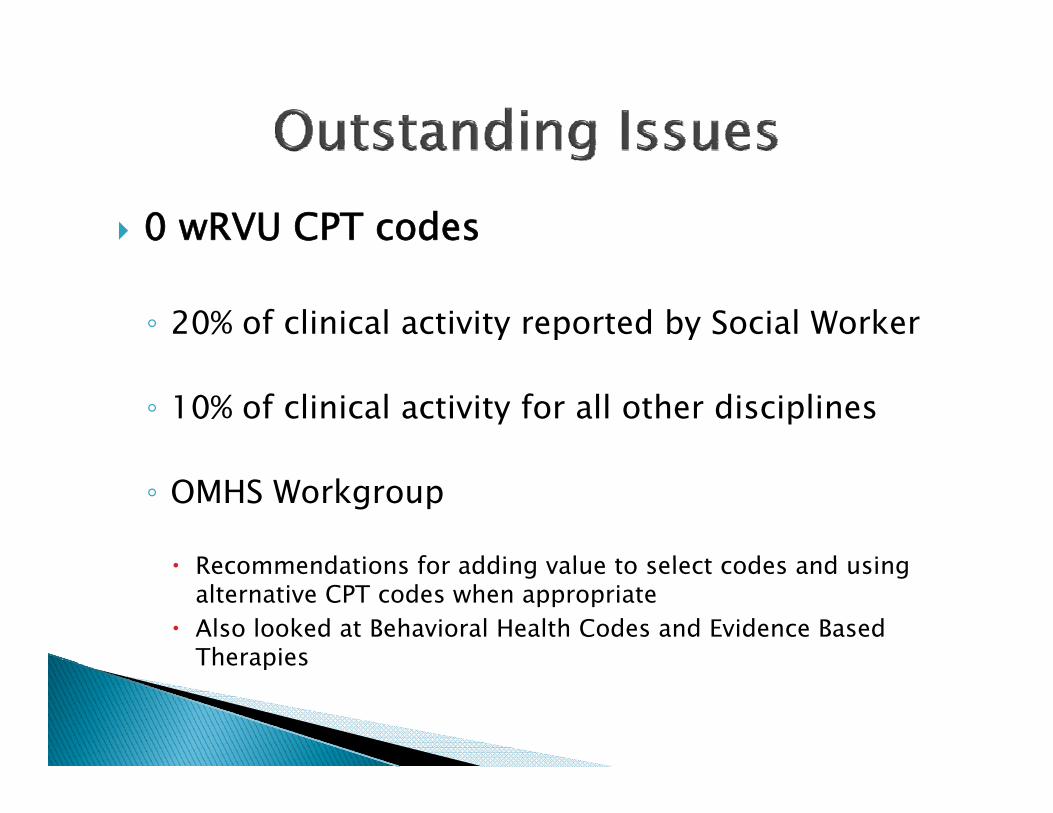
0 wRVU CPT codes
◦ 20% of clinical activity reported by Social Worker
◦ 10% of clinical activity for all other disciplines
◦ OMHS Workgroup
R d ti f ddi l t l t d d i Recommendations for adding value to select codes and using alternative CPT codes when appropriate
Also looked at Behavioral Health Codes and Evidence Based TherapiesTherapies
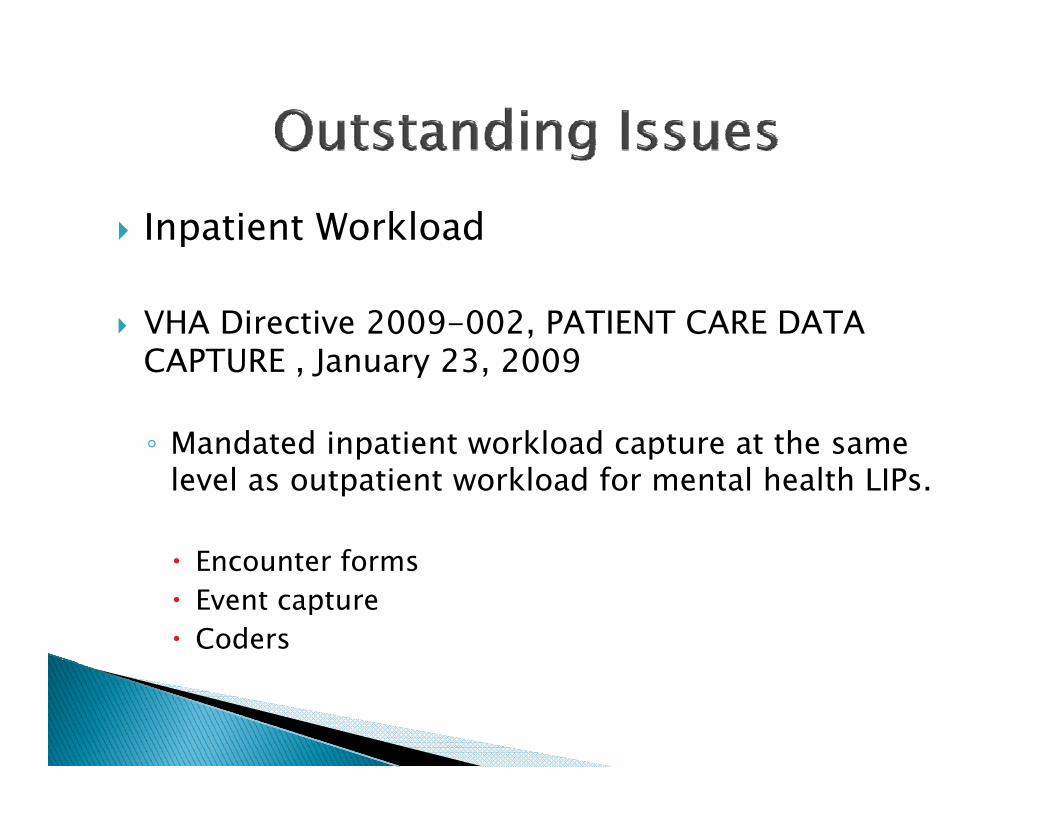
Inpatient Workload
VHA Directive 2009-002, PATIENT CARE DATA CAPTURE January 23 2009CAPTURE , January 23, 2009
◦ Mandated inpatient workload capture at the same p plevel as outpatient workload for mental health LIPs.
Encounter forms Encounter forms Event capture Coders
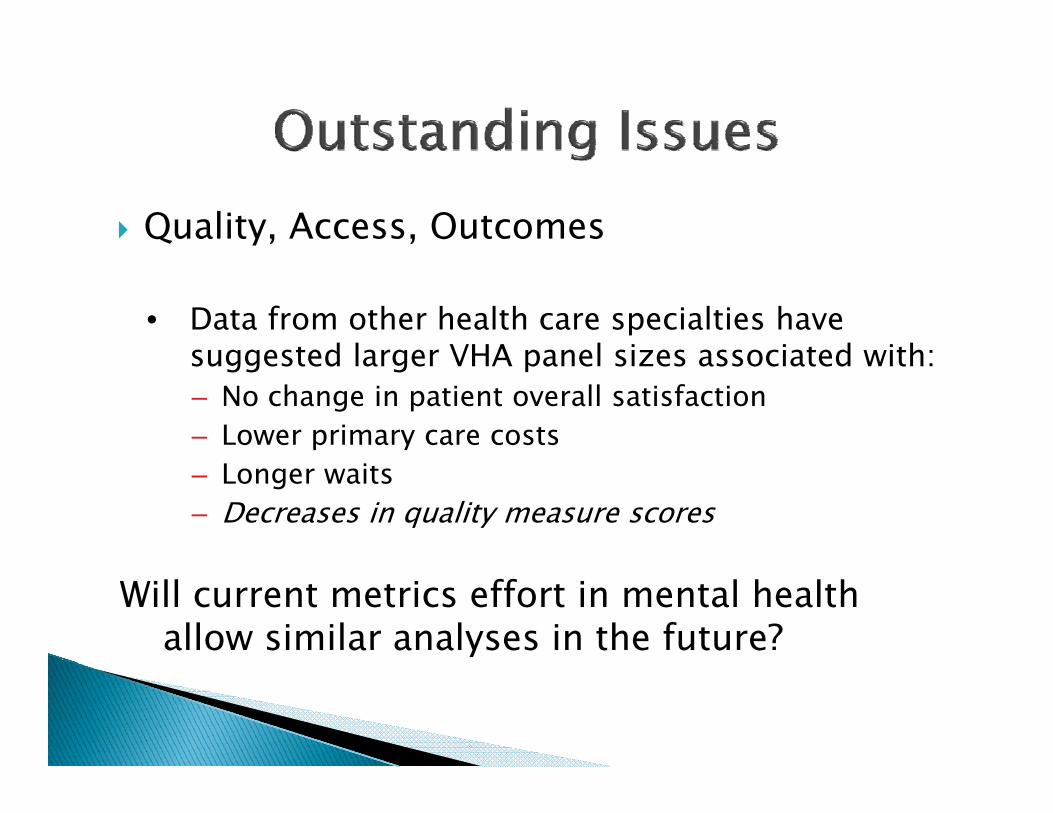
Quality, Access, Outcomes
• Data from other health care specialties have suggested larger VHA panel sizes associated with:suggested larger VHA panel sizes associated with:– No change in patient overall satisfaction– Lower primary care costs– Longer waits– Decreases in quality measure scores
Will current metrics effort in mental health allow similar analyses in the future?
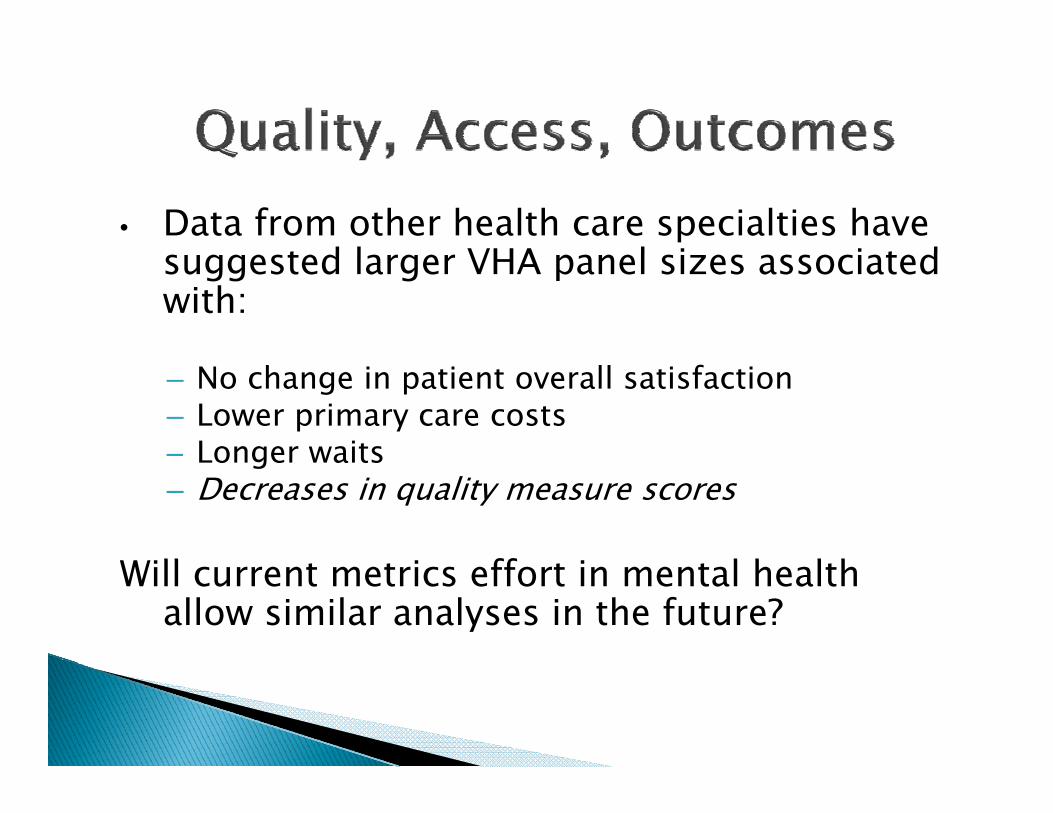
• Data from other health care specialties have t d l VHA l i i t dsuggested larger VHA panel sizes associated
with:
– No change in patient overall satisfaction– Lower primary care costs– Longer waitsLonger waits– Decreases in quality measure scores
Will i ff i l h l hWill current metrics effort in mental health allow similar analyses in the future?
Direct care only
Outpatient care only
wRVUs = primary metric
Target productivity at the facility level, notindividual provider level
Target a range, not a specific number (e.g., median, mean), )
Strengths
◦ wRVUs- a common metric allowing for the comparison of diverse practices across disciplinesdiverse practices across disciplines
◦ Data collected exactly the same for all sites
◦ Data collected exactly the same within each individual discipline
◦ Data collected nationally rather than by each individual facility or VISN
Challenges
◦ Absence of national business rules for the reporting of workload and labor mappingworkload and labor mapping
◦ For associated mental health care providers, workload and workforce data are collected from different sourcesworkforce data are collected from different sources
◦ Nationally, productivity can be seen at the individual provider level only for psychiatristsprovider level only for psychiatrists.
◦ No single metric tells the whole story

• VACO Review and Approval of Draft Directive ppEstablishing Mental Health Productivity Standards/Guidance
• Buy-in from all affected disciplines/ VACO leadershipleadership
• Determine metric value and range
• Decide outstanding issues: 0 wRVU codes….

• Develop National Business Rules for Capturing and Reporting Mental Health W kl d d L b M iWorkload and Labor Mapping
Create a tool to provide data on a quarterly• Create a tool to provide data on a quarterly basis to the field and VACO.
Incorporate inpatient productivity
National labor mapping data at the individual provider level for all professions studied
Identify relationship between productivity and other important domains (quality/access)other important domains (quality/access)