Embed Size (px)
DESCRIPTION
Psychology 320: Psychology of Gender and Sex Differences February 3 Lecture 44. Office Hour Invitations February 7, 11:30-2:30, Kenny 3102. 12795134 15776131 16678120 25176124 46382115 71992093 74373093. Reminder. The peer mentors (Derek, Natalie) will hold a tutorial tomorrow: - PowerPoint PPT Presentation
Citation preview
1
Psychology 320: Psychology of Gender and Sex Differences
February 3
Lecture 44

2
Office Hour InvitationsFebruary 7, 11:30-2:30, Kenny 3102
12795134
15776131
16678120
25176124
46382115
71992093
74373093

Reminder
3
The peer mentors (Derek, Natalie) will hold a tutorial tomorrow:
When? 5:00-6:00Where? Kenny 2510

4
From last class ….
• What are some criticisms of Baumeister’s theory?
5
Education
2. What factors contribute to sex differences in educational attainment?
1. Do males and females perform similarly in school? (continued)

6
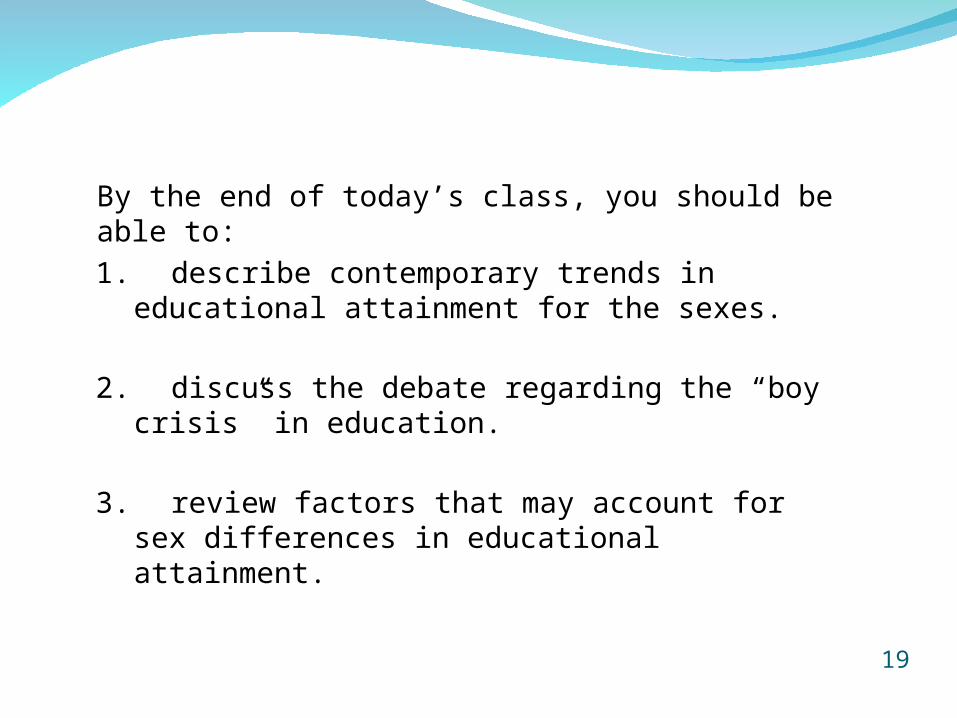
By the end of today’s class, you should be able to:
3. review factors that may account for sex differences in educational attainment.
2. discuss the debate regarding the “boy crisis” in education.
1. describe contemporary trends in educational attainment for the sexes.

7
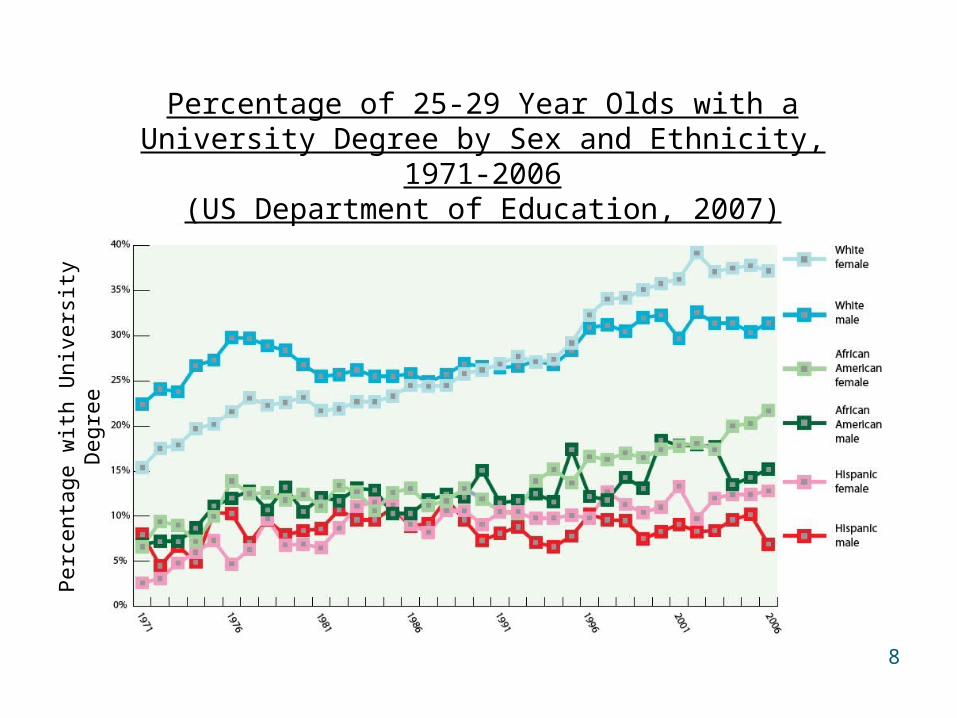
Do males and females perform similarly in school? (continued)
8
Percentage of 25-29 Year Olds with a University Degree by Sex and Ethnicity, 1971-2006
(US Department of Education, 2007)
Per
cent
age
with
Uni
vers
ity D
egre
e
8

Major Field of Study Number of Females (Thousands)
Number of Males(Thousands)
Education, recreational and counselling services 528 233
Fine and applied arts 77 41
Humanities 285 201
Social sciences 394 336
Agricultural, biological, nutritional and food sciences
107 97
Health professions 281 135
Commerce, management and business administration
321 427
Applied science technologies and trades 3 9
Engineering and applied sciences 71 394
Mathematics, computer and physical sciences 109 229
9
Major Field of Study, Age 15 and Older, by Sex (Statistics Canada, 2011)

Faculty Percent Female Percent Male
Arts 64 36
Dentistry 75 25
Education 68 32
Land and Food Systems 79 21
Medicine 56 44
Pharmaceutical Sciences 56 44
Applied Science 24 76
Forestry 44 56
Law 51 49
Sauder School of Business 47 53
Science 52 48
10
Evidence of Sex Segregation at UBC (UBC Annual Report, 2011)
11
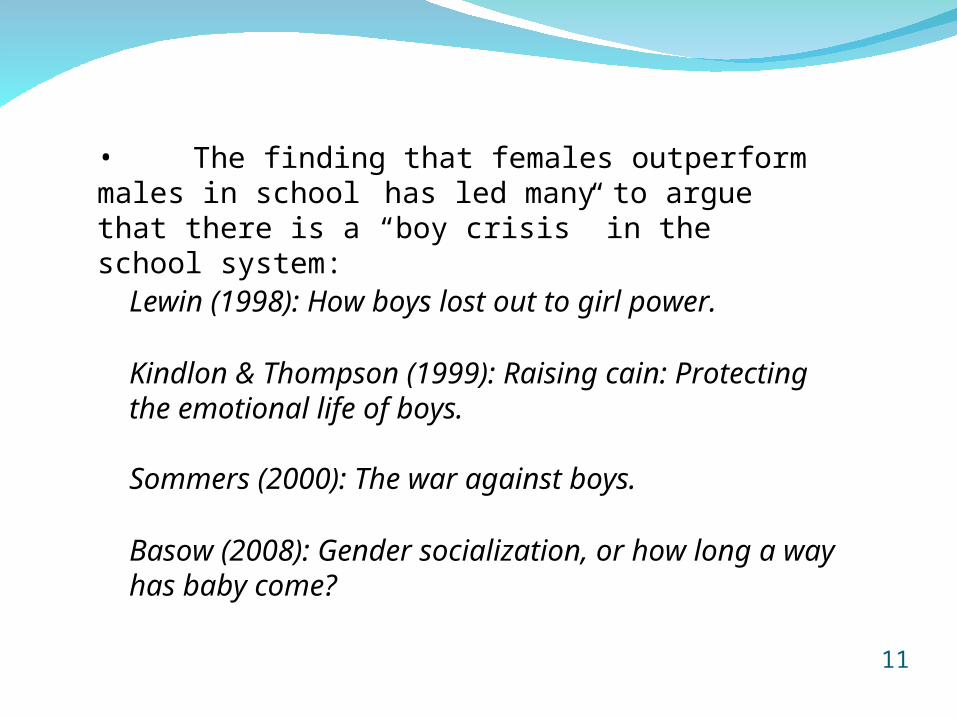
• The finding that females outperform males in school has led many to argue that there is a “boy crisis” in the school system:
Kindlon & Thompson (1999): Raising cain: Protecting the emotional life of boys.
Lewin (1998): How boys lost out to girl power.
Basow (2008): Gender socialization, or how long a way has baby come?
Sommers (2000): The war against boys.

12
“The real story is not bad news about boys doing worse; it’s good news about girls doing better” (Mead, 2006).
• In response to this view, others have argued that male performance has not decreased over the years; rather, female performance has increased more dramatically than male performance.

13
What factors contribute to sex differences in educational attainment?
• Among the factors that advocates of the boy crisis have implicated in the relatively low educational
attainment of males are the following:

14
The relatively large number of programs designed to improve the academic performance of females as opposed to males.

Major Field of Study Number of Females (Thousands)
Number of Males(Thousands)
Education, recreational and counselling services 528 233
Fine and applied arts 77 41
Humanities 285 201
Social sciences 394 336
Agricultural, biological, nutritional and food sciences
107 97
Health professions 281 135
Commerce, management and business administration
321 427
Applied science technologies and trades 3 9
Engineering and applied sciences 71 394
Mathematics, computer and physical sciences 109 229
Major Field of Study, Age 15 and Older, by Sex (Statistics Canada, 2011)
15

16
Gender role expectations that foster “better” student skills (e.g., obedience, delay of gratification) among girls than boys.
The preponderance of female teachers, particularly in early-education settings.

17
School environments that reward characteristics associated with the female gender role and punish characteristics associated with the male gender role.
More boys than girls receive referrals to special education services:

Percent Boys
Teacher referral to learning disabled program (Mirkin, 1982) 80
Learning-disabled students (Lerner, 1993) 72
Enrolled in learning-disabled program (K-12; Mellard & Byrne, 1993) 75
Teacher referral to learning disabled program (Flynn & Rahbar, 1994) 66
Diagnosed with reading disorder (APA, 1995) 60-80
“Eligible for special education” (Skarbrevik, 2002) 70
Enrollment in special education classes (Benjamin, 2003) 60-70
Diagnosed with attention deficit disorder/attention deficit hyperactivity disorder (Berry, 1985; Abraham, 2010)
75-86
Percent of Students Described as Needing Special Education Services Across Diverse Studies
18
19
By the end of today’s class, you should be able to:
3. review factors that may account for sex differences in educational attainment.
2. discuss the debate regarding the “boy crisis” in education.
1. describe contemporary trends in educational attainment for the sexes.