Embed Size (px)
Citation preview

Psychological therapy services in Australia
Presented at:
Sharing learnings from early implementation of stepped care:
A PHN collaborative workshop
Canberra, 22-23 February 2016
Meredith Harris School of Public Health, The University of Queensland

Context
• Establishing services for the middle/moderate group
• Mainly require psychological therapy services in conjunction with GPs
• Better Access is the backbone of psychological therapy services provision
• Understanding the patterns of access to and utilisation of Better Access services can help inform the investment of ATAPS money to areas or people not well serviced by Better Access

Overview
• Defining psychological therapy services
• Why is it critical for PHN planning and commissioning to understand patterns of MBS mental health service use across and within regions?
• Links to MBS data available to PHNs
• Utilisation – patterns of long-term use of Better Access psychological services

Defining psychological therapy services
• Department of Health’s 2016 Psychological Therapies Provided by Mental Health Professionals to Underserviced Groups guidance document:
– “… evidence based, short term psychological intervention to people with a diagnosable mild, moderate, or in some cases severe mental illness, or to people who have attempted, or are at risk of, suicide or self-harm where access to other services is not appropriate”

Defining psychological therapy services
• Primary Mental Health Care Minimum Data Set specifications add detail by defining ‘psychological therapy services’ episodes as those where:
– “The treatment plan for the client is primarily based around the delivery of psychological therapy by one or more mental health professionals. This category most closely matches the type of services delivered under the previous ATAPS program …”

Defining psychological therapy services
• … and the scope of ‘mental health professionals’ as – “… service providers who meet the requirements for registration,
credentialing or recognition as a qualified mental health professional. Includes:
• Psychiatrists
• Registered Psychologists
• Clinical Psychologists
• Mental Health Nurses;
• Occupational Therapists;
• Social Workers
• Aboriginal and Torres Strait Islander health workers”

Why is it critical to understand patterns of MBS mental health service use within/across regions?
• Mapping service provision is an important activity within the ‘four core elements’
Stratification into ‘needs groups’
Setting interventions for each group
Defining a ‘menu’ of service types
Matching service types to treatment targets
Map local services against profile of need to identify gaps and unknowns • Which providers available, what are
they delivering, at what capacity? • Fit with identified needs groups – are
services getting to the right people? • System focus – how do available
services work together? • Full spectrum – do gaps in one area
impact on other services?

Why is it critical to understand patterns of MBS mental health service use within/across regions?
• Within the planning process, MBS services have been defined as a focus for PHNs
• Department of Health guidance document (2016): • “PHNs are required to identify service gaps and commission
psychological therapy services for people in underserviced groups, including those in rural and remote areas, where there are barriers to accessing Medicare Benefits Schedule (MBS) based psychological intervention, making optimal use of the available service infrastructure and workforce”.

Why is it critical to understand patterns of MBS mental health service use within across/regions?
• MBS is the main provider of mental health care to those Australians who seek mental health-specific care
• Psychological therapy services are delivered through (mainly) the MBS and, to a lesser extent, the flexible funding available to PHNs
• It is therefore critical to ensure that scarce resources are targeted in a way that complements rather than duplicates the MBS

Role of MBS in providing mental health care
Figure: Number of people seen by selected mental health programs, 2014-15 (Source: AIHW Mental Health Services in Australia 2016)

Role of MBS in providing mental health care
Figure: Number of people seen by selected mental health programs, 2014-15 (Source: AIHW Mental Health Services in Australia 2016)
~ 1,000,000 seen by clinical psychologists/allied health providers Virtually all of these received Better
Access services

Figure 59: Number of people and percentage of population seen by each of the major mental health service streams, 2006-07 to 2010-11 (Source: National Mental Health Report 2013)
Growth in treatment rates driven by MBS
Pe
rcenta
ge o
f pop
ulatio
n se
en
Totals: 970,000 1.9 m 8.5%

Better Access psychological services
Category Provider(s)
Psychological Therapy Services (individual) clinical psychologists
Allied Health Focussed Psychological Strategies (individual)
psychologists, social workers and occupational therapists
Group Services clinical psychologists, psychologists, social workers and occupational therapists
GP Focussed Psychological Strategies general practitioners

Relative access to and utilisation of psychological services via Better Access and ATAPS
Measure Better Access (2014-15)b ATAPS (2014-15)b
N patients seen ~ 1,000,000 71,830
N sessions delivered 4,525,420 386,669
Average N of sessions ~ 4.5 4.8
Patient copayments: - % of sessions - Average copayment per session
50.8% $50.39
3.0% $13.45
a Includes psychological services delivered by allied health professionals and GPs b Most data are for 2014-15 (Source: AIHW, 2016). Better Access copayment data are for first half of 2014 (Source: Department of Health analyses).
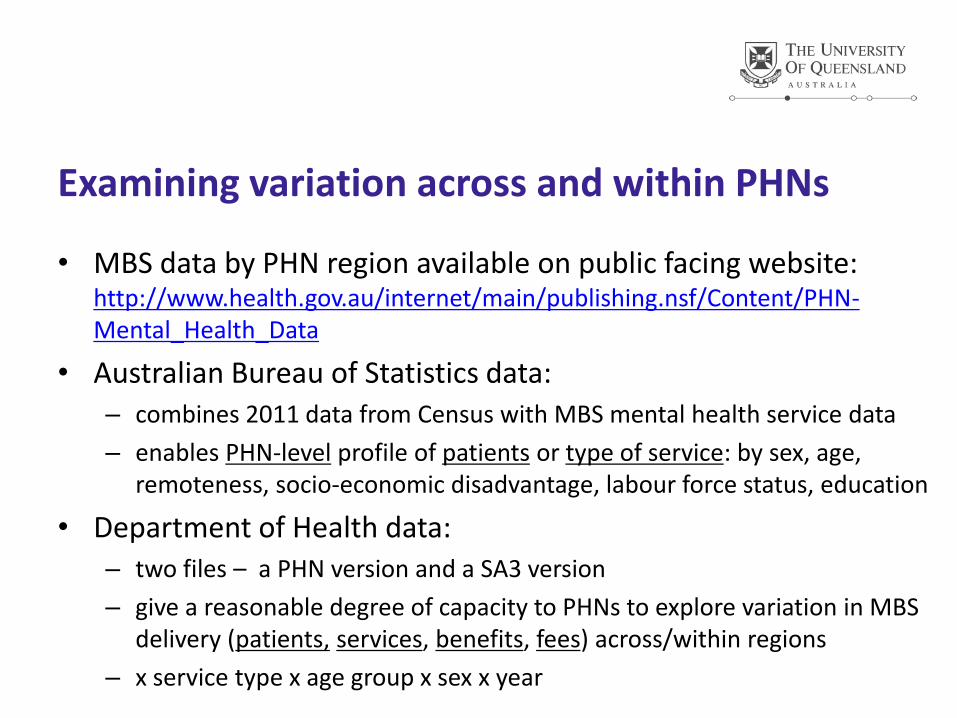
Examining variation across and within PHNs
• MBS data by PHN region available on public facing website: http://www.health.gov.au/internet/main/publishing.nsf/Content/PHN-Mental_Health_Data
• Australian Bureau of Statistics data: – combines 2011 data from Census with MBS mental health service data
– enables PHN-level profile of patients or type of service: by sex, age, remoteness, socio-economic disadvantage, labour force status, education
• Department of Health data: – two files – a PHN version and a SA3 version
– give a reasonable degree of capacity to PHNs to explore variation in MBS delivery (patients, services, benefits, fees) across/within regions
– x service type x age group x sex x year

Variation in mental health services – why it matters
• Some variations may be appropriate i.e., where it reflects need, or cultural or service user preferences
• Unwarranted variations may indicate inequitable allocation of funding, provider supply problems, or poor match to service users’ needs and preferences
• How understanding variation helps planners – For services to operate as intended, an adequate level complementary
services and/or supports must also be available
– Necessary to plan coordinated care models
– Supports person-centred care

0.0% 1.0% 2.0% 3.0% 4.0% 5.0% 6.0% 7.0%
PHN101-Central and Eastern Sydney
PHN101--Northern Sydney
PHN103-Western Sydney
PHN104-Nepean Blue Mountains
PHN105-South Western Sydney
PHN106-South Eastern NSW
PHN107-Western NSW
PHN108-Hunter New England and Central Coast
PHN109-North Coast
PHN110-Murrumbidgee
PHN201-North Western Melbourne
PHN202-Eastern Melbourne
PHN203-South Eastern Melbourne
PHN204-Gippsland
PHN205-Murray
PHN206-Western Victoria
PHN301-Brisbane North
PHN302-Brisbane South
PHN303-Gold Coast
PHN304-Darling Downs and West Moreton
PHN305-Western Queensland
PHN306-Central Qld, Wide Bay, Sunshine Coast
PHN307-Northern Queensland
PHN401-Adelaide
PHN402-Country SA
PHN501-Perth North
PHN502-Perth South
PHN503-Country WA
PHN601-Tasmania
PHN701-Northern Territory
PHN801-Australian Capital Territory
MBS Patients treated per capita 2014-15 - Allied Health
11.3-fold difference between lowest and highest PHNs
Source: Department of Health data on PHN website: http://www.health.gov.au/internet/main/publishing.nsf/Content/PHN-Mental_Health_Data

$- $5.00 $10.00 $15.00 $20.00 $25.00 $30.00
PHN101-Central and Eastern Sydney
PHN101--Northern Sydney
PHN103-Western Sydney
PHN104-Nepean Blue Mountains
PHN105-South Western Sydney
PHN106-South Eastern NSW
PHN107-Western NSW
PHN108-Hunter New England and Central Coast
PHN109-North Coast
PHN110-Murrumbidgee
PHN201-North Western Melbourne
PHN202-Eastern Melbourne
PHN203-South Eastern Melbourne
PHN204-Gippsland
PHN205-Murray
PHN206-Western Victoria
PHN301-Brisbane North
PHN302-Brisbane South
PHN303-Gold Coast
PHN304-Darling Downs and West Moreton
PHN305-Western Queensland
PHN306-Central Qld, Wide Bay, Sunshine Coast
PHN307-Northern Queensland
PHN401-Adelaide
PHN402-Country SA
PHN501-Perth North
PHN502-Perth South
PHN503-Country WA
PHN601-Tasmania
PHN701-Northern Territory
PHN801-Australian Capital Territory
MBS Benefits per capita 2014-15 - Allied Health
15.3-fold difference between lowest and highest PHNs
Source: Department of Health data on PHN website: http://www.health.gov.au/internet/main/publishing.nsf/Content/PHN-Mental_Health_Data

Utilisation of Better Access psychological services
• Most information focuses on yearly snapshots
• Little is known about individuals’ patterns of use of Better Access over multiple years, overall or by region
• Exploratory analyses are being undertaken for the Department of Health to examine these longer-term ‘frequency of use’ patterns. Preliminary results follow…

Variation in service utilisation – why it matters
• Some variations between/within regions may be appropriate i.e., reflects need, or cultural or service user preferences
• Unwarranted variations may indicate inequitable allocation of funding, provider supply problems, or poor match to service users’ needs and preferences
• How understanding variation in utilisation helps planners – For services to operate as intended, an adequate level of
complementary services and/or supports must also be available
– Necessary to plan coordinated care models
– Supports person-centred care

Long-term frequency of use
• Exploratory Department of Health analyses based on an extract of data on 1.3 million patients who received their first Better Access psychological service between 2007 and 2010
• Examined patterns of use of Better Access psychological services in first year plus three following years (i.e. four years)
• Developed a classification of ‘frequency of use’ reflecting: – Frequency and duration of use
– Concerns about appropriateness of Better Access services for people at the ‘low’ and ‘high’ ends
– Since 2013, Better Access services have been capped at 10 individual and 10 group services per calendar year

Classifying long term frequency of use
• Frequency – low (avg. 1-2 services/year); med (avg. >2 but < cap/year); high (10+ individual or 10+ group services/year)
• Duration – short-term < 3 consecutive years; long-term >= 3 consecutive years
• Combining frequency and duration resulted in six levels: (1) Low frequency/short-term
(2) Low frequency/long-term
(3) Medium frequency/short-term
(4) Medium frequency/long-term
(5) High frequency/short-term
(6) High frequency/long-term

Summary measures of long-term frequency of use of Better Access psychological services,
among Primary Health Networks
Australia
Lowest
PHN
Highest
PHN
Fold diff-
erencea CoVb
Population rates
Patients (per 1,000 population) 60.2 (n=1.3m) 14.4 83.5 5.8 0.3
Services (per 1,000 population) 562.8 (n=12.4m) 103.5 858.8 8.3 0.4
Frequency of use (% of patients):
Low frequency/short term 26.7% 22.3% 40.7% 1.8 0.1
Low frequency/long term 0.6% 0.5% 1.0% 2.0 0.2
Medium frequency/short term 46.2% 43.0% 49.5% 1.2 0.04
Medium frequency/long term 5.9% 4.6% 7.1% 1.6 0.1
High frequency/short term 19.0% 9.6% 24.9% 2.6 0.2
High frequency/long term 1.5% 0.4% 2.5% 6.3 0.4
Source: Department of Health exploratory analyses. PHNs with <30 patients excluded. a Fold difference is the ratio of the highest to lowest PHNs. b CoV, or coefficient of variation, is a measure of variability around the average for the PHNs; higher values indicate
greater variation.

Percentage of patients in each level of long term frequency of use of Better Access psychological services, by PHN Source: Department of Health exploratory analyses. Note: Long and short-term categories combined for PHN 307 Northern Territory due to low numbers.

Types of Better Access psychological services
Percentage of patients using Better Access psychological services, by type of
Better Access psychological service used, over four years of observation
Australiaa
Lowest PHNb
Highest
PHNb
Fold differ-
ence CoV
Psychological Therapy Services 42.4% 18.8% 71.0% 3.8 0.3
Allied Health Focussed Psychological Services 73.3% 41.5% 87.6% 2.1 0.1
Group Services 1.0% 0.4% 1.5% 4.0 0.3
GP Focussed Psychological Strategies 3.2% 1.4% 7.4% 5.3 0.4
Source: Department of Health exploratory analyses. a Percentages will sum to slightly more than 100% as some individuals used more than one type of Better Access psychological service. b PHNs with <30 patients excluded.

Percentage of patients using each type of Better Access psychological service over four years,
by PHN Source: Department of Health exploratory analyses.
Note: Some data omitted for PHN305 Western Queensland and PHN 307 Northern Territory due to low numbers.

Type of Better Access psychological service used
Source: Department of Health exploratory analyses. Note: Low frequency categories combined for Group Services due to small numbers
Frequency of use of Better Access psychological services among patients using each type of service, across all Primary Health Networks
Values < 4% not shown.

Type of Better Access psychological service used
• PHN-level analyses showed some associations between ‘frequency of use’ and type of Better Access psychological service used, for example: – PHNs with relatively high use of PTS and Group Services tended to
have more High frequency/long term service users and fewer Low frequency/short term users
– Conversely, PHNs with relatively high use of AHFPS services tended to have fewer High frequency/long term service users and more Low frequency/short term users
Source: Department of Health exploratory analyses.

Patient copayments
Summary measures of copayments for Better Access psychological services, over
four years of observation
Australiaa,b
Lowest PHN
Highest
PHN
Fold differ-
ence CoV
Patients contributing copayments 65.5% (n=0.9m) 32.3% 85.9% 2.7 0.2
Average copayment per sessiona,b $40 (n=7.4m sessions) $32 $53 1.7 0.1
Source: Department of Health exploratory analyses. a Refers to services for which a copayment was made. b Total copayments $294m.
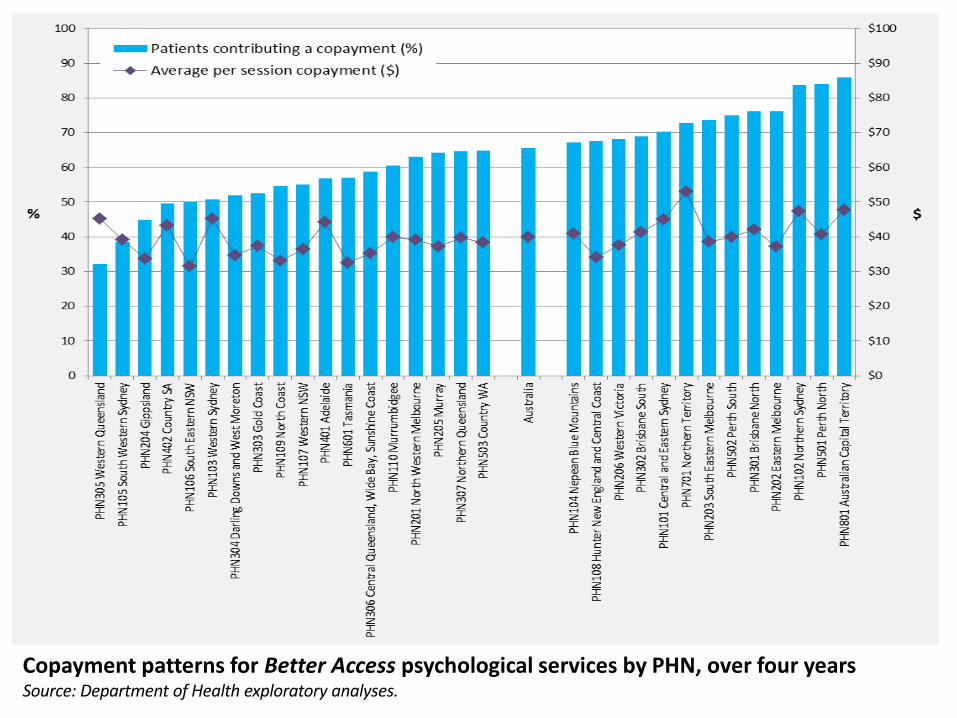
Copayment patterns for Better Access psychological services by PHN, over four years Source: Department of Health exploratory analyses.

Patient copayments
Source: Department of Health exploratory analyses.
Copayment patterns by frequency of use, across all Primary Health Networks

Thank you!