Embed Size (px)
Citation preview

Psychological Skills, Education, andLongevity
of High-Ability IndividualsWorking paper
Peter A. Savelyev∗Department of Economics
Vanderbilt University
August 3, 2014First version on SSRN: November 2010
∗Peter Savelyev is an Assistant Professor of Economics at Vanderbilt University and aHealth Policy Associate of the Robert Wood Johnson Center for Health Policy at MeharryMedical College. Address: Department of Economics, 415 Calhoun Hall, Vanderbilt Univer-sity, Nashville, TN 37235-0002. Email: [email protected]. A version of this paperwas presented to the Annual Meeting of the American Economic Association in Chicago; theHealth Economics Workshop at the NBER Summer Institute; the European Economic As-sociation and Econometric Society Annual European Meeting in Gothenburg, Sweden; theHealth Economics Workshop and the Labor Group Seminar at the University of Chicago;Applied Microeconomics seminar at the University of North Carolina; the Institute on HealthEconomics, Health Behaviors, and Disparities at Cornell University; Economics seminar ofthe Andrew Young School of Policy Studies, Georgia State University; University of Hous-ton and Rice University Empirical Micro seminar; RAND Labor and Population Seminar inSanta-Monica; the Quantitative Methods Brown Bag at the Department of Psychology andHuman Development at Peabody College, Vanderbilt University; Departmental Seminar inEconomics at Vanderbilt University; the Applied Microeconomics Seminar at Vanderbilt LawSchool; David Eccles School of Business research seminar, University of Utah; and the UpjohnInstitute for Employment Research seminar. I thank participants of these meetings for use-ful suggestions and stimulating discussions. I am grateful to Gary Becker, Gabriella Conti,Miriam Gensowski, Mike Grossman, Tim Kautz, Don Kenkel, Adriana Lleras-Muney, WillardManning, David Meltzer, Remi Piatek, Kegon Tan, Ben Ward, Ben Williams, and especiallyJim Heckman for productive comments; to Mihir Gandhi, Kai Hong, and Ivana Stosic fortheir excellent research assistance over different stages of this long project; to Keith Dent, SonNghiem, and Cody Vaughn for great help during their summer internships at Vanderbilt;and to the Economics Research Center at the University of Chicago for its support of earlyversions of this work. I thank John Spraul for his excellent proofreading. The Terman dataare provided by the Interuniversity Consortium for Political and Social Research Ann Arbor,MI. An early version of this paper was supported by the Merck Quantitative Science Gradu-ate Fellowship in Health Economics. The paper also benefited from the financial support of

Abstract
Based on the 1922–1991 Terman data of children with high ability, I inves-tigate the effects of childhood psychological skills and post-compulsoryeducation on longevity. I identify causal effects and account for measure-ment error using factor-analytic methodology (Heckman et al., 2006).Latent class analysis supports the causal interpretation of results. Formales, I find strong effects of psychological skills and education on lon-gevity and an interaction between personality and education. Results arein line with the IV literature. For females, who are born around 1910 andlive longer than men, I find no effects of education and personality onlongevity.
Key words: longevity, survival function, life expectancy, value of longevity,post-compulsory education, IQ, personality skills, Big Five, average treat-ment effect, Terman Data of Children with High Ability, gender differ-ence
JEL codes: C41, D91, I12
the Douglas W. Grey Faculty Research Fund in Economics. The views expressed in this paperare those of the author and may not coincide with those of the funders. Supplementary ma-terials may be retrieved from https://my.vanderbilt.edu/petersavelyev/2012/01/web-appx-terman.
b

1 Introduction
It is well documented in the literature that longevity is primarily produced
through health behaviors such as avoiding smoking tobacco and following a
healthy diet (e.g., Phelps, 2013).1 Preferences for these behaviors are formed
as a result of a complex process of human development, implying that de-
terminants of human development can be expected to affect longevity. The
emerging literature in economics of human development suggests that we can
expect to find such determinants among cognitive and personality skills, as
well as among investments in education (Almlund et al., 2011). In this paper
I find substantial effects of cognitive skills, personality skills, and education
on longevity. I also provide evidence in favor of interpreting the estimated
effects as causal (see Figure 1 for a scheme of the estimated model).
This paper contributes to two distinct literatures: health economics and
economics of human development. In the health economics literature, even
though education and longevity strongly correlate, the claim of causality is
still controversial despite the major importance of this relationship for both
public policy and for theories that are foundational of health economics as a
discipline (Galama and van Kippersluis, 2013; Grossman, 1972).
It is useful to distinguish two major ranges of formal education that have
received unequal attention in the literature: compulsory and post-compulsory
education. The effect of compulsory education on longevity has been studied
extensively using changes in compulsory schooling laws as natural experi-
ments, but authors disagree on the causal status of education (e.g., Albouy
and Lequien, 2009; Clark and Royer, 2013; Lleras-Muney, 2005; Mazumder,
2008; van Kippersluis et al., 2011).2
Unlike the effect of compulsory education, the effect of post-compulsory
1Kenkel (2000) describes primary prevention as a set of actions including lifestyles decisions.2See Web Appendix A for more details about this and other literatures.
1

Figure 1: Developmental Origins of Longevity
Measurement error η
Hazard ofdeath, λ(t)
Education, D
Childhood psychological
skills, Θ
Measures of psychological
skills, MBaseline
hazard, λ0(t)
Earlychildhood
health, early educational investments, individual
and parental background,
X
Lifestyles, health
behaviors, health
investments
Measurement
error, η
Notes: This scheme is a simplified visualization of the statistical model estimated in this pa-per. Colored rectangles denote observable variables. The dashed rectangle denotes mediatorsthat are not explicitly modeled in this paper but are modeled in a companion paper (Hong,Savelyev, and Tan, 2014). A circle denotes a vector of latent skills. Solid lines denote causallinks; dashed lines denote interactions.
education on longevity is unexplored, perhaps since suitable natural experi-
ments are less readily available. An exception is a recent working paper by
Buckles et al. (2013), which uses the avoidance of the Vietnam War draft as a
source of identification and finds a strong and statistically significant effect of
college graduation on longevity.
My paper further explores the effect of post-compulsory education on
longevity, and complements the paper by Buckles et al. in a number of ways.
First, I use a methodology of causal effect identification that is an alternative
2

to the use of natural experiments and is based on a combination of advanced
econometric techniques controlling for unobserved heterogeneity (Heckman
and Singer, 1984; Heckman et al., 2006).
All statistical methods for causal effect identification are based on assump-
tions and have limitations, even “gold standard” ones, such as randomized
controlled experiments (Deaton, 2009; Heckman, Moon, Pinto, Savelyev, and
Yavitz, 2010; Heckman and Vytlacil, 2007a), not to mention natural experi-
ments, such as instrumental variable (IV) methods. Limitations of IVs are
numerous: IVs are often weak, precision relative to OLS is low, and exo-
geneity of the IVs is usually a rhetoric-based assumption, which is hard to
test directly (e.g., Cameron and Trivedi, 2005). Also, the IV method breaks
down when the monotonicity assumption is violated (Heckman and Vytlacil,
2005). Moreover, the effect is only identified for a specific population that
is induced to change behavior by the instrument. The OLS, despite its bias,
might be closer to the policy-relevant treatment effect than the IV (Carneiro
et al., 2011). In particular, the regression discontinuity estimator identifies the
causal effect at the point of discontinuity, which is not necessarily the policy-
relevant effect (Heckman and Vytlacil, 2007b). Since all statistical methods
have their pros and cons, accumulating evidence based on alternative meth-
ods is productive, especially given that results based on natural experiments
are at odds with each other, as mentioned above.
Second, I study a different population and observe mortality over a much
longer age range than Buckles et al.3 Finally, I show the effects of various
levels of post-compulsory education on a number of fundamental longevity-
related outcomes. One such outcome is the survival function, a key parameter
in the inter-temporal model of educational investment presented in Section
3I study white men and women with high intelligence born in 1904–1915 over 70 years oflife; Buckles et al. study white men from the general population born in 1942–1953 over theperiod 1982–2007.
3

3.1. Other such outcomes include the hazard of death, life expectancy, and
the value of statistical life. For comparison with the literature, I construct a
measure of mortality that is comparable to the specific aggregated measure
of mortality used by Buckles et al. (2013) and obtain similar results.4
I also contribute to the emerging literature in economics of human devel-
opment, in which it is an important part of the agenda to allow for a multi-
dimensional vector of correlated personality skills grounded in psychological
theory, a task that requires both excellent data and computational intensity
(Almlund et al., 2011; Borghans et al., 2008). In this paper I relax the skill
orthogonality assumption and account for personality factors that are closely
linked to the contemporary and well-established taxonomy of personality,
referred to as the Big Five, and find effects of personality on longevity, an
unexplored outcome in the literature of economics of human development.
Note that the association between certain personality skills and longevity has
been established by psychologists based on the same data (Friedman et al.,
2010, 1995, 1993). These papers, however, failed to document the exploratory
and confirmatory factor analysis of personality measures, did not eliminate
the attenuation bias due to measurement error, did not test the proportional
hazard assumption behind the Cox model of mortality, and did not attempt
to establish causal inference. These papers missed a number of results of this
paper such as effects of Extraversion, IQ, and Education on longevity.
I use the Terman data of children with high ability (Terman, 1986), a
dataset of about 1,500 subjects from California. The dataset fits well into the
study of developmental origins of longevity since it contains a unique combi-
nation of measures: IQ, personality, and detailed family background around
4Longevity results of this paper and of the paper by Buckles et al. (2013) are in linewith a number of papers that identify effects of post-compulsory education on health-relatedoutcomes other than longevity (Conti et al., 2010; Currie and Moretti, 2003; de Walque, 2007;Grimard and Parent, 2007; Heckman et al., 2014). See Web Appendix A for more details.
4

age 12, followed by 70 years of prospective observations of education, impor-
tant life events, and mortality. Despite an unusual statistical population, my
results contribute substantially to our understanding of the developmental
origins of longevity.5
Applying a methodology of causal effect identification similar to that used
in Heckman et al. (2006), I estimate a system of equations that includes
the Cox proportional hazard model of mortality, the generalized ordered
logit model of schooling choice, and a system of equations linking a low-
dimensional set of latent factors to their multiple noisy measures. On top of
controlling for a detailed set of background variables, I also control for ability
via IQ and a set of latent personality factors that resemble the Big Five—a
set that many psychologists view as comprehensive. I test this model against
an alternative that accounts for possible additional unobserved heterogene-
ity using the latent class technique (Heckman and Singer, 1984) and find no
evidence against the null, a result that is in line with a relatively homoge-
nous sample (high IQ white people from California) and a substantial set of
observable and latent controls motivated by the literature. The mechanisms
behind the treatment effects that we find in companion papers reinforce the
causality claims (Hong, Savelyev, and Tan, 2014; Savelyev and Tan, 2014). I
acknowledge limitations of this methodology.
Results of this paper differ greatly by gender. For males, I find that Consci-
entiousness, Extraversion, and IQ strongly decrease mortality, but IQ is only
predictive for ages before 50. (The time-dependence of the IQ effect could
be an artifact of this particular generation that survived the Great Depression
and World War II.) I also find that childhood Conscientiousness interacts with
Doctorate degree, so that for future Doctorates, childhood Conscientiousness
is no longer beneficial for longevity even though it is highly beneficial for peo-
5See a discussion of external validity and data limitations in Section 4.
5

ple with less-advanced degrees. As a result, the return to a Doctorate degree
with respect to longevity declines with the level of childhood Conscientious-
ness. The treatment effect of a Bachelor’s degree on life expectancy at age 30
is 8.6 additional years of life relative to high school education. For a statistical
man, the longevity boost induced by a college education is worth as large as
$810,000 of 2012 US dollars as a conservative estimate.6 Finally, while the di-
rect effects of childhood psychological skills on longevity are strong, I do not
find any strong and statistically significant indirect effects of psychological
skills through education.
Females live even longer than males with advanced degrees, but I do not
find any statistically significant effects of education and skills except for a
beneficial effect of IQ on mortality below age 50, the same effect that I find
for males. Finding an effect of education for males but not for females is in
line with Van Den Berg et al. (2012), who have similar findings for compulsory
schooling of Danish twins born about 20 years before the Terman cohort. I
argue that the lack of effects for females born in the early 20th Century may
not apply to contemporary females.
2 Terman Data
The Terman Study started in 1922 and continued through 1991. The sample
consists of 856 males and 672 females selected for their high ability based on
teachers’ nomination followed by an IQ test with a cut-off value of 140. The
subjects (who are white and mostly well off7) were born, on average, in 1910.
The study has an attrition rate below 10%, which is exceptionally low for a
6This number does not directly account for any other benefit of college education such ashigher wages, greater employment, lower crime, greater investments in children etc.
7Terman et al. (1925) refer to the economic status of a majority of families as “fairly com-fortable,” and indicates that only a few families were “truly in poverty.”
6

70-year-long prospective study. Moreover, the lost subjects are known not to
differ systematically in terms of education, income, and demographic factors
(Sears, 1984). There is also no evidence that members of the attrited group
differ significantly from others on measures of personality (Friedman et al.,
1993).
One important benefit of the longitudinal nature of the Terman study, with
detailed education data collected multiple times prospectively and retrospec-
tively, is that measurement error in education (e.g., Ashenfelter and Krueger,
1994), is bound to be negligible since our education variable is based on all
available life-cycle information.
Background variables in this paper can be grouped into six categories:
general intelligence, early health, early childhood investments, parental lon-
gevity and background, World War II Experience, and cohort variables. See
Table 1 for information about specific variables within these categories.
I restrict the data based on a number of criteria chosen prior to estimation.
I exclude subjects who: (1) were not born in the period 1904–1915;8 (2) are
missing both parents’ and teachers’ personality trait ratings; (3) dropped out
from high school;9 (4) died in service during World War II; (5) had severe
diseases such as cancer in their early life; (6) have missing education data;
and (7) died or attrited before age 30. The final estimation sample contains
680 males and 529 females. Criteria (1) and (2) are similar or identical to those
used by psychologists (Martin et al., 2007).10
Measuring Personality Skills Although there are various ways to define
personality skills, the Big Five taxonomy of personality is an established and
8This restriction makes the cohorts more comparable by excluding a small number ofrespondents in the tails of the year of birth distribution.
9High school dropouts are 16 outliers with a likely case of reverse causality betweeneducation and health, which I wish to minimize.
10See Web Appendix B for more details on the Terman data.
7

Table 1: Education and Background Variables
Variable Year of
measure-
ment Mean
Standard
Error Mean
Standard
Error
Highest Education Level
High School Graduate 1922-1968 0.101 (0.012) 0.112 (0.014)
Some College 1922-1968 0.165 (0.014) 0.202 (0.017)
Bachelor's Degree 1922-1968 0.300 (0.018) 0.420 (0.021)
Master's Degree or equivalent 1922-1968 0.184 (0.015) 0.216 (0.018)
Doctorate(a)
1922-1968 0.250 (0.017) 0.051 (0.010)
General Intelligence
IQ(b)
1922 149.3 (0.405) 148.5 (0.446)
Early Health
Normal birth or no birth problems mentioned(c)
1922 0.571 (0.019) 0.629 (0.021)
No breastfeeding(c)
1922 0.091 (0.011) 0.085 (0.012)
Health rating in 1922(d)
1922 8.526 (0.075) 9.027 (0.083)
Physical energy rating in 1922(d)
1922 8.219 (0.073) 8.834 (0.078)
Mother's poor health during pregnancy(c,e)
1922 0.173 (0.015) 0.178 (0.017)
Low birthweight (below 2.5 kg)(c,e)
1922 0.019 (0.005) 0.047 (0.010)
Persistent mouth breathing in 1922(e)
1922 0.024 (0.006) 0.020 (0.007)
Frequent or very frequent colds in 1922(e)
1922 0.166 (0.015) 0.112 (0.014)
Headaches mentioned in 1922(e)
1922 0.170 (0.015) 0.181 (0.018)
Headaches frequent or severe in 1922(e)
1922 0.006 (0.003) 0.010 (0.005)
Nutrition poor or fair in 1922(e)
1922 0.092 (0.012) 0.071 (0.012)
Early Educational Investments
Logarithm of the amount of parental tutoring, ages 2-7(f)
1922 0.450 (0.014) 0.409 (0.016)
Logarithm of the duration of private tutoring, ages 2-7(f)
1922, 28 0.105 (0.014) 0.344 (0.026)
Parental Longevity and Background
Mother is deceased by 1922 1922 0.028 (0.006) 0.032 (0.008)
Father is deceased by 1922 1922 0.081 (0.010) 0.074 (0.011)
Parents are divorced before 1922 1922 0.050 (0.008) 0.047 (0.009)
Father has at least a bachelor's degree 1922 0.291 (0.017) 0.253 (0.019)
Mother is employed 1922 0.126 (0.013) 0.132 (0.015)
Father is a professional 1922 0.243 (0.016) 0.276 (0.019)
Either parent from outside the US 1922 0.304 (0.018) 0.267 (0.019)
Either parent from Europe 1922 0.218 (0.016) 0.202 (0.017)
Parental finances adequate 1922 0.371 (0.019) 0.384 (0.021)
Parental social position below average 1922 0.253 (0.017) 0.153 (0.016)
World War II Experience
WWII Participation 1945 0.410 (0.019) 0.026 (0.007)
WWII Combat Experience 1945 0.093 (0.011) 0.004 (0.003)
Cohort
Cohort: 1904 - 1907 1922 0.237 (0.016) 0.172 (0.016)
Cohort: 1908 - 1911 1922 0.468 (0.019) 0.467 (0.022)
Cohort: 1912 - 1915 1922 0.296 (0.018) 0.361 (0.021)
Age in 1922 11.84 (0.112) 11.30 (0.121)
Estimation Sample 680 529
Males Females
Notes: (a)Includes both entry-level and research-level doctoral degrees such as M.D., LL.B., LL.M, and Ph.D.(b)The
best estimate of IQ in 1922 is provided by survey organizers and is based on all available test scores including Stan-
ford Binet and Terman Group Tests. (c)Indicators of conditions at birth and early health investments (breastfeeding)
are reported retrospectively by parents in 1922. (d)An average over non-missing values of teachers’ and parents’
ratings is used (rating can range from 1 to 13). (e)Variables marked with “(e)” are not controlled for in the final
model, but robustness checks show that controlling for them does not change model results in any significant way,
while reducing the estimation sample size. (f)Duration of parental tutoring (in hours/week) and private tutoring (in
weeks, where 1 week is 168 hours of tutoring) are transformed using the natural logarithm, ln(1+duration).
8
widely-used way to do so (John and Srivastava, 1999). The data on person-
ality collected in 1922 and 1940 by Terman and coworkers are theoretically
and empirically close to the Big Five taxonomy (Martin and Friedman, 2000).
Definitions of the Big Five skills are provided by John and Srivastava (1999).
In short, conscientious people are planful, goal-directed, and follow rules;
open people enjoy new experiences and ideas; extraverted people like social-
izing; agreeable people are nice to others; and neurotic people are emotionally
unstable.11 In this paper, following standard psychometric techniques, I rep-
resent latent personality skills using factor analysis documented in detail in
Web Appendix C.
3 Methodology
3.1 Conceptual Framework
Consider a generalization of a discrete time intertemporal economic model
(Becker, 2007) in order to demonstrate the economic role of both education
and psychological skills in extending life.12 I incorporate psychological skills
into the model as exogenous parameters: individuals cannot choose their
levels of psychological skills, but skills can possibly be influenced by the en-
vironment, which includes parents, peers, and educators.13
Consider a two-period model, which demonstrates the main features of
the economic problem and is easily generalizable to a multiple-period case.14
11See Web Appendix C for more details. In particular, Table C-13 shows measures thatdefine factors in this paper.
12Assumptions of the motivating conceptual framework do not necessarily affect the valid-ity of statistical results.
13In this simple model, I abstract from a possibility proposed by Becker and Mulligan(1997) that individuals may rationally invest in their imagination capital with the aim ofreducing the discount on future utilities.
14Since I do not calibrate the economic model, generalizing it for more than two periodsin this paper would complicate model presentation without providing any benefit such as
9

Let capital and annuity markets be perfect and earnings not be taxed. An in-
dividual maximizes the expected utility with respect to consumption {C1, C2}
and education D:
u1(C1) + B(Θ) · S(Θ, D) · u2(C2), (1)
where B is the discount factor, S is the survival probability, ut is the utility
function at period of life t. Let the discount factor B and survival S depend
on psychological skills Θ.15 Let S also depend on education D.16 Assumption
S = S(Θ, D) is theoretically justified by a companion paper by Savelyev and
Tan (2014), who show the role of health-related consumption and health in-
vestments as mediators of the effect of psychological skills and education on
health stock and longevity.
The maximization is subject to the intertemporal budget constraint
C1 + g(Θ, D) +S(Θ, D)
(1 + r)C2 = A + Y1(Θ) +
S(Θ, D)
(1 + r)Y2(Θ, D), (2)
where Y1 and Y2 are earnings in period 1 and 2, and g is the cost of educa-
tion investment.17 Earnings Y2 in the second period and cost of education g
depend on years of education D and psychological skills Θ.
It is straightforward to show from the first order conditions that marginal
benefits of education include the longevity benefit, B(Θ) ∂S(Θ,D)∂D u2(C2), rep-
resenting greater expected utility due to higher probability to survive to the
better fit to the data.15See Almlund et al. (2010) for a discussion of the relationship between psychological skills
and time preference.16In the theoretical part, I treat D as continuous. The model can be reformulated to use
categorical highest degree completed as in the rest of the paper at the expense of losingconcise mathematical representation of results.
17From theoretical considerations and in line with the psychological literature, we canexpect the cost of education to decrease with Cognition, Conscientiousness, and Openness,skills that make learning more effective. We also can expect Extraversion to have the oppositeeffect since studying implies forgone socializing, which is of higher value for those who aremore extraverted.
10
second period, induced by additional education. The benefit is amplified by
discount factor B and utility u2(C2), which makes the benefit higher for pa-
tient people (who have high B), and for wealthy people (who can afford high
C2). Both discount factor and earnings can be influenced by investments in
childhood personality skills, thus adding to incentivizing the education in-
vestment through greater marginal longevity benefit.
I supplement the theory with a number of empirical results. I confirm
the assumption of the model that S = S(D, Θ). I also empirically find: (1)∂S
∂ΘC > 0, ∂S∂ΘE > 0, ∂S
∂ΘG > 0 (higher childhood Conscientiousness, Extraver-
sion, and IQ lead to higher survival); (2) ∂D/∂ΘC > 0 and ∂D/∂ΘG > 0
(higher childhood Conscientiousness and IQ increase education); (3) At the
highest education level ∂2St∂D∂ΘC < 0 (Conscientiousness and Doctoral education
are substitutes). (4) ∂St∂D > 0 (college education increases longevity). I also find
relationships similar to the ones I found for S for other outcomes representing
longevity.
3.2 Statistical Models
From this section on, let D be a categorical choice of the highest education
level obtained in life. For highly intelligent Terman subjects, D takes values
from 1 to 5: (1) high school graduate, (2) some college education, (3) Bache-
lor’s degree, (4) Master’s degree, and (5) Doctorate.
Main Model The gold standard for modeling the hazard of death is the
semi-parametric Cox proportional hazard (PH) model (Cox, 1972). I use a
generalization of the Cox model that allows regression coefficients to vary
over time (Asparouhov et al., 2006).
My most preferred Cox model specification justified in Web Appendix D
11

can be written as
λ(t|Θ, D,X) =
λ01(t) · exp(βG1 ΘG + Z(Θ, D,X)), for 30 < t ≤ 50
λ02(t) · exp(βG2 ΘG + Z(Θ, D,X)), for 50 < t ≤ 86,
(3)
where λ is a hazard of death, λ0 is a nonparametric baseline hazard, Z is
defined as
Z(Θ, D,X) =5
∑d=1
αd1[D = d] + ∑i∈IβiΘi + γΘC1[D = 5] + δX ,
i is an index for personality skills, and 1[D = d] is an indicator that educa-
tion D has realization d. In this formula, α3 and α4 are both set to zero as
effects of reference education levels;18 I = {C, O, E}, which stands for Con-
scientiousness (C), Openness (O), and Extraversion (E). The third term on the
right-hand side represents an interaction between Conscientiousness ΘC and
education at the doctorate level (D = 5).
I test this model against an alternative that accounts for possible addi-
tional unobserved heterogeneity using the latent class technique (Heckman
and Singer, 1984) and find no evidence against the null.19
I use a generalized ordered logit model (e.g., Williams, 2006) for study-
ing schooling choice. The choice of this standard model is justified in Web
Appendix D.
In order to account for latent personality variables as determinants of
longevity and schooling choice, I estimate a factor model (4) called “measure-
ment system” simultaneously with the Cox model and the schooling model
using the maximum likelihood estimator and the expectation-maximization
algorithm. Identification of such models is standard and discussed in a num-
18Reference education level in the Cox model is Bachelor’s and Master’s education com-bined. I find no difference in longevity between people with Bachelor’s and Master’s degrees.
19See Web Appendix E for latent class analysis.
12

ber of papers such as classic Anderson and Rubin (1956), and more recent
Heckman, Pinto, and Savelyev (2013), Heckman et al. (2014), and Williams
(2011). The model can be written as
M = ξ+ψΘ + πA + γX + η, (4)
where M is a vector of K personality measures that proxy latent factors Θ;20
ξ is a vector of intercepts; ψ is a K× I matrix of factor loadings, which repre-
sents relationships between correlated latent factors Θ and personality mea-
sures; π is a vector capturing the relationship between the age of testing
A and personality measures;21 γ is a K × Q matrix that relates a vector of
background control variables X to measures; η is a vector of measurement
errors.22
A Model Allowing for a Comparison with the Literature In order to ob-
tain estimates of the effect of schooling on mortality that are based on the
methodology of this paper but are comparable with those by Buckles et al.
(2013), I also estimate a linear model controlling for latent factors, IQ, and
background variables. I define MR(y1, y2) as a binary variable that takes
value one if person died during years from y1 to y2 and value zero if person
survived through the period. Let CE be a binary variable denoting that the
highest education level in life is Bachelor’s degree or above. I estimate the
20See Web Appendix C for a justification of the measurement system specification.21I find a strong and statistically significant effect of age A on measures of Conscientious-
ness and Extraversion, implying that it is necessary to age-adjust measures of personality inthe Terman data. The effect of age on measures of Conscientiousness is uniformly positive,while it is mixed on measures of Extraversion. I find no age effect on measures of Openness.
22See Web Appendix D for further details on the factor model.
13

following linear model
MR(y1, y2) = q0 + q1CE + ∑i∈I
qi2Θi + q3ΘG + q4X + ε. (5)
for various years y1 and y2 simultaneously with the measurement system (4).
3.3 Treatment Effect Identification and Calculation
The Effect of Education There are two major statistical problems that pre-
vent us from interpreting the correlation between education and longevity as
a causal effect (e.g., Grossman, 2000): (1) confounding factors such as ability
that affect both education and longevity, and (2) reverse causality (expected
longevity affects education choice). I address both problems in order to sep-
arate out the causal effect of education on longevity.
I employ a method of causal effect identification that relies on the ex-
traordinary richness of Terman data and a possibility to control for unob-
served heterogeneity through modeling both latent personality skills (Heck-
man et al., 2006) and latent classes of individuals (Heckman and Singer,
1984). I assume that conditional on detailed background characteristics and
latent classes, all dependence across education and potential longevity out-
comes comes from cognitive and personality skills. This identification strat-
egy, which is similar to the one used in Heckman et al. (2006), should elim-
inate the omitted variable bias under the assumptions of the model. Note
that the Big Five taxonomy captures both Victor Fuchs’s favorite candidates
for confounders of the relationship between education and health: time pref-
erence and self-efficacy (Fuchs, 1982, 1997). Time preference is related to
Conscientiousness, while self-efficacy, which is the belief that one is able to
exercise control over one’s own environment and achieve one’s goals, is re-
lated to Neuroticism (see Almlund et al. (2011) for a survey).
14

To address the reverse causality problem, I control for various early health
conditions and other background characteristics that subjects may use to an-
ticipate a short life, thus resulting in low educational investments. First, I
drop a few subjects from the sample who had severe medical conditions such
as cancer early in their life and so could expect early death.23 Second, I con-
trol for longevity predictors such as early childhood health, childhood health
in 1922, early parental death, early educational investments, parental social
status, and parental wealth, among other controls. Finally, I restrict consider-
ation to subjects who survived through age 30, which both rules out people
who died early and makes education choice a past event by construction.24
It would be valuable to compare methodology used in this paper with
alternative ones based on the same data, but I was not able to find any reliable
instrumental variable for education as a cause of longevity.25
Even though it is generally impossible to fully account for confounding
factors and reverse causality, the method described above uses all available
means to minimize biases and, hopefully, makes them negligible.
The Effect of Psychological Skills While the biological view of psychology
still contends that developments of personality in adulthood are biologically
predetermined (e.g., McCrae et al., 2000), this traditional view of personality
23Controlling for them using a dummy variable is not practical when bootstrap-based in-ference is used since there are only a few such severe cases in the sample, which would createthe collinearity problem in some pseudo-samples. Longevity of children with severe diseasesshould be studied based on specific data of such children.
24Some of those who died early could anticipate their death with consequences for edu-cation. Education is largely a past choice after 30 since only 2.3% of respondents were stillstudents at that age (see Figure M-1 of the Web Appendix).
25I considered using the Great Depression, World War II, and other variables as instrumentsfor schooling. I do not document the results here, since, even though I obtain a positiveIV estimate of the effect of education on longevity that is statistically significant at 10%level, monotonicity of the instruments is questionable, the instruments are not strong enough(Stock et al., 2002), and standard errors are too large for the estimate to be informative. HadI considered instruments as the only possible treatment effect identification tool, the rich andunique Terman data would be useless.
15

as stable and non-malleable has been challenged by recent literature. Roberts
and Bogg (2004) provide evidence that Conscientiousness and socioenviron-
mental factors influence each other. Heckman, Pinto, and Savelyev (2013)
show experimental evidence that skills closely related to Conscientiousness
can be improved through educational intervention in early life with major
consequences for later life outcomes. Papers by Almlund et al. (2011) and
Conti and Heckman (2014) survey a large body of literature and support the
view that personality skills are malleable and can be affected by interventions.
As in the case with the education effect identification, there might be con-
founding factors, such as parental skills, that affect both childhood skills (e.g.,
through investments) and longevity (e.g., through providing a personal exam-
ple of healthy lifestyles). Poor early health may affect both childhood skills
and mortality in adulthood. Reverse causality is also not impossible, since an-
ticipation of shorter lifespan may affect investments into childhood skills. To
minimize a possible omitted variable bias, I control for a detailed set of indi-
vidual and family background variables,X , thus eliminatingX and variables
that are closely related to X as confounding factors. Even though I do not
observe parental personality, I do observe education and occupation of both
mother and father, as well as their wealth and social standing. I expect these
multiple controls to indirectly capture the most of productive and health-
relevant parental skills and lifestyles.26 Early health measures, the childhood
health measure, and other controls should minimize the bias due to reverse
causality. As above, evidence from latent class analysis can be interpreted as
an indication of no sizable unobserved heterogeneity.
26For instance, parental education and skill level of occupation is expected to positivelycorrelate with parental Conscientiousness and IQ. Higher level of earnings likely correlateswith healthy lifestyles and Extraversion.
16

Understanding Mechanisms Reinforces the Causality Claim The influen-
tial Surgeon General’s Report (Terry et al., 1964) was highly convincing of
the causal effect of tobacco smoking on mortality despite relying on corre-
lational evidence since strong correlational evidence was combined with ev-
idence of concrete chemical and biological mechanisms of smoking causing
cancer. Likewise, results of our companion papers (Hong, Savelyev, and Tan,
2014; Savelyev and Tan, 2014) reinforce treatment effect evidence from this
paper with evidence on mechanisms. As described in Web Appendix A, our
papers show multiple channels through which education and personality may
affect longevity: weight control, smoking tobacco, heavy drinking of alcohol,
physical exercise, earnings, social ties, and stable marriage.
Outcomes of Interest I estimate treatment effects on the following four out-
comes describing longevity: the hazard of death, survival function, life ex-
pectancy, and an aggregated measure of mortality similar to that used in
Buckles et al. (2013). I also evaluate the effects on longevity in US dollars.
Estimation of survival function S involves many technicalities that are de-
scribed in Web Appendix F. I estimate S as a function of age t, starting age
t0 at which a person is known to be alive, personality θ, and education d.27
Once we know S, we can calculate life expectancy at age t0 for any t0 ≥ 30:
e(t0,θ, d) =∫ ∞
t0
S(t, t0,θ, d) dt. (6)
In order to evaluate the effect of education on survival in US dollars, I cal-
culate the value of remaining life VR at age t0 using the methodology from
27Realizations θ and d correspond to random variables Θ and D.
17

Murphy and Topel (2006). Generally, VR can be written as:
VR(t0, d) =∫ ∞
t0
v(t, d)S(t, t0, d)e−r(t−t0) dt, (7)
where v(t, d) is the value of a life-year at age t for a person with education
level d. The effect of education level on VR, ∆VR = VR(t0, d2)−VR(t0, d1), can
be decomposed into three terms:
∆VR =∫ ∞
t0
v∆Se−r(t−t0) dt︸ ︷︷ ︸value of greater longevity
+∫ ∞
t0
∆vSe−r(t−t0) dt︸ ︷︷ ︸value of greater quality of life
+∫ ∞
t0
∆v∆Se−r(t−t0) dt.︸ ︷︷ ︸interaction term
(8)
One of the aims of this project is to evaluate the monetary value of the
longevity contribution, the first term of this decomposition.
I use the shape of the v(t) function from Murphy and Topel (2006) and
follow the authors in using interest rate r of 3.5%. In order to evaluate effects
on longevity in today’s prices, I multiply v(t) from Murphy and Topel by
an adjusting coefficient to achieve the statistical value of life in the Terman
population of $9.1 mln US dollars, an estimate that was recently adopted by
the US Department of Transportation28 and is grounded in the most recent
economic research (Viscusi, 2013).29 I use the value of statistical life VS as
defined in Murphy and Topel (2006), a survival-adjusted average of the value
of remaining life over a period of economically active life.30 Given that white
28Polly Trottenberg and Robert S. Rivkin. “Guidance on Treatment of the EconomicValue of a Statistical Life in U.S. Department of Transportation Analyses,” Office ofthe Secretary of Transportation, U.S. Department of Transportation, 2013. Availableat http://www.dot.gov/office-policy/transportation-policy/guidance-treatment-economic-value-statistical-life.
29The median estimate based on the literature that used the most reliable data, the Censusof Fatal Occupational Injuries, is $9.3 mln (Viscusi, 2013). The US Department of Transporta-tion adopted $9.1 mln based on the same data. Readers who prefer a different estimate ofthe value of life can easily adjust all estimates in this paper by multiplying them by a ratio oftheir favorite value of life estimate to $9.1 mln.
30See Web Appendix F for more details.
18

men with high IQ have much higher earnings than a random person from the
general population, and that the elasticity of the value of life with respect to
earnings is at least 1.0 (Viscusi, 2013), the value of life estimates provided here
are conservative. The interpretation of this evaluation is the lower bound of
the value of educational investments for the contemporary statistical person
from the relevant population if we expect the effects of the investment to be
the same as for the Terman cohort.
Average Treatment Effects Consider the average effect of increasing educa-
tion level from d1 to d2 on Y, where Y denotes any outcome of interests such
as S, e, VR or VS. Based on identification assumptions discussed above in this
section, estimated model coefficients for education and skills represent aver-
age treatment effects, and so we can write: ∆Y(θ, d1, d2) = Y(θ, d2)−Y(θ, d1)
and, after integrating skills out, ∆Y(d1, d2) = Y(d2) − Y(d1). The average
treatment effects of skills given education (the direct effect of skills) is de-
fined by ∂Y(θ,d)∂θi , for i ∈ {C, O, E, G}.
For comparison with Buckles et al. (2013) I use an estimate q1 from equa-
tion (4) multiplied by 1000. The interpretation of 1000q1 given the assump-
tions of the statistical model is the causal effect of college education on the
number of deaths among 1000 of a population between years y1 and y2.
4 Empirical Results and Discussion
I first motivate the empirical study based on descriptive statistics. Then, I dis-
cuss estimates of the main model and proceed with the analysis of treatment
effects on survival, life expectancy, and an aggregate measure of mortality
that was used by Buckles et al. (2013). Finally, I discuss a number of robust-
ness checks.
19

Descriptive Results Consider first dependencies among variables without
imposing any parametric assumptions. Figure 2 shows the Kaplan-Meier es-
timates of survival by education and gender. For males, higher levels of edu-
cation correspond to higher survival. Indeed, while only 23% of high school
graduates survive to age 80, 60% of doctorates do.31 For females, we can see
no difference between the survival curves from high school to Master lev-
els. Although the estimated survival curve for the sample of 27 females with
doctoral degrees stays below other survival curves, confidence intervals for
the survival curve of female Doctorates are too large to claim that the curve
differs from others.32 Other documented nonparametric results include asso-
ciations between longevity and skills of Conscientiousness and Extraversion,
as well as the association between skills and education outcomes.33
Treatment Effects of Education and Psychological Skills on the Hazard of
Death Figure 3 shows multiplicative effects on the hazard of death λ that
include: (1) effects of education levels relative to Bachelor’s and Master’s
levels combined,34 and (2) effects of early psychological skills conditional on
the future choice of education, which are the direct effects of skills as opposed
31It may seem surprising that 10-11% of high-ability people did not proceed beyond highschool. In Web Appendix B I argue that high-school education was perceived as relativelyhigh level of education for this cohort corresponding rank-wise to today’s Bachelor’s degree.
32See Figure M-2 in the Web Appendix, which shows that we can statistically distinguishsurvival curves for males but not for females. We may also expect that females who chose amale-like degree of that time (a Doctorate) could be more inclined to also have more male-like habits such as smoking and hence die from associated diseases early on. This hypothesisis not supported by the data on the causes of death reported by relatives; but, given lowsample size of female doctorates and possible measurement error in the reported causes ofdeath, it is hard to be sure about any statistical inference. In addition, in Web Appendix G, Ishow that having a doctoral degree for high-ability females born in the beginning of the 20thCentury is associated with lower family life satisfaction, lower general happiness, and fewerchildren. Some of these factors could be behind this unusual pattern of longevity unless thepattern is just an artifact of the data.
33To save space, these graphs are shown and discussed in Web Appendix M (see FiguresM-3–M-6 for survival curves by personality skills, Figures M-7–M-8 for kernel densities ofpsychological skills by education, and Figure M-9 for personality skills by gender).
34There is no difference in longevity between Bachelor’s and Master’s levels.
20
Figure 2: Kaplan-Meier Survival Function by Education
(a) Males
0.1
0.2
0.3
0.4
0.5
0.6
0.7
0.8
0.9
1.0
0.1
0.2
0.3
0.4
0.5
0.6
0.7
0.8
0.9
1.0
Surv
ival
Pro
babi
lity
30 35 40 45 50 55 60 65 70 75 80 85
Age
High School (69) Some College (112)Bachelor’s (204) Master’s (125)Doctorate (170)
(b) Females
0.1
0.2
0.3
0.4
0.5
0.6
0.7
0.8
0.9
1.0
0.1
0.2
0.3
0.4
0.5
0.6
0.7
0.8
0.9
1.0
Surv
ival
Pro
babi
lity
30 35 40 45 50 55 60 65 70 75 80 85
Age
High School (59) Some College (107)Bachelor’s (222) Master’s (114)Doctorate (27)
Notes: Probability of survival is conditional on survival to age 30. Sample sizes are shownin parentheses. Education groups are mutually exclusive and refer to the highest level ofeducation obtained in life. Calculations are based on the Terman data. See Figure M-2 of theWeb Appendix for pairwise comparisons of curves with confidence intervals shown.
21
to indirect effects that work through education.35
Figure 3: Multiplicative Effects of Education and Psychological Skills on theHazard of Death
(a) Males (b) Females2.08
1.36
0.92
0.83
1.06
0.86
1.07
0.64
1.02
High School
Some College
Doctorate
Conscientiousness below Doctorate
Conscientiousness for Doctorates
Extraversion
Openness
IQ before age 50
IQ after age 50
0 1 2 3Effect
2.08
1.36
0.92
0.83
1.06
0.86
1.07
0.64
1.02
High School
Some College
Doctorate
Conscientiousness below Doctorate
Conscientiousness for Doctorates
Extraversion
Openness
IQ before age 50
IQ after age 50
0 1 2 3Effect
1.01
0.92
1.41
0.87
1.15
1.00
1.09
0.48
0.94
High School
Some College
Doctorate
Conscientiousness below Doctorate
Conscientiousness for Doctorates
Extraversion
Openness
IQ before age 50
IQ after age 50
0 1 2 3Effect
Notes: Effects of education are relative to the baseline Bachelor’s or Master’s degree. Effectsof childhood psychological skills are direct effects conditional on the future choice of edu-cation. Bars represent 95% confidence intervals. Corresponding Cox model parameters arepresented in Panel 1a of Table 3.
For males, high school graduates have about 100% higher hazard of death
than those with a Bachelor’s or Master’s degree (see Panel (a)). Those with
some college education have about 40% higher hazard of death. A Doctorate
degree makes no statistically significant difference relative to Bachelor’s and
Master’s degrees.
Further, a one standard deviation increase in childhood Conscientiousness
(for men with education below Doctorate) or Extraversion (for men with any
level of education) decreases the hazard of death by about 17 and 14% re-
spectively. Finally, IQ decreases the hazard of death by 36% despite already
high IQ level in the sample, but only at ages 30–50. As we can see from panel
(b), the only statistically significant result for females is a similar effect of
35Estimates of the indirect effects are small and statistically insignificant.
22

IQ. The estimate of the effect of Conscientiousness is similar for males and
females, but we cannot distinguish the effect for females from zero due to
higher standard error.
These gender differences are consistent with results by Conti and Heck-
man (2010), who show that both education and personality skills affect health
and health behaviors more for males than for females even for the contempo-
rary population. For the Terman population, for which women faced stronger
pressure from the society in terms of following certain healthy lifestyles, we
should expect even smaller role of skills and education.36
Results for Conscientiousness and Education are not surprising given the
prior evidence mentioned in the introduction. Results for Extraversion and IQ
are novel for a high-ability population. Our companion paper (Savelyev and
Tan, 2014) based on the same data suggests that even though Extraversion
increases heavy drinking, it also increases earnings and improves mental and
general health, which sheds light on some mechanisms of the effect.
At the same time, the unexpected age-dependence of the IQ effect is chal-
lenging to interpret. Given that we observe the effect for both males and
females, it is unlikely to be just an artifact of the data. There is evidence that
the effect is not due to violent deaths such as accidents or suicide.37 One
possible interpretation is that the IQ result is specific to the sample of peo-
ple born in 1904–1915, who in young adulthood were subject to both physical
and psychological challenges associated with the Great Depression and World
War II. Higher IQ could provide a survival advantage for dealing with these
challenges. Whatever the interpretation of the effect and whatever its gener-
alizability to different cohorts and different populations, it is useful to control
for this time dependence in this particular estimation for the sake of better
36See also Friedman et al. (1993) for a discussion of these mechanisms.37See Tables M-1 and M-2 and their discussion in Web Appendix M for more details.
23

model specification. The role of the IQ effect in early life is minor in forming
life expectancy since deaths are not frequent at ages 30–50.38
Early psychological skills also affect education. As documented in the Web
Appendix, education is boosted by Conscientiousness and IQ, but effects are
not strong.39
Treatment Effect of Education on Survival Function Since I find no educa-
tion and personality gradient for females in either descriptive nonparametric
or most preferred semi-parametric models, all discussion below is for males,
for whom the gradient is substantial.
Survival function S is fundamental for making intertemporal economic
decisions such as investments in education. S acts as a discount factor for
both expected utility and the budget constraint (see Equations (1) and (2)).
The importance of S motivates studying its major determinants.
I find that survival monotonically increases with education (see Figure
4).40 The survival curve for the general population of white males born in
1910 based on the Census data shown in the same figure is most similar with
the survival curve for Terman participants who stopped their education at
the high-school level. Vertical distances between survival curves by educa-
tion represent the treatment effect of education on survival. These effects
are documented and discussed in the Web Appendix I, with the conclusion
that the maximal survival effect of university degrees relative to high school
education is archived at age 80 and constitutes statistically significant 22–25
percentage points.
38See Figure M-10 of the Web Appendix M illustrating the relatively minor role of IQ inoverall survival (panel (a)), but strong role of IQ at ages 30–50 (panel (b)).
39See Figures M-11 and M-12, Table M-3, as well as their description in Web Appendix M.40See Web Appendix H for interpolation and extrapolation of the baseline survival func-
tion, which is an intermediary step for predicting survival curves. I also discuss the robust-ness of the survival curve to alternative methods of extrapolation in the appendix.
24
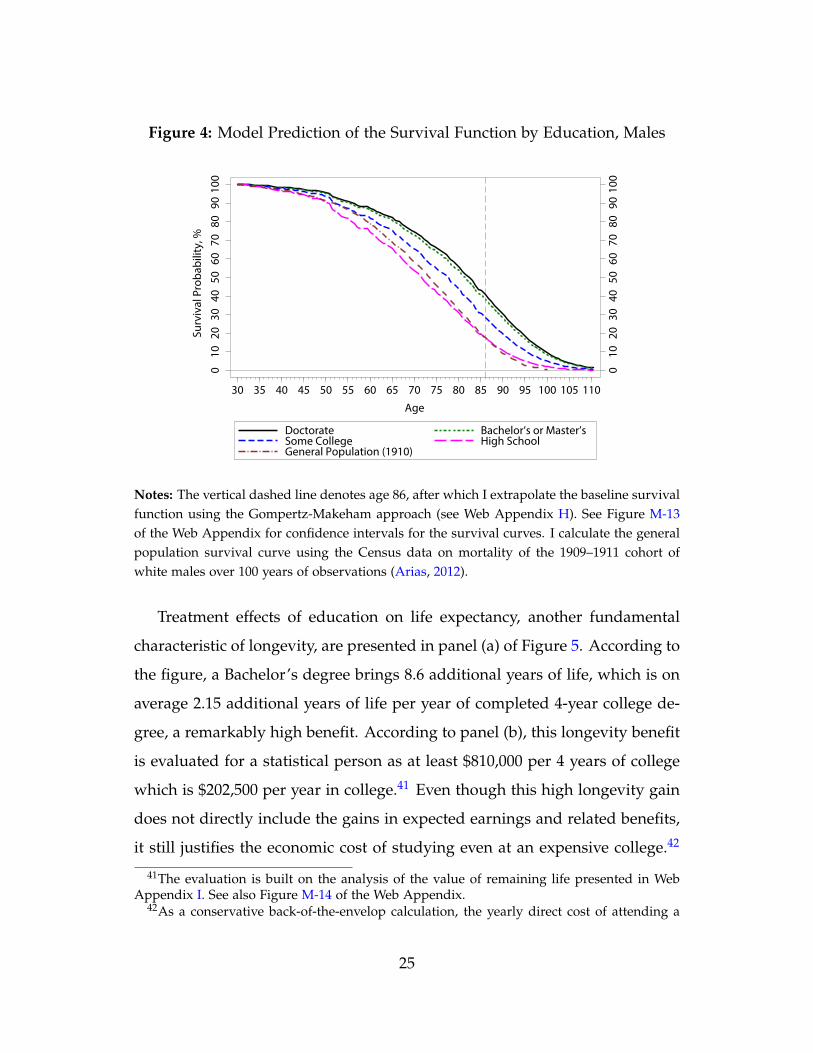
Figure 4: Model Prediction of the Survival Function by Education, Males
010
2030
4050
6070
8090
100
010
2030
4050
6070
8090
100
Surv
ival
Pro
babi
lity,
%
30 35 40 45 50 55 60 65 70 75 80 85 90 95 100 105 110
Age
Doctorate Bachelor’s or Master’sSome College High SchoolGeneral Population (1910)
Notes: The vertical dashed line denotes age 86, after which I extrapolate the baseline survivalfunction using the Gompertz-Makeham approach (see Web Appendix H). See Figure M-13of the Web Appendix for confidence intervals for the survival curves. I calculate the generalpopulation survival curve using the Census data on mortality of the 1909–1911 cohort ofwhite males over 100 years of observations (Arias, 2012).
Treatment effects of education on life expectancy, another fundamental
characteristic of longevity, are presented in panel (a) of Figure 5. According to
the figure, a Bachelor’s degree brings 8.6 additional years of life, which is on
average 2.15 additional years of life per year of completed 4-year college de-
gree, a remarkably high benefit. According to panel (b), this longevity benefit
is evaluated for a statistical person as at least $810,000 per 4 years of college
which is $202,500 per year in college.41 Even though this high longevity gain
does not directly include the gains in expected earnings and related benefits,
it still justifies the economic cost of studying even at an expensive college.42
41The evaluation is built on the analysis of the value of remaining life presented in WebAppendix I. See also Figure M-14 of the Web Appendix.
42As a conservative back-of-the-envelop calculation, the yearly direct cost of attending a
25

Finally, rectangles on the graphs representing robustness of estimates to alter-
native extrapolation methods suggest that extrapolation methodology makes
little difference.
Figure 5: Effects of Education on the Life Expectancy and the CorrespondingMonetary Value for a Statistical Person, Males
(a) Gains in Life Expectancy (b) Monetary Value
4.9
8.6
9.4Doctorate
Bachelor's or Master's
Some College
0 5 10 15Years
4.9
8.6
9.4Doctorate
Bachelor's or Master's
Some College
0 5 10 15Years
0.49
0.81
0.89Doctorate
Bachelor's or Master's
Some College
0.0 0.5 1.0 1.5Millions of U.S. Dollars
Notes: Effects are relative to the baseline remaining life expectancy at age 30 for high-schoolgraduates, which is 40.7 years (see Figure M-16 of the Web Appendix for life expectancy byeducation). Black dots represent estimates. Bars represent the 95% bootstrap confidence in-tervals. Widths of rectangles around dots represent robustness of the estimates with respectto alternative extrapolations of the baseline survival function from age 86 to age 110 docu-mented in Web Appendix H. Monetary values are in 2013 US dollars. Calculations are basedon the Terman data.
Effects of Skills on Life Expectancy Conditional on Education Choice Fig-
ure 6 shows how life expectancy at birth conditional on survival to age 30
changes depending on deciles of a particular skill, keeping all other skills at
top private college in the US today is about $47,000 (tuition, books and supplies, other fees).The forgone labor income is about $40,000, so that the total economic cost of one year of high-quality education is about $87,000. The value of additional longevity per year of schooling ofa statistical person discounted to age 18 with a rate of 3.5% is about $100,000, which exceedsthe total cost of college by $13,000, but less conservative estimates give an even larger gap.Indeed, according to the College Board, an average cost of a public college for state residentsin 2013-14 is about $9,000, while many students at private schools receive scholarships.
26
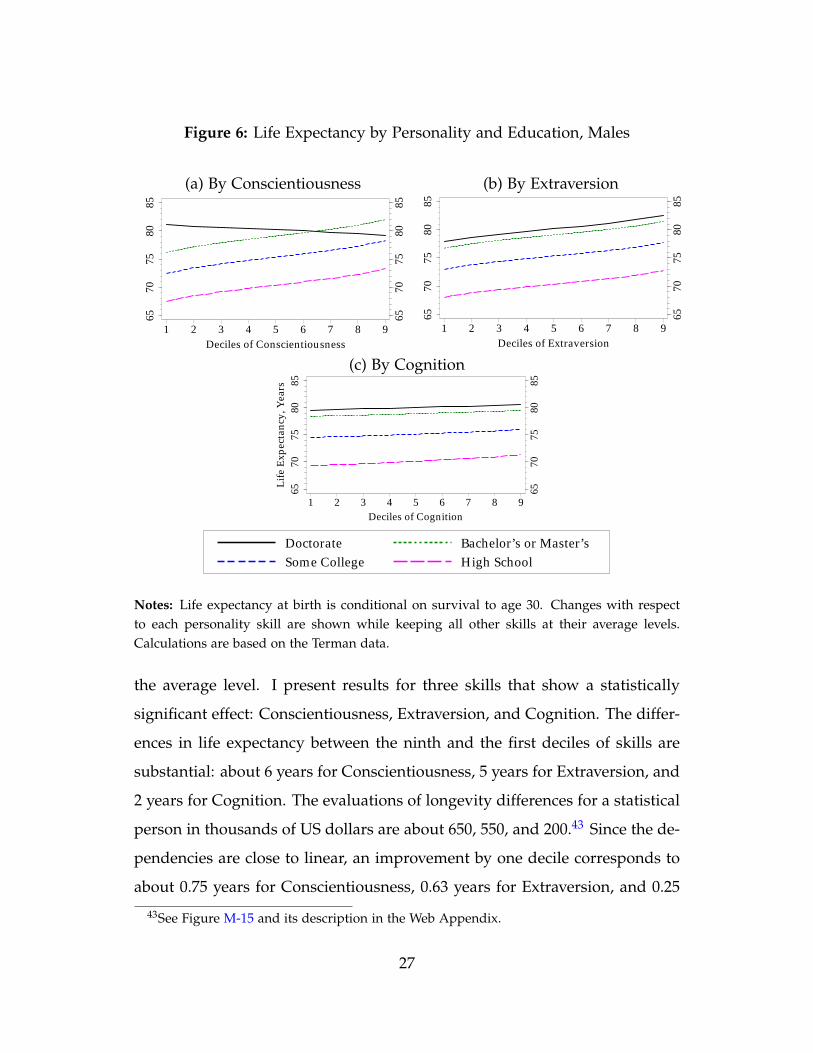
Figure 6: Life Expectancy by Personality and Education, Males
(a) By Conscientiousness (b) By Extraversion
6570
7580
85
6570
7580
85L
ife
Exp
ecta
ncy,
Yea
rs
1 2 3 4 5 6 7 8 9Deciles of Conscientiousness
Doctorate Bachelor’s or Master’sSome College High School
6570
7580
85
6570
7580
85L
ife
Exp
ecta
ncy,
Yea
rs
1 2 3 4 5 6 7 8 9Deciles of Extraversion
Doctorate Bachelor’s or Master’sSome College High School
(c) By Cognition
6570
7580
85
6570
7580
85L
ife
Exp
ecta
ncy,
Yea
rs
1 2 3 4 5 6 7 8 9Deciles of Cognition
Doctorate Bachelor’s or Master’sSome College High School
6570
7580
85
6570
7580
85
Lif
e E
xpec
tanc
y, Y
ears
1 2 3 4 5 6 7 8 9
Deciles of Extraversion
Doctorate Bachelor’s or Master’sSome College High School
Notes: Life expectancy at birth is conditional on survival to age 30. Changes with respectto each personality skill are shown while keeping all other skills at their average levels.Calculations are based on the Terman data.
the average level. I present results for three skills that show a statistically
significant effect: Conscientiousness, Extraversion, and Cognition. The differ-
ences in life expectancy between the ninth and the first deciles of skills are
substantial: about 6 years for Conscientiousness, 5 years for Extraversion, and
2 years for Cognition. The evaluations of longevity differences for a statistical
person in thousands of US dollars are about 650, 550, and 200.43 Since the de-
pendencies are close to linear, an improvement by one decile corresponds to
about 0.75 years for Conscientiousness, 0.63 years for Extraversion, and 0.25
43See Figure M-15 and its description in the Web Appendix.
27

years for Cognition, with value for a statistical person equal to 81, 69, and
25 thousand USD respectively.44 Thus, an early intervention performed by
parents or educators that by age 12 improves productive psychological skills
by one decile is expected to lead to substantial longevity benefits later on.
All curves in Figure 6 are parallel except for one curve. The parallelism
represents the lack of interactions between education and personality skills.
The line that is not parallel to the others represents life expectancy by Consci-
entiousness for Doctorates (see panel (a)). While slopes of all other lines are
statistically significant, we cannot distinguish the slope of the line for Doc-
torates from zero, implying that future doctorates do not benefit in terms of
longevity from additional childhood Conscientiousness so that the longevity
returns to Doctorate degree decline with Conscientiousness.45 This result is in
line with Conti et al. (2011), who found a negative interaction between educa-
tion and a Conscientiousness-related personality skill in predicting a number
of health behaviors.
I offer two possible explanations for the observed decline of the effect of
the Doctorate degree with childhood Conscientiousness. First, knowledge,
lifestyles, and earnings that come with a Doctorate degree promote health-
ier behaviors and health investments, which compensate for somewhat lower
adult Conscientiousness, which comes as a consequence of lower childhood
Conscientiousness. This explanation is consistent with evidence based on
the same data of the strong effect of Doctoral education on wages and the
number of memberships in organizations (Savelyev and Tan, 2014).46 The
44These are present values of the value of additional longevity induced by changing skillsby one decile for a statistical person.
45See Figure M-17 of the Web Appendix showing average effects of doctorate education byConscientiousness. While for the first decile the effect of a Doctorate degree is statisticallysignificant at 14 additional years of life, for the ninth decile the effect is borderline statisticallysignificant at six years.
46A number of other important behaviors that were probably affected by a Doctorate de-gree, such as smoking, were either not observed in the Terman data or were measured only
28

second explanation is that the process of obtaining doctoral education helps
develop adult Conscientiousness, so that people with low childhood Con-
scientiousness develop more additional Conscientiousness than people who
were already conscientious. The Terman data are not suitable for testing this
second possible explanation because of the lack of comparable measures of
personality across ages, but this assumption is in line with growing evidence
of the malleability of personality skills over the lifecycle (see Almlund et al.
(2011) for a survey).
Comparison with the Literature I compare estimates of the effect of college
education on an aggregated measure of mortality, which is similar to the
measure used in Buckles et al. (2013). Table 2 shows a remarkably close
agreement between the most preferred 2SLS results by Buckles et al. (2013)
and my calculations based on different data and methodology.
Table 2: Effect of College Degree on Mortality per 1000 Population, Males
Average age over the risk period
The effect of college *** -102 ** -99 ** -98 **
Standard error (40) (41) (43)
Sample size 629 625 623
Duration of the mortality risk period
Age at the beginning of the risk period
Age at the end of mortality risk period
Mortality risk period
Population
Cohorts
Age range in the cohorts 12
white males of the
general US
population
white males with high IQ from California
1981–2007
27
12
28–39
54–65
1942–1953
(D) 54.5(C) 52.5(B) 50.5(A) 46.5
1904–1915
-94
(26)
36–47
62–73
1951–1977
27 27 27
32–42
58–69
1947–1973
34–45
60–71
1949–1975
600
Buckles et al. (2013) This paper
Notes: Panels (A) and (B) present the cubic-2SLS estimate from Buckles et al. (2013) and themost comparable model of this paper. Panels (C) and (D) contain robustness checks.
late in the panel, at which time surviving respondents were 70–80 years old.
29

Such a close match may not be expected ex-ante given the different ages of
birth (1904–15 vs. 1942–53) and different levels of the average IQ (149 vs. 100),
but it is possible that factors associated with higher IQ and factors associated
with the earlier cohort about cancelled each other out.47
To further discuss Table 2, there are many similarities between the cohort
used by my paper and that used by Buckles et al. (2013) documented in the
table. There is one complication though. The risk period in Terman that cor-
responds to the same age range as in the Buckles et al. paper starts in the
middle of World War II, a period that includes additional risks for mortal-
ity even outside battlefields, such as merchant ships sunk by submarines or
weapon-related accidents. To account for this problem, I shift the starting
year of observations a few years further to 1947. I make a robustness check
using two further shifts towards older ages shown in panels (C) and (D), and
find that small shifts like this have negligible effects on the estimate.
Data Limitations and External Validity Economists usually study data sam-
pled from the general population, but the Terman data are still informative
for a number of reasons. First, the effect of education on health may differ
with the level of IQ, and this paper allows us to explore the limiting case
when IQ is high and to verify claims made in the literature. Contrary to Auld
and Sidhu (2005), who use parental education as an IV and claim that school-
ing has a large effect on health “only for individuals who obtain low levels of
schooling, particularly low-ability individuals” and that “years of schooling
beyond high school contribute very little to health,” I find that college edu-
47We can see a similar cancelling out in panel (b) of Figure J-1 of the Web Appendix, inwhich Vietnam War generation (born about 1940–50) life expectancy curves approach such acurve for the Terman cohort (born about 1910) from below. Moreover, as I showed in the WebAppendix I, static approach to life expectancy calculation leads to a downward bias of aboutthree years at age 30. The Vietnam War generation survival curves corrected for the bias (notshown) are even closer to the Terman survival curve.
30

cation strongly increases longevity even for individuals with extraordinarily
high ability. Second, having a sample of high IQ subjects allows me to study
effects on longevity of all education levels up to a Doctorate degree without
worrying about a confounding effect of IQ: all participants had enough cog-
nitive potential to receive a Doctorate, a property that only holds in a sample
selected on high ability. Finally, I argue that even though the main results of
this paper are obtained for men with extraordinarily high IQs, the results are
likely generalizable to a much broader population of men who are smart but
not necessarily extraordinarily smart, since good choices of beneficial health
behaviors such as healthy diet or regular physical exercise, which are pow-
erful mechanisms of longevity production, do not require an extraordinary
cognitive talent. With a number of limitations, I also argue in favor of gen-
eralizing the results of this paper to contemporary cohorts of males (see Web
Appendix L for more details.)
Comparison to Alternative Cox Model Specifications I compare alternative
Cox Model specifications for males in Table 3 for the analysis of model robust-
ness to alternative specifications and its sensitivity to misspecification.48
Coefficients of my most preferred Cox model of mortality hazard are tab-
ulated in panel 1a.49,50 A comparison with a similar model based on teachers’
48Table 3 shows estimates for the main variables only. Estimates for background controlsand for the measurement system are presented and described in the Web Appendix (seeTables M-4 and M-5). Unlike for males, the hypothesis that the Cox regression coefficientsare jointly zero cannot be rejected for females, and therefore I placed the corresponding Tablefor females to the Web appendix as less informative (see Table M-6).
49As discussed above, conditioning on survival through age 30 is motivated by observedcompletion of education by that age by almost all subjects, which makes education a pastevent. In Tables M-7–M-8 of the Web Appendix I show that the results of the model arerobust to the choice of such age: regression coefficients and p-values for models with initialages of 40, 50, and 60 are similar.
50A simplification of model 1a, in which I do not control for education and interactionbetween Doctorate and Conscientiousness, is still in line with the main results showing effectsof Conscientiousness and Extraversion for males but not for females (see Table M-9 of the WebAppendix).
31

Tabl
e3:
Cox
Prop
orti
onal
Haz
ard
Mod
elof
Mor
talit
y,M
ales
PH
te
st
p-v
alu
es(d
)
1a
2a
3a
1b
2b
3b
1c
2c
3c
45
E
du
cati
on
H
igh
sch
oo
l 0
.73
0*
**
0.6
88
**
*0
.80
8*
**
0.7
34
**
*0
.70
4*
**
0.8
27
**
*0
.72
4*
**
0.7
15
**
*0
.78
5*
**
0.7
01
**
*0
.75
3*
**
0.5
37
(0.193)
(0.193)
(0.181)
(0.194)
(0.203)
(0.193)
(0.197)
(0.203)
(0.185)
(0.194)
(0.183)
S
om
e c
oll
eg
e0
.31
0*
*0
.29
1*
0.3
51
**
0.3
40
**
0.3
35
**
0.3
99
**
*0
.30
8*
0.3
22
**
0.3
61
**
0.3
61
**
0.4
32
**
0.6
18
(0.154)
(0.153)
(0.148)
(0.150)
(0.165)
(0.143)
(0.158)
(0.157)
(0.154)
(0.146)
(0.142)
B
ach
elo
r's
or
Ma
ste
r's
de
gre
e–
––
––
––
––
––
–
––
––
––
––
––
–
D
oct
ora
te d
eg
ree
-0.0
84
-0.1
12
-0.1
91
-0.1
09
-0.1
74
-0.2
07
-0.0
93
-0.0
95
-0.1
71
-0.1
08
-0.1
68
0.7
61
(0.147)
(0.148)
(0.144)
(0.148)
(0.157)
(0.167)
(0.144)
(0.148)
(0.139)
(0.140)
(0.135)
P
sych
olo
gic
al
skil
ls
C
on
scie
nti
ou
sne
ss
-0.1
89
**
-0.1
65
**
-0.3
20
**
*-0
.19
4*
*-0
.14
9*
*-0
.28
2-0
.12
8-0
.12
3*
-0.2
29
**
––
0.3
06
(0.079)
(0.069)
(0.089)
(0.081)
(0.073)
(0.212)
(0.088)
(0.070)
(0.094)
––
C
on
scie
nti
ou
sne
ss ×
Do
cto
rate
0.2
49
*0
.21
20
.39
4*
*0
.29
6*
*0
.27
7*
0.4
30
**
0.1
24
0.0
96
0.1
96
––
0.8
75
(0.147)
(0.135)
(0.155)
(0.144)
(0.143)
(0.189)
(0.161)
(0.138)
(0.157)
––
E
xtra
ve
rsio
n-0
.15
2*
*-0
.11
2*
-0.1
01
-0.0
73
-0.0
27
-0.0
26
-0.1
63
*-0
.12
8*
*-0
.12
6–
–0
.34
0
(0.063)
(0.060)
(0.075)
(0.077)
(0.064)
(0.076)
(0.084)
(0.064)
(0.079)
––
O
pe
nn
ess
0.0
71
0.0
48
0.1
73
*0
.09
30
.04
20
.13
60
.06
70
.04
70
.14
2–
–0
.30
4
(0.076)
(0.062)
(0.090)
(0.083)
(0.068)
(0.144)
(0.089)
(0.062)
(0.088)
––
I
Q,
ag
es
30
-50
-0.4
47
**
-0.4
44
**
–-0
.44
6*
*-0
.50
9*
*–
-0.4
49
**
-0.4
92
**
–-0
.44
5*
*–
0.1
86
(0.213)
(0.212)
–(0.213)
(0.231)
–(0.215)
(0.241)
–(0.215)
–
I
Q,
ab
ov
e a
ge
50
0.0
20
0.0
22
–0
.02
30
.01
6–
0.0
20
0.0
12
–0
.02
7–
0.2
42
(0.064)
(0.064)
–(0.065)
(0.071)
–(0.064)
(0.065)
–(0.064)
–
Ba
ckg
rou
nd
Va
ria
ble
sY
es
Ye
sN
oY
es
Ye
sN
oY
es
Ye
sN
oY
es
No
–
Join
t te
st p
-va
lue
(e)
0.0
00
0.0
00
0.0
00
0.0
00
0.0
00
0.0
00
0.0
00
0.0
00
0.0
00
0.0
00
0.0
00
0.3
47
Sa
mp
le s
ize
68
06
80
68
06
80
68
06
80
68
06
80
68
06
80
68
06
80
Te
ach
ers
' a
nd
Pa
ren
ts' R
ati
ng
s(a)
Te
ach
ers
' R
ati
ng
s(b)
Pa
ren
ts' R
ati
ng
s(c)
No
co
ntr
ol
for
pe
rso
na
lity
Not
es:
Mod
el1a
isth
em
ost
pref
erre
dm
odel
.(a
) Pers
onal
ity
skill
sar
em
easu
red
base
don
aver
aged
rati
ngs
ofth
esa
me
skill
sin
de-
pend
entl
ym
ade
byth
ete
ache
ran
dth
epa
rent
sof
the
child
;(b
) only
teac
her’
sra
ting
sus
ed;
(c) on
lypa
rent
alra
ting
sus
ed;
(d) to
test
the
prop
orti
onal
haza
rdas
sum
ptio
n,I
perf
orm
the
Wal
dte
st.
Ial
low
the
coef
ficie
ntin
ques
tion
todi
ffer
for
ever
yte
n-ye
arpe
riod
,and
then
test
ifco
effic
ient
sar
eth
esa
me
acro
ssti
me.
Ate
n-ye
arpe
riod
isch
osen
from
prac
tica
lcon
side
rati
ons
give
nsa
mpl
esi
zeof
680.
(e) Te
stif
alll
iste
dco
effic
ient
sar
eze
ro(e
xcep
tfo
rth
ejo
int
PHte
stin
the
last
colu
mn,
whi
chis
the
unio
nof
alli
ndiv
idua
lPH
-tes
ts).
Mod
els
1a,
1b,a
nd1c
are
vers
ions
ofth
em
ain
fact
orm
odel
.M
odel
s2a
,2b,
and
2car
eco
rres
pond
ing
mod
els
usin
gan
inde
x(a
vera
ged
mea
sure
s)in
stea
dof
late
ntfa
ctor
s.M
odel
s3a
,3b,
and
3car
eve
rsio
nsof
the
mai
nfa
ctor
mod
elw
itho
utco
ntro
lling
for
IQan
dX
.Mod
el4
cont
rols
for
IQbu
tno
tpe
rson
alit
y.M
odel
5co
ntro
lsfo
red
ucat
ion
only
.
32

and parents’ ratings (models 1b and 1c) reveals that the causal effects of edu-
cation and IQ are robust to the type of rater, while effects of personality skills
show some differences. In particular, while signs of estimated coefficients are
robust to the choice of rater, estimates and standard errors vary. A likely in-
terpretation of this result is that teachers and parents see children in different
environments, which may induce differences in answers. For instance, the
side of extraversion that teachers may observe in class (say, love for socializ-
ing, which is not always productive for learning) could be less predictive for
longevity than the side of extraversion that parents observe (say, leadership
and good relationships with friends). As in previous research based on the
same data (Friedman et al., 2010, 1995, 1993), I average ratings for my best
estimates to account of all available sources of information. This approach is
in line with Murray et al. (2007), who conclude that obtaining ratings from
multiple informants is critical for obtaining a full picture of children’s func-
tioning.
A comparison of the most preferred model’s 1a estimates with estimates
based on the less preferred model (2a) shows biases that are induced by ignor-
ing the factor-analytic method as a way to control for measurement error in
measures.51 Unlike a factor model, an equally-weighted average of measures,
which I call here “an index,” only partly controls for measurement error by
diminishing it through averaging. When the number of measures to be aver-
aged is small, using an index is associated with a substantial attenuation bias,
which I show in this paper. I demonstrate biases of 12–25% in Figure 7, which
shows two direct effects of personality skills on the hazard of death that are
statistically significant, namely effects of Conscientiousness (for education be-
low Doctorate) and Extraversion. I also find that the bias due to omission of
51See Figure M-18 of the Web Appendix for the share of measurement error in measures,which is, typically, about 50–70%.
33
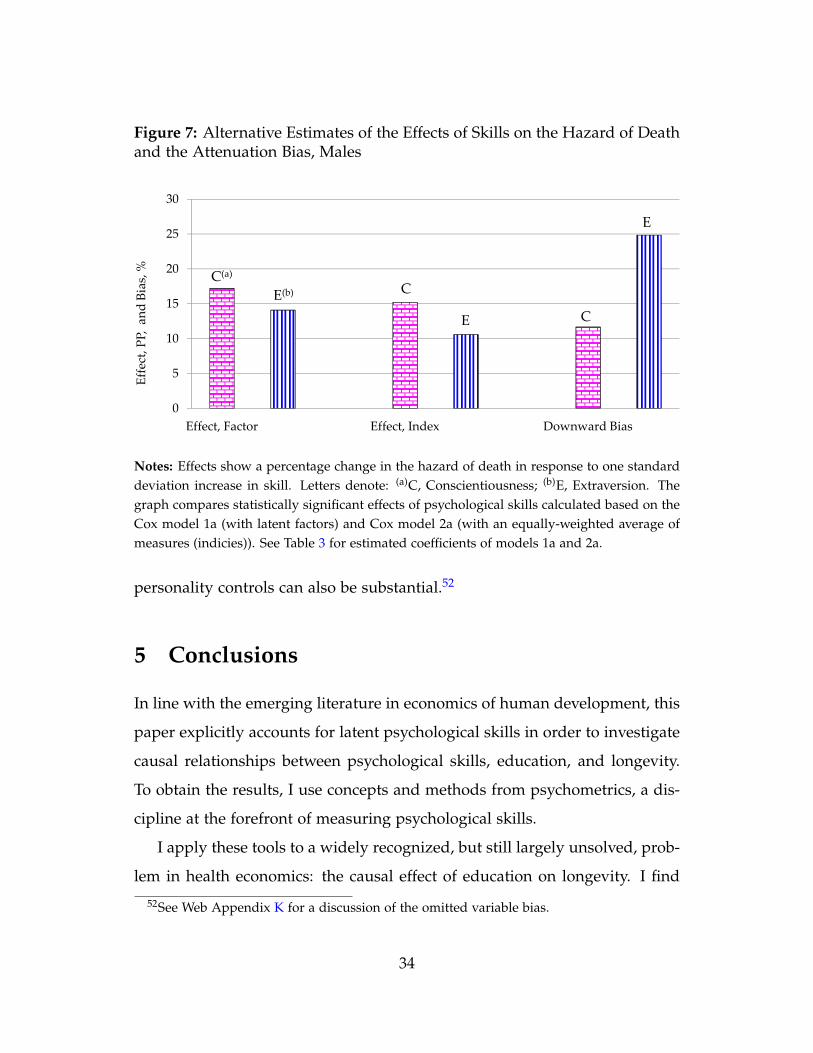
Figure 7: Alternative Estimates of the Effects of Skills on the Hazard of Deathand the Attenuation Bias, Males
0
5
10
15
20
25
30
Effect, Factor Effect, Index Downward Bias
Eff
ect,
PP,
a
nd
Bia
s, % C(a)
E(b) C
E C
E
Notes: Effects show a percentage change in the hazard of death in response to one standarddeviation increase in skill. Letters denote: (a)C, Conscientiousness; (b)E, Extraversion. Thegraph compares statistically significant effects of psychological skills calculated based on theCox model 1a (with latent factors) and Cox model 2a (with an equally-weighted average ofmeasures (indicies)). See Table 3 for estimated coefficients of models 1a and 2a.
personality controls can also be substantial.52
5 Conclusions
In line with the emerging literature in economics of human development, this
paper explicitly accounts for latent psychological skills in order to investigate
causal relationships between psychological skills, education, and longevity.
To obtain the results, I use concepts and methods from psychometrics, a dis-
cipline at the forefront of measuring psychological skills.
I apply these tools to a widely recognized, but still largely unsolved, prob-
lem in health economics: the causal effect of education on longevity. I find
52See Web Appendix K for a discussion of the omitted variable bias.
34

a strong causal effect for males but not for females. Additionally, I find di-
rect effects of Conscientiousness, Extraversion, and IQ on longevity of males,
while for females I find an effect only for IQ. In addition, Conscientiousness
in males interacts with a Doctorate degree in affecting longevity.
The causal effect of education on health and longevity has standard impli-
cations for positive education subsidies in cases where education investments
are at sub-optimal levels. The effects of Conscientiousness and Extraversion,
however, suggest a new dimension for public policy: encouraging the de-
velopment of children’s Conscientiousness and Extraversion at home and at
school would contribute to both health and longevity. Additionally, Con-
scientiousness boosts schooling. Thus, the question of the malleability of
Conscientiousness and Extraversion deserves increased research efforts.
References
Albouy, V. and L. Lequien (2009). Does compulsory education lower mortal-ity? Journal of Health Economics 28, 155–168.
Almlund, M., A. Duckworth, J. J. Heckman, and T. Kautz (2011). Personalitypsychology and economics. In E. A. Hanushek, S. Machin, and L. Woßmann(Eds.), Handbook of the Economics of Education, Volume 4, pp. 1–181. Amster-dam: Elsevier.
Almlund, M., A. L. Duckworth, J. Heckman, and T. Kautz (2010). Person-ality psychology and economics. Unpublished manuscript, University ofChicago, Department of Economics.
Anderson, T. W. and H. Rubin (1956). Statistical inference in factor analysis. InJ. Neyman (Ed.), Proceedings of the Third Berkeley Symposium on MathematicalStatistics and Probability, 5, pp. 111–150. Berkeley: University of CaliforniaPress.
Arias, E. (2012, September). United States life tables, 2008. National VitalStatistics Reports 61(3).
35
Ashenfelter, O. and A. B. Krueger (1994, December). Estimates of the eco-nomic returns to schooling from a new sample of twins. American EconomicReview 84(5), 1157–1173.
Asparouhov, T., K. Masyn, and B. Muthen (2006). Proceedings of the JointStatistical Meeting in Seattle, August 2006. In ASA Section on Biometrics, pp.180–187.
Auld, M. C. and N. Sidhu (2005, October). Schooling, cognitive ability andhealth. Health Economics 14(10), 1019–1034.
Becker, G. S. (2007, July). Health as human capital: synthesis and extensions.Oxford Economic Papers 59(3), 379–410.
Becker, G. S. and C. B. Mulligan (1997, August). The endogenous determina-tion of time preference. Quarterly Journal of Economics 112(3), 729–758.
Borghans, L., A. L. Duckworth, J. J. Heckman, and B. ter Weel (2008, Fall).The economics and psychology of personality traits. Journal of Human Re-sources 43(4), 972–1059.
Buckles, K., A. Hagemann, O. Malamud, M. S. Morrill, and A. K. Wozniak(2013, July). The effect of college education on health. NBER WorkingPaper NO. 19222.
Cameron, A. C. and P. K. Trivedi (2005). Microeconometrics: Methods and Ap-plications. New York: Cambridge University Press.
Carneiro, P., J. J. Heckman, and E. J. Vytlacil (2011, September). Estimatingmarginal returns to education. American Economic Review 101(6), 2754–2781.
Clark, D. and H. Royer (2013). The effect of education on adult mortality andhealth: Evidence from Britain. American Economic Review 103(6), 2087–2120.
Conti, G. and J. J. Heckman (2010). Understanding the early origins of theeducation-health gradient: A framework that can also be applied to ana-lyze gene-environment interactions. Perspectives on Psychological Science 5(5),585–605.
Conti, G. and J. J. Heckman (2014). Understanding conscientiousness acrossthe life course: An economic perspective. Developmental Psychology 50(5),1451–9.
Conti, G., J. J. Heckman, and S. Urzua (2010, May). The education-healthgradient. American Economic Review: Papers and Proceedings 100(2), 1–5.
36

Conti, G., J. J. Heckman, and S. Urzua (2011). Early endowments, education,and health. Unpublished manuscript, University of Chicago, Departmentof Economics.
Cox, D. R. (1972). Regression models and life-tables. Journal of the RoyalStatistical Society 34, 187–220.
Currie, J. and E. Moretti (2003, November). Mother’s education and the inter-generational transmission of human capital: Evidence from college open-ings. Quarterly Journal of Economics 118(4), 1495–1532.
de Walque, D. (2007). Does education affect smoking behaviors?: Evidenceusing the Vietnam draft as an instrument for college education. Journal ofHealth Economics 26(5), 877 – 895.
Deaton, A. S. (2009, January). Instruments of development: Randomizationin the tropics, and the search for the elusive keys to economic development.Working Paper 14690, National Bureau of Economic Research.
Friedman, H. S., M. L. Kern, and C. A. Reynolds (2010). Personality andhealth, subjective well-being, and longevity. Journal of Personality 78(1), 179–216.
Friedman, H. S., J. S. Tucker, J. E. Schwartz, L. R. Martin, C. Tomlinson-Keasey,D. L. Wingard, and M. H. Criqui (1995). Childhood conscientiousness andlongevity: Health behaviors and cause of death. Journal of Personality andSocial Psychology 68(4), 696–703.
Friedman, H. S., J. S. Tucker, C. Tomlinson-Keasey, J. E. Schwartz, D. L.Wingard, and M. H. Criqui (1993). Does childhood personality predictlongevity? Journal of Personality and Social Psychology 65(1), 176–185.
Fuchs, V. R. (1982). Time preference and health: An exploratory study. In V. R.Fuchs (Ed.), Economic Aspects of Health, pp. 93–120. Chicago, IL: Universityof Chicago Press.
Fuchs, V. R. (1997). The Future of Health Policy. Harvard University Press.
Galama, T. and H. van Kippersluis (2013). Joint investment in educationand health: A unified theory of human capital formation. Unpublishedmanuscript, USC Dornsife Center for Economic and Social Research.
Grimard, F. and D. Parent (2007, September). Education and smoking: WereVietnam war draft avoiders also more likely to avoid smoking? Journal ofHealth Economics 26(5), 896–926.
37

Grossman, M. (1972, March-April). On the concept of health capital and thedemand for health. Journal of Political Economy 80(2), 223–255.
Grossman, M. (2000). The human capital model. In A. J. Culyer and J. P. New-house (Eds.), Handbook of Health Economics, Volume 1, pp. 347–408. Amster-dam: Elsevier.
Heckman, J. J., J. E. Humphries, S. Urzua, and G. Veramendi (2014). Educa-tion, health, and wages. NBER Working Paper.
Heckman, J. J., S. H. Moon, R. Pinto, P. A. Savelyev, and A. Q. Yavitz (2010,August). Analyzing social experiments as implemented: A reexaminationof the evidence from the HighScope Perry Preschool Program. QuantitativeEconomics 1(1), 1–46.
Heckman, J. J., R. Pinto, and P. A. Savelyev (2013). Understanding the mecha-nisms through which an influential early childhood program boosted adultoutcomes. American Economic Review 103(6), 1–35.
Heckman, J. J. and B. S. Singer (1984, March). A method for minimizing theimpact of distributional assumptions in econometric models for durationdata. Econometrica 52(2), 271–320.
Heckman, J. J., J. Stixrud, and S. Urzua (2006, July). The effects of cognitiveand noncognitive abilities on labor market outcomes and social behavior.Journal of Labor Economics 24(3), 411–482.
Heckman, J. J. and E. J. Vytlacil (2005, May). Structural equations, treatmenteffects and econometric policy evaluation. Econometrica 73(3), 669–738.
Heckman, J. J. and E. J. Vytlacil (2007a). Econometric evaluation of socialprograms, part I: Causal models, structural models and econometric policyevaluation. In J. Heckman and E. Leamer (Eds.), Handbook of Econometrics,Volume 6B, pp. 4779–4874. Amsterdam: Elsevier.
Heckman, J. J. and E. J. Vytlacil (2007b). Econometric evaluation of socialprograms, part II: Using the marginal treatment effect to organize alterna-tive economic estimators to evaluate social programs and to forecast theireffects in new environments. In J. Heckman and E. Leamer (Eds.), Hand-book of Econometrics, Volume 6B, Chapter 71, pp. 4875–5143. Amsterdam:Elsevier.
Hong, K., P. Savelyev, and K. Tan (2014). Understanding the mechanismslinking personality and education with longevity. Unpublished manuscript,Vanderbilt University, Department of Economics.
38
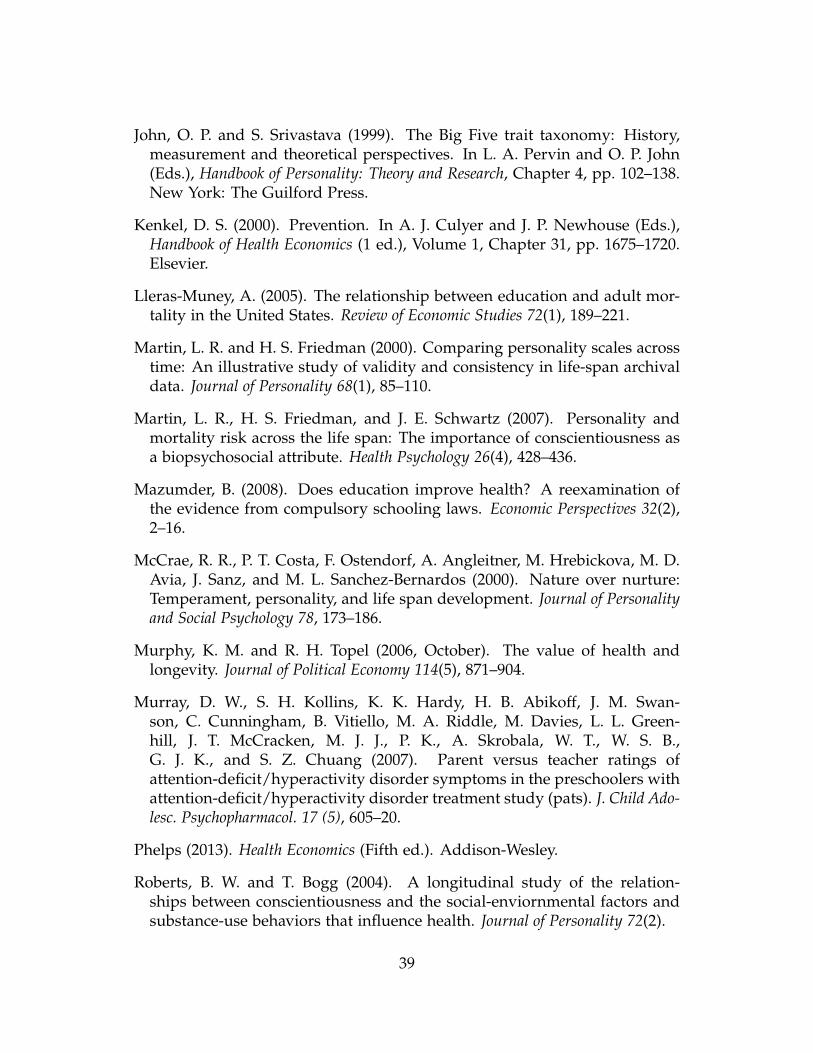
John, O. P. and S. Srivastava (1999). The Big Five trait taxonomy: History,measurement and theoretical perspectives. In L. A. Pervin and O. P. John(Eds.), Handbook of Personality: Theory and Research, Chapter 4, pp. 102–138.New York: The Guilford Press.
Kenkel, D. S. (2000). Prevention. In A. J. Culyer and J. P. Newhouse (Eds.),Handbook of Health Economics (1 ed.), Volume 1, Chapter 31, pp. 1675–1720.Elsevier.
Lleras-Muney, A. (2005). The relationship between education and adult mor-tality in the United States. Review of Economic Studies 72(1), 189–221.
Martin, L. R. and H. S. Friedman (2000). Comparing personality scales acrosstime: An illustrative study of validity and consistency in life-span archivaldata. Journal of Personality 68(1), 85–110.
Martin, L. R., H. S. Friedman, and J. E. Schwartz (2007). Personality andmortality risk across the life span: The importance of conscientiousness asa biopsychosocial attribute. Health Psychology 26(4), 428–436.
Mazumder, B. (2008). Does education improve health? A reexamination ofthe evidence from compulsory schooling laws. Economic Perspectives 32(2),2–16.
McCrae, R. R., P. T. Costa, F. Ostendorf, A. Angleitner, M. Hrebickova, M. D.Avia, J. Sanz, and M. L. Sanchez-Bernardos (2000). Nature over nurture:Temperament, personality, and life span development. Journal of Personalityand Social Psychology 78, 173–186.
Murphy, K. M. and R. H. Topel (2006, October). The value of health andlongevity. Journal of Political Economy 114(5), 871–904.
Murray, D. W., S. H. Kollins, K. K. Hardy, H. B. Abikoff, J. M. Swan-son, C. Cunningham, B. Vitiello, M. A. Riddle, M. Davies, L. L. Green-hill, J. T. McCracken, M. J. J., P. K., A. Skrobala, W. T., W. S. B.,G. J. K., and S. Z. Chuang (2007). Parent versus teacher ratings ofattention-deficit/hyperactivity disorder symptoms in the preschoolers withattention-deficit/hyperactivity disorder treatment study (pats). J. Child Ado-lesc. Psychopharmacol. 17 (5), 605–20.
Phelps (2013). Health Economics (Fifth ed.). Addison-Wesley.
Roberts, B. W. and T. Bogg (2004). A longitudinal study of the relation-ships between conscientiousness and the social-enviornmental factors andsubstance-use behaviors that influence health. Journal of Personality 72(2).
39
Savelyev, P. and K. Tan (2014). Personality, education and health-related out-comes of high-ability individuals. Unpublished manuscript, VanderbiltUniversity, Department of Economics.
Sears, R. R. (1984). Handbook of Longitudinal Research, Volume 1, Chapter “TheTerman gifted children study”, pp. 398–414. New York: Praeger.
Stock, J. H., J. H. Wright, and M. Yogo (2002, October). A survey of weakinstruments and weak identification in generalized method of moments.Journal of Business & Economic Statistics 20(4).
Terman, L. M. (1986). Terman Life-Cycle Study of Children with High Abil-ity by Terman L. M. et al., 1922-1986 [computer file]. 2nd ICPSR release.Palo Alto, CA: Robert R. Sears [producer], 1986. Ann Arbor, MI: Inter-university Consortium for Political and Social Research [distributor], 1989.doi:10.3886/ICPSR08092.
Terman, L. M., B. T. Baldwin, E. Bronson, J. C. DeVoss, F. Fuller, T. Lee Kel-ley, M. Lima, H. Marshall, A. H. Moore, A. S. Raubenheimer, G. M. Ruch,R. L. Willoughby, J. Benson Wyman, and D. Hazeltine Yates (1925). GeneticStudies of Genius: Mental and Physical Traits of a Thousand Gifted Children,Volume 1. Stanford University, CA: Stanford University Press.
Terry, L. and co-authors (1964). Smoking and health: Report of the advi-sory committee to the surgeon general of the United States. Public HealthService publication No. 1103. Technical report, Department of Health, Ed-ucation, and Welfare.
Van Den Berg, G., L. Janys, and K. Christensen (2012). The causal effect ofeducation on mortality.
van Kippersluis, H., O. O’Donnell, and E. van Doorslaer (2011). Long-runreturns to education: Does schooling lead to an extended old age? TheJournal of Human Resources 46, 695–721.
Viscusi, W. K. (2013, October). Estimating the value of a statistical life usingcensus of fatal occupational injuries (CFOI) data. Monthly Labor Review,1–17.
Williams, B. (2011, January). Notes on identification of factor models. Un-published manuscript, University of Chicago, Department of Economics.
Williams, R. (2006). Generalized ordered logit/partial proportional oddsmodels for ordinal dependent variables. The Stata Journal 6(1), 58–82.
40