Embed Size (px)
Citation preview


CITIES ALLIANCE – PSWM PROJECT Mid-Term Evaluation – Final Report
Divalon Enterprises Limited ii June 4th 2020
Acronyms and Abbreviations:
CA
CBEs
CDS
CMTs
DFID
EU
EMUS
EPA
FGDs
GM
GoL
IMPAC
KII
LCP
LGA
LOP
LRTF
M&E
MCC
MDC
MIS
NACOBE
NAP
NDC
PCC
PPS
PSWM
SDG
SMEs
SOW
SSWM
SWM
TOR
WASH
UK
UN
UNFCCC
UNOPS
- Cities Alliance
- Community Based Enterprises
- City Development Strategy
- Community Management Teams
- Department for International Development
- European Union
- Emergency Monrovia Urban Sanitation (EMUS) Project
- Environmental Protection Agency
- Focus Group Discussions
- Greater Monrovia
- Government of Liberia
- Improved Primary Waste Collection in Poor Communities Project
- Key Informant Interviews
- Liberia Country Programme
- Local Government Authorities
- Life of Project
- Liberia Reconstruction Trust Fund
- Monitoring and Evaluation
- Monrovia City Corporation
- Mobile Data Collection
- Management Information System
- National Association of Community Based Enterprises
- National Adaptation Planning
- Nationally Determined Contribution
- Paynesville City Corporation
- Probability Proportionate to Size
- Primary Solid Waste Management
- Sustainable Development Goals
- Small and Medium Enterprises
- Scope of Work
- Secondary Solid Waste Management
- Solid Waste Management
- Terms of Reference
- Water Sanitation and Hygiene
- United Kingdom
- United Nations
- UN Framework Convention on Climate Change
- United Nations Office of Project Services

CITIES ALLIANCE – PSWM PROJECT Mid-Term Evaluation – Final Report
Divalon Enterprises Limited iii June 4th 2020
Table of Content:
Acronyms and Abbreviations: ............................................................................................................ ii
Table of Content: ............................................................................................................................. iii
List of Tables: .................................................................................................................................... vi
List of Figures: .................................................................................................................................. vii
Acknowledgement: ......................................................................................................................... viii
Executive Summary: .......................................................................................................................... ix
CHAPTER I: INTRODUCTION AND BACKGROUND ........................................................................ 1
1.1 Introduction and Background ................................................................................................. 1
1.2 Cities Alliance’s Programming ................................................................................................ 2
1.2.1 About Cities Alliance Country Programmes ........................................................................... 2
1.2.2 About the Liberia Country Programme ................................................................................. 2
1.2.3 About the PSWM Project ...................................................................................................... 3
1.3 Objectives of the EU Primary Solid Waste Project .................................................................. 4
1.4 Project Implementation Approach: ........................................................................................ 4
1.5 Purpose of Mid-Term Evaluation ........................................................................................... 5
1.6 Scope of the Evaluation: ........................................................................................................ 5
1.7 Evaluation Questions ............................................................................................................. 6
CHAPTER II: EVALUATION METHODOLOGY ................................................................................. 7
2.1 Evaluation Design ................................................................................................................. 7
2.2 Sample size estimation and selection of participants ............................................................... 7
2.2.1 Sample Size for households ................................................................................................... 7
2.2.2 Sample Size for CBEs ............................................................................................................. 7
2.3 Selection of Study Participants ............................................................................................... 8
2.3.1 Selection of Households: ....................................................................................................... 8
2.3.2 Selection of CBEs and Other Project Stakeholders .................................................................. 9
2.4 Data Collection Methods and procedures .............................................................................. 9
2.4.1 Quantitative data .................................................................................................................. 9
2.4.2 Qualitative data .................................................................................................................... 9
2.4.3 Digital Data collection for Quantitative Data ......................................................................... 9
2.5 Field Data Collection Procedure ............................................................................................ 9
2.6 Training and field Presetting of data collection Tools ............................................................ 10
2.7 Data Management, Systematization and Analysis .................................................................. 10

CITIES ALLIANCE – PSWM PROJECT Mid-Term Evaluation – Final Report
Divalon Enterprises Limited iv June 4th 2020
2.7.1 Data Editing, Systematization and cleaning ........................................................................... 10
2.7.2 Qualitative Data Analysis ..................................................................................................... 10
2.7.3 Quantitative Data Analysis ................................................................................................... 10
2.8 Report Writing...................................................................................................................... 11
2.8.1 Draft Report ......................................................................................................................... 11
2.8.2 Draft Report Review ............................................................................................................. 11
2.8.3 Final Report Compilation ...................................................................................................... 11
2.9 Validation and Dissemination Workshop ............................................................................... 11
2.10 Exit Meeting ......................................................................................................................... 11
2.11 Limitations to the Evaluation: ................................................................................................ 11
CHAPTER III: RESULTS AND FINDINGS .......................................................................................... 13
3.1 Introduction ........................................................................................................................ 13
3.2 The Solid Waste Sector in Greater Monrovia & Project’s Response to Sector Challenges ........ 13
3.2.1 Analysis of the SWM Sector in Greater Monrovia ................................................................. 13
3.2.2 Project’s Response to Sector challenges in Greater Monrovia ................................................ 15
3.2.3 Waste Sector Challenges that need to be addressed .............................................................. 16
3.2.4 Delivering Climate Smart Solid Waste services through the CBE Model ................................. 16
3.2.5 Environment within which the Project is implemented ......................................................... 17
3.2.5.1 Current Economic Situation in Liberia ................................................................................... 17
3.2.5.2 Emergence of Private Individual Waste Collectors (Zogos) .................................................... 17
3.2.6 Lessons Learned implementing this Model ............................................................................ 18
3.2.7 Limitations with the Model: ................................................................................................. 19
3.3 Progress towards attainment of Project Objectives: .............................................................. 19
3.4 Results from the Quantitative and Qualitative Surveys .......................................................... 21
3.4.1 Introduction ........................................................................................................................ 21
3.4.2 Socio-demographic Characteristics of Participants ................................................................ 22
3.4.3 Coverage of CBE Services .................................................................................................... 23
3.4.4 CBE Operations .................................................................................................................. 25
3.4.5 Tools, Equipment and Transport Facilities used by CBEs ...................................................... 27
3.4.6 CBEs Working Conditions ................................................................................................... 29
3.4.7 Waste Collection, Disposal and Management Practices ........................................................ 32
3.4.8 Frequency of Waste Collection and Satisfaction with Waste Collection Services ................... 36
3.4.9 Waste Sorting and Separation by CBEs and Households ....................................................... 38

CITIES ALLIANCE – PSWM PROJECT Mid-Term Evaluation – Final Report
Divalon Enterprises Limited v June 4th 2020
3.4.10 Recycling and Compositing of Waste .................................................................................. 39
3.4.11 Sensitization and Awareness about Solid Waste Management ............................................... 41
3.4.12 Capacity Building for CBEs .................................................................................................. 42
3.4.13 Community Inclusiveness in SWM Planning ......................................................................... 43
3.4.14 Problems affecting CBE Operations ..................................................................................... 43
3.4.15 Visibility of Cities Alliance ................................................................................................... 44
3.5 Conclusions from the Evaluation Questions ......................................................................... 45
3.5.1 Relevance ........................................................................................................................... 45
3.5.2 Effectiveness:....................................................................................................................... 46
3.5.3 Efficiency ............................................................................................................................ 48
3.5.4 Impact ................................................................................................................................ 48
3.5.5 Sustainability ....................................................................................................................... 49
3.5.6 Equity ................................................................................................................................. 50
CHAPTER IV: SUCCESSES, CHALLENGES & AREAS OF FOCUS ......................................................... 51
4.1 Introduction ........................................................................................................................ 51
4.2 Project Achievements and Successes ...................................................................................... 51
4.3 Challenges: ......................................................................................................................... 52
4.4 Key Areas of Focus for the final 2 Years: .............................................................................. 52
CHAPTER V: PROJECT MONITORING AND EVALUATION .......................................................... 53
5.1 Introduction ....................................................................................................................... 53
5.2 M&E Structure for the Project .............................................................................................. 53
5.3 M&E Areas that can be Strengthened ................................................................................... 54
5.4 Proposed Revisions in Project Indicators .............................................................................. 54
CHAPTER VI: CONCLUSION AND RECOMMENDATIONS ............................................................ 55
6.1 Introduction ....................................................................................................................... 55
6.2 Conclusion .......................................................................................................................... 55
6.3 Recommendations .............................................................................................................. 55
6.3.1 Government ....................................................................................................................... 55
6.3.2 Cities Alliance ..................................................................................................................... 56
6.3.3 City Authorities ................................................................................................................... 56
6.3.4 Community-Based Enterprises ............................................................................................. 57
Annex I: Progress against the Project Monitoring Framework .......................................................... 58

CITIES ALLIANCE – PSWM PROJECT Mid-Term Evaluation – Final Report
Divalon Enterprises Limited vi June 4th 2020
List of Tables:
Table 1: Evaluation Questions ........................................................................................................... 6
Table 2: Household Reached during the Sample by City and LGA .................................................... 8
Table 3: Number of other Project stakeholders and population groups Reached ................................ 8
Table 4: Qualitative Programme Stakeholders and data collection methods ....................................... 9
Table 5: Socio-demographic characteristics Respondents .................................................................. 22
Table 6: Additional Household Socio-demographic Characteristics ................................................... 23
Table 7: Coverage of CBE Services .................................................................................................. 23
Table 8: CBE Operations disaggregated by Duration of Operation ................................................... 25
Table 9: Representation of CBE Interests by NACOBE ..................................................................... 30
Table 10: Working Conditions of CBEs ............................................................................................. 31
Table 11: Household Access to Public and Private Waste Collection Services ..................................... 32
Table 12: Household Waste Disposal Practices by Households ......................................................... 33
Table 13: Waste Disposal Practices among Households .................................................................... 34
Table 14: Frequency of Waste Collection and Satisfaction with Waste Collection Services ................. 36
Table 15: Waste Sorting and Separation Practices among CBEs ......................................................... 38
Table 16: Waste Sorting and Separation Practices among Households .............................................. 38
Table 17: Knowledge about the 4R Strategy of Waste Minimization ................................................ 40
Table 18: Availability of Waste Minimization Campaigns on the 4Rs – CBE Survey .......................... 40
Table 19: Awareness and Sensitization of Households on Good SWM Practices ................................ 42
Table 20: Capacity Building activities for CBEs ................................................................................ 42
Table 21: Inclusiveness of CBEs and Communities development or selection of new SWM Policies ... 43
Table 22: Visibility of Cities Alliance among CBEs ............................................................................ 44
Table 23: Visibility of Cities Alliance at Community Level ................................................................ 44
Table 24: Proposed Revisions in Project Indicators .......................................................................... 54
CITIES ALLIANCE – PSWM PROJECT Mid-Term Evaluation – Final Report
Divalon Enterprises Limited vii June 4th 2020
List of Figures:
Figure 1: Estimated Number of Households Reached with CBE Services Per LGA .............................. 24
Figure 2: Major Problems encountered in expanding the Size of the CBE ......................................... 29
Figure 3: Waste Disposal Methods for Households with no access to Public or Private Services ........ 33
Figure 4: Disposal of Waste by CBEs after Collection ....................................................................... 35
Figure 5: Reasons for Household Dissatisfaction with Waste Collection Services ............................... 37
Figure 6: Recycling and Compositing Practice by CBEs ..................................................................... 39
Figure 7: Problems affecting CBE Operations ................................................................................... 43
CITIES ALLIANCE – PSWM PROJECT Mid-Term Evaluation – Final Report
Divalon Enterprises Limited viii June 4th 2020
Acknowledgement:
The Mid-Term Evaluation process was participatory and consultative in nature, covering a wide range
of stakeholders at national and sub-national levels. The consultations covered Cities Alliance’s Liberia
Country Office Staff, Government Ministries, Agencies and Departments, Partners, Local
Governments, National Association of Community Based Enterprises (NACOBE), Community Based
Enterprises (CBEs) and Community members among others.
Divalon Enterprises Limited would like to express its appreciation to all key stakeholders who
participated in the Mid-Term Evaluation. Because of your honest and objective feedback, we were
able to put together this Report. We acknowledge the following Staff from Cities Alliance for their
generous support towards this Evaluation: Senjovu Andrew, Francisco Juarez Lopez, Yondeh Moore
and Alice Rowley.
Divalon Enterprises Limited acknowledges input from; the Ministry of Internal Affairs (MIA), the
Environmental Protection Agency (EPA), the WASH Commission, City Corporations of Monrovia and
Paynesville, Township Commissioners from West Point, Caldwell, Congo Town, Barnesville and the
Borough of New Kru Town. Our sincere appreciation to Partners from the CLUS Project, NACOBE,
CBEs and the Communities across the 12 LGAs were the Evaluation was conducted.
Our Sincere appreciation to the European Union which generously supported this Evaluation, with
funding. Special thanks go to the task Manager Mr. Senjovu Andrew for his steadfast leadership and
coordination of the Evaluation. Despite his very busy schedule, he provided the necessary support
whenever he was approached. Divalon Enterprises Limited applauds and acknowledges the
contribution of the Enumeration team, who braved several challenges including the Coronavirus crisis,
to collect data from the different respondent categories, thank you!

CITIES ALLIANCE – PSWM PROJECT Mid-Term Evaluation – Final Report
Divalon Enterprises Limited ix June 4th 2020
Executive Summary:
Introduction:
This Report presents findings from the Mid-term Evaluation of Cities Alliance’s European Union (EU)
funded Project “Delivering Climate-Resilient Solid Waste Management Services in Greater Monrovia
(GM), Liberia through Community-Based Enterprises”. This is a 4-year Project (2018-2021) that aims
to; improve access to sanitation through more sustainable and efficient solid waste collection, reduce
greenhouse gas emission through improving extracting, sorting and re-use of solid waste, improve
awareness of Climate Change and climate-resilient Solid Waste Management (SWM) with a focus on
youth, and Improving and integrating plans and capacity to manage and fund SWM for GM.
The purpose of the Evaluation was to provide a strategic review of the performance of the Project,
assess results achieved, lessons learnt and the extent to which the Project is delivering on its objectives.
The Evaluation adopted a cross-sectional descriptive design, utilizing mixed methods approach i.e.
qualitative and quantitative. Data collection took place in March 2020. Quantitatively, target
respondents were heads of households or their spouse, and CBEs proprietors. Households were
systematically selected at Block level, from the 12 LGAs of the Country Programme. Qualitatively, the
Evaluation targeted stakeholders such MIA, EPA, Wash Commission, City Corporations, Township
Commissioners, NACOBE and Community members among others.
Results from the Mid-Term Evaluation:
The Solid Waste Sector in Greater Monrovia
Solid Waste disposal has become an overwhelming task for municipal authorities, who face severe
constraints in tackling the mounting waste situation. Within Greater Monrovia, Solid Waste
Management is vested within city corporations, however the Government of Liberia (GoL) has
established agencies such EPA and the WASH Commission to enhance Solid Waste Management
efforts. However, mandates for these agencies seem to cross cut resulting into duplication of activities
and resources in terms of monitoring, supervision, regulation and enforcement.
Currently, municipal authorities are largely using land filling to solve the solid waste problem. Liberia
lacks capacity to adequately utilize other options such as recycling or energy recovery. This option,
however, is down the waste hierarchy which prioritizes environmental friendliness with waste
prevention at the top, followed by minimization, reuse, recycling, energy recovery, and disposal.
Despite efforts by GoL and City Governments in enhancing SWM, challenges remain. Inadequate sites
for landfill disposal is a major challenge. Due to inadequate sites for waste disposal, wetlands and
rivers streams are being used to dump waste. Poor public attitude towards waste disposal, coupled
with the non-enforcement of existing laws on waste disposal affects efforts towards improving Solid
Waste Management. Skip buckets are not regularly emptied due to lack of fuel for waste collection
trucks and frequent breakdown of machinery, while the lack of up to-date data also presents
challenges to municipal authorities in planning and organization of waste management.
CITIES ALLIANCE – PSWM PROJECT Mid-Term Evaluation – Final Report
Divalon Enterprises Limited x June 4th 2020
Project’s Response to Sector challenges in Greater Monrovia
The Project is enhancing access to sanitation through more sustainable and efficient Solid Waste
collection. Working closely with City Corporations, Cities Alliance has revamped and built on
successes of the CBE model following closure of the EMUS Project. The Project has provided tools and
equipment to CBEs, built their capacity in SWM, Financial and Record Management among others. In
the next phase of implementation, the Project intends to provide Loan and Grant facilities to enable
CBEs address challenges around inadequate tools and equipment.
The Loans and Grants will further enable CBEs to generate value added services such as sorting,
compositing and recycling to improve livelihoods and reduce the quantity of recyclable waste
dumped at landfills. The Project established a Solid Waste Technical Working Group (TWG) to
strengthen coordination of sector players and conducted feasibility studies to understand the viability
of recycling and compositing interventions in Liberia.
The Project is further enhancing awareness of Climate Change and climate Resilient SWM through
developing and implementing School and Community awareness campaigns that promote climate
change awareness and promote 4R awareness. The Project supports the development of an Integrated
SWM system as a guiding framework for city corporations in the implementation of SWM services,
development of a costed Solid Waste strategy for the Greater Monrovia and is building capacity of
local leaders to create awareness & sensitize communities on proper SWM.
Waste Sector Challenges that need to be addressed
Despite the Project’s efforts and commitment to support Greater Monrovia in addressing the
mounting waste sector challenges, a number of gaps that impact delivery of project outcomes remain.
These include;
▪ Inability to regularly and frequently empty Skip buckets by municipal authorities.
▪ Lack of a National Solid Waste Management Policy.
▪ Lack of enforcement of existing laws and ordinances on waste management at Municipal level.
▪ Limited availability and use of data in Solid Waste Management and Planning.
▪ Inadequate funding for agencies responsible for waste management
▪ Inadequate Land space: Land is scarce and finding suitable sites for waste disposal is an
overwhelming task. This has affected interventions around constructing sorting, compositing and
recycling stations.
Environment within which the Project is Implemented:
▪ Current Economic Situation in Liberia
The administration of President George M. Weah clocked two years in January 2020. He inherited an
economy badly hit by a slump in global prices of rubber and iron ore - Liberia's key export
commodities. The Ebola crisis exacerbated the economic stagnation in the Country.

CITIES ALLIANCE – PSWM PROJECT Mid-Term Evaluation – Final Report
Divalon Enterprises Limited xi June 4th 2020
Two years into office, the country’s economy has been challenged with rising inflation as a result of
significant depreciation of the Liberian dollar against the United States dollar. Inflation reached 31.3%
by August 2019, up from 26.1% the previous year. The economy has fallen further into the repressed
category since 2019, while GDP growth has recorded a weak performance over the last couple of
years. This has hampered Government’s ability to fully deliver services and meet other obligations,
with 80% of the population said to live on less than $1.25 a day.
As the economy worsened with civil servants reporting months-long delays to salary payments,
thousands of people took to the streets in protest. The domestic macroeconomic environment has
been challenging, characterized by low economic growth which has hampered Government’s ability
to fully deliver services and meet other obligations. The business environment also remains difficult,
affecting people’s earnings.
▪ Emergence of Private Individual Waste Collectors (Zogos)
The CBE Model faces competition from Private individuals (Zogos) and illegal waste collectors. MCC
piloted a 3-4 months Project where Zogos were recruited by the city corporation to engage in waste
collection, particularly street cleaning. While the mandate of the Zogos was initially limited to street
cleaning, many have now penetrated primary waste collection, duplicating CBE activities. According
to NACOBE, more than half of the CBEs nearly closed operations due to a decline in clientele, which
led to a drop-in revenue collection, making it hard for CBEs to sustain their operations.
Zogos go into households to collect garbage and get paid from households mandated towards CBEs,
thus taking away their business. They are paid between LRD 10-15 every time they pick waste. Because
they are cheaper, the majority of the households have now resorted to their services. However, the
Zogos are neither registered nor regulated, and their operations not monitored and supervised.
According to NACOBE and Township Commissioners, they lack basic training in SWM and dump
garbage in open space, streets corners, highways and in residents’ compounds in the night.
Analysis shows that the Zogos have not increased access to primary waste collection services but
rather created a transfer or shift of clients from CBEs to Zogos. Households previously subscribed to
CBEs have shifted allegiance to Zogos. These individuals lack basic waste collection tools, equipment
and protective gear to ensure safety during waste collection. They carry garbage on their heads and
when the weight becomes unbearable, they dump anywhere.
Progress towards attainment of Project Objectives:
Outcome: Greater Monrovia is serviced by a citywide Integrated SWM system that reduces
greenhouse gas emission and enhances the city’s resilience against climate change and disease.
The Project has contributed to an increase in the proportion of households with planned forms of
garbage disposal in Greater Monrovia. The percentage increased from 36% at baseline to 83% at
mid-term, surpassing the 45% Life of Project (LOP) target, attributed to the awareness creation
campaigns on waste collection and disposal. The Project’s contribution towards reducing the quantity
CITIES ALLIANCE – PSWM PROJECT Mid-Term Evaluation – Final Report
Divalon Enterprises Limited xii June 4th 2020
of recyclable waste going to the landfill remains low. The percentage (33%) remains unchanged from
the baseline, majorly due to activities supporting this outcome lagging behind schedule.
Intermediate Outcomes 1: Improved access to sanitation through more sustainable and efficient
solid waste collection in Greater Monrovia
Overall, attainment of results under this intermediate outcome is relatively low at the mid-term.
Critical activities for the outcome lag behind schedule, CBEs face stiff competition from Zogos, while
the inefficiencies within the public system have not helped address issues of access. Delays in signing
an MOU with ECO Bank to manage the Loan and Grant facility has affected provision of loan and
grant support to CBEs, yet this critical in attainment of results under component 1. The process took 6-
8 months.
The percentage of households receiving PSW collection services in Greater Monrovia increased from
36% at Baseline to 37% at Mid-Term. The progress is low compared to the Life of Project (LOP)
target of 45%. The Evaluation observes that performance of the indicator is lower, compared to what
is reported in the 2019 Comic Relief Mid-term Evaluation at 52%. The drop in the indicator is
attributed to the following:
i. From the qualitative Interviews, the Evaluation found that households were using the waste
generated to reclaim land. Owing to the imminent rainy season, communities are distressed of their
homes being washed away, consequently resorting to using the garbage generated to reclaim land.
This is aimed at lengthening the distance of the houses from the wetlands and river stream, and in
some instances creating more space for settlement. This implies that even where access to waste
collection services is increased, household use of the services is affected by other considerations,
such as using waste to reclaim land.
ii. Reduction in levels of trust by citizens in waste collection service providers. City Corporations have
been ineffective in emptying skip buckets, CBEs are unreliable, while the Zogo approach was
suspended shortly after it had started. This has compelled citizens to devise other waste disposal
methods such as dumping in wetland and rivers streams and burning waste.
iii. Low willingness by households to pay for waste collection services - 42% of the Households were
found to have refused to pay for the service in the past 6 months preceding the Evaluation, while
half (50%) reported that the economic situation in the Country affected their ability to pay for
waste collection services. The unwillingness for households to pay for waste collection coupled
with the economic situation in the country has compelled them to resort to disposal methods that
do not involve costs such as open dumping, dumping in wetlands and river streams and burning.
Intermediate Outcome 2: Reduced greenhouse gas emission through improving extracting,
sorting and re-use of solid waste in Greater Monrovia
Overall, progress at the mid-term for this outcome is low. Owing to the interrelatedness and
interlinkage of Component 1&2, the low performance in Component 1 has affected attainment of

CITIES ALLIANCE – PSWM PROJECT Mid-Term Evaluation – Final Report
Divalon Enterprises Limited xiii June 4th 2020
results for this component. The Project envisaged that if Loan and Grant facilities are provided to
CBEs to engage in Composting and Recycling, this will reduce the amount of recyclable waste
dumped at landfills, eventually reducing green gas emission. Delays in functionalizing the Loan and
Grant facility has had a toll on the attainment of results for this intermediate outcome.
The proportion of solid waste sorted and recycled for re-use at collection remains unchanged from
the baseline (0%), with the LOP target of 5%. Only one percent (1%) of the households was found
to engage in waste sorting, while 16% of CBEs engaged in some kind of sorting although on a small
scale. While knowledge on Recycling was found to be high among CBEs (91%), non is engaged in
Recycling activities due to lack of appropriate tools, equipment, technology and resources.
As with Intermediate Outcome 1, critical activities lag behind schedule while securing land for
construction of sorting and recycling stations remains another challenge.
Intermediate outcome 3: Improved awareness of Climate Change and climate resilient Solid
Waste Management in the Greater Monrovia Population with a focus on youth
Overall, attainment of this intermediate outcome is well on track. The proportion of households in
Greater Monrovia reached by awareness campaigns on SWM improved from 0% at baseline to 15%
at Mid-Term, surpassing the LOP Target of 10%. The substantial investments in awareness creation
around Climate-Smart SWM, urban health and environmental protection has led to corresponding
level of results with 87% of the households sensitized reporting to have found the sensitization
campaigns beneficial and have made changes in Solid Waste Management at household level as a
result.
Regarding outcome 4: Improved and integrated plans and capacity to manage and fund SWM
for Greater Monrovia
Overall, attainment of this intermediate outcome is within the control of the Project. The outcome
indicator is qualitative; “Integrated Solid Waste Management small initiatives/best practices have been
included at community level planning” Analysis from the Project Management Information System
(MIS), there is “No integrated solid waste management small initiatives/lessons learnt included at
community level planning”.
In order to address capacity issues, Cities Alliance has partnered with the Institute of Housing and
Development Studies (Erasmus University of Rotterdam) to conduct trainings locally in Liberia.
Training courses will be developed for Municipal SWM Officials and LGA staff, to be conducted by
the University and certificates awarded locally. Several Technical Committee meetings have been held
and SWM partnerships developed i.e. the partnership with HFHI. Focus should be on fast tracking the
development of the Solid Waste Strategy which is part of the City Development Strategy.

CITIES ALLIANCE – PSWM PROJECT Mid-Term Evaluation – Final Report
Divalon Enterprises Limited xiv June 4th 2020
Results from the Quantitative and Qualitative Surveys:
The Proportion of Households without access to PSW collection services (either Public or Private)1 in
Greater Monrovia was found to be 63%. These households mainly dispose of waste in wetlands and
river streams to reclaim land, and therefore need to be targeted.
All CBEs were found to be legally operational and registered, and the majority (89%) had permanent
offices for transacting business. Payments for staff employed by CBEs remains low, the average
monthly salary was found to be LRD 8,150 (USD 41). While labor laws in Liberia require a minimum
wage of USD 125 is paid to workers, CBEs cannot manage to pay this rate. Profitability of the CBE
business was found to be low. Within the past 12 Months, 71% of the CBEs report a decline in profits
registered, attributed to the economic situation in the Country, the failure of households to pay for
Waste Collections Services, and the reduction in the number of clients served due to Zogos. The
average monthly profits registered by CBEs is LRD 12,000 (USD 60).
The profits are higher among newly established CBEs compared to CBEs that have been in Business
longer. This is partly attributed to the trainings in Financial Management and Business Development.
Newly established CBEs were more likely to implement lessons learnt from the training compared to
CBEs that have been in business longer. Availability of transport means fully dedicated for Waste
Collection remains a big challenge for CBEs, with 47% of the CBEs not having vehicle or transport
means fully dedicated to Waste Collection and disposal.
The main transport means used by CBEs are Push Carts, Tri-cycles and Wheelbarrows. The cost of fuel
and repairs was found to limit the use of tricycles in waste collection. On average, a CBE has three (3)
Tricycles, four (4) Push Carts and five (5) Wheelbarrows, which is not sufficient for waste collection.
From the CBE Survey, 82% of the CBEs reported lack of adequate tools and equipment to effectively
conduct their operations. The major problems encountered in expanding the size of the CBE are; lack
of capital, inadequate access to finance and credit and, lack of appropriate tools and equipment. The
lack of adequate tools and equipment is further complicated by theft of the available tools.
The number of wheelbarrows of wastes collected from each household per week ranged from 1-4,
with an average of 3. The total number of wheelbarrows of waste collected by a CBE per day ranged
from 15-231, with an average of 101 wheelbarrows. From these wheelbarrows collected per day, <1%
(i.e. 0.7%) is sorted. CBEs were found to engage in open dumping (37%) when skips are full, while
others resort to forceful use of transfer stations (16%) and landfills (13%) since access is restricted. A
few (3%) opt to dump in the Water bodies and wetlands. From the Household Survey, 75% of the
households with waste collection services reported that waste collection was conducted three (3) or
less time from their homes in a week.
1 % of households with regular access to PSW collection” Measures the percentage of households that have
access to either PUBLIC or PRIVATE waste collection services. Private services included CBEs or private
individuals (Zogos), while public included Gov’t/City Authorities or household direct disposal to skips”

CITIES ALLIANCE – PSWM PROJECT Mid-Term Evaluation – Final Report
Divalon Enterprises Limited xv June 4th 2020
On satisfaction with Waste collection services, 45% of the households were satisfied with waste
collection services. Satisfaction was higher among households using private individuals (Zogos), at 47%
compared to those using CBEs, at 36%. Major reasons for dissatisfaction with Waste Collection Service
providers are improper waste collection raised by 64% of unsatisfied Households. This relates to
improper removal of wastes from the storage or disposal facilities, where part of the waste drops or
remains around the storage or disposal facility, leaving the place untidy. Other issues include high
waste collection costs charged by CBEs (49%), and the unreliability of CBEs.
The average amount incurred by household for waste collection was found to be LRD 130 per week,
while CBEs reported to charge an average of LRD 80 per week.
Separation and sorting of wastes remains a big challenge among CBEs & Households. Sensitization of
Households on waste separation is found to be moderate, 55% of the CBEs tell their clients to separate
wastes. From the household Survey, 99% of the households did not separate waste. Neither CBEs nor
households were found to engage in compositing or recycling activities. While the willingness for CBEs
to engage in Recycling and Compositing is high (87%), they lack appropriate tools, equipment and
resources to engage in these activities.
Regarding Cities Alliance visibility, all CBEs have heard about Cities Alliance, while only 50% fully
understand what the organization does. CBEs who have been in business longer were twice likely to
understand what Cities Alliance does compared to newly established CBEs. Twenty-two percent (22%)
of households have heard about Cities Alliance, while 13% fully understand what it does.
Conclusion Regarding the Evaluation Questions:
Relevance
There is unanimous acknowledgement from stakeholders that the Project provides an important and
significant contribution to the waste sector in Greater Monrovia, and is widely considered to be
connected to the 2030 agenda, NDC and the NAP. The Project’s contribution towards NDC and NAP
results at this stage is moderate, demonstrable results so far observed with the awareness and
sensitization on climate smart SWM. Efforts to reduce emissions from SWM services are affected by
delays in activities under component 1&2. The Project has built capacity of Local Government and
Private Sector players on SWM, EPA compliance mechanisms regarding Environmental Protection, 4R
and the benefits of proper waste disposal and the adverse effects of improper disposal of Waste on the
environment.
Effectiveness:
Overall, efforts need to be stepped-up to attain project objectives. Attainment of Intermediate
outcomes 1&2 requires rethinking and coming up with modalities that will address the implementation
bottlenecks highlighted. Efforts in attainment of Intermediate outcome 3 are commendable, the Project
is well on track towards attaining this result, while attainment of intermediate outcome 4 is within the
control of the project. While the Model is to a large extent effective, and can lead to attainment of
deliverables, its effectiveness is directly linked with designed interventions being implemented on

CITIES ALLIANCE – PSWM PROJECT Mid-Term Evaluation – Final Report
Divalon Enterprises Limited xvi June 4th 2020
schedule and according to plan, and is subject to risks beyond the control of the Programme, for
instance the Zogos and the deteriorating economic situation.
Several factors explain the low progress towards attainment of Project Results. The waste sector in
Greater Monrovia generally faces several mounting constraints that need to be addressed by the GoL
and municipal authorities. These affect implementation and attainment of results. The CBE Model faces
stiff competition from the Zogos, there is minimal recognition of CBEs by municipal authorities
(particularly MCC) as vital players within the waste sector. The current economic situation in the
Country has affected progress, while the resignation of the Solid Waste Specialist also created vacuum
in the technical team.
Despite the above challenges, several factors have facilitated attainment of successes so far registered.
The Project leverages the Country Programme which has established sustainable relationships with
GoL, City Governments, Local Governments and communities, adopts Community-led implementation
approach to ensure community inclusiveness, and has a strong Programme Steering Committee.
Strengthening the platform that brings together all players in the waste sector to deliberate on issues
that affect the sector has greatly contributed to the observed successes. The Project found an organized
CBE network, with an umbrella association, NACOBE. Because CBEs were already organized, this
enabled an easy entry to working with them. Enhanced communication and visibility by Cities Alliance
has been central in awareness and sensitization interventions.
In addition, the Project has a well-structured log frame that provides a streamlined linear interpretation
of the Project’s planned use of resources and its desired ends. It clearly highlights the logical linkages
between intended inputs, planned activities and expected results.
Efficiency
The Project has conducted training in financial management for NACOBE, partly aimed at ensuring
that resources advanced to CBEs are used optimally. The Project put in place robust financial
management and accountability systems to ensure that resources are being used economically during
Project implementation. The robustness has however created some delays and slowed down the pace
of activity implementation. Point in case, the process of bringing ECO Bank on board took 6-8 months
With all activities the Project implements, Cities Alliance goes through rigorous UNOPS procurement
processes to ensure competent contractors are hired at reasonable costs. Value for money clauses are
included in all Contractor contracts, prioritizing value for money. In construction Projects that will be
undertaken, all processes MUST conform to, and should be compliant with the UNOPS engineering
standards, which provide for high quality construction and value for money. In addition, the Project is
routinely audited to ensure compliance with controls instilled by Cities Alliance and EU.
Impact
The capacity building and training conducted for CBEs on Record Management has greatly improved
Records Management Practices. All CBEs were found to maintain records of business transactions, and
CITIES ALLIANCE – PSWM PROJECT Mid-Term Evaluation – Final Report
Divalon Enterprises Limited xvii June 4th 2020
records for 87% of the CBEs could be accessed. The Project has contributed to an increase in the
proportion of households with planned forms of garbage disposal in Greater Monrovia, attributed to
the awareness and sensitization campaigns.
Substantial investments in awareness creation around Climate-Smart solid waste management through
radio talk shows, community clean-up and education campaigns targeting schools, has led to
corresponding level of results - 87% of the households sensitized found the sensitization campaigns
beneficial, and have made changes in SWM at household level. Best practices adopted include
adopting waste reduction practices and improving storage of wastes at Household. Working with
school age children as agents of change in their communities is a long-term investment in changing
behavior of individuals and communities.
Sustainability
The programme implementation approach, has been documented to improve primary waste collection
in a sustainable manner. It is a good example of how city-community partnerships can deliver essential
services to poor communities in resource poor situations, including informal high-density townships.
CBEs are locally established and employ workers from within local communities. CBEs through their
umbrella organization NACOBE, are part of the Waste Sector Technical Working Group which
provides a platform for sustaining their operations and advancing their interests.
The Model is scalable, evident from the fact that PCC has adopted and replicated it within the city.
However, the emergence of Zogos within the waste sector not only provides stiff competition to the
CBE Model but threatens its survival. To enhance institutional sustainability of CBEs, there is need to
recognize CBEs as vital players within the Waste Sector in Liberia, address challenges that constrain
their operations, but also putting to a stop Zogo’s continued participation in primary waste collection.
Conclusion
While the Project is responding to some of the challenges in the Waste Sector in Greater Monrovia,
several challenges and gaps remain at the mid-term, which have implication on the delivery of the
Project and the attainment of results. Empting of Skip buckets by municipal authorities remains a huge
challenge that affects CBE operations, and needs to be resolved by municipal authorities.
Overall, efforts towards attainment of Project objectives need stepping-up. Results in Component 1&2
remain low. Owing to the interrelatedness and interlinkage of components 1&2, low performance in
component 1 is affecting attainment of results in Component 2. Attainment of results in component 3
is well on track while attainment of component 4 is within the control of the Project.
Coverage of CBE services remains thin on ground, while challenges around their operational capacity
remain unaddressed. The lack of access to finance and credit, lack of adequate tools and equipment,
and the frequent breakdown of equipment continue to affect their day-to-day operations. A
functional Primary-Secondary Waste Management value chain is central to improving SWM in Greater
Monrovia, therefore critical for all duty bearers to perform their roles.
CITIES ALLIANCE – PSWM PROJECT Mid-Term Evaluation – Final Report
Divalon Enterprises Limited xviii June 4th 2020
While the Model can lead to attainment of deliverables, it’s effectiveness is directly linked with
designed interventions being implemented on schedule and on plan, therefore Cities Alliance urgently
needs to fast track implementation of activities that lag behind schedule.
Recommendations
Government
There is a need for improved funding for the city corporations. The lack of adequate budgetary
support by the GoL has restricted city corporations’ ability to expand SWM services. Government
should increase on allocations to MCC, PCC, EPA and the WASH Commission, but also ensure that
city authorities are supported firmly to improve revenue mobilization from local sources. Government
needs to fulfill its counterpart funding with Secondary SWM Project.
Fast tracking the formulation of the Waste Management Policy and Strategy: Once in place, the policy
framework will guide municipal authorities as well as provide them with adequate legal support to
enforce their mandate in waste management. In addition, strict enforcement of existing laws on waste
disposal would also aid greatly in eradicating the negative attitude regarding waste disposal
with offenders receiving punishment.
Though waste management is a stated government priority, the subsector depends primarily on
donor financing. Citizens trust in service providers is largely broken and needs to be addressed to
rebuild the social contract of paying for solid waste collection. There is need to establish a policy to
enforce mandatory requirement of households to subscribe to CBEs. This will help CBEs increase their
revenue and prevent Zogos from encroaching on their revenue.
Cities Alliance
Expedite implementation of all activities that lag behind schedule, particularly activities in Component
1 and 2. Functionalizing the Loan Facility, Grant Facility and construction of Sorting, Compositing and
Recycling facilities should be given high priority. These are central interventions, if implemented will
create the desired impact.
Enhance efforts to reduce the per capita Solid Waste dumped in landfill. Diversion from landfills has
become a major driver for many SWM Projects, with some States, Cities and Municipalities operating
under legislative requirements for achieving specific diversion goals. Recycling and compositing are
critical in determining the actual diversion rates. These interventions not only reduce per capita waste
to landfills, but also generate life affirming livelihoods for the urban poor. The Project should design
incentives and awareness systems to motivate waste reduction, source-separation and reuse.
Monitoring and supervision of CBEs: Supervision and Monitoring CBE activities by NACOBE is weak,
needs to be strengthened. The Evaluation established that some CBE staff practice unhealthy waste
disposal practices. They dispose wastes in water bodies and non-gazatted places. Unless monitored
and supervised, such practices may gradually be seen to raise. We recommend reinstating Community
Management Team (CMTs) to Monitor and supervise CBEs at community level.

CITIES ALLIANCE – PSWM PROJECT Mid-Term Evaluation – Final Report
Divalon Enterprises Limited xix June 4th 2020
City Authorities
Empting skips buckets regularly: Emptying skip buckets by City Corporations remains a big challenge
with Greater Monrovia. Authorities should work on addressing challenges around emptying skips.
Alternatively, City Corporations should permit CBEs to dump at transfer stations and landfills. This
will reduce the amount of waste that goes to the skip buckets.
In order to enhance effective planning and organization of waste management operations in Greater
Monrovia, there is need to gather accurate data on the quantities, type and characteristics of waste
being generated. MCC and PCC should work on creation of a database on solid waste and undertake
regular investigations and research to generate accurate data on the waste situations with the aim of
facilitating waste planning and management.
Strengthening Public-Private-Partnerships in delivery of SWM Services. Public-Private-Partnerships are
one of the proven approaches in better SWM efforts. The Project has demonstrated that Private
Sector engagement is vital in stimulating improvements in SWM, and minimizing negative effects of
waste in poor communities. National & City Governments should strengthen and promote
sustainable, self-supporting partnerships with Partners and NACOBE/ CBEs.
Whilst the Pilot was suspended by MCC, they had already penetrated primary waste collection and
remain in operation in communities. These individuals cannot be ignored, need to be engaged by
municipal authorities, have them trained on basic SWM practices, supervise and monitor their
operations, and have them integrated into the CBE Sector, by having CBEs employ them.
Community-Based Enterprises
There are opportunities that NACOBE can explore to enhance the service delivery model of engaging
CBEs for primary waste collection. NACOBE, with support from the Project should explore the
possibility of adapting zoning laws to enhance competition, efficiency and effectives among CBEs by
re-dividing Greater Monrovia in well-defined zones (LGAs) and allocating specific zones (LGAS) to
specific CBEs for operation. This will increase service coverage and enhance accountability.
There is need for better engagement and representation of CBE interests by NACOBE at National and
City Government level, in terms of recognition of CBEs as vital private players within the Waste
Sector; lobbying for opportunities for CBEs to access Finance and Credit; address issues of harassment
by city authorities particularly confiscation of CBE tools and equipment, denying access to disposal
sites, physical violence and extortion as well as a policy that makes it mandatory for households to
pay for waste collection services to enable CBEs collect adequate revenues to sustain their operations.
CBEs operations are primarily financed by a Primary Solid Waste Collection (PSWC) fee paid by
households. Individual CBE determines the fees, which in many cases are negotiated on an individual
basis with households. There is need for NACOBE to work along with Municipal Authorities to come

CITIES ALLIANCE – PSWM PROJECT Mid-Term Evaluation – Final Report
Divalon Enterprises Limited xx June 4th 2020
up with a uniform fee to be charged to households than individual CBEs determining their own fees.
The fee should be standardized to all households across the 12 LGAs.
Some CBE staff were found to engage in non-environmentally friendly dumping practices, partly
attributed to weak supervision of CBE activities by NACOBE. We recommend that NACOBE
strengthens Monitoring and Supervision of CBE activities at Community level to ensure that CBEs and
their staff are compliant with waste disposal standards and protocols set by EPA

CITIES ALLIANCE – PSWM PROJECT Mid-Term Evaluation – Final Report
Divalon Enterprises Limited 1 June 4th 2020
CHAPTER I: INTRODUCTION AND BACKGROUND
1.1 Introduction and Background
Globally, the amount of urban waste being produced is growing faster than the rate of urbanization.
Currently, world cities generate about 1.3 billion tonnes of solid waste per year. This volume is
expected to increase to 2.2 billion tonnes by 2025. Waste generation in sub-Saharan Africa is
approximately 62 million tonnes per year with rates likely to more than double over the next twenty
years in lower income countries2. Per capita waste generation is generally low in Sub-Saharan African
(compared to other regions in the world), but spans a wide range, from 0.09 to 3.0 kg per person
per day, with an average of 0.65 kg/capita/day.3
Primary waste collection continues to remain a challenge in Greater Monrovia and its surrounding
townships. The Emergency Monrovia Urban Sanitation (EMUS) Project supported the Government of
Liberia, on an emergency basis, to maintain and increase access to solid waste collection service in the
capital city of Monrovia from the period of 2009-2016. As the country had just emerged from a 14
year long civil war at that time, the capital city of Monrovia had been among the worst affected
areas, with the collapse of the solid waste management system being central to poor living conditions.
The service had ceased to exist for over 14 years, leading to massive accumulation of waste
throughout the city. Piling waste was creating health and environmental hazards, which contributed
to the spread of diseases, clogged the drainage and sewerage networks, and contributed to flooding
that further deteriorated city infrastructure. While solid waste services in Monrovia were partially
restored in 2006/7, only about a third of daily generated waste was being collected and disposed
away from the city.
Solid Waste Management (SWM) services in Greater Monrovia combine primary and secondary solid
waste collection services. Primary solid waste collections (PSWC) from the poorer community areas
are run by Community-Based Enterprises (CBEs) with semi-formal recognition by Greater Monrovia’s
local governments. CBEs collect the waste at the doorstep and transport it with buckets and
wheelbarrows and/or simple capital equipment (e.g. tricycle) to skips.
There is a total of 110 skips. The skips are of two types. Ten are reinforced concrete bins, which are
emptied directly into tipper trucks that transport the waste directly to the Whein Town landfill. The
remaining 100 skips are emptied at the nearest transfer stations. Secondary solid waste collections
(SSWC) are run by formally registered SMEs who transport the waste from skips to a transfer station
2 Hoornweg and Bhandal-Tata (2012) What A Waste: A Global Review of Solid Waste Management,
World Bank: Washington, DC.
3 Data used in this section is adopted from “Description of the action on delivering climate-resilient solid
waste management services in Greater Monrovia, Liberia through community-based enterprises. presented
by UNOPS-Cities Alliance, December 2017

CITIES ALLIANCE – PSWM PROJECT Mid-Term Evaluation – Final Report
Divalon Enterprises Limited 2 June 4th 2020
from where it is further transported to the landfill site4. More recently, during the end of the EMUS
project, the private contractor system collapsed and the MCC then took on the service directly,
moving waste from skips and transfer stations to the landfill.
The MCC established a dedicated IMPAC team to manage the project and to support CBEs. The CBEs
entered into official contracts with the MCC, which provided some level of official recognition. In
addition to monitoring and administrating the project, the team was responsible for establishing and
training CBEs and conducting public awareness campaigns to inform the urban poor of the health and
environmental benefits of improved waste disposal. The CBEs are financed by a PSWC fee paid by
households and small businesses in the communities served by the CBE.
The individual CBE determines the fees, which in many cases are negotiated on an individual basis
with communities and even households. Similarly, the system varies between the CBEs as the service is
tailor-made to local conditions. Although the methods vary, all systems involve collecting Primary
Solid Waste (PSW) directly from individual households and transferring it to a local skip bucket from
where city authorities takes the waste to the landfill.
1.2 Cities Alliance’s Programming
1.2.1 About Cities Alliance Country Programmes
The Cities Alliance is a global partnership for poverty reduction and the promotion of sustainable
development in cities, hosted by the United Nations Office for Project Services (UNOPS). Launched in
1999 jointly by the World Bank and UN-Habitat, the Cities Alliance provides technical and financial
assistance to address urban poverty in developing countries. The Cities Alliance Country Programmes
were first designed in 2009 as a new model of intervention in urban development, with a shift from
shorter-term, onetime initiatives towards a longer-term, programmatic approach to address the
specific development needs of cities in selected countries, typically in the context of rapid urbanisation
and growing urban poverty.
1.2.2 About the Liberia Country Programme
The Cities Alliance Liberia Country Programme (LCP) is a 5-year programme aiming at enabling
Liberia – specifically its development partners and Cities Alliance members in Greater Monrovia –
realise its urban agenda through investing in partnerships, building coherence of effort among
members and partners, and improving alignment between national policy, local government capacity
and an active citizenry.
The Liberia Country Programme is a partnership initiative undertaken by the Government of Liberia
and its partners to align urban development efforts at the national, city and community levels
working directly with Habitat for Humanity International, Institute of Housing and Development
4 Landfill site is located in Paynesville, part of Greater Monrovia.

CITIES ALLIANCE – PSWM PROJECT Mid-Term Evaluation – Final Report
Divalon Enterprises Limited 3 June 4th 2020
Studies(I.H.S), Women in Informal Employment Globalizing and Organizing, UN-Habitat and
Shack/Slum Dweller International as implementing partners. The Programme was initiated at the
request of the Monrovia City Corporation (MCC) and the Liberian Ministry of Internal Affairs, and
aims to provide direct service investments, especially for the urban poor and youth living in Greater
Monrovia’s informal settlements. It also supports Liberia’s goal of achieving middle income status by
2030.
The Programme aims to improve the quality of support provided to cities in the country, eventually
expanding from Greater Monrovia to secondary cities and county capitals around the country. The
programme aims to:
1. Strengthen organisation and meaningful participation of slum dwellers and working poor
organizations in city governance, inclusive planning and responsive service delivery.
2. Improve climate resilient and inclusive urban planning, slum upgrading and incremental housing
strategies with investments in the provision of community driven services and affordable housing.
3. Enhance the national enabling environment for resilient and inclusive urbanization benefitting
economic growth, local governments and the urban poor.
4. National and city level policy, planning and legislative environment for resilient and inclusive
urbanization benefits recognition and voice of the urban poor.
1.2.3 About the PSWM Project
The Cities Alliance’s European Union funded Project “Delivering Climate-Resilient Solid Waste
Management Services in Greater Monrovia, Liberia through Community-Based Enterprises” is a 4-year
Project (2018-2021) aimed at leveraging long-term support, in accordance with GCCA/GCCA+
objectives, public-private-people-partnerships in Greater Monrovia to build and sustain:
o Urban health and environmental protection, leveraging World Bank-supported Solid Waste
Management (SWM) projects.
o Sustainable economic growth through green businesses generating jobs to the urban poor,
leveraging the Improved Primary Waste Collection in Poor Communities (IMPAC) project.
o Resilient governance, based on the principles of partnership and subsidiarity, with participation of
the urban poor and women, girls, and youth leveraging the Cities Alliance LCP.
The Goal of the Programme is to contribute to poverty reduction and improve the quality of life while
supporting Liberia’s carbon neutrality agenda. The overall objective is to ensure that Greater Monrovia
is serviced by a citywide integrated solid waste management system that reduce greenhouse gas
emission and enhances the city’s resilience against climate change and disease, it creates jobs and
creates awareness of climate change.
The Project is funded to a tune of £4.9M, supporting primary waste collection in Greater Monrovia
through Community Based Enterprises (CBEs). The CBEs were formed as part of the door to door

CITIES ALLIANCE – PSWM PROJECT Mid-Term Evaluation – Final Report
Divalon Enterprises Limited 4 June 4th 2020
collection in the city and have been working for quite some time in the area of Primary Solid Waste
collection. Several attempts have been made during the past years to make the Community Based
Enterprises (CBE) viable to sustain the current CBE system.
The design of the EU Funded Primary Solid Waste Collection Project is based on linking solid waste
removal into the very fabric of the Liberia Country Programme with the understanding that for any
solid waste removal system to be resilient, effective, and sustainable, it needs to be directly linked into
a wider development vision that integrates city governance, citizenship, other municipal services, the
natural ecological environment, and the economy.
1.3 Objectives of the EU Primary Solid Waste Project
▪ Improved access to sanitation through more sustainable and efficient solid waste collection in
Greater Monrovia.
▪ Reduced greenhouse gas emission through improving extracting, sorting and re-use of solid waste
in Greater Monrovia.
▪ Improved awareness of Climate Change and climate-resilient solid waste management in the
Greater Monrovia population with a focus on youth.
▪ Improved and integrated plans and capacity to manage and fund Solid Waste Management for
Greater Monrovia.
1.4 Project Implementation Approach:
Component I: Collect more wastes: This works directly with CBEs who go to households to collect
solid waste and dispose the waste into skip buckets. Household subscribe and pay weekly or monthly
fees for waste collection to the CBEs. The outcome is to improve access to sanitation through more
sustainable and efficient Solid Waste collection within Greater Monrovia. This is attained through
establishing a Micro-Credit Facility to support CBEs with equipment and loans, establish a Small Grant
facility for CBEs and communities for Primary Waste collection innovation, and conduct engagement
meetings with MCC, PCC, LIBA and NACOBE.
Component II: Extract and Reuse Plastic and Organic Matter: Looks at the next steps after collecting
the waste. The Project provides CBEs that are ready to do recycling and compositing with loans and
grants to undertake recycling and compositing activities. Expected result is reduced greenhouse gas
emission through improving extracting, sorting and re-use of solid waste in Greater Monrovia.
Interventions include Commissioning feasibility studies into selected options, technologies and product
markets, production testing, and detailed models for plastics and organics extracting, sorting and
composting. Other interventions include arranging cross visits to identified best practices and
technology with respect to 4R, construct and operate sorting stations, pilot waste to compost project
in operation and piloting a waste to plastic project.
Component III: Increased awareness and Education on SWM: Expected result is improved awareness
of Climate Change and climate Resilient Solid Waste Management in the Greater Monrovia with focus
CITIES ALLIANCE – PSWM PROJECT Mid-Term Evaluation – Final Report
Divalon Enterprises Limited 5 June 4th 2020
on Youth. Interventions include developing and implementing School and Community awareness
campaigns and competitions for Greater Monrovia that promote climate change awareness, promote
4R awareness, and the importance of protecting the natural and built environment. Other
interventions include implementing Outreach events such as radio shows, cleanest school &
community competitions, beach cleaning campaigns, and implementing demonstration projects in
selected communities and schools of Greater Monrovia.
Component IV: Integrated SWM System and Capacity: Expected result is improved and integrated plans
and capacity to manage and fund SWM for GM. Interventions include support the capacity
development and institutional strengthening of an integrated solid waste management team within
Greater Monrovia, Developing a stakeholder platform that brings together national ministries, Greater
Monrovia Local Government, private sector, and communities, linked to the City Development
Strategies (CDS), developing a costed solid waste strategy for the Greater Monrovia area, designing and
implementing a participatory M&E system with a community monitoring component, and design and
implement learning exchange for Programme committee members and other stakeholders.
1.5 Purpose of Mid-Term Evaluation
The purpose of the Mid-Term Evaluation was to provide a strategic review of Project performance,
assess results achieved, lessons learnt and the extent to which the Project is delivering on its objectives.
To achieve this, the Evaluation assessed Tier II and III Project indicators (outcome and intermediate-
outcomes) across the 12 LGAs of Greater Monrovia. In addition to Tier II and III indicators, Tier IV
output level indicators were included in the analysis as detailed in Annex I.
1.6 Scope of the Evaluation:
The Mid-Term Evaluation covered the 12 LGAs in Greater Monrovia were Project is implemented.
Tier II and III Programme indicators were assessed as per the Project Log frame. In addition, Tier IV
output level indicators have been included in the Report after review and discussion of output data
from the Project Management Information System with the Cities Alliance. In addition to reviewing
performance against the Project log frame, a contextual analysis was conducted with regard to the
Solid Waste Sector in Greater Monrovia, and the environment within which the Project is delivered.
The following population groups were studied to answer the Evaluation questions and objectives.
o Households in Greater Monrovia
o National Association of Community Based Enterprises (NACOBE)
o Community Based Enterprises (CBEs)
o Government officials i.e. Ministry of Internal Affairs, EPA, WASH Commission, MCC, PCC etc.
o Township Commissioners from West Point, Caldwell, Congo Town, Barnesville and the
Borough of New Kru Town.
o CLUS Project Coordinator

CITIES ALLIANCE – PSWM PROJECT Mid-Term Evaluation – Final Report
Divalon Enterprises Limited 6 June 4th 2020
1.7 Evaluation Questions
Table 1: Evaluation Questions
SNO Evaluation Criteria Evaluation Question
1. Relevance ▪ To what extent has the Programme Supported the National
Adaptation Planning (NAP) and Nationally Determined
Contributions (NDCs) processes, through building green and
inclusive Community-Based Enterprises (CBEs) that reduce per
capita solid waste dumped in landfills while generating life
affirming Livelihoods for the urban poor and with a gender
focus?
▪ To what extent has the Programme Supported national and
local government, the private sector, and urban poor
communities in building effective climate adaptation systems at
all levels?
2. Effectiveness ▪ To what extent will the Programme be likely to achieve its
deliverables with the current structure model?
▪ How effective is the Programme design and coherence
including the design of the log frame matrix/ Programme
theory of change and its assumptions?
▪ The what extent has the Programme built an inclusive, safe,
resilient, and sustainable ecosystem around the sector to test,
refine, replicate, and scale precedence-setting Solid Waste
Management technologies?
▪ What were the major factors influencing the achievement or
non-achievement of the outcome/intermediate
outcome(s)/expected results/outputs? (Also consider any which
were possibly beyond the control of the project)?
3. Efficiency ▪ To what degree was value for money Prioritized during
Programme implementation?
▪ To what extent will the Programme staff and task distribution
influence achievement of Programme results?
4. Sustainability ▪ To what extent will the Community Based Enterprise Model of
primary Waste Collection be sustainable and be scaled across
Greater Monrovia?
▪ What needs to be done and/or improved to ensure institutional
sustainability of the Community Based Enterprises?
▪ To what extent will the 4 project components be handed over
to stakeholders?
5. Equity ▪ To what degree is gender equality evident in the structures,
systems and results of the Programme?
CITIES ALLIANCE – PSWM PROJECT Mid-Term Evaluation – Final Report
Divalon Enterprises Limited 7 June 4th 2020
CHAPTER II: EVALUATION METHODOLOGY
2.1 Evaluation Design
The Evaluation adopted a cross-sectional descriptive study design, utilizing mixed methods
approach i.e. both qualitative and quantitative, including secondary5 and primary data sources to
better understand the extent to which Greater Monrovia is serviced by a citywide integrated SWM
system that reduces greenhouse gas emission and enhances the city’s resilience against climate change
and disease, and creates awareness of climate change. The cross-sectional element obtained data from a
cross section of stakeholders and population groups such as Households and CBEs, while the descriptive
element obtained data from NACOBE, City Corporations, Township Commissioners and Government
agencies such as Ministry of Internal Affairs, EPA and WASH Commission.
2.2 Sample size estimation and selection of participants
Quantitative data collection approaches were adopted in collection of data from Households and
CBEs. At 5% level of statistical significance, the required sample size for the above participants were
calculated using the Kish Leslie formula for simple random sampling;
Sample size n0 = Z2 x p (1-p)/e
2
Where n0 = sample size, Z = confidence level at 95% e = margin of error at 5%
p = Proportion of households in slums with regular access to private solid waste collection
2.2.1 Sample Size for households
From Kish Leslie’s formula, with p = 16%6 gives a sample size of 207 households. A non-response of
5% was factored into the calculation to cater for both non-response and poorly filled in
questionnaires. This increased the estimated sample size to 217 households. A design effect, of 2 was
factored in the estimation to obtain the final sample as 434. The 434 households were apportioned
across the 12 LGAs and enrolled into the Evaluation. Probability Proportionate to Size (PPS) was
adopted in apportioning the number of households for selection in each LGA. However, changes were
made to final sample sizes in some LGAs as detailed in Table 2, majorly due to the outbreak of
Coronavirus within these LGAs, as elaborated in the limitations section.
2.2.2 Sample Size for CBEs
The number of CBEs supported by the Project is 40, of these 38 were reached. The two could not be
reached successfully for interviews. Efforts to have phone interviews were unsuccessful as the known
phone contacts were unavailable. To ensure quality and operational utility of this Midterm Evaluation,
the Enumeration team ensured that gender issues were put into considered in selection of Evaluation
participants including CBEs, Households and other stakeholders.
5 Baseline Report, 2018 & 2019 Project Annual Reports, MEL Strategy for LCP, Final CBE Starter Kit M&E
Report, Project Proposal, CR LCP Mid-Term Evaluation Report
6 Proportion of households in slum/low income areas with regular access to private solid waste collection
based on the Mid-Term Evaluation of Cities Alliance Liberia Country Programme

CITIES ALLIANCE – PSWM PROJECT Mid-Term Evaluation – Final Report
Divalon Enterprises Limited 8 June 4th 2020
Table 2: Household Reached during the Sample by City and LGA
Sno. Name City or LGA Population7 Sample Size HH Reached
1 Monrovia 148,278 88 112
2 Paynesville 120,671 70 60
3 New Kru 82,614 45 45
4 Logan Town 76,579 44 60
5 Gardnerville 51,259 30 50
6 West Point 47,470 28 32
7 Johnsonville 2,553 10 17
8 Caldwell 45,595 27 14
9 Congo Town 15,640 9 10
10 Dixville 75,403 45 10
11 New Georgia 36,546 22 16
12 Barnesville 26,894 16 8
Total 434 434
Table 3: Number of other Project stakeholders and population groups Reached
SNO. Programme Stakeholder No. Participants
1. NACOBE 8
2. Ministry of Internal Affairs 1
3. Environmental Protection Agency 1
4. WASH Commission 1
5. Monrovia City Corporation & Paynesville City Corporation 12
6. Township Commissioners 5
7. CLUS Project 1
8. Cities Alliance Staff 5
2.3 Selection of Study Participants
2.3.1 Selection of Households:
In selection of households, multistage sampling technique was adopted. First, all the 12 LGAs were
considered (purposive sampling). Within each LGA, stratified sampling was adopted to select the
required number of communities for the survey. Communities selected were those were CBEs
supported by the Project are working. The number of communities selected in each LGA followed
Probability Proportionate to Size (PPS) approach. Within each community, Simple random sampling
was adopted to select the required number of Blocks and within each block, systematic random
sampling was adopted to select the households enrolled in the survey. At household level, the head of
the household was the target respondent and in their absence, their spouse was the next choice
respondent.
7 Data source: Monrovia City Corporation zone and community boundaries – Ministry of Planning &
Economic Affairs

CITIES ALLIANCE – PSWM PROJECT Mid-Term Evaluation – Final Report
Divalon Enterprises Limited 9 June 4th 2020
2.3.2 Selection of CBEs and Other Project Stakeholders
Due to the small number of CBEs, all were selected for the Evaluation. An inventory of CBEs supported
by the Project was obtained from Cities Alliance and reached out for interviews. Project stakeholders
were purposively selected based on the knowledge and understanding they hold regarding the Project
and their involvement in implementation, in consultation with Cities Alliance. Gender issues were put
into consideration in selection of the stakeholders.
2.4 Data Collection Methods and procedures
2.4.1 Quantitative data
Household Survey Questionnaire. This was a structured researcher administered tool to community
dwellers. CBE Survey Questionnaire: A Semi-structured questionnaire was used to collect data to
understand their role in delivering Climate-Resilient SWM Services in Greater Monrovia.
2.4.2 Qualitative data
Qualitatively, data was collected from stakeholders using approaches detailed in the table 4.
Table 4: Qualitative Programme Stakeholders and data collection methods
SNO. Programme Stakeholder Data Collection Method
1. NACOBE Focus Group Discussion
2. Ministry of Internal Affairs Key Informant Interviews
3. Environmental Protection Agency Key Informant Interviews
4. WASH Commission Key Informant Interviews
5. MCC and PCC In-depth Interviews
6. Township Commissioners Key Informant Interviews
7 CLUS project coordinator In-depth interview
8. Household Qualitative Interviews FGDs
9. Cities Alliance Staff In-depth Interviews
2.4.3 Digital Data collection for Quantitative Data
Mobile Data Collection (MDC) devices were used in collection of quantitative data. Quantitative data
collection tools were converted to an electronic tool through an application designed using
Kobotoolbox to collect the data. Data was then transferred from the device to a central database for
storage, analysis and manipulation. These devices were password protected to limit access to
unauthorized users. This saved time that would otherwise have been used to do data entry.
2.5 Field Data Collection Procedure
The first case of Covid-19 was confirmed a day before data collection started. The data collection plan
and field implementation were revised to fasten data collected. While the initial plan was to work
with 9 enumerators and 3 team leaders to collect data within 15 days, the numbers were increased to
15 for enumerators and 5 for supervisors, and data collected in 7 days by five (5) teams each
consisting of 3 enumerators and a supervisor. The supervisor provided technical support, management
of study and quality assurance.

CITIES ALLIANCE – PSWM PROJECT Mid-Term Evaluation – Final Report
Divalon Enterprises Limited 10 June 4th 2020
2.6 Training and field Presetting of data collection Tools
A two-day training was conducted for the data collection team on areas encompassing the study
objectives, sampling methods, data collection methods, interviewing skills and getting informed
consent from the respondents.
A field pre-testing exercise was conducted in Jallah Town Community. Enumerators administered
tools to the respondents to assess the validity, relevance, clarity, length and completeness of the data
collection tools while the team leaders observed how interviews were being conducted. Results of the
pre-test were used to refine the study tools and processes. Prior to data collection, teams visited the
Township Commissioners to request for permission to conduct the survey within the LGAs.
Quality control
The consulting team was responsible for supervision of the data collection process and ensuring data is
checked daily for missing information, errors and inconsistencies. Respondents with missing and
inconsistent data were followed up to address the gaps. Daily reviews were held to share and discuss
results, findings and the day’s activities. This enabled the team to identify and deal with information
gaps before leaving the field. Spot checking were conducted by reviewing a random sample of data to
check for discrepancies or other anomalies.
2.7 Data Management, Systematization and Analysis
2.7.1 Data Editing, Systematization and cleaning
Data was continuously reviewed and assessed from the field at the end of each day’s work, and made
adjustments, where needed to control quality. Data was further scrubbed to detect & correct or
remove corrupt or inaccurate records from a data set. Data harmonization and standardization was
conducted to ensure a clean dataset is produced.
2.7.2 Qualitative Data Analysis
Qualitative data was analyzed following standard content analysis procedures. The analysis permitted
extraction of the required content for each theme. The extracted content was synthesized in
consonance with the major themes of the survey and categorized according to social, demographic
and gender factors. This was used to explain the quantitative results. Transcriptions from audio
recordings formed the empirical basis for the content analysis.
2.7.3 Quantitative Data Analysis
Data was exported to Excel for checking and cleaning to ensure accuracy. Univariate analysis was
conducted for descriptive statistics. Frequency tables, proportions, percentages and other measures of
central tendency i.e. mean and median were computed. Bivariate Analysis was performed through
cross tabulations to provide further analysis.

CITIES ALLIANCE – PSWM PROJECT Mid-Term Evaluation – Final Report
Divalon Enterprises Limited 11 June 4th 2020
2.8 Report Writing
2.8.1 Draft Report
On the basis of document review and field level consultations, a draft report with results and findings
disaggregated by gender where applicable has been compiled. It includes a critical assessment of the
data and putting together survey findings, conclusions and recommendations.
2.8.2 Draft Report Review
The first draft report was submitted to Cities Alliance for review. Feedback and comments obtained
were incorporated into the second draft. Feedback and comments from the second draft were
incorporated into the final Draft Report, which was shared with Project stakeholders and Cities
Alliance Management for a final round of review and input. The review process provided an
opportunity for Cities Alliance and stakeholders to comment on the draft reports. Apart from
clarifying and correcting certain information, the review provided additional data that was used to
highlight additional results.
2.8.3 Final Report Compilation
Comments and recommendations emanating from the Final Draft Report review by Cities Alliance
Management and stakeholders were used to further refine, improve and compile the Final Report
which has been submitted to Cities Alliance. The report captured recommendations with clear
responsibility centers, and presented issues and recommendations in a way that will assist the Project
team in making informed decisions to enhance performance.
2.9 Validation and Dissemination Workshop
Due to restrictions on group meeting due to Covid-19, the dissemination was done electronically by
sharing the Report with Project stakeholders on mail for review, input and comments. This was used
as a forum for sharing preliminary findings, crosschecking data consistence and filling any data gaps
identified. Opinions and comments from stakeholders were taken into account during preparation of
this Final Report.
2.10 Exit Meeting
Upon submission of the Final Report, the consulting team will hold an exit meeting with Cities
Alliance to share lessons learned from the evaluation for improving the planning, design and
implementation of future similar exercises.
2.11 Limitations to the Evaluation:
Respondent fatigue: Some of the selected respondents declined to participate in the Evaluation, citing
involvement in several previous research undertakings by Cities Alliance, providing similar
information. This was more pronounced among CBEs who highlighted to have provided Cities
Alliance similar information at least twice in the past two years. A few households expressed similar

CITIES ALLIANCE – PSWM PROJECT Mid-Term Evaluation – Final Report
Divalon Enterprises Limited 12 June 4th 2020
concerns. However, benefits of taking part and risks for not taking part in the Evaluation were
explained to these participants, and majority consented to participate.
In selection of households, systematic sampling was adopted. However, local leaders were not certain
of the total number of households at Block level. An approximation was instead made, in order to
determine the sampling interval. This could have introduced a selection bias in the recruitment
process. Simple random sampling should have been adopted to avert this bias.
Recall bias: Some of the questions required respondents to recall practices or behavior six months
preceding the Evaluation. Some participants however, could not recall with certainty practices for
such questions. Although the study minimized this by properly defining and articulating the research
questions, similar research undertakings in future should employ prospective study designs since this
type of design does not require recalls.
Social desirability response bias: Some respondents reported what they thought was socially
acceptable. This could have resulted into under or over estimating certain outcomes. This was
mitigated by assuring respondents that the Evaluation was just an inquiry into current SWM practices
to identify gaps and areas that could be strengthened, and not aimed at prosecuting offenders,
particularly those engaged in illegal dumping. Moreover, tools were structured in such a way that
they carried no personal identifiers.
Corona Virus Outbreak: The first case of Covid-19 in Liberia was among the selected key Informants
for the Evaluation. A session on preventive and safety measures was held for the Research team, and
protective gear and sensitizers procured and distributed to the team before dispatch for data
collection to ensure safety of the team. The following challenges were experienced;
i. Over/under sampling in some LGAs. To ensure safety of the Research team, the Consultants
continually reallocated sample sizes from LGAs that reported confirmed cases of the Coronavirus
to those that were secure, which distorted the initial sample size allocation to LGAs. The
reallocation was however carefully done in a way that did not affect survey results and
outcomes.
ii. Change in the Data Collection Plan and Implementation approach: Face-to-face interviews were
dropped for all key informant and adopted phone interviews to minimize contact. The
scheduling of interviews had to be re-organized to start with group interviews (FGDs and In-
depth Interviews). The Research team was beefed-up from 9 to 15 enumerators, and 3 to 5
supervisors to complete Quantitative data collection within 7 days.
iii. Missed opportunity with Schools. The outbreak of the virus resulted into closure of all schools in
the country. The Evaluation missed an opportunity of visiting supported schools to assess current
SWM practices and the impact of awareness campaigns with the schools.

CITIES ALLIANCE – PSWM PROJECT Mid-Term Evaluation – Final Report
Divalon Enterprises Limited 13 June 4th 2020
CHAPTER III: RESULTS AND FINDINGS
3.1 Introduction
This Chapter presents findings from the Mid-Term Evaluation. It presents results from the analysis of
the Solid Waste Sector in Greater Monrovia, Progress towards attainment of Project Objectives, results
from the Qualitative and Quantitative Surveys, and conclusions related to the Evaluation Questions.
3.2 The Solid Waste Sector in Greater Monrovia & Project’s Response to Sector Challenges
3.2.1 Analysis of the SWM Sector in Greater Monrovia
Over the years, the population in Greater Monrovia has significantly increased, currently estimated at
one million. The unsustainable rise in population has led to corresponding levels of Solid Waste
accumulation, putting pressure on the existing resources and infrastructure. Solid Waste disposal has
thus become an overwhelming task for municipal authorities, who face severe constraints in tackling
the mounting waste situation.
The Government of Liberia (GoL) has established a number of agencies to manage Solid Waste; EPA
was established to tackle environmental issues and waste management services, coordination,
monitoring and supervision of waste sector, and setting up national guidelines for SWM. The WASH
Commission, was recently established (2018) to promote and regulate the development, management
of water, sanitation and hygiene services.
Within Greater Monrovia, SWM is vested within city corporations. These are responsible for carrying
out city ordinances, management of municipal wastes, recreation, public awareness and provision of
services in environmental health and sanitation. The mandates of these agencies however seem to
cross cut resulting into duplication of activities and resources in terms of monitoring, supervision,
regulation and enforcement.
Primary Waste Collection involves door-to-door Waste Collection Services in some areas, and
communal storage in skip buckets in other areas, while Secondary Waste Collection Services involve a
long haul from skip buckets to transfer stations and to final disposal at a sanitary landfill, as well as
management of the landfill. Secondary collection is taken over by City Governments, while Primary
collection is conducted through agreements with Community Based Enterprises (CBEs).
The CBE model was created in 2007 as part of the World Bank’s EMUS project. Under the model,
CBEs were established by MCC through a competitive bid process, in which one or two suitable
bidders were selected and assigned to a particular zone within which they were required to collect
garbage from households to designated collection points.
Cities Alliance’s EU funded “Delivering Climate-Resilient SWM Services in Greater Monrovia, Liberia
through CBEs” builds on this model to deliver climate smart waste management services in Greater
Monrovia. The Model started in Monrovia but has since been replicated in Paynesville, with 30% of
the CBEs supported located in Paynesville, though serving communities outside Paynesville.
CITIES ALLIANCE – PSWM PROJECT Mid-Term Evaluation – Final Report
Divalon Enterprises Limited 14 June 4th 2020
With funding from the World Bank, city corporations are implementing a Secondary SWM Project -
the Cheesemanburg Landfill Urban Sanitation (CLUS) Project, collecting waste from the Skips to
transfer stations and sanitary landfills. The infrastructure for SWM in Greater Monrovia includes one
sanitary landfill (Whein Town Landfill), two transfer stations (Stockton Creek and Fiamah), three
installed weighbridges (at the landfill and at the two transfer stations), and one hundred and ten
communal disposal locations spread over the Greater Monrovia area.
Currently, municipal authorities are largely using land filling to solve the solid waste problem,
however efforts to reduce the per capita Solid Waste dumped in landfills need to be enhanced. Liberia
lacks the capacity to adequately utilize other options such as recycling or energy recovery. This option
is down the waste hierarchy which prioritizes environmental friendliness with waste prevention at the
top, followed by minimization, reuse, recycling, energy recovery, and disposal. Over the years, city
corporations have demonstrated capacity to sustain SWM, though challenges & logistical gaps remain.
Inadequate sites for landfill disposal is a major challenge faced by municipal authorities. The city is
saturated with squatters. Most available spaces are in the hands of private owners and outskirts of the
city saturated with mangrove swamps. In short, land space is scarce and finding suitable sites for the
disposal of solid waste that will not affect communities is an overwhelming task. Due to inadequate
sites for waste disposal, wetlands and rivers streams are being used to dump waste.
Poor public attitude towards waste disposal, coupled with the non-enforcement of existing laws on
waste disposal affects efforts towards improving SWM. Residents freely throw waste where they like.
While there are city ordinances that prohibit such practice, these are not adequately enforced.
Skip buckets are not frequently emptied due to lack of fuel for waste collection trucks, and frequent
breakdown of machinery. While GoL’s counterpart funding under WB’s Secondary SWM Project was
meant to provide funds for fuel and repair of equipment and machinery, this has not been fulfilled.
Therefore, the lack of logistics, poorly maintained disposal sites, and lack of waste treatment facilities
make it difficult for accumulated wastes to be effectively collected and disposed.
The lack of data presents huge challenges to municipal authorities in planning and organization of
waste management. The acquisition of accurate and reliable data on the sources, quantities and
composition of waste generated is vital for successful planning and organization of waste
management in any city. Without such data, it is seemingly impossible for any city corporation to
effectively determine the resources and capacity requirement for effective and sustainable SWM in
terms of personnel, logistics and organization.
Lack of Solid Waste Management Policy. Liberia lacks a National Waste Management Policy, making
regulation of the sector challenging. Ordinances on waste management remain the key guiding
framework for SWM, yet not adequately enforced. The lack of adequate budgetary support by the
GoL has restricted city corporations’ ability to expand SWM services. The challenges above have a
critical bearing on delivery of intended results.

CITIES ALLIANCE – PSWM PROJECT Mid-Term Evaluation – Final Report
Divalon Enterprises Limited 15 June 4th 2020
3.2.2 Project’s Response to Sector challenges in Greater Monrovia
The Project is enhancing access to sanitation through more sustainable and efficient Solid Waste
collection. Working closely with City Corporations, Cities Alliance has revamped and built on
successes of the CBE model following closure of the EMUS Project. The Project has provided tools and
equipment to CBEs, built their capacity in several areas including Solid Waste Management, Financial
Management and Record Management among others.
In addition, the Project intends to provide Loan and Grant facilities to enable CBEs address challenges
around inadequate tools and equipment. The Loans and Grants will further enable CBEs to generate
value added services such as sorting, compositing and recycling of wastes to improve livelihoods and
reduce the Quantity of recyclable waste dumped at landfills. This will enhance expansion of CBEs
horizontally (Geographical coverage) and vertically (composting and recycling). Although Project
activities around extracting, sorting and re-use of Solid Waste lag behind schedule, once fully
implemented will go a long way in reducing greenhouse gas emission.
Coordination of the Solid Waste Sector players is critical in tackling constraints to the mounting waste
situation in Greater Monrovia. The Project established a Solid Waste TWG to strengthen coordination
of sector players, although this has been duplicated by MCC and the WASH Commission. The
platform brings together National Ministries, City Corporations, Local Government, private sector,
and communities to deliberate on issues within the waste sector.
Results from the feasibility studies have been helpful in shaping the Waste Sector in Greater Monrovia
and Liberia. The studies identified the need of a National Waste Management Policy to regulate the
Waste Sector, this is currently under development, and a draft has been shared with stakeholders. The
Project has also enhanced awareness of Climate Change and climate Resilient Solid Waste
Management through developing and implementing School and Community awareness campaigns
and competitions that promote climate change awareness, promotes 4R awareness and the
importance of protecting natural and built environment.
This is done through Radio and TV talk shows, outreach events, and implementing demonstration
projects in selected communities and schools. Within the supported schools, the Project supported the
establishment of Environmental Clubs, majorly targeting Youth. Educational excursion to solid waste
management facilities have conducted for schools to raise awareness around solid waste management,
increase knowledge and simulate a sense of behavior change.
The Project is supporting the development of an Integrated Solid Waste Management system as a
guiding framework for city corporations in the implementation of waste management services to
ensure prioritization of the various strategies of SWM in the order presented by the waste hierarchy.
The Project further supports the development of a costed Solid Waste strategy for Greater Monrovia
which is linked to the City Development Strategies (CDS). The Project has built the capacity of local
leaders to create awareness and sensitize communities on the benefits of proper SWM.
CITIES ALLIANCE – PSWM PROJECT Mid-Term Evaluation – Final Report
Divalon Enterprises Limited 16 June 4th 2020
3.2.3 Waste Sector Challenges that need to be addressed
Empting of Skip buckets by municipal authorities: Lack of logistics such as fuel, repair of waste
collection trucks affects frequent emptying of skip buckets, needs to be addressed. Need to finalize
construction of the Cheesemanburg Landfill to ensure adequate space is available for disposal of waste
Solid Waste Management Policy: A coherent Policy for waste management, revenue collection and
incentivizing assistance from the government will go a long way in strengthening the sector, but also
provide clear vision and direction for bringing in donor partners and private capital.
Enforcement of existing laws and ordinances: Weak enforcement of existing laws on waste disposal
affects efforts to improve SWM. Strict enforcement would greatly aid in eradicating the negative
attitude regarding disposal of waste with offenders receiving punishment.
Availability, and use of data in SWM and planning: Lack of accurate data on the quantities and types
of waste being generated, their characteristics, as well as the waste disposal practices prevalent among
the population affects waste planning and management. MCC and PCC should work on the creation
of a database on solid waste and undertake regular investigations and research to generate accurate
data on the waste situation with the aim of facilitating waste planning and management.
Inadequate land space: Land space is scarce and finding suitable sites for the disposal of solid waste
that will not affect community dwellers is a huge challenge. This has affected interventions around
constructing sorting, compositing and recycling stations.
Inadequate funding for government agencies responsible for waste management: Even though waste
management is a stated government priority, the subsector depends primarily on donor financing.
There is a need for improved funding for the City Corporations, EPA and the WASH Commission.
3.2.4 Delivering Climate Smart Solid Waste services through the CBE Model
Cities Alliance implements a model that supports CBEs to collect Waste from households and dispose
into Skip Buckets placed within communities by City Corporations. This approach is key to improving
primary waste collection in a sustainable manner.
Many of the benefits of the CBE model accrue to local communities, particularly because workers are
sourced from the communities in which they operate. Not only does local employment provide an
income and help the money stay in the community, but also helps create trust and greater sense of
community ownership. CBE activities have resulted into an increase in the Quantity of Waste
collected. However, because skip buckets are not regularly emptied, CBE operations are affected.
i. Reduction in CBE Activity: Due to delays in empting skip buckets, CBEs are forced to scale down
on their activities because they have nowhere to dispose the garbage, until the City Corporations
empty the skip buckets. Municipal authorities ought to grant CBEs access to Transfer stations and
landfills to reduce the amount of waste dumped at the skips.

CITIES ALLIANCE – PSWM PROJECT Mid-Term Evaluation – Final Report
Divalon Enterprises Limited 17 June 4th 2020
ii. Unreliability of CBEs: While the willingness of CBEs to collect waste is high, a scale down in
activities is eminent because they have nowhere to dump the garbage. The frequency of waste
collection from households has to be scaled down, as a result CBEs have are considered unreliable.
iii. Household refusal to pay for waste collection services: Because of the unreliability of CBEs,
majority of the households will refuse to pay for waste collection services. From the Household
Survey, 42% of the households were found to have refused to pay for waste collection services
within the past six month preceding the survey.
iv. Alternative unhealthy and non-environmentally sound Waste disposal practices: Due to the
unreliability of CBEs, households instead resort to unhealthy and non-environmentally friendly
waste disposal practices such as damping in wetlands, river streams and burning.
3.2.5 Environment within which the Project is implemented
3.2.5.1 Current Economic Situation in Liberia
The administration of President George M. Weah clocked two years in office in January 2020, and
Liberians believe their economic woes have worsened under his leadership. Weah inherited an
economy badly hit by a slump in global prices of rubber and iron ore - Liberia's key export
commodities. The Ebola crisis of 2014-2016 exacerbated the economic stagnation in the Country,
where 80% of the population is said to live on less than $1.25 a day. The president promised to turn
around economy by fighting corruption, increasing foreign investment and creating jobs for the poor.
Two years into office, the country’s economy has been challenged with rising inflation as a result of
significant depreciation of the Liberian dollar against the United States dollar. Inflation reached 31.3%
by August 2019, up from 26.1% the previous year. The economy has fallen further into the repressed
category since 2019, while GDP growth has recorded a weak performance over the last couple of
years. This has hampered Government’s ability to fully deliver services and meet other obligations.
The business environment in the Country remains difficult due to the challenging domestic
macroeconomic environment. This has affected the ability of nationals to meet expenses on basic
necessities. Government’s desires to reduce poverty, create new jobs, meet critical infrastructure
needs, and develop the agricultural sector to increase food production are not likely to be fulfilled
without significant steps to improve the business and investment climates.
3.2.5.2 Emergence of Private Individual Waste Collectors (Zogos)
The CBE Model faces stiff competition from Private individuals (Zogos) and illegal waste collectors.
Between Dec 2019 and Mar 2020, MCC piloted a three-four months Project where youths (Zogos)
were recruited by the city corporation to engage in waste collection, particularly street cleaning. The
introduction of Zogos added to illegal waste collectors, who have been active in the waste sector for
several years. While the mandate of the Zogos was initially limited to street cleaning, many have
penetrated the primary waste collection, duplicating CBE activities.

CITIES ALLIANCE – PSWM PROJECT Mid-Term Evaluation – Final Report
Divalon Enterprises Limited 18 June 4th 2020
They go into households to collect garbage and get paid from households mandated towards CBEs,
thus taking away their business. They are paid between LRD 10-15 every time they pick wastes.
Because they are cheaper, majority of the households have resorted to using their services. However,
the Zogos and illegal waste collectors are neither registered nor regulated, and their operations not
monitored and supervised. They lack basic training in SWM and dump garbage in open space, streets
corners, highways and in residents’ compounds in the night.
They lack basic waste collection tools and equipment, and protective gear to ensure safety during
waste collection. They carry garbage on their heads, when the weight becomes unbearable, they
dump anywhere. Effective end of March, the Zogos approach was suspended by MCC. While the
Pilot was suspended, these individuals had already penetrated primary waste collection and remain in
operation in most communities.
This is unsustainable, and not the long-term solution to tackling the mounting waste situation in
Greater Monrovia. The Zogos have neither supported expansion nor increased access to primary
waste collection services but rather created a transfer or shift of clients from CBEs to using services of
Zogos. Households that had previously subscribed to CBEs have shifted allegiance to Zogos.
Among households using private waste collection services, 84% were found to use Zogos while 16%
used CBEs. In addition, satisfaction with waste collection service provider was higher among
households using Zogos, at 47% compared to those using CBEs, at 36% because Zogos are cheaper
and considered more reliable than CBEs. These individuals cannot be ignored, need to be engaged by
municipal authorities. There is need to organize them, have them trained on basic Solid Waste
Management, have them supervised and their operations monitored closely, and eventually have
them integrated into the CBE Sector, by having CBEs employ them.
3.2.6 Lessons Learned implementing this Model
i. The effectiveness of the Model requires the entire Primary-Secondary SWM value chain to be
functional. A breakdown in any component along the value chain creates a breakdown in the
entire cycle. While the Primary & Secondary SWM functions rest with two different entities, the
two are inter-twinned & inter-linked. Success of one of the components is dependent on the other.
ii. Addressing challenges around CBE operations remains critical for the success of the Model. Efforts
into training CBEs in SWM, Financial Management, Business Development and Records
Management are commendable, however challenges around access to finance and credit, adequate
tools & equipment, and frequent breakdown of equipment remain, and need to be addressed.
iii. While the Project supports CBE vertical and horizontal expansion, horizontal expansion can only
happen to a point where the garbage collected by CBEs can be effectively managed by city
corporations. If the amount of garbage generated surpasses the capacity of city corporations, then
the negative consequences will be borne by the communities. This is further affected by delays in
implementation of the Recycling and Compositing interventions.

CITIES ALLIANCE – PSWM PROJECT Mid-Term Evaluation – Final Report
Divalon Enterprises Limited 19 June 4th 2020
iv. Public-Private-Partnerships critical: There is increasing demand for better recognition of CBEs as
vital players within the Waste Sector in Liberia, particularly from City Corporations. Lessons from
countries and cities with robust Waste Management Systems shows that Public-Private-Partnerships
have been pivotal to such efforts. Implementing the Zogos approach did not seem to strengthen
PPPs. While CBEs are slightly costly compared to the Zogos, the CBE approach is a more
sustainable model because they are regulated, monitored, and supervised unlike the Zogos.
v. The Model thrives better within a conducive policy and legislative environment: Liberia currently
lacks a Waste Management Policy, relying on City ordinances for regulating the Waste Sector.
There is need for regulations that make it mandatory for households to pay for waste collection
services. This will ensure CBEs collect enough revenue to manage & sustain day-to-day operations.
vi. Monitoring and supervision of CBEs activities is critical: The Evaluation established that some CBE
staff practice unhealthy waste dispose practices. They dispose wastes in Water bodies and non-
gazatted places. Unless monitored and supervised, such practices may gradually be seen to raise.
Reinstating Community Management Team (CMTs) to Monitor and supervise CBEs at community
level will enhance compliance to standards.
3.2.7 Limitations with the Model:
i. Inadequate Waste disposal facilities (Skip Buckets): The design did not take into account the
number of skip buckets available at community level, and their capacity to accommodate the
amount of garbage collected by CBEs. The Quantity of waste collected exceeds the capacity skip
buckets can accommodate and many times, CBEs have nowhere to dump garbage. This is further
complicated by skip buckets not emptied on time.
ii. Success of this Model requires that either (or both) the Recycling and Compositing component
and/or Secondary waste collection are functional. However, the former is yet to start, while the
later has been ineffective. With composting and recycling interventions behind schedule, the per
capita solid waste that goes into landfills continues to increase, and delays in empting skips is a
driver to communities engaging in unhealthy and environmental unsound disposal practices.
3.3 Progress towards attainment of Project Objectives:
Outcome: Greater Monrovia is serviced by a citywide Integrated SWM system that reduces
greenhouse gas emission and enhances the city’s resilience against climate change and disease.
The Project has contributed to an increase in the percentage of households with planned forms of
garbage disposal in Greater Monrovia. The percentage increased from 36% at baseline to 83% at
mid-term, surpassing the 45% Life of Project (LOP) target. This is attributed to the awareness creation
campaigns where communities are sensitized on the benefits of proper waste collection, storage and
disposal. As a result, households have put in place storage and disposal facilities within homes.

CITIES ALLIANCE – PSWM PROJECT Mid-Term Evaluation – Final Report
Divalon Enterprises Limited 20 June 4th 2020
The Project’s contribution towards reducing the quantity of recyclable waste going to the landfill
remains low. The percentage (33%) remains unchanged from the baseline. Recycling and compositing
reduces the quantity of recyclable waste that goes to the landfill, thus reducing GHG emissions.
However, activities in Component 1&2 that support attainment of this result lag behind schedule.
Intermediate Outcomes 1: Improved access to sanitation through more sustainable and efficient
solid waste collection in Greater Monrovia
Overall attainment of results under this intermediate outcome is relatively low at mid-term,
particularly due to critical activities lagging behind schedule and a few internal delays that have
affected speedy implementation. For instance, signing an MOU with ECO Bank to manage the Loans
and Grant facility took 6-8 months to be finalized.
The percentage of households receiving PSW collection services in Greater Monrovia improved from
36% at Baseline to 37% at Mid-Term. The progress is generally low compared to the Life of Project
(LOP) target of 45%. The Evaluation however observes that performance of the indicator is lower
compared to what is reported in the 2019 Comic Relief Mid-term Evaluation at 52%8. The drop in
the indicator is attributed to the following.
i. From the Qualitative Interviews, the Evaluation found that households were using the waste
generated to reclaim land. Owing to the imminent rainy season, communities are distressed of their
homes being washed away, consequently resorting to using the garbage generated to reclaim land.
This is aimed at lengthening the distance of the houses from the wetlands and river stream, and in
some instances creating more space for settlement. This implies that even where access to waste
collection services is increased, household use of the services is affected by other considerations,
such as using waste to reclaim land.
ii. Reduction in levels of trust by citizens in waste collection service providers. City Corporations are
ineffective in emptying skip, CBEs are unreliable, while the newly introduced Zogo approach
ended shortly after it had started. This has compelled citizens to devise other waste disposal means.
iii. Low willingness by households to pay for waste collection services. The unwillingness for
households to pay for waste collection has compelled them to resort to disposal methods that do
not involve costs such as open dumping, dumping in wetlands, river streams and burning wastes.
Intermediate Outcome 2: Reduced greenhouse gas emission through improving extracting,
sorting and re-use of solid waste in Greater Monrovia
Overall, attainment of results for the intermediate outcome at mid-term is low. Achievement of
Results is reliant on the performance of Intermediate Outcome I. Owing to the interrelatedness and
interlinkage of the two components, the low performance in component 1 affects attainment of full
scale results for this component. The Project envisaged that if Loan and Grant facilities are provided to
CBEs to engage in Composting and Recycling, this will reduce the amount of recyclable waste
8 Adopted from the 2019 Mid-Term Evaluation of the Comic Relief’s funded Liberia Country Programme
CITIES ALLIANCE – PSWM PROJECT Mid-Term Evaluation – Final Report
Divalon Enterprises Limited 21 June 4th 2020
dumped at landfills, eventually reducing green gas emission. However, Loan and Grant facilities have
been delayed.
The proportion of solid waste sorted and recycled for re-use at collection remains unchanged from
the baseline (0%), with the LOP target of 5%. Only one percent (1%) of the households was found
to engage in waste sorting, while 16% of CBEs engaged in some kind of sorting although on a small
scale. While knowledge on Recycling was found to be high among CBEs (91%), non is engaged in
Recycling activities due to lack of appropriate tools, equipment, technology and resources.
As with Intermediate Outcome 1, several critical activities lag behind schedule while securing land for
construction of sorting and recycling stations is a huge challenge
Intermediate outcome 3: Improved awareness of Climate Change and climate resilient solid
Waste management in the Greater Monrovia Population with a focus on youth
Overall, attainment of this intermediate outcome is well on track. The proportion of households in
Greater Monrovia reached by awareness campaigns on SWM improved from 0% at baseline to 15%
at Mid-Term, surpassing the LOP Target of 10%.
The Project has made substantial investments in awareness creation around Climate-Smart SWM,
urban health and environmental protection and the investments have led to corresponding level of
results - 87% of the households sensitized found the sensitization campaigns beneficial and have made
changes in SWM at household level. Best practices adopted include adopting waste reduction practices
and improving storage of wastes at Household as a result.
Regarding outcome 4: Improved and integrated plans and capacity to manage and fund SWM
for Greater Monrovia
Overall, attainment of this intermediate outcome is within the control of the Project. The outcome
indicator is qualitative; “Integrated Solid Waste Management small initiatives/best practices have been
included at community level planning” Analysis from the Project MIS, there is “No integrated solid
waste management small initiatives/lessons learnt included at community level planning”
In order to address the capacity issues, Cities Alliance has partnered with the Institute of Housing and
Development Studies (Erasmus University of Rotterdam) to conduct trainings locally in Liberia.
Training courses will be developed for Municipal SWM Officials and LGA staff, conducted by the
University and certificates awarded locally.
3.4 RESULTS FROM THE QUANTITATIVE AND QUALITATIVE SURVEYS
3.4.1 Introduction
This section presents results from the CBEs, Key informants, Focused Group Discussions & Households
Surveys conducted across the 12 LGAs of Greater Monrovia. A total of 38 CBEs of the target 40
participated in the survey, registering 95% response rate. Data was collected through research

CITIES ALLIANCE – PSWM PROJECT Mid-Term Evaluation – Final Report
Divalon Enterprises Limited 22 June 4th 2020
administered questionnaires. A similar approach was adopted to collect data from 434 households,
registering 100% response rate.
From the CBE Survey, more than half of the respondents (55%, n=21) were Proprietors of the Business,
the other (145%, n=17) were either Managers or Senior Officers with the CBE. From the Household
Survey, majority of the respondents (53%, n=229) were Heads of Household, while forty-seven
percent (n= 205) were Spouses to the Household Heads.
3.4.2 Socio-demographic Characteristics of Participants
From the CBE Survey, 76% (n=29) were Male, and majority were above 40 Years of age (Mean Age
=46 Years, SD=12.4), while 92% of the respondents (n=35) were married or cohabiting, and attained
University as the highest level of education (61%, n=23) as detailed in Table 5.
From the Household Survey, approximately two thirds of the respondents were female (65%, n=281),
with the majority between 31-40 Years of age (Mean Age=38, SD=10.1). Youths (15-24 Years)
comprised of 4% of the Household Survey respondents. Majority of the Household Survey respondents
were married or cohabiting (70%, n=304), and had Senior High School (38%, n=165) as the highest
level of education attained as detailed in Table 5.
Table 5: Socio-demographic characteristics Respondents
Characteristic Response CBE Survey (N, %) Household Survey (N, %)
Gender
Male 29 (76%) 153 (35%)
Female 9 (24%) 281 (65%)
Age
20-30 Years 3 (8%) 113 (26%)
31-40 Years 14 (37%) 180 (42%)
Above 40 Years 21 (55%) 141 (33%)
Marital Status
of Respondents
Married/ Cohabiting 35 (92%) 304 (70%)
Single 2 (5%) 98 (23%)
Other 1 (3%) 32 (7%)
Highest Level
of Education
Vocational/ Trade School 2 (5%) 34 (8%)
Senior High School 13 (34%) 165 (38%)
University 23 (61%) 96 (22%)
No Education 63 (15%)
Elementary 29 (7%)
Junior High School 47 (11%)
More than half of the Households (54%, n=236) were from Monrovia, Paynesville and Logan Town
due to the population sizes of the LGAs. Majority of the Households (53%) had 3-6 household
members, with an average size of 6 (SD=2.62). Majority of the Respondents (44%) were engaged in
Petty Trading as the main source of livelihood as detailed in Table 6.

CITIES ALLIANCE – PSWM PROJECT Mid-Term Evaluation – Final Report
Divalon Enterprises Limited 23 June 4th 2020
Table 6: Additional Household Socio-demographic Characteristics
Characteristic Characteristic Categories (n, %)
Local Government Authority
Monrovia 112 (26%)
Paynesville 60 (14%)
Logan Town 60 (14%)
Gardnerville 50 (12%)
New Kru Town 45 (10%)
West Point 32 (7%)
Johnsonville 17 (4%)
New Georgia 16 (4%)
Caldwell 14 (3%)
Congo Town 10 (2%)
Dixville 10 (2%)
Barnesville 8 (2%)
Household size
Mean=6, SD= 2.62
<3 34 (8%)
3-6 231 (53%)
Above 6 169 (39%)
Source of Livelihood
No Livelihood 36 (8%)
Formal Salaried Employee 122 (28%)
Petty Trader 190 (44%)
Casual laborer 36 (8%)
Unpaid family worker 26 (6%)
Industrial Worker 12 (28%)
Business 8 (2%)
Other 4 (1%)
3.4.3 Coverage of CBE Services
In terms of Coverage, CBEs are operational in nine (9) of the twelve (12) LGAs as highlighted in Table
7. Concentration of CBEs is much higher in Paynesville, with close to one third (32%, n=12) located
in PCC. Seven in every ten CBEs (71%, n=27) have been in existence for more than more than 4
years while eight (8) have been in operation for less than 3 Years. These were established with
support of the Project, with 7 out of 8 CBEs being in Paynesville. All the three (3) CBEs that have
been operational for 3-4 Years are from Paynesville.
The estimated number of number of households reached with CBEs is 8,800, with CBEs employing an
estimated 381 workers, for which 31% are female. As detailed in Figure 1, the number of households
reached within each LGA is proportional to the number of CBEs operational within the LGA.
Table 7: Coverage of CBE Services
Characteristic Characteristic Categories (n, %)
No. of staff employed by CBEs = 381
Male 262 (67%)
Female 119 (31%)

CITIES ALLIANCE – PSWM PROJECT Mid-Term Evaluation – Final Report
Divalon Enterprises Limited 24 June 4th 2020
Characteristic Characteristic Categories (n, %)
No. of Years of Existence as a CBE
1-2 Years 8 (21%)
3-4 Years 3 (8%)
Above 4 Years 27 (71%)
Number of CBEs operating within each
LGA
Paynesville 12
Logan Town 6
Monrovia 6
Barnesville 3
New Kru Town 3
Congo Town 3
Gardnerville 2
New Georgia 2
West Point 1
Despite the coverage at LGA and Community level above, CBE coverage remains thin on ground.
While nine (9) of the twelve (12) LGAs seem covered by CBE services, the proportion of communities
reached with services is low. From the Household Survey, households using private waste collection
services, only 16% are using CBEs. While a number of factors could explain the low utilization of CBE
services, coverage and reach of households remains a significant.
Figure 1: Estimated Number of Households Reached with CBE Services Per LGA
Vertical and horizontal expansion of CBEs is found to happen on a minimal scale due to inadequate
access to finance and Credit, inadequate tools and equipment, and frequent breakdown of available
equipment. The lack of compositing and recycling facilities, and resources affects vertical expansion.

CITIES ALLIANCE – PSWM PROJECT Mid-Term Evaluation – Final Report
Divalon Enterprises Limited 25 June 4th 2020
3.4.4 CBE Operations
All CBEs are legally operational and registered with City Corporations and NACOBE. Approximately
nine (9) in every ten CBEs (89%, n=34) had permanent offices where Business transactions are
conducted. Record keeping and management has greatly improved among CBEs, all CBEs had records
of business transactions. This is attributed to the training on Records Management by the Project.
Table 8: CBE Operations disaggregated by Duration of Operation
Characteristic Response
Project
Level
Duration of Operation9
<3 Years ≥3 Years
CBE has permanent offices to
transact Business?
Yes 89% 75% 93%
No 11% 25% 7%
CBE Keeps Records of
Business Transactions?
Yes (Records accessed) 87% 88% 87%
Yes (Records not accessed) 13% 12% 13%
Frequency of Waste
Collection by CBE per week
Two times 13% 37% 7%
Three times 39% 13% 46%
Four Times 6% 25% 0%
Five or More times 42% 25% 47%
Amount Charged by CBEs for
Waste Collection per month
(LRD)
Average Pay 325 270 350
Minimum Pay (Median) 168 125 188
Maximum Pay (Median) 550 450 600
Average Monthly Profits
from Business (LRD)
Average 12,000 15,000 10,500
Minimum 1,000 6,000 1,000
Maximum 54,000 54,000 52,000
Monthly Pay to Staff (LRD) Average Pay 8,150 10,650 7,500
Minimum Pay (Average) 5,000 6,000 5,000
Maximum Pay (Average) 15,250 15,250 10,000
Past 12 Months, the Profits
the CBE is making;
Increased 16% 38% 10%
Declined 71% 38% 80%
Remain the same 13% 24% 10%
Any clients refused to pay for
Services past 6 Months
Yes 95% 100% 93%
No 5% 0% 7%
All CBEs were found to maintain Records of Business Transactions, records for 87% of the CBEs could
be accessed. The result didn’t differ among CBEs newly established and those that have been in
business longer as indicated in Table 8.
9 Newly established CBEs are those who have been in operation for <3 years, while CBEs that have been
longer in business are those that have been in operation for at least 3 years.

CITIES ALLIANCE – PSWM PROJECT Mid-Term Evaluation – Final Report
Divalon Enterprises Limited 26 June 4th 2020
Majority of the CBEs (42%, n=16) reported to collect waste five or more times from households per
week. This frequency was found to be higher among CBEs that have been in the business longer
(47%) compared to those newly established (25%). The result, however differed with findings from
the Household Survey were the majority of the Households (75%) with access to public or private
waste collection services reported their wastes to be collected utmost three times in a week.
The amount charged for waste collection services was found to vary across CBEs. There is no standard
fee set by NACOBE or CBEs, each CBE determines their fee. The amount payable by the household is
dependent on the number of times a CBEs collects wastes from the households per week. The average
amount charged per month from households is LRD 325 (approximately USD 1.6), an average of LRD
80 per week. Newly established CBEs are seen to have a lower monthly average charges (LRD 270)
compared to CBEs that have been in business longer (LRD 350).
The Minimum amount charged per month is LRD 168, an average of about LRD 40 per week.
However, the amount charged can go as high as LRD 550, an average of about LRD 140 per week.
The average minimum and maximum amount charged are seen to be lower for newly established
CBEs compared to CBEs that have been in business longer.
Payments for staff employed by CBEs remains low, the average monthly salary was found to be LRD
8,150 (approx. USD 41). While the labor laws in Liberia require a minimum wage of USD 125 is paid
to workers, CBEs cannot afford to pay this rate. Newly established CBEs provide a much higher
average monthly pay of LRD 10,650 (USD 53) compared to CBEs who have been in business longer
at LRD 7500 (USD 38) mainly to attract workers. Its further observed that CBEs can pay as low as
LRD 5,000 (USD 25) per Month and as high as LRD 15,250 (USD 76).
“The average monthly pay to our staff is about LRD 7,000 (USD 35), this is however for staff who
collect wastes and garbage from households. Administrative officers are usually paid around LRD
10,000 (USD 50), and the CEOs or Proprietor of the CBEs paid around LRD 20,000 (USD 100). This is
very low, much lower than the what the labor laws in the country require us to pay workers, which
USD 125. People in the communities are willing and readily available to work but sometimes we find
it hard to attract staff because our pay is very low” Key Informant NACOBE.
Profitability of the CBE Business remains low. Within the past 12 Months, 71% of the CBEs report a
decline in profits registered. This is mainly attributed to the current economic situation in the country,
failure by households to pay for Waste Collections Services, but also a reduction in the CBE clients due
to the Zogo project implemented by MCC working directly with private individuals (Zogos). Many
households have resorted to services of the Zogos, which has led to a decline in CBE clients and a
reduction in the revenue collections.
The average monthly profits registered by CBEs is LRD 12,000 (USD 60), the profits are higher among
newly established CBEs compared to CBEs that have been in Business longer. This is partly attributed
to the trainings in Financial Management and Business Development conducted by the Project. Newly
established CBEs were more likely to implement lessons learnt from the training compared to CBEs

CITIES ALLIANCE – PSWM PROJECT Mid-Term Evaluation – Final Report
Divalon Enterprises Limited 27 June 4th 2020
Left: A Pushcart used by CBEs in Wastes collection. (Right): Tricycles that belong to PCC before
dispatched for Waste Collection. CBEs use similar Tricycles in Waste Collection
who have been in business longer. Profits generated by CBEs can be as low as LRD 1,000 (USD 5) per
month but also as high as LRD 54,000 (USD 270).
“The profits registered by the CBEs are very low. The Business cannot generate revenue worth USD
1,000 in a month, yet you employ like 15-20 staff who have to be paid. Now when you add other
expanses like renting Office premises, paying taxes, subscription to City Corporations and NACOBE,
frequent breakdown of our tools and equipment that need to be repaired almost every week, you
find that very little profits are realized” Key Informant NACOBE.
3.4.5 Tools, Equipment and Transport Facilities used by CBEs
Availability of transport means fully dedicated for Waste Collection remains a big challenge for CBEs.
CBEs collect Wastes and Garbage from Households and dispose it into Skip Buckets placed in different
locations within the communities by the City Corporations. From the CBE Survey, close to half of the
CBEs (47%, n=18) don’t have vehicle or transport means fully dedicated to Waste Collection and
disposal. CBEs without dedicated transport means were either hiring or borrowing from their
colleagues. Vehicles are not a common means used by CBEs in collecting Wastes, only one CBE has a
vehicle (Pick-up). The main transport means used by CBEs are Push Carts, Tricycles and
Wheelbarrows. The cost of fuel and repairs limits the use of tricycles in waste collection for CBEs.

CITIES ALLIANCE – PSWM PROJECT Mid-Term Evaluation – Final Report
Divalon Enterprises Limited 28 June 4th 2020
A Tricycle belonging to N. Joe Sanitation Services picking Wastes from Duport Road Community
Further analysis indicates that newly established CBEs were more likely to experience shortage or lack
of dedicated transport means compared to CBEs that have been in business longer. While the Project
provided equipment and tools to 3 CBEs, challenges around inadequate equipment and tools for CBE
remains central. The average of three (3) Tricycles, four (4) Push Carts and five (5) Wheelbarrows is
not sufficient to enable horizontal expansion of CBEs. Even with this average, one of the biggest
challenges affecting CBE transport is the frequent breakdown. This adds to the challenge of having
inadequate equipment and tools, which affects their operations.
“CBEs face numerous challenges. First they are self-supporting, they don’t receive any financial
support from anyone. They experience break down of their transport means almost every day. Now
they have very few transport equipment, they have 2 or 3 tricycles, so when 1 or 2 break down, the
A Tricycle belonging to Recvic Community Services in a Garage Under Repair

CITIES ALLIANCE – PSWM PROJECT Mid-Term Evaluation – Final Report
Divalon Enterprises Limited 29 June 4th 2020
entire operations are crippled. And because they don’t have money to repair these tri-cycles, they end
up spending months and months in the garage” KII City Corporations
Eighty-two percent (82%, n=31) of the CBEs reported lack of adequate tools and equipment to
effectively conduct their operations, the result did not differ among newly established CBEs and those
that have been in business longer. Almost all CBEs expressed desire in having or increasing the number
of vehicles fully dedicated for waste collection. These include Push Carts, Tricycles, and where possible
vehicles (pick-ups) to transport wastes to the skip buckets. CBEs further expressed need to acquire
more working tools such as Wheelbarrows, Spades and trowels, and protective wear such as gloves,
nose masks, Gum/rain boots and shovels to ensure safety of workers by reducing the risk of exposure
to infectious material.
The amount of funds required by CBEs to purchase the above tools and equipment ranges between
LRD 180,000 (USD 900) to LRD 750,000 (3,750) with an average of LRD 360,000 (USD 1,800). The
funds required did not differ among newly established CBEs and those that have been in business
longer. On how the CBEs intend to raise these funds, approximately 65%, (n=20) CBEs highlighted
obtaining a Grant from the Project as the immediate plan. The next option is to obtain a Loan from
the Project (61%, n=19) and obtaining a Loan from Financial Institutions, although high interest rate
and the lack of collateral are barriers to CBEs accessing credit from financial institutions.
Figure 2: Major Problems encountered in expanding the Size of the CBE
3.4.6 CBEs Working Conditions
A favorable working environment is critical to the success and sustainability of CBE operations. CBEs
subscribe to NACOBE, an umbrella organization that regulates, lobbies, advocates, coordinates,

CITIES ALLIANCE – PSWM PROJECT Mid-Term Evaluation – Final Report
Divalon Enterprises Limited 30 June 4th 2020
monitors and supervises the operations of CBEs. Within the past six (6) months preceding the
Evaluation, all the CBEs reported to have participated in meetings with NACOBE to discuss issues
related to their working conditions. Seventy-Nine percent (79%) believe that NACOBE represents
their interest well. CBEs that have been in business longer report better representation of their
interests (87%) compared to newly established CBEs (50%).
Table 9: Representation of CBE Interests by NACOBE
Characteristic Response
Project
Level
Duration of Operation10
<3 Years ≥3 Years
NACOBE Represents CBE Interest well (N=38)
Yes 79% 50% 87%
No 3% 0% 3%
Don’t Know 18% 50% 10%
NACOBE Engages Government and other
authorities on issues that affect CBE work
(N=38)
Yes 71% 50% 77%
No 11% 13% 10%
Don’t Know 18% 37% 13%
Satisfied with the way NACOBE is engaging
Government regarding your work (N=38)
Yes 34.2% 25% 37%
No 65.8% 75% 63%
Have freedom to express your concerns and
participate in decisions that affect your work
Yes 87% 88% 87%
No 13% 12% 13%
From the CBE Survey, 71% are in agreement that NACOBE engages Government and other City
Authorities on issues that affect their work, agreement higher among CBEs that have been in business
longer (77%) than newly established CBEs (50%). However, satisfaction with the way NACOBE is
engaging authorities is low. Only 34% of the CBEs expressed satisfaction with how NACOBE is
engaging government.
CBEs highlight the need for better representation of their interests by NACOBE, particularly
recognition by City and National Government as vital private players in the waste sector, advocate
for development of a National Waste Management Policy, lobbying for opportunities to access
Finance and Credit, a policy that makes it mandatory for households to pay for waste collection
services, and better information sharing and dissemination among others. In terms of expressing their
concerns, majority of the CBEs (87%, n=33) feel they have the freedom to express their concerns and
participate in decisions that affect their work, this did not differ among newly established CBEs and
those that have been in business longer.
10 Newly established CBEs are those who have been in operation for <3 years, while CBEs that have been
longer in business are those that have been in operation for at least 3 years.

CITIES ALLIANCE – PSWM PROJECT Mid-Term Evaluation – Final Report
Divalon Enterprises Limited 31 June 4th 2020
Table 10: Working Conditions of CBEs
Characteristic Response
Project
Level
Duration of Operation
<3 Years ≥3 Years
Experienced theft of your
Business Property or equipment
past 6 months (N=38)
Yes 47% 50% 47%
No 53% 50% 53%
Experienced Harassment from
authorities past 6 Mnths (N=38)
Yes 37% 38% 37%
No 63% 62% 63%
Harassed by (N=14)
Police 7% 33% 0%
Gov’t or City Authorities 93% 67% 100%
How many times has this
happened in the past 6 Months
(N=14)
Once 35% 29% 38%
Twice 13% 14% 13%
Thrice 26% 43% 19%
More than three times 26% 14% 31%
Forms of Harassment (N=14)
Physical Violence 36% 33% 36%
Extortion by city authorities 36% 33% 36%
Confiscation tools & Equipt 57% 67% 54%
Denied access to disposal sites 21% 33% 18%
The lack of adequate tools and equipment is further complicated by theft of tools and equipment.
Forty-Seven percent (47%) of the CBEs experienced theft of the business property and equipment
within the past six (6) months preceding the Evaluation, the incidents did not differ among newly
established CBEs and those that have been in business longer.
Incidents of harassment still exist for CBEs, with 37% of the CBEs reporting to have experienced
harassment from authorities within the past 6-months. The harassment is majorly done by City
Authorities. To a less extent, the Police was reported to harass CBEs. More than half of the CBEs that
were harassed reported this to have occurred at least three (3) times within the past six (6) months.
This did not differ among newly established CBEs and those that have been in business longer.
The most common forms of harassment by reported CBEs is the confiscation of their tools and
equipment, physical violence and extortion by city authorities. The other form harassment reported is
denying CBEs access to disposal sites.
“Because City Authorities take long to empty the skip buckets, we find that we cannot continue
dumping more wastes at the skip buckets because they are already overflowing. We have to look for
other alternative places were to dump or dispose the garbage we collect, so we end up forcefully
taking the garbage to transfer stations and sometimes to the landfills. However, we are denied access
to these disposal sites by City Authorities” KII NACOBE.

CITIES ALLIANCE – PSWM PROJECT Mid-Term Evaluation – Final Report
Divalon Enterprises Limited 32 June 4th 2020
3.4.7 Waste Collection, Disposal and Management Practices
The proportion of households with access to regular Solid Waste collection services increased
marginally from 36% at baseline to 37% at Mid-Term, while 95% of households with access to both
public and private services were found to use more of private services compared to public services.
Table 11: Household Access to Public and Private Waste Collection Services
Characteristic Response Household Survey
Household has access to Regular Waste
collection services [Public or Private] (N=434)
Yes 37%
No 63%
Access to Regular Waste Collection Services
[Public or Private by LGA]
Monrovia 41%
Paynesville 48%
Logan Town 38%
Gardnerville 26%
New Kru Town 44%
West Point 38%
Johnsonville 11%
New Georgia 13%
Caldwell 17%
Congo Town 45%
Dixville 14%
Barnesville 25%
Access to regular Solid Waste collection services
by type used by Households (N=161)
Public only 5%
Private only 48%
Both Public and Private 47%
If Private arrangement, who provides the
service (N=153)
CBE 16%
Individuals (Zogos) 84%
Household has a planned form of waste storage
and disposal within the home (N=434)
Yes 83%
No 17%
Households without access to public or private waste collection services (63%) were found to resort
to unhealthy and non-environmentally friendly waste disposal methods like disposing to the river,
wetlands and water bodies as detailed in Figure 3.
The major composition of wastes generated by households is organic waste. The major storage/
disposal facilities used in homes are plastic bags and plastic Bins/drums. In addition, 17% of the
households have no storage/disposal facilities, do direct disposal. Both Household & CBEs reported
the current Waste Disposal system pollutes the environment (95% for CBE vs 92% for households).
Reasons differed across CBEs and Households. The three (3) major reasons by CBEs are; Wastes not
collected regularly, Wastes left on the Road and Wastes left on the drain. For the households, the
reasons are; Waste left on the Road, Lack of dust bins and waste dumped everywhere, and Wastes
not regularly collected as shown in Table 12.

CITIES ALLIANCE – PSWM PROJECT Mid-Term Evaluation – Final Report
Divalon Enterprises Limited 33 June 4th 2020
Figure 3: Waste Disposal Methods for Households with no access to Public or Private Services
Table 12: Household Waste Disposal Practices by Households
Characteristic Response CBE
Survey
Household
Survey
Major Composition of Household
Waste (N=38)
Organic 74% 69%
Paper 5% 4%
Plastic 21% 27%
Major Storage facilities for Wastes
at Household
Plastic Bags 61% 44%
Plastic Bins/ drums 21% 39%
Metal Bins 18% 0%
No storage - Direct disposal/ dump 0% 17%
Current Waste Disposal system
polluting the environment (N=38)
Yes 95% 92%
No 5% 8%
Reason why it’s so (N=36)
No dustbin, waste dumped here and there 31% 49%
Burning of Waste 31% 0%
Waste not collected Regularly 65% 41%
Wastes left around the Dustbin 29% 17%
Wastes left on the Drain 55% 33%
Inadequate enforcement 13% 0%
Inadequate awareness and sensitization 6% 0%
Wastes left on the Road 55% 55%
The average number of wheelbarrows of wastes collected from a household per week by CBEs ranged
from 1-4 wheelbarrows, with an average of 3. The total number of wheelbarrows of waste collected
by a CBE per day ranged from 15-231, with an average of 101 wheelbarrows. From the wheelbarrows
of wastes collected per day, <1% (i.e. 0.7%) of the waste is separated or sorted.

CITIES ALLIANCE – PSWM PROJECT Mid-Term Evaluation – Final Report
Divalon Enterprises Limited 34 June 4th 2020
Left: Plastic Bags used to store waste, Centre: Plastic bin/drum, Right: Sacks used to store of wastes.
From the CBE Survey, 92% of the CBEs report that it’s common practice for people to dump waste
alongside bins instead of inside, mainly due to the height of the bin, waste and litter spread around
the bin, inadequate awareness and sensitization on good waste disposal practices at community level,
and delays in emptying skip buckets. Forty-two percent (42%, n=22) of the CBEs report difficulty in
accessing Skip buckets, while 82% report that Garbage containers and Skip buckets lack the capacity
to accommodate the waste collected as detailed in Table 13.
Table 13: Waste Disposal Practices among Households
Characteristic Response CBE Survey
People dump Waste alongside bins instead
of inside (N=38)
Yes 92%
No 8%
Reasons for doing this
(N=35)
Height of the Bin 46%
Waste and litter around the bin 46%
Inadequate awareness and sensitization 29%
Delays in empting the skip buckets 26%
Stray animal i.e. Dogs, Mouse 11%
Inadequate law enforcement 11%
Are Garbage Containers/ Skip Buckets
easily accessible (N=38)
Yes 58%
No 42%
Garbage containers have capacity to
accommodate waste collected (N=38)
Yes 18%
No 82%
Frequency of emptying Skip Buckets
(N=38)
Daily 14%
Weekly 81%
Monthly 5%

CITIES ALLIANCE – PSWM PROJECT Mid-Term Evaluation – Final Report
Divalon Enterprises Limited 35 June 4th 2020
A Skip Bucket placed in Jallah Town Community, Monrovia. While the bucket is empty, people
resort to dump garbage outside the Bucket than inside.
After collecting waste, CBEs dispose the garbage in Skip buckets. However, skips get filled up and over
flow because they are not emptied regularly. CBEs then have to think of other disposal methods -
Commonly used is open dumping (37%). Others resort to forcefully using the transfer stations (16%)
and landfills (13%) although access is restricted, while a few (3%) will dump in the Water bodies and
wetlands, as detailed in Figure 4.
Figure 4: Disposal of Waste by CBEs after Collection

CITIES ALLIANCE – PSWM PROJECT Mid-Term Evaluation – Final Report
Divalon Enterprises Limited 36 June 4th 2020
3.4.8 Frequency of Waste Collection and Satisfaction with Waste Collection Services
From the Household Survey, 75% of the households with waste collection services reported that
waste collection was conducted three (3) or less time from their homes in a week. Less than half of
the respondents (44%) were satisfied with the frequency of waste collection. Satisfaction did not
differ by gender, while the youth were more satisfied with the services than other age groups.
Ninety-six percent (96%, n=155) of households with access to waste collection services reported to
incur waste collection costs. The average amount incurred by household is LRD 130 per week, which
is line with findings from the CBEs who charge an average of LRD 80 from households per week.
Table 14: Frequency of Waste Collection and Satisfaction with Waste Collection Services
Characteristic Response Project
Level
Gender Age
Male Female 15-24 25-34 >34
Frequency of Waste
collection by Waste
Collection Service
Provider per week
(N=161)
Once 6% 11% 4% 0% 8% 6%
Two Times 28% 23% 31% 13% 31% 27%
Three Times 40% 45% 37% 50% 34% 44%
Four times 7% 6% 7% 12% 6% 6%
Five or more times 19% 15% 21% 25% 21% 17%
Satisfied with freq. of
Waste collection (n=161)
Yes 44% 43% 47% 100% 43% 42%
No 56% 57% 53% 0% 57% 58%
Household Incurs Waste
collection costs (N=161)
Yes 96% 95% 97% 88% 97% 97%
No 4% 5% 3% 12% 3% 3%
Satisfied with current
Waste Collection service
provider (N=161)
Yes 45% 47% 46% 100% 42% 44%
No 56% 53% 54% 0% 58% 56%
Which of these is a
priority Concern about
Waste in Community
(N=434)
Littering & Looks Bad 20% 23% 19% 7% 23% 20%
Effect on Human Health 47% 42% 49% 60% 46% 46%
Effect on Environment 33% 35% 32% 33% 31% 34%
Preferred time for Waste
Collection (N=161)
Morning 69% 63% 72% 88% 64% 71%
Noon 6% 5% 6% 0% 9% 3%
Afternoon 7% 12% 5% 0% 9% 7%
Evening 18% 20% 17% 12% 18% 19%
Failed to Pay for Waste
collection past 6 mnths
Yes 42% 47% 39% 0% 49% 40%
No 58% 53% 61% 100% 51% 60%
Current economic
situation affects ability to
pay for waste collection
services
Yes 50% 55% 47% 0% 51% 53%
No 50% 45% 53% 100% 49% 47%

CITIES ALLIANCE – PSWM PROJECT Mid-Term Evaluation – Final Report
Divalon Enterprises Limited 37 June 4th 2020
On satisfaction with Waste collection services, 45% of the households were satisfied with the waste
collection services. Satisfaction was higher among households using Zogos, at 47% compared to those
using CBEs, at 36%. Satisfaction was higher for households using Zogos because they consider
them to be more reliable in waste collection, charge a lower price for the service and also
because of the high cooperation with the households, compared to the CBEs.
Figure 5: Reasons for Household Dissatisfaction with Waste Collection Services
Major reasons for household dissatisfaction with Waste Collection Service provider are improper
waste collection raised by 64% (n=49) of unsatisfied Households. This relates to improper removal
of wastes from the storage or disposal facilities, where part of the waste drops or remains around the
storage or disposal facility, leaving the place untidy. Other issues around household dissatisfaction is in
regards to the high waste collection costs charged by CBEs (49%), and the unreliability of CBEs.
From the Household Survey, 42% of the households were found to have failed to pay waste
collection service provider within the past six (6) months. The result is much higher among CBEs, were
95% reported to have experienced defaulting from households in the past 6 months preceding the
Evaluation. The finding could be attributed to a social desirability bias, where respondents are thought
to have reported what they think is socially desirable, than what the actual practice is. However,
results from FGDs and Key informants were found to be in agreement with findings from the CBE
Survey. Half of the respondents (50%, n= 80) using private waste collection services reported that
the current economic situation in the Country had impact of their ability to pay for waste collection
services.

CITIES ALLIANCE – PSWM PROJECT Mid-Term Evaluation – Final Report
Divalon Enterprises Limited 38 June 4th 2020
3.4.9 Waste Sorting and Separation by CBEs and Households
Separation and sorting of wastes remains a big challenge among CBEs & Households. Only 8% of the
CBEs reported to know households that engage in sorting of waste. Sensitization of Households on
waste separation was found to be moderate, 55% of the CBEs reported to tell their clients to separate
wastes, as detailed in Table 15.
Table 15: Waste Sorting and Separation Practices among CBEs
Characteristic Response
Project
Level
Duration of Operation11
<3 Years ≥3 Years
Do household separate different types of
Waste (N=38)
Yes 8% 13% 7%
No 92% 87% 93%
CBE tells clients (Households) to Separate
Wastes (N=38)
Yes 55% 50% 57%
No 45% 50% 43%
CBE separates different type of Waste
before disposal (N=38)
Yes 16% 13% 17%
No 84% 87% 83%
From the CBE Survey, only 16% of the CBEs were found to be engaged in some kind of sorting or
separation of waste before disposal, although this is done on a small scale. The result did not differ
among newly established and those that have been in business longer.
Findings from the Household Survey did not differ from those from the CBE Survey, only 1% of the
households were found to separate or sort wastes. The result did not differ between gender and age.
Sensitization and awareness from Waste Collection Service Providers around waste separation and
sorting remains low. Only 4% of the households reporting to have ever been told to separate wastes
by the service providers as detailed in Table 16.
Table 16: Waste Sorting and Separation Practices among Households
Characteristic Response
Project
Level
Sex Age
Male Female 15-24 25-34 >34
Household Separates different type of
wastes (N=434)
Yes 1% 1% 1% 0% 1% 1%
No 99% 99% 99% 100% 99% 99%
Ever been told by Service Provider to
separate wastes (N=434)
Yes 4% 4% 4% 0% 3% 5%
No 96% 96% 96% 100% 97% 95%
If No, Would you do so if told
(N=416)
Yes 58% 63% 55% 53% 70% 52%
No 42% 37% 45% 47% 30% 48%
11 Newly established CBEs are those who have been in operation for <3 years, while CBEs that have been
longer in business are those that have been in operation for at least 3 years

CITIES ALLIANCE – PSWM PROJECT Mid-Term Evaluation – Final Report
Divalon Enterprises Limited 39 June 4th 2020
From the Household Survey, willingness by households to engage in sorting of waste was found to be
high (58%) if told to do so. The biggest challenge around sorting and separation of waste at
household level was found to be lack of adequate storage facilities.
“While households would want to sort their wastes, we don’t have enough storage facilities to
separate the waste. Separation of Waste requires that you have at least three (3) storage facilities, one
for Organic Waste, the other for plastics and at least one for paper. We cannot afford to do this and
neither can the CBEs afford to provide us three (3) plastics bags every time they collect wastes from
our homes” FGD Participant, Household.
3.4.10 Recycling and Compositing of Waste
Recycling and compositing of waste are critical Project interventions under Component 2. However,
they lag behind schedule. This is evident from the CBE Survey, where 92% of the CBEs did not
engage in recycling or composting activities. While the willingness for CBEs to Recycle and Composite
Wastes is high (86%), they lack the necessary tools, equipment, technology and resources to engage
in these activities.
Figure 6: Recycling and Compositing Practice by CBEs
From the CBE Survey, knowledge about the 4R strategy is seen to be high among CBEs (89%), but
very low among households (6%). While the strategy provides an opportunity to minimize wastes
generated and disposed, knowledge is low among households. Awareness creation and sensitization
activities in the remaining Project life should focus on the 4R.
Of the CBEs that have heard about the 4R, 88% heard it from Cities Alliance, likely during the
training on Solid Waste Management, while only a few from NACOBE and City Authorities.
Households that have heard about the 4R, majority have heard it from City authorities and members
of the Community. Willingness to engage in recycling and compositing activities was found to be high
among households, at 52%. More awareness is needed around the 4R at community level.

CITIES ALLIANCE – PSWM PROJECT Mid-Term Evaluation – Final Report
Divalon Enterprises Limited 40 June 4th 2020
Table 17: Knowledge about the 4R Strategy of Waste Minimization
Characteristic Response CBE Survey Household Survey
Heard of the 4R Strategy for Waste
Minimization
Yes 89% 6%
No 11% 94%
Source of Information about the 4R
Strategy of Waste Minimization
Cities Alliance 88% 0%
NACOBE 26% 0%
Gov’t/ City Authorities 26% 46%
NGOs 18% 13%
Training Institutions 6% 0%
Community Members 0% 29%
CBEs 0% 13%
What is the Strategy About?
[CBE understands]
Waste Reduce 85% 63%
Reusing Waste 91% 83%
Waste Recycle 91% 100%
Waste Recover 68% 42%
CBEs that had heard about the 4R were found to be knowledgeable about the Reuse, Recycle and
Reuse strategies, however less knowledgeable about Recovery. The few Household that have heard
about the 4R Strategy were found to be knowledgeable about the Recycle and Reuse Strategies. While
knowledge about the 4R strategy is high among CBEs, there is need for more sensitization on Waste
Recovery. At Household level, more sensitization is needed on Reduction and Recovery.
Campaigns about the 4R strategy were found to be thin on ground. Results reported did not differ
among CBEs and Households. More investments needed in awareness & sensitization about the 4R at
community level.
Table 18: Availability of Waste Minimization Campaigns on the 4Rs – CBE Survey
Characteristic Response CBE Survey Household
Survey
Waste Reduction campaigns are
organized in communities (N=38)
Yes 18% 9%
No 82% 91%
Waste Reuse campaigns are organized
in communities (N=38)
Yes 13% 1%
No 87% 99%
Waste Recycling campaigns are
organized in communities (N=38)
Yes 11% 1%
No 89% 99%
Waste Recovery campaigns are
organized in communities (N=38)
Yes 5% 0%
No 95% 100%

CITIES ALLIANCE – PSWM PROJECT Mid-Term Evaluation – Final Report
Divalon Enterprises Limited 41 June 4th 2020
Households have adopted local resources to collect and store household wastes and garbage.
3.4.11 Sensitization and Awareness about Solid Waste Management
From the CBE Survey, 89% of the CBEs were found to have participated or engaged in voluntary
community clean campaigns. CBEs that have been longer in Business were more likely to engage in
voluntary clean-up activities than newly established CBEs. In addition, 97% of the CBEs reported to
sensitize households on good waste management practices. Because CBEs are thin on ground, reach to
households is low. From the Household Survey, 15% of the Households were found to have been
reached with sensitization and awareness activities either by CBEs, local authorities or Cities Alliance.
Majority of the sensitization was found to be done by City Authorities and Cities Alliance, and less by
CBEs. Of the Households that were sensitized, majority (87%) found the sensitization and awareness
campaigns beneficial. Females were found to have benefited more from campaigns compared to the
males. Youths reported to have benefited more from the campaigns compared to other age
categories.
Majority of the household that have been sensitized report to have made changes in Solid Waste
Management at Household level following learnings from the awareness and sensitization campaigns.
Best practices adopted include adopting waste reduction practices and improving storage of wastes at
Household.

CITIES ALLIANCE – PSWM PROJECT Mid-Term Evaluation – Final Report
Divalon Enterprises Limited 42 June 4th 2020
Table 19: Awareness and Sensitization of Households on Good SWM Practices
Characteristic Response
Project
Level
Sex Age
Male Female 15-24 25-34 >34
Household received
sensitization/ awareness on
good SWM practices
(n=434)
Yes 15% 17% 13% 7% 12% 17%
No 85% 83% 87% 93% 88% 83%
Were the campaigns
beneficial to you and the
community (N=63)
Yes 87% 73% 97% 100% 76% 91%
No 10% 19% 3% 0% 18% 7%
Don’t Know 3% 8% 0% 0% 6% 2%
Household has made
changes in SWM practices
based on learning from the
campaigns (N=63)
Yes 68% 62% 73% 100% 65% 69%
No 24% 26% 22% 0% 35% 20%
Don’t Know 8% 12% 5% 0% 0% 11%
3.4.12 Capacity Building for CBEs
The Project has enhanced the capacity of CBEs to improve SWM through training and capacity
building in various areas. Ninety-five percent (95%) of the CBEs report to have benefited from
trainings organized by Cities Alliance. The Estimate number of CBEs staff who have benefited from the
training is these is 70, with 63% male and 37% female.
Table 20: Capacity Building activities for CBEs
Characteristic Response
Project
Level
CBE Years of Operation
<3 Years ≥3 Years
Any staff from CBE received
training or capacity building past 2
years (N=38)
Yes 95% 100% 93%
No 5% 0% 7%
Who conducted the training
(N=36)
NACOBE 33% 50% 29%
Gov’t/ City Authorities 36% 25% 39%
Cities Alliance 97% 100% 96%
NGO 25% 25% 25%
Areas of Capacity Building
(N=36)
Financial Management 94% 88% 96%
Record Keeping 83% 100% 79%
Solid Waste Management 86% 100% 82%
Business Management 17% 25% 14%
Was Capacity Building or Training
Beneficial (N=36)
Yes 100% 100% 100%
No

CITIES ALLIANCE – PSWM PROJECT Mid-Term Evaluation – Final Report
Divalon Enterprises Limited 43 June 4th 2020
3.4.13 Community Inclusiveness in SWM Planning
From the CBE Survey, 55% of the CBEs report to have been consulted or involved in the
development or selection of new Waste Management policies. On whether laws or polices about
Waste Management are clear and understandable, 61% of the CBEs reported the policies and laws
being clear and understandable.
From the Household Survey, only 4% of the respondents report to have been consulted or involved
in development or selection of new Waste Management Policies. In addition, only 5% reported that
the laws or policies about Waste Management being clear and understandable as detailed in Table 21.
Table 21: Inclusiveness of CBEs and Communities development or selection of new SWM Policies
Characteristic Response CBE Survey Household Survey
Involved or consulted in development or
selection of new Waste Management Policies
Yes 55% 4%
No 29% 30%
Don’t Know 16% 66%
Laws or Policies about Waste Management are
clear and understandable
Yes 61% 5%
No 24% 50%
Don’t Know 16% 45%
3.4.14 Problems affecting CBE Operations
Figure 7: Problems affecting CBE Operations
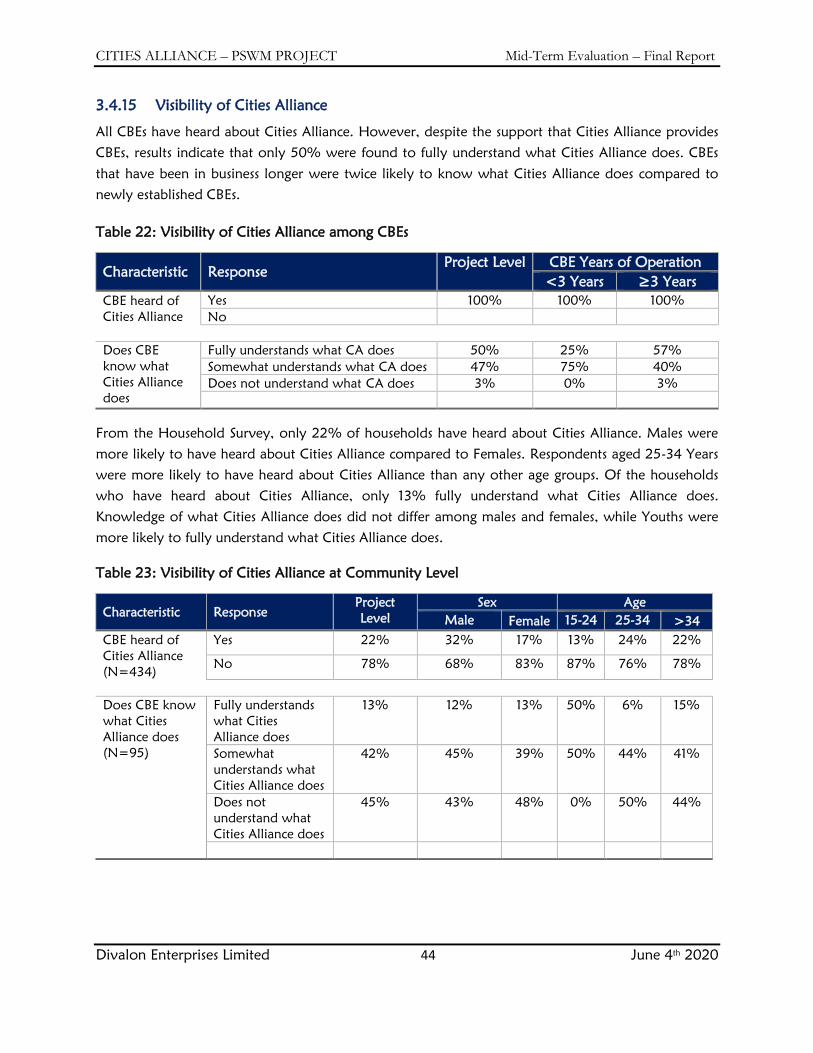
CITIES ALLIANCE – PSWM PROJECT Mid-Term Evaluation – Final Report
Divalon Enterprises Limited 44 June 4th 2020
3.4.15 Visibility of Cities Alliance
All CBEs have heard about Cities Alliance. However, despite the support that Cities Alliance provides
CBEs, results indicate that only 50% were found to fully understand what Cities Alliance does. CBEs
that have been in business longer were twice likely to know what Cities Alliance does compared to
newly established CBEs.
Table 22: Visibility of Cities Alliance among CBEs
Characteristic Response
Project Level CBE Years of Operation
<3 Years ≥3 Years
CBE heard of
Cities Alliance
Yes 100% 100% 100%
No
Does CBE
know what
Cities Alliance
does
Fully understands what CA does 50% 25% 57%
Somewhat understands what CA does 47% 75% 40%
Does not understand what CA does 3% 0% 3%
From the Household Survey, only 22% of households have heard about Cities Alliance. Males were
more likely to have heard about Cities Alliance compared to Females. Respondents aged 25-34 Years
were more likely to have heard about Cities Alliance than any other age groups. Of the households
who have heard about Cities Alliance, only 13% fully understand what Cities Alliance does.
Knowledge of what Cities Alliance does did not differ among males and females, while Youths were
more likely to fully understand what Cities Alliance does.
Table 23: Visibility of Cities Alliance at Community Level
Characteristic Response
Project
Level
Sex Age
Male Female 15-24 25-34 >34
CBE heard of
Cities Alliance
(N=434)
Yes 22% 32% 17% 13% 24% 22%
No 78% 68% 83% 87% 76% 78%
Does CBE know
what Cities
Alliance does
(N=95)
Fully understands
what Cities
Alliance does
13% 12% 13% 50% 6% 15%
Somewhat
understands what
Cities Alliance does
42% 45% 39% 50% 44% 41%
Does not
understand what
Cities Alliance does
45% 43% 48% 0% 50% 44%
CITIES ALLIANCE – PSWM PROJECT Mid-Term Evaluation – Final Report
Divalon Enterprises Limited 45 June 4th 2020
3.5 CONCLUSIONS FROM THE EVALUATION QUESTIONS
3.5.1 Relevance
There is unanimous acknowledgement from stakeholders that the Project provides an important and
significant contribution to the waste sector in Greater Monrovia. It is widely considered to be
connected to the 2030 agenda through SDG’s 5 (Gender Equality), SDG 7 (Affordable and Clean
Energy), SDG 8 (decent Work and Economic Growth), SDG 11 (Sustainable Cities and Communities)
and SDG 16 (Promote just, peaceful, and inclusive societies).
The Project supports climate mitigation solutions as outlined in the Liberia’s NDCs and NAP, through
reduced greenhouse gas emissions from solid waste management services as well as creating awareness
of Climate Change challenges among the population. The Project engages households and
communities, enlightening them about the benefits of proper SWM, and encourages them to practice
waste prevention, waste reduction and re-use, with waste disposal being the last option.
Evaluation Question: To what extent has the Project Supported the National Adaptation Planning
(NAP) and Nationally Determined Contributions (NDCs) processes, through building green and
inclusive CBEs that reduce per capita solid waste dumped in landfills while generating life affirming
livelihoods for the urban poor and with a gender focus
Overall, impact towards support of the NDC and NAP is moderate. Demonstrable results are so far
observed with the Project’s awareness and sensitization interventions around climate smart SWM.
Efforts to reduce emissions from SWM services will be enhanced once implementation of activities
under component 1&2 is fast tracked
The growth in the number of CBEs from 14 at Baseline to 40 at Mid-Term has expanded livelihood
opportunities for the urban poor. Workers employed by CBEs have grown from 299 at Baseline to 381
at Mid-Term, with more women employed (improved from 27% to 31%). Majority of the workers
employed by the CBEs (70%) are Youth and selected from local communities.
To what extent has the Project Supported National and Local Government, the private sector, and
urban poor communities in building effective climate adaptation systems at all levels?
The feasibility studies identified the need of a National Waste Management Policy to regulate the Waste
Sector, this is currently under development, with the draft shared with stakeholders for review.
Recycling, Compositing and Sorting are approaches Government is adopting for waste minimization.
The Project has built capacity of Local Government and Private Sector players. A total of 70 workers
from 40 CBEs have been trained on SWM and EPA compliance mechanisms regarding Environmental
Protection, while 64 community leaders have been trained on 4R and educated on the importance of
utilizing CBE services at household level, benefits of proper waste disposal and the adverse effects of
improper disposal of Waste on the environment. At community level, as part of the Project’s Education
Campaign for schools on climate change and 4R, 8 schools have been reached with awareness
campaigns and outreach activities. Within the schools, the Project has supported the establishment of
Environmental Clubs, majorly targeting Youth to increase awareness on climate smart behavior.

CITIES ALLIANCE – PSWM PROJECT Mid-Term Evaluation – Final Report
Divalon Enterprises Limited 46 June 4th 2020
3.5.2 Effectiveness:
Overall, more efforts need to be invested to attain Project Objectives although these are subjected to
risks beyond the control of the Programme, for instance the Zogos and the deteriorating economic
situation. Attainment of Intermediate outcomes 1&2 requires rethinking and coming up with modalities
that will address the implementation bottlenecks highlighted. Efforts in attainment of Intermediate
outcome 3 are commendable, the Project is on track to attain this outcome. Attainment of
intermediate outcome 4 is within the control of the project, however pending activities need to be fast
tracked.
Evaluation Question: To what extent will the Project be likely to achieve its deliverables with the
current structure model?
To a large extent, the Model supports attainment of the Project deliverables. Working with key
government agencies such WASH Commission, EPA, Ministry of Internal Affairs and City Corporations,
and the private sector (CBEs) provides a platform for enhancing climate resilient waste management
services. The effectiveness of the model is however directly linked with designed interventions being
implemented on schedule and plan, therefore need to fast track implementation of pending activities.
Like any other business enterprise, survival of CBEs requires that they are able to generate adequate
revenues to finance their day-to-day operations. There is need to make it mandatory for households to
pay for waste collection services so that CBEs can rise enough revenue to sustain their operations.
Evaluation Question: How effective is the Programme design and coherence including the design of the
log frame matrix/ Programme theory and present the underlying theory of change and its assumptions?
The design of the Project is to a large extent considered effective and coherent. It brings together
players and actors in the Waste Sector and leverages the Country Programme with strong established
partnerships and networks. The design however, did not take into consideration the number of skip
buckets available at community level and their capacity to accommodate the garbage collected.
The Project has a well-structured log frame that provides a streamlined linear interpretation of the
Project’s planned use of resources and its desired ends. It clearly highlights the logical linkages between
intended inputs, planned activities and expected results. An Integrated M&E Plan is in place, defining
M&E processes, including measurement of output, outcome and Impact Level Indicators for both the
Country Programme and the PSWM Project.
Theories of Change for the Country Programme and PSWM Project have been twinned, therefore not
clear how intended results are to be achieved. While efforts are commended for having an integrated
M&E Plan, there is need to separate the Theories of Change as is with the logical frameworks.
CITIES ALLIANCE – PSWM PROJECT Mid-Term Evaluation – Final Report
Divalon Enterprises Limited 47 June 4th 2020
To what extent has the Project built an inclusive, safe, resilient, and sustainable ecosystem around the
sector to test, refine, replicate, and scale precedence-setting SWM technologies?
The Project works with a number of stakeholders dealing with Primary and Secondary Waste
management, and those working on the Eco system within Greater Monrovia. In terms of inclusiveness,
the Project works with the EPA, WASH commission, Ministry of Internal Affairs and City Corporations.
In terms of the resilience and sustainable ecosystems, the Project intends to bring on board SMEs to
engage in compositing and recycling interventions, making the Model sustainable. Regarding replication
of the Model, the Model is replicable. Before the IMPAC project, the CBE model was not in place. It
was first implemented by MCC during the IMPAC project in 2009 and has now been replicated in PCC.
Evaluation Question: What were the major factors influencing the achievement or non-achievement of
the outcome, intermediate outcomes, expected results and outputs?
Several factors have facilitated attainment of observed successes. The Project leverages the Country
Programme with well-established partnerships with GoL, City Governments, Local Governments and
communities, adopts a Community-led implementation approach to ensure community inclusiveness,
and has a strong Programme Steering Committee. Strengthening the platform that brings together
players in SWM to discuss and deliberate issues that affect the sector has been key to the observed
successes. The Project found an organized CBEs network, with an umbrella association, NACOBE.
Because the CBEs were already organized, this enabled ease entry into working with them. Enhanced
communication and visibility has been central in successes around awareness and sensitization
Several factors could explain the low progress towards attainment of Project Results. The waste sector
in Greater Monrovia generally has several mounting constraints that need to be addressed by the GoL
and municipal authorities. Secondly, the CBE Model is facing stiff competition from the Zogos, there is
minimal recognition of CBEs by municipal authorities, particularly MCC, as vital players within the
waste sector, while implementation of critical activities lags behind schedule particularly in component
1&2. The current economic situation in the Country has also had a toll effect on the project’s progress,
while the resignation of the Solid Waste Specialist created vacuum in the technical team.
Which factors were beyond the control of the project?
The Piloting of the Zogo model by Monrovia City Corporation, which duplicated CBE interventions
provided stiff competition to the Model. Survival for the majority of the CBEs has long been in balance
because many of their clients had restored to using Zogos, which was beyond the control of the Project.
The Country’s economy has been challenged with rising inflation as a result of significant depreciation
of the Liberian dollar against the United States dollar. The economy has fallen further into the repressed
category since 2019 which has hampered Government’s ability to fully deliver services and meet other
obligations, but also made the business environment difficult, which has affected people’s earnings.
To what extent is climate change mitigation mainstreamed through the Programme actions/activities?

CITIES ALLIANCE – PSWM PROJECT Mid-Term Evaluation – Final Report
Divalon Enterprises Limited 48 June 4th 2020
It’s evident within the Project that the climate change mitigation is mainstreamed within the actions and
activities of the Project. The Projects supports activities of EPA and WASH Commission. These are
government agencies responsible for implementing resilient and sustainable climate change mitigation
measures. Through awareness creation campaigns, the Project is sensitizing communities about climate
change while the Project objectives align well with the NAP and the NDC result areas on climate
change, but also on SDG 7 (Affordable and Clean Energy).
3.5.3 Efficiency
Evaluation Question: To what degree was value for money prioritized during implementation?
The Project has conducted training in financial management for NACOBE, aimed at improving financial
management for their businesses, but also ensure that resources advanced by the project are used
optimally. The Project put in place robust financial management and accountability systems to ensure
resources are used economically during Project implementation. The robustness has however resulted in
a few delays and slowed down the pace of implementation, a case in point is the ECO Bank process.
With all the activities the Project implements, Cities Alliance goes through rigorous UNOPS procurement
processes to ensure competent contractors are hired at reasonable costs. Value for money clauses are
included in all Contractor contracts, prioritizing value for money. In construction Projects that will be
undertaken, all processes MUST conform to, and should be compliant with the UNOPS engineering
standards, which provide for high quality construction and value for money. In addition, the Project is
routinely audited to ensure compliance with controls instilled by Cities Alliance and the donor.
To what extent will the Project staff & task distribution influence achievement of Project results?
At inception, the staff composition catered for the Project Manager, M&E Specialist, Solid Waste
Specialist, Grants Officer and Finance Specialist. It didn’t have some technical staff on the team such as
the Capacity Building and Communications Specialist. Considering Cities Alliance was to do direct
implementation, this structure was not ideal to deliver Project results. In consultation with EU, the
structure was reviewed, and the above positions created. The workload may overwhelm due to the
vacuum created by Solid Waste Specialist, but once the vacancy is filled, the work is manageable.
3.5.4 Impact
Evaluation Question: What exactly has already changed in the lives of the Programme beneficiaries
(Households in slums, CBEs, City Corporations and Government)
The capacity building and training conducted for CBEs on Record Management has greatly improved
Records Management Practices. As a result of the training, CBEs maintain Records of Business
Transactions. CBE activities have also resulted into an increase in the Quantity of Waste collected
The Project has contributed to an increase in the proportion of households with planned forms of
garbage disposal in Greater Monrovia, increasing from 36% at baseline to 83% at mid-term,

CITIES ALLIANCE – PSWM PROJECT Mid-Term Evaluation – Final Report
Divalon Enterprises Limited 49 June 4th 2020
surpassing the 45% Life of Project (LOP) target. As a result, households have put in place storage and
disposal facilities within homes.
The Project has made substantial investments in awareness creation around Climate-Smart SWM, urban
health and environmental protection which have led to corresponding level of results - 87% of the
households sensitized found the sensitization campaigns beneficial and made changes in SWM at
household level. Best practices adopted include adopting waste reduction practices and improving
storage of wastes at Household.
3.5.5 Sustainability
Evaluation Question: To what extent will the Community Based Enterprise Model of primary Waste
Collection be sustainable and be scaled across Greater Monrovia?
The programme approach, has been documented to improve primary waste collection in a sustainable
manner. It is a good example of how city-community partnerships can deliver essential services to poor
communities in resource poor situations, including informal high-density townships. CBEs are locally
established and employ workers from within local communities.
CBEs through their umbrella organization NACOBE, are part of the Waste Sector TWG. This provides a
platform for sustaining their operations because of their role in the sector. However, the emergence of
Zogos within the waste sector not only provides stiff competition to the CBE Model but threatens the
survival considering that households are resorting to Zogos than the CBEs.
Evaluation Question: What needs to be done and/or improved to ensure institutional sustainability of
the Community Based Enterprises?
To enhance institutional sustainability of CBEs, there is need to recognize CBEs as vital players within
the Waste Sector in Liberia, particularly by MCC. There is also need to address the issues around CBE
capacity and operational challenges. Success of the CBE Models requires that CBEs are able to generate
adequate revenues to finance their day-to-day operations. There is need to make it mandatory for
households to pay for waste collection so that CBEs can rise revenue to sustain their businesses.
To what extent will the 4 project components be handed over to stakeholders?
Likelihood of handing over of Project components is high, however handover processes is affected by
critical activities lagging behind schedule. Continuity of the CBE model is guaranteed since they are well
organized, with an umbrella organization in NACOBE.
Handover for component 1&2 is highly likely. Likelihood of the Loan facility continuing is quite high
because it can be integrated into ECO Bank products or services, while the Composting and Recycling
stations and interventions can be handed over to municipal authorities. City Corporations have
Directorates of Solid Waste Management, interventions around SWM will likely be handed over to City
Corporations. With component 3, City Corporations have departments for Community Services, that
carry out awareness and sensitization and the Project is already engaging them.
CITIES ALLIANCE – PSWM PROJECT Mid-Term Evaluation – Final Report
Divalon Enterprises Limited 50 June 4th 2020
3.5.6 Equity
To what degree is gender equality evident in the structures, systems and results of the Project?
It's evident within the Project design, structures and implementation that gender is integrated.
Particularly, there has been growth in females employed by CBEs, increasing from 27% to 31%. It is
also observed that some of the CBEs are owned by Women, 30% of the Project technical staff are
women. The Project is creating awareness mainstreaming gender in all activities, while Cities Alliance
has zero tolerance policies to discrimination on any accounts, including gender. The M&E framework
has gender sensitive indicators, generating, analyzing and presenting gender disaggregated data.

CITIES ALLIANCE – PSWM PROJECT Mid-Term Evaluation – Final Report
Divalon Enterprises Limited 51 June 4th 2020
CHAPTER IV: SUCCESSES, CHALLENGES & AREAS OF FOCUS
4.1 Introduction
This Chapter presents consolidated achievements and successes at Mid-Term, further highlighting
challenges and the key areas of focus moving into the final 2 years of the Project.
4.2 Project Achievements and Successes
Strengthened Public-Private-Partnerships: The Project has strengthened Public-Private-Partnerships in
the Waste Sector in Greater Monrovia. Primary Solid Waste Collection is done by the private sector,
particularly CBEs, while the Secondary Waste Collection is managed by City Corporations.
Increased number of CBEs: The number of CBEs increased from 14 at baseline to 40 at Mid-Term to
improve access to sanitation within Greater Monrovia. The total number of communities served also
increased from 89 at baseline to 222 at Mid-Term, surpassing the LOP target of 105.
Expansion of the CBE model to PCC: The CBE Model started in Monrovia but has since been
replicated in Paynesville, with majority of the CBEs (30%) supported by the Project located in
Paynesville. PCC adopted this model following successes from Monrovia from the EMUS Project.
Capacity Building: Seventy (70) workers from 40 CBEs have been trained on SWM, Financial
Management, Records Management, and EPA Compliance mechanisms regarding Environmental
Protection. In addition, 64 community leaders have been trained on 4R, benefits proper waste
disposal and the adverse effects of improper waste disposal on the environment.
Awareness Creation and Outreach activities: Eight (8) schools have been reached with outreach and
awareness campaigns. Within the schools, the Project supported the establishment of Environmental
Clubs, majorly targeting Youth to increase awareness on climate smart SWM.
Tools and equipment to CBEs: The Project provided starter kits to 3 CBEs as a way of addressing
challenges around inadequate tools and equipment. These include tricycles, wheelbarrows, shovels,
rakes and masks. This support horizontal expansion of operations of the beneficiary CBEs.
Coordination Platform for Waste Sector Players in Greater Monrovia: The platform brings together
National Ministries, City Corporations, Local Government, private sector, and communities to
deliberate on addressing constraints to the mounting waste situation in Greater Monrovia. A series of
engagement meetings aimed at establishing partnerships, collaboration and synergies between Cities
Alliance, MCC, PCC, LIBA and NACOBE.
Leveraging the Country Programme: Project has benefited from the existing multi-stakeholder
partnerships existing under the LCP and community partners such Community Based Enterprises (CBEs),
street trader union and slum dweller savings forums who are active participants in the LCP.
Establishment of the Micro-finance facility: While the Loan and Grant facilities are not yet functional,
the Project has established a micro finance facility with ECO Bank to facilitate disbursement of loans.

CITIES ALLIANCE – PSWM PROJECT Mid-Term Evaluation – Final Report
Divalon Enterprises Limited 52 June 4th 2020
4.3 Challenges:
The waste sector in Greater Monrovia generally has several mounting constraints that need to be
addressed by the GoL and municipal authorities. These challenges have been elaborated under section
3.2.3 and have huge impact on attainment of intended results.
Minimal recognition of CBEs as vital players within the Waste Sector by City Corporations, particularly
MCC has affected success of the CBE Model. This further affected efforts to strengthen PPPs
Emergence of the Zogos: The Emergence Zogos, duplicating CBE activities has provided stiff
competition to the CBEs.
Lack of Solid Waste Management Policy: Liberia lacks a National Waste Management Policy, which
makes regulating the Sector challenging. Implementation of Waste Management activities are enforced
through City ordinances rather than National Policy.
Inadequate support from Monrovia City Corporation: This steams from the understanding that MCC
wanted to do direct implementation for both the Primary and Secondary SWM Projects. Awarding
the PSWM Project to Cities Alliances was not warmly received by MCC. The implementation of the
Zogo approach and duplication of the SWM TWG shows limited support to from MCC.
4.4 Key Areas of Focus for the final 2 Years:
Fast tracking the implementation of pending activities: Priority focus should be on ensuring that all
activities lagging behind are fast tracked. Particular focus should be interventions in component 1 &2
(Loan and Grant Facilities, and Compositing and Recycling Interventions). These have the potential to
turn around Project results and demonstrate better impact.
Enhancing Monitoring and Evaluation: There is need to enhance Performance Review and Lesson
Sharing meetings with the implementation team to assess progress. Monthly feedback meetings with
the technical team at Cities Alliance to garner support to speed up implementation.
Addressing challenges around CBE operational capacity: Existing CBE challenges do not support
attainment of vertical and horizontal expansion. Particular focus attention to these challenges is key in
attainment of Project deliverables.
Functionalizing the Primary-Secondary value chain: Focus should be on ensuring that duty bearers
along the value chain perform their roles. Failure for any player to implement their roles breakdowns
the entire chain and affects attainment of Project deliverables.
Additional investments in awareness creation and sensitization activities: Proper solid waste practices
require continues awareness and sensitization to change behavior. Investments made in awareness
creation have so far shown corresponding level of results. More investments need to be made in
awareness creation, particularly around the 4R. Because of the respect they commend in communities,
the Project may explore engaging Religious Leaders in sensitization campaigns.
CITIES ALLIANCE – PSWM PROJECT Mid-Term Evaluation – Final Report
Divalon Enterprises Limited 53 June 4th 2020
CHAPTER V: PROJECT MONITORING AND EVALUATION
5.1 Introduction
M&E is vital in assessing how well Project activities are being implemented and measuring the extent
to which the Project objectives are being attained. This section provides an analysis of the robustness
of the M&E processes, and the project’s ability to collect adequate information to monitor progress.
5.2 M&E Structure for the Project
The Country Office has a full time M&E Analyst responsible for providing M&E oversight to Projects
at the Country Office. He receives backstopping support from the M&E specialist based at Cities
Alliance’s head office in Brussels. The County Office structure is such that the M&E Analyst is part of
the Senior Management. The Project, however allocates a minimal budget to M&E activities, which is
less than 5% of the Project Budget, to support M&E activities including Evaluations (formative and
summative), strategic information, tools, training, data use and improvement of the existing system.
The M&E Analyst is responsible for the flow of Project information from partners and stakeholders to
the donors; also responsible for M&E planning and operationalization of the M&E plan for the
Project, ensuring the functionality of information systems and putting in place plans and systems to
monitor and evaluate the Project.
The Project has a well-structured log frame that provides a streamlined linear interpretation of the
Project’s planned use of resources and its desired ends. It clearly highlights the logical linkages between
intended inputs, planned activities and expected results. The set objectives are a clear reflection of the
outputs, defines and clearly identifies key activities, defines resource requirements, and ascertains the
Means of Verification.
An Integrated M&E Plan is available, defines how to Monitor and Evaluate the Project, a component
on the role of the Community in Monitoring and Evaluating performance is incorporated into the
plan. The Monitoring Evaluation and Learning Strategy for the Country Programme was strengthened
to enable Cities Alliance to more closely monitor and steer the project activities. A structured
Programme theory of change, Management Information System and data collection instruments have
been developed to support Programme Monitoring and Evaluation.
Measurement of output, outcome and Impact Level Indicators for both the Country Programme and
the PSWM Project are well articulated and mechanisms for communicating, disseminating and sharing
project learning are well established. The Project reports annually to EU, however activity reports are
submitted by the programme specialists to monitor and track activity implementation and Project
results routinely.
Program Evaluations: Evaluations are perceived important and Cities Alliance always evaluates the
Projects it implements (conducts Baseline Surveys, Mid- Term and End-Term Evaluations) and shares
reports with all stakeholders. The Project allocated budgets to cater for Evaluation studies.

CITIES ALLIANCE – PSWM PROJECT Mid-Term Evaluation – Final Report
Divalon Enterprises Limited 54 June 4th 2020
5.3 M&E Areas that can be Strengthened
i. The Theories of Change for both the Country Programme and the PSWM Project have been
twinned, therefore not clear on how the Project is expected to achieve the intended results within
the Theory of Change. While efforts are commended for having an integrated M&E Plan, there is
need to separate the Theories of Change. The M&E Plan can remain integrated, however, the two
theories should be separated, as is with the logical frames.
5.4 Proposed Revisions in Project Indicators
Table 24: Proposed Revisions in Project Indicators
SNO. Observation Proposed Change
1. o At outcome level, Project lacks an
indicator (s) to measure coverage of CBE
services at community level
Incorporate a new indicator “Percentage of
Households receiving PSW collection services
from CBEs in Greater Monrovia”
2. o Under Output 1.1, the indicator “Number
of CBEs that report improved revenue”
should be sharpened
Revise to “Percentage of CBEs that report
improved revenue”
May consider including it as an outcome
indicator
3 o Revision of indicator targets Targets for the following indicators to be
reviewed to ensure all CBEs are supported
o Number of loans provided to CBEs by the
Project
o Number of grants provided to CBEs by
the Project
o At outcome level % of recycled waste
going to landfill (organic & inorganic) is
beyond project scope. There are no
project interventions beyond the disposal
of waste in the skip buckets
% of recycled waste going to skip buckets
(organic & inorganic)

CITIES ALLIANCE – PSWM PROJECT Mid-Term Evaluation – Final Report
Divalon Enterprises Limited 55 June 4th 2020
CHAPTER VI: CONCLUSION AND RECOMMENDATIONS
6.1 Introduction
The foregoing chapters have presented and discussed the findings of the Mid-term Evaluation, key
achievements, lessons learned, the facilitators and barriers to achieving full scale results, and the key
areas of focus in the final 2 years. This final chapter draws some conclusions and makes
recommendations for improving Project performance in the final half of the Project.
6.2 Conclusion
While the Project is responding to some of the challenges in the Waste Sector in Greater Monrovia,
several challenges and gaps remain at mid-term, which have implication on the delivery of the Project
and the attainment of results. Empting of Skip buckets by municipal authorities remains a huge
challenge that affects CBE operations, and urgently needs to be resolved by municipal authorities.
Overall, efforts towards attainment of Project objectives need stepping-up. Results in Component 1&2
remain low due to critical activities lagging behind schedule, while the inefficiencies within the public
system have not helped to address access issues. Owing to the interrelatedness and interlinkage of
components 1&2, low performance in component 1 is affecting attainment of results in Component 2.
Attainment of results in component 3 is well on track. Substantial investments have been made in
awareness creation activities which has led to corresponding level of results. Working with school
age children as agents of change in their communities is a long term investment in changing behavior
of individuals and communities. Attainment of component 4 is within the control of the Project.
Focus should be on fast tracking implementation of pending activities, such as the development of the
Solid Waste Strategy which is part of the CDS.
The CBE Model faces stiff competition from Zogos, there is minimal recognition of CBEs by municipal
authorities, particularly MCC as vital players within the waste sector while challenges around CBE
operational capacity need to be addressed. A functional Primary-Secondary Waste Management value
chain is central to improving SWM in Greater Monrovia, therefore critical for all duty bearers to
perform their roles. While the Model can lead to attainment of deliverables, it’s effectiveness is
directly linked with designed interventions being implemented on schedule and on plan, therefore
Cities Alliance urgently needs to fast track implementation of activities that lag behind schedule.
6.3 Recommendations
6.3.1 Government
There is a need for improved funding for the city corporations. The lack of adequate budgetary
support by the GoL has restricted city corporations’ ability to expand SWM services. Government
should increase on allocations to MCC, PCC, EPA and the WASH Commission, but also ensure that
city authorities are supported firmly to improve revenue mobilization from local sources. Government
needs to fulfill its counterpart funding with Secondary SWM Project.
CITIES ALLIANCE – PSWM PROJECT Mid-Term Evaluation – Final Report
Divalon Enterprises Limited 56 June 4th 2020
Fast tracking the formulation of the Waste Management Policy and Strategy: Once in place, the policy
framework will guide municipal authorities as well as provide them with adequate legal support to
enforce their mandate in waste management. In addition, strict enforcement of existing laws on waste
disposal would also aid greatly in eradicating the negative attitude regarding waste disposal
with offenders receiving punishment.
Though waste management is a stated government priority, the subsector depends primarily on
donor financing. Citizens trust in service providers is largely broken and needs to be addressed to
rebuild the social contract of paying for solid waste collection. There is need to establish a policy to
enforce mandatory requirement of households to subscribe to CBEs. This will help CBEs increase their
revenue and prevent Zogos from encroaching on their revenue.
6.3.2 Cities Alliance
Expedite implementation of all activities that lag behind schedule, particularly activities in Component
1 and 2. Functionalizing the Loan Facility, Grant Facility and construction of Sorting, Compositing and
Recycling facilities should be given high priority. These are central interventions, if implemented will
create the desired impact.
Enhance efforts to reduce the per capita Solid Waste dumped in landfill. Diversion from landfills has
become a major driver for many SWM Projects, with some States, Cities and Municipalities operating
under legislative requirements for achieving specific diversion goals. Recycling and compositing are
critical in determining the actual diversion rates. These interventions not only reduce per capita waste
to landfills, but also generate life affirming livelihoods for the urban poor. The Project should design
incentives and awareness systems to motivate waste reduction, source-separation and reuse.
Monitoring and supervision of CBEs: Supervision and Monitoring CBE activities by NACOBE is weak,
needs to be strengthened. The Evaluation established that some CBE staff practice unhealthy waste
disposal practices. They dispose wastes in water bodies and non-gazatted places. Unless monitored
and supervised, such practices may gradually be seen to raise. We recommend reinstating Community
Management Team (CMTs) to Monitor and supervise CBEs at community level
6.3.3 City Authorities
Empting skips buckets regularly: Emptying skip buckets by City Corporations remains a big challenge
with Greater Monrovia. Authorities should work on addressing challenges around emptying skips.
Alternatively, City Corporations should permit CBEs to dump at transfer stations and landfills. This
will reduce the amount of waste that goes to the skip buckets.
In order to enhance effective planning and organization of waste management operations in Greater
Monrovia, there is the need to gather accurate data on the quantities, type and characteristics of
waste being generated. MCC and PCC should work on creation of a database on solid waste and
undertake regular investigations and research to generate accurate data on the waste situations with
the aim of facilitating waste planning and management.

CITIES ALLIANCE – PSWM PROJECT Mid-Term Evaluation – Final Report
Divalon Enterprises Limited 57 June 4th 2020
Strengthening Public-Private-Partnerships in delivery of SWM Services. Public-Private-Partnerships are
one of the proven approaches in better SWM efforts. The Project has demonstrated that Private
Sector engagement is vital in stimulating improvements in SWM and minimizing negative effects of
waste in poor communities. Sustainable processes however require co-operation between Public,
Private and citizen stakeholders. National & City Governments should strengthen and promote
sustainable, self-supporting partnerships with Partners and NACOBE/ CBEs.
Whilst the Pilot was suspended by MCC, they had already penetrated primary waste collection and
remain in operation in communities. These individuals cannot be ignored, need to be engaged by
municipal authorities, have them trained on basic SWM practices, supervise and monitor their
operations, and have them integrated into the CBE Sector, by having CBEs employ them.
6.3.4 Community-Based Enterprises
There are opportunities that NACOBE can explore to enhance the service delivery model of engaging
CBEs for primary waste collection. NACOBE, with support from the Project should explore the
possibility of adapting zoning laws to enhance competition, efficiency and effectives among CBEs by
re-dividing Greater Monrovia in well-defined zones (LGAs) and allocating specific zones (LGAS) to
specific CBEs for operation. This will increase service coverage and enhance accountability.
Only 34% of the CBEs expressed satisfaction with the way NACOBE is engaging authorities on issues
that affect their work. There is need for better engagement and representation of CBE interests by
NACOBE at National and City Government level, particularly in terms of recognition of CBEs as vital
private players within the Waste Sector; lobbying for opportunities for CBEs to access Finance and
Credit; address issues of harassment by city authorities particularly confiscation of CBE tools and
equipment, denying access to disposal sites (transfer stations), physical violence and extortion. There is
also need for NACOBE to advocate for a policy that makes it mandatory for households to pay for
waste collection services to enable CBEs collect adequate revenues to sustain their operations.
CBEs operations are primarily financed by a Primary Solid Waste Collection (PSWC) fee paid by
households in the communities served by the CBE. The individual CBE determines the fees, which in
many cases are negotiated on an individual basis with communities and households, and the service is
tailor-made to local conditions. There is need for NACOBE to work along with Municipal Authorities
to come up with a uniform fee to be charged to households than individual CBEs determining their
own fees. The fee should be standardized to all households across the 12 LGAs.
Some CBE staff were found to engage in non-environmentally friendly dumping practices such as
open dumping and dumping in wetlands and River streams. This is partly attributed to weak
supervision of CBE activities by NACOBE. We recommend that NACOBE strengthens Monitoring and
Supervision of CBE activities at Community level to ensure that CBEs and their staff are compliant
with waste disposal standards and protocols set by the Environmental Protection Agency

CITIES ALLIANCE – PSWM PROJECT Mid-Term Evaluation – Final Report
Divalon Enterprises Limited 58 June 4th 2020
Annex I: Progress against the Project Monitoring Framework
SNo Indicator
Baseline
Mid-Term
Target Gender
Year Value Target % Achiev’t Male Female
Goal: To contribute to poverty reduction and improve the quality of life while supporting Liberia’s carbon
neutrality agenda
Project Outcome: Greater Monrovia is serviced by a citywide integrated solid waste management system that
reduces greenhouse gas emission and enhances the city’s resilience against climate change and disease,
1 % households with planned
forms of garbage disposal in
selected communities of
Greater Monrovia.
2017 36% 83% 45%
2 % of recycled waste going to
landfill (organic & inorganic) 2017 33% 33% 25%
Intermediate Outcome/ Component I: Collect more waste: Improved access to sanitation through more
sustainable and efficient solid waste collection in Greater Monrovia
1.1
Percentage of Households
receiving PSW collection
services in Greater Monrovia
2017 36% 37% 45%
Output: 1.1 Improved Coverage and effectiveness through CBEs:
1.1.1
Number of CBEs registered
with MCC, PCC, NACOBE,
LIBA and are active in PSW.
2017 14 40 35 114%
1.1.2
Number of communities
served by CBEs in Greater
Monrovia
2017 89 222 105 211%
1.1.3 Number of loans provided
to CBEs by the Project 2017 0 0 35 0%
1.1.4 Number of grants provided
to CBEs by the Project 2017 0 0 35 0%
1.1.5 Number of people employed
by CBEs, by Gender 2017 299 381 330 115% 262 119
1.1.6 Number of CBEs that report
improved revenue. 2017 0 14 35 40%
1.1.7 Number of households
served by CBEs 2017 7,600 8,800 8,200 107%
Intermediate Outcome/Component 2: Extract and reuse plastic and organic matter: Reduced greenhouse gas
emission through improving extracting, sorting and re-use of solid waste in GM
2
Proportion of solid waste
sorted and recycled for re-
use at collection
2017 0% 0% 5%
Output 2.1 Feasibility Studies
2.1.1 Number of feasibility studies
conducted. 2017 0 3 3 100%

CITIES ALLIANCE – PSWM PROJECT Mid-Term Evaluation – Final Report
Divalon Enterprises Limited 59 June 4th 2020
SNo Indicator
Baseline
Mid-Term
Target Gender
Year Value Target % Achiev’t Male Female
Output 2.2 Recycling pilots: Sorting and Extracting
2.2.1
Number of CBEs and SMEs
supported (financial/
capacity) to enter the 4R
Market
2017 0 0 20 0%
2.2.2 Number of jobs created
through 4R 2017 0 0 40 0%
2.2.3 Number of sorting stations
supported 2017 0 0 3 0%
Output 2.3: Recycling Pilots: Plastics and composting manufacturing
2.3.1
Number of organic recycling
pilots established in selected
communities and schools.
2017 0 0 7 0%
2.3.2
Number of plastic recycling
pilots established in selected
communities and schools
2017 0 0 3 0%
Outcome/Component 3: Increased awareness and education on solid waste management: Improved
awareness of Climate Change and climate resilient solid Waste management in the GM population with a
focus on youth.
3
Proportion of households in
Greater Monrovia reached
by awareness campaigns on
solid waste management.
2017 0 15% 10%
Output 3.1: Education campaigns for schools on climate change and 3R
3.1.1 Number of schools reached
in awareness campaigns 2017 0 8 30 27%
3.1.2 Number of education
campaigns targeting schools 2017 0 3 3 100%
3.1.3
Number of youths reached in
awareness campaigns
disaggregated by sex
2017 0 360 9,600 4% 195 165
Output 3.2 Outreach activities for GM population, on climate change SWM and 3R, climate smart behavior
3.2.1
Number of outreach
activities to educate the
general populations about
the threat of climate change
2017 0 7 5 140%
3.2.2 Number of print publications
developed and disseminated 2017 0 1 5 20%
3.2.3
Number of audio/video
materials developed and
disseminated
2017 0 6 15 40%
Output 3.3 Pilot projects in schools and communities: demonstration projects
3.3.1
Number of 3R
demonstration projects in
selected schools of Greater
Monrovia
2017 0 5 10 50%
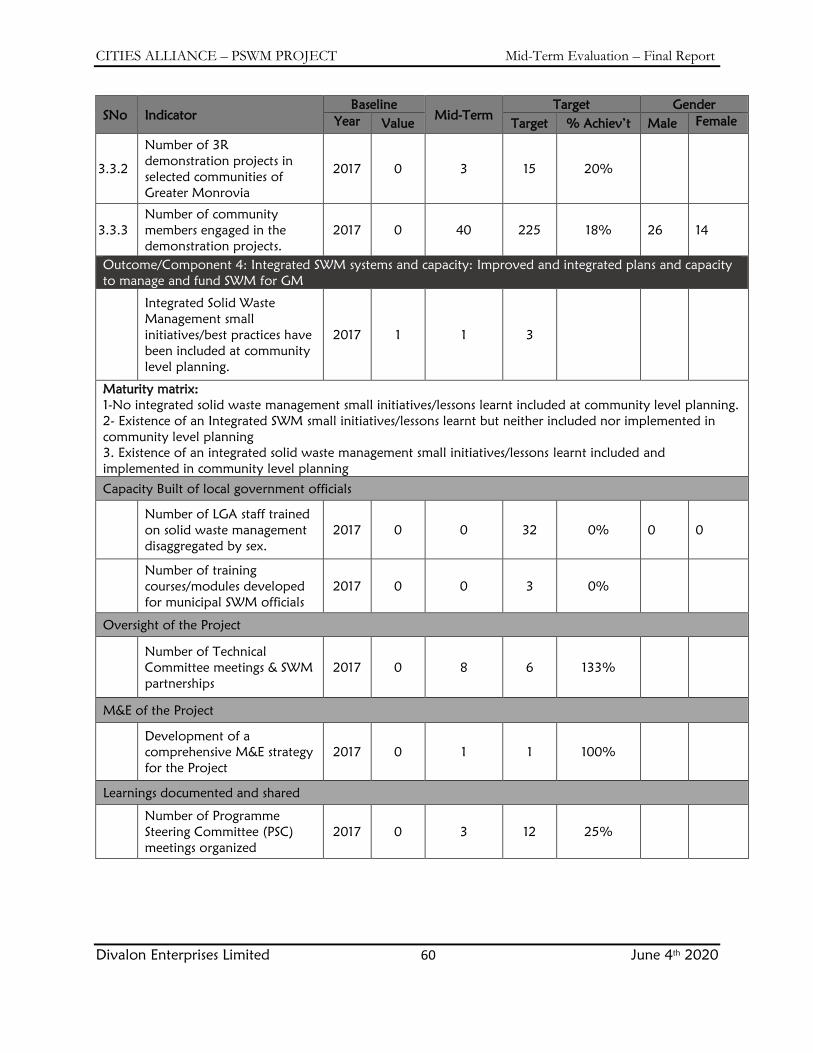
CITIES ALLIANCE – PSWM PROJECT Mid-Term Evaluation – Final Report
Divalon Enterprises Limited 60 June 4th 2020
SNo Indicator
Baseline
Mid-Term
Target Gender
Year Value Target % Achiev’t Male Female
3.3.2
Number of 3R
demonstration projects in
selected communities of
Greater Monrovia
2017 0 3 15 20%
3.3.3
Number of community
members engaged in the
demonstration projects.
2017 0 40 225 18% 26 14
Outcome/Component 4: Integrated SWM systems and capacity: Improved and integrated plans and capacity
to manage and fund SWM for GM
Integrated Solid Waste
Management small
initiatives/best practices have
been included at community
level planning.
2017 1 1 3
Maturity matrix:
1-No integrated solid waste management small initiatives/lessons learnt included at community level planning.
2- Existence of an Integrated SWM small initiatives/lessons learnt but neither included nor implemented in
community level planning
3. Existence of an integrated solid waste management small initiatives/lessons learnt included and
implemented in community level planning
Capacity Built of local government officials
Number of LGA staff trained
on solid waste management
disaggregated by sex.
2017 0 0 32 0% 0 0
Number of training
courses/modules developed
for municipal SWM officials
2017 0 0 3 0%
Oversight of the Project
Number of Technical
Committee meetings & SWM
partnerships
2017 0 8 6 133%
M&E of the Project
Development of a
comprehensive M&E strategy
for the Project
2017 0 1 1 100%
Learnings documented and shared
Number of Programme
Steering Committee (PSC)
meetings organized
2017 0 3 12 25%