Embed Size (px)
Citation preview

1
at the
Permanent Service for Mean Sea Level (PSMSL) National Oceanography Centre, Joseph Proudman Building,
6 Brownlow Street, Liverpool L3 5DA, UK www.psmsl.org
A member of the ICSU World Data System
Permanent Service for Mean Sea Level
(PSMSL) Annual Report 2016
1 Introduction ......................................................................................................................... 2
2 Mean Sea Level Data received during 2016 ....................................................................... 3
3 Interactive map showing long-term trends .......................................................................... 5
4 Changes to Mean Sea Level Time Series with some Mean Tide Level values .................. 6
5 Ellipsoidal Links for Revised Local Reference Data .......................................................... 6
6 Author Archive .................................................................................................................... 7
7 Number of Citations for PSMSL data series for the period 2012-2016 .............................. 7
8 Global Sea Level Observing System (GLOSS) Core Network Status ................................ 9
9 Data Archaeology in collaboration with GLOSS .............................................................. 10
10 Global Extreme Sea Level Analysis (GESLA) ............................................................... 11
11 Training and capacity building ........................................................................................ 12
12 Visitors to the PSMSL during 2016 ................................................................................ 12
13 National and International Meetings ............................................................................... 12
14 PSMSL Staff and Advisory Group ................................................................................. 13
15 Summary and forward look ............................................................................................. 14
Annex 1: Selected Papers published during 2016 ................................................................ 15
Annex 2: Stations received from individual countries ......................................................... 17
Annex 3: Data Suppliers 2016 ............................................................................................. 18
Annex 4: Acronyms ............................................................................................................. 19

2
1 Introduction The Permanent Service for Mean Sea Level (PSMSL) is the internationally recognised global sea level data bank for long-term sea level change information from tide gauges and bottom pressure recorders. Established in 1933 by Joseph Proudman, who became its first Secretary, the PSMSL is responsible for the collection, publication, analysis and interpretation of sea level data from the global network of tide gauges and also provides a wider Service to the sea level community. The PSMSL is embedded within the National Oceanography Centre (NOC) at Liverpool, and is funded by the UK Natural Environment Research Council (NERC, the parent body of NOC). The PSMSL also reports to the International Association for the Physical Sciences of the Oceans (IAPSO) and is a service of the International Association of Geodesy (IAG). PSMSL also has a key role in the Intergovernmental Oceanographic Commission's (IOC’s) Global Sea Level Observing System (GLOSS) and contributes to the IAG Global Geodetic Observing System (GGOS). Towards the end of 2015, the PSMSL was accepted as a regular member of the International Council for Science World Data System (ICSU-WDS). The ICSU-WDS has a rigorous application process and PSMSL was very pleased to gain membership to this interdisciplinary body, which means that the PSMSL is regarded as a trustworthy facility in terms of authenticity, integrity, confidentiality and data availability and services. The goal of the ICSU-WDS is to create and co-ordinate global ‘communities of excellence’ for scientific data services. The primary aim of the PSMSL is the provision of the global databank for long-term sea level information from tide gauges. PSMSL has continued to increase its efforts in this regard and over the last year over 2000 station-years of mean sea level data were entered into the PSMSL database, increasing the total PSMSL data holdings to over 65000 station-years from over 2200 stations. In addition, the PSMSL, together with the British Oceanographic Data Centre (BODC), is responsible for the archive of delayed-mode higher-frequency sea level data (e.g. hourly or higher frequency values) from the IOC's GLOSS Core Network. The PSMSL database contains monthly and annual mean values of sea level. The dataset and ancillary information are provided free of charge and are made available to the international scientific community through the PSMSL website (www.psmsl.org). Accompanying metadata includes station descriptions and their locations, types of instrumentation and, where available, frequency of data collection as well as notes on other issues of which users should be aware (e.g. earthquakes that are known to have occurred in the vicinity or subsidence due to local groundwater extraction). The free access to data by users is central to the PSMSL’s mission and conversely no supplier is ever paid for their data nor are licensing terms ever entered into. New products developed include relative sea level trend maps with associated uncertainty values; links with the Système d'Observation du Niveau des Eaux Littorales (SONEL) have been further enhanced to facilitate distribution of additional geodetic data; and data from in situ Ocean Bottom Pressure recorders from all possible sources are being made available through PSMSL. PSMSL, in collaboration with BODC, has also taken the lead in sea level data archaeology and rescue primarily through GLOSS. The PSMSL mailbox [email protected] responds to requests for information from national tide gauge agencies, decision makers (local councils, Parliamentary enquiries), the media and the general public.
3
2 Mean Sea Level Data received during 2016 Figure 1 shows the amount of data received by the PSMSL over the last 5 years indicating how many station years have been added to the database each year and from how many stations. The number of stations remains at about 800, but the number of station years can vary considerably from year to year. This may be due to a data provider reviewing and resupplying their historical dataset or if a backlog of data has been supplied. Figure 2 shows the stations which have provided data during 2016, or in 2015 (but not 2016).
Figure 1a: Number of station years added to the
PSMSL database during 2012-2016 Figure 1b: Number of stations with data added to
PSMSL database during 2012-2016
Figure 2: New data received by PSMSL during 2016
Figure 3 gives a more detailed view of the data held by PSMSL, indicating where data have been supplied in the past – in particular, the decline in the number of stations in the Arctic is noticeable. 777 stations have provided data from 2013 or later, with a further 196 providing data from 2010-2012. These (973 stations) can all be considered as active stations, but there are 987 stations for which no data have been supplied since before 1995. Some of these have undoubtedly ceased to operate; for others contact with the operators is being actively pursued. New stations are also coming on line providing near-real-time data for tsunami monitoring, but a number of these do not yet supply quality controlled mean sea level values to the PSMSL; these are also being sought to add to the dataset.

4
Whilst many geographic regions regularly supply mean sea level data (e.g. North America, Europe, Japan, Australia, New Zealand, South Africa, India), there are still gaps in data receipts from the Arctic and Antarctic, parts of South East Asia, South and Central America, and Africa; these are presently being targeted to try to improve data flow. African countries have received special attention through the Ocean Data and Information Network for Africa (ODINAfrica) projects and the Indian Ocean Tsunami Warning System (IOTWS); new tide gauges have been installed, but ongoing maintenance for some of these sites is a major issue. Although data flow has improved considerably over the last decade some of the gauges require a higher level of maintenance. To facilitate this close links are maintained with the University of Hawaii Sea Level Center (UHSLC) and other international sea level data centres.
Figure 3: Year of most recent data received by PSMSL In Figure 4 below, the uneven distribution of data supply is further illustrated; pale blue shows the data receipts from the Northern Hemisphere while the dark blue area of the plot shows the data receipts from the Southern Hemisphere.
Figure 4: North-south hemisphere distribution of data received by PSMSL

5
The distribution of the longest time series also reflects this, as shown in Figure 5. The Southern Hemisphere has only a small number of time series of over 100 years; most are found in the Northern Hemisphere. Overall western Europe, North America and Japan have most of the longest records, and also have a high proportion of records of 50 to 100 years, although Australia, New Zealand, South Africa, Chile and Argentina also have a number of records of this length. The Arctic and Antarctic have very few records of greater than 50 years, and a number of the Russian Arctic tide gauges are no longer operational.
Figure 5: Distribution of long tide gauge records
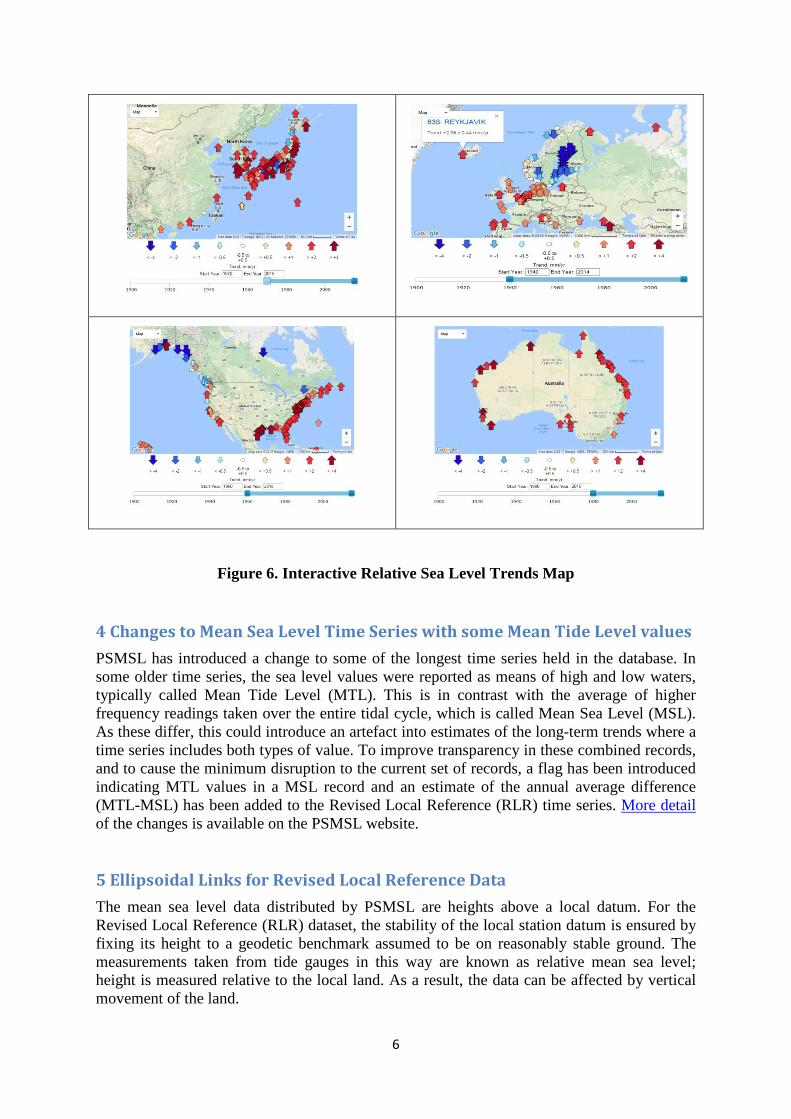
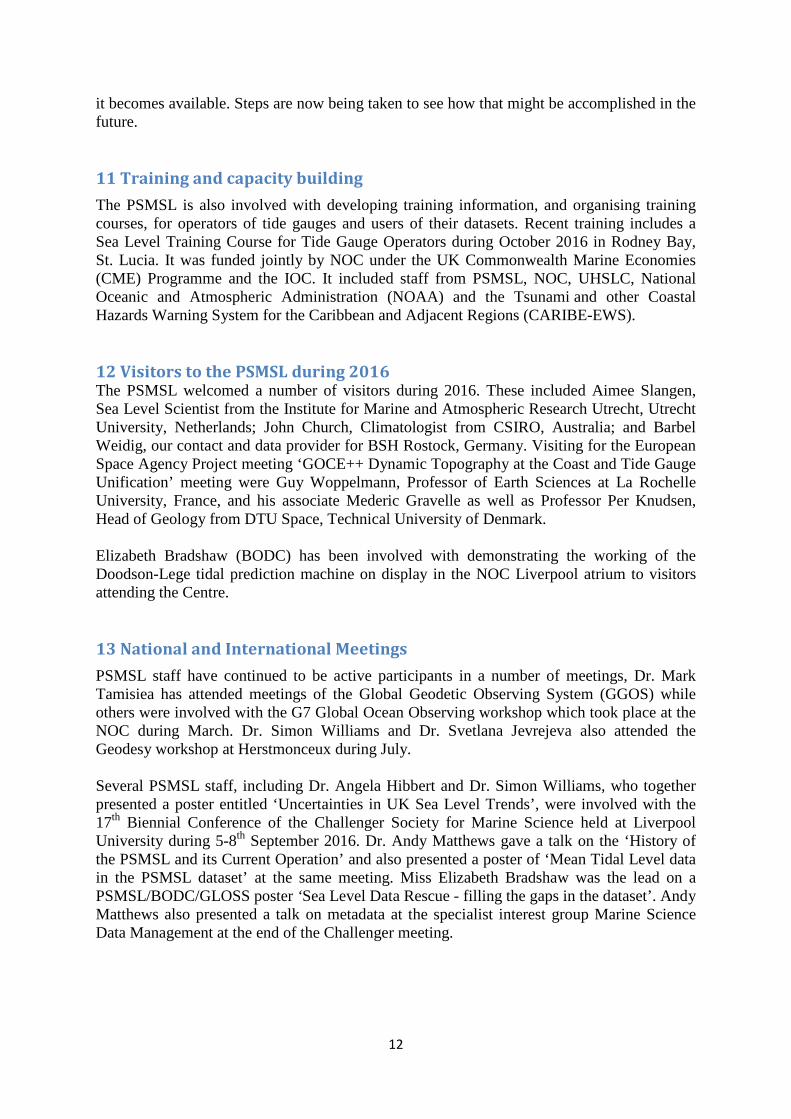
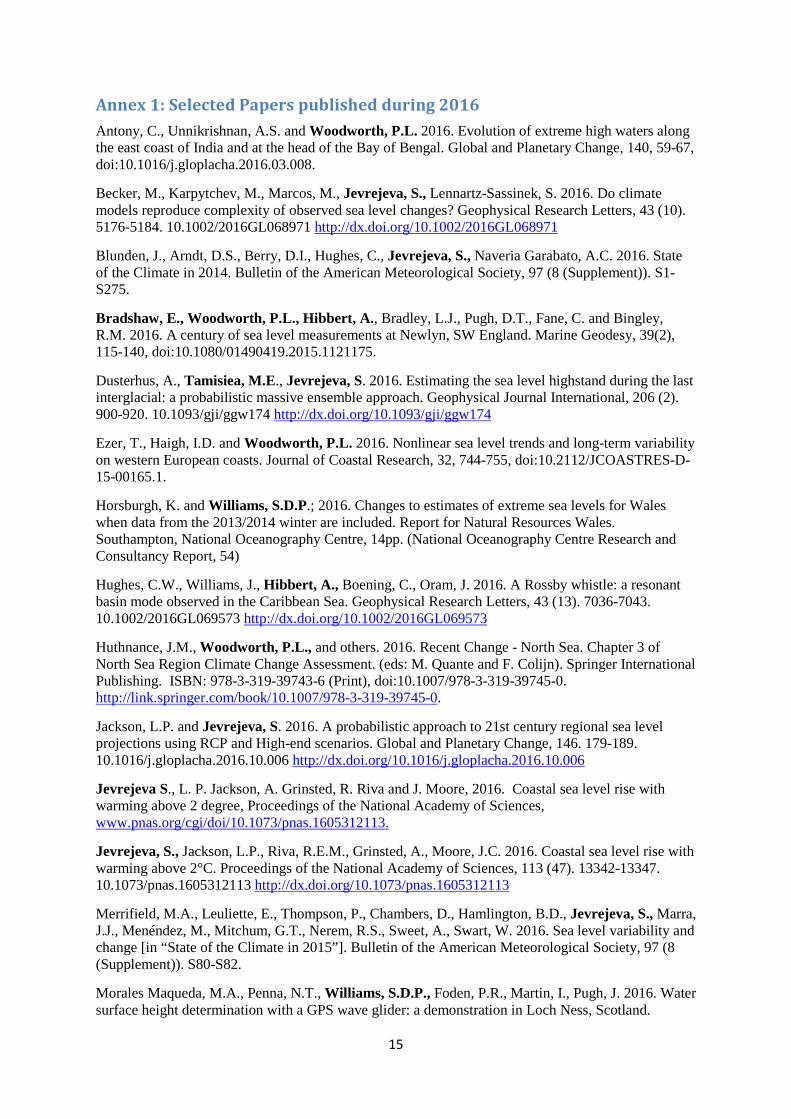
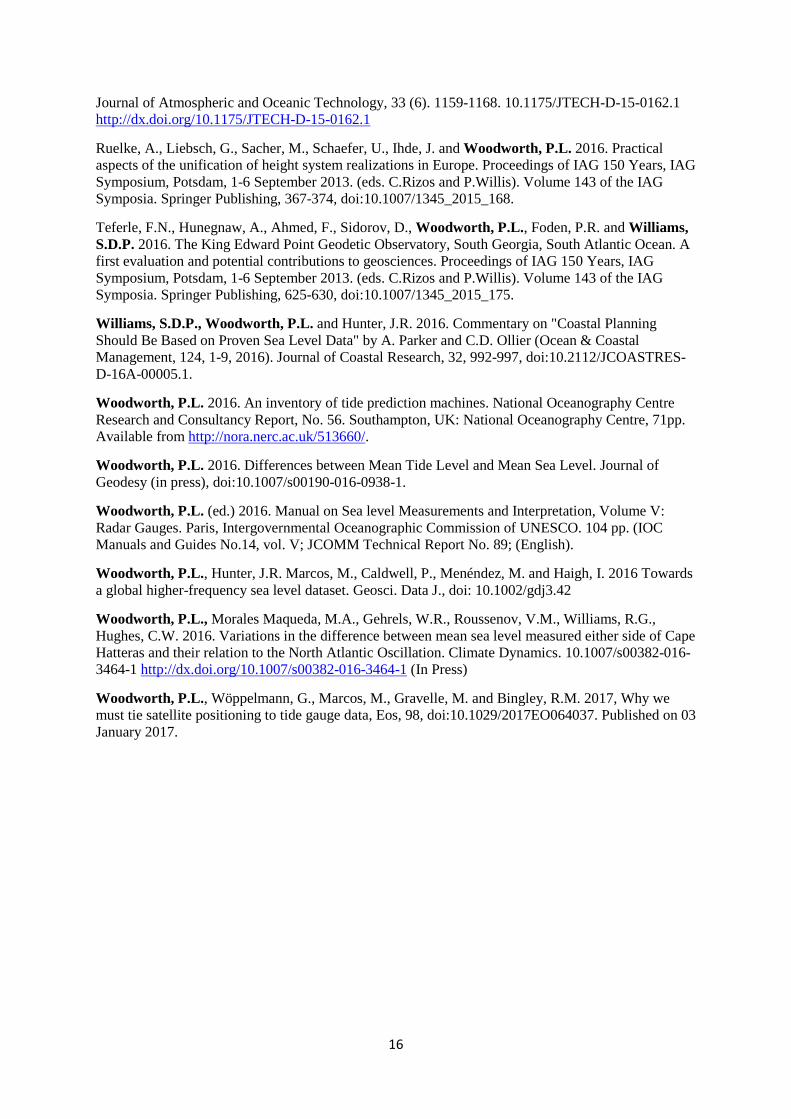
3 Interactive map showing long-term trends The web pages illustrating the trends in the tide gauge dataset have been updated with the 10 January 2017 release of the dataset. Links with SONEL have been further developed to facilitate distribution of additional geodetic data. With this year's update, which includes the new data obtained during 2016, a new method of determining the trends was introduced. Details are given on the Methods page of the PSMSL website (http://www.psmsl.org/products/trends/methods.php). The new method takes into account that the variability in the tide gauge time series may not be independently random, but may be correlated over different time spans. This correlated variability can decrease our ability to determine if a long-term trend in sea level is occurring at the tide gauge, or in other words, increase our uncertainty in the estimated trend. The pop-up boxes for each tide gauge shown on the trends map now include an uncertainty estimate. Both the estimated trend and the uncertainty will change as one changes the time span chosen by moving the sliders. Secondly, in order to calculate these results, monthly means are now used instead of annual means. Example trend maps are shown below (Figure 6).
6
Figure 6. Interactive Relative Sea Level Trends Map 4 Changes to Mean Sea Level Time Series with some Mean Tide Level values PSMSL has introduced a change to some of the longest time series held in the database. In some older time series, the sea level values were reported as means of high and low waters, typically called Mean Tide Level (MTL). This is in contrast with the average of higher frequency readings taken over the entire tidal cycle, which is called Mean Sea Level (MSL). As these differ, this could introduce an artefact into estimates of the long-term trends where a time series includes both types of value. To improve transparency in these combined records, and to cause the minimum disruption to the current set of records, a flag has been introduced indicating MTL values in a MSL record and an estimate of the annual average difference (MTL-MSL) has been added to the Revised Local Reference (RLR) time series. More detail of the changes is available on the PSMSL website.
5 Ellipsoidal Links for Revised Local Reference Data The mean sea level data distributed by PSMSL are heights above a local datum. For the Revised Local Reference (RLR) dataset, the stability of the local station datum is ensured by fixing its height to a geodetic benchmark assumed to be on reasonably stable ground. The measurements taken from tide gauges in this way are known as relative mean sea level; height is measured relative to the local land. As a result, the data can be affected by vertical movement of the land.

7
For some analyses we may wish to attempt to remove the land movement signal from the tide gauge record, for example, for reconstruction of historical global mean sea level, or to compare sea level measured by tide gauges with sea level measured by satellite altimetry. One solution to both of these cases is to use continuous Global Navigation Satellite System (GNSS) measurements from a receiver located near the tide gauge. The GNSS receiver measures heights relative to an ellipsoid and can be used to estimate the rate of vertical movement of the local land mass. The tide gauge datum can be associated with these estimates if routine geodetic levelling campaigns are carried out between the tide gauge benchmark and the GNSS receiver. PSMSL have been working in collaboration with colleagues at SONEL, the GLOSS data centre for GNSS measurements, to make it easier to connect PSMSL RLR data with SONEL's GNSS data. Where a link to a GNSS receiver can be established, the PSMSL information section of the station page will note that a link to the ellipsoid is available. The reference ellipsoid used for the University of La Rochelle GPS solutions is GRS80. 6 Author Archive During 2016, Peter Hogarth has liaised with Prof. Philip Woodworth to work on some of the historic data series available through the PSMSL. As a result, he has recently published an article in Journal of Geophysical Research investigating acceleration of sea level rise. In the course of this research, he has extended the tide gauge time series available for several locations. He has made available to us his extensive notes and the additional data. 7 Number of Citations for PSMSL data series for the period 2012-2016 Annually we collate statistics on the number of peer-reviewed published papers that use the PSMSL dataset. We do this in a number of ways. Firstly, we find papers that have cited either Holgate et al [2013] or Woodworth and Player [2003] in Web of Science and Scopus (the upper section of Figure 7 below shows the number of citations per year for these two papers from 2004 onwards). Not all papers will have cited either of these papers so we also perform full text searches for “PSMSL” or “Permanent Service”. These papers are then manually filtered to remove any papers that are not actually referring to PSMSL. We note that it is very easy to miss papers that use our dataset but have not referred to us directly so our statistics are likely to be biased low. Figure 7 (lower section) below shows the statistics for the last five years. There are over 330 papers in 97 distinct journals ranging from a variety of subject areas including oceanography, quaternary research, geodesy, climate, environment and multidisciplinary. The top three journals in terms of total publications are Global and Planetary Change (20; JCR impact factor 3.548); Geophysical Research Letters (29; JCR impact factor 4.456) and Journal of Geophysical Research (59; JCR impact factor 3.318). Other notable citations come from Nature (2; IF 38.138), Nature Communications (2; IF 11.329), PNAS (1; 9.423), and Reviews of Geophysics (1; 11.444). There were over 61 citations in journals with impact factors greater than 4. Overall, we have seen the number of citations increase every year to around 70 citations per year.

8
Figure 7: Statistics of PSMSL Data Set Citations

9
8 Global Sea Level Observing System (GLOSS) Core Network Status The Global Sea Level Observing System (GLOSS) was established by the Intergovernmental Oceanographic Commission (IOC) in 1985 to provide coordination for global and regional sea level networks in support of, and with direction from, the oceanographic and climate research communities. Various tide gauge networks have contributed to GLOSS, each with a different focus and each changing over time as research and operational priorities evolve. The main component is the GLOSS Core Network (GCN), a global set of 290 tide gauge stations (Figure 8) that serves as the backbone of the global in situ sea level network. The network is designed to provide an approximately evenly distributed sampling of global coastal sea level variation. Ideally, each station should provide data on a variety of timescales for use in different applications; for example, real-time data can be useful for tsunami monitoring, whereas monthly and annual mean data can be used to monitor long-term changes in sea level. In addition, sites should also be fitted with GNSS equipment to monitor land movement at or near the site. Further information on GLOSS is available in the GLOSS Implementation Plan 2012 and on the GLOSS web-site (www.gloss-sealevel.org).
Figure 8. GLOSS Core Network
For many years PSMSL has produced maps showing the status of the Core Network from its perspective, and more recently has been generating additional maps, automatically updated weekly, showing the status for the other GLOSS data streams (e.g. real-time, fast-mode, delayed-mode and TIGA/GNSS). Figure 9 presents how PSMSL currently sees the status of the GLOSS Core Network. The map indicates whether a station is considered currently operational (green marker), has been operational in the past (orange marker), or has never operated successfully (white marker).

10
Figure 9. GLOSS Status from a PSMSL perspective 9 Data Archaeology in collaboration with GLOSS PSMSL has also taken the lead in data archaeology through the IOC GLOSS programme. Many historical tide gauge data still exist in non-digital form. These mostly paper-based datasets are of great potential value to the sea level community for a range of applications, the most obvious being the extension of existing sea level time series as far back as possible in order to understand more completely the timescales of sea level change. Figure 10 illustrates the results of a number of data rescue projects undertaken by various sea level groups worldwide, some of which include data going back to dates prior to 1850. The GLOSS data archaeology sub-group, under the leadership of Elizabeth Bradshaw, is collating tools and guidelines for the scanning, digitising and quality control of historical tide gauge charts and sea level ledgers. In the future, coordination of a tide gauge data rescue project with the Atmospheric Circulation Reconstructions over the Earth (ACRE) programme (carrying out rescue of air pressure data) could result in interesting synergies. The other major form of analogue sea level data is handwritten ledgers. Transcribing these is labour intensive and usually undertaken by people entering numbers by hand. GLOSS is exploring other methods for use in the future; one possibility is to have a Citizen Science approach as with the OldWeather project run in partnership with ACRE. An alternative approach is to investigate the adaption of Handwritten Text Recognition technology for use with handwritten tide gauge ledgers.

11
Figure 10: GLOSS Tide Gauge Data Archaeology
10 Global Extreme Sea Level Analysis (GESLA) The Global Extreme Sea Level Analysis (GESLA) project grew out of the interest of several people in learning more about changes in the frequency and magnitude of extreme sea levels. The first GESLA dataset (GESLA-1) was assembled by Philip Woodworth (National Oceanography Centre, Liverpool), Melisa Menendez (University of Cantabria) and John Hunter (University of Tasmania) around 2009 and contained a quasi-global set of ‘high frequency’ (i.e. hourly or more frequent) measurements of sea level from tide gauges around the world. GESLA-1 was used first in a study of sea level extremes by Woodworth and Menendez (JGR, 2010). It has since been used in a number of other published studies of extremes including the Intergovernmental Panel on Climate Change (IPCC) Fifth Assessment Report. After some years it became apparent that GESLA-1 needed updating, which has resulted in the present GESLA-2 dataset comprising 37000 station years of information from 1300 stations (as of February 2016). The three original people have been joined in GESLA by Marta Marcos (University of the Balearic Islands) and Ivan Haigh (University of Southampton). It can be seen that, while the study of extreme sea levels has been the main interest, the availability of as large a quasi-global sea level dataset as possible enables many other types of study, such as changes in ocean tides. The oceanographic community needs a global dataset such as GESLA, that is regularly updated and extended to include new historic data as
12
it becomes available. Steps are now being taken to see how that might be accomplished in the future. 11 Training and capacity building The PSMSL is also involved with developing training information, and organising training courses, for operators of tide gauges and users of their datasets. Recent training includes a Sea Level Training Course for Tide Gauge Operators during October 2016 in Rodney Bay, St. Lucia. It was funded jointly by NOC under the UK Commonwealth Marine Economies (CME) Programme and the IOC. It included staff from PSMSL, NOC, UHSLC, National Oceanic and Atmospheric Administration (NOAA) and the Tsunami and other Coastal Hazards Warning System for the Caribbean and Adjacent Regions (CARIBE-EWS). 12 Visitors to the PSMSL during 2016 The PSMSL welcomed a number of visitors during 2016. These included Aimee Slangen, Sea Level Scientist from the Institute for Marine and Atmospheric Research Utrecht, Utrecht University, Netherlands; John Church, Climatologist from CSIRO, Australia; and Barbel Weidig, our contact and data provider for BSH Rostock, Germany. Visiting for the European Space Agency Project meeting ‘GOCE++ Dynamic Topography at the Coast and Tide Gauge Unification’ meeting were Guy Woppelmann, Professor of Earth Sciences at La Rochelle University, France, and his associate Mederic Gravelle as well as Professor Per Knudsen, Head of Geology from DTU Space, Technical University of Denmark. Elizabeth Bradshaw (BODC) has been involved with demonstrating the working of the Doodson-Lege tidal prediction machine on display in the NOC Liverpool atrium to visitors attending the Centre. 13 National and International Meetings PSMSL staff have continued to be active participants in a number of meetings, Dr. Mark Tamisiea has attended meetings of the Global Geodetic Observing System (GGOS) while others were involved with the G7 Global Ocean Observing workshop which took place at the NOC during March. Dr. Simon Williams and Dr. Svetlana Jevrejeva also attended the Geodesy workshop at Herstmonceux during July. Several PSMSL staff, including Dr. Angela Hibbert and Dr. Simon Williams, who together presented a poster entitled ‘Uncertainties in UK Sea Level Trends’, were involved with the 17th Biennial Conference of the Challenger Society for Marine Science held at Liverpool University during 5-8th September 2016. Dr. Andy Matthews gave a talk on the ‘History of the PSMSL and its Current Operation’ and also presented a poster of ‘Mean Tidal Level data in the PSMSL dataset’ at the same meeting. Miss Elizabeth Bradshaw was the lead on a PSMSL/BODC/GLOSS poster ‘Sea Level Data Rescue - filling the gaps in the dataset’. Andy Matthews also presented a talk on metadata at the specialist interest group Marine Science Data Management at the end of the Challenger meeting.

13
Elizabeth Bradshaw was invited to represent and deliver an overview presentation of GLOSS at the EU funded HYDRALAB+ project event held at the Institute of Hydro-engineering of Polish Academy of Sciences, Gdansk, Poland in September. At the International Conference of Marine Data and Information Systems (IMDIS) conference in Gdansk Poland in October, Andy Matthews gave a similar metadata presentation. Elizabeth Bradshaw presented a poster on ‘The future for the Global Sea Level Observing System (GLOSS) Sea Level Data Rescue’. During November Andy Matthews together with Elizabeth Bradshaw attended the Ocean Surface Topography Science Team Meeting (OSTST) at the La Rochelle University gave a joint talk on metadata standardization at the International Workshop on Sea Level Measurement Technologies held by the EuroGOOS Tide Gauge Task Team. Andy Matthews also presented a poster about the PSMSL and links with GNSS data from SONEL. Angela Hibbert also supplied a poster at the same meeting and attended a Chartered Institute of Ecology and Environmental Management (CIEEM) meeting in London about the Southern Ocean. PSMSL staff were also involved when the NERC research vessel RRS Discovery was moored on the Liverpool Waterfront for a showcase event ‘Into the Blue’ during 4-7th October, among those visiting the ship were local public, schools and businesses. This is only the second time the ship has visited Liverpool. Dr. Lesley Rickards is a member of the ICSU World Data System Scientific Committee and chairs the sub-committee on Membership and Accreditation. She has been closely involved in the development and implementation of the accreditation criteria. This has led to co-chairing a joint working group between the World Data System and the Data Seal of Approval, under the auspices of the Research Data Alliance (RDA), as the two organisations harmonise the catalogues of criteria for a basic level of certification. She has attended two RDA meetings, the 8th Plenary in Tokyo and a UK RDA meeting in Birmingham, UK, to promote the agreed certification. 14 PSMSL Staff and Advisory Group Funding for PSMSL comes from NERC via NOC. During 2016 this was approximately equivalent to 3 full time staff, but in reality all of those listed in the table below have contributed to PSMSL, and as ever, we are grateful to others in the NOC Sea Level and Technology Groups who contribute to or represent PSMSL at meetings, conferences, or other fora. We said goodbye to Mark Tamisiea who left PSMSL to move back to the USA during the year. He has made a considerable contribution to PSMSL, for which we would like to thank him. We wish him well in his new role. Dr. Lesley Rickards, Director Dr. Svetlana Jevrejeva, Senior Scientist Mrs. Kathy Gordon, Data Manager Dr. Mark Tamisiea, Senior Scientist Dr. Andrew Matthews, Data Scientist Dr. Simon Williams, Senior Scientist Miss Elizabeth Bradshaw, Data Scientist, BODC
Dr Angela Hibbert, Scientist Prof. Philip Woodworth, Scientific Advisor

14
The PSMSL is also served by an Advisory Group which at present consists of Dr. R. Neilan (JPL, USA), Prof. G. Mitchum (University of South Florida, USA), Dr. Guy Wöppelmann (Université de La Rochelle, France), Dr. P. Knudsen (Danish National Space Institute), Dr. R. Bingley (Nottingham University, UK), and Dr. T. Aarup (IOC, UNESCO).
15 Summary and forward look 2016 was another active year for PSMSL with regard to important workshops and conferences, and a busy one with regard to data acquisition and analysis. The functions provided by the PSMSL are in as much demand as ever, and new products continue to be developed and activities have expanded. Future plans include:
• Improved integration of the mean sea level dataset with higher frequency data and improving the quality of accompanying metadata;
• Keeping contact with data suppliers (the trend being to acquire data from websites rather than direct supply) and ensuring that data made available in real-time are also contributed to PSMSL;
• Continue collaboration with SONEL (IGS TIGA Working Group data centre) and with GGOS;
• Expansion of ocean bottom pressure record section and data; • Further develop data archaeology with the Group of Experts on GLOSS; • Redevelopment of capacity building/training material. • Contribute to WDS metadata catalogue and training pages • Mint a Digital Object Identifier (DOI) for PSMSL dataset (in collaboration with BODC) • Refreshing and further updating the PSMSL web-site
15
Annex 1: Selected Papers published during 2016 Antony, C., Unnikrishnan, A.S. and Woodworth, P.L. 2016. Evolution of extreme high waters along the east coast of India and at the head of the Bay of Bengal. Global and Planetary Change, 140, 59-67, doi:10.1016/j.gloplacha.2016.03.008.
Becker, M., Karpytchev, M., Marcos, M., Jevrejeva, S., Lennartz-Sassinek, S. 2016. Do climate models reproduce complexity of observed sea level changes? Geophysical Research Letters, 43 (10). 5176-5184. 10.1002/2016GL068971 http://dx.doi.org/10.1002/2016GL068971
Blunden, J., Arndt, D.S., Berry, D.I., Hughes, C., Jevrejeva, S., Naveria Garabato, A.C. 2016. State of the Climate in 2014. Bulletin of the American Meteorological Society, 97 (8 (Supplement)). S1-S275.
Bradshaw, E., Woodworth, P.L., Hibbert, A., Bradley, L.J., Pugh, D.T., Fane, C. and Bingley, R.M. 2016. A century of sea level measurements at Newlyn, SW England. Marine Geodesy, 39(2), 115-140, doi:10.1080/01490419.2015.1121175.
Dusterhus, A., Tamisiea, M.E., Jevrejeva, S. 2016. Estimating the sea level highstand during the last interglacial: a probabilistic massive ensemble approach. Geophysical Journal International, 206 (2). 900-920. 10.1093/gji/ggw174 http://dx.doi.org/10.1093/gji/ggw174
Ezer, T., Haigh, I.D. and Woodworth, P.L. 2016. Nonlinear sea level trends and long-term variability on western European coasts. Journal of Coastal Research, 32, 744-755, doi:10.2112/JCOASTRES-D-15-00165.1.
Horsburgh, K. and Williams, S.D.P.; 2016. Changes to estimates of extreme sea levels for Wales when data from the 2013/2014 winter are included. Report for Natural Resources Wales. Southampton, National Oceanography Centre, 14pp. (National Oceanography Centre Research and Consultancy Report, 54)
Hughes, C.W., Williams, J., Hibbert, A., Boening, C., Oram, J. 2016. A Rossby whistle: a resonant basin mode observed in the Caribbean Sea. Geophysical Research Letters, 43 (13). 7036-7043. 10.1002/2016GL069573 http://dx.doi.org/10.1002/2016GL069573
Huthnance, J.M., Woodworth, P.L., and others. 2016. Recent Change - North Sea. Chapter 3 of North Sea Region Climate Change Assessment. (eds: M. Quante and F. Colijn). Springer International Publishing. ISBN: 978-3-319-39743-6 (Print), doi:10.1007/978-3-319-39745-0. http://link.springer.com/book/10.1007/978-3-319-39745-0.
Jackson, L.P. and Jevrejeva, S. 2016. A probabilistic approach to 21st century regional sea level projections using RCP and High-end scenarios. Global and Planetary Change, 146. 179-189. 10.1016/j.gloplacha.2016.10.006 http://dx.doi.org/10.1016/j.gloplacha.2016.10.006
Jevrejeva S., L. P. Jackson, A. Grinsted, R. Riva and J. Moore, 2016. Coastal sea level rise with warming above 2 degree, Proceedings of the National Academy of Sciences, www.pnas.org/cgi/doi/10.1073/pnas.1605312113.
Jevrejeva, S., Jackson, L.P., Riva, R.E.M., Grinsted, A., Moore, J.C. 2016. Coastal sea level rise with warming above 2°C. Proceedings of the National Academy of Sciences, 113 (47). 13342-13347. 10.1073/pnas.1605312113 http://dx.doi.org/10.1073/pnas.1605312113
Merrifield, M.A., Leuliette, E., Thompson, P., Chambers, D., Hamlington, B.D., Jevrejeva, S., Marra, J.J., Menéndez, M., Mitchum, G.T., Nerem, R.S., Sweet, A., Swart, W. 2016. Sea level variability and change [in “State of the Climate in 2015”]. Bulletin of the American Meteorological Society, 97 (8 (Supplement)). S80-S82.
Morales Maqueda, M.A., Penna, N.T., Williams, S.D.P., Foden, P.R., Martin, I., Pugh, J. 2016. Water surface height determination with a GPS wave glider: a demonstration in Loch Ness, Scotland.
16
Journal of Atmospheric and Oceanic Technology, 33 (6). 1159-1168. 10.1175/JTECH-D-15-0162.1 http://dx.doi.org/10.1175/JTECH-D-15-0162.1
Ruelke, A., Liebsch, G., Sacher, M., Schaefer, U., Ihde, J. and Woodworth, P.L. 2016. Practical aspects of the unification of height system realizations in Europe. Proceedings of IAG 150 Years, IAG Symposium, Potsdam, 1-6 September 2013. (eds. C.Rizos and P.Willis). Volume 143 of the IAG Symposia. Springer Publishing, 367-374, doi:10.1007/1345_2015_168.
Teferle, F.N., Hunegnaw, A., Ahmed, F., Sidorov, D., Woodworth, P.L., Foden, P.R. and Williams, S.D.P. 2016. The King Edward Point Geodetic Observatory, South Georgia, South Atlantic Ocean. A first evaluation and potential contributions to geosciences. Proceedings of IAG 150 Years, IAG Symposium, Potsdam, 1-6 September 2013. (eds. C.Rizos and P.Willis). Volume 143 of the IAG Symposia. Springer Publishing, 625-630, doi:10.1007/1345_2015_175.
Williams, S.D.P., Woodworth, P.L. and Hunter, J.R. 2016. Commentary on "Coastal Planning Should Be Based on Proven Sea Level Data" by A. Parker and C.D. Ollier (Ocean & Coastal Management, 124, 1-9, 2016). Journal of Coastal Research, 32, 992-997, doi:10.2112/JCOASTRES-D-16A-00005.1.
Woodworth, P.L. 2016. An inventory of tide prediction machines. National Oceanography Centre Research and Consultancy Report, No. 56. Southampton, UK: National Oceanography Centre, 71pp. Available from http://nora.nerc.ac.uk/513660/.
Woodworth, P.L. 2016. Differences between Mean Tide Level and Mean Sea Level. Journal of Geodesy (in press), doi:10.1007/s00190-016-0938-1.
Woodworth, P.L. (ed.) 2016. Manual on Sea level Measurements and Interpretation, Volume V: Radar Gauges. Paris, Intergovernmental Oceanographic Commission of UNESCO. 104 pp. (IOC Manuals and Guides No.14, vol. V; JCOMM Technical Report No. 89; (English).
Woodworth, P.L., Hunter, J.R. Marcos, M., Caldwell, P., Menéndez, M. and Haigh, I. 2016 Towards a global higher-frequency sea level dataset. Geosci. Data J., doi: 10.1002/gdj3.42
Woodworth, P.L., Morales Maqueda, M.A., Gehrels, W.R., Roussenov, V.M., Williams, R.G., Hughes, C.W. 2016. Variations in the difference between mean sea level measured either side of Cape Hatteras and their relation to the North Atlantic Oscillation. Climate Dynamics. 10.1007/s00382-016-3464-1 http://dx.doi.org/10.1007/s00382-016-3464-1 (In Press)
Woodworth, P.L., Wöppelmann, G., Marcos, M., Gravelle, M. and Bingley, R.M. 2017, Why we must tie satellite positioning to tide gauge data, Eos, 98, doi:10.1029/2017EO064037. Published on 03 January 2017.

17
Annex 2: Stations received from individual countries
American Samoa 1 Martinique 1 Antarctica 1 Mauritius 2 Argentina 1 Mayotte 1 Australia 80 Micronesia, Federated States of 1 Belgium 3 Monaco 1 Bermuda 1 Myanmar 1 Canada 39 Namibia 2 Chile 12 Nauru 1 China 6 Netherlands 11 Cocos (Keeling) Islands 1 New Caledonia 5 Cook Islands 1 New Zealand 13 Croatia 5 Norway 23 Cuba 12 Panama 1 Fiji 2 Papua New Guinea 1 France 32 Philippines 21 French Guiana 2 Portugal 3 French Polynesia 5 Puerto Rico 7 Georgia 2 Réunion 1 Germany 3 Russian Federation 4 Greece 17 Saint Pierre and Miquelon 1 Greenland 3 Samoa 1 Grenada 1 Singapore 10 Guadeloupe 1 Solomon Islands 1 Guam 2 South Africa 10 Hong Kong 6 Spain 44 Iceland 1 Svalbard and Jan Mayen 2 India 14 Sweden 23 Indonesia 1 Thailand 5 Isle of Man 1 Tonga 1 Israel 6 Tuvalu 1 Italy 33 United Kingdom 48 Japan 99 United States 116 Jersey 1 United States Minor Outlying Islands 1 Kiribati 1 Uruguay 1 Korea, Republic of 46 Vanuatu 1 Malaysia 18 Virgin Islands, U.S. 4 Malta 1 Wallis and Futuna 1 Marshall Islands 3

18
Annex 3: Data Suppliers 2016
Supplier Country No. of stations Servicio de Hidrografia Naval, Argentina Argentina 1 Australian Ocean Data Centre, NSW Australia 1 National Tidal Centre Australia 86 NSW Public Works Australia 10 Agency for Maritime and Coastal Services Belgium 3 Canadian Hydrographic Service Canada 39 Servicio Hidrografico y Oceanografico de la Armada (SHOA) Chile 12 National Oceanographic Data Centre China 6 Hidrografski Institut, Split Croatia 5 Cuban National Tidal Service Cuba 12 Danish National Space Center Denmark 3 Institut Geographique National, France France 1 Service Hyd. et Ocean. de la Marine (SHOM) France 50 Dept. of Oceanology and Meteorology, Georgia Georgia 2 Bundesamt fur Seeschifffahrt und Hydrographie, Hamburg Germany 3 Hellenic Navy Hydrographic Service Greece 17 Hong Kong Observatory Hong Kong 6 Icelandic Coast Guard - Hydrographic Department Iceland 1 Survey of India India 14 Survey of Israel Israel 6 Instituto Talassografico di Trieste Italy 1 ISPRA Italy 31 University of Ferrara Italy 1 Geographical Survey Institute Japan 25 Japan Meteorological Agency Japan 54 Japan Oceanographic Data Centre, MSA Japan 20 National Oceanographic Research Institute Korea, Republic of 46 Department of Survey and Mapping Malaysia 18 Malta Maritime Authority Malta 1 Meteo-France Martinique 1 Meteorological Services, Mauritius Mauritius 2 Rijkswaterstaat Netherlands 11 Land Information New Zealand (LINZ) New Zealand 12 Norwegian Hydrographic Service Norway 24 National Mapping And Resource Information Authority Philippines 21 Instituto Hidrografico, Lisbon Portugal 3 World Data Center B1 Russian Federation 5 Maritime Port Authority of Singapore Singapore 10 Directorate Of Hydrography, SA South Africa 12 Dr. Josep Pascual Massaguer Spain 1 Instituto Espanol de Oceanografia Spain 11 Puertos del Estado Spain 32 Swedish Met. and Hyd. Institute Sweden 23 Oceanographic Division, Hydrographic Department Thailand 5 Channel Coastal Observatory United Kingdom 10 National Oceanography Centre / Environment Agency United Kingdom 38 Port of London Authority United Kingdom 2 NOAA / NOS United States 133 Panama Canal Commission United States 1 University of Hawaii Sea Level Center (UHSLC) United States 4 Servicio de la Armada de Uruguay Uruguay 1

19
Annex 4: Acronyms
ACRE Atmospheric Circulation Reconstructions over the Earth BSH Bundesamt für Seeschifffahrt und Hydrographie (Federal Maritime and
Hydrographic Agency), Germany BODC British Oceanographic Data Centre CARIBE-EWS Tsunami and other Coastal Hazards Warning System for the Caribbean and
Adjacent Regions CIEEM Chartered Institute of Ecology and Environmental Management CME Commonwealth Marine Economies CSIRO Commonwealth Scientific and Industrial Research Organisation, Australia DOI Digital Object Identifier DTU Danmarks Tekniske Universitet (Technical University of Denmark) EuroGOOS European Global Ocean Observing System GCN GLOSS Core Network GESLA Global Extreme Sea Level Analysis GGOS Global Geodetic Observing System GLOSS Global Sea Level Observing System GNSS Global Navigation Satellite System GOCE Gravity field and steady-state Ocean Circulation Explorer GPS Global Positioning System IAG International Association of Geodesy IAPSO International Association for the Physical Sciences of the Oceans ICSU-WDS International Council for Science – World Data System IMDIS International Conference of Marine Data and Information Systems IGS International GNSS Service IOC Intergovernmental Oceanographic Commission IOTWS Indian Ocean Tsunami Warning System IPCC Intergovernmental Panel on Climate Change JCR Journal Citation Reports MSL Mean Sea Level MTL Mean Tide Level NERC Natural Environment Research Council NOAA National Oceanic and Atmospheric Administration, USA NOC National Oceanography Centre, UK ODINAfrica Ocean Data and Information Network for Africa OSTST Ocean Surface Topography Science Team Meeting PNAS Proceedings of the National Academy of Sciences of the USAmerica PSMSL Permanent Service for Mean Sea Level RDA Research Data Alliance RLR Revised Local Reference SONEL Système d'Observation du Niveau des Eaux Littorales TIGA IGS Working Group Tide Gauge Benchmark Monitoring Project UHSLC University of Hawaii Sea Level Center