Embed Size (px)
Citation preview

PSI Group ASA – Q2 and first half 2014 Page 1

PSI Group ASA – Q2 and first half 2014 Page 2
HIGHLIGHTS 2ND QUARTER 2014
RRev
Operating revenues: MNOK 196.8 (MNOK 198.6). o 32.0 per cent increase for PSI Technology to MNOK 119.1 (MNOK
90.2). CashGuard has increased the revenues with 18.9 per cent and SQS Security has increased the revenues with 10.3 per cent.
o 56.5 per cent decrease for PSI Retail to MNOK 38.8 (MNOK 89.1). The decline is related to the roll out of electronic shelf labels to Rema 1000 which was completed in summer 2013.
o 108.2 per cent increase for PSI Labels to MNOK 43.5 (MNOK 20.9). The increase comes from both the acquisition of businesses and organic growth.
EBITDA: MNOK 10.1 (MNOK 15.5) o MNOK 2.8 increased EBITDA for PSI Technology to MNOK 9.0
(MNOK 6.2). EBITDA includes MNOK – 0.3 from Vensafe.
o MNOK 10.6 decreased EBITDA for PSI Retail to MNOK 1.1 (MNOK 11.7).
o MNOK 2.2 increased EBITDA for PSI Labels to MNOK 2.4 (MNOK 0.2). EBITDA includes non-recurring expenses of MNOK 1.4 related to the merger in Sweden.
Cash flow from operational activities: MNOK -3.5 (MNOK 21.9) o Strong sales in May-June has resulted in increase of working capital
Two strategically important acquisitions: o Vensafe: PSI Technology gets yet another world-leading retail
technology in its portfolio of owned technologies.
o New Vision: Provides PSI a new geographic market in the Baltic, as well as a newly started business in Russia and Finland. This strengthens PSI Technology's distribution network, and gives PSI Retail important IT - and solution expertise within retail.

PSI Group ASA – Q2 and first half 2014 Page 3
Acquisitions of companies
PSI Group ASA has an ambitious strategy to develop the Group into a leading European retail group. This goal will be reached by offering customers an attractive product range in retail solutions, software solutions, services and service in more and more markets.
As a step towards this goal we have in the last quarter acquired two new businesses:
- Vensafe’s solutions fit well into PSI Group, both as a product in our company-owned distribution network
- New Vision adds new markets to PSI Group for sale of our own technology, which today consist of CashGuard,
In addition to the acquisitions, essentially resources are used on sales and marketing of CashGuard, Vensafe and SQS Security in increasing number of markets. CashGuard has in recent years strengthened its workforce in sales and marketing with 4 FTE, and SQS Security will in August get a new sales director and director of new markets.
(in Norway, Sweden, the Baltic, Finland and Russia), in addition it will be marketed together with CashGuard and SQS Security to dealers outside of our own distribution network .
Vensafe AS, a wholly owned subsidiary of PSI Group ASA through a private placement 8th April 2014 and is included in the business area PSI Technology as of April 2014. Vensafe is a Norwegian technology company, which develops and sells automated sales solutions goods exposed for theft in retail. Vensafe streamline store operations, reduce shrinkage and theft and help reduce working capital on a number of high value products. The most important markets as of today are Germany, Norway, Sweden and Belgium.
See www.vensafe.com for more information.
Vensafe and SQS Security. In addition, PSI Group will get important expertise in solutions and software aimed at retail, which we can use in our home markets in Norway and Sweden.
New Vision Baltija UAB, with its subsidiaries in the Baltic countries as well as Finland and Russia, became a wholly owned subsidiary of PSI Group ASA on 2 July 2014. The company is included in the business area PSI Retail as of July 2014. The company is an ambitious Baltic technology - and service company that specializes in delivering IT and business solutions to the retail industry. The company represents world leading suppliers of retail technology to the retail sector. The company also has strong expertise in software development, productivity increasing consulting expertise, as well as 24/7 service and support center for its customers.
See www.new-vision.com for more information.

PSI Group ASA – Q2 and first half 2014 Page 4
GROUP STRUCTURE
The Group has three business areas:
PSI Technology: Technology as the group itself develops under the brand names CashGuard, Vensafe and SQS Security. The figures in the business area show sales and profit generated by the technology products throughout the value chain within PSI Group.
PSI Retail: Sales and marketing of retail solutions and supplies, beyond the solutions reported in the PSI Technology. Besides sales of equipment, service and support, systems integration and consulting are major income elements.
PSI Labels: Design, production, sale and marketing of adhesive labels and corresponding printer / applicators.
THE GROUP
Results The Group generated operating revenues of MNOK 196.8 in the second quarter 2014, compared with MNOK 198.6 in the corresponding period in 2013. In the first half 2014 operating revenue was MNOK 370.0 compared with MNOK 385.4 in the first half 2013.
Operating profit before depreciation (EBITDA) was MNOK 10.1 (MNOK 15.5) in the second quarter. The second quarter includes MNOK 1.4 in non-recurring expenses related to the merger of Labels in Sweden and MNOK - 0.3 in EBITDA from Vensafe. In the first half 2014 EBITDA were MNOK 20.1 compared with MNOK 28.6 in the first half 2013.
Profit before tax (EBT) show a profit of MNOK 2.4 in the second quarter compared with MNOK 9.1 in 2013. In the first half 2014 EBT were MNOK 4.5 compared with MNOK 14.2 in the first half 2013.
MNOK Q2 2014 Q2 2013 YTD 2014 YTD 2013 2013
Revenue 196,8 198,6 370,0 385,4 718,9
EBITDA 10,1 15,5 20,1 28,6 54,2
Operating profit (EBIT) 2,9 10,1 5,6 17,5 28,3
Ordinary profit before tax (EBT) ¹⁾ 2,4 9,1 4,5 14,2 56,4
Net cash flow operations -3,5 21,9 -11,8 22,9 66,2
Disposable funds 22,6 19,2 22,6 19,2 65,0
Earnings per share (NOK) 0,04 0,15 0,08 0,23 1,16
EBITDA margin 5 % 8 % 5 % 7 % 8 %
¹⁾ Year 2013: Icluded a profit of MNOK 33 related to the sale of InStore IT companies.
Revenue
MNOK Norway Sweden
Other
markets Total Norway Sweden
Other
markets Total
PSI Technology 27,8 58,0 33,3 119,1 35,1 29,5 25,5 90,2
PSI Retail 15,7 23,3 -0,2 38,8 57,1 31,9 0,1 89,1
PSI Label 14,4 28,4 0,7 43,5 8,8 12,1 0,0 20,9
Group 0,1 0,0 0,0 0,1 0,1 0,0 0,0 0,1
Elimineringer 1,1 -5,9 0,2 -4,6 -1,8 0,1 0,1 -1,7
Total 59,1 103,8 33,9 196,8 99,3 73,6 25,7 198,6
Q2 2013Q2 2014

PSI Group ASA – Q2 and first half 2014 Page 5
PSI TECHNOLOGY
PSI Technology comprises PSI Groups self-owned technologies and brands: CashGuard, SQS Security and Vensafe.
PSI Group ASA acquired 100 per cent of Vensafe AS 8 April 2014. The acquisition added the business area yet another world-leading technology within retail solutions. Vensafe produces machines for securing valuable products in retail. See www.vensafe.com for more information.
The figures in the business area show sales and profit generated by the technology products throughout the value chain within PSI Group.
CashGuard is the market’s most reliable cash handling systems. CashGuard’s goal is to make cash payments effective and competitive for retailers through its leading expertise and longest experience in cash handling concepts.
The operating revenue increased by 8.3 per cent to MNOK 64.3 (MNOK 59.4) in the second quarter. In the first half 2014 the business area showed an increase in operating revenue of 23.7 per cent to MNOK 134.0 (MNOK 108.3). Increased sales in Sweden are the main reason for the increase. The business area experiencing a high demand for new machines ahead of the new notes and coins which the Swedish Riksbanken will introduce in the coming years.
EBITDA was MNOK 6.3 (MNOK 8.3) in the second quarter. The decrease in EBITDA in the period is due to enhanced investment in sales and marketing, as well as product development. In the first half EBITDA was MNOK 16.2 (MNOK 15.2).
CashGuard had a strong growth in revenue in Q2 compared to the same period in 2013. A successful replacement campaign of CashGuard, to deal with new Swedish notes and coins, has contributed significantly to this growth. PSI Antonson has also started roll out of 65 CashGuard systems to Sweden's largest private pharmacy
MNOK 2014 2013 2014 2013 2013
Product Sales 75,4 58,2 134,9 123,1 235,3
Service 43,6 32,0 74,0 58,0 120,5
Revenue 119,1 90,2 208,9 181,1 355,7
EBITDA 9,0 6,2 15,1 12,7 22,4
EBITDA-margin 7,5 % 6,9 % 7,2 % 7,0 % 6,3 %
EBT 4,7 1,5 7,0 0,5 -1,3
Q2 YTD
MNOK 2014 2013 2014 2013 2013
Product Sales 36,8 34,8 84,7 65,3 133,7
Service 27,6 24,7 49,3 43,1 88,2
Revenue 64,3 59,4 134,0 108,3 221,8
EBITDA 6,3 8,3 16,2 15,2 29,4
EBITDA-margin 9,8 % 14,0 % 12,1 % 14,0 % 13,2 %
EBT 4,8 6,1 13,4 8,6 17,2
Q2 YTD
2014 2013 2014 2013 2013
Norway 80 179 248 351 565 8 489
Sweden 229 107 513 265 700 10 779
Total domestic
markets
309 286 761 616 1 265 19 268
International 250 179 440 396 785 3 990
Total 559 465 1 201 1 012 2 050 23 258
Total
sold
Number of sold
systemsQ2 YTD

PSI Group ASA – Q2 and first half 2014 Page 6
chain Apotek Hjärtat. The catering chain Kost has become a customer during Q2.
The new G-MAX at Slependen in Oslo has installed CashGuard and MultiPOS from PSI Systems. This is the 9th store in the series since the start up at Storo in 2011. G-MAX plan to install the concept in all its stores.
In Denmark the deliveries to Copenhagen municipality continued in the second quarter. There have also been a number of smaller individual sales in the period, especially to the convenience market.
In Spain, there was a marked increase in sales of CashGuard to the pharmacy industry in the second quarter. There was also initiated several pilots of CashGuard Presidio to several major restaurant chains in the same quarter. In the 1st quarter, CashGuard got a major new order from supermarket chain Grupo Jesuman the Canary Islands.
I France the deliveries to Monoprix continued as planned. On the French market, sales increased both to bakeries and pharmacies. A pharmacy at the airport Charles De Gaulle also has installed CashGuard; a strategically important exhibition space for the product on an international arena.
The good development in Germany in the first quarter has continued in the second quarter, although the total still represents a smaller amount of systems.
Go to www.cashguard.com to subscribe to news or to www.youtube.com/user/CasGuard to watch videos.
PSI Group ASA acquired Vensafe 8 April 2014. From the second quarter Vensafe is a part of PSI Technology.
It is in the first three months made significant cuts in costs, focusing on realizing synergies with other companies in PSI Group. From the third quarter the organization is changed, new work processes and
procedures have been implemented so that Vensafe is focused on sales and profitability.
The effect of synergies with PSI Group is expected to provide Vensafe a reduction in operating costs with an annual effect of MNOK 8.3. The effect of synergies is reflected from the 2nd quarter. The work on defining cost-reducing effects in the production and coordination of suppliers for the whole group continues. It is still expected a time consuming turnaround to achieve satisfactory profitability in the business.
In Norway the tobacco legislation is tightened for the sale of tobacco product. This means that the previous legal tobacco product refrigerator must move behind the checkout, so it can’t be offered self-service. A result of this legislation is that the Meny chain has upgraded all of its stores to offer tobacco products through Vensafe machines with cooling, the tobacco product refrigerator will therefore be removed from Meny within July 1. The deliveries were completed in June.
The operating revenue wqs MNOK 20.8 in the second quarter. EBITDA was MNOK – 0.3 in the second quarter.
SQS Security delivers cash security solutions for ATM and cash in transit (CIT) operators based on patented destruction and tracking technologies.
The operating revenue increased by 10.3 per cent to MNOK 34.0 (MNOK 30.8) in the second quarter. In the first half 2014 SQS Security showed a decrease in operating revenue of 25.6 per cent to MNOK 54.1 (MNOK 72.8). This is mainly due to a large delivery to Croatia in Q1 2013.
EBITDA was MNOK 2.9 (MNOK – 2.1) in the second quarter. In the first half EBITDA was MNOK - 0.8 (MNOK - 2.5). EBITDA in the first quarter 2013 included non-recurring expenses of MNOK 2.4 related to management changes in SQS Security.
MNOK 2014
Product Sales 12,7
Service 8,0
Revenue 20,8
EBITDA -0,3
EBITDA-margin -1,5 %
EBT -1,0
Q2
MNOK 2014 2013 2014 2013 2013
Product Sales 25,9 23,5 37,5 57,8 101,6
Service 8,1 7,3 16,6 14,9 32,3
Revenue 34,0 30,8 54,1 72,8 133,9
EBITDA 2,9 -2,1 -0,8 -2,5 -7,0
EBITDA-margin 8,7 % -6,8 % -1,4 % -3,4 % -5,2 %
EBT 0,9 -4,6 -5,4 -8,1 -18,5
Q2 YTD

PSI Group ASA – Q2 and first half 2014 Page 7
The new SMP product line and the upgrade of Q400 have resulted in significant reductions in warranty costs. At the same time, SQS Security will in 2014 increase its focus on sales and marketing. It is employed a new sales manager as well as a business expansion manager for new geographical markets. Both will start in August.
SQS Security has during the 2nd quarter completed a delivery of 484 Q-Case SMP Mini relating to the framework agreement signed in March 2014.
In France, SQS Security Qube System received in the first quarter an order from Brinks on 165 Q-Case 400. 53 cases are delivered in the second quarter and the rest of the delivery will be completed in the third quarter.
We have received an additional order for 150 cases to a CIT company in Europe.
In Germany SparBank has outfitted several of its ATMs with ASP (ATM Stationary Protection). The company has totally installed approx. 20 ATMs with ASP in Germany.
New products within the SMP family will be launched consecutively in 2014. These products will be based on the same main components, which would result in a significant simplification of the logistics and reduce production costs.
PSI RETAIL
The business area's goal is to enhance retailers' profitability by making store employees' working environment more efficient and streamlining consumers' shopping experience. PSI Retail is a distributor of retail technology and supplies from the world's leading producers, as well as supplier of software solutions, consulting, service and support. Sales and profit from self-owned technology, such as SQS Security, CashGuard and Vensafe, are reported under PSI Technology.
New Vision will be included in the business area as of July 2014. The acquisition will give the group a new position as market leader in the Baltic countries, at the same time the
offices in Finland and Russia are relatively young, but can be important contributors to the business area's organic growth in the years to come. New Vision has approx. 200 employees and the total turnover in 2013 was MNOK 73.6.
The business area PSI Retail’s operating revenue has decreased by 56.5 per cent to MNOK 38.8 (MNOK 89.1) in the second quarter. In the first half 2014 the business area showed a decrease in operating revenue of 46.1 per cent to MNOK 89.1 (MNOK 165.3). The corresponding period for 2013 was characterized by roll-out of ESL to Rema1000.
EBITDA was MNOK 1.1 (MNOK 11.7) in the second quarter. In the first half EBITDA was MNOK 5.7 (MNOK 21.0). The decrease in EBITDA of 72.8 per cent is due to lower revenue compared with the same period last year.
ICA is upgrading all their fresh food scales. PSI Systems was preferred as supplier because of its total solution consisting of PC-scales combined with our own developed software, Scale Manager.
PSI Systems signed in the first quarter a framework agreement for the delivery, installation and service of Pricer's electronic shelf labels to a retail chain in Norway.
During the second quarter, PSI Antonson has been chosen as a supplier of Repant reverse vending machines to ICA in Sweden and received approval for the product at Coop. PSI Antonson has also a Repant pilot at the low price chain and Axfood-owned Willys.
MNOK 2014 2013 2014 2013 2013
Product Sales 30,4 71,6 65,4 125,4 195,4
Service 8,4 17,5 23,6 39,9 67,6
Revenue 38,8 89,1 89,1 165,3 263,0
EBITDA 1,1 11,7 5,7 21,0 33,4
EBITDA-margin 2,9 % 13,1 % 6,4 % 12,7 % 12,7 %
EBT 0,9 10,9 5,0 19,0 30,9
Q2 YTD

PSI Group ASA – Q2 and first half 2014 Page 8
PSI LABELS
PSI Labels offers a wide range of adhesive labels and corresponding printer / applicators. The business area is one of Scandinavia's largest producers of label solutions.
The business area is a result of the focus on the label business in PSI Retail. As of Q1 2014 label business will be reported in this new business area.
The business area PSI Labels operating revenue has increased by 108.2 per cent to MNOK 43.5 (MNOK 20.9) in the second quarter. In the first half 2014 the business area showed an increase in operating revenue of 119.6 per cent to MNOK 85.4 (MNOK 38.9). The acquisition of two digital printing facilities in 2013 was consolidated, respectively, in July and September 2013, which resulted in a growth in the quarter of MNOK 18.8. In addition, the business area organic growth in the quarter was MNOK 3.8.
EBITDA was MNOK 2.4 (MNOK 0.2) in the second quarter. In the first half EBITDA was MNOK 5.0 (MNOK 0.0).
In Sweden, Sydetikett AB and PSI Retail's Swedish label business has been integrated into one common company - Antonson Etikett AB. The second quarter includes non-
recurring expenses of MNOK 1.4 related to staff reductions as a result of this merger.
Antonson Label has during the second quarter received orders on preprinted labels to the food producer Hilton Food Group and the health food supplier Bringwell.
Coop has renewed its agreement with PSI Systems and PSI Antonson, which means that the companies will continue to deliver all of the scale labels to their stores in Norway and Sweden.
CASH FLOW AND EQUITY
Cash flow from operating activities decreased by MNOK 25.4 in the second quarter, and ended at MNOK - 3.5 compared with MNOK 21.9 in the same period last year.
Working capital increased by MNOK 13.7 in the quarter compared with the end of the first quarter of 2014.
Net interest-bearing debt has increased by MNOK 24.5 compared with the end of the previous quarter and totalled MNOK 82.5.
Disposable funds was MNOK 22.6 per 30 June 2014.
The Board wants the members of the executive management to have shares in the company. It was therefore in the first quarter 2013 introduced a share program for the executive management where members have the opportunity to buy shares for up to NOK 500 000 per year with 20 per cent discount. In addition, the first employee share program was conducted, in which all employees in the Norwegian companies were allowed to buy shares for up to NOK 25 000 with 20 per cent discount. In 2013 employees subscribed 102 649 shares through these programs.
The Groups holding of own shares amounts to 660,253, which represents 1.5 per cent of outstanding shares.
A dividend of NOK 0.30 per share was paid in May.
The Board of Directors of PSI Group ASA, Rælingen, 10 July 2014
Svein S. Jacobsen Erik Pinnås Selma Kveim Chairman Director Director Camilla Tepfers Klaus de Vibe Jørgen Waaler Director Director CEO
MNOK 2014 2013 2014 2013 2013
Product Sales 43,5 20,9 85,4 38,9 101,8
Service - - - - -
Revenue 43,5 20,9 85,4 38,9 101,8
EBITDA 2,4 0,2 5,0 0,0 4,5
EBITDA-margin 5,4 % 0,8 % 5,8 % 0,1 % 4,4 %
EBT -0,6 -0,7 -0,8 -1,8 -3,2
Q2 YTD

PSI Group ASA – Q2 and first half 2014 Page 9
STATEMENT FROM THE BOARD
The board and group CEO have today considered and approved PSI Group’s financial statements for the second quarter and first half 2014, including comparative consolidated figures for the second quarter and first half 2013. This report has been prepared in accordance with IAS 34 on interim financial reporting as determined by the European Union, and with supplementary requirements pursuant to the Norwegian Securities Trading Act.
The board and CEO hereby declare, to the best of their knowledge, that the financial statements for the second quarter and first half 2014 have been prepared in accordance with prevailing accounting principles and that the information in the financial statements gives a true and fair view of the assets, liabilities, financial position and profit of the group taken as a whole at 30 June 2014 and 30 June 2013. To the best of their knowledge, the report gives a true and fair overview of important events during the accounting period and the impact of these events on the financial statements.
The Board of Directors of PSI Group ASA, Rælingen, 10 July 2014
Svein S. Jacobsen Erik Pinnås Selma Kveim Chairman Director Director
Camilla Tepfers Klaus de Vibe Jørgen Waaler Director Director CEO

PSI Group ASA – Q2 and first half 2014 Page 10
CONSOLIDATED INCOME STATEMENT
KNOK Q2 2014 Q2 2013 Chg. % YTD 2014 YTD 2013 Chg. % 2013
Sales revenues 196 847 196 809 0,0 % 370 036 383 023 -3,4 % 716 506
Profit from AC, Service companies - 1 804 - 2 367 2 367
Cost of goods sold 97 234 110 498 -12,0 % 180 231 210 418 -14,3 % 378 473
Payroll 63 188 49 338 28,1 % 119 707 101 462 18,0 % 196 806
Other operating expenses 26 359 23 279 13,2 % 49 993 44 931 11,3 % 89 438
Total operating expenses 186 781 183 115 2,0 % 349 931 356 811 -1,9 % 664 718
EBITDA 10 066 15 499 -35,1 % 20 104 28 579 -29,7 % 54 155
Depreciation tangible assets 2 898 2 064 40,4 % 5 812 4 495 29,3 % 10 573
Depreciation intangible assets 4 294 3 321 29,3 % 8 661 6 590 31,4 % 15 299
EBIT 2 874 10 114 -71,6 % 5 631 17 494 -67,8 % 28 283
Interest -925 -1 436 35,6 % -1 723 -2 898 40,5 % -4 314
Other financial income 491 376 30,6 % 624 -427 246,2 % 32 414
EBT ¹⁾ 2 440 9 054 -73,1 % 4 531 14 169 -68,0 % 56 383
Taxes 502 2 173 -76,9 % 1 086 3 675 -70,4 % 5 214
Profit/loss after tax 1 938 6 881 -71,8 % 3 445 10 494 -67,2 % 51 169
Of which
Majority interest 1 938 6 706 -71,1 % 3 445 10 172 -66,1 % 50 937
Minority interest - 175 0,0 % - 323 0,0 % 232
1 938 6 881 -71,8 % 3 445 10 494 -67,2 % 51 169
Earnings per share
Number of shares outstanding 44 376 040 44 376 040 0,0 % 44 376 040 44 376 040 0,0 % 44 376 040
Av. Number of shares - own shares 43 715 787 43 786 928 0,0 % 43 715 787 43 765 010 0,0 % 43 757 742
0,04 0,15 0,0 % 0,08 0,23 0,0 % 1,16
Diluted earnings per share 0,04 0,15 0,0 % 0,08 0,23 0,0 % 1,16
EBITDA per share 0,23 0,35 0,0 % 0,46 0,65 0,0 % 1,24
Diluted EBITDA per share 0,23 0,35 0,0 % 0,46 0,65 0,0 % 1,24
Total earnings Q2 2014 Q2 2013 Chg. % YTD 2014 YTD 2013 Chg. % 2013
Profit/loss after tax 1 938 6 881 -71,8 % 3 445 10 494 -67,2 % 51 169
Exchange differences on foreign operations -4 190 517 -909,8 % -9 723 9 951 -197,7 % 22 628
Total earnings -2 252 7 399 -130,4 % -6 278 20 445 -130,7 % 73 797
Of which
Majority interest -2 252 7 224 -131,2 % -6 278 20 123 -131,2 % 73 565
Minority interest - 175 0,0 % - 323 0,0 % 232
Earnings per share
¹⁾ Year 2013 includes a profit of MNOK 33 related to the sale of InStore IT companies.
PSI Group ASA – Q2 and first half 2014 Page 11
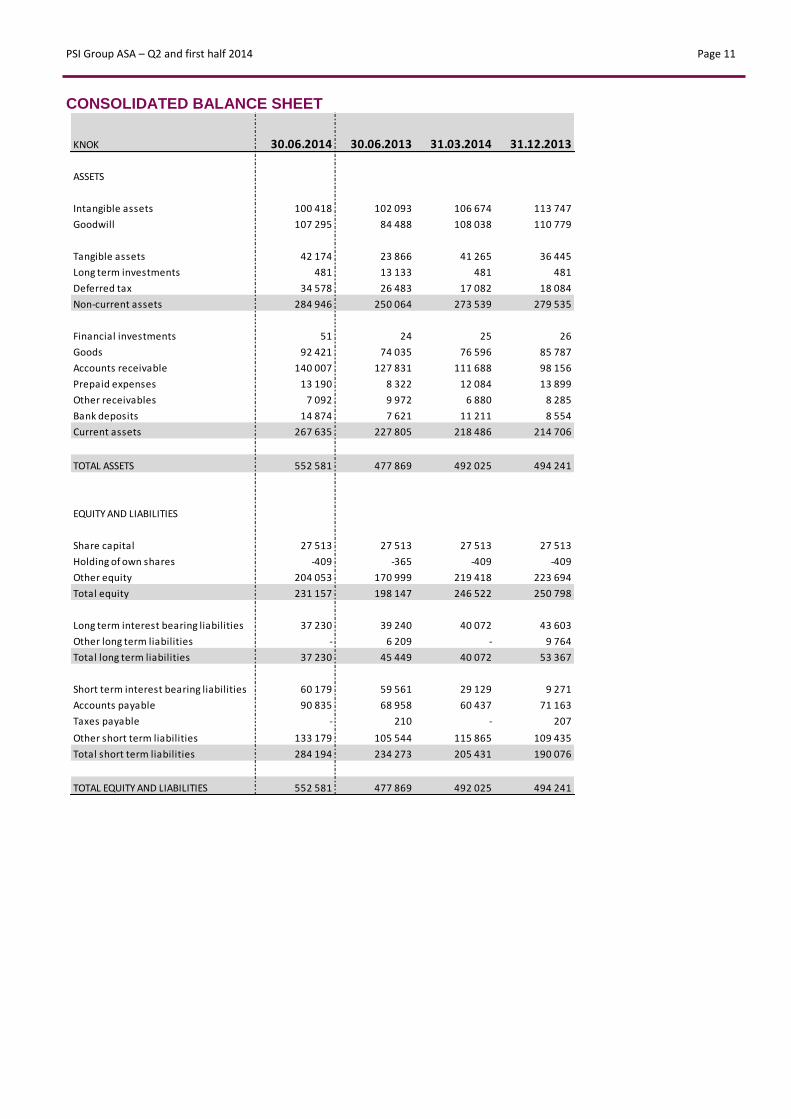
CONSOLIDATED BALANCE SHEET
KNOK 30.06.2014 30.06.2013 31.03.2014 31.12.2013
ASSETS
Intangible assets 100 418 102 093 106 674 113 747
Goodwill 107 295 84 488 108 038 110 779
Tangible assets 42 174 23 866 41 265 36 445
Long term investments 481 13 133 481 481
Deferred tax 34 578 26 483 17 082 18 084
Non-current assets 284 946 250 064 273 539 279 535
Financial investments 51 24 25 26
Goods 92 421 74 035 76 596 85 787
Accounts receivable 140 007 127 831 111 688 98 156
Prepaid expenses 13 190 8 322 12 084 13 899
Other receivables 7 092 9 972 6 880 8 285
Bank deposits 14 874 7 621 11 211 8 554
Current assets 267 635 227 805 218 486 214 706
TOTAL ASSETS 552 581 477 869 492 025 494 241
EQUITY AND LIABILITIES
Share capital 27 513 27 513 27 513 27 513
Holding of own shares -409 -365 -409 -409
Other equity 204 053 170 999 219 418 223 694
Total equity 231 157 198 147 246 522 250 798
Long term interest bearing liabilities 37 230 39 240 40 072 43 603
Other long term liabilities - 6 209 - 9 764
Total long term liabilities 37 230 45 449 40 072 53 367
Short term interest bearing liabilities 60 179 59 561 29 129 9 271
Accounts payable 90 835 68 958 60 437 71 163
Taxes payable - 210 - 207
Other short term liabilities 133 179 105 544 115 865 109 435
Total short term liabilities 284 194 234 273 205 431 190 076
TOTAL EQUITY AND LIABILITIES 552 581 477 869 492 025 494 241

PSI Group ASA – Q2 and first half 2014 Page 12
STATEMENT OF EQUITY
KNOK
Share
capital
Treasury
shares
Other
paid-in
equity
Translation
variances
Other
equity Total
Minority
interest Total equity
Equity 31.12.2012 13 757 -185 108 879 10 152 -112 310 203 213 49 203 261
Dividend to minority interest - - - - - - -120 -120
Sale of own shares - 51 - - 338 389 - 389
Purchase of own shares / Compulsory
acquisition
- -44 - - -636 -680 - -680
Dividend 2012 - - - -10 947 -10 947 - -10 947
Profit this year after tax - - - - 51 403 51 403 -234 51 169
Other comprehensive income and expenses - - - 22 628 - 22 628 - 22 628
Equity 31.12.2013 27 513 -409 351 262 29 108 -156 675 250 800 - 250 798
Dividend 2013 - - - - -13 115 -13 115 - -13 115
Adapting K3 Sweden - - - - -248 -248 - -248
Profit this year after tax - - - - 3 445 3 445 - 3 445
Other comprehensive income and expenses - - - -9 723 - -9 723 - -9 723
Equity 30.06.2014 27 513 -409 351 262 19 386 -166 593 231 159 - 231 157

PSI Group ASA – Q2 and first half 2014 Page 13
STATEMENT OF CASH FLOW
KNOK Q2 2014 Q2 2013 YTD 2014 YTD 2013 2013
Ordinary profit before tax 2 440 9 054 4 531 14 169 56 383
Net interest 925 1 436 1 723 2 898 4 314
Tax paid - - - -433 667
Share of profit, associated companies - -1 804 - -2 367 -2 367
Ordinary depreciation 7 192 5 385 14 473 11 085 25 872
Profit / loss on sale of fixed assets - - - - -169
Realised profit on financial instruments - - - - -32 969
Change in inventories -13 949 2 216 -6 295 12 094 4 712
Change in receivables -14 285 -10 155 -29 790 -30 860 9 422
Change in accounts payable 17 161 3 412 7 671 -3 930 -6 480
Change in other accrued items -2 980 12 399 -4 093 20 272 6 774
Net cash flow from operational activities -3 496 21 943 -11 780 22 928 66 159
Net payments for fixed assets -2 386 -1 010 -8 255 -1 875 -4 550
Capitalisation of development costs 1 - -97 - -
Net payments for long term shares -0 -0 - -476 -476
Net effect acquisition Vensafe AS 843 - 843 - -
Net effect acquisition Etikett-Produsenten AS - -7 031 - -7 031 -2 578
Net effect acquisition Sydetikett AB - - - - -24 732
Payment from sale of fixed assets - - - - 325
Net effect sale InStore IT companies - - - - 46 398
Interest income 40 27 138 60 199
Dividend received from associated companies - 1 000 - 2 300 2 300
Net cash flow from investment activities -1 502 -7 014 -7 371 -7 022 16 887
Buying of treasury shares / compulsary acquisition - - - - -680
Selling of treasury shares - - - 389 389
Change in long-term debt -5 671 -2 851 -8 881 -5 017 -13 435
Change in overdraft 28 446 3 434 49 572 6 177 -49 114
Interest expenses -966 -1 463 -1 861 -2 958 -4 513
Dividend paid -13 115 -10 547 -13 115 -10 547 -10 943
Dividend paid to minorities - - - -120 -120
Net cash flow from financing activities 8 695 -11 428 25 715 -12 076 -78 416
Net change in liquid assets 3 696 3 501 6 564 3 830 4 630
Cash and cash equivalents at the start of the period 11 211 4 110 8 554 3 670 3 670
Effect of foreign exchange rate fluctuations on foreign currency deposits -33 10 -244 120 254
Cash and cash equivalents at the end of the period 14 874 7 621 14 874 7 621 8 554

PSI Group ASA – Q2 and first half 2014 Page 14
KEY FIGURES
KNOK Q2 2014 Q1 2014 Q4 2013 Q3 2013 Q2 2013 YTD 2014 YTD 2013
Income statement
Operating revenue 196 847 173 188 188 546 144 937 198 614 370 036 385 390
EBITDA 10 066 10 038 15 506 10 071 15 499 20 104 28 579
Operating revenue EBIT 2 874 2 757 7 296 3 493 10 114 5 631 17 494
Ordinary profit before tax (EBT) ¹⁾ 2 440 2 091 7 077 35 137 9 054 4 531 14 169
Profit for the year 1 938 1 507 6 783 33 892 6 881 3 445 10 494
EBITDA-margin 5,1 % 5,8 % 8,2 % 6,9 % 7,8 % 5,4 % 7,4 %
EBT-margin 1,2 % 1,2 % 3,8 % 24,2 % 4,6 % 1,2 % 3,7 %
Balance sheet
Non-current assets 284 946 273 539 279 535 281 564 250 064 284 946 250 064
Current assets 267 635 218 486 214 706 235 206 227 805 267 635 227 805
Total assets 552 581 492 025 494 241 516 769 477 869 552 581 477 869
Equity 231 157 246 522 250 798 241 218 198 147 231 157 198 147
Long-term debt 37 230 40 072 53 367 61 071 45 449 37 230 45 449
Short-term debt 284 193 205 431 190 076 214 481 234 273 284 193 234 273
Working capital 141 593 127 847 112 780 118 478 132 907 141 593 132 907
Equity ratio 41,8 % 50,1 % 50,7 % 46,7 % 41,5 % 41,8 % 41,5 %
Liquidity ratio 94,2 % 106,4 % 113,0 % 109,7 % 97,2 % 94,2 % 97,2 %
Cash Flow
Net cash flow from operation -3 496 -8 284 34 907 8 323 21 943 -11 780 22 928
Net cash flow 3 696 2 868 -1 473 2 273 3 501 6 564 3 830
Share information
Number of shares 44 376 040 44 376 040 44 376 040 44 376 040 44 376 040 44 376 040 44 376 040
Weighted average shares outstanding 43 715 787 43 715 787 43 715 787 43 785 398 43 786 928 43 715 787 43 765 010
EBT per shares 0,06 0,05 0,16 0,80 0,21 0,10 0,32
Earnings per share 0,04 0,03 0,16 0,77 0,16 0,08 0,24
Equity per share 5,3 5,6 5,7 5,5 4,5 5,3 4,5
Dividend per share 0,30 - - - 0,25 0,30 0,25
Employees
Number of employees (end of period) 360 326 314 326 297 360 297
Average number of employees 353 324 321 307 303 339 304
Operating revenue per employee 547 531 600 445 669 1 028 1 298
Operating cost per employee 519 500 551 414 617 972 1 201
EBT per employee 7 6 23 108 30 13 48
¹⁾ Q3 2013 includes a profit of MNOK 33 related to the sale of InStore IT companies.

PSI Group ASA – Q2 and first half 2014 Page 15
DEFINITIONS
Number of shares Number of issued shares year and
Working capital Inventories + accounts receivables – accounts payable
Equity per share Book value equity / number of shares
Operating revenue Sales revenues and profit from AC, Service companies
Operating revenue per employee Operating revenue / average number of employees
Operating cost Operating cost / average number of employees
EBT Profit before tax
EBIT Operating profit
EBIT pr. ansatt EBIT / average number of employees
EBIT pr. utestående aksje EBIT / average number of shares outstanding
EBIT-margin EBIT / operatin revenue
EBITDA Operating profit + depreciation fixed asstets amd tangible assets
EBITDA-margin EBITDA / operating revenue
Egenkapitalandel Book value equity / total assets
Weighted average basic shares outstanding Issued shares adjusted for own shares on average for the year
Cash Flow margin Net cash flow operations / operating revenue
Liquidity ratio Current assets / short term debt
Earnings per share Profit after tax / weighted average basic shares outstanding
Dividend per share Paid dividend per share throughout the year

PSI Group ASA – Q2 and first half 2014 Page 16
NOTE 1 CONFIRMATION OF REPORTING FRAMEWORK
The condensed and consolidated quarterly financial statements are prepared in accordance with IAS 34 Interim Financial Reporting. The quarterly financial statements do not contain all the information required in an annual financial statement and should be read in connection with the Group financial statements for 2013.
NOTE 2 KEY ACCOUNTING PRINCIPLES
The accounting principles for 2013 are described in the annual financial statements for 2013. The Group financial statements for 2013 were prepared in accordance with the IFRS principals and interpretations thereof, as defined by the EU, as well as other disclosure requirements pursuant to the Norwegian Accounting Act and the Oslo Stock Exchange regulations and rules applicable as at 31.12.2013. The quarterly report and the interim financial statements have not been revised by auditor.
NOTE 3 SEGMENT INFORMATION
SEGMENT: BUSINESS AREAS
SEGMENT: SALES REVENUES BY GEOGRAPHICAL MARKET
SEGMENT: SALES REVENUES BY PRODUCT AND SERVICE
MNOK Revenues EBITDA EBT Revenues EBITDA EBT Revenues EBITDA EBT Revenues EBITDA EBT Revenues EBITDA EBT
PSI Technology 119,1 9,0 4,7 90,2 6,2 1,5 208,9 15,1 7,0 181,1 12,7 0,5 355,7 22,4 -1,3
PSI Retail ¹⁾ 38,8 1,1 0,9 89,1 11,7 10,9 89,1 5,7 5,0 165,3 21,0 19,0 263,0 33,4 30,9
PSI Label 43,5 2,4 -0,6 20,9 0,2 -0,7 85,4 5,0 -0,8 38,9 0,0 -1,8 101,8 4,5 -3,2
Group 0,1 -2,6 -2,8 0,1 -2,6 -1,7 0,2 -5,7 -6,7 0,2 -5,1 -1,2 5,1 -6,6 78,2
Eliminations -4,6 0,2 0,2 -1,7 0,0 -1,0 -13,6 0,0 0,0 -0,2 -0,0 -2,3 -6,8 0,4 -48,2
Total 196,8 10,1 2,4 198,6 15,5 9,1 370,0 20,1 4,5 385,4 28,6 14,2 718,9 54,2 56,4
¹⁾ Year 2013 includes a profit of MNOK 33 related to the sale of InStore IT companies.
Year 2013Q2 2014 Q2 2013 YTD 2014 YTD 2013
MNOK Norway Sweden
Other
markets Norway Sweden
Other
markets Norway Sweden
Other
markets Norway Sweden
Other
markets Norway Sweden
Other
markets
PSI Technology 27,8 58,0 33,3 35,1 29,5 25,5 58,0 97,1 53,8 60,3 61,3 59,5 125,1 129,5 101,1
PSI Retail 15,7 23,3 -0,2 57,1 31,9 0,1 36,5 52,5 0,0 106,4 58,7 0,2 153,3 108,9 0,7
PSI Label 14,4 28,4 0,7 8,8 12,1 0,0 30,4 53,8 1,2 17,0 21,9 0,0 39,1 62,5 0,3
Group 0,1 0,0 0,0 0,1 0,0 0,0 0,2 0,0 0,0 0,2 0,0 0,0 1,6 3,5 0,0
Eliminations 1,1 -5,9 0,2 -1,8 0,1 0,1 -0,1 -12,6 -0,9 -0,1 0,0 -0,1 -1,3 -5,6 0,1
Total 59,1 103,8 33,9 99,3 73,6 25,7 125,0 190,8 54,2 183,9 141,9 59,6 317,8 298,8 102,3
Q2 2013 YTD 2014 YTD 2013 Year 2013Q2 2014
MNOK New sales Service New sales Service New sales Service New sales Service New sales Service
PSI Technology 75,4 43,6 58,2 32,0 134,9 74,0 123,1 58,0 235,3 120,5
PSI Retail 30,4 8,4 71,6 17,5 65,4 23,6 125,4 39,9 195,4 67,6
PSI Label 43,5 0,0 20,9 0,0 85,4 0,0 38,9 0,0 101,8 0,0
Group 0,1 0,0 0,1 0,0 0,2 0,0 0,2 0,0 5,1 0,0
Eliminations -4,6 0,0 -1,7 0,0 -13,6 0,0 -0,2 0,0 -6,8 0,0
Total 144,8 52,1 149,1 49,5 272,4 97,6 287,4 97,9 530,8 188,0
Year 2013Q2 2014 Q2 2013 YTD 2014 YTD 2013
PSI Group ASA – Q2 and first half 2014 Page 17
NOTE 4 RELATED PARTIES
No significant transactions between the Group and related parties had taken place as at 30 June 2014.
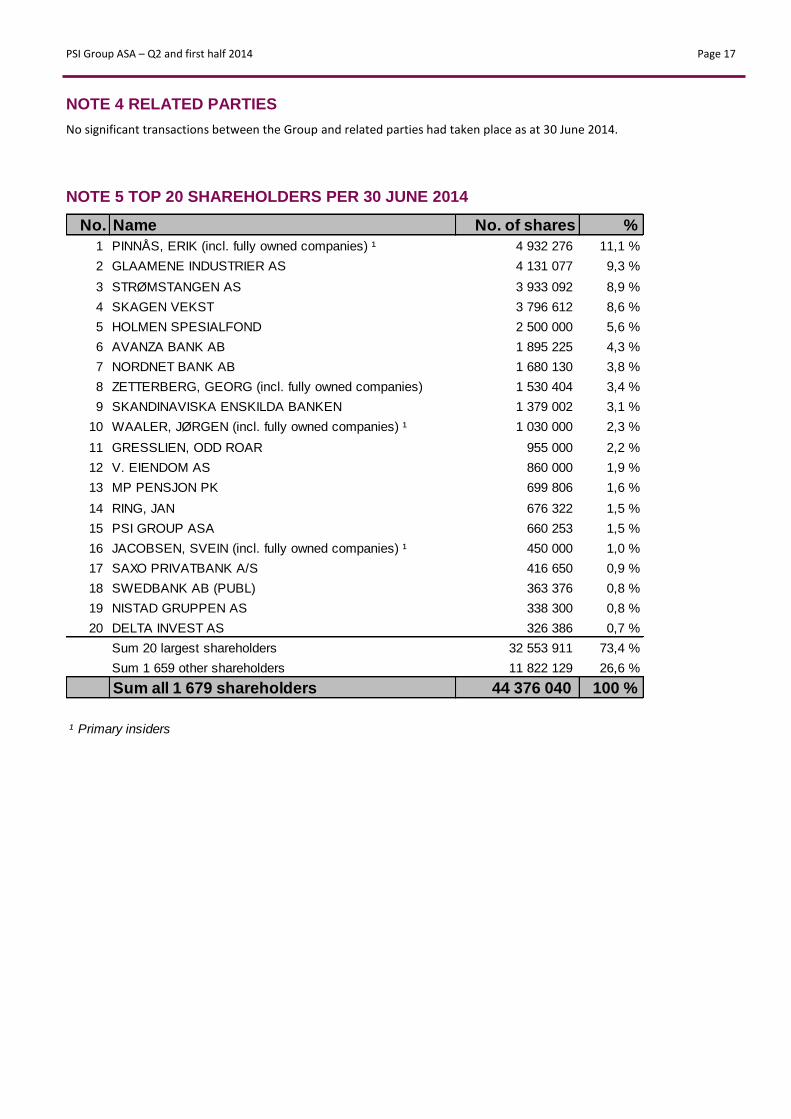
NOTE 5 TOP 20 SHAREHOLDERS PER 30 JUNE 2014
No. Name No. of shares %
1 PINNÅS, ERIK (incl. fully owned companies) ¹ 4 932 276 11,1 %
2 GLAAMENE INDUSTRIER AS 4 131 077 9,3 %
3 STRØMSTANGEN AS 3 933 092 8,9 %
4 SKAGEN VEKST 3 796 612 8,6 %
5 HOLMEN SPESIALFOND 2 500 000 5,6 %
6 AVANZA BANK AB 1 895 225 4,3 %
7 NORDNET BANK AB 1 680 130 3,8 %
8 ZETTERBERG, GEORG (incl. fully owned companies) 1 530 404 3,4 %
9 SKANDINAVISKA ENSKILDA BANKEN 1 379 002 3,1 %
10 WAALER, JØRGEN (incl. fully owned companies) ¹ 1 030 000 2,3 %
11 GRESSLIEN, ODD ROAR 955 000 2,2 %
12 V. EIENDOM AS 860 000 1,9 %
13 MP PENSJON PK 699 806 1,6 %
14 RING, JAN 676 322 1,5 %
15 PSI GROUP ASA 660 253 1,5 %
16 JACOBSEN, SVEIN (incl. fully owned companies) ¹ 450 000 1,0 %
17 SAXO PRIVATBANK A/S 416 650 0,9 %
18 SWEDBANK AB (PUBL) 363 376 0,8 %
19 NISTAD GRUPPEN AS 338 300 0,8 %
20 DELTA INVEST AS 326 386 0,7 %
Sum 20 largest shareholders 32 553 911 73,4 %
Sum 1 659 other shareholders 11 822 129 26,6 %
Sum all 1 679 shareholders 44 376 040 100 %
¹ Primary insiders

PSI Group ASA – Q2 and first half 2014 Page 18
NOTE 6 UNAUDITED PRO FORMA FIGURES
New Vision was acquired 2 July 2014 and will be consolidated from the third quarter 2014.
in KNOK
P&L PSI GROUP ASA
consolidated New Vision
PSI GROUP ASA
consolidated incl.
Vision
PSI GROUP ASA
consolidated New Vision
PSI GROUP ASA
consolidated incl.
Vision
Revenue 173 188 23 596 196 784 186 776 13 463 200 239
EBITDA 10 038 -200 9 838 13 080 -684 12 396
Depreciation and amortizations of intangible assets and goodwill-7 281 -993 -8 274 -5 700 -594 -6 294
EBIT 2 757 -1 194 1 563 7 380 -1 278 6 102
Net financial items -665 -92 -757 -2 264 -74 -2 338
Profit before tax 2 091 -1 285 806 5 115 -1 352 3 763
Tax -584 - -584 -1 502 - -1 502
Net Profit 1 507 -1 285 222 3 613 -1 352 2 261
Balance sheet 31.03.14 31.03.14 31.03.14 31.03.13 31.03.13 31.03.13
Intangible assets 231 794 7 314 239 108 212 814 4 768 217 582
Tangible assets 41 265 3 203 44 468 24 519 2 818 27 337
Financial assets 481 - 481 12 329 5 269 17 598
Total non-current assets 273 539 10 517 284 056 249 661 12 855 262 516
Inventory 76 596 11 037 87 633 76 121 9 193 85 314
Receivables 130 677 29 008 159 685 136 174 16 084 152 258
Bank deposits 11 211 446 11 657 4 110 90 4 200
Total current assets 218 486 40 491 258 977 216 404 25 367 241 771
Total assets 492 025 51 008 543 033 466 065 38 222 504 287
Paid-in equity 336 392 1 222 336 392 336 392 1 106 336 392
Own shares -409 - -409 -365 -1 203 -365
Other equity -89 461 7 017 -81 223 -134 734 9 866 -124 965
Minority interests - - - 382 - 382
Total equity 246 522 8 238 254 760 201 674 9 769 211 443
Provision for liabilities - - - 6 199 - 6 199
Long term interest bearing liabilities 40 072 6 909 46 981 41 919 6 846 48 765
Total long term liabilities 40 072 6 909 46 981 48 117 6 846 54 963
Short term interest bearing liabilities 29 129 10 831 39 960 56 213 7 907 64 120
Short term liabilities 176 302 25 029 201 331 160 060 13 700 173 760
Total short term liabilities 205 431 35 860 241 291 216 274 21 607 237 881
Total liabilities 245 503 42 769 288 272 264 391 28 454 292 845
Total equity and liabilities 492 025 51 008 543 033 466 065 38 222 504 287
Q1 2014 Q1 2013

PSI Group ASA – Q2 and first half 2014 Page 19
NOTES:
______________________________________________________________________________________________________________________________________________________________________________________________________________________________________________________________________________________________________________________________________________________________________________________________________________________________________________________________________________________________________________________________________________________________________________________________________________________________________________________________________________________________________________________________________________________________________________________________________________________________________________________________________________________________________________________________________________________________________________________________________________________________________________________________________________________________________________________________________________________________________________________________________________________________________

PSI Group ASA – Q2 and first half 2014 Page 20