Embed Size (px)
Citation preview
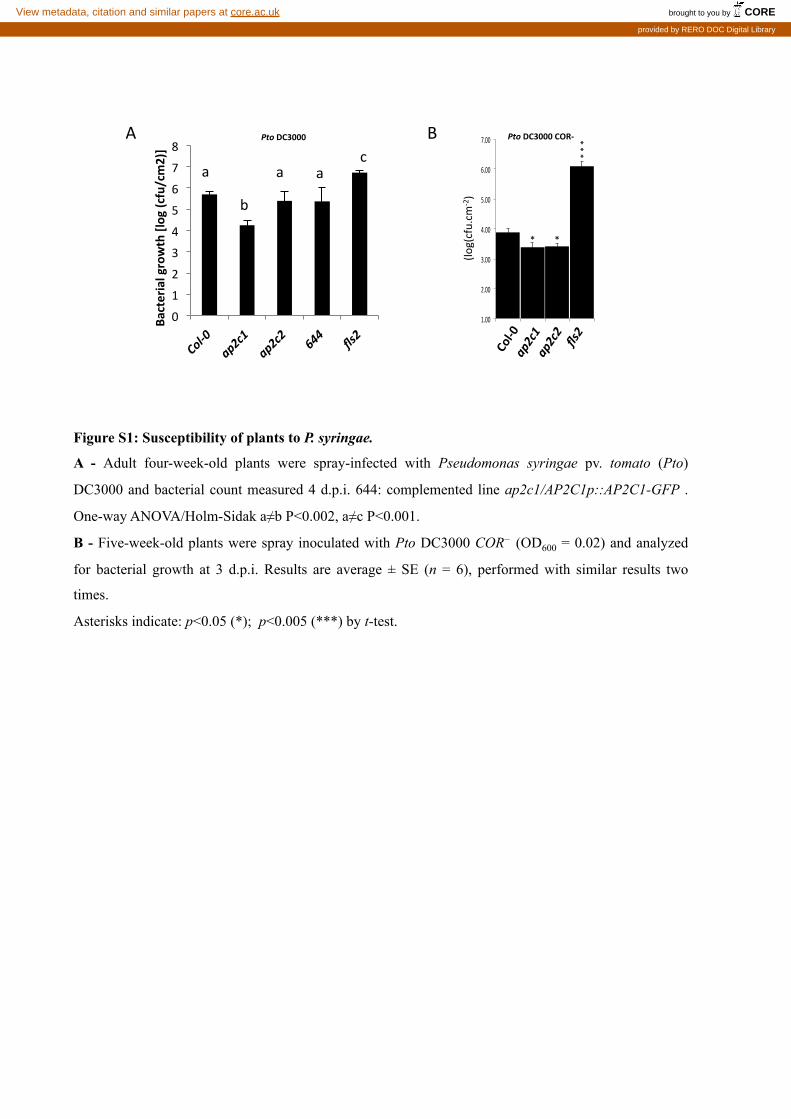
Figure S1: Susceptibility of plants to P. syringae.
A - Adult four-week-old plants were spray-infected with Pseudomonas syringae pv. tomato (Pto)
DC3000 and bacterial count measured 4 d.p.i. 644: complemented line ap2c1/AP2C1p::AP2C1-GFP .
One-way ANOVA/Holm-Sidak a≠b P<0.002, a≠c P<0.001.
B - Five-week-old plants were spray inoculated with Pto DC3000 COR− (OD600 = 0.02) and analyzed
for bacterial growth at 3 d.p.i. Results are average ± SE (n = 6), performed with similar results two
times.
Asterisks indicate: p<0.05 (*); p<0.005 (***) by t-test.
0
1
2
3
4
5
6
7
8 Ba
cterial growth [log (cfu/cm2)]
B A
b
c a a a
1.00$
2.00$
3.00$
4.00$
5.00$
6.00$
7.00$
Col.0$ ap2c1$ ap2c2$ fls2$
(log(cfu.cm
-‐2)
Pto DC3000 COR-‐
* *
* * * Pto DC3000
brought to you by COREView metadata, citation and similar papers at core.ac.uk
provided by RERO DOC Digital Library
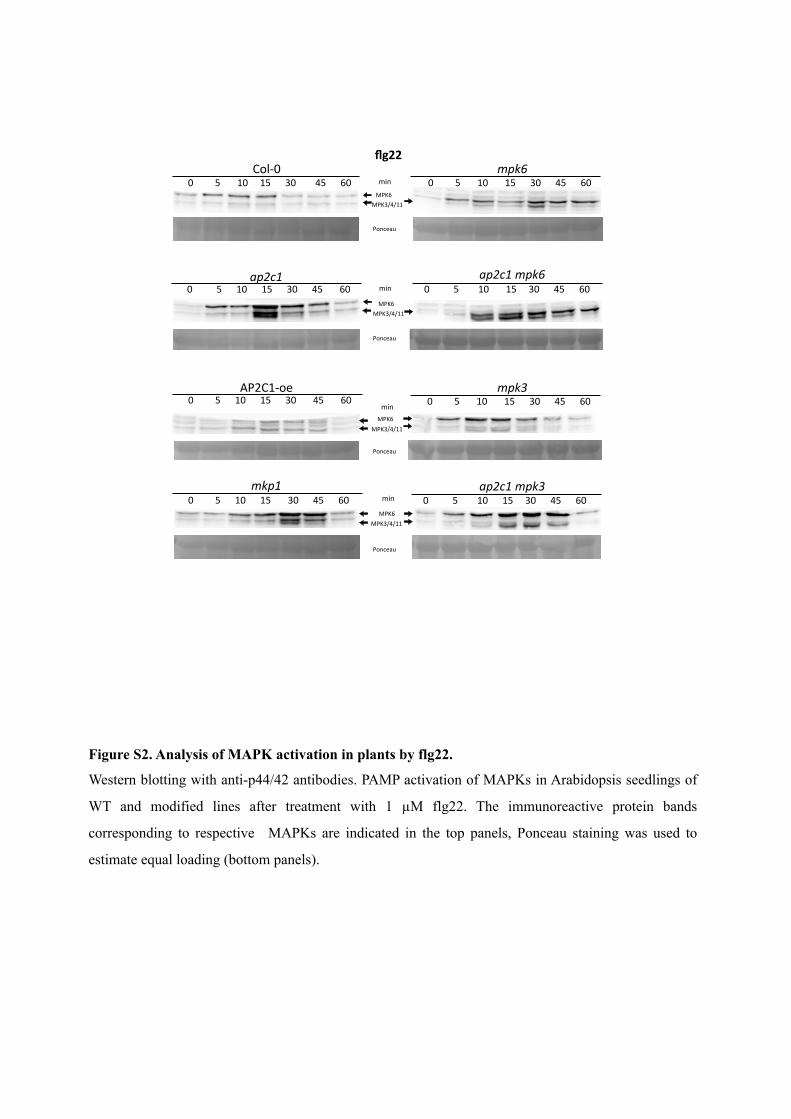
Figure S2. Analysis of MAPK activation in plants by flg22.
Western blotting with anti-p44/42 antibodies. PAMP activation of MAPKs in Arabidopsis seedlings of
WT and modified lines after treatment with 1 µM flg22. The immunoreactive protein bands
corresponding to respective MAPKs are indicated in the top panels, Ponceau staining was used to
estimate equal loading (bottom panels).
AP2C1-‐oe mpk3
min
MPK6 MPK3/4/11
MPK3/4/11
min MPK6
0 5 10 15 30 45 60
mkp1 ap2c1 mpk3 0 5 10 15 30 45 60 0 5 10 15 30 45 60
0 5 10 15 30 45 60
ap2c1 ap2c1 mpk6 min
MPK6 MPK3/4/11
0 5 10 15 30 45 60 0 5 10 15 30 45 60
Col-‐0 mpk6 min
MPK6 MPK3/4/11
0 5 10 15 30 45 60 0 5 10 15 30 45 60
flg22
Ponceau
Ponceau
Ponceau
Ponceau
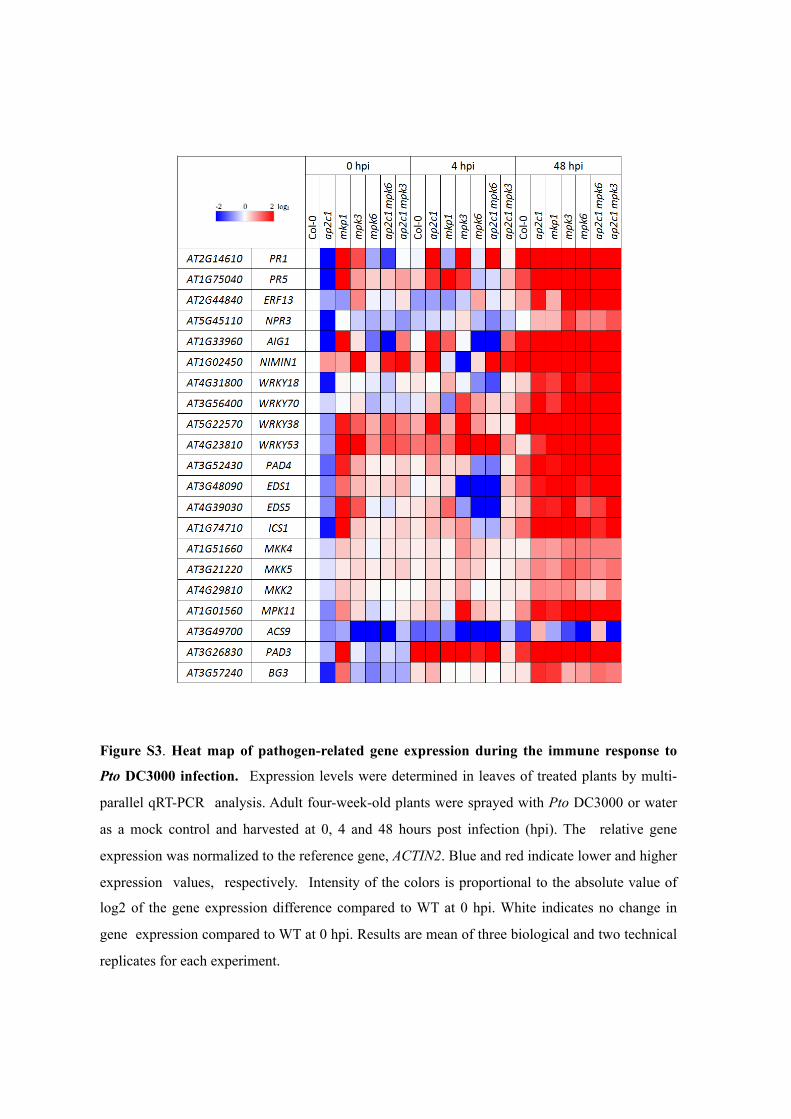
Figure S3. Heat map of pathogen-related gene expression during the immune response to
Pto DC3000 infection. Expression levels were determined in leaves of treated plants by multi-
parallel qRT-PCR analysis. Adult four-week-old plants were sprayed with Pto DC3000 or water
as a mock control and harvested at 0, 4 and 48 hours post infection (hpi). The relative gene
expression was normalized to the reference gene, ACTIN2. Blue and red indicate lower and higher
expression values, respectively. Intensity of the colors is proportional to the absolute value of
log2 of the gene expression difference compared to WT at 0 hpi. White indicates no change in
gene expression compared to WT at 0 hpi. Results are mean of three biological and two technical
replicates for each experiment.
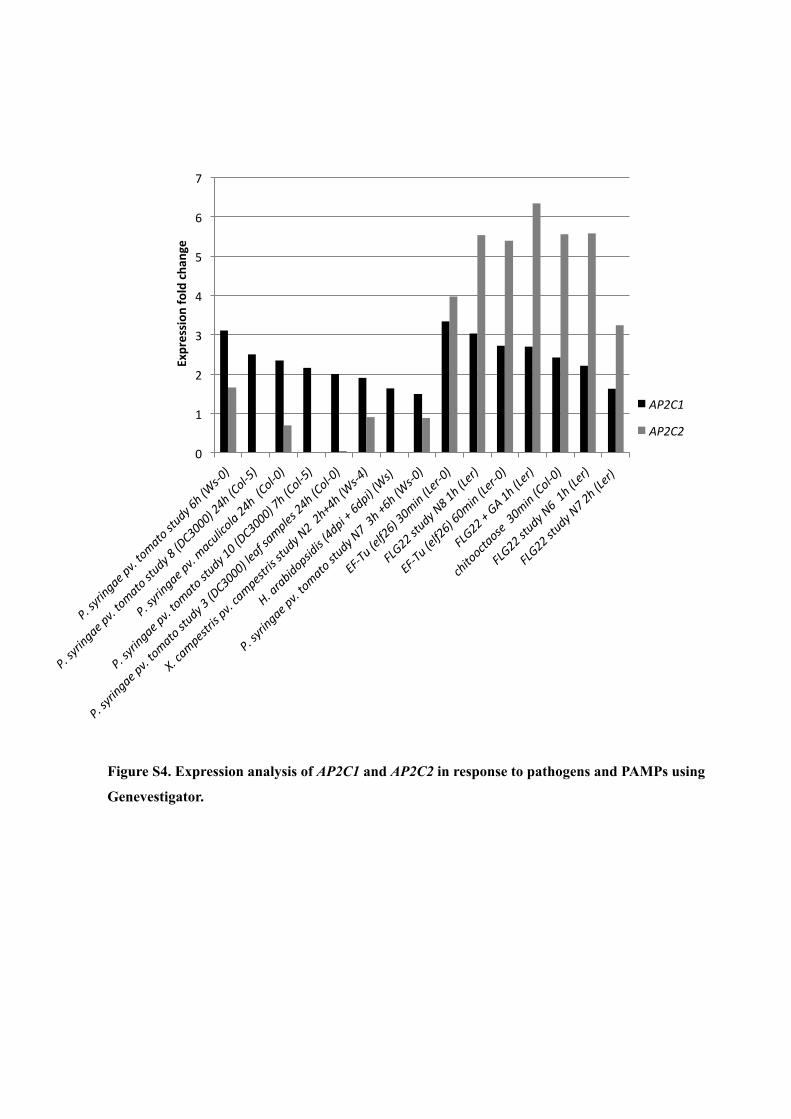
Figure S4. Expression analysis of AP2C1 and AP2C2 in response to pathogens and PAMPs using
Genevestigator.
0
1
2
3
4
5
6
7
AP2C1
AP2C2
Expression
fold cha
nge
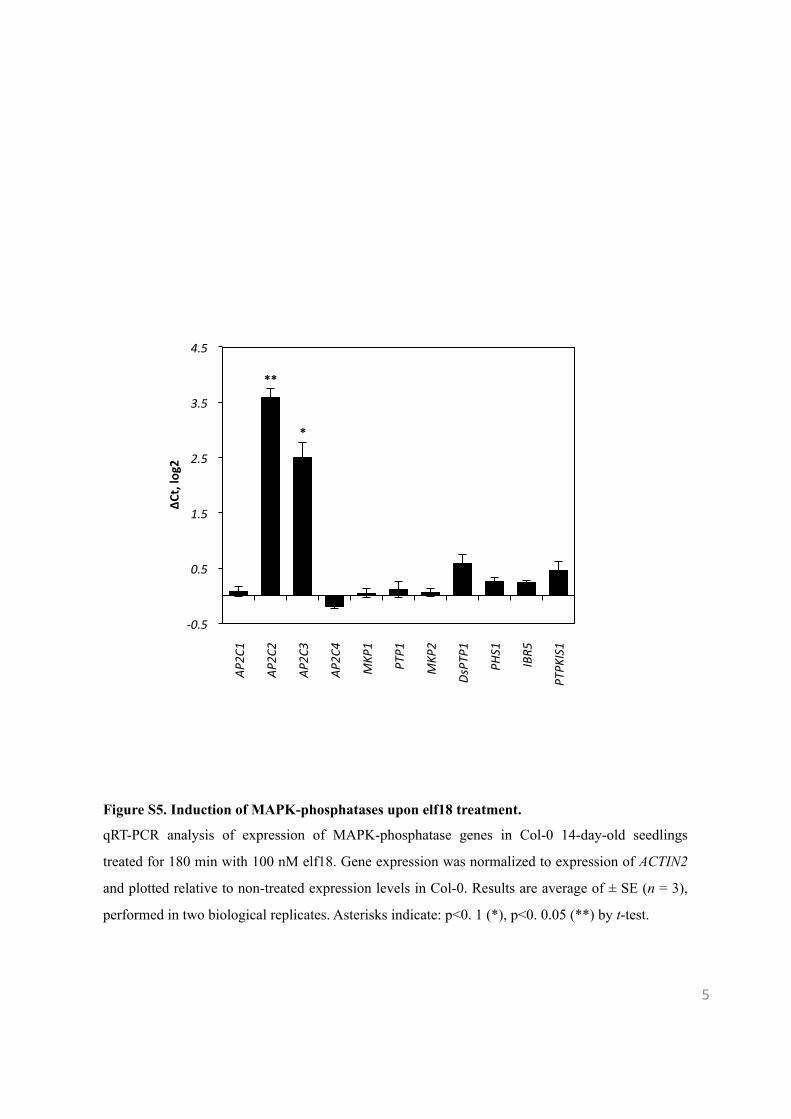
Figure S5. Induction of MAPK-phosphatases upon elf18 treatment.
qRT-PCR analysis of expression of MAPK-phosphatase genes in Col-0 14-day-old seedlings
treated for 180 min with 100 nM elf18. Gene expression was normalized to expression of ACTIN2
and plotted relative to non-treated expression levels in Col-0. Results are average of ± SE (n = 3),
performed in two biological replicates. Asterisks indicate: p<0. 1 (*), p<0. 0.05 (**) by t-test.
5
-‐0.5
0.5
1.5
2.5
3.5
4.5
AP2C
1
AP2C
2
AP2C
3
AP2C
4
MKP
1
PTP1
MKP
2
DsPTP1
PHS1
IBR5
PTPK
IS1
ΔCt, log2
**
*
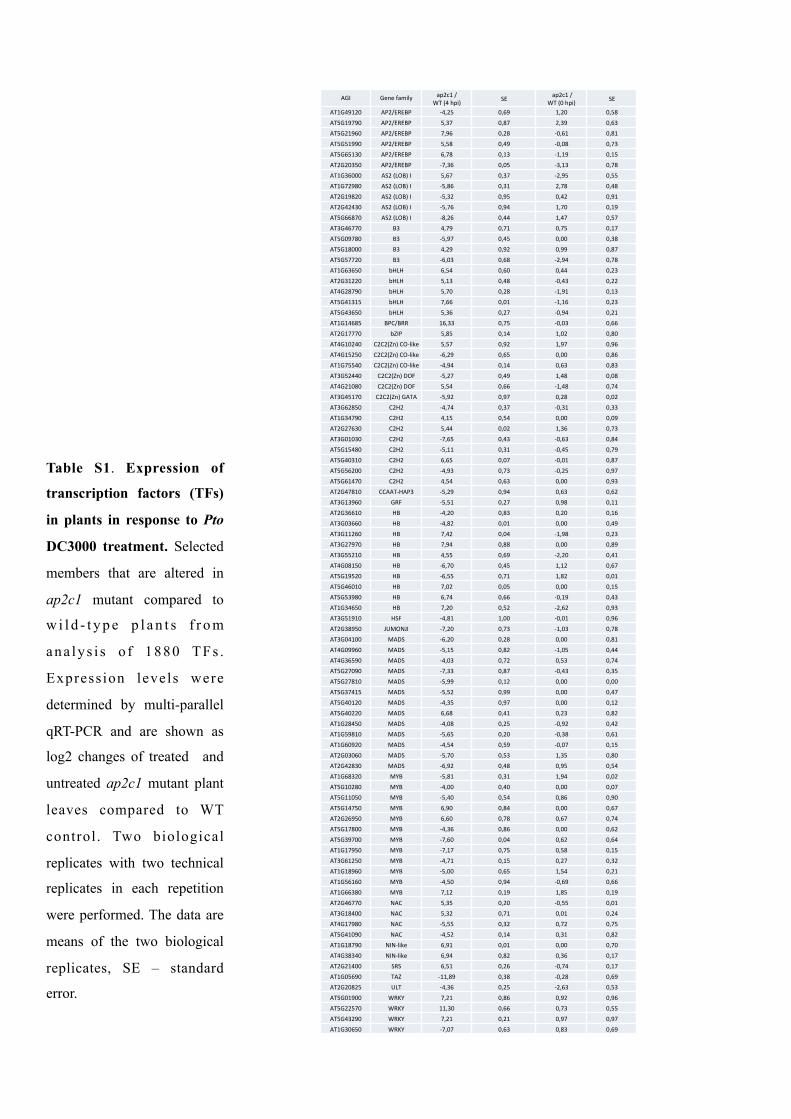
Table S1. Expression of
transcription factors (TFs)
in plants in response to Pto
DC3000 treatment. Selected
members that are altered in
ap2c1 mutant compared to
w i l d - t y p e p l a n t s f r o m
ana lys i s o f 1880 TFs .
Expression levels were
determined by multi-parallel
qRT-PCR and are shown as
log2 changes of treated and
untreated ap2c1 mutant plant
leaves compared to WT
control. Two biological
replicates with two technical
replicates in each repetition
were performed. The data are
means of the two biological
replicates, SE – standard
error.
AGI Gene family ap2c1 / WT (4 hpi) SE ap2c1 /
WT (0 hpi) SE
AT1G49120 AP2/EREBP -‐4,25 0,69 1,20 0,58
AT5G19790 AP2/EREBP 5,37 0,87 2,39 0,63
AT5G21960 AP2/EREBP 7,96 0,28 -‐0,61 0,81
AT5G51990 AP2/EREBP 5,58 0,49 -‐0,08 0,73
AT5G65130 AP2/EREBP 6,78 0,13 -‐1,19 0,15
AT2G20350 AP2/EREBP -‐7,36 0,05 -‐3,13 0,78
AT1G36000 AS2 (LOB) I 5,67 0,37 -‐2,95 0,55
AT1G72980 AS2 (LOB) I -‐5,86 0,31 2,78 0,48
AT2G19820 AS2 (LOB) I -‐5,32 0,95 0,42 0,91
AT2G42430 AS2 (LOB) I -‐5,76 0,94 1,70 0,19
AT5G66870 AS2 (LOB) I -‐8,26 0,44 1,47 0,57
AT3G46770 B3 4,79 0,71 0,75 0,17
AT5G09780 B3 -‐5,97 0,45 0,00 0,38
AT5G18000 B3 4,29 0,92 0,99 0,87
AT5G57720 B3 -‐6,03 0,68 -‐2,94 0,78
AT1G63650 bHLH 6,54 0,60 0,44 0,23
AT2G31220 bHLH 5,13 0,48 -‐0,43 0,22
AT4G28790 bHLH 5,70 0,28 -‐1,91 0,13
AT5G41315 bHLH 7,66 0,01 -‐1,16 0,23
AT5G43650 bHLH 5,36 0,27 -‐0,94 0,21
AT1G14685 BPC/BRR 16,33 0,75 -‐0,03 0,66
AT2G17770 bZIP 5,85 0,14 1,02 0,80
AT4G10240 C2C2(Zn) CO-‐like 5,57 0,92 1,97 0,96
AT4G15250 C2C2(Zn) CO-‐like -‐6,29 0,65 0,00 0,86
AT1G75540 C2C2(Zn) CO-‐like -‐4,94 0,14 0,63 0,83
AT3G52440 C2C2(Zn) DOF -‐5,27 0,49 1,48 0,08
AT4G21080 C2C2(Zn) DOF 5,54 0,66 -‐1,48 0,74
AT3G45170 C2C2(Zn) GATA -‐5,92 0,97 0,28 0,02
AT3G62850 C2H2 -‐4,74 0,37 -‐0,31 0,33
AT1G34790 C2H2 4,15 0,54 0,00 0,09
AT2G27630 C2H2 5,44 0,02 1,36 0,73
AT3G01030 C2H2 -‐7,65 0,43 -‐0,63 0,84
AT5G15480 C2H2 -‐5,11 0,31 -‐0,45 0,79
AT5G40310 C2H2 6,65 0,07 -‐0,01 0,87
AT5G56200 C2H2 -‐4,93 0,73 -‐0,25 0,97
AT5G61470 C2H2 4,54 0,63 0,00 0,93
AT2G47810 CCAAT-‐HAP3 -‐5,29 0,94 0,63 0,62
AT3G13960 GRF -‐5,51 0,27 0,98 0,11
AT2G36610 HB -‐4,20 0,83 0,20 0,16
AT3G03660 HB -‐4,82 0,01 0,00 0,49
AT3G11260 HB 7,42 0,04 -‐1,98 0,23
AT3G27970 HB 7,94 0,88 0,00 0,89
AT3G55210 HB 4,55 0,69 -‐2,20 0,41
AT4G08150 HB -‐6,70 0,45 1,12 0,67
AT5G19520 HB -‐6,55 0,71 1,82 0,01
AT5G46010 HB 7,02 0,05 0,00 0,15
AT5G53980 HB 6,74 0,66 -‐0,19 0,43
AT1G34650 HB 7,20 0,52 -‐2,62 0,93
AT3G51910 HSF -‐4,81 1,00 -‐0,01 0,96
AT2G38950 JUMONJI -‐7,20 0,73 -‐1,03 0,78
AT3G04100 MADS -‐6,20 0,28 0,00 0,81
AT4G09960 MADS -‐5,15 0,82 -‐1,05 0,44
AT4G36590 MADS -‐4,03 0,72 0,53 0,74
AT5G27090 MADS -‐7,33 0,87 -‐0,43 0,35
AT5G27810 MADS -‐5,99 0,12 0,00 0,00
AT5G37415 MADS -‐5,52 0,99 0,00 0,47
AT5G40120 MADS -‐4,35 0,97 0,00 0,12
AT5G40220 MADS 6,68 0,41 0,23 0,82
AT1G28450 MADS -‐4,08 0,25 -‐0,92 0,42
AT1G59810 MADS -‐5,65 0,20 -‐0,38 0,61
AT1G60920 MADS -‐4,54 0,59 -‐0,07 0,15
AT2G03060 MADS -‐5,70 0,53 1,35 0,80
AT2G42830 MADS -‐6,92 0,48 0,95 0,54
AT1G68320 MYB -‐5,81 0,31 1,94 0,02
AT5G10280 MYB -‐4,00 0,40 0,00 0,07
AT5G11050 MYB -‐5,40 0,54 0,86 0,90
AT5G14750 MYB 6,90 0,84 0,00 0,67
AT2G26950 MYB 6,60 0,78 0,67 0,74
AT5G17800 MYB -‐4,36 0,86 0,00 0,62
AT5G39700 MYB -‐7,60 0,04 0,62 0,64
AT1G17950 MYB -‐7,17 0,75 0,58 0,15
AT3G61250 MYB -‐4,71 0,15 0,27 0,32
AT1G18960 MYB -‐5,00 0,65 1,54 0,21
AT1G56160 MYB -‐4,50 0,94 -‐0,69 0,66
AT1G66380 MYB 7,12 0,19 1,85 0,19
AT2G46770 NAC 5,35 0,20 -‐0,55 0,01
AT3G18400 NAC 5,32 0,71 0,01 0,24
AT4G17980 NAC -‐5,55 0,32 0,72 0,75
AT5G41090 NAC -‐4,52 0,14 0,31 0,82
AT1G18790 NIN-‐like 6,91 0,01 0,00 0,70
AT4G38340 NIN-‐like 6,94 0,82 0,36 0,17
AT2G21400 SRS 6,51 0,26 -‐0,74 0,17
AT1G05690 TAZ -‐11,89 0,38 -‐0,28 0,69
AT2G20825 ULT -‐4,36 0,25 -‐2,63 0,53
AT5G01900 WRKY 7,21 0,86 0,92 0,96
AT5G22570 WRKY 11,30 0,66 0,73 0,55
AT5G43290 WRKY 7,21 0,21 0,97 0,97
AT1G30650 WRKY -‐7,07 0,63 0,83 0,69
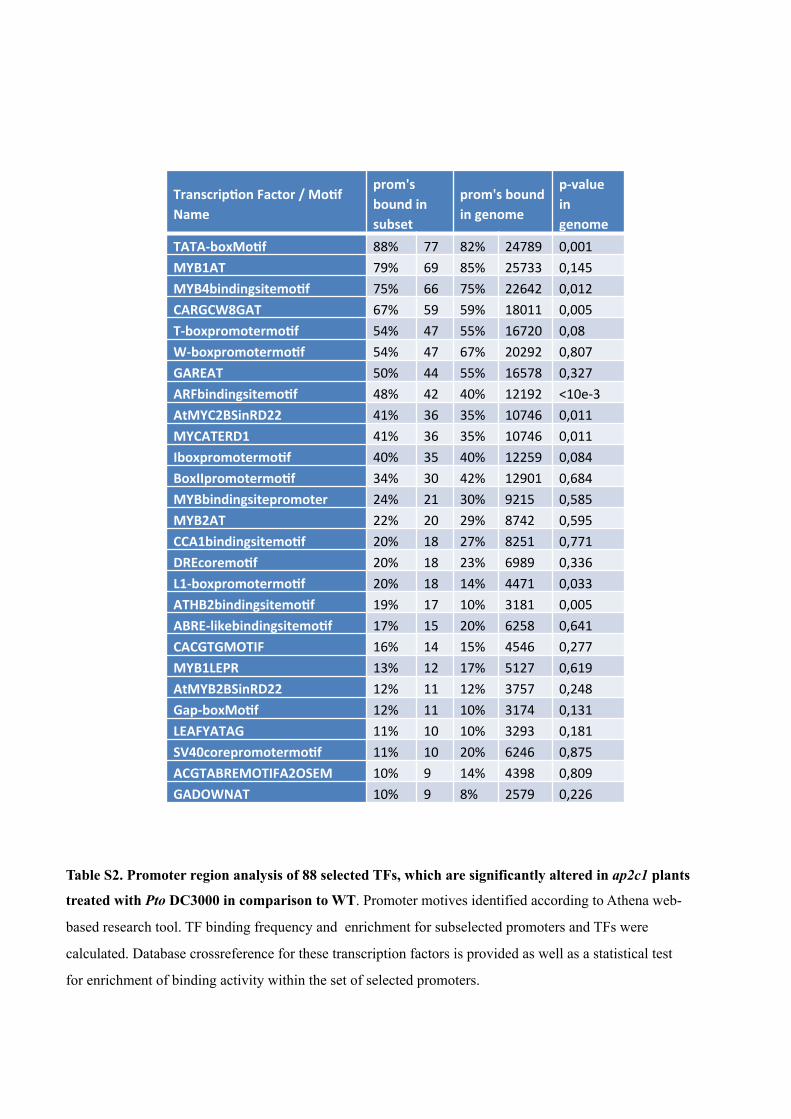
TranscripIon Factor / MoIf Name
prom's bound in subset
prom's bound in genome
p-‐value in genome
TATA-‐boxMoIf 88% 77 82% 24789 0,001 MYB1AT 79% 69 85% 25733 0,145 MYB4bindingsitemoIf 75% 66 75% 22642 0,012 CARGCW8GAT 67% 59 59% 18011 0,005 T-‐boxpromotermoIf 54% 47 55% 16720 0,08 W-‐boxpromotermoIf 54% 47 67% 20292 0,807 GAREAT 50% 44 55% 16578 0,327 ARFbindingsitemoIf 48% 42 40% 12192 <10e-‐3 AtMYC2BSinRD22 41% 36 35% 10746 0,011 MYCATERD1 41% 36 35% 10746 0,011 IboxpromotermoIf 40% 35 40% 12259 0,084 BoxIIpromotermoIf 34% 30 42% 12901 0,684 MYBbindingsitepromoter 24% 21 30% 9215 0,585 MYB2AT 22% 20 29% 8742 0,595 CCA1bindingsitemoIf 20% 18 27% 8251 0,771 DREcoremoIf 20% 18 23% 6989 0,336 L1-‐boxpromotermoIf 20% 18 14% 4471 0,033 ATHB2bindingsitemoIf 19% 17 10% 3181 0,005 ABRE-‐likebindingsitemoIf 17% 15 20% 6258 0,641 CACGTGMOTIF 16% 14 15% 4546 0,277 MYB1LEPR 13% 12 17% 5127 0,619 AtMYB2BSinRD22 12% 11 12% 3757 0,248 Gap-‐boxMoIf 12% 11 10% 3174 0,131 LEAFYATAG 11% 10 10% 3293 0,181 SV40corepromotermoIf 11% 10 20% 6246 0,875 ACGTABREMOTIFA2OSEM 10% 9 14% 4398 0,809 GADOWNAT 10% 9 8% 2579 0,226
Table S2. Promoter region analysis of 88 selected TFs, which are significantly altered in ap2c1 plants
treated with Pto DC3000 in comparison to WT. Promoter motives identified according to Athena web-
based research tool. TF binding frequency and enrichment for subselected promoters and TFs were
calculated. Database crossreference for these transcription factors is provided as well as a statistical test
for enrichment of binding activity within the set of selected promoters.
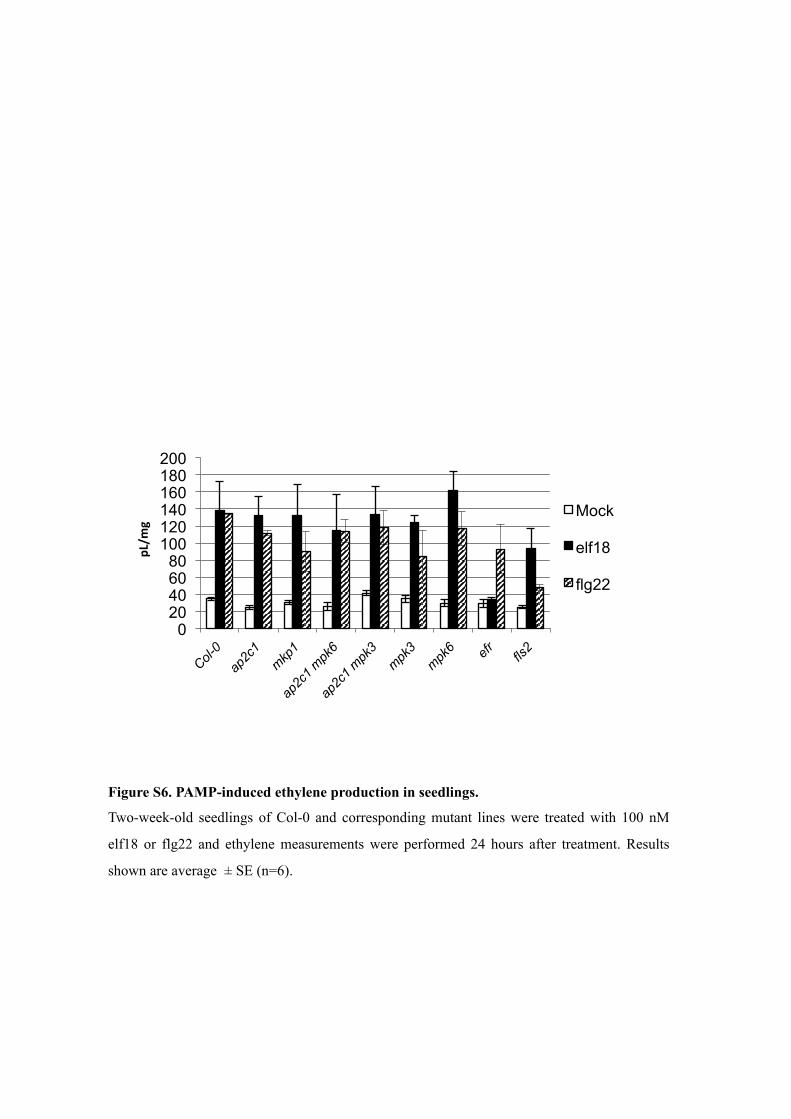
Figure S6. PAMP-induced ethylene production in seedlings.
Two-week-old seedlings of Col-0 and corresponding mutant lines were treated with 100 nM
elf18 or flg22 and ethylene measurements were performed 24 hours after treatment. Results
shown are average ± SE (n=6).
0 20 40 60 80
100 120 140 160 180 200
pL/m
g
Mock
elf18
flg22
WT ap2c1
AP2C1-‐oe
mkp1 efr
Col-‐0 ap2c1
AP2C1 OE mkp1
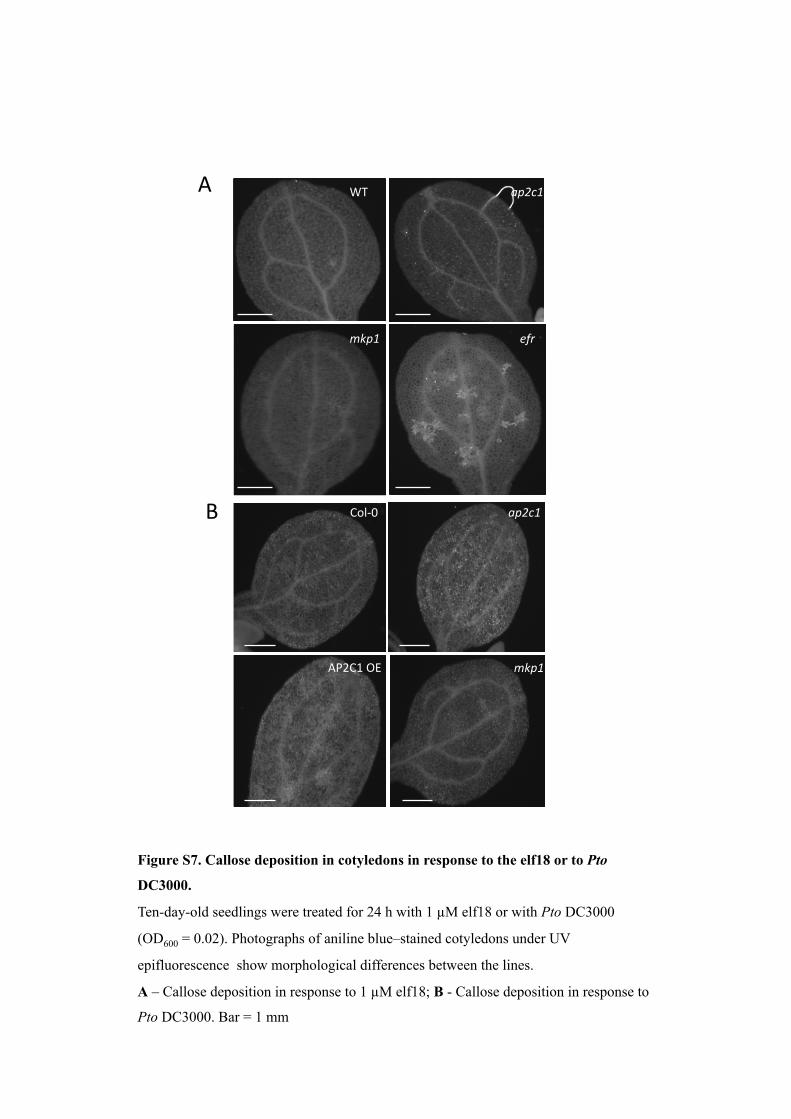
Figure S7. Callose deposition in cotyledons in response to the elf18 or to Pto
DC3000.
Ten-day-old seedlings were treated for 24 h with 1 µM elf18 or with Pto DC3000
(OD600 = 0.02). Photographs of aniline blue–stained cotyledons under UV
epifluorescence show morphological differences between the lines.
A – Callose deposition in response to 1 µM elf18; B - Callose deposition in response to
Pto DC3000. Bar = 1 mm
A
B