Embed Size (px)
Citation preview
Direct-WEPCO/WPSC-Hagerty-1
BEFORE THE
PUBLIC SERVICE COMMISSION OF WISCONSIN
Joint Application of Wisconsin Public Service )
Corporation and Wisconsin Electric Power )
Company for Authority to Construct the Weston ) Docket 5-CE-153
Reciprocating Internal Combustion Engine )
Project in the Villages of Rothschild and )
Kronenwetter, Marathon County, Wisconsin )
DIRECT TESTIMONY OF JOHN MICHAEL HAGERTY
ON BEHALF OF WISCONSIN PUBLIC SERVICE CORPORATION AND
WISCONSIN ELECTRIC POWER COMPANY
Q. Please state your name, business address, and position. 1
A. My name is John Michael Hagerty. My business address is 1800 M St Northwest, 2
Washington, DC 20036. My current position is Senior Associate for The Brattle Group 3
(“Brattle”). 4
5
Q. Please describe your education and professional background. 6
A. I received a M.S. in Technology and Policy from the Massachusetts Institute of 7
Technology and a B.S. in Chemical Engineering from the University of Notre Dame. 8
I have 10 years of experience in utility and electric power industry planning and 9
regulatory reviews, including studies of wholesale market design to achieve resource 10
adequacy requirements in MISO, studies on the cost of new entry (“CONE”) in PJM, 11
ISO-NE, and Alberta, Canada, utility resource planning in Arizona, Kansas, and North 12
Carolina, renewable energy resource economics and policy in numerous states, including 13
Nebraska, Illinois, Pennsylvania and California, transmission system upgrade needs in 14
MISO, SPP, ERCOT, CAISO, NYISO, and ISO-NE, and optimized approaches to 15
PSC REF#:420387Public Service Commission of Wisconsin
RECEIVED: 09/09/2021 1:23:05 PM
Direct-WEPCO/WPSC-Hagerty-2
economy-wide deep decarbonization across the U.S. and specifically in California and 1
New England. 2
Prior to joining Brattle, I was a research assistant at the MIT Energy Initiative 3
focusing on renewable energy integration in the electric power sector and industrial uses 4
of natural gas, a chemical process engineer at Honeywell advising the startup of new oil 5
refinery process units in the U.S., Japan, Thailand, Vietnam and Saudi Arabia, and a 6
research chemist at GE Global Research developing low emissions automotive coatings. 7
8
Q. Have you previously testified before the Wisconsin Commission? 9
A. No, but I have testified before the Alberta Utility Commission concerning the costs of 10
new gas-fired resources in the Alberta Electric System Operator market and submitted 11
affidavits to FERC concerning the costs of new and existing generation resources on 12
behalf of PJM, end of life transmission planning processes on behalf of LS Power, and 13
transmission needs for transportation electrification on behalf of Michigan Electric 14
Transmission Company. I have also co-written filed regulatory reports to the California 15
Public Utilities Commission on the benefits of new high-voltage transmission facilities 16
and to the Public Service Commission of the District of Columbia on electricity demand 17
growth from transportation and heating electrification. 18
19
Q. Are you submitting any exhibits with your testimony? 20
A. Yes, I am submitting the following exhibits: 21
Ex.-WEPCO/WPSC-Hagerty-1: Resume of John Michael Hagerty; 22
Direct-WEPCO/WPSC-Hagerty-3
Ex.-WEPCO/WPSC-Hagerty-2: Entergy New Orleans Editorial Team, “New Orleans 1
Power State: An Important Resource in the Ida Restoration Process,” September 2, 2
2021; 3
Ex.-WEPCO/WPSC-Hagerty-3: Energy Information Administration (“EIA”), 4
“Capital Cost and Performance Characteristic Estimate for Utility Scale Electric 5
Power Generating Technologies,” February 2020; 6
Ex.-WEPCO/WPSC-Hagerty-4: Steven Martinez, “Three days later, more than 7
18,000 We Energies customers still do not have power,” Milwaukee Journal Sentinel, 8
August 13, 2021; 9
Ex.-WEPCO/WPSC-Hagerty-5: Midcontinent Independent System Operator 10
(“MISO”), “MISO January 30-31 Maximum Generation Event Overview,” February 11
27, 2019; 12
Ex.-WEPCO/WPSC-Hagerty-6: MISO, “Aligning Resource Availability and Need,” 13
December 2019; 14
Ex.-WEPCO/WPSC-Hagerty-7: MISO, “MISO Futures Report,” April 2021; 15
Ex.-WEPCO/WPSC-Hagerty-8: Roger Lueken, et al., “New York’s Evolution to a 16
Zero Emission Power System,” June 22, 2020; 17
Ex.-WEPCO/WPSC-Hagerty-9: Jurgen Weiss and J. Michael Hagerty, “Achieving 18
80% GHG Reduction in New England by 2050,” September 2019. 19
Ex.-WEPCO/WPSC-Hagerty-10: U.S. Department of Energy (“DOE”), “Solar 20
Futures Study,” September 2021; 21
Ex.-WEPCO/WPSC-Hagerty-11: Wärtsilä Corporation, “Wärtsilä gas engines to burn 22
100% hydrogen,” May 5, 2020; 23
Direct-WEPCO/WPSC-Hagerty-4
Ex.-WEPCO/WPSC-Hagerty-12: Wärtsilä Corporation, “New Orleans chooses 1
Wärtsilä Smart Power solution for new power plant,” March 21, 2018; 2
Ex.-WEPCO/WPSC-Hagerty-13: Wayne Barber, “Mid-Kansas plans 110 MW of new 3
natural gas generation,” Transmission Hub, August 17, 2012; 4
Ex.-WEPCO/WPSC-Hagerty-14: Xcel Energy, “Upper Midwest Integrated Resource 5
Plan 2020–2034,” July 1, 2019; 6
Ex.-WEPCO/WPSC-Hagerty-15: DTE Energy, “2019 Integrated Resource Plan 7
Summary: Clean, Reliable Solutions to Power Michigan’s Future,” 2019; 8
Ex.-WEPCO/WPSC-Hagerty-16: CenterPoint Energy, “CenterPoint Energy proposes 9
next step in Smart Energy Future Plan,” June 17, 2021; and 10
Ex.-WEPCO/WPSC-Hagerty-17: Central Iowa Power Cooperative (“CIPCO”), 11
“CIPCO’s Summit Lake Expansion Project Reaches Commercial Operation,” April 12
21, 2021. 13
14
Q. Were these exhibits prepared or compiled by you or at your direction? 15
A. Yes. 16
17
Q. What is the purpose of your direct testimony? 18
A. I understand that Wisconsin Electric Power Company (“WEPCO”) and Wisconsin Public 19
Service Corporation (“WPSC”) (collectively, the “Joint Applicants”), which are both 20
electric utility subsidiaries of WEC Energy Group Inc. (“WEC”), are proposing to 21
construct a new reciprocating internal combustion engine (“RICE”) generating facility at 22
the Weston Generating Station as part of WEC’s Generation Reshaping Plan (“GRP”). 23
Direct-WEPCO/WPSC-Hagerty-5
The GRP includes retirement of several coal-fired units and their replacement primarily 1
by new solar and storage resources by 2025, with the goal of significantly shifting the 2
Joint Applicants’ resource portfolios towards lower carbon emission generation 3
resources, while maintaining an economic, safe and reliable electric generation fleet to 4
serve their customers. The RICE units to be installed at Weston are a small part of the 5
GRP and are intended to provide system support and energy timing benefits that are 6
difficult to achieve with renewables and storage. My testimony provides an evaluation of 7
the cost effectiveness and system benefits of the Weston RICE units as part of the Joint 8
Applicants’ proposed generation portfolio. 9
10
I. SUMMARY OF CONCLUSIONS 11
Q. Please summarize the conclusions you reach in your direct testimony. 12
A. I conclude the following: 13
The Weston RICE units are a cost-effective resource addition to serve Joint 14
Applicants’ load obligations due to their low all-in operating and capital recovery 15
costs and unique performance capabilities for an increasingly decarbonized system. 16
These performance capabilities include the ability to efficiently generate power when 17
needed to meet peak demand and during periods with low or no renewable 18
generation, to ramp quickly up and down in response to unexpected perturbation in 19
the system, and to provide additional resilience benefits. The results of the Joint 20
Applicants’ computer simulations demonstrate that the unique characteristics of the 21
proposed 7-unit RICE resource meet the system needs at least cost to customers even 22
when alternative technologies were available to be selected by the model. 23
Direct-WEPCO/WPSC-Hagerty-6
The Weston RICE units can provide additional benefits in a highly decarbonized 1
power system that were not captured by Joint Applicants’ simulations. In particular, 2
those analyses did not capture the additional cost savings under possible scenarios 3
with lower gas costs or during “droughts” in production from renewable energy 4
resources (that are difficult to model but which will occur), or the need for sudden 5
balancing in response to unplanned swings in hourly renewable energy generation. 6
These are all situations where the Weston RICE units would have more value than 7
has been quantified in the Joint Applicants’ simulations. 8
Notwithstanding the Joint Applicants’ desire for a clean power system over the next 9
few years, numerous studies of deep decarbonization find that dispatchable gas-fired 10
resources will be needed to play a key role in reducing costs and assuring reliability 11
in a future highly decarbonized power system. The Weston RICE units can reliably 12
serve this role over the coming decades. 13
Currently, many other utilities have found or are considering similar additions of 14
RICE or other gas-fired resources as a part of their optimized supply portfolio as they 15
shift towards low emitting resources to replace coal plants. 16
17
II. SUMMARY OF THE JOINT APPLICANTS’ ANALYSIS 18
Q. Please describe the primary drivers for the Joint Applicants’ decision to add new 19
generation resources to their system. 20
A. Traditionally, generating resources are added to meet load growth. Here that is not the 21
case. Instead, the Joint Applicants are planning to retire 1,385 MW of coal-fired power 22
plants (Oak Creek 5 – 8 and Columbia 1-2) and 190 MW of natural gas-fired peaking 23
Direct-WEPCO/WPSC-Hagerty-7
generation by 2025, which will decrease the amount of generation capacity and energy 1
available to serve their existing native load and to meet their resource adequacy 2
requirements. The new generation and storage resources are intended to replace the lost 3
capacity and energy from the retiring coal-fired and gas-fired plants while reducing the 4
greenhouse gas (“GHG”) emissions to meet the Joint Applicants’ goals of 60% and 80% 5
reductions by 2025 and 2030, respectively (from 2005 levels), and full net carbon 6
neutrality by 2050. These goals are consistent with the recommendations released in 7
December 2020 by Governor Evers’ Climate Task Force. 8
9
Q. What resources did the Joint Applicants consider in their GRP planning analyses? 10
A. The Joint Applicants considered multiple types of resources with diverse attributes as 11
candidates for replacing the retired capacity and energy while reducing GHG emissions 12
in a cost effective and reliable manner, including renewable energy resources (i.e., solar 13
and wind), battery energy storage systems (“BESS”), and several types of natural gas-14
fired resources, including combined cycle gas turbines (“CC”) and simple cycle gas 15
turbines (“CT”), and RICE. 16
Solar and wind generation resources can provide the Joint Applicants with zero 17
emission electricity generation that will reduce the CO2 emissions of their generation 18
portfolio. Both solar and wind generation are increasingly cost-effective as energy 19
resources compared to new fossil-fired generation. But these resources are dependent on 20
the intermittent availability of solar irradiation or wind for generating electricity that 21
varies by hour, by day, by season and by year. For example, solar resources are relatively 22
predictable based on the daily cycles of solar irradiation but naturally produce more 23
Direct-WEPCO/WPSC-Hagerty-8
electricity in the summer than winter, and they are vulnerable to periods of lower output 1
due to cloud cover. Wind resources are less predictable on an hourly and daily basis, are 2
likewise intermittent, but tend to generate more electricity at night and in the winter 3
(which can complement solar’s generation patterns). Neither resource is dispatchable, 4
though they can be curtailed during periods of excess generation to provide some 5
reliability services. Because of their dependence on weather conditions rather than direct 6
control by system operators, they provide less reliable capacity per MW of nameplate 7
capacity than more conventional dispatchable resources. 8
BESS resources using lithium-ion technology can play a key role in balancing 9
system demand and supply by charging during periods of excess renewable energy 10
generation and/or low market energy prices and then discharging during periods of higher 11
demand when renewable energy generation is low and/or energy prices are high. BESS 12
resources are limited by its “duration,” or the amount of time that the resource can inject 13
power into the grid at 100% of its rated capacity on a full charge. In particular, the BESS 14
resources considered by the Joint Applicants are limited to a four-hour duration due to the 15
higher capital costs of longer duration BESS resources. BESS resources can play a 16
crucial role by shifting the generation from renewable energy resources to periods of 17
higher demand when cost effective to do so and when there is sufficient foresight into 18
future system needs. The costs of BESS systems are declining rapidly such that they are 19
becoming cost effective to deploy at scale, but their 4-hour duration means they are not a 20
full substitute for dispatchable resources, such as gas-fired resources. 21
Natural gas-fired resources have been the mainstay of recent utility industry 22
generation capacity expansion, which has been dominated for 20 years or so by CC and 23
Direct-WEPCO/WPSC-Hagerty-9
CT units. There now are several different gas-fired technologies with varying balance of 1
capital costs, operating costs, CO2 emissions rates, and flexibility. Compared to CTs, the 2
RICE technology can start up and ramp faster and at lower cost and operate more 3
efficiently (e.g., burn less fuel per MWh of generation) both at full load and partial load. 4
RICE resources tend to have higher capital costs than CTs, but multiple-unit sites, such as 5
the one planned at Weston, can achieve lower capital costs per megawatt of installed 6
capacity. Compared to CCs, the RICE units are less efficient but are able to economically 7
cycle off and on more often and to lower load levels without loss of efficiency to meet 8
shorter demand periods when renewable energy resources are not available to produce. 9
Due to their flexibility and efficiency, RICE units are cost effective resources to dispatch 10
both on a day-ahead forecasted basis to provide low cost generation to serve demand and 11
in real-time to mitigate the costs of unplanned changes in system conditions. 12
Similar to other gas resources, RICE units provide black-start capability that can 13
support system restoration following a partial or complete collapse, as recently 14
demonstrated by the RICE units in New Orleans following Hurricane Ida.1 15
Because of these added performance capabilities, RICE units typically have 16
higher capital costs than alternative gas-fired technologies, as shown in recent EIA cost 17
projections.2 In this case, the Joint Applicants identified a lower capital cost plant by 18
installing a 7-unit plant at the existing Weston site with the same design as the Kuester 19
RICE plant recently installed in the Upper Peninsula of Michigan by another WEC 20
electric utility subsidiary. 21
1 Ex.-WEPCO/WPSC-Hagerty-2. 2 RICE plants estimated to cost $1,810/kW versus $1,175/kW for a simple cycle aeroderivative CT.
Ex.-WEPCO/WPSC-Hagerty-3, at 28.
Direct-WEPCO/WPSC-Hagerty-10
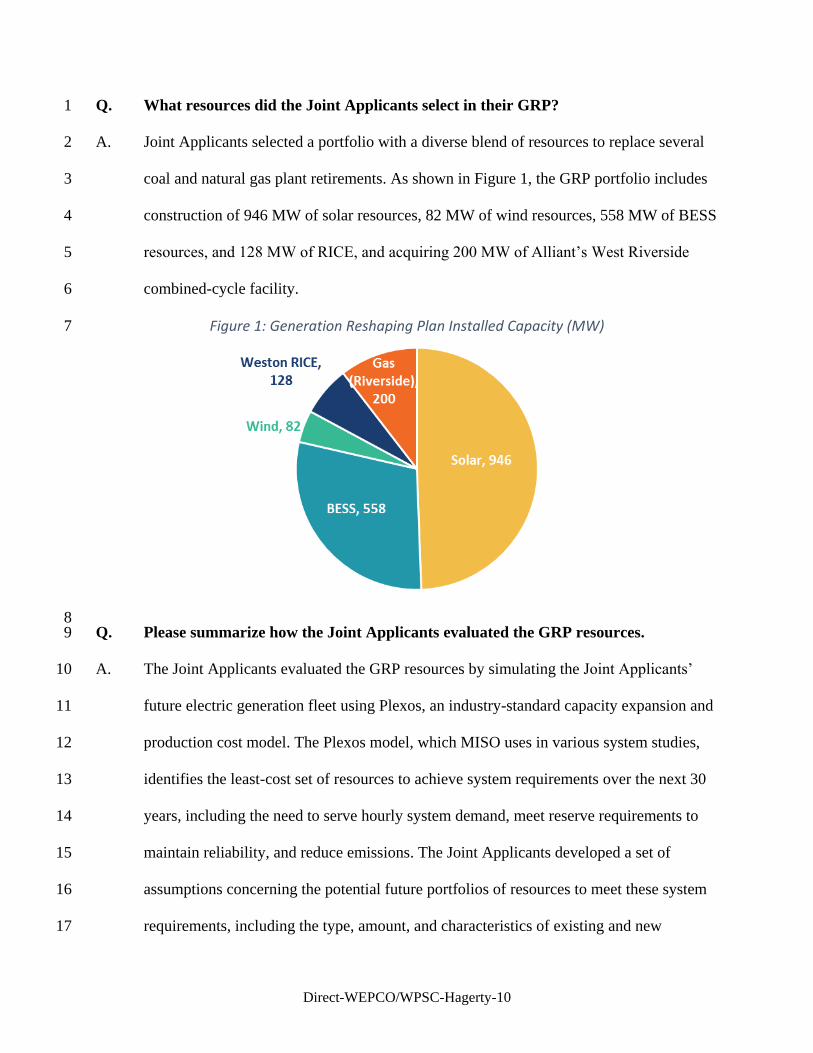
Q. What resources did the Joint Applicants select in their GRP? 1
A. Joint Applicants selected a portfolio with a diverse blend of resources to replace several 2
coal and natural gas plant retirements. As shown in Figure 1, the GRP portfolio includes 3
construction of 946 MW of solar resources, 82 MW of wind resources, 558 MW of BESS 4
resources, and 128 MW of RICE, and acquiring 200 MW of Alliant’s West Riverside 5
combined-cycle facility. 6
Figure 1: Generation Reshaping Plan Installed Capacity (MW) 7
8 Q. Please summarize how the Joint Applicants evaluated the GRP resources. 9
A. The Joint Applicants evaluated the GRP resources by simulating the Joint Applicants’ 10
future electric generation fleet using Plexos, an industry-standard capacity expansion and 11
production cost model. The Plexos model, which MISO uses in various system studies, 12
identifies the least-cost set of resources to achieve system requirements over the next 30 13
years, including the need to serve hourly system demand, meet reserve requirements to 14
maintain reliability, and reduce emissions. The Joint Applicants developed a set of 15
assumptions concerning the potential future portfolios of resources to meet these system 16
requirements, including the type, amount, and characteristics of existing and new 17
Direct-WEPCO/WPSC-Hagerty-11
resources (including planned retirement dates) and other key assumptions, such as fuel 1
(i.e., natural gas and coal) prices, MISO energy and capacity market prices, and GHG 2
emissions-related assumptions. 3
The Joint Applicants then ran simulations of their system in Plexos, which selects 4
cost effective new resources to build (in this case, additional new resources beyond the 5
GRP) and which resources to dispatch to meet future requirements to minimize costs to 6
its customers over 30 years. The Joint Applicants simulated their generation fleet under a 7
Base Case set of assumptions and 11 additional sensitivities. For each case, the Joint 8
Applicants simulated the optimized dispatch and calculated resulting annual net costs, 9
from which savings were derived relative to a case in which the Joint Applicants 10
maintained their current resource mix. The Joint Applicants then estimated the present 11
value of the cost savings for each scenario relative to the status quo. 12
The Joint Applicants determined that the GRP would save customers $888 million 13
over the 30 year period on a net present value basis for the combined WPSC/WEPCO 14
system under the Base Case assumptions, and in the range of $477 million to $1,183 15
million under sensitivity cases spanning alternative forecasts for natural gas prices, CO2 16
prices, resource assumptions, and GRP resource costs. 17
18
Q. Have Joint Applicants performed additional analyses to confirm the cost 19
effectiveness of Weston RICE units? 20
A. Yes. In addition to the analysis described above, the Joint Applicants also ran additional 21
simulations in Plexos in response to a data request from the PSC (PSC-Grant-1). In those 22
simulations, the Plexos model selected new resources from the available resources 23
Direct-WEPCO/WPSC-Hagerty-12
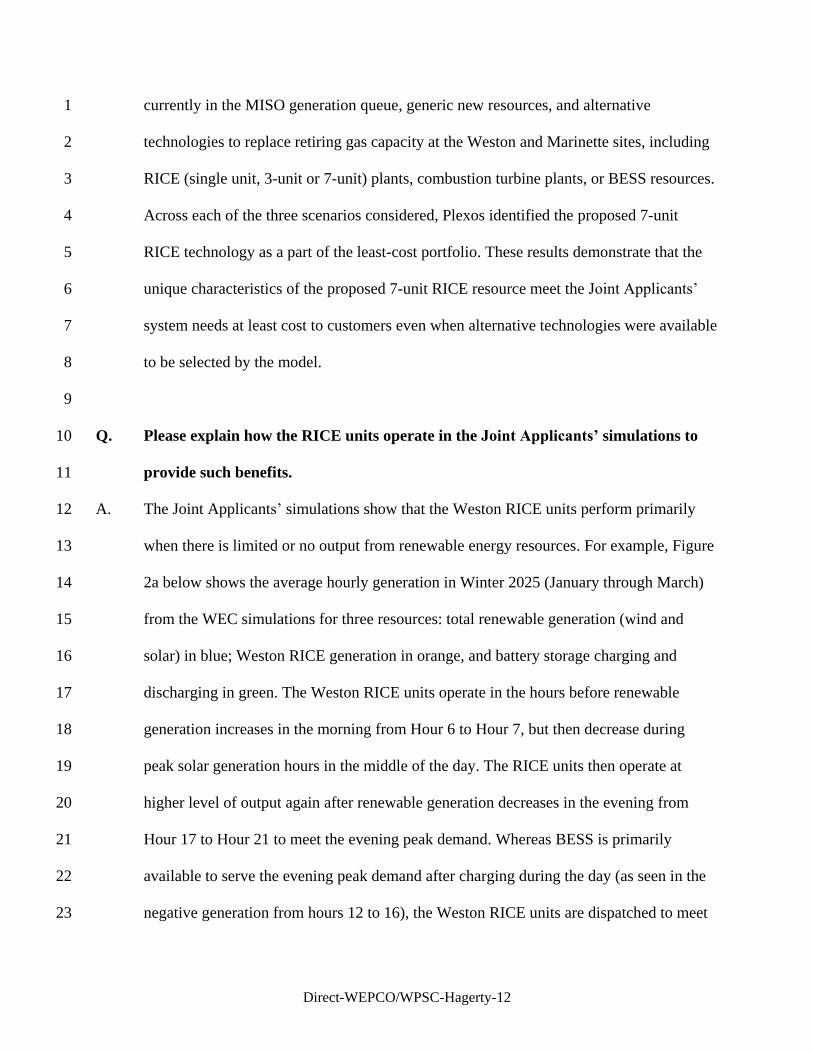
currently in the MISO generation queue, generic new resources, and alternative 1
technologies to replace retiring gas capacity at the Weston and Marinette sites, including 2
RICE (single unit, 3-unit or 7-unit) plants, combustion turbine plants, or BESS resources. 3
Across each of the three scenarios considered, Plexos identified the proposed 7-unit 4
RICE technology as a part of the least-cost portfolio. These results demonstrate that the 5
unique characteristics of the proposed 7-unit RICE resource meet the Joint Applicants’ 6
system needs at least cost to customers even when alternative technologies were available 7
to be selected by the model. 8
9
Q. Please explain how the RICE units operate in the Joint Applicants’ simulations to 10
provide such benefits. 11
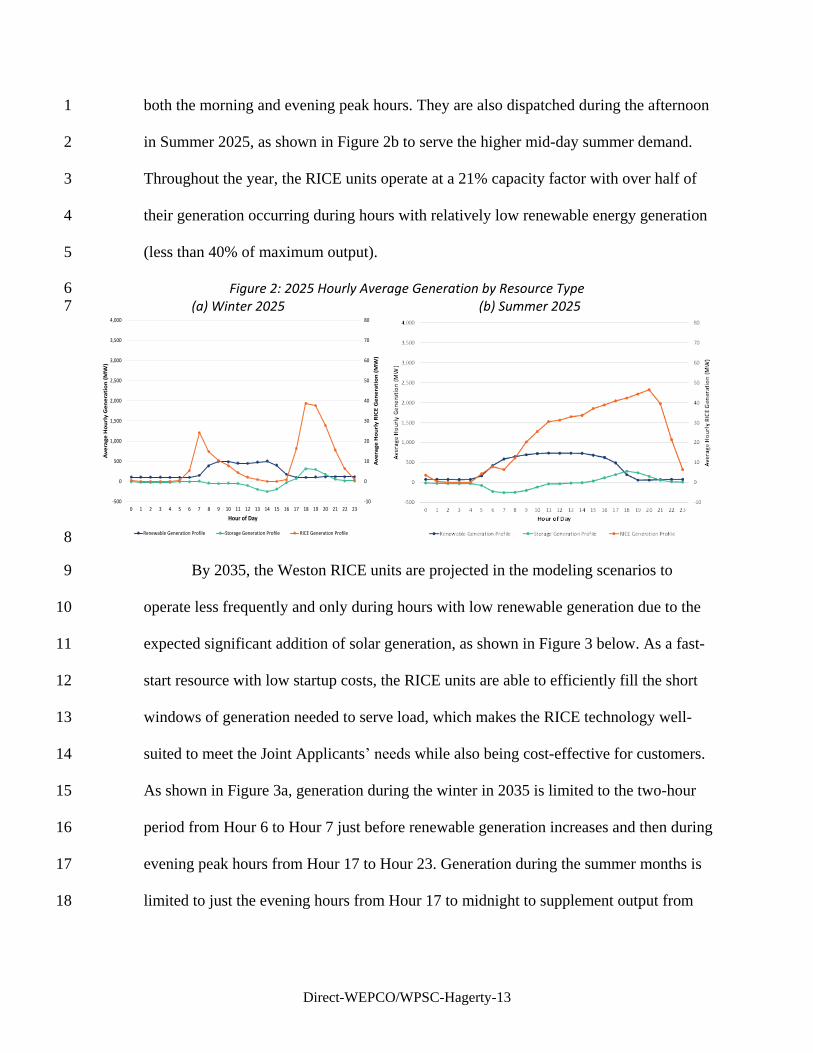
A. The Joint Applicants’ simulations show that the Weston RICE units perform primarily 12
when there is limited or no output from renewable energy resources. For example, Figure 13
2a below shows the average hourly generation in Winter 2025 (January through March) 14
from the WEC simulations for three resources: total renewable generation (wind and 15
solar) in blue; Weston RICE generation in orange, and battery storage charging and 16
discharging in green. The Weston RICE units operate in the hours before renewable 17
generation increases in the morning from Hour 6 to Hour 7, but then decrease during 18
peak solar generation hours in the middle of the day. The RICE units then operate at 19
higher level of output again after renewable generation decreases in the evening from 20
Hour 17 to Hour 21 to meet the evening peak demand. Whereas BESS is primarily 21
available to serve the evening peak demand after charging during the day (as seen in the 22
negative generation from hours 12 to 16), the Weston RICE units are dispatched to meet 23
Direct-WEPCO/WPSC-Hagerty-13
both the morning and evening peak hours. They are also dispatched during the afternoon 1
in Summer 2025, as shown in Figure 2b to serve the higher mid-day summer demand. 2
Throughout the year, the RICE units operate at a 21% capacity factor with over half of 3
their generation occurring during hours with relatively low renewable energy generation 4
(less than 40% of maximum output). 5
Figure 2: 2025 Hourly Average Generation by Resource Type 6 (a) Winter 2025 (b) Summer 2025 7
8
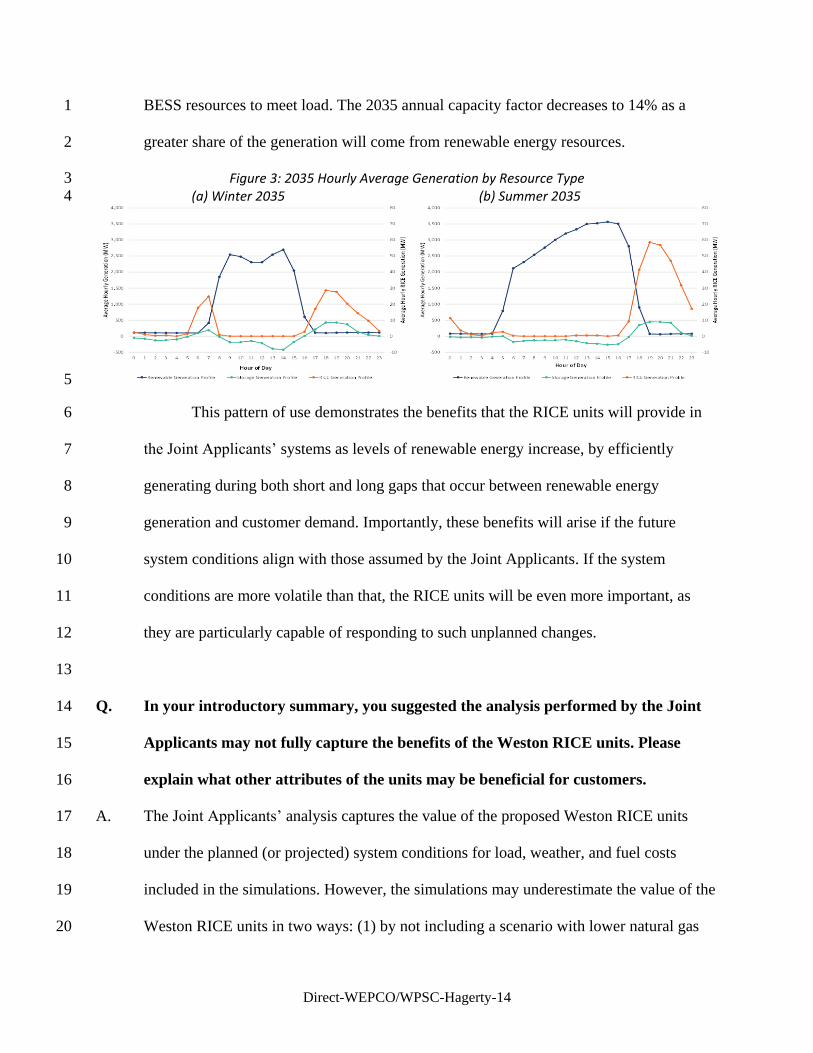
By 2035, the Weston RICE units are projected in the modeling scenarios to 9
operate less frequently and only during hours with low renewable generation due to the 10
expected significant addition of solar generation, as shown in Figure 3 below. As a fast-11
start resource with low startup costs, the RICE units are able to efficiently fill the short 12
windows of generation needed to serve load, which makes the RICE technology well-13
suited to meet the Joint Applicants’ needs while also being cost-effective for customers. 14
As shown in Figure 3a, generation during the winter in 2035 is limited to the two-hour 15
period from Hour 6 to Hour 7 just before renewable generation increases and then during 16
evening peak hours from Hour 17 to Hour 23. Generation during the summer months is 17
limited to just the evening hours from Hour 17 to midnight to supplement output from 18
-10
0
10
20
30
40
50
60
70
80
-500
0
500
1,000
1,500
2,000
2,500
3,000
3,500
4,000
0 1 2 3 4 5 6 7 8 9 10 11 12 13 14 15 16 17 18 19 20 21 22 23
Av
era
ge
Ho
url
y R
ICE
Ge
ne
rati
on
(M
W)
Av
era
ge
Ho
url
y G
en
era
tio
n (
MW
)
Hour of Day
Generation Profile by Resource, Winter 2025
Renewable Generation Profile Storage Generation Profile RICE Generation Profile
Direct-WEPCO/WPSC-Hagerty-14
BESS resources to meet load. The 2035 annual capacity factor decreases to 14% as a 1
greater share of the generation will come from renewable energy resources. 2
Figure 3: 2035 Hourly Average Generation by Resource Type 3 (a) Winter 2035 (b) Summer 2035 4
5
This pattern of use demonstrates the benefits that the RICE units will provide in 6
the Joint Applicants’ systems as levels of renewable energy increase, by efficiently 7
generating during both short and long gaps that occur between renewable energy 8
generation and customer demand. Importantly, these benefits will arise if the future 9
system conditions align with those assumed by the Joint Applicants. If the system 10
conditions are more volatile than that, the RICE units will be even more important, as 11
they are particularly capable of responding to such unplanned changes. 12
13
Q. In your introductory summary, you suggested the analysis performed by the Joint 14
Applicants may not fully capture the benefits of the Weston RICE units. Please 15
explain what other attributes of the units may be beneficial for customers. 16
A. The Joint Applicants’ analysis captures the value of the proposed Weston RICE units 17
under the planned (or projected) system conditions for load, weather, and fuel costs 18
included in the simulations. However, the simulations may underestimate the value of the 19
Weston RICE units in two ways: (1) by not including a scenario with lower natural gas 20
Direct-WEPCO/WPSC-Hagerty-15
prices than the current U.S. Energy Information Administration’s Annual Energy Outlook 1
(“AEO”) forecasts, e.g. closer to the prices reflected in current natural gas futures prices, 2
which would reduce the costs of operating the RICE plant, and (2) by modeling 3
normalized system conditions that do not reflect several real-world system stress 4
conditions, such as short- to mid-length periods (hours or a few days) of much higher 5
electricity demand, unplanned generation and transmission outages, and unexpected 6
variations (possibly including large gaps or “droughts”) in renewable generation. The 7
benefits of the Weston RICE units are likely to be high during these periods due to the 8
flexibility they provide to the Joint Applicants’ system. 9
10
Q. Please explain the additional benefits of the Weston RICE units in a future that 11
could have lower natural gas prices than were evaluated by the Joint Applicants. 12
A. The projected natural gas price has a significant impact on the operation of the Weston 13
RICE units as fuel costs are the primary operating costs for these resources and factor 14
into the frequency at which they operate and the costs of doing so. Higher natural gas 15
prices will increase the fuel costs of the Weston RICE units. In a system with a mix of 16
coal and gas resources, all else equal, higher fuel costs will result in the RICE units 17
operating less frequently and lower fuel costs will result in them operating more 18
frequently. 19
The Joint Applicants’ simulations of the GRP included three gas price scenarios: 20
(1) an AEO Reference Case based on the projected prices from the AEO 2020 Reference 21
Case, (2) a High Natural Gas case by calculating and adding one standard deviation to the 22
AEO Reference Case forecast, and (3) an AEO $15 CO2 Fee case, in which natural gas 23
Direct-WEPCO/WPSC-Hagerty-16
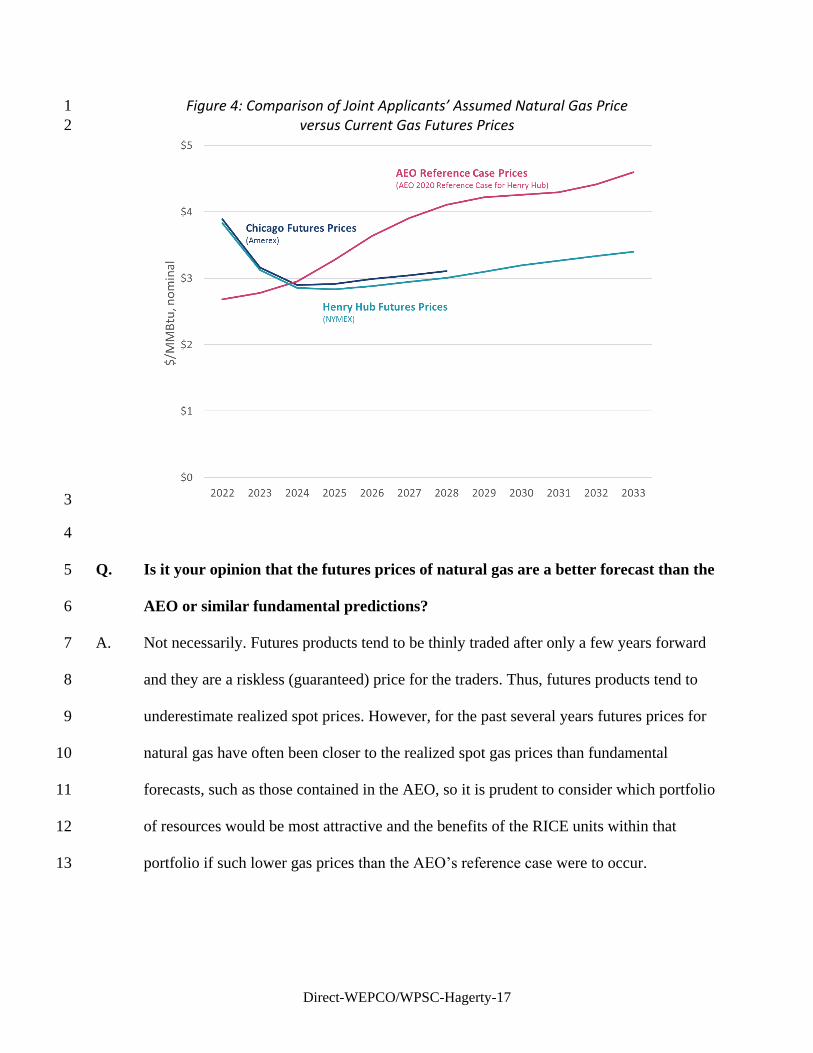
prices are slightly higher than the Reference Case through 2028 and then equivalent 1
through 2035. The simulations did not include a low natural gas price case that would 2
tend to increase the benefits of the RICE Plants. 3
I compared the natural gas prices in the Joint Applicants’ simulations from the 4
AEO 2020 Reference Case to the natural gas futures prices at two gas hubs as of 5
September 2, 2021: Chicago and Henry Hub, as shown in Figure 4 below. The futures 6
prices at the two gas hubs are very similar until 2028, the last year that Chicago prices are 7
available. As shown, the natural gas price the Joint Applicants assumed in their 8
simulations are about $1/MMBtu higher than the current futures prices on average from 9
2025 to 2033. If sustained, the lower natural gas prices reflected in the futures products 10
would decrease the production costs of the Weston RICE units by about $8/MWh, based 11
on the assumed RICE heat rate of 8,295 Btu/kWh, and would therefore increase how 12
frequently they are dispatched and the benefits accruing to customers from their inclusion 13
in the GRP. 14
Direct-WEPCO/WPSC-Hagerty-17
Figure 4: Comparison of Joint Applicants’ Assumed Natural Gas Price 1
versus Current Gas Futures Prices 2
3
4
Q. Is it your opinion that the futures prices of natural gas are a better forecast than the 5
AEO or similar fundamental predictions? 6
A. Not necessarily. Futures products tend to be thinly traded after only a few years forward 7
and they are a riskless (guaranteed) price for the traders. Thus, futures products tend to 8
underestimate realized spot prices. However, for the past several years futures prices for 9
natural gas have often been closer to the realized spot gas prices than fundamental 10
forecasts, such as those contained in the AEO, so it is prudent to consider which portfolio 11
of resources would be most attractive and the benefits of the RICE units within that 12
portfolio if such lower gas prices than the AEO’s reference case were to occur. 13
Direct-WEPCO/WPSC-Hagerty-18
III. ADDITIONAL BENEFITS WITH INCREASING RENEWABLE GENERATION 1
Q. Please elaborate on the real-world system stress conditions you mentioned above 2
that are not captured in the Joint Applicants’ simulations and would increase the 3
benefits of the Weston RICE units. 4
A. The simulation analysis performed by the Joint Applicants to evaluate the GRP assumed 5
normalized system conditions including projected system 50/50 peak demand, limited 6
unplanned outages of generation and transmission resources, and normalized renewable 7
generation profiles. However, the real-world power system must be able to respond to 8
unplanned system conditions that frequently stress the system and increase costs to 9
customers. The frequency of these stress conditions have been increasing recently. 10
For example, system demand frequently exceeds the planned peak demand 11
included in the simulations, but the cold weather that hit much of the United States in 12
February 2021 further stressed the system due to the geographic scope of the cold 13
temperatures and the extended length of the cold weather event. In mid-August 2021, 14
storms that swept across Wisconsin resulted in the largest outages of system 15
infrastructure in We Energies’ history.3 16
The increase in renewable energy resources is adding more frequent unplanned 17
stress conditions, as solar and wind generation can decrease dramatically within an hour 18
due to heavy cloud cover or shifting wind conditions such that other resources must be 19
available to respond. For example, MISO called a maximum generation emergency, or 20
“Max Gen” event, at 5 A.M. on January 30, 2019 due to an unexpected 6,000 MW 21
3 Ex.-WEPCO/WPSC-Hagerty-4.
Direct-WEPCO/WPSC-Hagerty-19
decrease in wind generation.4 The addition of the Weston RICE units would mitigate the 1
costs of these events to the Joint Applicants’ customers. 2
MISO has identified the reliability impacts of the shifting resource mix and 3
system conditions in a December 2019 whitepaper: 4
A total of 12 emergencies occurred beginning in the 2016-17 planning year 5
through half of the subsequent planning year. That trend has continued as MISO 6
entered MISO Market Capacity Emergency procedures 27 times through the 7
summer of 2019. These events have occurred multiple times in every season 8
reinforcing the notion that ‘every hour matters.’ This differs greatly from the 9
assumption that the system will be reliable for all 8,760 hours of the year as long 10
as utilities have enough generation capacity to meet demand on the ‘peak hour’ of 11
the year, which typically occurs on an exceptionally hot and humid summer day.5 12
13
Q. Please summarize the types of performance uncertainties and challenges that 14
renewable generation adds to the operation of the Joint Applicants’ power system. 15
A. The increasing amount of renewable generation resources added to the Joint Applicants’ 16
power system, and to the MISO region as a whole, creates additional mid-term (daily to 17
weekly) uncertainty and short-term (hourly) uncertainty in serving future demand. In the 18
mid-term, additional reliance on renewable energy can result in extended periods of low 19
generation due to occasional renewable energy droughts that require other generation 20
resources like the dispatchable generation from the Weston RICE units to make up the 21
shortfall. At the hourly level, renewable energy increases the uncertainty between the 22
4 Ex.-WEPCO/WPSC-Hagerty-5. 5 Ex.-WEPCO/WPSC-Hagerty-6, at 6.
Direct-WEPCO/WPSC-Hagerty-20
forecasted day-ahead generation and actual real-time generation, resulting in periods of 1
unplanned shortfalls in generation. 2
The impacts of the extended renewable energy droughts and real-time shortfalls 3
on Joint Applicants’ customers are made more significant by the correlation of output 4
from renewable energy resources owned by the Joint Applicants and the renewable 5
energy resources in the MISO North market. For example, correlation of renewable 6
output with the rest of the MISO region creates significant costs risks for Joint Applicants 7
during periods of low output from their renewable resources, since the rest of MISO 8
would also be likely short in renewables and the cost of market purchases are likely to be 9
high. This challenge will only increase as more utilities across region shift their resource 10
mix towards renewable energy resources. 11
12
Q. Have you analyzed the potential for a multi-day drought in renewable energy 13
generation that the Joint Applicants are likely to experience in their future system? 14
A. Yes. Due to the higher levels of wind generation that have currently been added in 15
Wisconsin and MISO North, I analyzed historical hourly wind generation in the MISO 16
region since 2019 and identified several multi-day periods during which the average wind 17
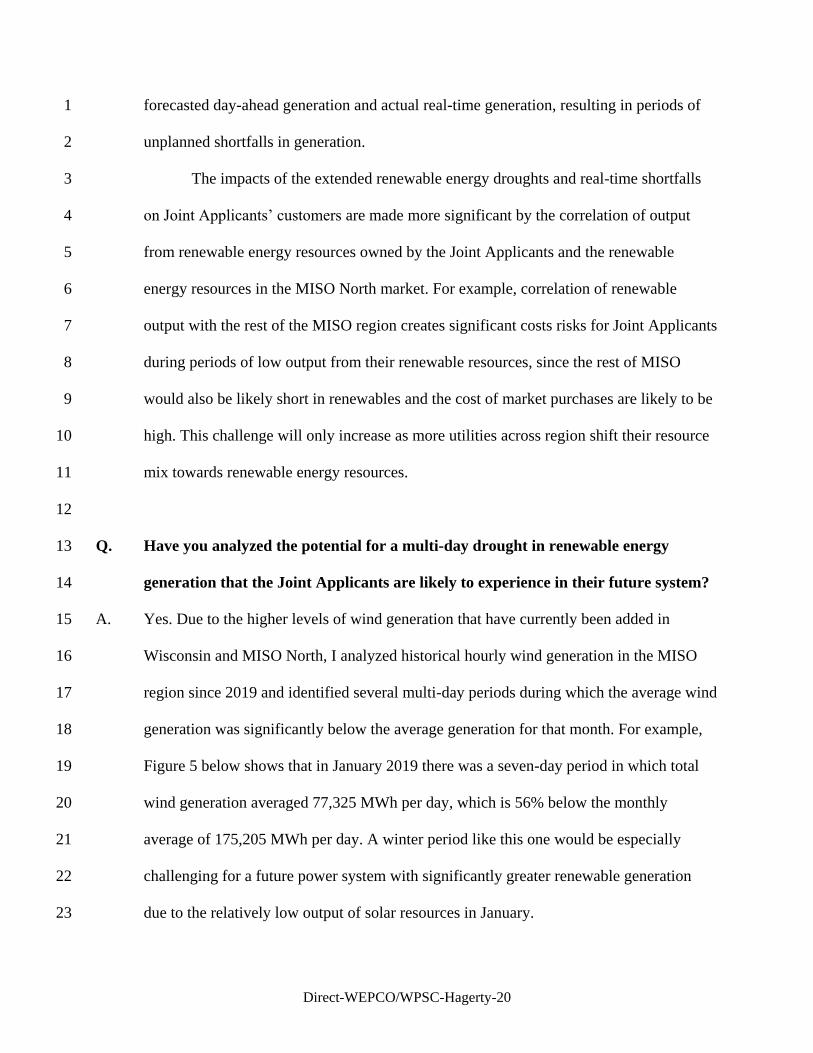
generation was significantly below the average generation for that month. For example, 18
Figure 5 below shows that in January 2019 there was a seven-day period in which total 19
wind generation averaged 77,325 MWh per day, which is 56% below the monthly 20
average of 175,205 MWh per day. A winter period like this one would be especially 21
challenging for a future power system with significantly greater renewable generation 22
due to the relatively low output of solar resources in January. 23
Direct-WEPCO/WPSC-Hagerty-21
Figure 5: January 2019 MISO Daily Wind Generation 1
2
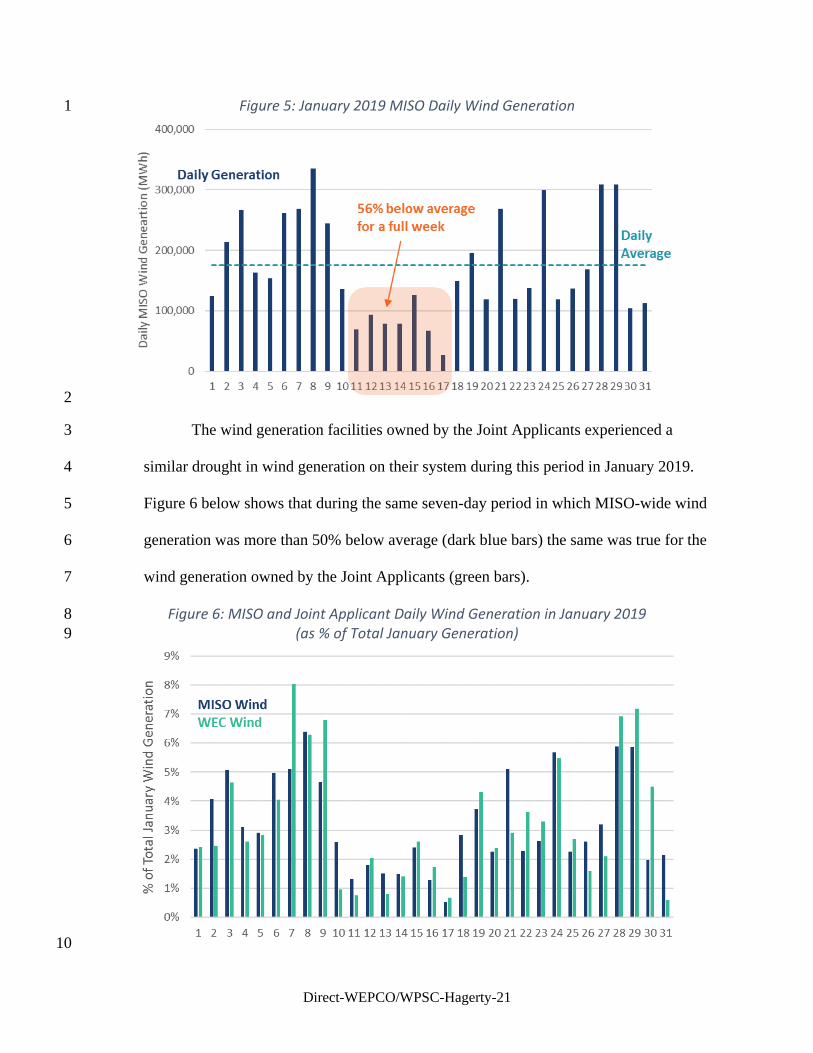
The wind generation facilities owned by the Joint Applicants experienced a 3
similar drought in wind generation on their system during this period in January 2019. 4
Figure 6 below shows that during the same seven-day period in which MISO-wide wind 5
generation was more than 50% below average (dark blue bars) the same was true for the 6
wind generation owned by the Joint Applicants (green bars). 7
Figure 6: MISO and Joint Applicant Daily Wind Generation in January 2019 8
(as % of Total January Generation) 9
10
Direct-WEPCO/WPSC-Hagerty-22
Q. Have you analyzed how well correlated the wind generation owned by the Joint 1
Applicants is to the total wind generation across MISO? 2
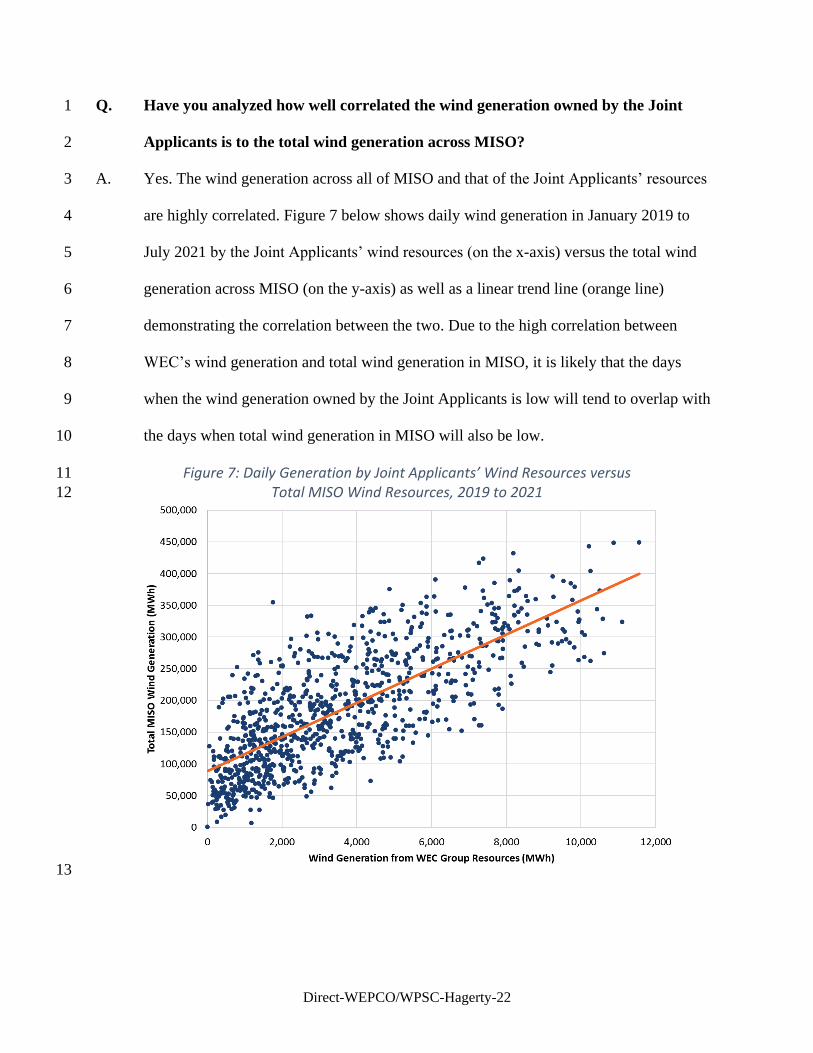
A. Yes. The wind generation across all of MISO and that of the Joint Applicants’ resources 3
are highly correlated. Figure 7 below shows daily wind generation in January 2019 to 4
July 2021 by the Joint Applicants’ wind resources (on the x-axis) versus the total wind 5
generation across MISO (on the y-axis) as well as a linear trend line (orange line) 6
demonstrating the correlation between the two. Due to the high correlation between 7
WEC’s wind generation and total wind generation in MISO, it is likely that the days 8
when the wind generation owned by the Joint Applicants is low will tend to overlap with 9
the days when total wind generation in MISO will also be low. 10
Figure 7: Daily Generation by Joint Applicants’ Wind Resources versus 11
Total MISO Wind Resources, 2019 to 2021 12
13
Direct-WEPCO/WPSC-Hagerty-23
Q. What are the benefits of the Weston RICE units during renewable energy droughts? 1
A. There are two significant benefits of the Weston RICE units to consider. First, in hours 2
with low wind generation in MISO, energy prices would tend to be higher, hence Joint 3
Applicant’s cost of purchasing power from the market to address its net short position 4
would also be higher. Adding a dispatchable and efficient resource like the Weston RICE 5
units will mitigate the increase in cost of market purchases during these periods by 6
limiting, if not eliminating, the need for high-cost market purchases during these periods. 7
Second, the multi-day duration of depressed wind generation periods requires a 8
longer-term duration resource than a battery storage resource currently can provide. If a 9
similar period as observed in January 2019 were included in the Joint Applicant’s 10
simulations for 2030, the lower wind generation would result in a 10,645 MWh shortfall 11
over a week in January, or about 63 MW on average over 168 hours.6 The Weston RICE 12
units could be dispatched to meet such a shortfall. By contrast, it would require 2,661 13
MW of 4-hour battery storage resources to be fully charged at the beginning of this 14
period to provide a similar level of energy to meet such a shortfall. 15
16
Q. Have you estimated the amount of hourly forecast error for the Joint Applicants’ 17
wind resources? 18
A. Yes. I analyzed the historical wind generation from the resources owned by the Joint 19
Applicants since 2017 and compared the day-ahead forecasted hourly wind generation to 20
the real-time actual generation to estimate the forecast error for their wind generation 21
resources. 22
6 The Joint Applicants’ simulations assume 2,716 MWh of daily average wind generation in January
2030. A 56% reduction in the daily generation over 7 days is 10,645 MWh.
Direct-WEPCO/WPSC-Hagerty-24
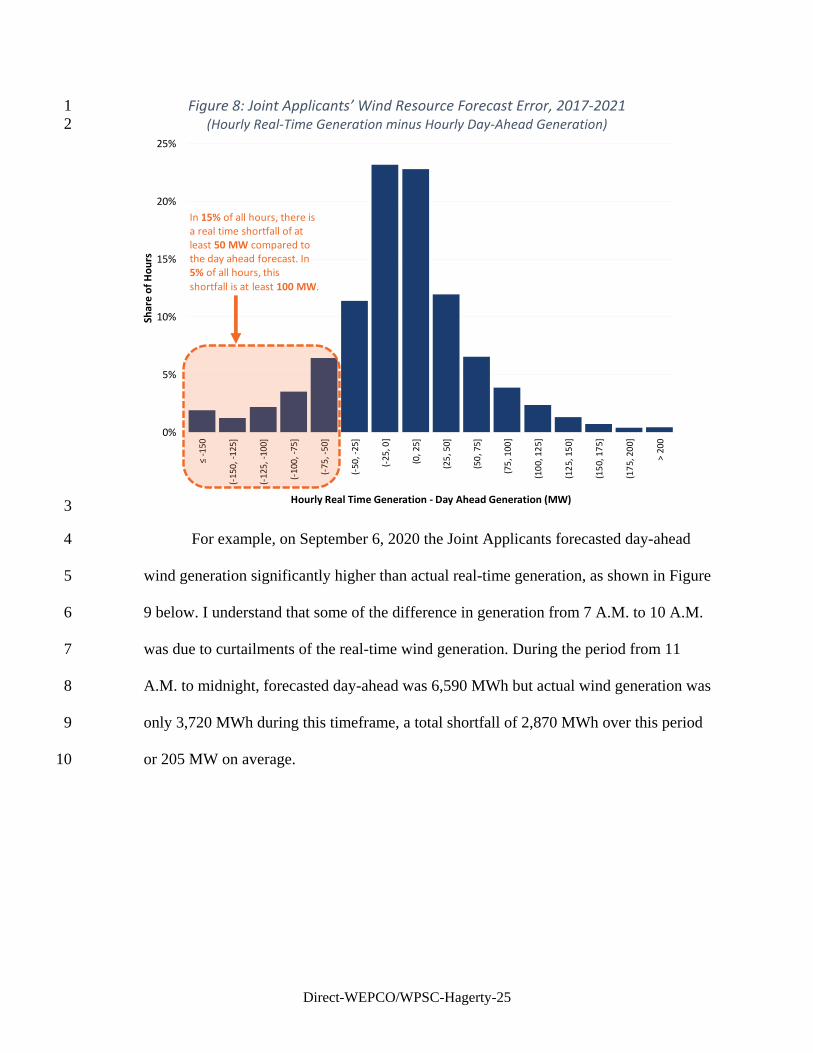
Figure 8 below shows the forecast error since 2017 of the Joint Applicants’ wind 1
resources, in terms of the difference between the real-time actual generation and the day-2
ahead forecasted generation. A positive difference indicates that real-time actual 3
generation exceeded the day-ahead forecasted generation in a given hour, while a 4
negative difference indicates real-time actual generation fell short of the day-ahead 5
forecasted generation. On average, day-ahead forecasted generation and real-time actual 6
generation were similar as shown by the greatest share of hours falling between -25 MW 7
and +25 MW in the figure. But in about 15% of hours since 2017, the real-time wind 8
generation was more than 50 MW lower than forecasted day-ahead and in 5% of hours 9
the real-time generation was more than 100 MW lower. When real-time generation is 10
significantly below the forecasted generation system operators must rely on fast-11
responding and dispatchable resources like the Weston RICE units to make up the 12
difference. 13
Direct-WEPCO/WPSC-Hagerty-25
Figure 8: Joint Applicants’ Wind Resource Forecast Error, 2017-2021 1
(Hourly Real-Time Generation minus Hourly Day-Ahead Generation) 2
3
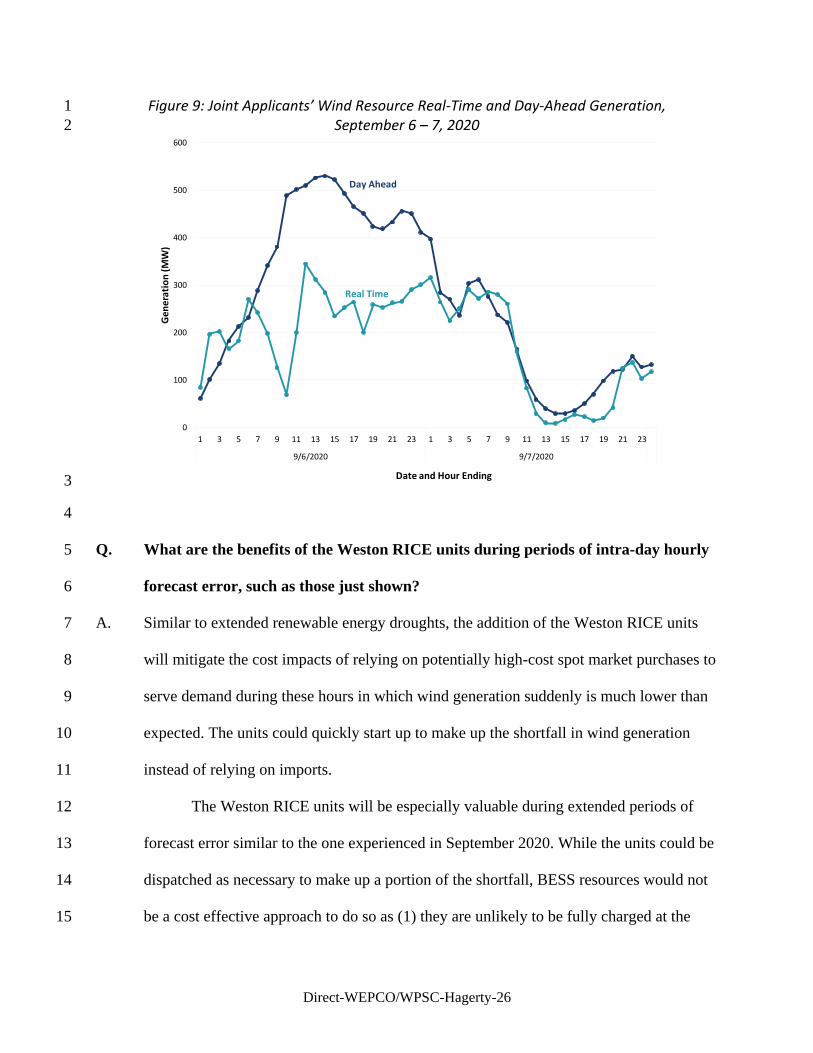
For example, on September 6, 2020 the Joint Applicants forecasted day-ahead 4
wind generation significantly higher than actual real-time generation, as shown in Figure 5
9 below. I understand that some of the difference in generation from 7 A.M. to 10 A.M. 6
was due to curtailments of the real-time wind generation. During the period from 11 7
A.M. to midnight, forecasted day-ahead was 6,590 MWh but actual wind generation was 8
only 3,720 MWh during this timeframe, a total shortfall of 2,870 MWh over this period 9
or 205 MW on average. 10
0%
5%
10%
15%
20%
25%
≤ -1
50
(-15
0, -
125]
(-12
5, -
100]
(-10
0, -
75]
(-75
, -50
]
(-50
, -25
]
(-25
, 0]
(0, 2
5]
(25
, 50
]
(50
, 75
]
(75
, 100
]
(10
0, 1
25]
(12
5, 1
50]
(15
0, 1
75]
(17
5, 2
00]
> 2
00
Sha
re o
f H
ou
rs
Hourly Real Time Generation - Day Ahead Generation (MW)
Real Time - Day Ahead Generation, WEC Energy Group, 2017 - 2021
In 15% of all hours, there is a real time shortfall of at least 50 MW compared to the day ahead forecast. In 5% of all hours, this shortfall is at least 100 MW.
Direct-WEPCO/WPSC-Hagerty-26
Figure 9: Joint Applicants’ Wind Resource Real-Time and Day-Ahead Generation, 1
September 6 – 7, 2020 2
3
4
Q. What are the benefits of the Weston RICE units during periods of intra-day hourly 5
forecast error, such as those just shown? 6
A. Similar to extended renewable energy droughts, the addition of the Weston RICE units 7
will mitigate the cost impacts of relying on potentially high-cost spot market purchases to 8
serve demand during these hours in which wind generation suddenly is much lower than 9
expected. The units could quickly start up to make up the shortfall in wind generation 10
instead of relying on imports. 11
The Weston RICE units will be especially valuable during extended periods of 12
forecast error similar to the one experienced in September 2020. While the units could be 13
dispatched as necessary to make up a portion of the shortfall, BESS resources would not 14
be a cost effective approach to do so as (1) they are unlikely to be fully charged at the 15
0
100
200
300
400
500
600
1 3 5 7 9 11 13 15 17 19 21 23 1 3 5 7 9 11 13 15 17 19 21 23
9/6/2020 9/7/2020
Gen
erat
ion
(M
W)
Date and Hour Ending
Day Ahead vs. Real Time Generation, Largest Shortfall
Day Ahead
Real Time
Direct-WEPCO/WPSC-Hagerty-27
beginning of this unplanned shortfall because batteries tend to charge during the middle 1
of the day during peak solar production, and (2) even if they were fully charged, 717 MW 2
of 4-hour duration BESS resources would be necessary to provide the same level of 3
output to make up for the shortfall during this period. 4
5
Q. Did the Joint Applicants consider these variations in hourly wind output in their 6
simulations? 7
A. No. The Joint Applicants did not consider real-time uncertainty of wind and solar 8
generation in their simulations. Real-time uncertainty is not commonly considered in 9
capacity expansion models like Plexos but can be included in more detailed production 10
cost simulations. 11
12
Q. Have studies of deeply decarbonized power systems that rely primarily on 13
renewable energy generation identified benefits of dispatchable gas-fired generation 14
resources? 15
A. Yes, they have. Nearly all recent decarbonization studies that have simulated future 16
power system demonstrate the significant challenge in reaching a deeply or fully 17
decarbonized system, especially if the only available technologies are renewable 18
generation and storage. The challenge of operating a system primarily with renewable 19
energy resources is the high correlation across multiple renewable generation resources 20
within a given region, as demonstrated for wind generation resources in Figure 7 above. 21
To mitigate this challenge, a considerable amount of additional renewable energy 22
resources have to be built in locations with less correlated generation along with 23
corresponding amounts of long-distance high-voltage transmission and long-duration 24
Direct-WEPCO/WPSC-Hagerty-28
storage to achieve the last few percent of decarbonization. On top of that, there is a risk 1
of renewable droughts (as discussed above) which may transcend the limits of even large 2
amounts of storage. Accordingly, given current technologies, some portion of any future 3
decarbonized system will need to be dispatchable since units like RICE will not have this 4
problem of its output being highly correlated with renewable energy resources. 5
For instance, the MISO Futures Report released in April 2021 included a future 6
scenario (Future 3) in which MISO-wide GHG emissions decrease by 81%.7 The capacity 7
of gas-fired resources in Future 3 increases from 71 GW in 2020 to 109 GW in 2039 and 8
produces 31% of the total energy generation in the market.8 9
A report by my colleagues at Brattle for the New York Independent System 10
Operator on the future generation mix to achieve New York State’s goal of achieving 11
100% zero-emissions resources by 2040 found that the total gas-fired generation capacity 12
would have to increase from 23 GW in 2020 to 34 GW in 2040.9 At the same time, the 13
total generation from the dispatchable gas-fired resources would fall from 59 terawatt 14
hours (“TWh”) in 2020 using conventional natural gas to 20 TWh in 2040 burning 15
renewable natural gas (“RNG”). 16
Similarly, I conducted a study on the generation mix necessary to achieve 80% 17
reductions in economy-wide GHG emissions by 2050 in New England and concluded 18
that 31 GW to 45 GW of dispatchable natural gas-fired capacity would be necessary in 19
7 Ex.-WEPCO/WPSC-Hagerty-7, at 6. 8 The growth in natural gas capacity in Future 3 is partially due to the nearly 50% increase in total
annual energy demand primarily driven by transportation and heating electrification. Id. at 36. 9 Ex.-WEPCO/WPSC-Hagerty-8, at 22-23, 61-64.
Direct-WEPCO/WPSC-Hagerty-29
2050 to meet these goals, with the higher end of the range occurring in a scenario with 1
significant RNG development.10 2
At the national level, the recently released Solar Futures Study by the U.S. 3
Department of Energy (“DOE”) found that dispatchable resources, primarily CTs 4
operating on renewable or zero-carbon fuel such as hydrogen and RNG, are a “critical 5
contributor” to maintaining resource adequacy and operational reliability in a fully 6
decarbonized power system.11 Similar to the points discussed above for the Joint 7
Applicants’ system, the DOE study finds that the operation of the dispatchable resources 8
tends to be relatively limited (4-5% capacity factor) and highly dependent on weather 9
conditions and the resulting availability of renewable energy generation, with the 10
dispatchable resources filling the gaps in renewable energy generation. The study in 11
particular highlights a simulation of a five-day renewable energy drought in 2050 (based 12
on historical weather conditions in ERCOT in January 2007) when nearly 50 GW of 13
dispatchable resources are necessary serve demand, noting that the same five-day period 14
in other years requires very limited operation of the dispatchable resources. 15
16
Q. Are the Weston RICE units cost-effective resources in serving a similar need for the 17
Joint Applicants in achieving their long-term GHG reduction goals? 18
A. Yes, the Weston RICE units provide an efficient and fast-ramping resource that will 19
adapt to the needs of the system as renewable energy generation increases and greater 20
reductions in GHG emissions occur. As shown above, the capacity factor of the Weston 21
RICE units decrease from 21% in 2025 to 14% in 2035 as their role shifts from 22
10 Ex.-WEPCO/WPSC-Hagerty-9, at 16, 19. 11 Ex.-WEPCO/WPSC-Hagerty-10, at 58-60.
Direct-WEPCO/WPSC-Hagerty-30
generating to meet mid-day summer demand in the near-term to exclusively operating 1
when renewable energy generation is low in 2035. 2
In addition, Wärtsilä, the manufacturer of the Weston RICE units, is currently 3
developing the capability for the units to operate on RNG or hydrogen.12 Wärtsilä has 4
already tested its units with a blend of 60% hydrogen and 40% natural gas and separately 5
with 100% RNG. 6
7
IV. EXPERIENCE WITH RICE AND RENEWABLES FROM OTHER UTILITIES 8
Q. Are other utilities choosing to install RICE units or other peaking gas resources as 9
part of their plans to replace retiring fossil generation resources? 10
A. Yes, other utilities replacing older coal- and gas-fired capacity are building dispatchable 11
and flexible, efficient gas-fired resources, including RICE units. 12
As noted above, Entergy Louisiana added 128 MW of Wärtsilä RICE units in 13
New Orleans to replace a retiring dual fuel steam turbine plant, and as noted above these 14
RICE units helped the city recover from Hurricane Ida.13 In addition, the Central Iowa 15
Power Cooperative installed 110 MW of RICE units in April 2021 to provide 16
“dispatchable, quick-start natural gas capacity to run when the wind and sun aren’t 17
producing electricity.”14 Mid-Kansas Electric in wind-heavy western Kansas installed a 18
12-unit 100 MW RICE facility at its Rubart substation in 2014, noting its fast start 19
capability, quick response to market conditions, and ability to support the integration of 20
wind energy.15 21
12 Ex.-WEPCO/WPSC-Hagerty-11. 13 Ex.-WEPCO/WPSC-Hagerty-12. 14 Ex.-WEPCO/WPSC-Hagerty-17. 15 Ex.-WEPCO/WPSC-Hagerty-13.
Direct-WEPCO/WPSC-Hagerty-31
Several of the larger utilities in MISO North that are retiring major coal plants are 1
choosing to include new gas plants as a part of their portfolios of replacement resources. 2
Xcel Energy in Minnesota selected a new 800 MW gas CC as a part of its plan to replace 3
3,000 MW of retiring coal plants and is extending the life of 150 MW of gas CTs, in 4
addition to installing over 5,000 MW of renewable resources.16 DTE in Michigan is also 5
replacing three retiring coal plants with a gas CC and a mix of renewable energy 6
resources, energy efficiency, and demand response.17 CenterPoint Energy in Indiana 7
recently submitted applications to build 460 MW of new gas CTs to replace the 490 MW 8
A.B. Brown coal-fired plant in addition to nearly 500 MW of solar capacity.18 9
By identifying these examples, I am not suggesting that the Joint Applicants 10
should blindly imitate those systems, as each has its own idiosyncratic needs and 11
opportunities for cost effective resources. However, the recurring pattern of many utilities 12
finding the units like these RICE ones improve performance in their planned systems is 13
indicative that there are some important benefits to be had. 14
15
Q. Does this conclude your direct testimony? 16
A. Yes. 17
16 Ex.-WEPCO/WPSC-Hagerty-14. 17 Ex.-WEPCO/WPSC-Hagerty-15. 18 Ex.-WEPCO/WPSC-Hagerty-4.