Embed Size (px)
Citation preview
51Factors Influencing Online Shopping: An Empirical Study in Ahmedabad
Factors Influencing Online Shopping:An Empirical Study in Ahmedabad
© 2012 IUP. All Rights Reserved.
* Assistant Professor, Shri Jairambhai Patel Institute of Business Management and Computer Applications(SJPI), National Institute of Cooperative Management (NICM), Gandhinagar, Gujarat, India.E-mail: [email protected]
** Assistant Professor, L J Institute of Management Studies (LJIM), Ahmedabad, Gujarat, India.E-mail: [email protected]
According to an India online landscape study (Juxt, 2010), the number of active Internetusers in India stands at 65 million, of which 17 million are online shoppers, indicatinga growth of 70% from the previous year. The statistics alone are enough to denote thepotential of e-commerce in India. However, as the online market becomes crowded withplayers, businesses need to have an edge in terms of customer satisfaction to gain alarger market share. With the above-mentioned objective in mind, a primary survey ofonline shoppers was conducted in Ahmedabad and consumer perceptions were analyzedusing factor analysis and Analysis of Variance (ANOVA) test. The paper has foundthat ease/attractiveness of website, service quality of website and website security arethe three dominant factors which influence consumer perceptions regarding their onlinepurchasing experiences. Hence, businesses which focus on these three factors can attractmore clicks. Also, the paper has proved that these factors are related to the varioustypes of consumers classified as trial, occasional, frequent and regular (based on theirfrequency of purchase). The authors have found that regular buyers are most influencedby ease/attractiveness of website and service quality of website, while occasional buyersvalue website security more than other categories of consumers.
Shahir Bhatt* and Amola Bhatt**
IntroductionInternet is rapidly becoming the main tool for communication and business convenience.With a growing number of households turning towards the Internet and the world ofe-commerce to shop, invest, make payments, and do online banking, new technologicaladvancements will have to come about to make these transactions secure. In India,Internet has primarily been used for enabling communications between individualsthrough various modes such as e-mailing, messaging or even social networking. However,a digital interactive media is only successful if it fails to pervade every single activity anindividual indulges in, his/her daily life.
According to India online landscape study (Juxt, 2010), the number of active Internetusers in India stands at 65 million, recording a 28% rise from 51 million last year. Thestudy also revealed that India has 61 million ‘regular’ users with 46 million urban and
The IUP Journal of Marketing Management, Vol. XI, No. 4, 201252
16 million rural users. “Four out of five Internet users ‘shop’ online, translating into a50 million strong online consumer base. About 17 million of these ‘online shoppers’(or 29% of all Internet users) also ‘buy’ online, recording a growth of 70% from 10million last year. Online buyers of ‘non-travel’ products stand at 13.5 million,outnumbering 8.6 million travel buyers”, the study quoted.
Google continues to dominate the online landscape, with Google, Gmail, Gtalk andYouTube being the most used websites for 19 distinct online activities (compared to 24activities last year). Facebook emerges as the leader in six distinct verticals, includingonline games and professional networking. For the rest of the verticals, it is the ‘specialized’players who lead or dominate user preferences like Naukri, IRCTC, eBay, 99Acres,MoneyControl, ShareKhan, Bharat Matrimony, Torentz, Songs.pk and ESPNStar.
Online travel industry grew from 6,250 cr in 2007 to 14,953 in 2009.e-Tailing comprises buying consumer items such as cameras, computers, home and kitchenappliances, flowers and toys and gifts online. This category grew from 978 cr in 2007to 1,550 in 2009. At present, PCs, laptops, computer peripherals, accessories andstorage contribute the most, 36% ( 560 cr), to e-tailing, followed by cameras and mobilescontributing 25% ( 389 cr). Personal items such as jewelry, apparels, cosmetics, shoesand watches contribute 19% ( 296 cr), whereas electronic items like TV, audio systemsand other accessories account for 13% ( 203 cr). The balance 7% was contributed byhome and kitchen appliances (4%) and other online buying (toys, gifts, flowers, etc.).Financial services market, estimated to be 1,540 cr, was expected to grow to 2,000 crin the year 2010. Digital downloads as a category has increased from 238 cr in 2007to 435 cr in 2009. Given the proliferation of mobile devices and the services availableover the Internet, the growth rate is expected to be higher in the coming years.
Literature ReviewHoffman and Novak (1997) pointed out that personalization is the essence by whichInternet firms valorize the Internet as a unique consumer market. Apart from the above,there are several studies which reveal that people’s behavior online is influenced byhigh-speed connection. Know and Lee (2003) explored consumers’ concerns aboutpayment security and its relationship to online shopping attitude and actual purchases.They observed a negative relationship between attitude towards online shopping andconcerns about online payment security. Consumers with a positive attitude seem to beless concerned about payment security.
Kotler and Armstrong (2000) pointed out that a person’s buying choices are furtherinfluenced by four key psychological factors: (1) Motivation; (2) Perception; (3) Learningand beliefs; and (4) Attitude. In most families, women are the chief decision makers(Dholakia, 1999). Men are more motivated toward utilitarian benefits of products andgive lesser importance to social relations and personal contacts (Steenkamp et al., 1999).Younger generation has always exhibited a positive disposition towards adoption of anew innovation (Schiffman and Kanuk, 2003) and understands the technological changesand complexities optimistically than the elderly segment (Wotruba and Pribova, 1995).
53Factors Influencing Online Shopping: An Empirical Study in Ahmedabad
Gurvinder and Zhaobin (2005) found that website design, website reliability/fulfillment, website customer service and website security/privacy are the four dominantfactors which influence consumer perceptions of online purchasing. The four types ofonline New Zealand buyers—trial, occasional, frequent and regular—perceived the fourwebsite factors differently. This paper has been taken as a basis for this study and thescale constructed for the study was partially adapted from this paper.
RationaleThe usage of Internet-aided services is highly increasing in India and technology hasplayed a vital role in the development of modern era. It is observed that the number ofInternet users is increasing in India at a steady rate. From a review of literature, it isperceived that no research had been done to understand the perception of people ofAhmedabad city towards online shopping. Hence, this study aims to explore the behaviorof people of Ahmedabad towards online shopping.
Objectives of the StudyThe present study focuses on online shopping in the Indian sector to explore its trends,prospects and challenges with the following objectives.
• To determine the factors driving online shopping; and
• To analyze the relationship between the factors brought out from the studyand the different types of buyers.
Hypotheses for the StudyThe following hypotheses have been formulated for the study.
Ho: Attributes are uncorrelated with the population.
Ho: There is no significanct relationship between factors driving online shopping anddifferent types of buyers:
• There is no significant relationship between website ease/attractiveness and thedifferent types of buyers.
• There is no significant relationship between website service quality and differenttypes of buyers.
• There is no significant relationship between website security and different types ofbuyers.
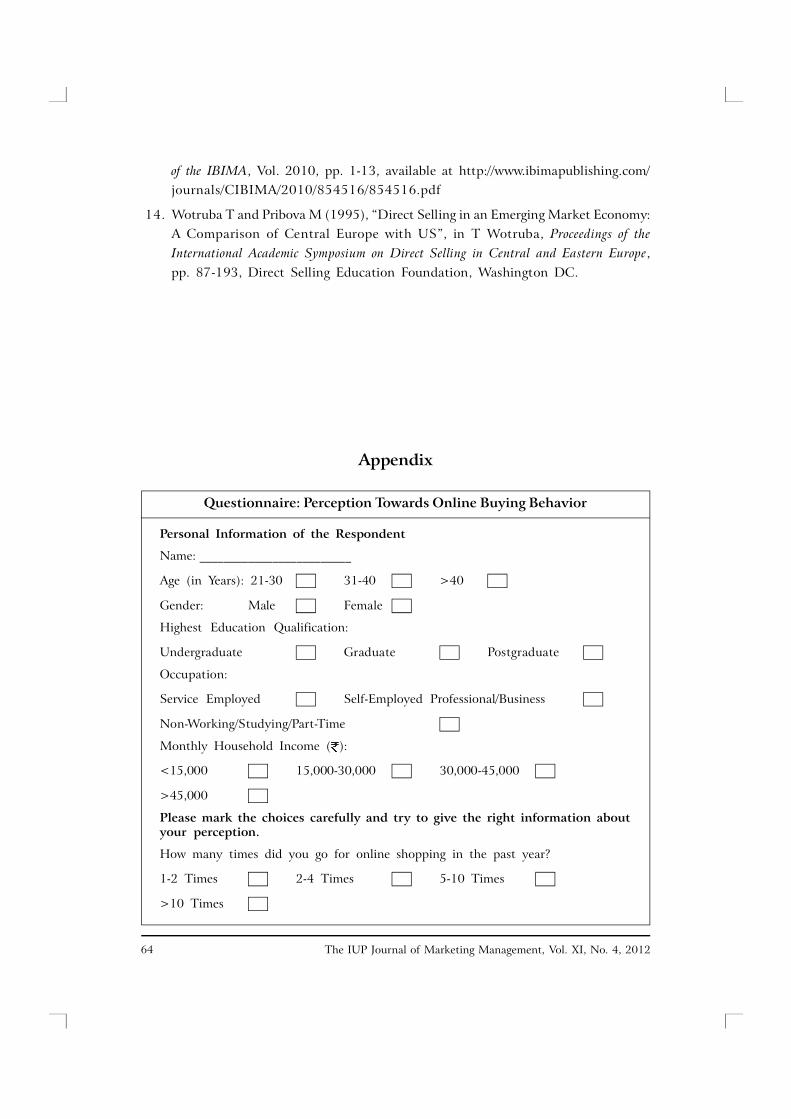
Research MethodologyThe data was collected through a questionnaire (refer Appendix). The questionnaireincluded several scales which were continuous and categorical in nature. The first questioncomprised the number of times people opted for online shopping in the past year, whichtalks about different types of buyers.
The IUP Journal of Marketing Management, Vol. XI, No. 4, 201254
• 1-2 times: Trial buyers (people who rarely shop online).
• 2-4 times: Occasional buyers (people who sometimes shop online).
• 5-10 times: Frequent buyers (people who often shop online).
• More than 10 times: Regular buyers (people who regularly shop online).
For this study, the scale constructed by Gurvinder and Zhaobin (2005) was usedwhich comprised 15 Likert scale statements. In addition, three statements were addedon the basis of exploratory research. The questionnaire was first pre-tested and the
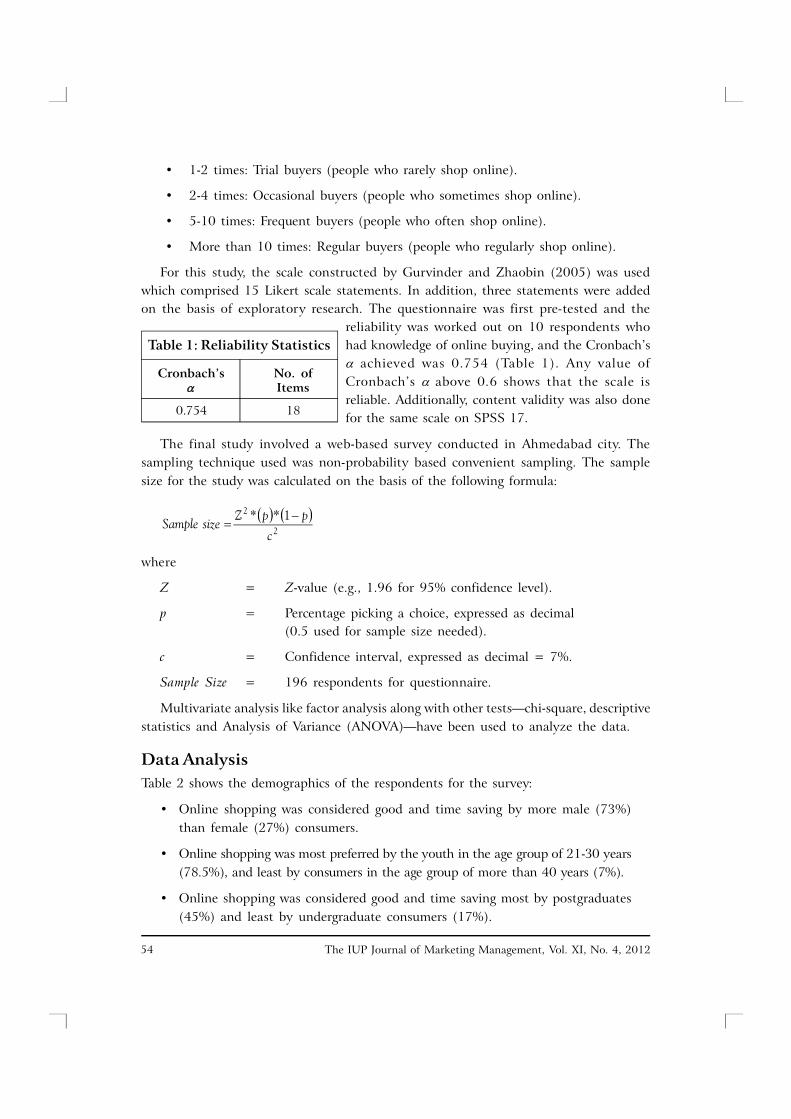
reliability was worked out on 10 respondents whohad knowledge of online buying, and the Cronbach’s achieved was 0.754 (Table 1). Any value ofCronbach’s above 0.6 shows that the scale isreliable. Additionally, content validity was also donefor the same scale on SPSS 17.
The final study involved a web-based survey conducted in Ahmedabad city. Thesampling technique used was non-probability based convenient sampling. The samplesize for the study was calculated on the basis of the following formula:
2
2 1**
c
ppZsizeSample
where
Z = Z-value (e.g., 1.96 for 95% confidence level).
p = Percentage picking a choice, expressed as decimal(0.5 used for sample size needed).
c = Confidence interval, expressed as decimal = 7%.
Sample Size = 196 respondents for questionnaire.
Multivariate analysis like factor analysis along with other tests—chi-square, descriptivestatistics and Analysis of Variance (ANOVA)—have been used to analyze the data.
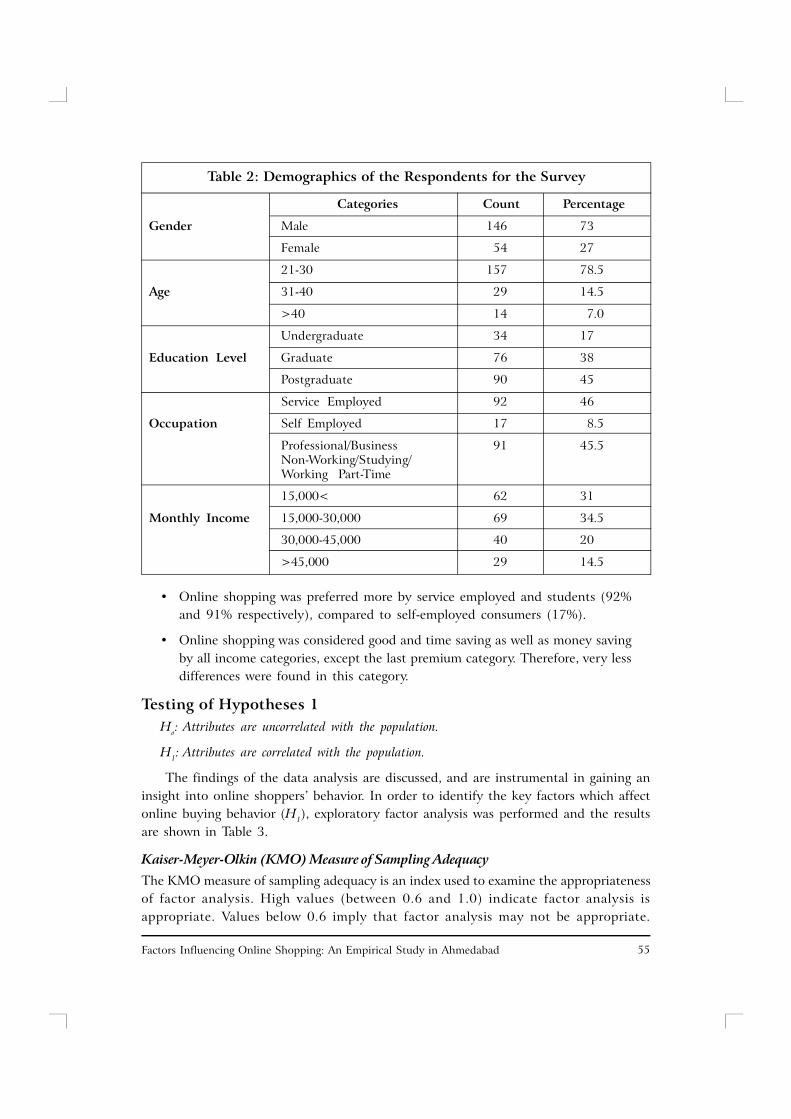
Data AnalysisTable 2 shows the demographics of the respondents for the survey:
• Online shopping was considered good and time saving by more male (73%)than female (27%) consumers.
• Online shopping was most preferred by the youth in the age group of 21-30 years(78.5%), and least by consumers in the age group of more than 40 years (7%).
• Online shopping was considered good and time saving most by postgraduates(45%) and least by undergraduate consumers (17%).
Cronbach’s No. of Items
0.754 18
Table 1: Reliability Statistics
55Factors Influencing Online Shopping: An Empirical Study in Ahmedabad
• Online shopping was preferred more by service employed and students (92%and 91% respectively), compared to self-employed consumers (17%).
• Online shopping was considered good and time saving as well as money savingby all income categories, except the last premium category. Therefore, very lessdifferences were found in this category.
Testing of Hypotheses 1Ho: Attributes are uncorrelated with the population.
H1: Attributes are correlated with the population.
The findings of the data analysis are discussed, and are instrumental in gaining aninsight into online shoppers’ behavior. In order to identify the key factors which affectonline buying behavior (H1), exploratory factor analysis was performed and the resultsare shown in Table 3.
Kaiser-Meyer-Olkin (KMO) Measure of Sampling AdequacyThe KMO measure of sampling adequacy is an index used to examine the appropriatenessof factor analysis. High values (between 0.6 and 1.0) indicate factor analysis isappropriate. Values below 0.6 imply that factor analysis may not be appropriate.
Categories Count Percentage
Gender Male 146 73
Female 54 27
21-30 157 78.5
Age 31-40 29 14.5
>40 14 7.0
Undergraduate 34 17
Education Level Graduate 76 38
Postgraduate 90 45
Service Employed 92 46
Occupation Self Employed 17 8.5
Professional/Business 91 45.5Non-Working/Studying/Working Part-Time
15,000< 62 31
Monthly Income 15,000-30,000 69 34.5
30,000-45,000 40 20
>45,000 29 14.5
Table 2: Demographics of the Respondents for the Survey
The IUP Journal of Marketing Management, Vol. XI, No. 4, 201256
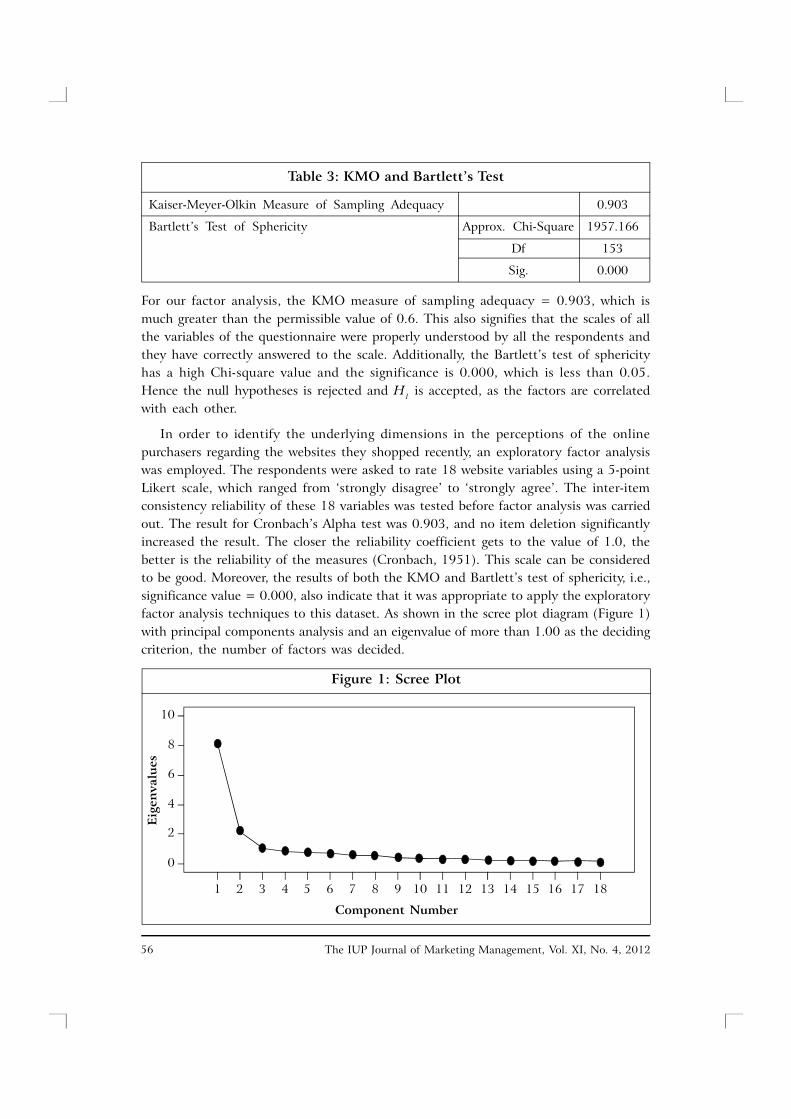
For our factor analysis, the KMO measure of sampling adequacy = 0.903, which ismuch greater than the permissible value of 0.6. This also signifies that the scales of allthe variables of the questionnaire were properly understood by all the respondents andthey have correctly answered to the scale. Additionally, the Bartlett’s test of sphericityhas a high Chi-square value and the significance is 0.000, which is less than 0.05.Hence the null hypotheses is rejected and H1 is accepted, as the factors are correlatedwith each other.
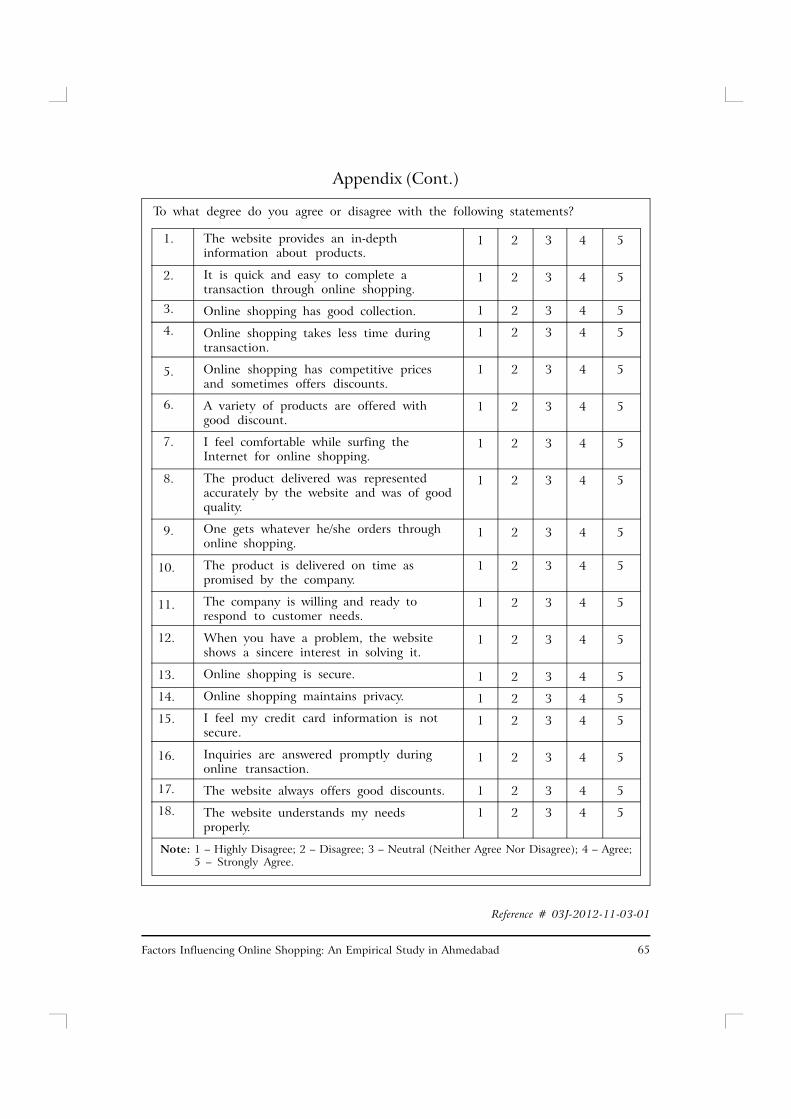
In order to identify the underlying dimensions in the perceptions of the onlinepurchasers regarding the websites they shopped recently, an exploratory factor analysiswas employed. The respondents were asked to rate 18 website variables using a 5-pointLikert scale, which ranged from ‘strongly disagree’ to ‘strongly agree’. The inter-itemconsistency reliability of these 18 variables was tested before factor analysis was carriedout. The result for Cronbach’s Alpha test was 0.903, and no item deletion significantlyincreased the result. The closer the reliability coefficient gets to the value of 1.0, thebetter is the reliability of the measures (Cronbach, 1951). This scale can be consideredto be good. Moreover, the results of both the KMO and Bartlett’s test of sphericity, i.e.,significance value = 0.000, also indicate that it was appropriate to apply the exploratoryfactor analysis techniques to this dataset. As shown in the scree plot diagram (Figure 1)with principal components analysis and an eigenvalue of more than 1.00 as the decidingcriterion, the number of factors was decided.
Kaiser-Meyer-Olkin Measure of Sampling Adequacy 0.903
Bartlett’s Test of Sphericity Approx. Chi-Square 1957.166
Df 153
Sig. 0.000
Table 3: KMO and Bartlett’s Test
Figure 1: Scree Plot
10
8
6
4
2
0
Eig
enva
lues
Component Number
1 2 3 4 5 6 7 8 9 10 11 12 13 14 15 16 17 18
57Factors Influencing Online Shopping: An Empirical Study in Ahmedabad
Scree PlotA scree plot is a plot of the eigenvalues against the number of factors in the order ofextraction. As shown in Figure 1, it indicates that there are three factors which haveeigenvalues greater than one based on all the 18 variables.
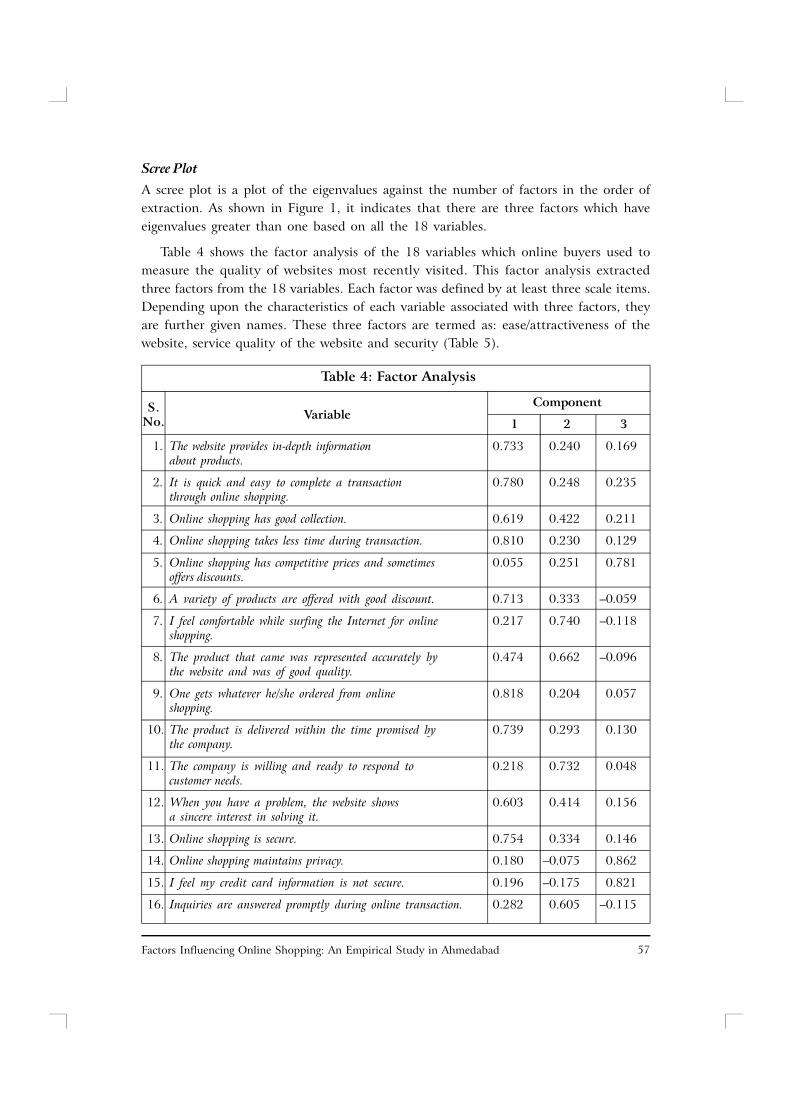
Table 4 shows the factor analysis of the 18 variables which online buyers used tomeasure the quality of websites most recently visited. This factor analysis extractedthree factors from the 18 variables. Each factor was defined by at least three scale items.Depending upon the characteristics of each variable associated with three factors, theyare further given names. These three factors are termed as: ease/attractiveness of thewebsite, service quality of the website and security (Table 5).
Component
1 2 3
1. The website provides in-depth information 0.733 0.240 0.169about products.
2. It is quick and easy to complete a transaction 0.780 0.248 0.235through online shopping.
3. Online shopping has good collection. 0.619 0.422 0.211
4. Online shopping takes less time during transaction. 0.810 0.230 0.129
5. Online shopping has competitive prices and sometimes 0.055 0.251 0.781offers discounts.
6. A variety of products are offered with good discount. 0.713 0.333 –0.059
7. I feel comfortable while surfing the Internet for online 0.217 0.740 –0.118shopping.
8. The product that came was represented accurately by 0.474 0.662 –0.096the website and was of good quality.
9. One gets whatever he/she ordered from online 0.818 0.204 0.057shopping.
10. The product is delivered within the time promised by 0.739 0.293 0.130the company.
11. The company is willing and ready to respond to 0.218 0.732 0.048customer needs.
12. When you have a problem, the website shows 0.603 0.414 0.156a sincere interest in solving it.
13. Online shopping is secure. 0.754 0.334 0.146
14. Online shopping maintains privacy. 0.180 –0.075 0.862
15. I feel my credit card information is not secure. 0.196 –0.175 0.821
16. Inquiries are answered promptly during online transaction. 0.282 0.605 –0.115
Table 4: Factor Analysis
VariableS.No.
The IUP Journal of Marketing Management, Vol. XI, No. 4, 201258
Component
1 2 3
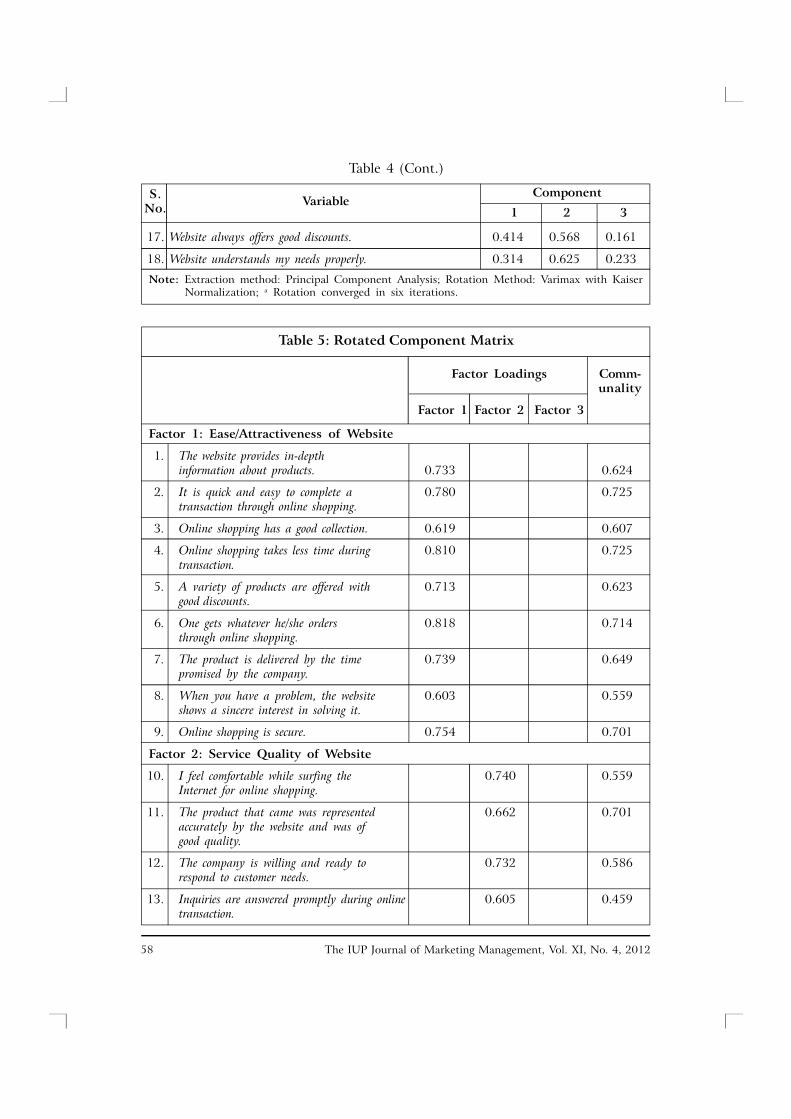
Table 4 (Cont.)
17. Website always offers good discounts. 0.414 0.568 0.161
18. Website understands my needs properly. 0.314 0.625 0.233
Note: Extraction method: Principal Component Analysis; Rotation Method: Varimax with KaiserNormalization; a Rotation converged in six iterations.
VariableS.No.
Factor Loadings Comm-unality
Factor 1 Factor 2 Factor 3
Factor 1: Ease/Attractiveness of Website
1. The website provides in-depthinformation about products. 0.733 0.624
2. It is quick and easy to complete a 0.780 0.725transaction through online shopping.
3. Online shopping has a good collection. 0.619 0.607
4. Online shopping takes less time during 0.810 0.725transaction.
5. A variety of products are offered with 0.713 0.623good discounts.
6. One gets whatever he/she orders 0.818 0.714through online shopping.
7. The product is delivered by the time 0.739 0.649promised by the company.
8. When you have a problem, the website 0.603 0.559shows a sincere interest in solving it.
9. Online shopping is secure. 0.754 0.701
Factor 2: Service Quality of Website
10. I feel comfortable while surfing the 0.740 0.559Internet for online shopping.
11. The product that came was represented 0.662 0.701accurately by the website and was ofgood quality.
12. The company is willing and ready to 0.732 0.586respond to customer needs.
13. Inquiries are answered promptly during online 0.605 0.459transaction.
Table 5: Rotated Component Matrix
59Factors Influencing Online Shopping: An Empirical Study in Ahmedabad
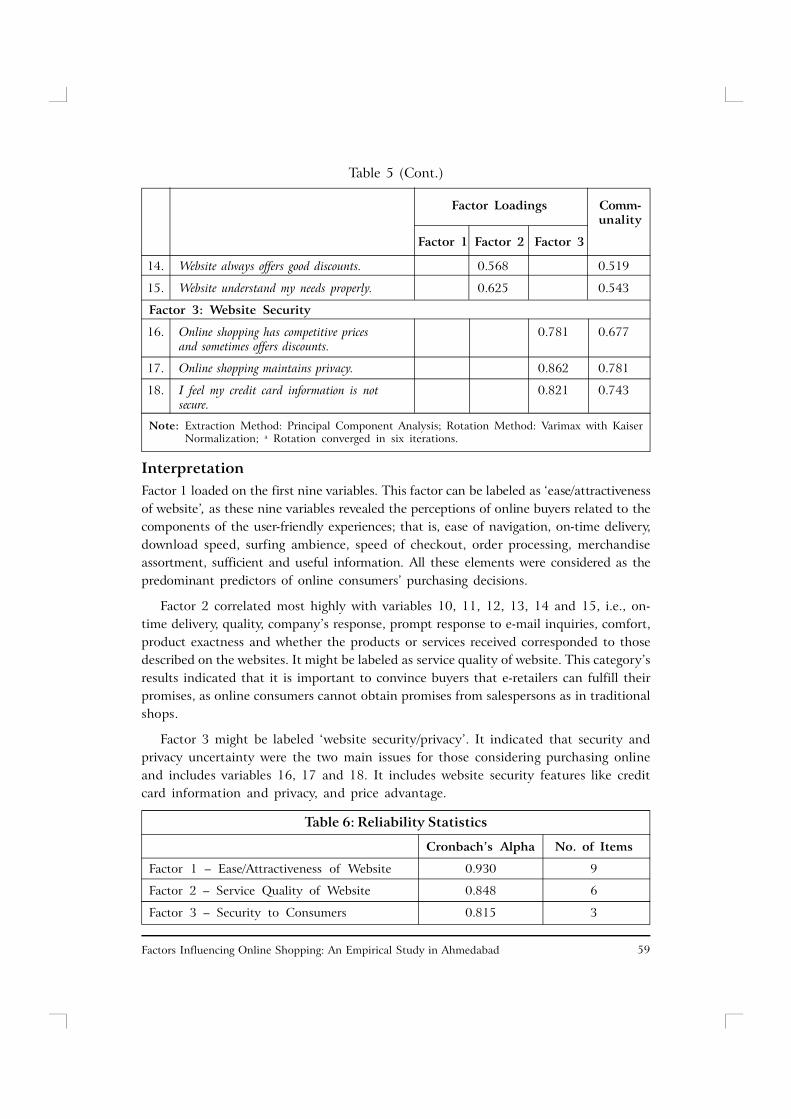
InterpretationFactor 1 loaded on the first nine variables. This factor can be labeled as ‘ease/attractivenessof website’, as these nine variables revealed the perceptions of online buyers related to thecomponents of the user-friendly experiences; that is, ease of navigation, on-time delivery,download speed, surfing ambience, speed of checkout, order processing, merchandiseassortment, sufficient and useful information. All these elements were considered as thepredominant predictors of online consumers’ purchasing decisions.
Factor 2 correlated most highly with variables 10, 11, 12, 13, 14 and 15, i.e., on-time delivery, quality, company’s response, prompt response to e-mail inquiries, comfort,product exactness and whether the products or services received corresponded to thosedescribed on the websites. It might be labeled as service quality of website. This category’sresults indicated that it is important to convince buyers that e-retailers can fulfill theirpromises, as online consumers cannot obtain promises from salespersons as in traditionalshops.
Factor 3 might be labeled ‘website security/privacy’. It indicated that security andprivacy uncertainty were the two main issues for those considering purchasing onlineand includes variables 16, 17 and 18. It includes website security features like creditcard information and privacy, and price advantage.
Factor Loadings Comm-unality
Factor 1 Factor 2 Factor 3
Table 5 (Cont.)
14. Website always offers good discounts. 0.568 0.519
15. Website understand my needs properly. 0.625 0.543
Factor 3: Website Security
16. Online shopping has competitive prices 0.781 0.677and sometimes offers discounts.
17. Online shopping maintains privacy. 0.862 0.781
18. I feel my credit card information is not 0.821 0.743secure.
Note: Extraction Method: Principal Component Analysis; Rotation Method: Varimax with KaiserNormalization; a Rotation converged in six iterations.
Cronbach’s Alpha No. of Items
Factor 1 – Ease/Attractiveness of Website 0.930 9
Factor 2 – Service Quality of Website 0.848 6
Factor 3 – Security to Consumers 0.815 3
Table 6: Reliability Statistics
The IUP Journal of Marketing Management, Vol. XI, No. 4, 201260
Further, the reliability statistics (Table 6) indicate that the results for Cronbach’salpha test were 0.930, 0.848 and 0.815 for all the three factors with respect to theirvariables and are above the permissible value of 0.5, and no item deletion significantlyincreased the result. The closer the reliability coefficient gets to the value of 1.0, the betteris the reliability of the measure (Cronbach, 1951). This scale can be considered good.
Hypotheses 2H0: There is no significant relationship between factors driving online shopping and different
types of buyers.
• There is no significant relationship between website ease/attractiveness and thedifferent types of buyers.
• There is no significant relationship between website service quality and differenttypes of buyers.
• There is no significant relationship between website security and different types ofbuyers.
H1: There is significant relationship between factors driving online shopping and differenttypes of buyers.
• There is significant relationship between website ease / attractiveness and thedifferent types of buyers.
• There is significant relationship between website service quality and different typesof buyers.
• There is significant relationship between website security and different types ofbuyers.
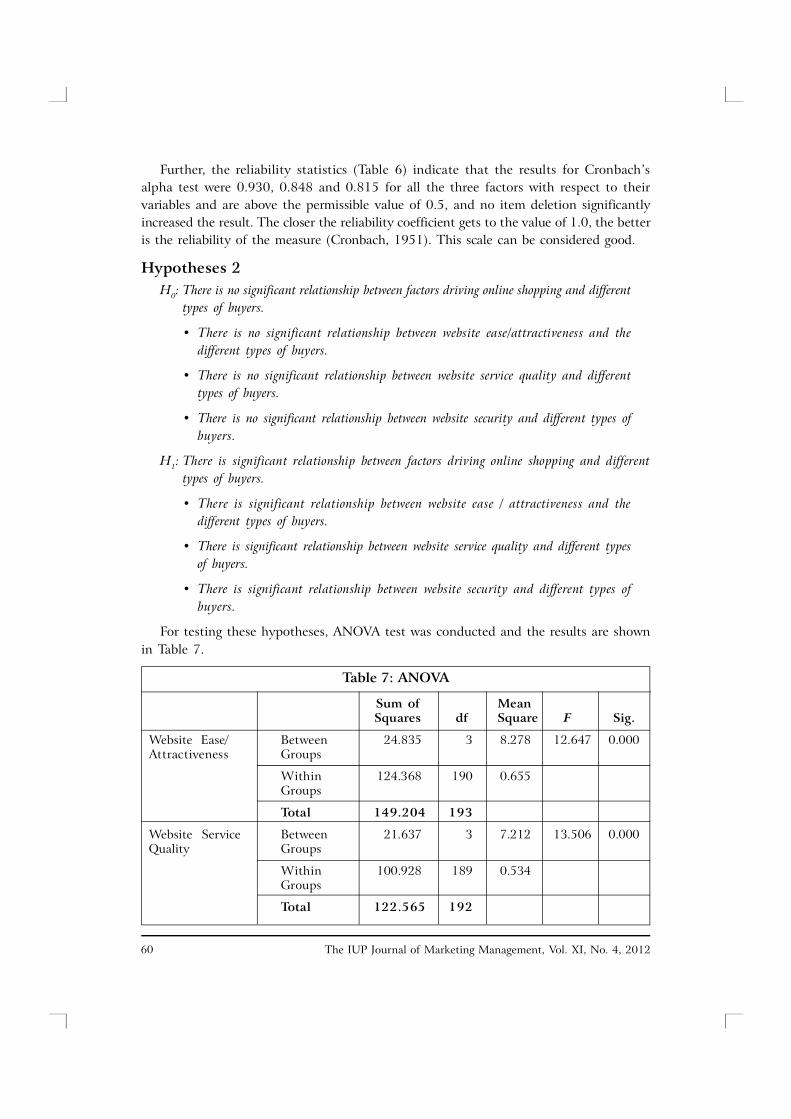
For testing these hypotheses, ANOVA test was conducted and the results are shownin Table 7.
Sum of MeanSquares df Square F Sig.
Website Ease/ Between 24.835 3 8.278 12.647 0.000Attractiveness Groups
Within 124.368 190 0.655Groups
Total 149.204 193
Website Service Between 21.637 3 7.212 13.506 0.000Quality Groups
Within 100.928 189 0.534Groups
Total 122.565 192
Table 7: ANOVA
61Factors Influencing Online Shopping: An Empirical Study in Ahmedabad
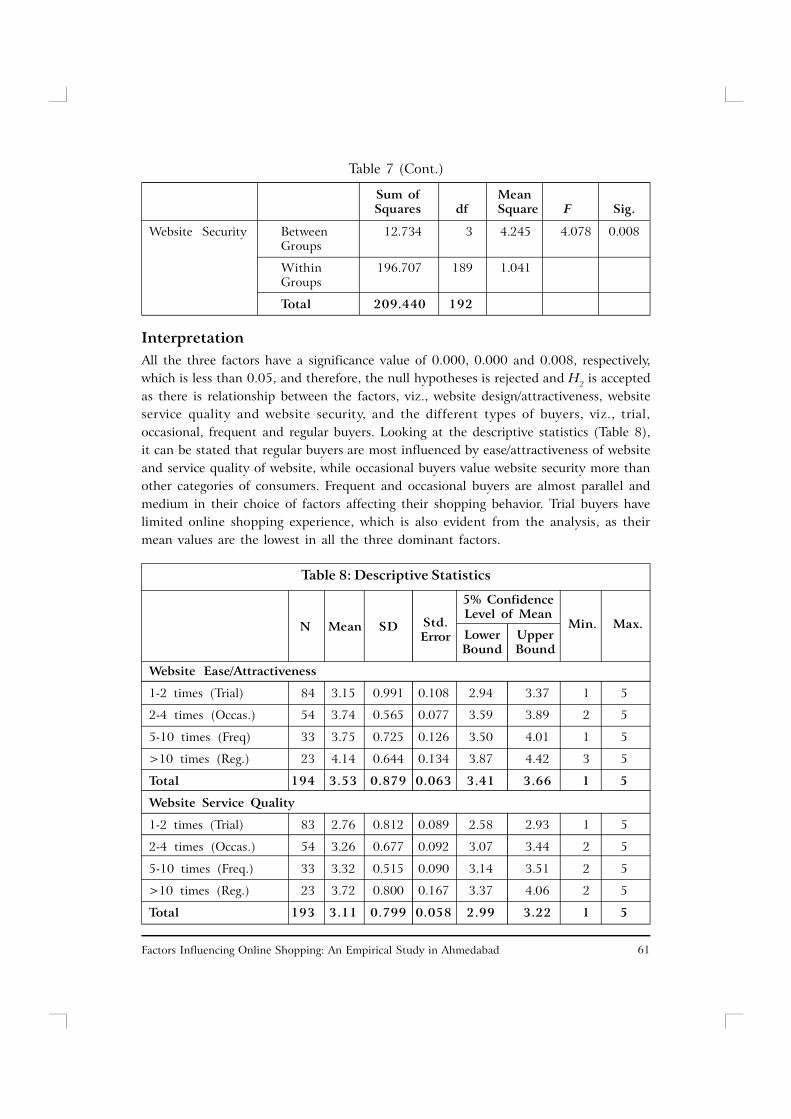
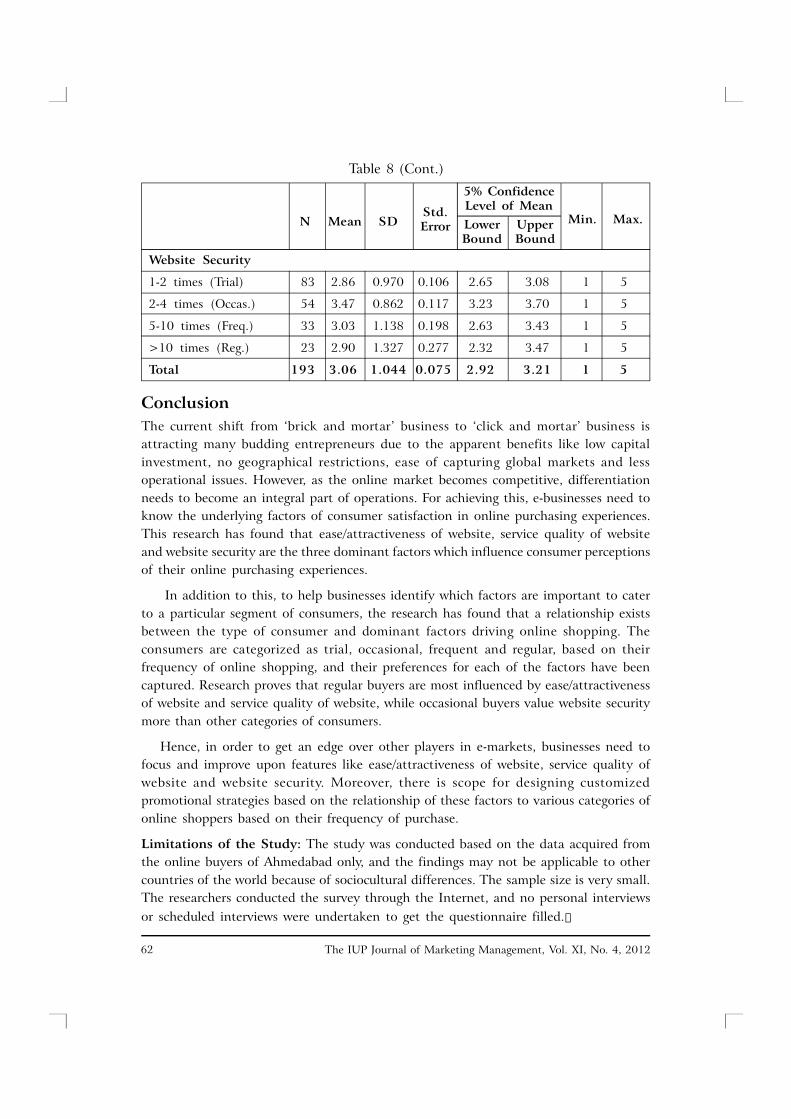
InterpretationAll the three factors have a significance value of 0.000, 0.000 and 0.008, respectively,which is less than 0.05, and therefore, the null hypotheses is rejected and H2 is acceptedas there is relationship between the factors, viz., website design/attractiveness, websiteservice quality and website security, and the different types of buyers, viz., trial,occasional, frequent and regular buyers. Looking at the descriptive statistics (Table 8),it can be stated that regular buyers are most influenced by ease/attractiveness of websiteand service quality of website, while occasional buyers value website security more thanother categories of consumers. Frequent and occasional buyers are almost parallel andmedium in their choice of factors affecting their shopping behavior. Trial buyers havelimited online shopping experience, which is also evident from the analysis, as theirmean values are the lowest in all the three dominant factors.
N Mean SD Std.Lower UpperErrorBound Bound
Min. Max.
Website Ease/Attractiveness
1-2 times (Trial) 84 3.15 0.991 0.108 2.94 3.37 1 5
2-4 times (Occas.) 54 3.74 0.565 0.077 3.59 3.89 2 5
5-10 times (Freq) 33 3.75 0.725 0.126 3.50 4.01 1 5
>10 times (Reg.) 23 4.14 0.644 0.134 3.87 4.42 3 5
Total 194 3.53 0.879 0.063 3.41 3.66 1 5
Website Service Quality
1-2 times (Trial) 83 2.76 0.812 0.089 2.58 2.93 1 5
2-4 times (Occas.) 54 3.26 0.677 0.092 3.07 3.44 2 5
5-10 times (Freq.) 33 3.32 0.515 0.090 3.14 3.51 2 5
>10 times (Reg.) 23 3.72 0.800 0.167 3.37 4.06 2 5
Total 193 3.11 0.799 0.058 2.99 3.22 1 5
Table 8: Descriptive Statistics
5% ConfidenceLevel of Mean
Sum of MeanSquares df Square F Sig.
Table 7 (Cont.)
Website Security Between 12.734 3 4.245 4.078 0.008Groups
Within 196.707 189 1.041Groups
Total 209.440 192
The IUP Journal of Marketing Management, Vol. XI, No. 4, 201262
ConclusionThe current shift from ‘brick and mortar’ business to ‘click and mortar’ business isattracting many budding entrepreneurs due to the apparent benefits like low capitalinvestment, no geographical restrictions, ease of capturing global markets and lessoperational issues. However, as the online market becomes competitive, differentiationneeds to become an integral part of operations. For achieving this, e-businesses need toknow the underlying factors of consumer satisfaction in online purchasing experiences.This research has found that ease/attractiveness of website, service quality of websiteand website security are the three dominant factors which influence consumer perceptionsof their online purchasing experiences.
In addition to this, to help businesses identify which factors are important to caterto a particular segment of consumers, the research has found that a relationship existsbetween the type of consumer and dominant factors driving online shopping. Theconsumers are categorized as trial, occasional, frequent and regular, based on theirfrequency of online shopping, and their preferences for each of the factors have beencaptured. Research proves that regular buyers are most influenced by ease/attractivenessof website and service quality of website, while occasional buyers value website securitymore than other categories of consumers.
Hence, in order to get an edge over other players in e-markets, businesses need tofocus and improve upon features like ease/attractiveness of website, service quality ofwebsite and website security. Moreover, there is scope for designing customizedpromotional strategies based on the relationship of these factors to various categories ofonline shoppers based on their frequency of purchase.
Limitations of the Study: The study was conducted based on the data acquired fromthe online buyers of Ahmedabad only, and the findings may not be applicable to othercountries of the world because of sociocultural differences. The sample size is very small.The researchers conducted the survey through the Internet, and no personal interviewsor scheduled interviews were undertaken to get the questionnaire filled.J
N Mean SDStd.
Lower UpperErrorBound Bound
Min. Max.
Table 8 (Cont.)
Website Security
1-2 times (Trial) 83 2.86 0.970 0.106 2.65 3.08 1 5
2-4 times (Occas.) 54 3.47 0.862 0.117 3.23 3.70 1 5
5-10 times (Freq.) 33 3.03 1.138 0.198 2.63 3.43 1 5
>10 times (Reg.) 23 2.90 1.327 0.277 2.32 3.47 1 5
Total 193 3.06 1.044 0.075 2.92 3.21 1 5
5% ConfidenceLevel of Mean
63Factors Influencing Online Shopping: An Empirical Study in Ahmedabad
Bibliography1. Changchit C (2006), “Consumer Perceptions of Online Shopping”, Issues in
Information Systems, Vol. 7, No. 2, pp. 177-181, available at http://iacis.org/iis/2006/Changchit.pdf
2. Cronbach L (1951), “Coefficient Alpha and the Internal Structure of Tests”,Psychometrika, Vol. 16, No. 3, pp. 297-334.
3. Dholakia R (1999), “Going Shopping: Key Determinants of Shopping Behavioursand Motivations”, International Journal of Retail and Distribution Management,Vol. 27, No. 4, pp. 154-165.
4. Gurvinder S S and Zhaobin C (2005), “Web-Based Shopping: Consumers’Attitudes Towards Online Shopping in New Zealand”, Journal of Electronic CommerceResearch, Vol. 6, No. 2, pp. 79-94, available at http://www.csulb.edu/journals/jecr/issues/20052/paper1.pdf
5. Hoffman D and Novak T (1997), “A New Marketing Paradigm for ElectronicCommerce”, The Information Society, Special Issue on Electronic Commerce, Vol. 13,January-March, pp. 43-54.
6. IAMAI (2010), “Consumer Demography has Affected Internet AdoptionMarginally”, Internet Mobile Association of India, July.
7. Juxt (2010), “India Online Landscape: Online Indians and Their Net UsageBehavior and Preferences”, available at http://www.slideshare.net/JuxtConsult/india-online-landscape-2010-snapshot
8. Know K and Lee J (2003), “Concerns About Payment Security of InternetPurchases: A Perspective on Current On-Line Shoppers”, Clothing and TextilesResearch Journal, Vol. 21, No. 4, pp. 174-184.
9. Kotler P and Armstrong G (2000), ‘Marketing, 5th Edition, Prentice-Hall, EnglewoodCliffs, NJ.
10. Ruchi N and Gupta S L (2010), “Impact of Changing Demographic Profiles ofIndian Customers on their Internet Shopping Behaviour”, Viewpoint, July-December, pp. 17-24, available at http://www.tmu.ac.in/gallery/managementjournal/final_inner_07.pdf
11. Schiffman L and Kanuk L (2003), Consumer Behaviour, 8th Edition, Prentice Hall,New Jersey.
12. Steenkamp J, Hofstede F and Wedel M (1999), “A Cross-National InvestigationInto the Individual and National Antecedents of Consumer Innovativeness,” Journalof Marketing, Vol. 63, April, pp. 55-69.
13. Vaggelis S, Adamantia C and Maro V (2010), “Perceptions Towards OnlineShopping: Analyzing the Greek University Students’ Attitude”, Communications
The IUP Journal of Marketing Management, Vol. XI, No. 4, 201264
of the IBIMA, Vol. 2010, pp. 1-13, available at http://www.ibimapublishing.com/journals/CIBIMA/2010/854516/854516.pdf
14. Wotruba T and Pribova M (1995), “Direct Selling in an Emerging Market Economy:A Comparison of Central Europe with US”, in T Wotruba, Proceedings of theInternational Academic Symposium on Direct Selling in Central and Eastern Europe,pp. 87-193, Direct Selling Education Foundation, Washington DC.
Appendix
Personal Information of the Respondent
Name: _________________________
Age (in Years): 21-30 31-40 >40
Gender: Male Female
Highest Education Qualification:
Undergraduate Graduate Postgraduate
Occupation:
Service Employed Self-Employed Professional/Business
Non-Working/Studying/Part-Time
Monthly Household Income ( ):
<15,000 15,000-30,000 30,000-45,000
>45,000
Please mark the choices carefully and try to give the right information aboutyour perception.
How many times did you go for online shopping in the past year?
1-2 Times 2-4 Times 5-10 Times
>10 Times
Questionnaire: Perception Towards Online Buying Behavior
65Factors Influencing Online Shopping: An Empirical Study in Ahmedabad
Reference # 03J-2012-11-03-01
Appendix (Cont.)
To what degree do you agree or disagree with the following statements?
1.
2.
3.
4.
5.
6.
7.
8.
9.
10.
11.
12.
13.
14.
15.
16.
17.
18.
The website provides an in-depthinformation about products.
It is quick and easy to complete atransaction through online shopping.
Online shopping has good collection.
Online shopping takes less time duringtransaction.
Online shopping has competitive pricesand sometimes offers discounts.
A variety of products are offered withgood discount.
I feel comfortable while surfing theInternet for online shopping.
The product delivered was representedaccurately by the website and was of goodquality.
One gets whatever he/she orders throughonline shopping.
The product is delivered on time aspromised by the company.
The company is willing and ready torespond to customer needs.
When you have a problem, the websiteshows a sincere interest in solving it.
Online shopping is secure.
Online shopping maintains privacy.
I feel my credit card information is notsecure.
Inquiries are answered promptly duringonline transaction.
The website always offers good discounts.
The website understands my needsproperly.
1 2 3 4 5
1 2 3 4 5
1 2 3 4 5
1 2 3 4 5
1 2 3 4 5
1 2 3 4 5
1 2 3 4 5
1 2 3 4 5
1 2 3 4 5
1 2 3 4 5
1 2 3 4 5
1 2 3 4 5
1 2 3 4 5
1 2 3 4 5
1 2 3 4 5
1 2 3 4 5
1 2 3 4 5
1 2 3 4 5
Note: 1 – Highly Disagree; 2 – Disagree; 3 – Neutral (Neither Agree Nor Disagree); 4 – Agree;5 – Strongly Agree.

Copyright of IUP Journal of Marketing Management is the property of IUP Publications and its content may not
be copied or emailed to multiple sites or posted to a listserv without the copyright holder's express written
permission. However, users may print, download, or email articles for individual use.


