Embed Size (px)
Citation preview

02Strategicreport
02 Strategic report 10 At a glance
10 Our strategy10 What we offer11 Where we operate
12 Our business model14 Our distribution16 Our performance18 Our businesses and their performance
18 Asia24 United States28 United Kingdom and Europe – Insurance and investments33 United Kingdom and Europe – Asset management
37 Chief Financial Officer’s report on the 2016 financial performance50 Group Chief Risk Officer’s report of the risks facing our business
and how these are managed 62 Corporate responsibility review
Prudential plc Annual Report 2016 www.prudential.co.uk10
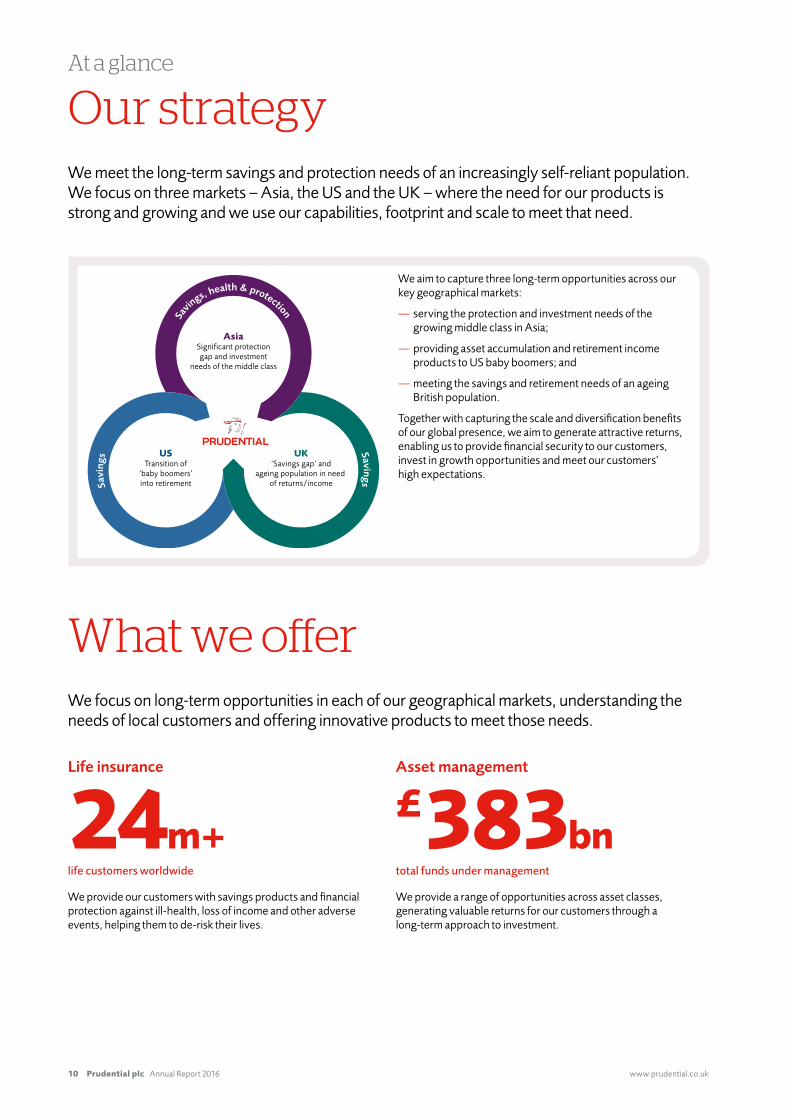
Our strategyWe meet the long-term savings and protection needs of an increasingly self-reliant population. We focus on three markets – Asia, the US and the UK – where the need for our products is strong and growing and we use our capabilities, footprint and scale to meet that need.
What we offerWe focus on long-term opportunities in each of our geographical markets, understanding the needs of local customers and offering innovative products to meet those needs.
Lifeinsurance Assetmanagement
24m+£383bn
life customers worldwide total funds under management
We provide our customers with savings products and financial protection against ill-health, loss of income and other adverse events, helping them to de-risk their lives.
We provide a range of opportunities across asset classes, generating valuable returns for our customers through a long-term approach to investment.
At a glance
USTransition of
‘baby boomers’into retirement
UK‘Savings gap’ and
ageing population in need of returns/income
AsiaSignificant protectiongap and investment
needs of the middle class
Savin
gs, health & protection
Savi
ngs Savings
We aim to capture three long-term opportunities across our key geographical markets:
— serving the protection and investment needs of the growing middle class in Asia;
— providing asset accumulation and retirement income products to US baby boomers; and
— meeting the savings and retirement needs of an ageing British population.
Together with capturing the scale and diversification benefits of our global presence, we aim to generate attractive returns, enabling us to provide financial security to our customers, invest in growth opportunities and meet our customers’ high expectations.
www.prudential.co.uk� Annual�Report�2016 Prudential plc 11
02Strategicreport
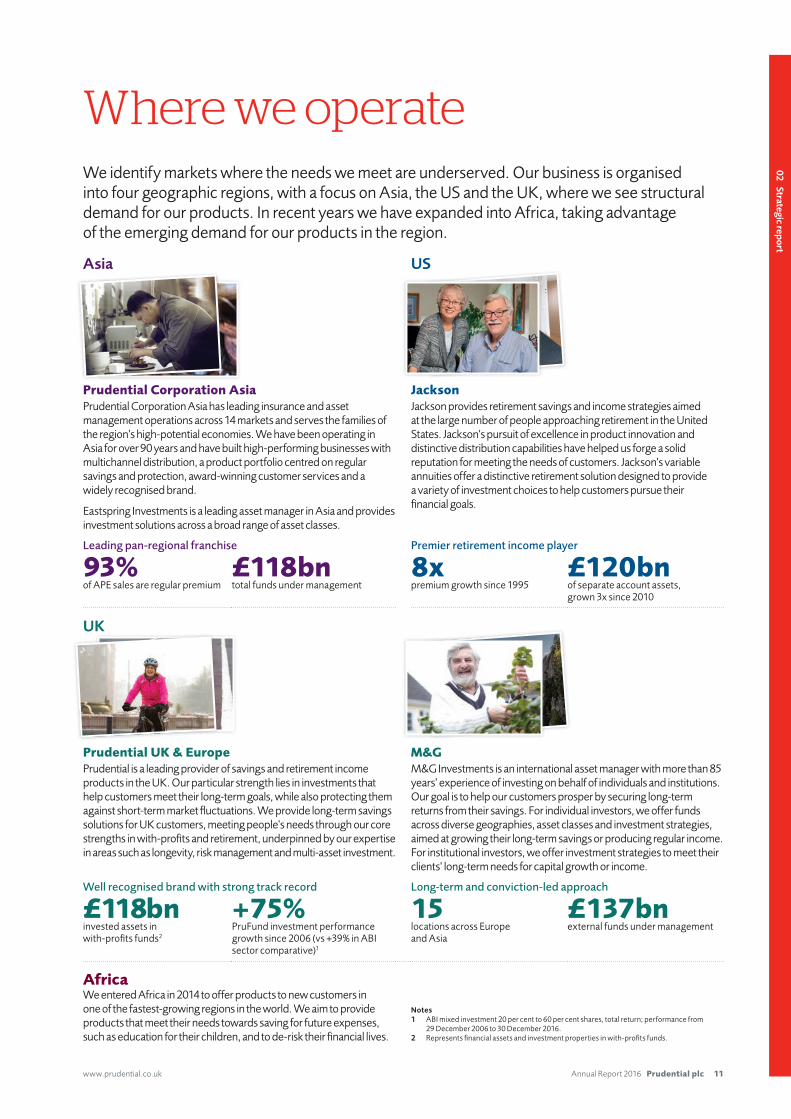
Where we operateWe identify markets where the needs we meet are underserved. Our business is organised into four geographic regions, with a focus on Asia, the US and the UK, where we see structural demand for our products. In recent years we have expanded into Africa, taking advantage of the emerging demand for our products in the region.
Asia
US
Prudential Corporation AsiaPrudential Corporation Asia has leading insurance and asset management operations across 14 markets and serves the families of the region’s high-potential economies. We have been operating in Asia for over 90 years and have built high-performing businesses with multichannel distribution, a product portfolio centred on regular savings and protection, award-winning customer services and a widely recognised brand.
Eastspring Investments is a leading asset manager in Asia and provides investment solutions across a broad range of asset classes.
JacksonJackson provides retirement savings and income strategies aimed at the large number of people approaching retirement in the United States. Jackson’s pursuit of excellence in product innovation and distinctive distribution capabilities have helped us forge a solid reputation for meeting the needs of customers. Jackson’s variable annuities offer a distinctive retirement solution designed to provide a variety of investment choices to help customers pursue their financial goals.
Leading pan-regional franchise Premier retirement income player
93% £118bn 8x £120bnof APE sales are regular premium total funds under management premium growth since 1995 of separate account assets,
grown 3x since 2010
UK
Prudential UK & EuropePrudential is a leading provider of savings and retirement income products in the UK. Our particular strength lies in investments that help customers meet their long-term goals, while also protecting them against short-term market fluctuations. We provide long-term savings solutions for UK customers, meeting people’s needs through our core strengths in with-profits and retirement, underpinned by our expertise in areas such as longevity, risk management and multi-asset investment.
M&GM&G Investments is an international asset manager with more than 85 years’ experience of investing on behalf of individuals and institutions. Our goal is to help our customers prosper by securing long-term returns from their savings. For individual investors, we offer funds across diverse geographies, asset classes and investment strategies, aimed at growing their long-term savings or producing regular income. For institutional investors, we offer investment strategies to meet their clients’ long-term needs for capital growth or income.
Well recognised brand with strong track record Long-term and conviction-led approach
£118bn +75% 15 £137bninvested assets in with-profits funds2
PruFund investment performance growth since 2006 (vs +39% in ABI sector comparative)1
locations across Europe and Asia
external funds under management
AfricaWe entered Africa in 2014 to offer products to new customers in one of the fastest-growing regions in the world. We aim to provide products that meet their needs towards saving for future expenses, such as education for their children, and to de-risk their financial lives.
Notes1 ABI mixed investment 20 per cent to 60 per cent shares, total return; performance from
29 December 2006 to 30 December 2016.2 Represents financial assets and investment properties in with-profits funds.
Understanding our markets Driving our business
Prudential plc Annual Report 2016 www.prudential.co.uk12
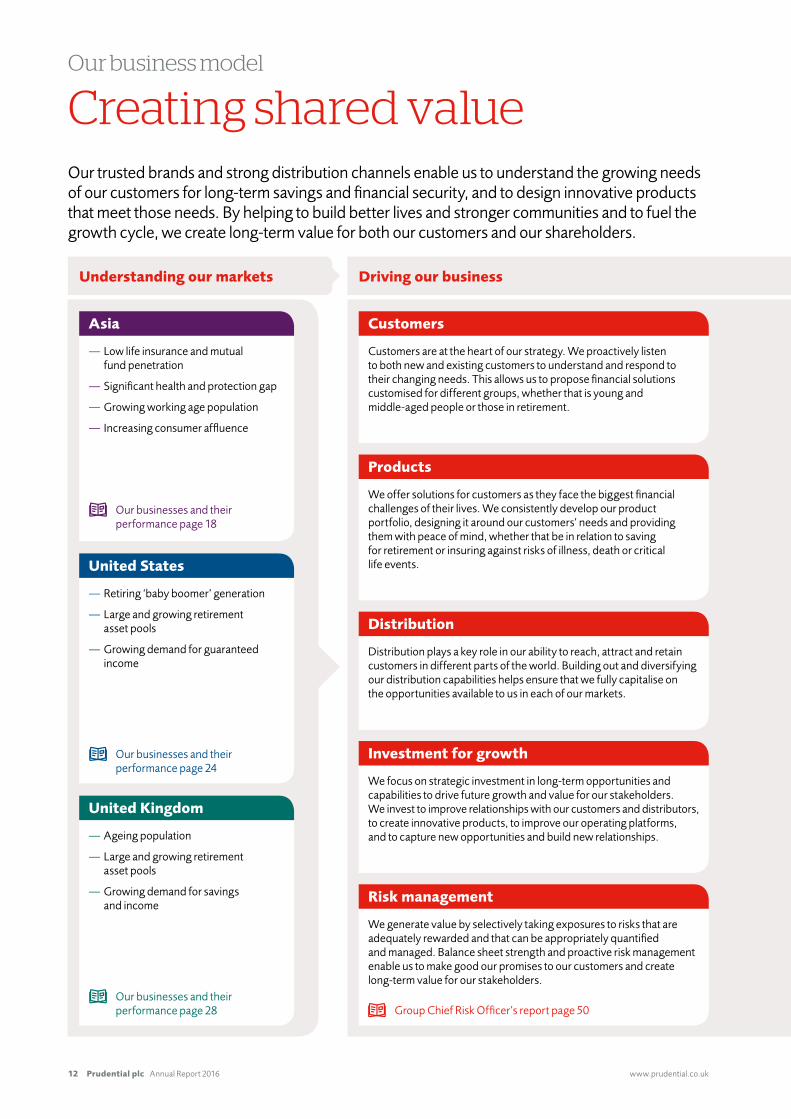
Creating shared valueOur trusted brands and strong distribution channels enable us to understand the growing needs of our customers for long-term savings and financial security, and to design innovative products that meet those needs. By helping to build better lives and stronger communities and to fuel the growth cycle, we create long-term value for both our customers and our shareholders.
Our business model
Customers are at the heart of our strategy. We proactively listen to both new and existing customers to understand and respond to their changing needs. This allows us to propose financial solutions customised for different groups, whether that is young and middle-aged people or those in retirement.
Customers
We generate value by selectively taking exposures to risks that are adequately rewarded and that can be appropriately quantified and managed. Balance sheet strength and proactive risk management enable us to make good our promises to our customers and create long-term value for our stakeholders.
We offer solutions for customers as they face the biggest financial challenges of their lives. We consistently develop our product portfolio, designing it around our customers’ needs and providing them with peace of mind, whether that be in relation to saving for retirement or insuring against risks of illness, death or critical life events.
Distribution plays a key role in our ability to reach, attract and retain customers in different parts of the world. Building out and diversifying our distribution capabilities helps ensure that we fully capitalise on the opportunities available to us in each of our markets.
We focus on strategic investment in long-term opportunities and capabilities to drive future growth and value for our stakeholders. We invest to improve relationships with our customers and distributors, to create innovative products, to improve our operating platforms, and to capture new opportunities and build new relationships.
Products
Distribution
Investment for growth
Risk management
— Low life insurance and mutual fund penetration
— Significant health and protection gap
— Growing working age population
— Increasing consumer affluence
Asia
Our businesses and their performance page 18
— Retiring ‘baby boomer’ generation
— Large and growing retirement asset pools
— Growing demand for guaranteed income
United States
Our businesses and their performance page 24
— Ageing population
— Large and growing retirement asset pools
— Growing demand for savings and income
United Kingdom
Our businesses and their performance page 28 Group Chief Risk Officer’s report page 50
Creating value…Driving our business …for our stakeholders
www.prudential.co.uk� Annual�Report�2016 Prudential plc 13
02Strategicreport
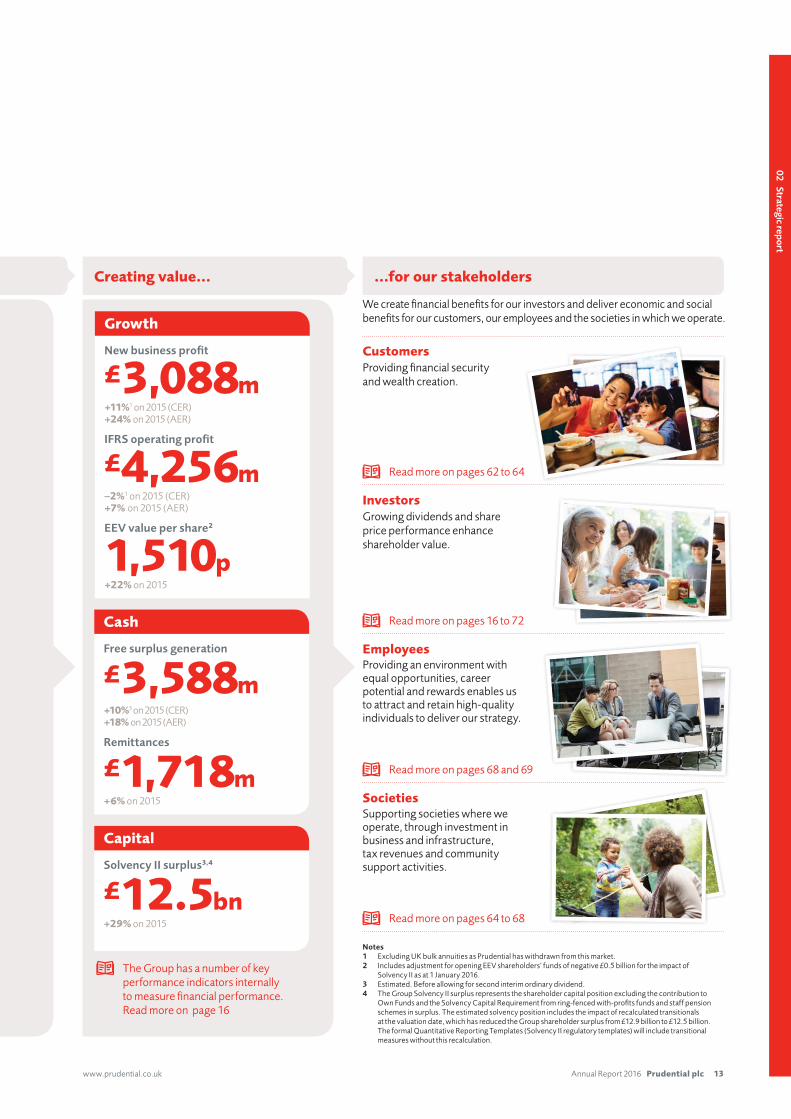
Newbusinessprofit
£3,088m+11%1 on 2015 (CER) +24% on 2015 (AER)
IFRSoperatingprofit
£4,256m–2%1 on 2015 (CER) +7% on 2015 (AER)
EEVvaluepershare2
1,510 p+22% on 2015
Growth
Freesurplusgeneration
£3,588m+10%3 on 2015 (CER) +18% on 2015 (AER)
Remittances
£1,718m+6% on 2015
Cash
SolvencyIIsurplus3,4
£12.5bn+29% on 2015
Capital
The Group has a number of key performance indicators internally to measure financial performance. Read more on page 16
CustomersProviding financial security and wealth creation.
InvestorsGrowing dividends and share price performance enhance shareholder value.
EmployeesProviding an environment with equal opportunities, career potential and rewards enables us to attract and retain high-quality individuals to deliver our strategy.
SocietiesSupporting societies where we operate, through investment in business and infrastructure, tax revenues and community support activities.
Read more on pages 62 to 64
Read more on pages 16 to 72
Read more on pages 68 and 69
Read more on pages 64 to 68
We create financial benefits for our investors and deliver economic and social benefits for our customers, our employees and the societies in which we operate.
Notes1 Excluding UK bulk annuities as Prudential has withdrawn from this market.2 Includes adjustment for opening EEV shareholders’ funds of negative £0.5 billion for the impact of
Solvency II as at 1 January 2016.3 Estimated. Before allowing for second interim ordinary dividend.4 The Group Solvency II surplus represents the shareholder capital position excluding the contribution to
Own Funds and the Solvency Capital Requirement from ring-fenced with-profits funds and staff pension schemes in surplus. The estimated solvency position includes the impact of recalculated transitionals at the valuation date, which has reduced the Group shareholder surplus from £12.9 billion to £12.5 billion. The formal Quantitative Reporting Templates (Solvency II regulatory templates) will include transitional measures without this recalculation.
Prudential plc Annual Report 2016 www.prudential.co.uk14
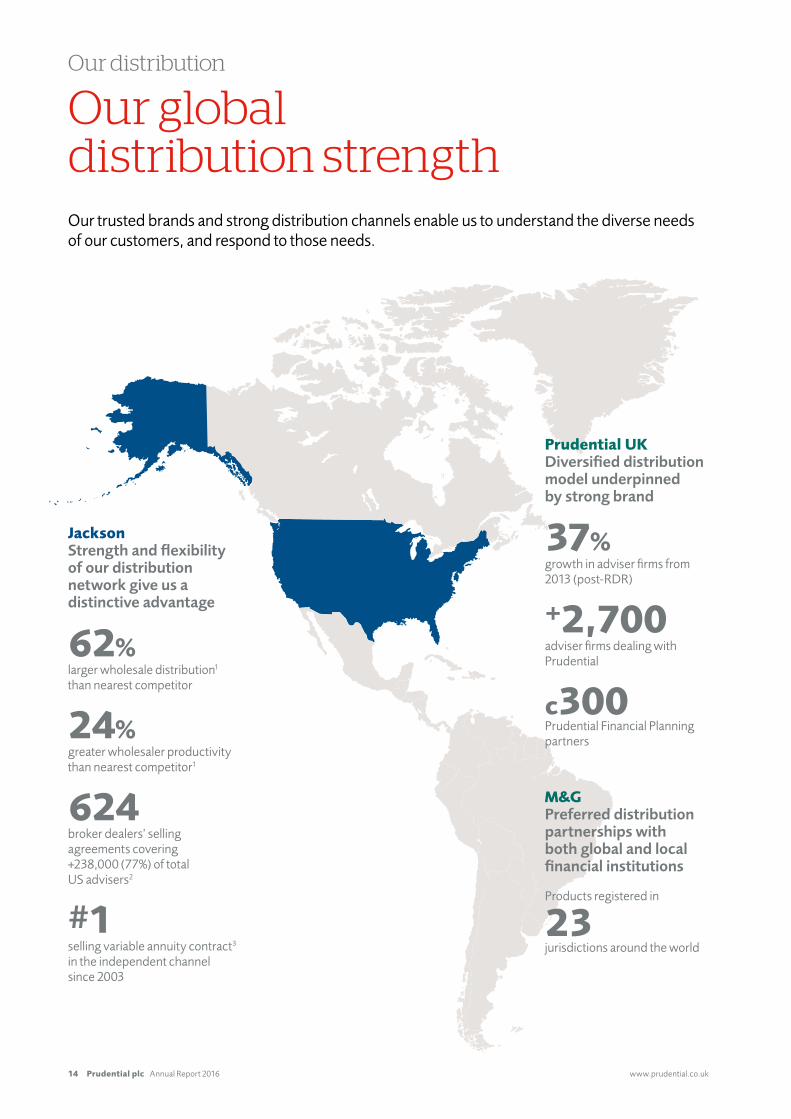
Our distribution
JacksonStrengthandflexibilityofourdistributionnetworkgiveusadistinctiveadvantage
62% larger wholesale distribution1 than nearest competitor
24% greater wholesaler productivity than nearest competitor1
624broker dealers’ selling agreements covering +238,000 (77%) of total US advisers2
#1 selling variable annuity contract3 in the independent channel since 2003
Prudential UKDiversifieddistributionmodelunderpinnedbystrongbrand
37% growth in adviser firms from 2013 (post-RDR)
+2,700adviser firms dealing with Prudential
c300Prudential Financial Planning partners
M&GPreferreddistributionpartnershipswithbothglobalandlocalfinancialinstitutions
Products registered in
23 jurisdictions around the world
Our global distribution strengthOur trusted brands and strong distribution channels enable us to understand the diverse needs of our customers, and respond to those needs.
www.prudential.co.uk� Annual�Report�2016 Prudential plc 15
02Strategicreport
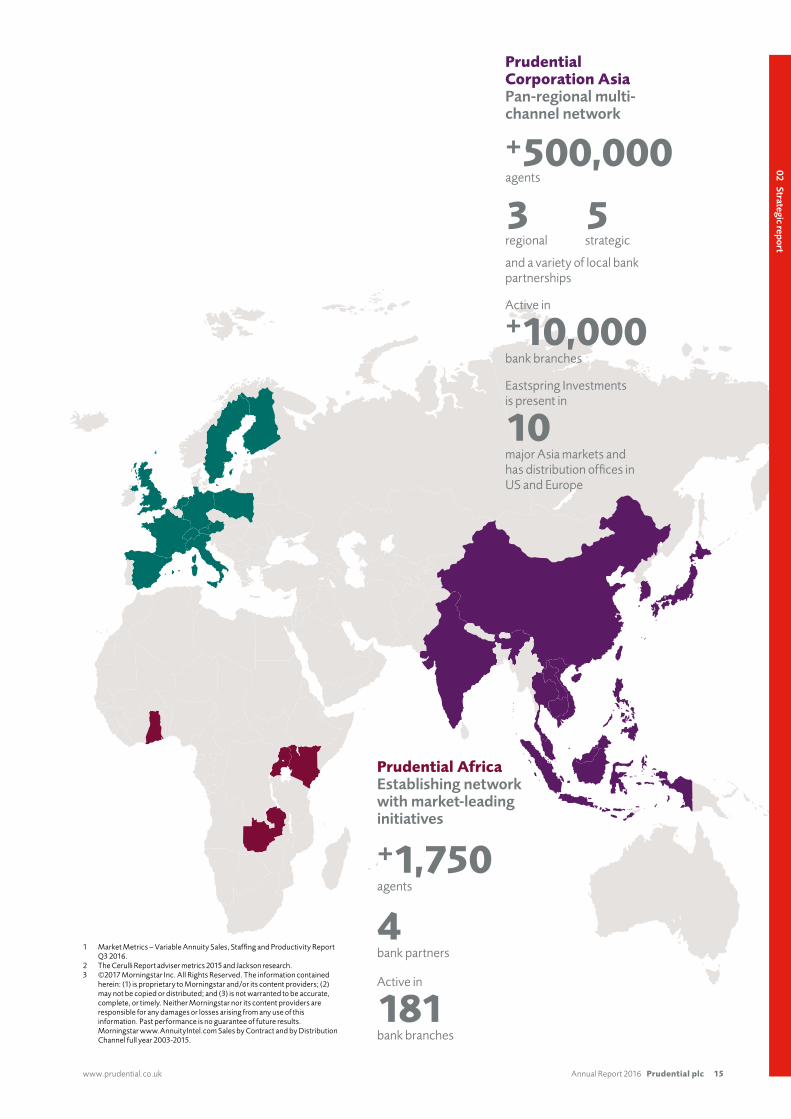
Prudential AfricaEstablishingnetworkwithmarket-leadinginitiatives
+1,750agents
4bank partners
Active in
181bank branches
Prudential Corporation AsiaPan-regionalmulti-channelnetwork
+500,000agents
3 5regional strategic
and a variety of local bank partnerships
Active in
+10,000bank branches
Eastspring Investments is present in
10major Asia markets and has distribution offices in US and Europe
1 Market Metrics – Variable Annuity Sales, Staffing and Productivity Report Q3 2016.
2 The Cerulli Report adviser metrics 2015 and Jackson research.3 ©2017 Morningstar Inc. All Rights Reserved. The information contained
herein: (1) is proprietary to Morningstar and/or its content providers; (2) may not be copied or distributed; and (3) is not warranted to be accurate, complete, or timely. Neither Morningstar nor its content providers are responsible for any damages or losses arising from any use of this information. Past performance is no guarantee of future results. Morningstar www.AnnuityIntel.com Sales by Contract and by Distribution Channel full year 2003-2015.
Prudential plc Annual Report 2016 www.prudential.co.uk16
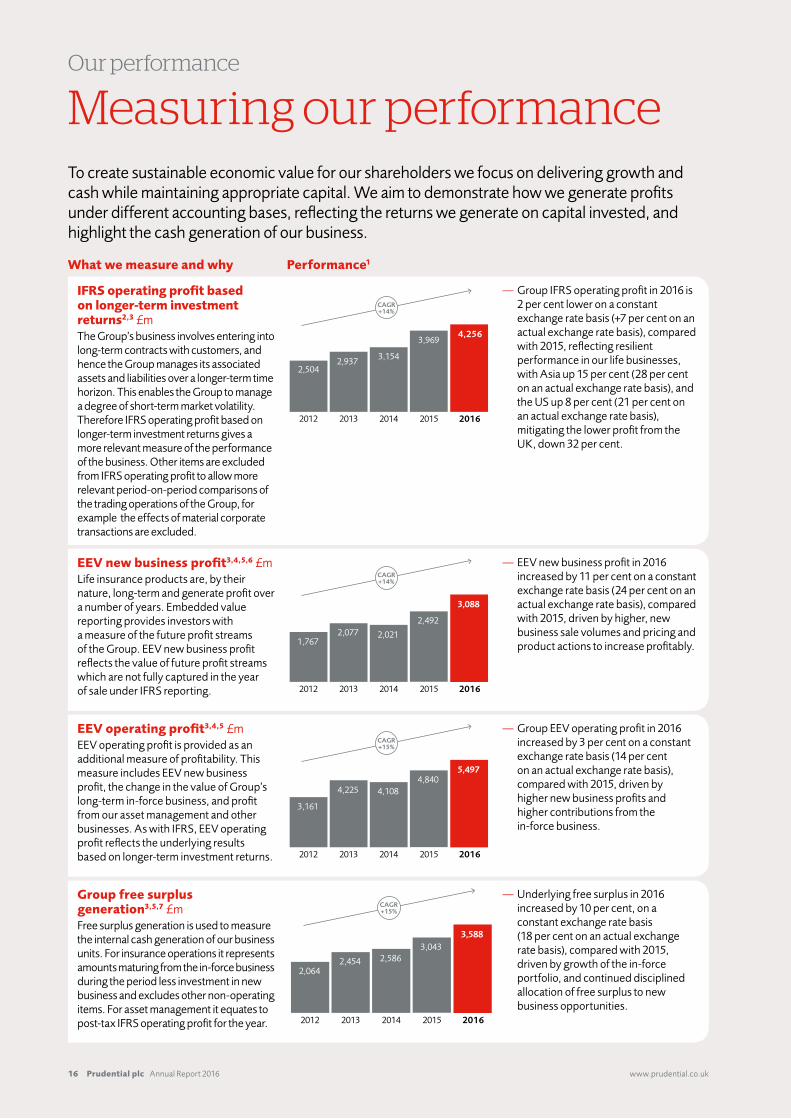
Measuring our performanceTo create sustainable economic value for our shareholders we focus on delivering growth and cash while maintaining appropriate capital. We aim to demonstrate how we generate profits under different accounting bases, reflecting the returns we generate on capital invested, and highlight the cash generation of our business.
Our performance
IFRS operating profit based on longer-term investment returns2,3 £mThe Group’s business involves entering into long-term contracts with customers, and hence the Group manages its associated assets and liabilities over a longer-term time horizon. This enables the Group to manage a degree of short-term market volatility. Therefore IFRS operating profit based on longer-term investment returns gives a more relevant measure of the performance of the business. Other items are excluded from IFRS operating profit to allow more relevant period-on-period comparisons of the trading operations of the Group, for example the effects of material corporate transactions are excluded.
— Group IFRS operating profit in 2016 is 2 per cent lower on a constant exchange rate basis (+7 per cent on an actual exchange rate basis), compared with 2015, reflecting resilient performance in our life businesses, with Asia up 15 per cent (28 per cent on an actual exchange rate basis), and the US up 8 per cent (21 per cent on an actual exchange rate basis), mitigating the lower profit from the UK, down 32 per cent.
EEV new business profit3,4,5,6 £mLife insurance products are, by their nature, long-term and generate profit over a number of years. Embedded value reporting provides investors with a measure of the future profit streams of the Group. EEV new business profit reflects the value of future profit streams which are not fully captured in the year of sale under IFRS reporting.
— EEV new business profit in 2016 increased by 11 per cent on a constant exchange rate basis (24 per cent on an actual exchange rate basis), compared with 2015, driven by higher, new business sale volumes and pricing and product actions to increase profitably.
EEV operating profit3,4,5 £mEEV operating profit is provided as an additional measure of profitability. This measure includes EEV new business profit, the change in the value of Group’s long-term in-force business, and profit from our asset management and other businesses. As with IFRS, EEV operating profit reflects the underlying results based on longer-term investment returns.
— Group EEV operating profit in 2016 increased by 3 per cent on a constant exchange rate basis (14 per cent on an actual exchange rate basis), compared with 2015, driven by higher new business profits and higher contributions from the in-force business.
Group free surplus generation3,5,7 £mFree surplus generation is used to measure the internal cash generation of our business units. For insurance operations it represents amounts maturing from the in-force business during the period less investment in new business and excludes other non-operating items. For asset management it equates to post-tax IFRS operating profit for the year.
— Underlying free surplus in 2016 increased by 10 per cent, on a constant exchange rate basis (18 per cent on an actual exchange rate basis), compared with 2015, driven by growth of the in-force portfolio, and continued disciplined allocation of free surplus to new business opportunities.
What we measure and why Performance1
3,088
2,492
2,0212,0771,767
CAGR+14%
20162015201420132012
5,4974,840
4,1084,225
3,161
CAGR+15%
20162015201420132012
3,5883,043
2,5862,4542,064
CAGR+15%
20162015201420132012
4,256
2016
3,969
2015
3,154
2014
2,937
2013
2,504
2012
CAGR+14%
www.prudential.co.uk� Annual�Report�2016 Prudential plc 17
02Strategicreport
Notes:1 The comparative results shown above have been prepared using actual exchange rates (AER)
basis except where otherwise stated. Comparative results on a constant exchange rate (CER) basis are also shown in financial tables in the Chief Financial Officers’ report on our 2016 financial performance. CAGR is Compound Annual Growth Rate.
2 IFRS operating profit is management’s primary measure of profitability and provides an underlying operating result based on longer-term investment returns and excludes non-operating items. Further information on its definition and reconciliation to profit for the period is set out in note B1 of the IFRS financial statements.
3 Following its reclassification to held for sale during 2016, operating results exclude the contribution of the Korea life business. The 2015 comparative results have been similarly adjusted.
4 Embedded value reporting provides investors with a measure of the future profit streams of the Group. The EEV basis results have been prepared in accordance with EEV principles discussed in note 1 of the EEV basis results. A reconciliation between IFRS and the EEV shareholder funds is included in note C of the Additional EEV financial information.
5 The 2016 EEV basis results for UK insurance operations have been prepared on a basis that reflects the Solvency II regime, effective from 1 January 2016. The 2015 comparative results for UK insurance reflects the Solvency I basis.
6 Excluding UK bulk annuities as Prudential has withdrawn from this market.7 Free surplus generation represents ‘underlying free surplus’ based on operating movements,
including the general insurance commission earned during the period and excludes market movement, foreign exchange, capital movements, shareholders’ other income and expenditure and centrally arising restructuring and Solvency II implementation costs. Further information is set out in note 11 of the EEV basis results.
8 Cash remitted to the Group forms part of the net cash flows of the holding company. A full holding company cash flow is set out in note II (a) of Additional IFRS financial information. This differs from the IFRS Consolidated Statement of Cash Flows which includes all cash flows relating to both policyholders and shareholders’ funds. The holding company cash flow is therefore a more meaningful indicator of the Group’s central liquidity.
9 Estimated before allowing for second interim ordinary dividend.10 Excludes surplus in ring-fenced policyholder funds. The methodology and assumptions used
in calculating the Group Solvency II capital results are set out in note II (c) of the additional financial information.
11 The objectives assume exchange rates at December 2013 and economic assumptions made by Prudential in calculating the EEV basis supplementary information for the half year ended 30 June 2013, and are based on regulatory and solvency regimes applicable across the Group at the time the objectives were set. The objectives assume that the existing EEV, IFRS and free surplus methodology at December 2013 will be applicable over the period.
12 Following the announcement of the proposed sale of the Korea life business in November 2016, amounts for all years exclude the results of the Korea life business, as this sale is expected to complete in 2017. The 2017 Asia objectives have been adjusted accordingly.
13 The Group Solvency II surplus represents the shareholder capital position excluding the contribution to Own Funds and the Solvency Capital Requirement from ring-fenced with-profits funds and staff pension schemes in surplus. The estimated solvency position includes the impact of recalculated transitionals at the valuation date, which has reduced the Group shareholder surplus from £12.9 billion to £12.5 billion. The formal Quantitative Reporting Templates (Solvency II regulatory templates) will include transitional measures without this recalculation.
Business unit remittances8 £mRemittances measure the cash transferred from business units to the Group. Cash flows across the Group reflect our aim of achieving a balance between ensuring sufficient net remittances from business units to cover the dividend (after corporate costs) and the use of cash for reinvestment in profitable opportunities available to the Group.
— Business unit remittances increased by 6 per cent in 2016, compared with 2015, with significant contributions from each of our four major business units.
Group Solvency II capital surplus9,10,13 £bnReplacing the IGD capital regime, from 1 January 2016, Prudential is subject to the risk sensitive solvency framework required under European Solvency II Directives (Solvency II) as implemented by the Prudential Regulation Authority in the UK. The Solvency II surplus represents the aggregated capital (own funds) held by the Group less solvency capital requirements.
— The high quality and recurring nature of our operating capital generation, beneficial effects of debt issued and disciplined approach to managing balance sheet risks is reflected in the solvency capital surplus, which increased to 12.5 billion at 31 December 2016.
2017 objectives11
We are making good progress towards the objectives we announced in December 2013:
Asia objectives12
Asia IFRS operating profit, £mAsia life and asset management pre-tax IFRS operating profit to grow at a compound annual rate of at least 15 per cent over the period 2012 to 2017.
Asia underlying free surplus, £mAsia underlying free surplus generation7 of £0.9 billion to £1.1 billion in 2017.
Group objective
Group cumulative underlying free surplus, £mCumulative Group underlying free surplus generation of at least £10 billion over the four year period from 2014 to end-2017.
1,7181,6251,482
1,3411,200
CAGR+9%
20162015201420132012
1,641
FY162015201420132012
1,4301,228
1,058884
>£1,826m
2017objective
16%
20%16%
16%15%
+17%
1,2861,108
909
1,644
872
FY162015201420132012
758669
565454
£1.1bn
2017objective
16%
24%18%
13%15%
666599468
859 £0.9bn
9.2
2014-2017objective
> £10bn
£9.2bn
2014-2016
12.5
9.7
4.75.1
IGD surplus Solvency II surplus
5.1
20162015201420132012
What we measure and why Performance1
Key Expressed at Dec 2013 FX rates Comparative stated at reported
currency basis
Prudential plc Annual Report 2016 www.prudential.co.uk18
Our businesses and their performance
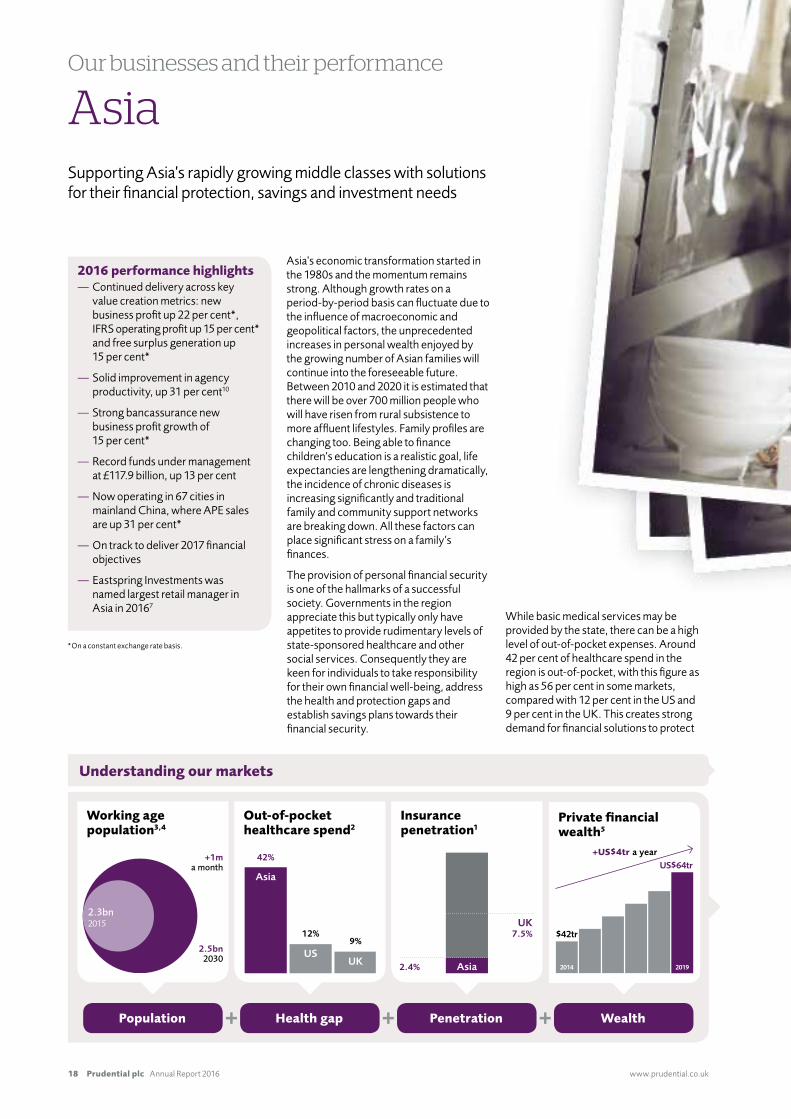
2016 performance highlights—— Continued—delivery—across—key—value—creation—metrics:—new—business—profit—up—22—per—cent*,—IFRS—operating—profit—up—15—per—cent*—and—free—surplus—generation—up—15—per—cent*
—— Solid—improvement—in—agency—productivity,—up—31—per—cent10
—— Strong—bancassurance—new—business—profit—growth—of—15—per—cent*
—— Record—funds—under—management—at—£117.9—billion,—up—13—per—cent
—— Now—operating—in—67—cities—in—mainland—China,—where—APE—sales—are—up—31—per—cent*
—— On—track—to—deliver—2017—financial—objectives
—— Eastspring—Investments—was—named—largest—retail—manager—in—Asia—in—20167
*On—a—constant—exchange—rate—basis.
Working age population3,4
Out-of-pocket healthcare spend2
Insurance penetration1
+1m a month
2.5bn 2030
2.3bn2015
42%
12%9%
Asia
USUK Asia2.4%
UK7.5%
Population Health gap Penetration Wealth
Asia Supporting—Asia’s—rapidly—growing—middle—classes—with—solutions—for—their—financial—protection,—savings—and—investment—needs
Asia’s—economic—transformation—started—in—the—1980s—and—the—momentum—remains—strong.—Although—growth—rates—on—a—period-by-period—basis—can—fluctuate—due—to—the—influence—of—macroeconomic—and—geopolitical—factors,—the—unprecedented—increases—in—personal—wealth—enjoyed—by—the—growing—number—of—Asian—families—will—continue—into—the—foreseeable—future.—Between—2010—and—2020—it—is—estimated—that—there—will—be—over—700—million—people—who—will—have—risen—from—rural—subsistence—to—more—affluent—lifestyles.—Family—profiles—are—changing—too.—Being—able—to—finance—children’s—education—is—a—realistic—goal,—life—expectancies—are—lengthening—dramatically,—the—incidence—of—chronic—diseases—is—increasing—significantly—and—traditional—family—and—community—support—networks—are—breaking—down.—All—these—factors—can—place—significant—stress—on—a—family’s—finances.
The—provision—of—personal—financial—security—is—one—of—the—hallmarks—of—a—successful—society.—Governments—in—the—region—appreciate—this—but—typically—only—have—appetites—to—provide—rudimentary—levels—of—state-sponsored—healthcare—and—other—social—services.—Consequently—they—are—keen—for—individuals—to—take—responsibility—for—their—own—financial—well-being,—address—the—health—and—protection—gaps—and—establish—savings—plans—towards—their—financial—security.
While—basic—medical—services—may—be—provided—by—the—state,—there—can—be—a—high—level—of—out-of-pocket—expenses.—Around—42—per—cent—of—healthcare—spend—in—the—region—is—out-of-pocket,—with—this—figure—as—high—as—56—per—cent—in—some—markets,—compared—with—12—per—cent—in—the—US—and—9—per—cent—in—the—UK.—This—creates—strong——demand—for—financial—solutions—to—protect—
Understanding our markets
Private financial wealth5
2019
US$64tr
2014
$42tr
+US$4tr a year
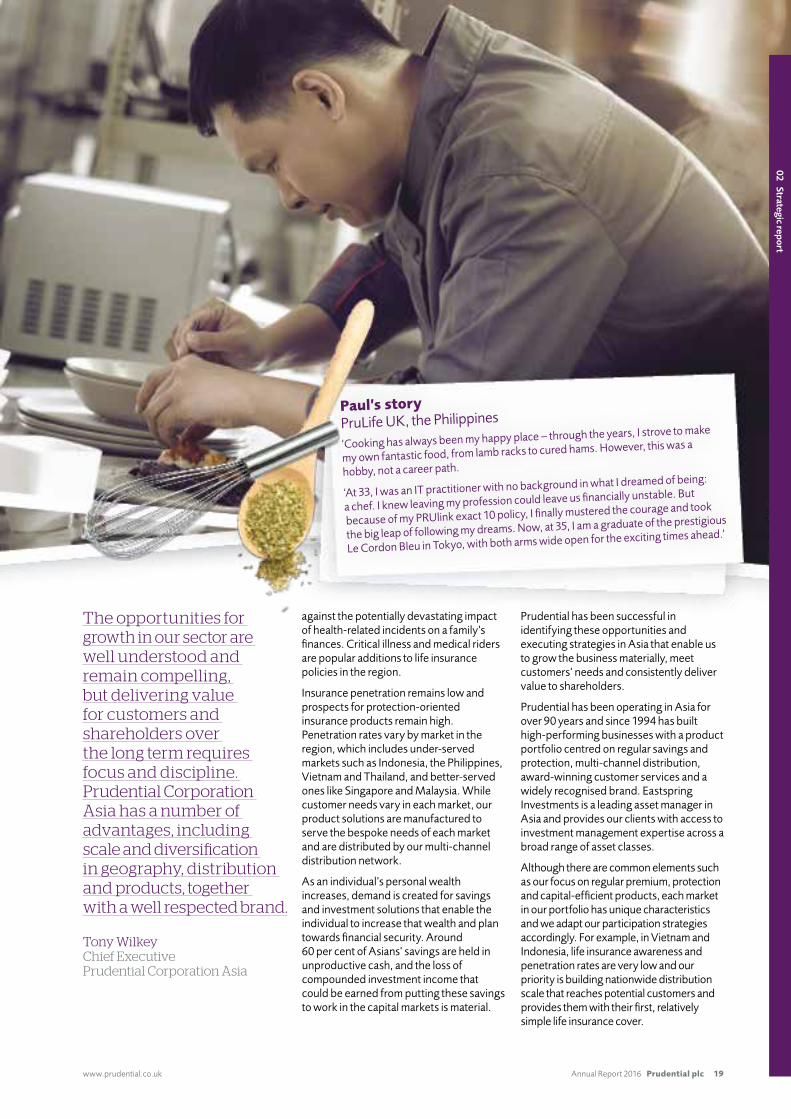
Paul’s storyPruLife—UK,—the—Philippines
‘Cooking—has—always—been—my—happy—place—–—through—the—years,—I—strove—to—make—
my—own—fantastic—food,—from—lamb—racks—to—cured—hams.—However,—this—was—a—
hobby,—not—a—career—path.
‘At—33,—I—was—an—IT—practitioner—with—no—background—in—what—I—dreamed—of—being:——
a—chef.—I—knew—leaving—my—profession—could—leave—us—financially—unstable.—But—
because—of—my—PRUlink—exact—10—policy,—I—finally—mustered—the—courage—and—took—
the—big—leap—of—following—my—dreams.—Now,—at—35,—I—am—a—graduate—of—the—prestigious—
Le—Cordon—Bleu—in—Tokyo,—with—both—arms—wide—open—for—the—exciting—times—ahead.’
www.prudential.co.uk� Annual�Report�2016 Prudential plc 19
02Strategicreport
against—the—potentially—devastating—impact—of—health-related—incidents—on—a—family’s—finances.—Critical—illness—and—medical—riders—are—popular—additions—to—life—insurance—policies—in—the—region.
Insurance—penetration—remains—low—and—prospects—for—protection-oriented—insurance—products—remain—high.—Penetration—rates—vary—by—market—in—the—region,—which—includes—under-served—markets—such—as—Indonesia,—the—Philippines,—Vietnam—and—Thailand,—and—better-served—ones—like—Singapore—and—Malaysia.—While—customer—needs—vary—in—each—market,—our—product—solutions—are—manufactured—to—serve—the—bespoke—needs—of—each—market—and—are—distributed—by—our—multi-channel—distribution—network.
As—an—individual’s—personal—wealth—increases,—demand—is—created—for—savings—and—investment—solutions—that—enable—the—individual—to—increase—that—wealth—and—plan—towards—financial—security.—Around—60—per—cent—of—Asians’—savings—are—held—in—unproductive—cash,—and—the—loss—of—compounded—investment—income—that—could—be—earned—from—putting—these—savings—to—work—in—the—capital—markets—is—material.—
Prudential—has—been—successful—in—identifying—these—opportunities—and—executing—strategies—in—Asia—that—enable—us—to—grow—the—business—materially,—meet—customers’—needs—and—consistently—deliver—value—to—shareholders.—
Prudential—has—been—operating—in—Asia—for—over—90—years—and—since—1994—has—built—high-performing—businesses—with—a—product—portfolio—centred—on—regular—savings—and—protection,—multi-channel—distribution,—award-winning—customer—services—and—a—widely—recognised—brand.—Eastspring—Investments—is—a—leading—asset—manager—in—Asia—and—provides—our—clients—with—access—to—investment—management—expertise—across—a—broad—range—of—asset—classes.
Although—there—are—common—elements—such—as—our—focus—on—regular—premium,—protection—and—capital-efficient—products,—each—market—in—our—portfolio—has—unique—characteristics—and—we—adapt—our—participation—strategies—accordingly.—For—example,—in—Vietnam—and—Indonesia,—life—insurance—awareness—and—penetration—rates—are—very—low—and—our—priority—is—building—nationwide—distribution—scale—that—reaches—potential—customers—and—provides—them—with—their—first,—relatively—simple—life—insurance—cover.—
The opportunities for growth in our sector are well understood and remain compelling, but delivering value for customers and shareholders over the long term requires focus and discipline. Prudential Corporation Asia has a number of advantages, including scale and diversification in geography, distribution and products, together with a well respected brand.
Tony Wilkey Chief Executive Prudential Corporation Asia
Prudential plc Annual Report 2016 www.prudential.co.uk20
Our businesses and their performanceContinued
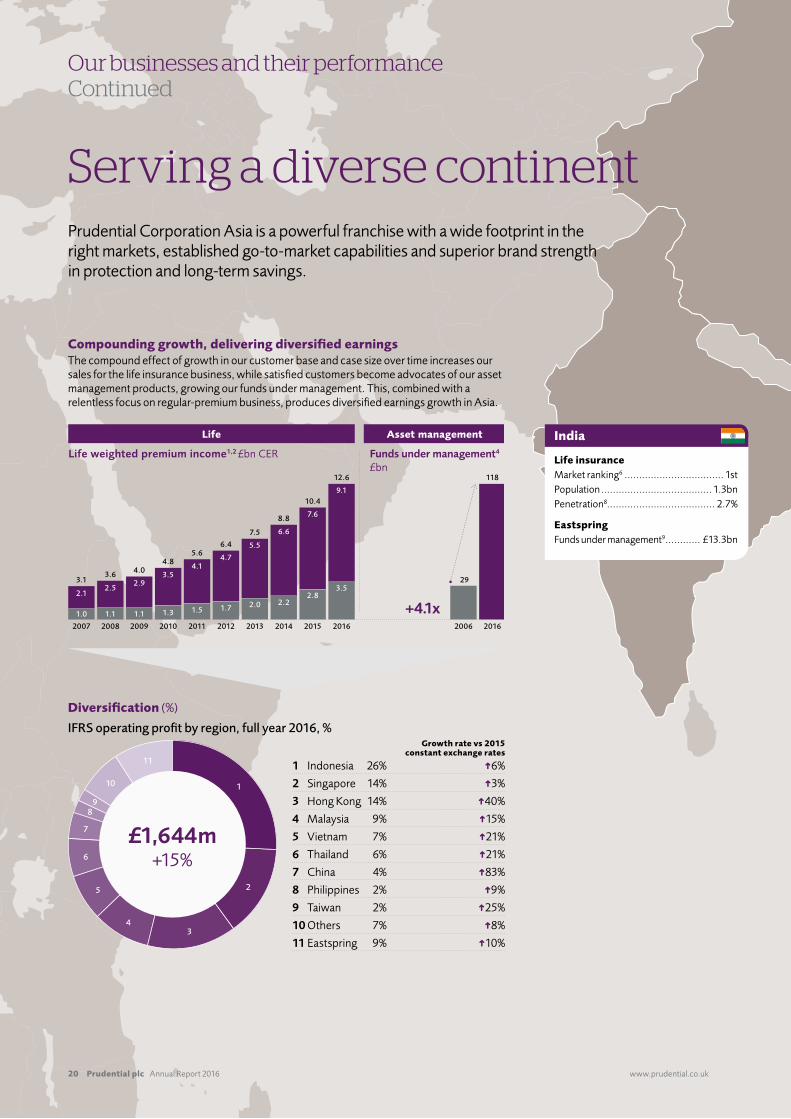
Serving a diverse continentPrudential—Corporation—Asia—is—a—powerful—franchise—with—a—wide—footprint—in—the—right—markets,—established—go-to-market—capabilities—and—superior—brand—strength—in—protection—and—long-term—savings.
Compounding growth, delivering diversified earnings The—compound—effect—of—growth—in—our—customer—base—and—case—size—over—time—increases—our—sales—for—the—life—insurance—business,—while—satisfied—customers—become—advocates—of—our—asset—management—products,—growing—our—funds—under—management.—This,—combined—with—a—relentless—focus—on—regular-premium—business,—produces—diversified—earnings—growth—in—Asia.
Life weighted premium income1,2 £bn CER Funds under management4
£bn
+4.1x
Life Asset management
2007
1.0
2.1
3.1
2008
1.1
2.5
3.6
1.1
2.9
4.0
1.3
3.5
4.8
1.5
4.1
5.6
1.7
4.7
6.4
2.0
5.5
7.5
2.2
6.6
8.8
2.8
7.6
10.4
3.5
9.1
12.6
2009 2010 2011 2012 2013 2014 2015 2016 2006 2016
118
29
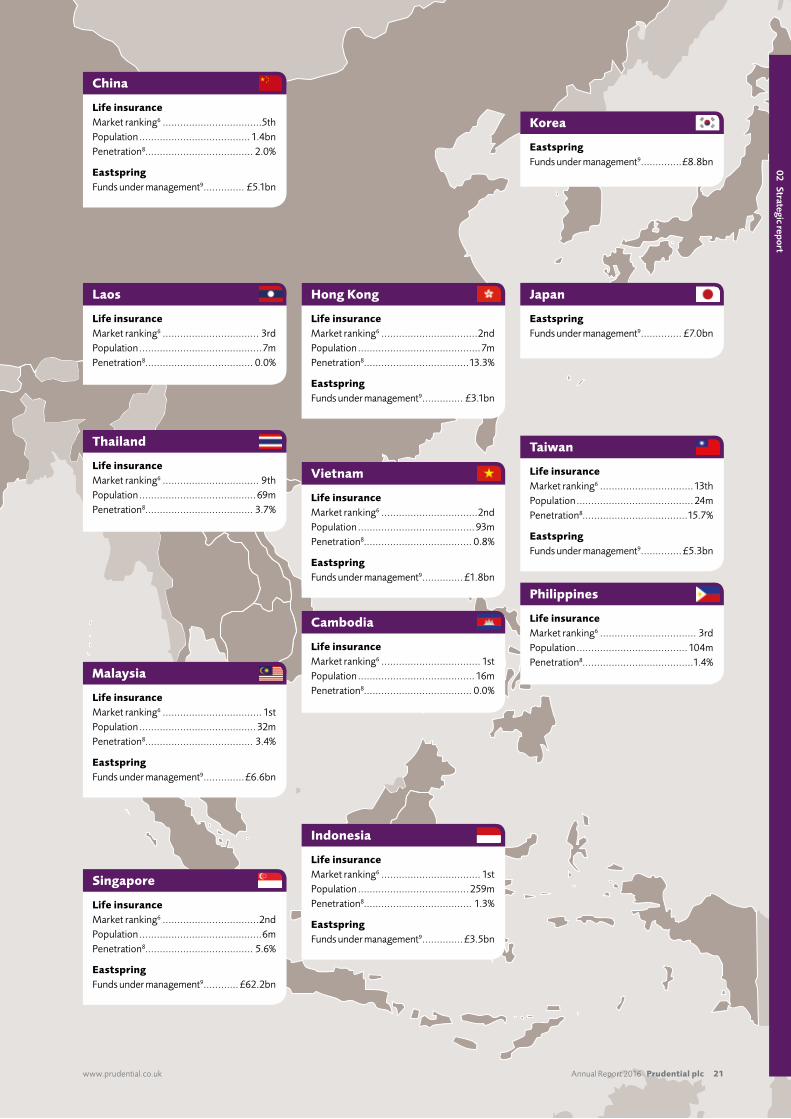
Life insuranceMarket—ranking6—.................................. 1stPopulation—...................................... 1.3bnPenetration8..................................... 2.7%
EastspringFunds—under—management9—............ £13.3bn
India
Diversification—(%)
IFRS operating profit by region, full year 2016, %
1
2
34
5
6
7
89
11
10
£1,644m+15%
Growth rate vs 2015 constant exchange rates
1— Indonesia—— 26%— ➜6%
2— Singapore—— 14%— ➜3%
3— Hong—Kong—— 14%— ➜40%
4— Malaysia—— 9%— ➜15%
5— Vietnam—— 7%— ➜21%
6— Thailand—— 6%— ➜21%
7— China—— 4%— ➜83%
8— Philippines—— 2%— ➜9%
9— Taiwan—— 2%— ➜25%—
10—Others—— 7%— ➜8%—
11—Eastspring—— 9%— ➜10%
www.prudential.co.uk� Annual�Report�2016 Prudential plc 21
02Strategicreport
Life insuranceMarket—ranking6—..................................5thPopulation—...................................... 1.4bnPenetration8..................................... 2.0%
EastspringFunds—under—management9—.............. £5.1bn
China
Life insuranceMarket—ranking6—.................................2ndPopulation—........................................ 93mPenetration8..................................... 0.8%
EastspringFunds—under—management9—.............. £1.8bn
Vietnam
Life insuranceMarket—ranking6—.................................2ndPopulation—..........................................7mPenetration8....................................13.3%
EastspringFunds—under—management9—.............. £3.1bn
Hong Kong
Life insuranceMarket—ranking6—................................13thPopulation—........................................ 24mPenetration8....................................15.7%
EastspringFunds—under—management9—.............. £5.3bn
Taiwan
Life insuranceMarket—ranking6—.................................. 1stPopulation—........................................ 16mPenetration8..................................... 0.0%
Cambodia Life insuranceMarket—ranking6—................................. 3rdPopulation—...................................... 104mPenetration8......................................1.4%
Philippines
Life insuranceMarket—ranking6—................................. 9thPopulation—........................................69mPenetration8..................................... 3.7%
Thailand
Life insuranceMarket—ranking6—................................. 3rdPopulation—..........................................7mPenetration8..................................... 0.0%
Laos
Life insuranceMarket—ranking6—.................................. 1stPopulation—........................................ 32mPenetration8..................................... 3.4%
EastspringFunds—under—management9—..............£6.6bn
Malaysia
Life insuranceMarket—ranking6—.................................2ndPopulation—..........................................6mPenetration8..................................... 5.6%
EastspringFunds—under—management9—............ £62.2bn
Singapore
Life insuranceMarket—ranking6—.................................. 1stPopulation—...................................... 259mPenetration8..................................... 1.3%
EastspringFunds—under—management9—.............. £3.5bn
Indonesia
EastspringFunds—under—management9—..............£8.8bn
Korea
EastspringFunds—under—management9—.............. £7.0bn
Japan
Prudential plc Annual Report 2016 www.prudential.co.uk22
Our businesses and their performanceContinued
In—Singapore,—by—contrast,—we—have—more—sophisticated—financial—planners—providing—advice—to—customers—on—a—more—complex—variety—of—protection,—savings—and—investment—options,—either—directly—or—via—our—bank—partners.
One—of—Prudential’s—core—strengths—is—the—diversity—of—our—portfolio—–—by—geography,—by—distribution—channel—and—by—product—–—and—the—flexibility—this—gives—us—in—responding—to—particular—opportunities—and—managing—our—participation—in—areas—where—markets—have—become—more—challenging.—Consequently,—while—the—headline—
performance—of—Prudential—Corporation—Asia—remains—relatively—stable—and—predictable—over—time—–—we—are—on—track—to—deliver—the—five-year—performance—objectives—announced—in—2013—–—the—individual—components—are—likely—to—flex—period—by—period.—For—example,—we—have—recently—seen—strong—demand—from—customers—in—mainland—China—for—our—participating—and—critical—illness—products—in—Hong—Kong,—while—in—Indonesia—the—emerging—middle—class—is—under—pressure—from—systemic—challenges—in—the—economy—and—so—demand—for—our—regular-premium,—protection-orientated—life—insurance—has—
been—temporarily—depressed—in—that—market.—We—always—seek—the—appropriate—balance—between—value—and—volume.
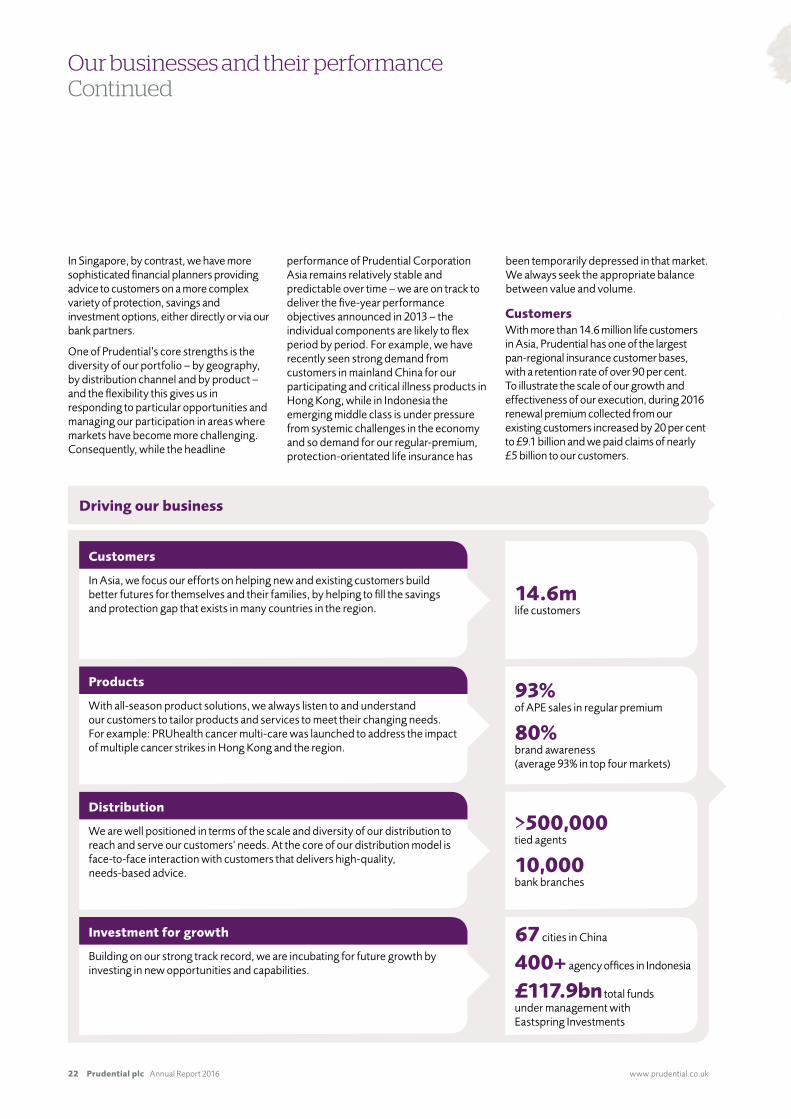
CustomersWith—more—than—14.6—million—life—customers—in—Asia,—Prudential—has—one—of—the—largest—pan-regional—insurance—customer—bases,—with—a—retention—rate—of—over—90—per—cent.—To—illustrate—the—scale—of—our—growth—and—effectiveness—of—our—execution,—during—2016—renewal—premium—collected—from—our—existing—customers—increased—by—20—per—cent—to—£9.1—billion—and—we—paid—claims—of—nearly—£5—billion—to—our—customers.
Driving our business
Customers
In—Asia,—we—focus—our—efforts—on—helping—new—and—existing—customers—build—better—futures—for—themselves—and—their—families,—by—helping—to—fill—the—savings—and—protection—gap—that—exists—in—many—countries—in—the—region.
Products
With—all-season—product—solutions,—we—always—listen—to—and—understand—our—customers—to—tailor—products—and—services—to—meet—their—changing—needs.—For—example:—PRUhealth—cancer—multi-care—was—launched—to—address—the—impact—of—multiple—cancer—strikes—in—Hong—Kong—and—the—region.
Distribution
We—are—well—positioned—in—terms—of—the—scale—and—diversity—of—our—distribution—to—reach—and—serve—our—customers’—needs.—At—the—core—of—our—distribution—model—is—face-to-face—interaction—with—customers—that—delivers—high-quality,—needs-based—advice.
Investment for growth
Building—on—our—strong—track—record,—we—are—incubating—for—future—growth—by—investing—in—new—opportunities—and—capabilities.
14.6mlife—customers
93%of—APE—sales—in—regular—premium
80%brand—awareness(average—93%—in—top—four—markets)
>500,000tied—agents
10,000bank—branches
67—cities—in—China
400+—agency—offices—in—Indonesia
£117.9bn—total—funds—under—management—with—Eastspring—Investments
Yona’s story Prudential Indonesia‘I realised how crucial it is to be insured when I was diagnosed with a cerebral abscess last year. I needed to have surgery and spent one-and-a-half months in intensive care at the hospital, so I’m thankful that I was covered by my Prudential hospitalisation rider. Today, I’m grateful to have my health back again and feel blessed that I’ll soon be able to welcome into the world my own little bundle of joy.’
www.prudential.co.uk� Annual�Report�2016 Prudential plc 23
02Strategicreport
Tony WilkeyChief Executive Prudential Corporation Asia
ProductsOur life product suite has three main categories: participating, linked and protection.
Although the protection component remains relatively consistent in the mix, reflecting our focus on this core customer need, the products within this category continue to evolve. For example, in Hong Kong we recently added a new feature that covers customers in the event of multiple diagnoses of cancer.
For the savings component of our insurance policies, we have seen softer demand for unit-linked products, given the recent volatility in capital markets, and correspondingly increased demand for participating products and their smoothed returns. The markets do have strong demand for products with high levels of guaranteed return but, although these can generate significant APE sales volumes, we only participate in this sector in a very controlled way. We maintain our balance sheet discipline and are unconcerned by any temporary erosion in market share.
DistributionPrudential Corporation Asia is well positioned in terms of our scale and diversity of distribution. Each market is unique and our overarching regional distribution strategy reflects our comprehensive approach to building pan-regional distribution capabilities, underpinned by effective platforms, comprehensive product solutions and the highest level of customer experience.
The scale, reach and quality of our life insurance distribution are evidenced by our productivity, persistency and customer satisfaction across the region. At the core of our distribution model is face-to-face interaction with customers, which delivers high-quality, needs-based advice. Supporting this approach is our continuous investment in enhancing customer experiences, such as the PRUcustomer friend customer servicing model in Indonesia and the PRU for you online community in Hong Kong.
Tied agency remains the most popular distribution channel in the region. For Prudential Corporation Asia, this produced
65 per cent of APE sales in 2016. At 31 December we had more than 500,000 agents, up 10 per cent on the previous year. Excluding India, the productivity of our active agents increased by 31 per cent.
Bancassurance is our other main distribution channel, generating 25 per cent of APE sales for Prudential Corporation Asia in 2016. Prudential Corporation Asia works with a number of partner banks, including international groups such as Standard Chartered Bank, regionals such as UOB, domestic banks such as Thailand’s Thanachart Bank and the retail banks of our partners CITIC in China and ICICI in India.
Eastspring InvestmentsOur regional asset management division, Eastspring Investments, is one of the region’s largest asset managers7, with a presence in 10 major Asian markets as well as distribution offices in the US and Europe. It has £117.9 billion in assets under management, managing funds across a range of asset classes, including equities and fixed income, distributed through bank partners, brokers and online platforms.
Eastspring has a stable and steadily growing core of funds under management from Prudential Corporation Asia’s life businesses, including the majority of its unit-linked funds. Its Asian focus and performance track record have also enabled it to secure sizeable institutional mandates, both in Asia and more broadly. The retail arm includes the attractive Japanese, Korean and Taiwanese markets. In Japan, our Asia Oceania High Dividend Equity Fund, with funds under management of £3.2 billion, is one of the largest in its sector.
Investing for growthPrudential’s platform is well established and we continue to invest in growing the business through expansion into new markets such as Laos and opening up in new cities in existing markets such as China, Indonesia and the Philippines. We are also investing in expanding our agency network in the region and we are enhancing our operating capabilities, particularly leveraging new technologies.
At Eastspring we are investing in the brand, in the operating model and in talent development, in order to ensure that we expand our regional capabilities to capture the opportunities available from the growth of the retail mutual funds markets in Asia.
Notes1 Insurance penetration source Swiss Re Sigma 2015.
Insurance penetration calculated as premiums in per cent of GDP. Asia penetration calculated on a weighted population basis.
2 World Health Organisation – Global Health Observatory data repository (2013). Out of pocket as a percentage of Total Health Expenditure Asia calculated as average out of pocket.
3 United Nations, Department of Economic and Social Affairs. Population Division (2015) World Population Prospects The 2015 Revision, DVD Edition 15.
4 Working age population 15-64 years.5 Source: BCG Global Wealth 2015 Winning the growth game.6 Based on FY16 or the latest information available. Source
includes formal (eg Competitors results release, local
regulators and insurance association) and informal (industry exchange) market share data. Ranking based on new business (APE sales on weighted full-year premium depending on availability of data). The ranking for China is among foreign players and India is among private life insurers.
7 Source: Asia asset management September 2016 (ranked according to participating regional players only). Based on assets sourced from the region, excluding Japan, Australia and New Zealand as at June 2016.
8 Based on latest market data available. Laos penetration is based on Swiss Re 2016 Sigma Report – Insuring the Frontier Markets.
9 FUM reported based on the country where the funds are managed.
10 Excluding India.
Understanding our markets
Prudential plc Annual Report 2016 www.prudential.co.uk24
Our businesses and their performance
2016 performance highlights—— Cash—remittance—of—£420—million
—— Total—IFRS—operating—profits—of—£2—billion—–—up—7—per—cent—(20—per—cent—on—an—actual—exchange—rate—basis)
—— Variable—annuity—total—net—flows—of—£4.9—billion
—— Strong—separate—account—asset—growth—–—up—11—per—cent—at—US$148.8—billion—(£120.4—billion)
—— Awarded—‘Contact—Center—World—Class—FCR—Certification’—and—‘Highest—Customer—Service—for—the—Financial—Industry’—awards—by—The—Service—Quality—Measurement—Group,—Inc.—–—the—10th—consecutive—year—of—recognition—for—customer—service—performance—in—both—categories
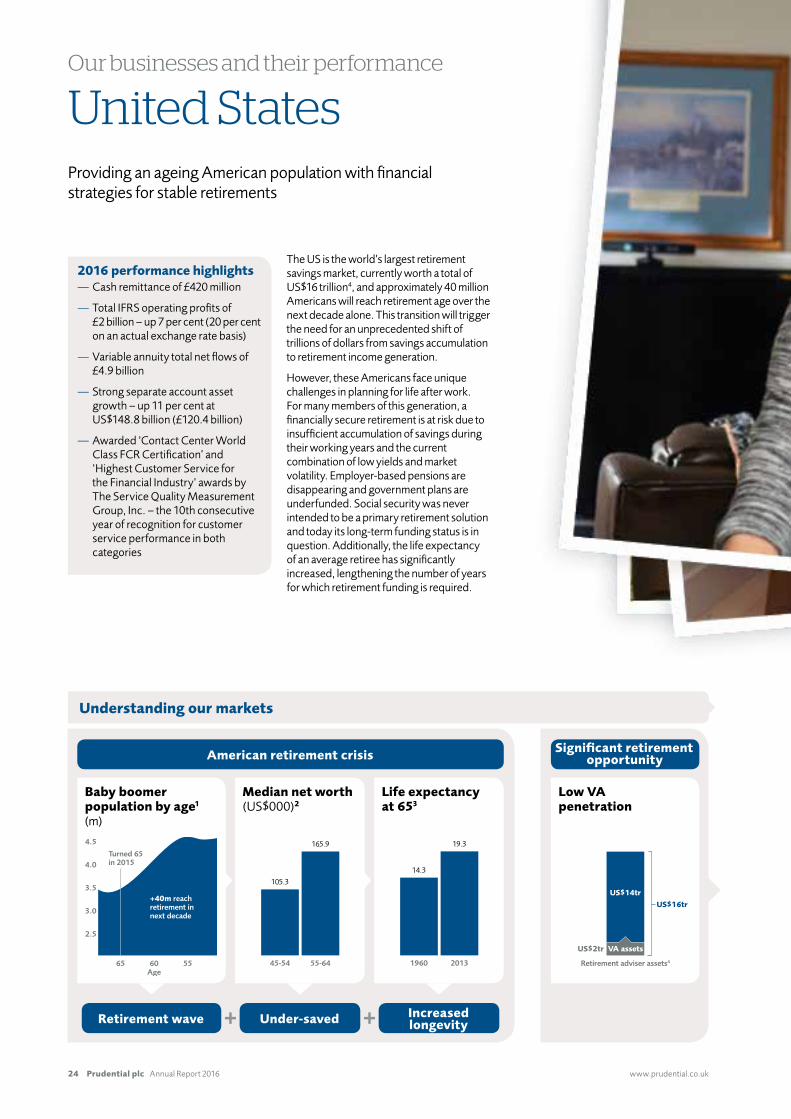
The—US—is—the—world’s—largest—retirement—savings—market,—currently—worth—a—total—of—US$16—trillion4,—and—approximately—40—million—Americans—will—reach—retirement—age—over—the—next—decade—alone.—This—transition—will—trigger—the—need—for—an—unprecedented—shift—of—trillions—of—dollars—from—savings—accumulation—to—retirement—income—generation.
However,—these—Americans—face—unique—challenges—in—planning—for—life—after—work.——For—many—members—of—this—generation,—a—financially—secure—retirement—is—at—risk—due—to—insufficient—accumulation—of—savings—during—their—working—years—and—the—current—combination—of—low—yields—and—market—volatility.—Employer-based—pensions—are—disappearing—and—government—plans—are—underfunded.—Social—security—was—never—intended—to—be—a—primary—retirement—solution—and—today—its—long-term—funding—status—is—in—question.—Additionally,—the—life—expectancy—of—an—average—retiree—has—significantly—increased,—lengthening—the—number—of—years—for—which—retirement—funding—is—required.—
United States Providing—an—ageing—American—population—with—financial—strategies—for—stable—retirements—
Turned 65 in 2015
3.5
3.0
2.5
4.0
4.5
65 60Age
55
+40m reach retirement innext decade
105.3
45-54
165.9
55-64
14.3
1960
19.3
2013 Retirement adviser assets4
US$14tr
US$16tr
VA assetsUS$2tr
Low VA penetration
Life expectancy at 653
Baby boomer population by age1
(m)
Median net worth (US$000)2
American retirement crisis Significant retirement opportunity
Retirement wave Under-saved Increased longevity

Doris and Doug’s story
JacksonIn—the—next—few—years,—Doris—and—Doug,—Jackson—annuity—holders—in—their—mid-sixties,—
will—be—phasing—into—semi-retirement—near—Olympia,—Washington.—Both—are—lifelong—
educators—–—Doris—a—teacher—and—college—instructor,—and—Doug—the—director—of—a—
non-profit—organisation.
‘We’re—not—looking—for—a—beach—and—we—don’t—plan—to—sit—under—an—umbrella—all—day.—
Doris—and—I—want—to—work—together,—write—together—and—continue—our—life’s—purpose—
–—helping—people—grow—and—identify—their—gifts,—whether—in—a—classroom,—congregation—
or—weekend—retreat.—
‘Our—retirement—dream—really—became—a—plan—when—we—partnered—with—our—financial—
professional.—As—a—financial—life—coach,—he—connected—with—our—vision,—enabling—us—to—maximise—
our—savings—and—investment—resources.—With—the—guarantees—offered—in—our—Jackson—annuity—
product,—we—feel—more—secure,—and—ready—to—focus—on—people,—rather—than—fight—for—financial—
survival.’—11
www.prudential.co.uk� Annual�Report�2016 Prudential plc 25
02Strategicreport
To—overcome—these—challenges,—Americans—need—retirement—strategies—that—offer—them—the—opportunity—to—grow—and—protect—the—value—of—their—existing—assets,—as—well—as—the—ability—to—provide—guaranteed—income—that—will—last—throughout—their—extended—lifetimes.—Annuities—can—do—just—that.
Through—its—distribution—partners,—Jackson—provides—products,—including—variable,—fixed—and—fixed—index—annuities,—which—offer—Americans—the—strategies—they—need.—A—variable—annuity—with—investment—freedom—represents—an—attractive—option—for—retirees,—providing—both—access—to—equity—market—appreciation—in—a—tax-deferred—wrapper—and—guaranteed—lifetime—income.—However,—penetration—of—variable—annuity—sales—into—the—retirement—market—remains—low,—accounting—for—less—than—15—per—cent—of—total—US—retirement—assets.
Jackson continues its long-term disciplined approach to our business, with a sharp focus on delivering products and services that meet the needs of our stakeholders. This discipline has historically enabled us to navigate market disruption, producing positive outcomes amid adversity. The looming retirement crisis for an under-saved generation of retirees, combined with significant regulatory change and political uncertainty, presents an opportunity to redefine the retirement marketplace. Jackson is well positioned to articulate the issues and provide leadership in addressing them, with a focus on creating value for consumers and shareholders.
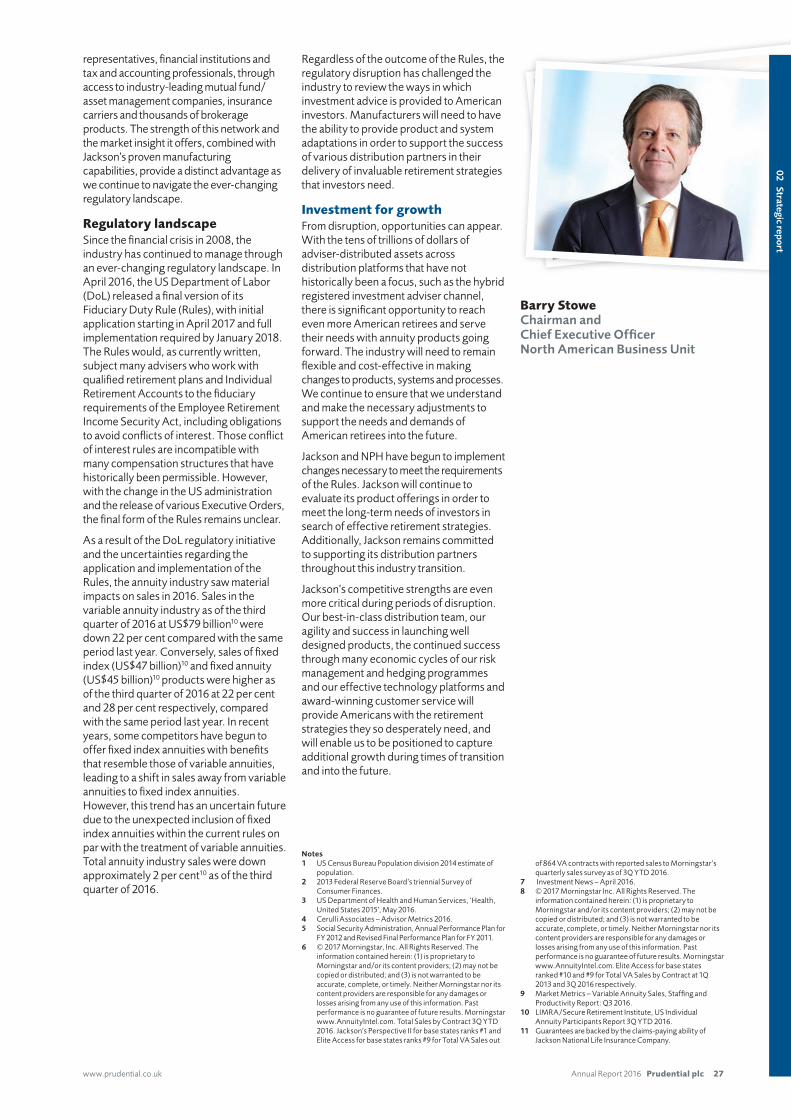
Barry Stowe Chairman and Chief Executive Officer, North American Business Unit
Prudential plc Annual Report 2016 www.prudential.co.uk26
Our businesses and their performanceContinued
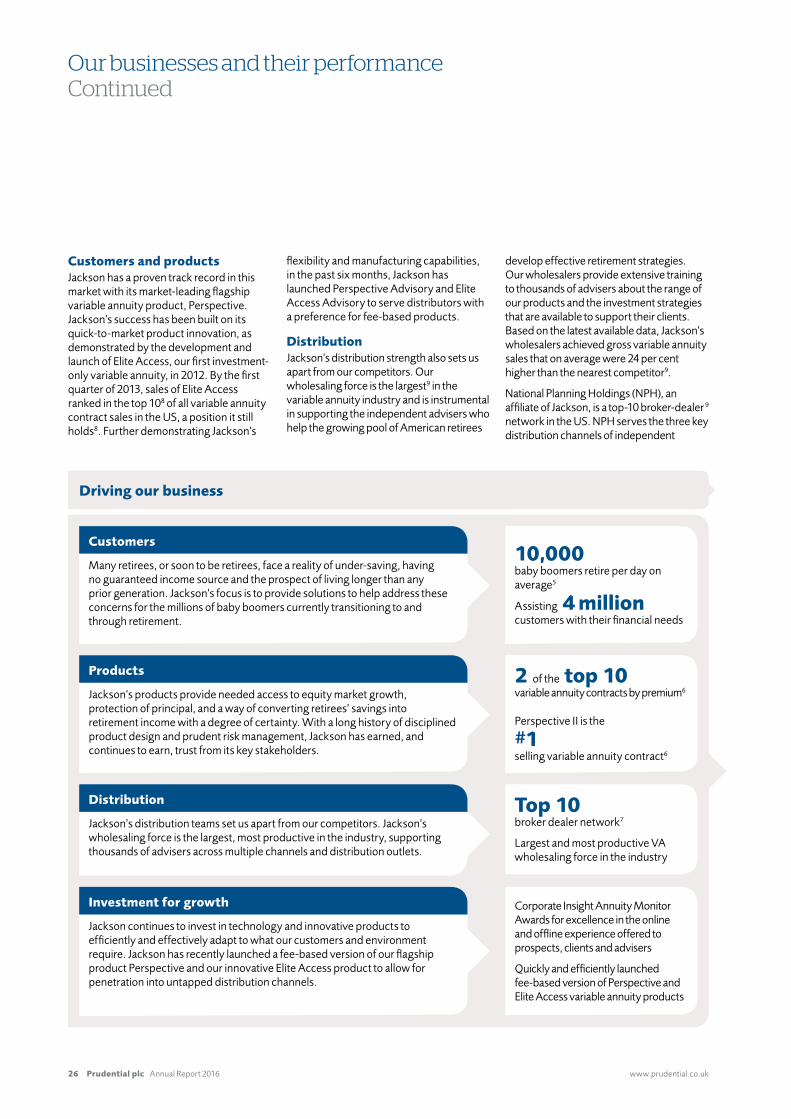
Customers and products Jackson—has—a—proven—track—record—in—this—market—with—its—market-leading—flagship—variable—annuity—product,—Perspective.—Jackson’s—success—has—been—built—on—its—quick-to-market—product—innovation,—as—demonstrated—by—the—development—and—launch—of—Elite—Access,—our—first—investment-only—variable—annuity,—in—2012.—By—the—first—quarter—of—2013,—sales—of—Elite—Access—ranked—in—the—top—108—of—all—variable—annuity—contract—sales—in—the—US,—a—position—it—still—holds8.—Further—demonstrating—Jackson’s—
flexibility—and—manufacturing—capabilities,—in—the—past—six—months,—Jackson—has—launched—Perspective—Advisory—and—Elite—Access—Advisory—to—serve—distributors—with—a—preference—for—fee-based—products.—
Distribution Jackson’s—distribution—strength—also—sets—us—apart—from—our—competitors.—Our—wholesaling—force—is—the—largest9—in—the—variable—annuity—industry—and—is—instrumental—in—supporting—the—independent—advisers—who—help—the—growing—pool—of—American—retirees—
develop—effective—retirement—strategies.—Our—wholesalers—provide—extensive—training—to—thousands—of—advisers—about—the—range—of—our—products—and—the—investment—strategies—that—are—available—to—support—their—clients.—Based—on—the—latest—available—data,—Jackson’s—wholesalers—achieved—gross—variable—annuity—sales—that—on—average—were—24—per—cent—higher—than—the—nearest—competitor9.—
National—Planning—Holdings—(NPH),—an—affiliate—of—Jackson,—is—a—top-10—broker-dealer 9—network—in—the—US.—NPH—serves—the—three—key—distribution—channels—of—independent—
Driving our business
Customers
Many—retirees,—or—soon—to—be—retirees,—face—a—reality—of—under-saving,—having—no—guaranteed—income—source—and—the—prospect—of—living—longer—than—any—prior—generation.—Jackson’s—focus—is—to—provide—solutions—to—help—address—these—concerns—for—the—millions—of—baby—boomers—currently—transitioning—to—and—through—retirement.
Products
Jackson’s—products—provide—needed—access—to—equity—market—growth,—protection—of—principal,—and—a—way—of—converting—retirees’—savings—into—retirement—income—with—a—degree—of—certainty.—With—a—long—history—of—disciplined—product—design—and—prudent—risk—management,—Jackson—has—earned,—and—continues—to—earn,—trust—from—its—key—stakeholders.
Distribution
Jackson’s—distribution—teams—set—us—apart—from—our—competitors.—Jackson’s—wholesaling—force—is—the—largest,—most—productive—in—the—industry,—supporting—thousands—of—advisers—across—multiple—channels—and—distribution—outlets.
Investment for growth
Jackson—continues—to—invest—in—technology—and—innovative—products—to—efficiently—and—effectively—adapt—to—what—our—customers—and—environment—require.—Jackson—has—recently—launched—a—fee-based—version—of—our—flagship—product—Perspective—and—our—innovative—Elite—Access—product—to—allow—for—penetration—into—untapped—distribution—channels.
10,000baby—boomers—retire—per—day—on—average5
Assisting 4 millioncustomers—with—their—financial—needs
2 of—the top 10variable—annuity—contracts—by—premium6
Perspective—II—is—the #1selling—variable—annuity—contract6
Top 10broker—dealer—network7
Largest—and—most—productive—VA—wholesaling—force—in—the—industry
Corporate—Insight—Annuity—Monitor—Awards—for—excellence—in—the—online—and—offline—experience—offered—to—prospects,—clients—and—advisers
Quickly—and—efficiently—launched—fee-based—version—of—Perspective—and—Elite—Access—variable—annuity—products
www.prudential.co.uk� Annual�Report�2016 Prudential plc 27
02Strategicreport
representatives, financial institutions and tax and accounting professionals, through access to industry-leading mutual fund/asset management companies, insurance carriers and thousands of brokerage products. The strength of this network and the market insight it offers, combined with Jackson’s proven manufacturing capabilities, provide a distinct advantage as we continue to navigate the ever-changing regulatory landscape.
Regulatory landscape Since the financial crisis in 2008, the industry has continued to manage through an ever-changing regulatory landscape. In April 2016, the US Department of Labor (DoL) released a final version of its Fiduciary Duty Rule (Rules), with initial application starting in April 2017 and full implementation required by January 2018. The Rules would, as currently written, subject many advisers who work with qualified retirement plans and Individual Retirement Accounts to the fiduciary requirements of the Employee Retirement Income Security Act, including obligations to avoid conflicts of interest. Those conflict of interest rules are incompatible with many compensation structures that have historically been permissible. However, with the change in the US administration and the release of various Executive Orders, the final form of the Rules remains unclear.
As a result of the DoL regulatory initiative and the uncertainties regarding the application and implementation of the Rules, the annuity industry saw material impacts on sales in 2016. Sales in the variable annuity industry as of the third quarter of 2016 at US$79 billion10 were down 22 per cent compared with the same period last year. Conversely, sales of fixed index (US$47 billion)10 and fixed annuity (US$45 billion)10 products were higher as of the third quarter of 2016 at 22 per cent and 28 per cent respectively, compared with the same period last year. In recent years, some competitors have begun to offer fixed index annuities with benefits that resemble those of variable annuities, leading to a shift in sales away from variable annuities to fixed index annuities. However, this trend has an uncertain future due to the unexpected inclusion of fixed index annuities within the current rules on par with the treatment of variable annuities. Total annuity industry sales were down approximately 2 per cent10 as of the third quarter of 2016.
Regardless of the outcome of the Rules, the regulatory disruption has challenged the industry to review the ways in which investment advice is provided to American investors. Manufacturers will need to have the ability to provide product and system adaptations in order to support the success of various distribution partners in their delivery of invaluable retirement strategies that investors need.
Investment for growth From disruption, opportunities can appear. With the tens of trillions of dollars of adviser-distributed assets across distribution platforms that have not historically been a focus, such as the hybrid registered investment adviser channel, there is significant opportunity to reach even more American retirees and serve their needs with annuity products going forward. The industry will need to remain flexible and cost-effective in making changes to products, systems and processes. We continue to ensure that we understand and make the necessary adjustments to support the needs and demands of American retirees into the future.
Jackson and NPH have begun to implement changes necessary to meet the requirements of the Rules. Jackson will continue to evaluate its product offerings in order to meet the long-term needs of investors in search of effective retirement strategies. Additionally, Jackson remains committed to supporting its distribution partners throughout this industry transition.
Jackson’s competitive strengths are even more critical during periods of disruption. Our best-in-class distribution team, our agility and success in launching well designed products, the continued success through many economic cycles of our risk management and hedging programmes and our effective technology platforms and award-winning customer service will provide Americans with the retirement strategies they so desperately need, and will enable us to be positioned to capture additional growth during times of transition and into the future.
Notes1 US Census Bureau Population division 2014 estimate of
population.2 2013 Federal Reserve Board’s triennial Survey of
Consumer Finances.3 US Department of Health and Human Services, ‘Health,
United States 2015’, May 2016.4 Cerulli Associates – Advisor Metrics 2016.5 Social Security Administration, Annual Performance Plan for
FY 2012 and Revised Final Performance Plan for FY 2011.6 © 2017 Morningstar, Inc. All Rights Reserved. The
information contained herein: (1) is proprietary to Morningstar and/or its content providers; (2) may not be copied or distributed; and (3) is not warranted to be accurate, complete, or timely. Neither Morningstar nor its content providers are responsible for any damages or losses arising from any use of this information. Past performance is no guarantee of future results. Morningstar www.AnnuityIntel.com. Total Sales by Contract 3Q YTD 2016. Jackson’s Perspective II for base states ranks #1 and Elite Access for base states ranks #9 for Total VA Sales out
of 864 VA contracts with reported sales to Morningstar’s quarterly sales survey as of 3Q YTD 2016.
7 Investment News – April 2016.8 © 2017 Morningstar Inc. All Rights Reserved. The
information contained herein: (1) is proprietary to Morningstar and/or its content providers; (2) may not be copied or distributed; and (3) is not warranted to be accurate, complete, or timely. Neither Morningstar nor its content providers are responsible for any damages or losses arising from any use of this information. Past performance is no guarantee of future results. Morningstar www.AnnuityIntel.com. Elite Access for base states ranked #10 and #9 for Total VA Sales by Contract at 1Q 2013 and 3Q 2016 respectively.
9 Market Metrics – Variable Annuity Sales, Staffing and Productivity Report: Q3 2016.
10 LIMRA/Secure Retirement Institute, US Individual Annuity Participants Report 3Q YTD 2016.
11 Guarantees are backed by the claims-paying ability of Jackson National Life Insurance Company.
Barry Stowe ChairmanandChiefExecutiveOfficerNorthAmericanBusinessUnit
Prudential plc Annual Report 2016 www.prudential.co.uk28
Our businesses and their performance
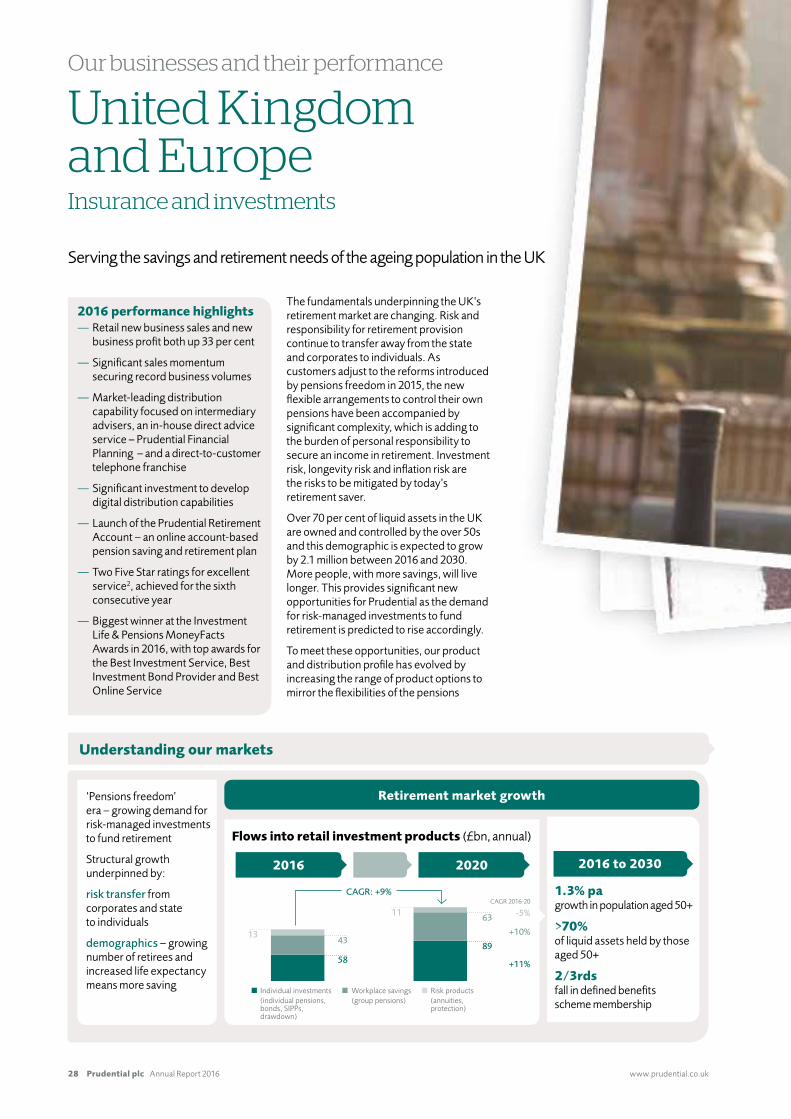
The fundamentals underpinning the UK’s retirement market are changing. Risk and responsibility for retirement provision continue to transfer away from the state and corporates to individuals. As customers adjust to the reforms introduced by pensions freedom in 2015, the new flexible arrangements to control their own pensions have been accompanied by significant complexity, which is adding to the burden of personal responsibility to secure an income in retirement. Investment risk, longevity risk and inflation risk are the risks to be mitigated by today’s retirement saver.
Over 70 per cent of liquid assets in the UK are owned and controlled by the over 50s and this demographic is expected to grow by 2.1 million between 2016 and 2030. More people, with more savings, will live longer. This provides significant new opportunities for Prudential as the demand for risk-managed investments to fund retirement is predicted to rise accordingly.
To meet these opportunities, our product and distribution profile has evolved by increasing the range of product options to mirror the flexibilities of the pensions
United Kingdom and Europe Insurance and investments
Serving the savings and retirement needs of the ageing population in the UK
2016 performance highlights — Retail new business sales and new business profit both up 33 per cent
— Significant sales momentum securing record business volumes
— Market-leading distribution capability focused on intermediary advisers, an in-house direct advice service − Prudential Financial Planning − and a direct-to-customer telephone franchise
— Significant investment to develop digital distribution capabilities
— Launch of the Prudential Retirement Account – an online account-based pension saving and retirement plan
— Two Five Star ratings for excellent service2, achieved for the sixth consecutive year
— Biggest winner at the Investment Life & Pensions MoneyFacts Awards in 2016, with top awards for the Best Investment Service, Best Investment Bond Provider and Best Online Service
‘Pensions freedom’ era – growing demand for risk-managed investments to fund retirement
Structural growth underpinned by:
risk transfer from corporates and state to individuals
demographics – growing number of retirees and increased life expectancy means more saving
Flows into retail investment products (£bn, annual)
2016 2020
89
6311
58
13
CAGR: +9%
Individual investments(individual pensions, bonds, SIPPs, drawdown)
Workplace savings(group pensions)
Risk products(annuities, protection)
+11%
+10%
-5%CAGR 2016-20
Retirement market growth
43
Understanding our markets
2016 to 2030
1.3% pagrowth in population aged 50+
>70%of liquid assets held by those aged 50+
2/3rdsfall in defined benefits scheme membership
www.prudential.co.uk� Annual�Report�2016 Prudential plc 29
02Strategicreport
freedom era. There has been a shift away from a reliance on capital-intensive annuity business to a focus on bond, ISA, pension and income drawdown products across a range of tax-efficient solutions.
Customers and productsThe Prudential brand benefits from a heritage that stretches back 168 years and a franchise that is based on long-term thinking, longevity experience, market-leading multi-asset investment capability and financial strength – the core attributes that customers continue to seek in the pension freedoms era.
Customer expectations are higher than ever. Increased life expectancy in retirement has put increased demands on long-term product performance, and technology is revolutionising the ways in
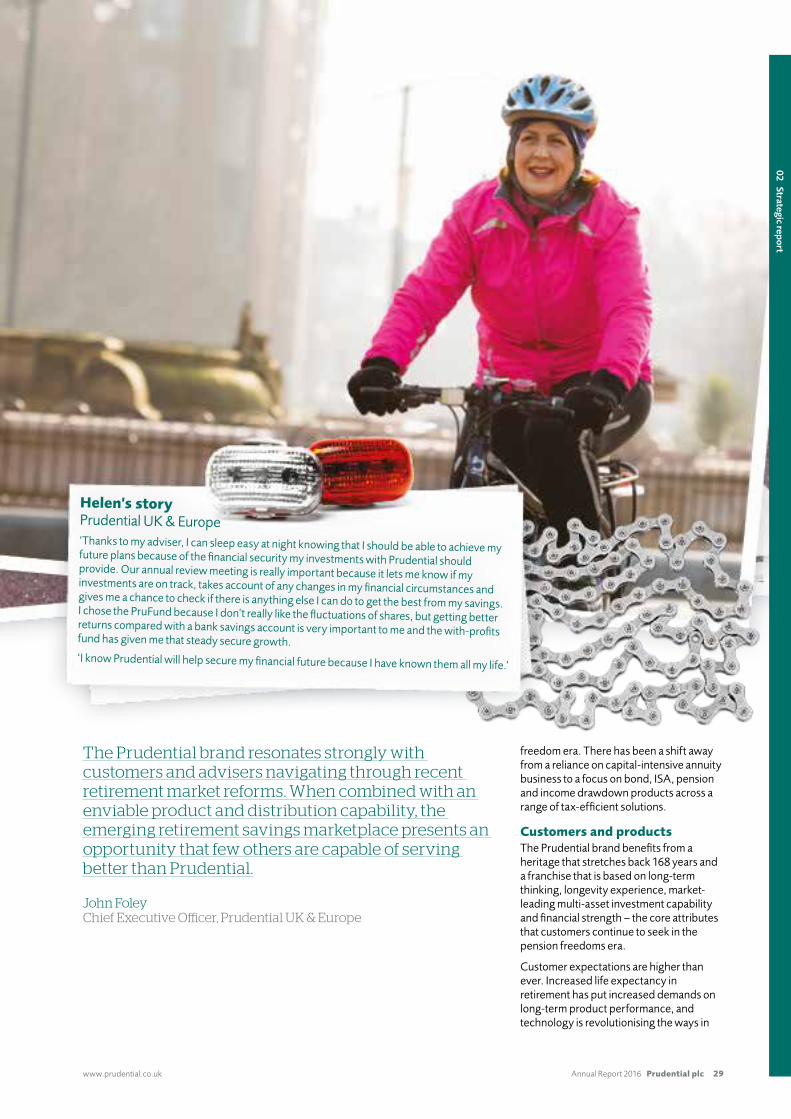
The Prudential brand resonates strongly with customers and advisers navigating through recent retirement market reforms. When combined with an enviable product and distribution capability, the emerging retirement savings marketplace presents an opportunity that few others are capable of serving better than Prudential.
John Foley Chief Executive Officer, Prudential UK & Europe
Helen’s storyPrudential UK & Europe‘Thanks to my adviser, I can sleep easy at night knowing that I should be able to achieve my future plans because of the financial security my investments with Prudential should provide. Our annual review meeting is really important because it lets me know if my investments are on track, takes account of any changes in my financial circumstances and gives me a chance to check if there is anything else I can do to get the best from my savings. I chose the PruFund because I don’t really like the fluctuations of shares, but getting better returns compared with a bank savings account is very important to me and the with-profits fund has given me that steady secure growth.‘I know Prudential will help secure my financial future because I have known them all my life.’
Prudential plc Annual Report 2016 www.prudential.co.uk30
Our businesses and their performanceContinued
which company and customer interact. In this changing environment, our brand franchise is strong, resonating with retirement savers.
We continue to focus on meeting these customers’ needs through:
— Extending our product range and servicing capability to help customers take full advantage of the flexibility introduced to the retirement saving marketplace through pension freedoms;
— Extending availability of our investment and retirement solutions by maintaining strong relationships with financial adviser intermediaries, accelerating the growth of our Prudential Financial Planning advisory business and through investing in our direct-to-consumer channels, including telephone and online services;
— Enhancing access to our market-leading PruFund proposition across a range of investment and tax wrappers; and
— Continually investing in customer service improvement, acknowledged by two Five Star ratings received for the sixth consecutive year in the Life & Pensions and Investment categories of the Financial Adviser Service Awards.
Most notably in 2016, we responded to changes in the market following the introduction of pension freedoms by launching the Prudential Retirement Account – an online account-based plan
Driving our business
Customers
Strong brand franchise with clear focus on providing retirement saving and income solutions that meet customers’ needs in the pensions freedom era.
Products
Product range enhanced, including extended access to our market-leading range of PruFund investments.
Distribution
Multi-channel distribution model based on strong relationships with intermediaries and customers. 11 per cent (CAGR) increase in advisers recommending Prudential since 2013. Prudential Financial Planning is now advising over 50,000 customers.
Investment for growth
Significant investment in product, service and technology to maintain the growth momentum created by recent structural changes in the retirement market.
168 years of providing financial security
Long track record of managing longevity
74 of 99public sector authorities’ schemes
75%PruFund growth since 2006
5*ratings for excellent service
2,700+adviser firms dealing with Prudential UK
c300Prudential Financial Planning partners
20%increase in 2016 sales generated through Prudential Financial Planning
www.prudential.co.uk� Annual�Report�2016 Prudential plc 31
02Strategicreport
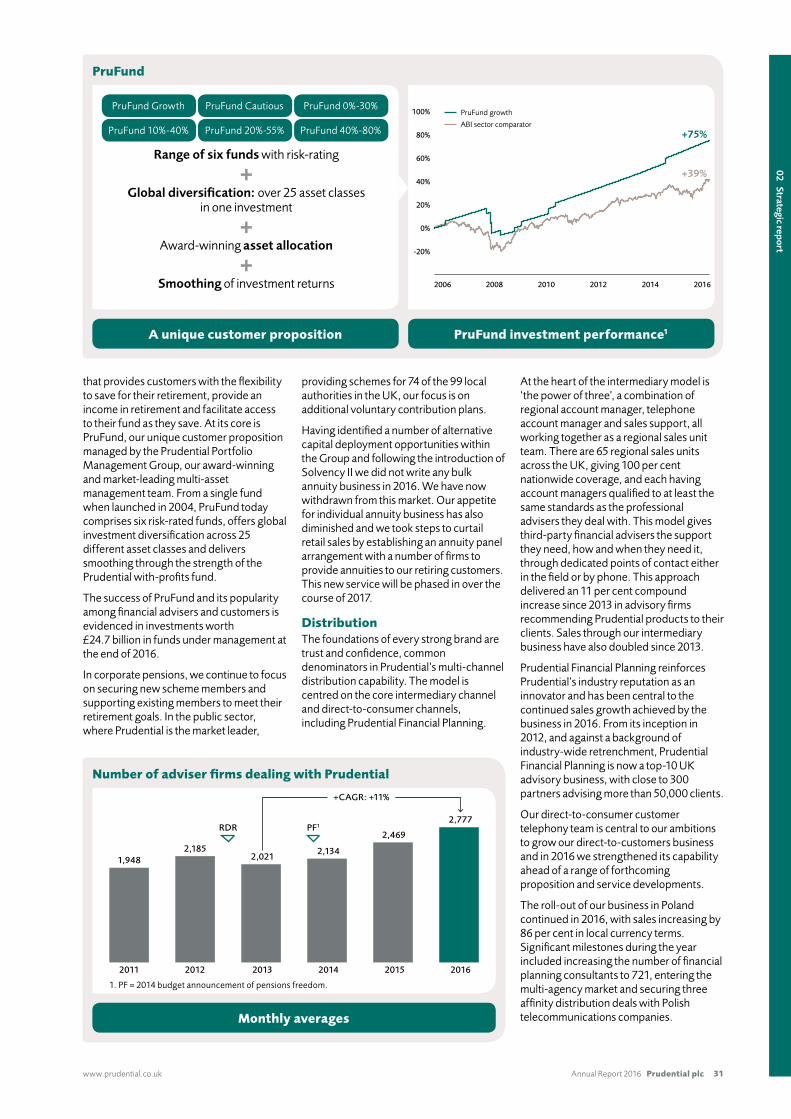
that provides customers with the flexibility to save for their retirement, provide an income in retirement and facilitate access to their fund as they save. At its core is PruFund, our unique customer proposition managed by the Prudential Portfolio Management Group, our award-winning and market-leading multi-asset management team. From a single fund when launched in 2004, PruFund today comprises six risk-rated funds, offers global investment diversification across 25 different asset classes and delivers smoothing through the strength of the Prudential with-profits fund.
The success of PruFund and its popularity among financial advisers and customers is evidenced in investments worth £24.7 billion in funds under management at the end of 2016.
In corporate pensions, we continue to focus on securing new scheme members and supporting existing members to meet their retirement goals. In the public sector, where Prudential is the market leader,
providing schemes for 74 of the 99 local authorities in the UK, our focus is on additional voluntary contribution plans.
Having identified a number of alternative capital deployment opportunities within the Group and following the introduction of Solvency II we did not write any bulk annuity business in 2016. We have now withdrawn from this market. Our appetite for individual annuity business has also diminished and we took steps to curtail retail sales by establishing an annuity panel arrangement with a number of firms to provide annuities to our retiring customers. This new service will be phased in over the course of 2017.
DistributionThe foundations of every strong brand are trust and confidence, common denominators in Prudential’s multi-channel distribution capability. The model is centred on the core intermediary channel and direct-to-consumer channels, including Prudential Financial Planning.
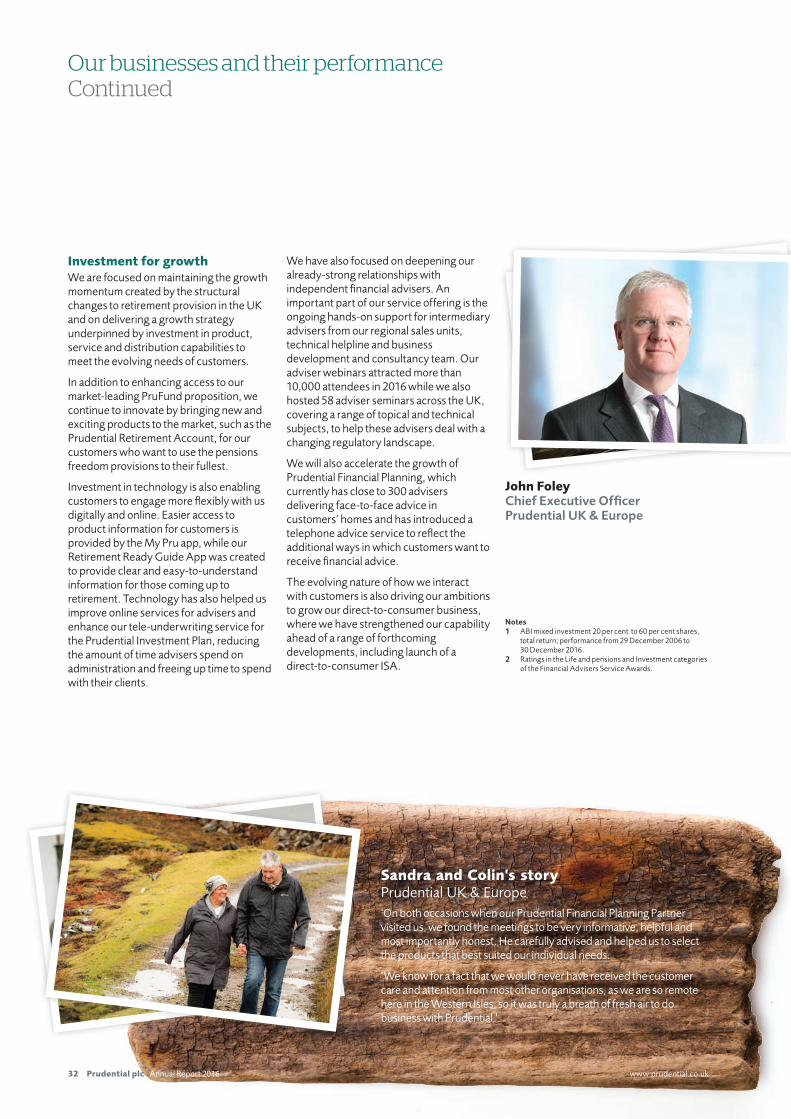
At the heart of the intermediary model is ‘the power of three’, a combination of regional account manager, telephone account manager and sales support, all working together as a regional sales unit team. There are 65 regional sales units across the UK, giving 100 per cent nationwide coverage, and each having account managers qualified to at least the same standards as the professional advisers they deal with. This model gives third-party financial advisers the support they need, how and when they need it, through dedicated points of contact either in the field or by phone. This approach delivered an 11 per cent compound increase since 2013 in advisory firms recommending Prudential products to their clients. Sales through our intermediary business have also doubled since 2013.
Prudential Financial Planning reinforces Prudential’s industry reputation as an innovator and has been central to the continued sales growth achieved by the business in 2016. From its inception in 2012, and against a background of industry-wide retrenchment, Prudential Financial Planning is now a top-10 UK advisory business, with close to 300 partners advising more than 50,000 clients.
Our direct-to-consumer customer telephony team is central to our ambitions to grow our direct-to-customers business and in 2016 we strengthened its capability ahead of a range of forthcoming proposition and service developments.
The roll-out of our business in Poland continued in 2016, with sales increasing by 86 per cent in local currency terms. Significant milestones during the year included increasing the number of financial planning consultants to 721, entering the multi-agency market and securing three affinity distribution deals with Polish telecommunications companies.
PruFund
2006 2008 2010 2012 2014 2016
PruFund growth
+75%
+39%
ABI sector comparator
-20%
0%
20%
40%
60%
80%
100%
Range of six funds with risk-rating
Global diversification: over 25 asset classes in one investment
Award-winning asset allocation
Smoothing of investment returns
A unique customer proposition PruFund investment performance1
PruFund Growth
PruFund 10%-40%
PruFund Cautious
PruFund 20%-55%
PruFund 0%-30%
PruFund 40%-80%
Number of adviser firms dealing with Prudential
Monthly averages
2,777
2,0212,134
2,469
2,185
RDR PF1
1,948
1. PF = 2014 budget announcement of pensions freedom.
2011 2012 2013 2014 2015 2016
+CAGR: +11%
32 Prudential plc Annual Report 2016 www.prudential.co.uk
Our businesses and their performanceContinued
Investment for growthWe are focused on maintaining the growth momentum created by the structural changes to retirement provision in the UK and on delivering a growth strategy underpinned by investment in product, service and distribution capabilities to meet the evolving needs of customers.
In addition to enhancing access to our market-leading PruFund proposition, we continue to innovate by bringing new and exciting products to the market, such as the Prudential Retirement Account, for our customers who want to use the pensions freedom provisions to their fullest.
Investment in technology is also enabling customers to engage more flexibly with us digitally and online. Easier access to product information for customers is provided by the My Pru app, while our Retirement Ready Guide App was created to provide clear and easy-to-understand information for those coming up to retirement. Technology has also helped us improve online services for advisers and enhance our tele-underwriting service for the Prudential Investment Plan, reducing the amount of time advisers spend on administration and freeing up time to spend with their clients.
We have also focused on deepening our already-strong relationships with independent financial advisers. An important part of our service offering is the ongoing hands-on support for intermediary advisers from our regional sales units, technical helpline and business development and consultancy team. Our adviser webinars attracted more than 10,000 attendees in 2016 while we also hosted 58 adviser seminars across the UK, covering a range of topical and technical subjects, to help these advisers deal with a changing regulatory landscape.
We will also accelerate the growth of Prudential Financial Planning, which currently has close to 300 advisers delivering face-to-face advice in customers’ homes and has introduced a telephone advice service to reflect the additional ways in which customers want to receive financial advice.
The evolving nature of how we interact with customers is also driving our ambitions to grow our direct-to-consumer business, where we have strengthened our capability ahead of a range of forthcoming developments, including launch of a direct-to-consumer ISA.
John Foley Chief Executive OfficerPrudential UK & Europe
Notes1 ABI mixed investment 20 per cent to 60 per cent shares,
total return; performance from 29 December 2006 to 30 December 2016.
2 Ratings in the Life and pensions and Investment categories of the Financial Advisers Service Awards.
Sandra and Colin’s story
Prudential UK & Europe‘On both occasions when our Prudential Financial Planning Partner visited us, we found the meetings to be very informative, helpful and most importantly honest. He carefully advised and helped us to select the products that best suited our individual needs.
‘We know for a fact that we would never have received the customer care and attention from most other organisations, as we are so remote here in the Western Isles, so it was truly a breath of fresh air to do business with Prudential.’
www.prudential.co.uk� Annual�Report�2016 Prudential plc 33
02Strategicreport
United Kingdom and EuropeAsset management
Serving retail and institutional investors through a conviction-led and long-term approach
2016 performance highlights — External funds under management up 8 per cent to £137 billion
— 2016 IFRS operating profit of £425 million
— Institutional external funds under management growth of 11 per cent
— New SICAV platform to offer Luxembourg-domiciled funds
— Implementation of new global risk and portfolio management platform underway
The world’s population is ageing: by 2020, there will be more people aged 65 and above than children under five, according to the US Census Bureau. The United Nations estimates that this trend will continue, with over 15 per cent of the global population being aged over 65 by 2050. This demographic shift coincides with changes in retirement planning as governments and employers shift more responsibility to individuals, resulting in growing demand for asset management services.
The European asset management market is already the second-largest in the world, with net assets of £8.2 trillion, while the UK – M&G’s core market – is the second-largest national market, with £1.2 trillion, and is a global centre of excellence for investment management.
As the appetite for long-term savings products grows, demand for alternative investment strategies and solutions, such as direct lending and long-term investment in infrastructure equity, is expected to grow. M&G is well placed to benefit from this trend, given its expertise across a diverse range of assets, a record of innovation and strong distribution relationships.
Market backdrop in 20161
Economic pessimism, political risk and central bank quantitative easing saw many government bonds offering negative real yields in the first half of 2016. There was a significant shift mid-year in investor sentiment, as assets flowed away from bonds and bond proxies back towards equities, particularly financial, energy and materials stocks. This trend accelerated following the US election, and the possibility of looser US fiscal policy boosting economic growth in 2017: over ¤22 billion was withdrawn from fixed income funds by European investors in November alone. An exception was the inflation-linked bond sector, which attracted net flows of over ¤10 billion in 2016 as investors sought protection from the inflationary impact of higher growth expectations in 2017.
Funds, excluding money market funds, in the UK ended 2016 strongly, with net inflows double those of the next-largest European market during the last two months of 2016. Total net sales of Investment Association-registered UK mutual funds were £13 billion during 2016, down from £22 billion in the previous year. In Europe, net sales were ¤213 billion, down from ¤498 billion in the previous year.
Customers Throughout our 85-year history, M&G has maintained its purpose: to help our customers prosper by putting their long-term savings to work. Our customers have always been at the heart of what we do.
Today we manage the savings of millions of people in the UK, Europe and the rest of the world. These include direct or intermediated investors in our open-ended investment funds, members of pension schemes or other long-term savings schemes who invest through financial institutions, and Jackson and Prudential policyholders, including the Prudential UK with-profits fund.
All our customers benefit from our conviction-led, long-term approach to asset management, applied across the full range of asset types: cash, equities, bonds, property and alternatives. We are constantly developing our capabilities to offer our customers strategies that meet their needs, whatever the market conditions.
ProductsM&G has a range of 59 open-ended funds domiciled in the UK and is developing a similar range of funds domiciled in Luxembourg. We aim to offer customers attractive long-term investment returns from a broad choice of products across diverse geographies, asset classes and strategies. Some of our products offer solutions to very specific investor needs. The M&G Episode Income Fund, for example, aims to deliver high and rising levels of income from a diverse range of different assets, which is important to

Prudential plc Annual Report 2016 www.prudential.co.uk34
2016 was a year of political and economic turmoil which prompted many of our customers to reassess their investment portfolios. As performance of our open-ended funds recovered in the second half of the year, we saw a much improved trend in flows in the fourth quarter, while appetite remained strong from institutional customers for our alternative investment strategies. Overall, the diversity of our asset classes, strategies and client base has allowed us once more to deliver value for money for our customers and a sizeable cash contribution to the Group.
Anne Richards Chief Executive Officer, M&G
Patrick’s story M&G‘I’ve enjoyed a long and very varied working life, adapting my skills to several industries
including the Civil Service, banking and even managing funeral homes in my later career, all
while working for 40 years as a minister with my local Congregational church.
‘My savings and investments have given me the security to manage life’s ups and downs,
pressures and expenditures. You never know what challenges life may bring you. The job
you have today may not be there tomorrow and, even in retirement, you don’t always know
how long you’ll have to support yourself and your family. Saving for the future is part of my
DNA, which is why investing with a company like M&G is important to me. I know that
looking after customers’ money is part of their DNA too.’
www.prudential.co.uk� Annual�Report�2016 Prudential plc 35
02Strategicreport
many investors at a time of historically low interest rates and negative bond yields. We also manage segregated mandates on behalf of pension schemes, wealth funds and other institutional investors, as well as a number of alternative investment strategies.
Equities: throughout our long history, we have favoured a stock selection approach, building portfolios from the bottom up. We are known for our long-term investment views, which give us credibility and influence when representing the views and interests of our end investors to company management.
Fixed income: M&G is one of Europe’s largest fixed income investors, with one of the biggest, most experienced in-house credit research teams. Our end investors benefit from our expertise in the full range of fixed income investments, ranging from
sovereign debt to private loans. Among our best-known and most successful strategies are the M&G Optimal Income Fund, which celebrated the 10th anniversary of its UK launch in 2016, and the M&G Alpha Opportunities Fund.
Multi-asset: M&G’s range of multi-asset funds, designed for investors seeking to spread risk across a mix of assets, has again proven popular with customers in 2016. The M&G Prudent Allocation Fund, launched in 2015 to cater specifically for European investors with a lower appetite for risk, was one of our bestselling funds in 2016. In December, we launched the M&G Global Target Return Fund, a new multi-asset fund aimed at investors seeking reasonable returns with managed volatility.
Real estate: M&G invests in, and manages, property around the globe. Our £26 billion portfolio covers the three
commercial sectors of retail, office and industrial. We have a growing franchise in UK Residential Property. M&G Real Estate’s core Asia property fund celebrated its 10th anniversary in 2016 and is one of the largest and most diversified Asia property portfolios. There are now investments of more than US$1.7 billion in the Asia Property Fund.
Alternative assets: M&G is a leading investor in a diverse range of private and illiquid assets such as commercial real estate debt, infrastructure debt and equity and direct lending, collectively known as alternatives. These are attractive options for institutional investors looking to match long-term liabilities with long-term returns, either at fixed or floating rates. They are also a key source of funding for public and private infrastructure projects and businesses that might otherwise struggle to access competitive financing.
Driving our business
Products
M&G operates a range of UK-domiciled retail funds, which are now distributed in 23 jurisdictions across Europe and Asia. In the institutional market, M&G provides a range of strategies that help pension funds, sovereign wealth funds and other large institutional investors match liabilities and achieve growth targets.
Distribution
M&G provides market insights to clients, intermediaries and others through a number of channels, including a programme of roadshows and events. The M&G Client Council offers customers who invest directly with M&G an opportunity to help shape our products and services, in line with their needs.
Investment for growth
M&G is making significant investment in technology, operating model and portfolio management platforms to advance our operational efficiencies and data capabilities.
£64.2 billion retail funds under management
£264.9 billion total funds under management
£64.2 billion retail funds under management
£264.9 billion total funds under management
One of Europe’s largest fixed income investors
One of Europe’s largest fixed-income investors
Range of 59 open-ended funds across diverse geographies, asset classes and investment strategies
14 funds have assets under
management of >£1 billion
Implementation of new portfolio management platform (Aladdin)
New SICAV platform in Luxembourg
58 billion held in equity investments
138 roadshows in 2016 from our retail fund managers reaching 42,000 clients in 16 countries
Customers
We believe our active approach to investment – selecting investments on a conviction basis rather than following a market index – produces superior returns for our customers over the longer term. We offer our customers the ability to invest in a diverse range of assets: not only equities and fixed income but also unlisted investments such as property and private equity.

� www.prudential.co.uk
Distribution With�offices�in�16�countries2,�M&G�is�able�to�stay�close�to�our�customers�and�the�intermediaries�who�distribute�our�products.�Our�open-ended�retail�funds�are�registered�for�distribution�in�23�jurisdictions3�in�Europe�and�Asia,�while�our�institutional�investment�strategies�are�available�to�investors�in�many�markets�around�the�world,�including�North�America.
We�are�also�investing�in�online�distribution�in�the�UK,�building�on�the�insights�we�gain�from�the�Client�Council,�a�group�of�500�customers�who�invest�directly�with�us�and�who�help�us�develop�our�products,�services�and�investor�communications.
Investment for growthM&G�is�investing�in�technology�and�operational�infrastructure�so�we�can�take�full�advantage�of�the�opportunities�in�the�fast-evolving�distribution�and�regulatory�landscape�in�which�we�operate.�In�2016,�we�began�implementation�of�Aladdin,�a�new�global�risk�and�portfolio�management�platform,�which�is�being�adopted�across�the�Prudential�Group’s�asset�management�businesses.�This�will�significantly�advance�our�data�capabilities�and�operational�efficiency.�
We�also�opened�a�new�investment�platform�in�Luxembourg,�which�gives�us�new�capacity�to�distribute�our�funds�to�European�customers�based�outside�the�UK.
Our businesses and their performanceContinued
Graham and Gemma’s story
M&G�and�Prudential�UKAlder�Hey�in�the�Park�Children’s�Hospital�in�Liverpool,�officially�opened�by�HM�The�Queen�in�June�2016,�was�built�using�finance�arranged�by�the�M&G�infrastructure�debt�team,�working�in�partnership�with�Prudential�as�lead�debt�investor.�
Consultant�paediatric�surgeon�Graham�Lamont�says�the�new�building�is�transforming�both�patient�experience�and�the�way�his�team�works.�‘Building�the�new�Alder�Hey�from�scratch�has�allowed�us�to�redesign�the�way�our�day-patients�flow�through�the�building.�Now�we�have�no�complaints�about�waiting�times,�and�we’ll�be�able�to�increase�the�number�of�patients�we’re�able�to�treat�from�about�7,000�day-cases�a�year�to�about�8,000.’
Gemma,�mother�of�one-year-old�Harry,�who�has�been�treated�for�craniosynostosis�at�Alder�Hey,�agrees:��‘There’s�so�much�clever�design�and�technology�at�the�hospital�to�make�patients�feel�comfortable,�from�barcode�scanners�that�check�you�in�for�appointments,�to�special�lighting�in�the�children’s�rooms�–�it�really�is�a�hospital�of�the�future!’
Anne Richards Chief Executive OfficerM&G
Notes1 Source:�Broadridge�FundFile�as�at�31�December�2016�in�
GBP�and�EUR.�Where�referenced,�the�European�asset�management�market�refers�to�both�cross�border�and�domestic�markets�and�net�sales�data�is�based�on�estimated�net�sales�data,�All�UK�data�is�sourced�from�the�Investment�Association�as�at�31�December�2016�and�based�on�the�UK�onshore�and�offshore�data.
2� Includes�the�UK�head�office�and�PPM�South�Africa.3� Europe�includes�the�UK.�Restricted�distribution�in�
Singapore.
www.prudential.co.uk� Annual�Report�2016 Prudential plc 37
02Strategicreport
Chief Financial Officer’s report on the 2016 financial performance – Nic Nicandrou
Showcasing the resilience of our earnings, cash and capital The Group’s performance has once again been led by Asia, with double digit growth across new business profit, IFRS operating profit and free surplus generation for the seventh year in a row.
Nic Nicandrou Chief Financial Officer
I am particularly pleased to be able to report that Prudential’s financial performance in 2016 has showcased the resilience of our earnings, cash and capital. While these are qualities I have mentioned in previous reports, the external events of 2016 have seen them tested repeatedly across our businesses during a year of significant uncertainty, market volatility and unexpected political and regulatory events. By remaining focused on our strategy and on disciplined execution, our business withstood the effect of these events and successfully adapted to changes in market conditions, regulatory intervention and shifts in consumer preference, to deliver a strong operating performance in 2016 and an improved capital position.
Prudential’s financial attributes and multiple, diverse levers of growth have enabled the Group to absorb not only the areas of earnings pressure known at the beginning of the year, but also the fluctuations of both equity markets and yields. New business profit, IFRS operating profit and free surplus generation, the three financial measures that we use to track delivery of our ‘growth and cash’ agenda, have all increased in 2016 when expressed on an actual exchange rate basis. This achievement demonstrates the benefits of our scale and the strength of our business model which is well diversified by geography, currency and source of earnings. The 2016 results also highlight the earnings power of our growing in-force
book of business and our ability to add large new business volumes which are an important store of future value.
The year-on-year trends of the three ‘growth and cash’ measures are also positive when expressed on a constant exchange rate basis, except for IFRS operating profit, where we have seen a marginal fall due to the effect of one-off impacts in our UK Life operations.
The Group’s performance has once-again been led by Asia, with double digit growth across new business profit, IFRS operating profit and free surplus generation for the seventh year in a row. This underlines the scale and quality of our regional franchise, characterised by the high proportion of recurring income and bias for protection business that is uncoupled from market effects. In our insurance and asset management businesses in the UK and US, we have continued to build our earnings base with growth in assets managed on behalf of our customers.
2016 has seen sterling weakening against most global currencies, which is positive for the translation of results from our sizeable non-sterling operations. However, to aid understanding of the underlying progress in these businesses, we continue to express and comment on the performance trends of our Asia and US operations on a constant currency basis.
The key financial highlights in 2016 were as follows:
— New business profit1 was 11 per cent2,3 higher at £3,088 million (up 24 per cent on an actual exchange rate basis), primarily as a result of higher volumes with APE sales up 8 per cent2,3. Growth was strongest in Asia, where new business profit increased 22 per cent on a 19 per cent uplift in APE sales and improvements in country and channel mix. The contribution to new business profit from Jackson declined by 13 per cent, reflecting lower variable annuity sales volumes. UK life retail new business profit grew by 33 per cent, driven by strong consumer demand for products offering access to our PruFund investment option, which resulted in a 33 per cent increase in retail APE sales. There was no bulk annuity new business profit as we withdrew from this market in 2016.
— IFRS operating profit based on longer-term investment returns (IFRS operating profit) was 2 per cent3 lower at £4,256 million (up 7 per cent on an actual exchange rate basis). IFRS operating profit from our Asia life insurance and asset management businesses grew by 15 per cent3 to £1,644 million, reflecting continued business momentum. In the US, Jackson’s total IFRS operating profit increased by 7 per cent, mainly due to growth in fee income on higher asset balances, which outweighed the anticipated reduction in spread earnings. In the UK, total IFRS operating profit was 31 per cent lower than the prior year, as a result of significantly reduced profits from annuity new business following our withdrawal from the bulk annuity market, the lower contribution from actions to support solvency and a provision for the cost of undertaking a review of past non-advised annuity sales practices and related potential redress. M&G’s operating profit was 4 per cent lower, reflecting the earnings impact of the recent period of net fund outflows.
— Underlying free surplus generation1,4, our preferred measure of cash generation from our life and asset management businesses, increased by 10 per cent3 to £3,588 million (up 18 per cent on an actual exchange rate basis), after financing new business growth. The increase reflects a higher contribution from our growing in-force book of business, as we continue to focus on high-return new business with fast payback periods and includes the benefit from capital actions in the UK and the US.
— Group shareholders’ Solvency II capital surplus7 was estimated at £12.5 billion at 31 December 2016, equivalent to a cover ratio of 201 per cent6 (1 January 2016: £9.7 billion, 193 per cent). The improvement in the period primarily reflects the continuing strength of the Group’s operating capital generation in excess of growing dividend payments to shareholders, and also includes the benefit of debt issued in the year.
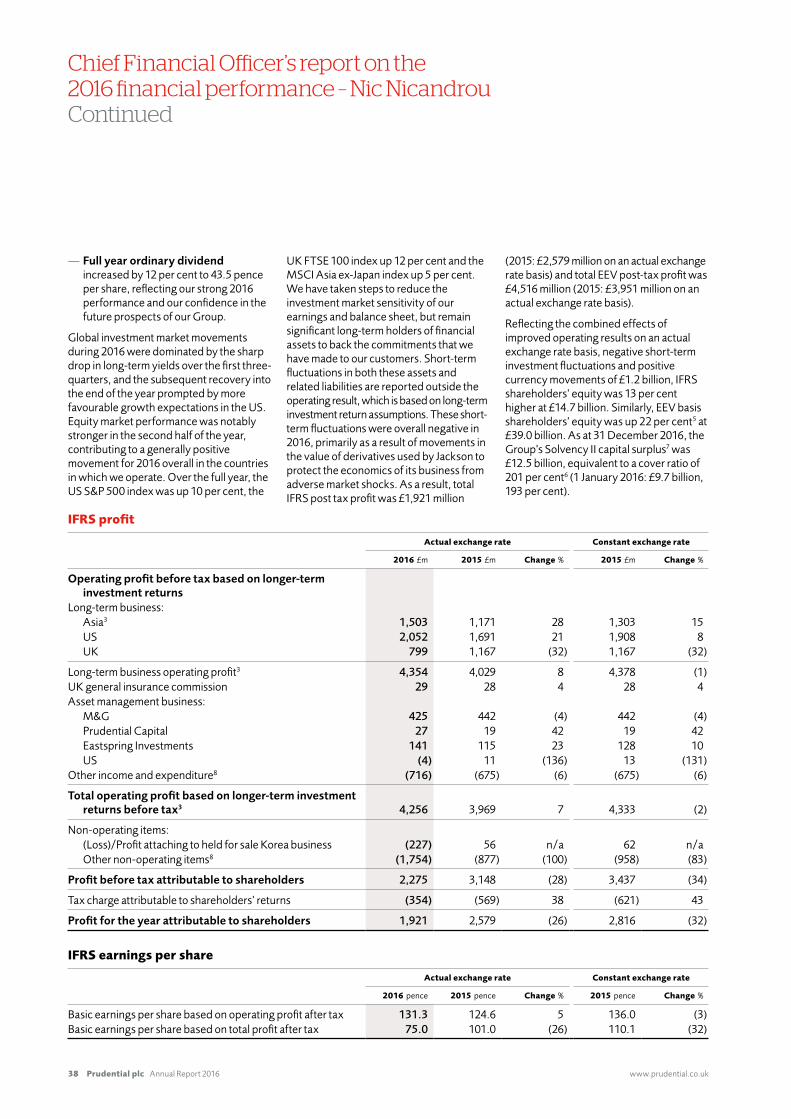
Prudential plc Annual Report 2016 www.prudential.co.uk38
Chief Financial Officer’s report on the 2016 financial performance – Nic NicandrouContinued
— Full year ordinary dividend increased by 12 per cent to 43.5 pence per share, reflecting our strong 2016 performance and our confidence in the future prospects of our Group.
Global investment market movements during 2016 were dominated by the sharp drop in long-term yields over the first three-quarters, and the subsequent recovery into the end of the year prompted by more favourable growth expectations in the US. Equity market performance was notably stronger in the second half of the year, contributing to a generally positive movement for 2016 overall in the countries in which we operate. Over the full year, the US S&P 500 index was up 10 per cent, the
UK FTSE 100 index up 12 per cent and the MSCI Asia ex-Japan index up 5 per cent. We have taken steps to reduce the investment market sensitivity of our earnings and balance sheet, but remain significant long-term holders of financial assets to back the commitments that we have made to our customers. Short-term fluctuations in both these assets and related liabilities are reported outside the operating result, which is based on long-term investment return assumptions. These short- term fluctuations were overall negative in 2016, primarily as a result of movements in the value of derivatives used by Jackson to protect the economics of its business from adverse market shocks. As a result, total IFRS post tax profit was £1,921 million
(2015: £2,579 million on an actual exchange rate basis) and total EEV post-tax profit was £4,516 million (2015: £3,951 million on an actual exchange rate basis).
Reflecting the combined effects of improved operating results on an actual exchange rate basis, negative short-term investment fluctuations and positive currency movements of £1.2 billion, IFRS shareholders’ equity was 13 per cent higher at £14.7 billion. Similarly, EEV basis shareholders’ equity was up 22 per cent5 at £39.0 billion. As at 31 December 2016, the Group’s Solvency II capital surplus7 was £12.5 billion, equivalent to a cover ratio of 201 per cent6 (1 January 2016: £9.7 billion, 193 per cent).
IFRS profit
Actual exchange rate Constant exchange rate
2016 £m 2015 £m Change % 2015 £m Change %
Operating profit before tax based on longer-term investment returns
Long-term business:Asia3 1,503 1,171 28 1,303 15US 2,052 1,691 21 1,908 8UK 799 1,167 (32) 1,167 (32)
Long-term business operating profit3 4,354 4,029 8 4,378 (1)UK general insurance commission 29 28 4 28 4Asset management business:
M&G 425 442 (4) 442 (4)Prudential Capital 27 19 42 19 42Eastspring Investments 141 115 23 128 10US (4) 11 (136) 13 (131)
Other income and expenditure8 (716) (675) (6) (675) (6)
Total operating profit based on longer-term investment returns before tax3 4,256 3,969 7 4,333 (2)
Non-operating items:(Loss)/Profit attaching to held for sale Korea business (227) 56 n/a 62 n/aOther non-operating items8 (1,754) (877) (100) (958) (83)
Profit before tax attributable to shareholders 2,275 3,148 (28) 3,437 (34)
Tax charge attributable to shareholders’ returns (354) (569) 38 (621) 43
Profit for the year attributable to shareholders 1,921 2,579 (26) 2,816 (32)
IFRS earnings per share
Actual exchange rate Constant exchange rate
2016 pence 2015 pence Change % 2015 pence Change %
Basic earnings per share based on operating profit after tax 131.3 124.6 5 136.0 (3)Basic earnings per share based on total profit after tax 75.0 101.0 (26) 110.1 (32)
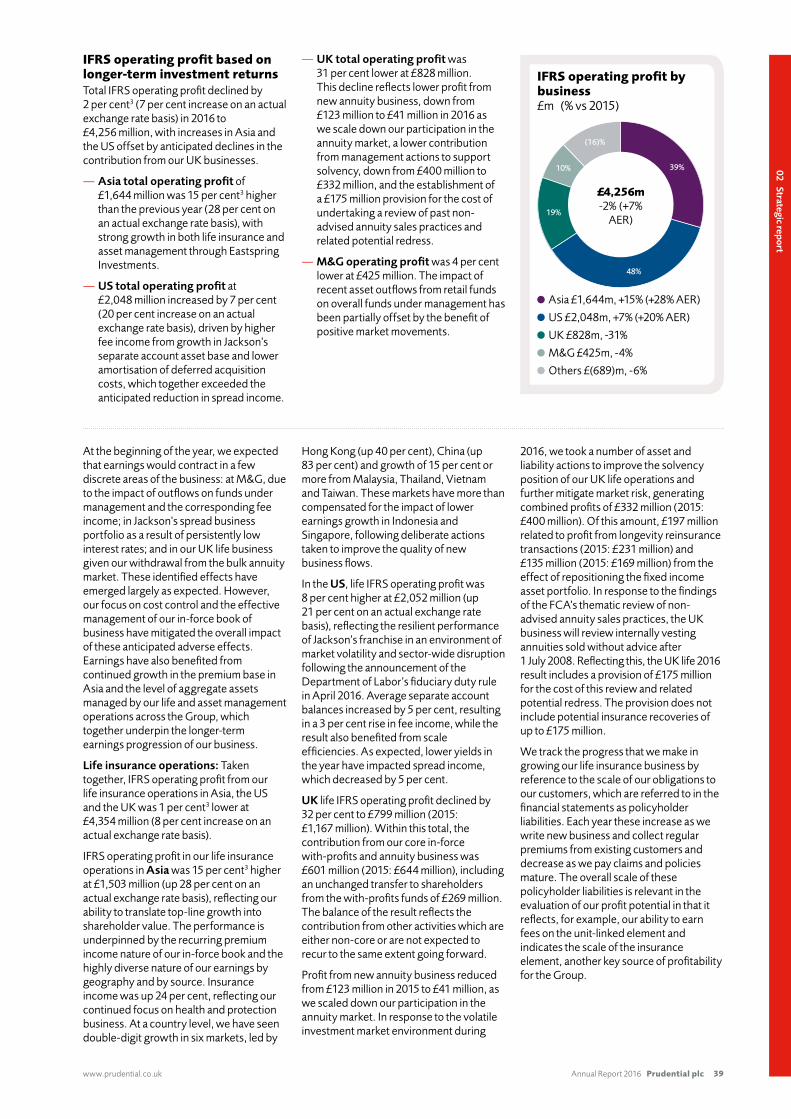
www.prudential.co.uk� Annual�Report�2016 Prudential plc 39
02Strategicreport
IFRS operating profit based on longer-term investment returnsTotal IFRS operating profit declined by 2 per cent3 (7 per cent increase on an actual exchange rate basis) in 2016 to £4,256 million, with increases in Asia and the US offset by anticipated declines in the contribution from our UK businesses.
— Asia total operating profit of £1,644 million was 15 per cent3 higher than the previous year (28 per cent on an actual exchange rate basis), with strong growth in both life insurance and asset management through Eastspring Investments.
— US total operating profit at £2,048 million increased by 7 per cent (20 per cent increase on an actual exchange rate basis), driven by higher fee income from growth in Jackson’s separate account asset base and lower amortisation of deferred acquisition costs, which together exceeded the anticipated reduction in spread income.
— UK total operating profit was 31 per cent lower at £828 million. This decline reflects lower profit from new annuity business, down from £123 million to £41 million in 2016 as we scale down our participation in the annuity market, a lower contribution from management actions to support solvency, down from £400 million to £332 million, and the establishment of a £175 million provision for the cost of undertaking a review of past non-advised annuity sales practices and related potential redress.
— M&G operating profit was 4 per cent lower at £425 million. The impact of recent asset outflows from retail funds on overall funds under management has been partially offset by the benefit of positive market movements.
IFRS operating profit by business £m (% vs 2015)
39%
48%
19%
10%
(16)%
£4,256m-2% (+7%
AER)
Asia £1,644m, +15% (+28% AER)
US £2,048m, +7% (+20% AER)
UK £828m, -31%
M&G £425m, -4%
Others £(689)m, -6%
At the beginning of the year, we expected that earnings would contract in a few discrete areas of the business: at M&G, due to the impact of outflows on funds under management and the corresponding fee income; in Jackson’s spread business portfolio as a result of persistently low interest rates; and in our UK life business given our withdrawal from the bulk annuity market. These identified effects have emerged largely as expected. However, our focus on cost control and the effective management of our in-force book of business have mitigated the overall impact of these anticipated adverse effects. Earnings have also benefited from continued growth in the premium base in Asia and the level of aggregate assets managed by our life and asset management operations across the Group, which together underpin the longer-term earnings progression of our business.
Life insurance operations: Taken together, IFRS operating profit from our life insurance operations in Asia, the US and the UK was 1 per cent3 lower at £4,354 million (8 per cent increase on an actual exchange rate basis).
IFRS operating profit in our life insurance operations in Asia was 15 per cent3 higher at £1,503 million (up 28 per cent on an actual exchange rate basis), reflecting our ability to translate top-line growth into shareholder value. The performance is underpinned by the recurring premium income nature of our in-force book and the highly diverse nature of our earnings by geography and by source. Insurance income was up 24 per cent, reflecting our continued focus on health and protection business. At a country level, we have seen double-digit growth in six markets, led by
Hong Kong (up 40 per cent), China (up 83 per cent) and growth of 15 per cent or more from Malaysia, Thailand, Vietnam and Taiwan. These markets have more than compensated for the impact of lower earnings growth in Indonesia and Singapore, following deliberate actions taken to improve the quality of new business flows.
In the US, life IFRS operating profit was 8 per cent higher at £2,052 million (up 21 per cent on an actual exchange rate basis), reflecting the resilient performance of Jackson’s franchise in an environment of market volatility and sector-wide disruption following the announcement of the Department of Labor’s fiduciary duty rule in April 2016. Average separate account balances increased by 5 per cent, resulting in a 3 per cent rise in fee income, while the result also benefited from scale efficiencies. As expected, lower yields in the year have impacted spread income, which decreased by 5 per cent.
UK life IFRS operating profit declined by 32 per cent to £799 million (2015: £1,167 million). Within this total, the contribution from our core in-force with-profits and annuity business was £601 million (2015: £644 million), including an unchanged transfer to shareholders from the with-profits funds of £269 million. The balance of the result reflects the contribution from other activities which are either non-core or are not expected to recur to the same extent going forward.
Profit from new annuity business reduced from £123 million in 2015 to £41 million, as we scaled down our participation in the annuity market. In response to the volatile investment market environment during
2016, we took a number of asset and liability actions to improve the solvency position of our UK life operations and further mitigate market risk, generating combined profits of £332 million (2015: £400 million). Of this amount, £197 million related to profit from longevity reinsurance transactions (2015: £231 million) and £135 million (2015: £169 million) from the effect of repositioning the fixed income asset portfolio. In response to the findings of the FCA’s thematic review of non-advised annuity sales practices, the UK business will review internally vesting annuities sold without advice after 1 July 2008. Reflecting this, the UK life 2016 result includes a provision of £175 million for the cost of this review and related potential redress. The provision does not include potential insurance recoveries of up to £175 million.
We track the progress that we make in growing our life insurance business by reference to the scale of our obligations to our customers, which are referred to in the financial statements as policyholder liabilities. Each year these increase as we write new business and collect regular premiums from existing customers and decrease as we pay claims and policies mature. The overall scale of these policyholder liabilities is relevant in the evaluation of our profit potential in that it reflects, for example, our ability to earn fees on the unit-linked element and indicates the scale of the insurance element, another key source of profitability for the Group.
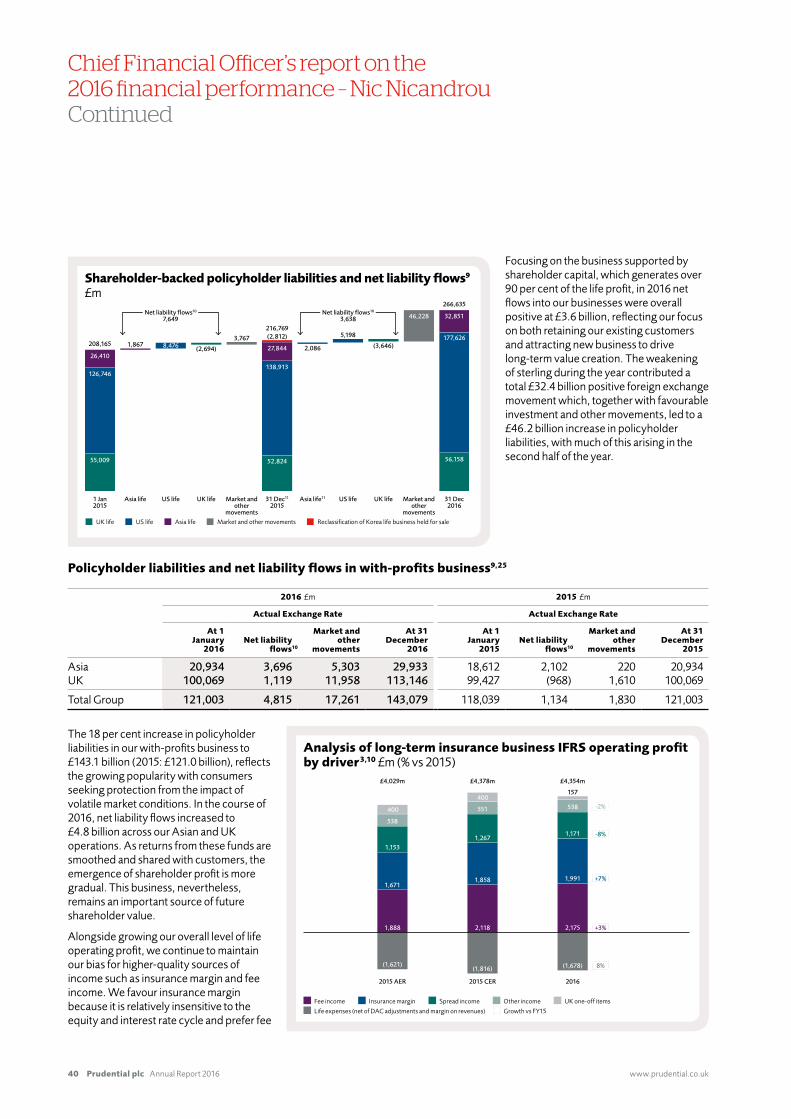
Prudential plc Annual Report 2016 www.prudential.co.uk40
Chief Financial Officer’s report on the 2016 financial performance – Nic NicandrouContinued
Shareholder-backed policyholder liabilities and net liability flows9 £m
1 Jan2015
55,009
126,746
26,410
208,165 1,867 8,476 (2,694) 27,844
(2,812)3,767
216,769
2,086 5,198
(3,646)2,086
46,228 32,851
266,635
177,626
56,158
138,913
52,824
Asia life US life UK life Market andother
movements
31 Dec11
2015Asia life11 US life UK life Market and
othermovements
31 Dec2016
US life Asia lifeUK life Market and other movements Reclassification of Korea life business held for sale
Net liability flows10
7,649Net liability flows10
3,638
Focusing on the business supported by shareholder capital, which generates over 90 per cent of the life profit, in 2016 net flows into our businesses were overall positive at £3.6 billion, reflecting our focus on both retaining our existing customers and attracting new business to drive long-term value creation. The weakening of sterling during the year contributed a total £32.4 billion positive foreign exchange movement which, together with favourable investment and other movements, led to a £46.2 billion increase in policyholder liabilities, with much of this arising in the second half of the year.
Policyholder liabilities and net liability flows in with-profits business9,25
2016 £m 2015 £m
Actual Exchange Rate Actual Exchange Rate
At 1January
2016Net liability
flows10
Market andother
movements
At 31December
2016
At 1January
2015Net liability
flows10
Market andother
movements
At 31December
2015
Asia 20,934 3,696 5,303 29,933 18,612 2,102 220 20,934UK 100,069 1,119 11,958 113,146 99,427 (968) 1,610 100,069
Total Group 121,003 4,815 17,261 143,079 118,039 1,134 1,830 121,003
The 18 per cent increase in policyholder liabilities in our with-profits business to £143.1 billion (2015: £121.0 billion), reflects the growing popularity with consumers seeking protection from the impact of volatile market conditions. In the course of 2016, net liability flows increased to £4.8 billion across our Asian and UK operations. As returns from these funds are smoothed and shared with customers, the emergence of shareholder profit is more gradual. This business, nevertheless, remains an important source of future shareholder value.
Alongside growing our overall level of life operating profit, we continue to maintain our bias for higher-quality sources of income such as insurance margin and fee income. We favour insurance margin because it is relatively insensitive to the equity and interest rate cycle and prefer fee
Analysis of long-term insurance business IFRS operating profit by driver3,10 £m (% vs 2015)
2015 AER
(1,621)
1,888
1,671
1,153
538
400
(1,816)
2,118
1,858
1,267
551
400
(1,678)
2,175
1,991
1,171
538
157
2015 CER 2016
£4,029m £4,378m £4,354m
8%
+3%
+7%
-8%
-2%
Fee income Insurance margin Spread income Other income UK one-off items
Life expenses (net of DAC adjustments and margin on revenues) Growth vs FY15
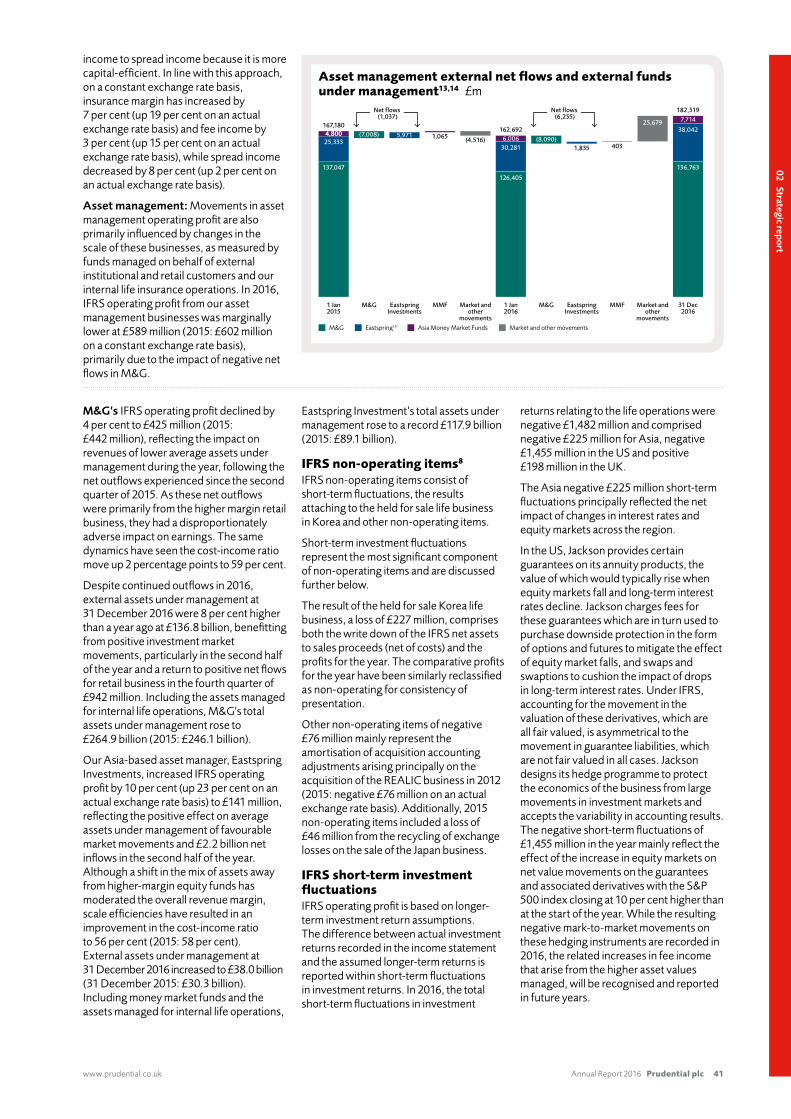
www.prudential.co.uk� Annual�Report�2016 Prudential plc 41
02Strategicreport
income to spread income because it is more capital-efficient. In line with this approach, on a constant exchange rate basis, insurance margin has increased by 7 per cent (up 19 per cent on an actual exchange rate basis) and fee income by 3 per cent (up 15 per cent on an actual exchange rate basis), while spread income decreased by 8 per cent (up 2 per cent on an actual exchange rate basis).
Asset management: Movements in asset management operating profit are also primarily influenced by changes in the scale of these businesses, as measured by funds managed on behalf of external institutional and retail customers and our internal life insurance operations. In 2016, IFRS operating profit from our asset management businesses was marginally lower at £589 million (2015: £602 million on a constant exchange rate basis), primarily due to the impact of negative net flows in M&G.
Asset management external net flows and external funds under management13,14 £m
1 Jan2015
137,047
25,3334,8004,800
167,180(7,008) 5,971 1,065 (4,516) 6,006
162,692
(8,090)1,835 403
25,679 7,714182,519
38,042
136,763
30,281
126,405
M&G EastspringInvestments
MMF Market andother
movements
1 Jan2016
M&G EastspringInvestments
MMF Market andother
movements
31 Dec2016
Net flows (1,037)
Net flows (6,255)
M&G Eastspring15 Asia Money Market Funds Market and other movements
M&G’s IFRS operating profit declined by 4 per cent to £425 million (2015: £442 million), reflecting the impact on revenues of lower average assets under management during the year, following the net outflows experienced since the second quarter of 2015. As these net outflows were primarily from the higher margin retail business, they had a disproportionately adverse impact on earnings. The same dynamics have seen the cost-income ratio move up 2 percentage points to 59 per cent.
Despite continued outflows in 2016, external assets under management at 31 December 2016 were 8 per cent higher than a year ago at £136.8 billion, benefitting from positive investment market movements, particularly in the second half of the year and a return to positive net flows for retail business in the fourth quarter of £942 million. Including the assets managed for internal life operations, M&G’s total assets under management rose to £264.9 billion (2015: £246.1 billion).
Our Asia-based asset manager, Eastspring Investments, increased IFRS operating profit by 10 per cent (up 23 per cent on an actual exchange rate basis) to £141 million, reflecting the positive effect on average assets under management of favourable market movements and £2.2 billion net inflows in the second half of the year. Although a shift in the mix of assets away from higher-margin equity funds has moderated the overall revenue margin, scale efficiencies have resulted in an improvement in the cost-income ratio to 56 per cent (2015: 58 per cent). External assets under management at 31 December 2016 increased to £38.0 billion (31 December 2015: £30.3 billion). Including money market funds and the assets managed for internal life operations,
Eastspring Investment’s total assets under management rose to a record £117.9 billion (2015: £89.1 billion).
IFRS non-operating items8
IFRS non-operating items consist of short-term fluctuations, the results attaching to the held for sale life business in Korea and other non-operating items.
Short-term investment fluctuations represent the most significant component of non-operating items and are discussed further below.
The result of the held for sale Korea life business, a loss of £227 million, comprises both the write down of the IFRS net assets to sales proceeds (net of costs) and the profits for the year. The comparative profits for the year have been similarly reclassified as non-operating for consistency of presentation.
Other non-operating items of negative £76 million mainly represent the amortisation of acquisition accounting adjustments arising principally on the acquisition of the REALIC business in 2012 (2015: negative £76 million on an actual exchange rate basis). Additionally, 2015 non-operating items included a loss of £46 million from the recycling of exchange losses on the sale of the Japan business.
IFRS short-term investment fluctuationsIFRS operating profit is based on longer-term investment return assumptions. The difference between actual investment returns recorded in the income statement and the assumed longer-term returns is reported within short-term fluctuations in investment returns. In 2016, the total short-term fluctuations in investment
returns relating to the life operations were negative £1,482 million and comprised negative £225 million for Asia, negative £1,455 million in the US and positive £198 million in the UK.
The Asia negative £225 million short-term fluctuations principally reflected the net impact of changes in interest rates and equity markets across the region.
In the US, Jackson provides certain guarantees on its annuity products, the value of which would typically rise when equity markets fall and long-term interest rates decline. Jackson charges fees for these guarantees which are in turn used to purchase downside protection in the form of options and futures to mitigate the effect of equity market falls, and swaps and swaptions to cushion the impact of drops in long-term interest rates. Under IFRS, accounting for the movement in the valuation of these derivatives, which are all fair valued, is asymmetrical to the movement in guarantee liabilities, which are not fair valued in all cases. Jackson designs its hedge programme to protect the economics of the business from large movements in investment markets and accepts the variability in accounting results. The negative short-term fluctuations of £1,455 million in the year mainly reflect the effect of the increase in equity markets on net value movements on the guarantees and associated derivatives with the S&P 500 index closing at 10 per cent higher than at the start of the year. While the resulting negative mark-to-market movements on these hedging instruments are recorded in 2016, the related increases in fee income that arise from the higher asset values managed, will be recognised and reported in future years.
Prudential plc Annual Report 2016 www.prudential.co.uk42
Chief Financial Officer’s report on the 2016 financial performance – Nic NicandrouContinued
The UK non-operating profit of positive £198 million mainly reflects gains on bonds backing annuity capital and shareholders’ funds following the 70 basis points fall in 15-year UK gilt yields in 2016.
The negative short-term fluctuations in investment returns for other operations of negative £196 million (2015: negative £61 million) include unrealised value movements on financial instruments.
IFRS effective tax ratesIn 2016, the effective tax rate on IFRS operating profit based on longer-term investment returns was 21 per cent, (2015: 20 per cent), reflecting a larger contribution to operating profit from Jackson which attracts a higher rate of tax.
The 2016 effective tax rate on the total IFRS profit was 16 per cent (2015: 18 per cent), reflecting a smaller contribution to the total profit from Jackson which attracts higher rate of tax.
The main driver of the Group’s effective tax
rate is the relative mix of the profits between countries with higher tax rates (such as the US, Indonesia, and Malaysia), and countries with lower tax rates (such as Hong Kong, Singapore and the UK). The UK has enacted legislation to reduce the corporation tax rate in stages from 20 per cent to 17 per cent from 1 April 2020. The effect of reductions to 17 per cent is reflected in the full year 2016 results. Following the US elections, there is the prospect of significant tax reform occurring in the US, which potentially could reduce the US corporate income tax rate from the current 35 per cent. A number of Asian countries, most notably Indonesia, have indicated they are considering reducing corporation tax rates, but no legislative proposals have been announced to date.
We do not expect that changes being introduced in the UK and other countries to implement recommendations made by the OECD’s base erosion and profit shifting project to reform the international tax
regime to have any significant impact on the Group.
Total tax contributionThe Group continues to make significant tax contributions in the countries in which it operates, with £2,890 million remitted to tax authorities in 2016. This was lower than the equivalent amount of £3,004 million in 2015, reflecting lower corporation tax payments, partly offset by increases in other taxes borne and taxes collected. In the US a change of basis for taxing derivatives which affects the timing but not the quantum of tax payable accelerated tax payments from 2016 into 2015.
Publication of tax strategyIn 2017, a new UK requirement for large UK businesses to publish their tax strategy will take effect. Prudential’s tax strategy, together with further details of the tax payments made in 2016, will be available on the Group’s website before 30 June 2017.
New business performanceLife EEV new business profit1 and APE new business sales (APE sales)
Actual exchange rate Constant exchange rate
2016 £m 2015 £m Change % 2015 £m Change %
APE sales
New business
profit APE
sales
New business
profitAPE
sales
New business
profitAPE
sales
New business
profitAPE
sales
New business
profit
Asia3 3,599 2,030 2,712 1,482 33 37 3,020 1,660 19 22US 1,561 790 1,729 809 (10) (2) 1,950 913 (20) (13)UK retail2 1,160 268 874 201 33 33 874 201 33 33
Total Group excluding bulk annuities2,3 6,320 3,088 5,315 2,492 19 24 5,844 2,774 8 11
UK bulk annuities – – 151 117 (100) (100) 151 117 (100) (100)
Total Group3 6,320 3,088 5,466 2,609 16 18 5,995 2,891 5 7
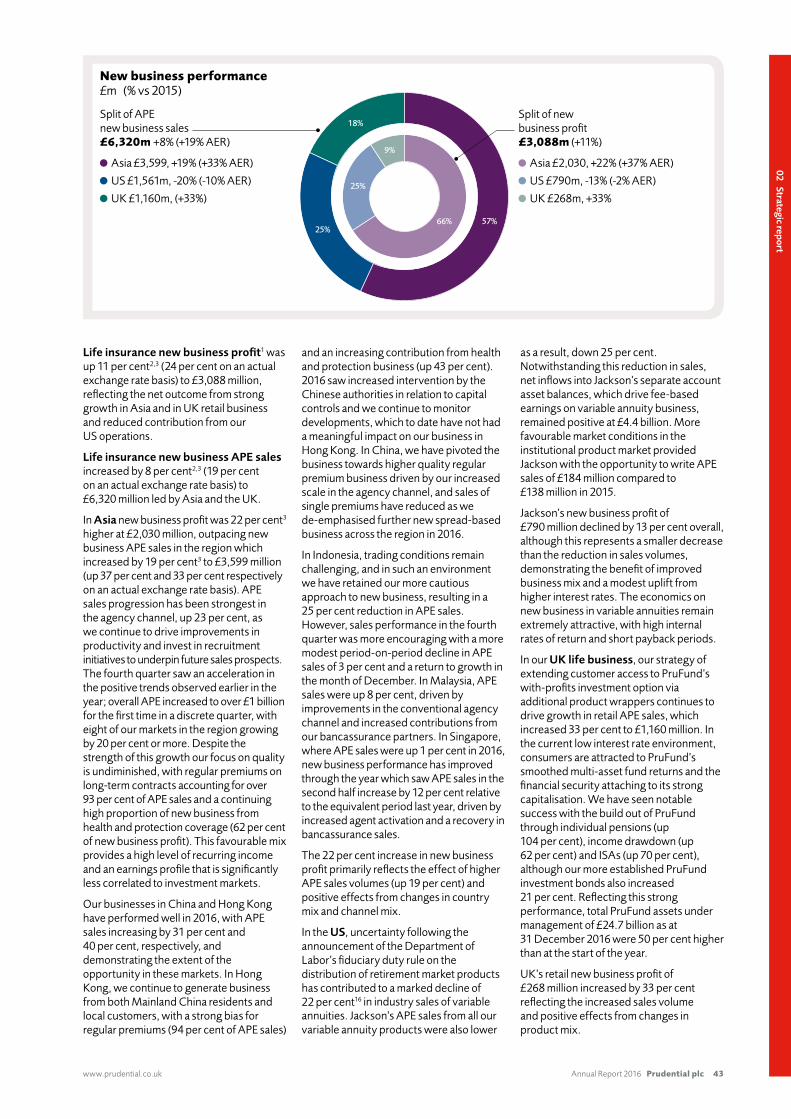
www.prudential.co.uk� Annual�Report�2016 Prudential plc 43
02Strategicreport
New business performance£m (% vs 2015)
57%66%25%
25%
18%
9%
Split of APE new business sales £6,320m +8% (+19% AER)
Asia £3,599, +19% (+33% AER)
US £1,561m, -20% (-10% AER)
UK £1,160m, (+33%)
Split of new business profit £3,088m (+11%)
Asia £2,030, +22% (+37% AER)
US £790m, -13% (-2% AER)
UK £268m, +33%
Life insurance new business profit1 was up 11 per cent2,3 (24 per cent on an actual exchange rate basis) to £3,088 million, reflecting the net outcome from strong growth in Asia and in UK retail business and reduced contribution from our US operations.
Life insurance new business APE sales increased by 8 per cent2,3 (19 per cent on an actual exchange rate basis) to £6,320 million led by Asia and the UK.
In Asia new business profit was 22 per cent3 higher at £2,030 million, outpacing new business APE sales in the region which increased by 19 per cent3 to £3,599 million (up 37 per cent and 33 per cent respectively on an actual exchange rate basis). APE sales progression has been strongest in the agency channel, up 23 per cent, as we continue to drive improvements in productivity and invest in recruitment initiatives to underpin future sales prospects. The fourth quarter saw an acceleration in the positive trends observed earlier in the year; overall APE increased to over £1 billion for the first time in a discrete quarter, with eight of our markets in the region growing by 20 per cent or more. Despite the strength of this growth our focus on quality is undiminished, with regular premiums on long-term contracts accounting for over 93 per cent of APE sales and a continuing high proportion of new business from health and protection coverage (62 per cent of new business profit). This favourable mix provides a high level of recurring income and an earnings profile that is significantly less correlated to investment markets.
Our businesses in China and Hong Kong have performed well in 2016, with APE sales increasing by 31 per cent and 40 per cent, respectively, and demonstrating the extent of the opportunity in these markets. In Hong Kong, we continue to generate business from both Mainland China residents and local customers, with a strong bias for regular premiums (94 per cent of APE sales)
and an increasing contribution from health and protection business (up 43 per cent). 2016 saw increased intervention by the Chinese authorities in relation to capital controls and we continue to monitor developments, which to date have not had a meaningful impact on our business in Hong Kong. In China, we have pivoted the business towards higher quality regular premium business driven by our increased scale in the agency channel, and sales of single premiums have reduced as we de-emphasised further new spread-based business across the region in 2016.
In Indonesia, trading conditions remain challenging, and in such an environment we have retained our more cautious approach to new business, resulting in a 25 per cent reduction in APE sales. However, sales performance in the fourth quarter was more encouraging with a more modest period-on-period decline in APE sales of 3 per cent and a return to growth in the month of December. In Malaysia, APE sales were up 8 per cent, driven by improvements in the conventional agency channel and increased contributions from our bancassurance partners. In Singapore, where APE sales were up 1 per cent in 2016, new business performance has improved through the year which saw APE sales in the second half increase by 12 per cent relative to the equivalent period last year, driven by increased agent activation and a recovery in bancassurance sales.
The 22 per cent increase in new business profit primarily reflects the effect of higher APE sales volumes (up 19 per cent) and positive effects from changes in country mix and channel mix.
In the US, uncertainty following the announcement of the Department of Labor’s fiduciary duty rule on the distribution of retirement market products has contributed to a marked decline of 22 per cent16 in industry sales of variable annuities. Jackson’s APE sales from all our variable annuity products were also lower
as a result, down 25 per cent. Notwithstanding this reduction in sales, net inflows into Jackson’s separate account asset balances, which drive fee-based earnings on variable annuity business, remained positive at £4.4 billion. More favourable market conditions in the institutional product market provided Jackson with the opportunity to write APE sales of £184 million compared to £138 million in 2015.
Jackson’s new business profit of £790 million declined by 13 per cent overall, although this represents a smaller decrease than the reduction in sales volumes, demonstrating the benefit of improved business mix and a modest uplift from higher interest rates. The economics on new business in variable annuities remain extremely attractive, with high internal rates of return and short payback periods.
In our UK life business, our strategy of extending customer access to PruFund’s with-profits investment option via additional product wrappers continues to drive growth in retail APE sales, which increased 33 per cent to £1,160 million. In the current low interest rate environment, consumers are attracted to PruFund’s smoothed multi-asset fund returns and the financial security attaching to its strong capitalisation. We have seen notable success with the build out of PruFund through individual pensions (up 104 per cent), income drawdown (up 62 per cent) and ISAs (up 70 per cent), although our more established PruFund investment bonds also increased 21 per cent. Reflecting this strong performance, total PruFund assets under management of £24.7 billion as at 31 December 2016 were 50 per cent higher than at the start of the year.
UK’s retail new business profit of £268 million increased by 33 per cent reflecting the increased sales volume and positive effects from changes in product mix.
Prudential plc Annual Report 2016 www.prudential.co.uk44
Chief Financial Officer’s report on the 2016 financial performance – Nic NicandrouContinued
Free surplus generationFree surplus generation is the financial metric we use to measure the internal cash generation of our business operations. For life insurance operations it represents amounts maturing from the in-force business during the year, net of amounts reinvested in writing new business. For asset management it equates to post-tax IFRS profit for the period.
This metric is based on the capital regimes which apply locally in the various jurisdictions in which our life businesses operate. The introduction of Solvency II with effect from 1 January 2016 has altered the regime locally applied to our UK life business, so the 2016 UK life free surplus figures reflect this change. The 2015 UK life comparatives are unchanged as they reflect the regime that applied at that time.
Solvency II does not directly impact the way capital is generated locally in the US and in our Asian life operations, so there is no change in the way free surplus is calculated for these businesses.
In 2016 underlying free surplus generation, after investment in new business, increased by 10 per cent2 to £3,588 million.
Free surplus generation
Actual exchange rate Constant exchange rate
2016 £m 2015 £m Change % 2015 £m Change %
Free surplus generation1,4
Asia3 1,335 1,052 27 1,176 14US 1,863 1,433 30 1,616 15UK 930 900 3 900 3M&G 341 358 (5) 358 (5)Prudential Capital 22 18 22 18 22
Underlying free surplus generated from in-force life business and asset management3 4,491 3,761 19 4,068 10
Investment in new business3 (903) (718) (26) (792) (14)
Underlying free surplus generated3 3,588 3,043 18 3,276 10
Market related movements, timing differences and other movements (588) 289
Net cash remitted by business units (1,718) (1,625)
Total movement in free surplus 1,282 1,707
Free surplus at end of year1,17 6,575 5,293
The 10 per cent3 increase in free surplus generated1 by our life insurance and asset management businesses to £4,491 million (up 19 per cent3 on an actual exchange rate basis) reflects our growing scale and the highly capital-generative nature of our business model. In 2016, a key contributor to this growth has been derived from the positive momentum of Asia’s in-force life insurance portfolio, which provides an important underpin to this metric and helps absorb cyclicality elsewhere in the Group. We drive this metric by targeting markets and products that have low-strain, high-return and fast payback profiles and by delivering both good service and value to improve customer retention. Our ability
to generate both growth and cash is a distinctive feature of Prudential. The closing value of free surplus in our life and asset management operations was £6.6 billion at 31 December 2016, after financing reinvestment in new business and funding cash remittances from the business units to Group.
In Asia, growth in the in-force life portfolio, combined with post-tax asset management profits from Eastspring Investments, contributed to free surplus generation of £1,335 million, up 14 per cent. In the US, in-force free surplus generation increased 15 per cent, reflecting higher expected returns and a benefit of £236 million from
contingent financing of specific US statutory reserves, which strengthened Jackson’s local statutory capital position. In the UK, free surplus generation1 was 3 per cent higher at £930 million, including a net contribution of £206 million (2015: £275 million) from management actions taken in the year to improve solvency, net of the provision for the cost of undertaking a review of past non-advised annuity sales practices and related potential redress.
We invested £903 million of the free surplus generated1 during the period in writing new business (2015: £792 million, including bulk annuities) equivalent to an increase of 14 per cent.

www.prudential.co.uk� Annual�Report�2016 Prudential plc 45
02Strategicreport
Asia remains the primary destination for reinvestment of capital given its higher margin organic growth opportunities. Investment of free surplus in new business was 12 per cent3 higher at £476 million, which is lower than the 19 per cent3 growth in APE sales, mainly due to positive mix effects. We continue to generate internal rates of return in excess of 20 per cent, with an average payback period of three years.
In the US, new business investment was broadly consistent with 2015 at £298 million, reflecting a greater proportion of variable annuity premiums being directed to the fixed account option and higher institutional volumes. At just
2 per cent of new business single premium sales, Jackson’s overall strain remains low, supporting the generation of high returns on capital. New business economics on Jackson’s sales remain extremely attractive, with business written at an overall internal rate of return in excess of 20 per cent and payback periods averaging two years.
The new business investment1 in the UK was £129 million (2015: £65 million), although comparisons are distorted by the application of different capital regimes in the two periods, with investment in 2016 including a significantly higher strain for new non-profit annuities under the new Solvency II regime, despite the much
reduced sales. Following our decision in June 2016 to stop writing annuity business in the open market and our action in early February 2017 to direct internal vestings to a panel of providers, UK new business strain is expected to reduce significantly in 2017.
We continue to manage cash flows across the Group with a view to achieving a balance between ensuring sufficient remittances are made to service central requirements (including paying the external dividend) and maximising value to shareholders through retention and reinvestment of capital in business opportunities.
Business unit remittance18
Actual exchange rate
2016 £m 2015 £m
Net cash remitted by business units:Asia 516 467US 420 470UK 300 301M&G 290 302Prudential Capital 45 55Other UK 147 30
Net cash remitted by business units 1,718 1,625
Holding company cash at 31 December 2,626 2,173
Movement in central cash £m
2,173
2,626
1 Jan2016
Cashremitted to Group
1,718 (257)
(1,010)
(1,267)
(416) 418
Dividendspaid
Centralcosts
Corporateactivities/
other
31 Dec2016
FY15 special dividend FY15 second interim dividend and FY16 first interim dividend
Asia 516US 420UK 300M&G 290PruCap 45Other UK 147
Cash remitted to the corporate centre in 2016 amounted to £1,718 million, driven by higher remittances from Asia (up 21 per cent, after adjusting for £42 million of proceeds in 2015 from the sale of our Japan life business). Jackson made sizeable remittances of £420 million, albeit lower than last year when more supportive markets enhanced capital formation. The remittance from UK Life of £300 million was in line with 2015, while the remittance
from M&G of £290 million was lower than last year reflecting lower levels of post-tax earnings in the year. Actions completed in the period, including internal restructuring that has enabled us to access central resources previously held at intermediary holding and other companies, contributed a further £147 million.
Cash remitted to the Group in 2016 was used to meet central costs of £416 million (2015: £354 million), pay the 2015 second
interim ordinary, 2015 special and 2016 first interim dividends and finance the final up-front payment for the renewal of the distribution agreement with Standard Chartered Bank. These movements combined with the net proceeds of debt raised in the year and other corporate cash flows led to holding company cash increasing from £2,173 million to £2,626 million over 2016.
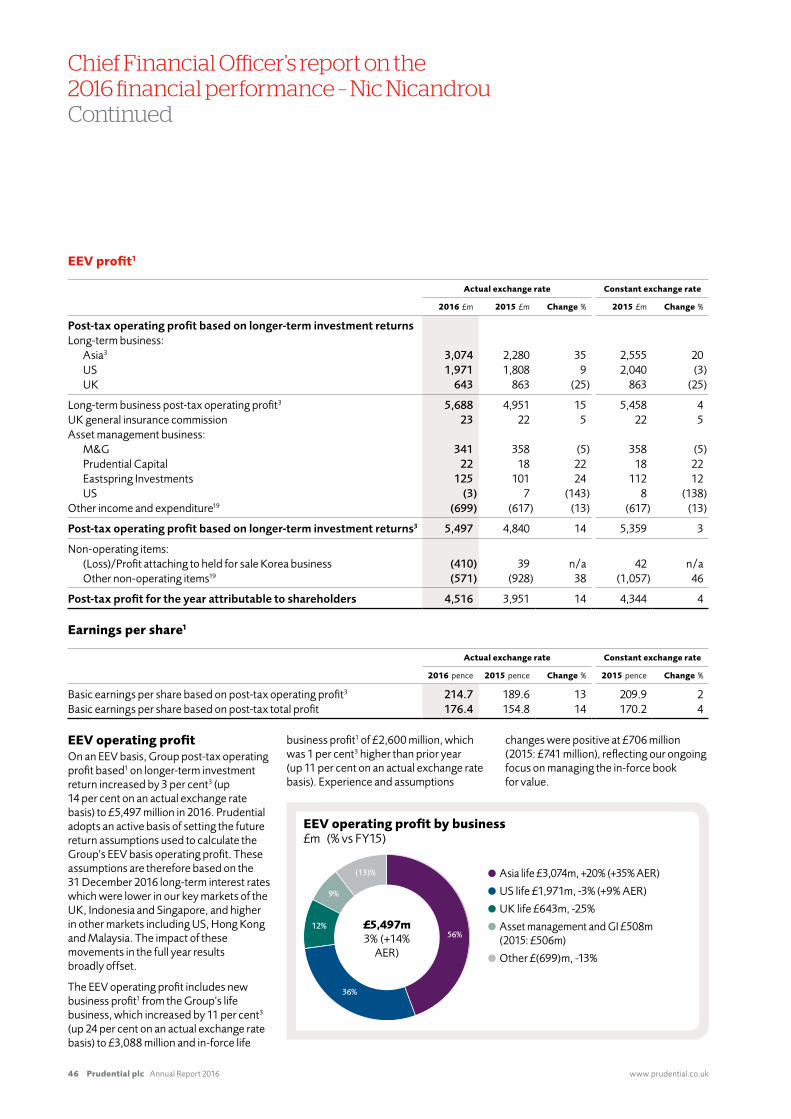
Prudential plc Annual Report 2016 www.prudential.co.uk46
Chief Financial Officer’s report on the 2016 financial performance – Nic NicandrouContinued
EEV profit1
Actual exchange rate Constant exchange rate
2016 £m 2015 £m Change % 2015 £m Change %
Post-tax operating profit based on longer-term investment returnsLong-term business:
Asia3 3,074 2,280 35 2,555 20US 1,971 1,808 9 2,040 (3)UK 643 863 (25) 863 (25)
Long-term business post-tax operating profit3 5,688 4,951 15 5,458 4UK general insurance commission 23 22 5 22 5Asset management business:
M&G 341 358 (5) 358 (5)Prudential Capital 22 18 22 18 22Eastspring Investments 125 101 24 112 12US (3) 7 (143) 8 (138)
Other income and expenditure19 (699) (617) (13) (617) (13)
Post-tax operating profit based on longer-term investment returns3 5,497 4,840 14 5,359 3
Non-operating items:(Loss)/Profit attaching to held for sale Korea business (410) 39 n/a 42 n/aOther non-operating items19 (571) (928) 38 (1,057) 46
Post-tax profit for the year attributable to shareholders 4,516 3,951 14 4,344 4
Earnings per share1
Actual exchange rate Constant exchange rate
2016 pence 2015 pence Change % 2015 pence Change %
Basic earnings per share based on post-tax operating profit3 214.7 189.6 13 209.9 2Basic earnings per share based on post-tax total profit 176.4 154.8 14 170.2 4
EEV operating profitOn an EEV basis, Group post-tax operating profit based1 on longer-term investment return increased by 3 per cent3 (up 14 per cent on an actual exchange rate basis) to £5,497 million in 2016. Prudential adopts an active basis of setting the future return assumptions used to calculate the Group’s EEV basis operating profit. These assumptions are therefore based on the 31 December 2016 long-term interest rates which were lower in our key markets of the UK, Indonesia and Singapore, and higher in other markets including US, Hong Kong and Malaysia. The impact of these movements in the full year results broadly offset.
The EEV operating profit includes new business profit1 from the Group’s life business, which increased by 11 per cent3 (up 24 per cent on an actual exchange rate basis) to £3,088 million and in-force life
business profit1 of £2,600 million, which was 1 per cent3 higher than prior year (up 11 per cent on an actual exchange rate basis). Experience and assumptions
changes were positive at £706 million (2015: £741 million), reflecting our ongoing focus on managing the in-force book for value.
EEV operating profit by business £m (% vs FY15)
56%
36%
12%
9%
(13)%
£5,497m3% (+14%
AER)
Asia life £3,074m, +20% (+35% AER)
US life £1,971m, -3% (+9% AER)
UK life £643m, -25%
Asset management and GI £508m (2015: £506m)
Other £(699)m, -13%
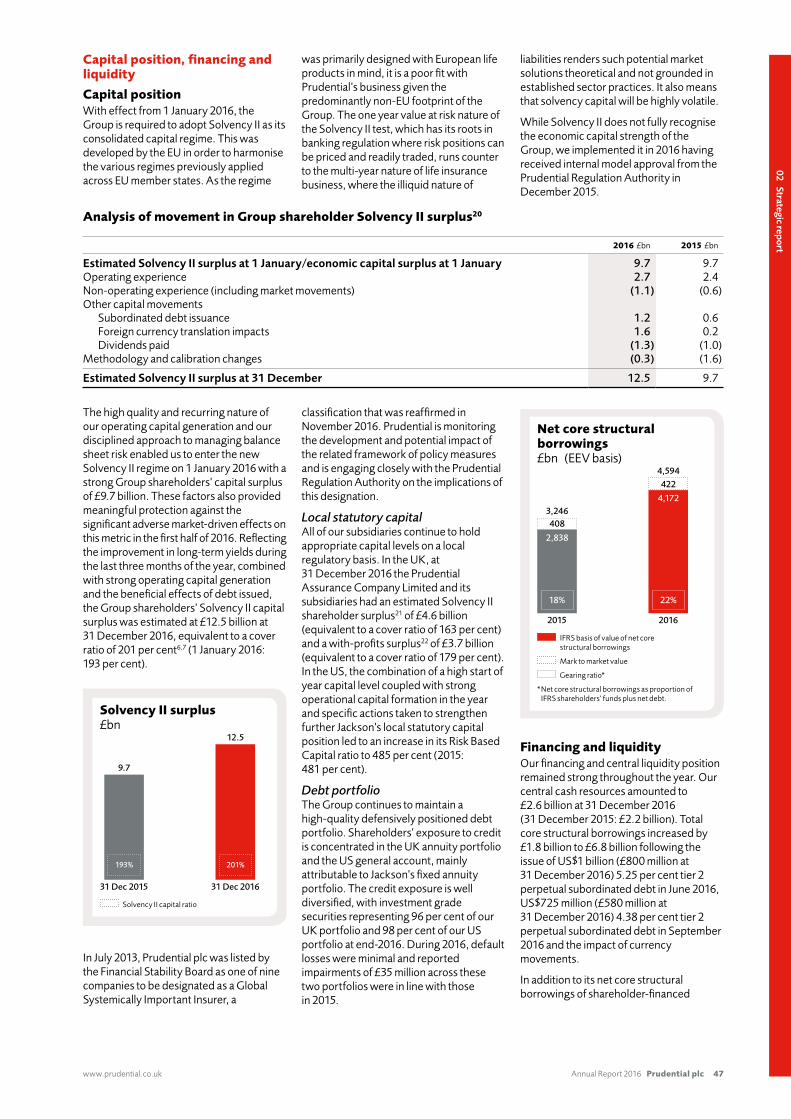
www.prudential.co.uk� Annual�Report�2016 Prudential plc 47
02Strategicreport
Capital position, financing and liquidity
Capital positionWith effect from 1 January 2016, the Group is required to adopt Solvency II as its consolidated capital regime. This was developed by the EU in order to harmonise the various regimes previously applied across EU member states. As the regime
was primarily designed with European life products in mind, it is a poor fit with Prudential’s business given the predominantly non-EU footprint of the Group. The one year value at risk nature of the Solvency II test, which has its roots in banking regulation where risk positions can be priced and readily traded, runs counter to the multi-year nature of life insurance business, where the illiquid nature of
liabilities renders such potential market solutions theoretical and not grounded in established sector practices. It also means that solvency capital will be highly volatile.
While Solvency II does not fully recognise the economic capital strength of the Group, we implemented it in 2016 having received internal model approval from the Prudential Regulation Authority in December 2015.
Analysis of movement in Group shareholder Solvency II surplus20
2016 £bn 2015 £bn
Estimated Solvency II surplus at 1 January/economic capital surplus at 1 January 9.7 9.7Operating experience 2.7 2.4Non-operating experience (including market movements) (1.1) (0.6)Other capital movements
Subordinated debt issuance 1.2 0.6Foreign currency translation impacts 1.6 0.2Dividends paid (1.3) (1.0)
Methodology and calibration changes (0.3) (1.6)
Estimated Solvency II surplus at 31 December 12.5 9.7
The high quality and recurring nature of our operating capital generation and our disciplined approach to managing balance sheet risk enabled us to enter the new Solvency II regime on 1 January 2016 with a strong Group shareholders’ capital surplus of £9.7 billion. These factors also provided meaningful protection against the significant adverse market-driven effects on this metric in the first half of 2016. Reflecting the improvement in long-term yields during the last three months of the year, combined with strong operating capital generation and the beneficial effects of debt issued, the Group shareholders’ Solvency II capital surplus was estimated at £12.5 billion at 31 December 2016, equivalent to a cover ratio of 201 per cent6,7 (1 January 2016: 193 per cent).
Solvency II surplus £bn
12.5
31 Dec 2016
9.7
31 Dec 2015
193% 201%
Solvency II capital ratio
In July 2013, Prudential plc was listed by the Financial Stability Board as one of nine companies to be designated as a Global Systemically Important Insurer, a
classification that was reaffirmed in November 2016. Prudential is monitoring the development and potential impact of the related framework of policy measures and is engaging closely with the Prudential Regulation Authority on the implications of this designation.
Local statutory capitalAll of our subsidiaries continue to hold appropriate capital levels on a local regulatory basis. In the UK, at 31 December 2016 the Prudential Assurance Company Limited and its subsidiaries had an estimated Solvency II shareholder surplus21 of £4.6 billion (equivalent to a cover ratio of 163 per cent) and a with-profits surplus22 of £3.7 billion (equivalent to a cover ratio of 179 per cent). In the US, the combination of a high start of year capital level coupled with strong operational capital formation in the year and specific actions taken to strengthen further Jackson’s local statutory capital position led to an increase in its Risk Based Capital ratio to 485 per cent (2015: 481 per cent).
Debt portfolioThe Group continues to maintain a high-quality defensively positioned debt portfolio. Shareholders’ exposure to credit is concentrated in the UK annuity portfolio and the US general account, mainly attributable to Jackson’s fixed annuity portfolio. The credit exposure is well diversified, with investment grade securities representing 96 per cent of our UK portfolio and 98 per cent of our US portfolio at end-2016. During 2016, default losses were minimal and reported impairments of £35 million across these two portfolios were in line with those in 2015.
Net core structural borrowings £bn (EEV basis)
4,594422
4,172
2016
3,246408
18%
2,838
2015
22%
IFRS basis of value of net core structural borrowings
Mark to market value
Gearing ratio*
* Net core structural borrowings as proportion of IFRS shareholders’ funds plus net debt.
Financing and liquidityOur financing and central liquidity position remained strong throughout the year. Our central cash resources amounted to £2.6 billion at 31 December 2016 (31 December 2015: £2.2 billion). Total core structural borrowings increased by £1.8 billion to £6.8 billion following the issue of US$1 billion (£800 million at 31 December 2016) 5.25 per cent tier 2 perpetual subordinated debt in June 2016, US$725 million (£580 million at 31 December 2016) 4.38 per cent tier 2 perpetual subordinated debt in September 2016 and the impact of currency movements.
In addition to its net core structural borrowings of shareholder-financed
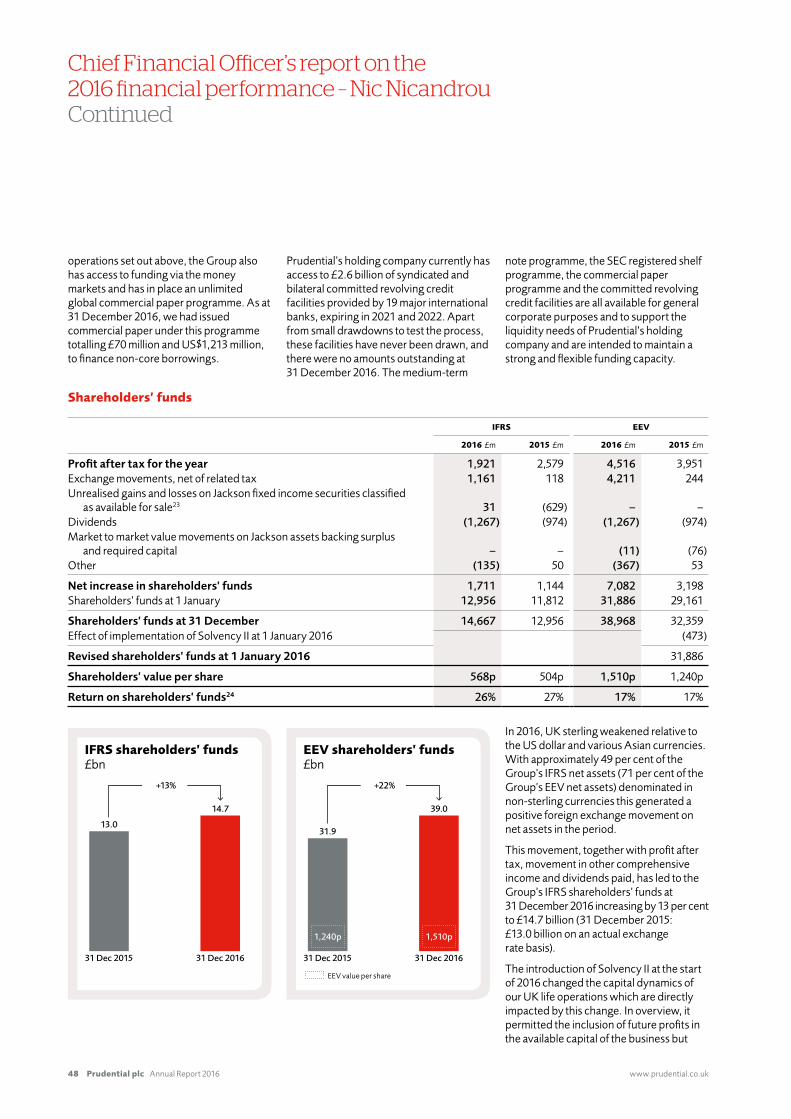
Prudential plc Annual Report 2016 www.prudential.co.uk48
Chief Financial Officer’s report on the 2016 financial performance – Nic NicandrouContinued
operations set out above, the Group also has access to funding via the money markets and has in place an unlimited global commercial paper programme. As at 31 December 2016, we had issued commercial paper under this programme totalling £70 million and US$1,213 million, to finance non-core borrowings.
Prudential’s holding company currently has access to £2.6 billion of syndicated and bilateral committed revolving credit facilities provided by 19 major international banks, expiring in 2021 and 2022. Apart from small drawdowns to test the process, these facilities have never been drawn, and there were no amounts outstanding at 31 December 2016. The medium-term
note programme, the SEC registered shelf programme, the commercial paper programme and the committed revolving credit facilities are all available for general corporate purposes and to support the liquidity needs of Prudential’s holding company and are intended to maintain a strong and flexible funding capacity.
Shareholders’ funds
IFRS EEV
2016 £m 2015 £m 2016 £m 2015 £m
Profit after tax for the year 1,921 2,579 4,516 3,951Exchange movements, net of related tax 1,161 118 4,211 244Unrealised gains and losses on Jackson fixed income securities classified
as available for sale23 31 (629) – –Dividends (1,267) (974) (1,267) (974)Market to market value movements on Jackson assets backing surplus
and required capital – – (11) (76)Other (135) 50 (367) 53
Net increase in shareholders’ funds 1,711 1,144 7,082 3,198Shareholders’ funds at 1 January 12,956 11,812 31,886 29,161
Shareholders’ funds at 31 December 14,667 12,956 38,968 32,359Effect of implementation of Solvency II at 1 January 2016 (473)
Revised shareholders’ funds at 1 January 2016 31,886
Shareholders’ value per share 568p 504p 1,510p 1,240p
Return on shareholders’ funds24 26% 27% 17% 17%
IFRS shareholders’ funds£bn
14.7
31 Dec 2016
13.0
31 Dec 2015
+13%
EEV shareholders’ funds£bn
39.0
31 Dec 2016
31.9
31 Dec 2015
+22%
1,240p 1,510p
EEV value per share
In 2016, UK sterling weakened relative to the US dollar and various Asian currencies. With approximately 49 per cent of the Group’s IFRS net assets (71 per cent of the Group’s EEV net assets) denominated in non-sterling currencies this generated a positive foreign exchange movement on net assets in the period.
This movement, together with profit after tax, movement in other comprehensive income and dividends paid, has led to the Group’s IFRS shareholders’ funds at 31 December 2016 increasing by 13 per cent to £14.7 billion (31 December 2015: £13.0 billion on an actual exchange rate basis).
The introduction of Solvency II at the start of 2016 changed the capital dynamics of our UK life operations which are directly impacted by this change. In overview, it permitted the inclusion of future profits in the available capital of the business but
CHARTS UPDATED TO REFLECT CHANGES TO TABLE
www.prudential.co.uk� Annual�Report�2016 Prudential plc 49
02Strategicreport
increased the statutory capital requirements. Factoring these and other consequential methodology changes in the EEV calculations of the UK life business produced a net charge of £473 million, equivalent to 5 per cent of the UK’s embedded value (just over 1 per cent of the Group’s embedded value at the start of the year). For our operations in Asia and the US, there is no impact on the EEV results since Solvency II does not act as the local constraint on the ability to distribute capital to the Group.
The Group’s EEV basis shareholders’ funds also increased by 22 per cent5 to £39.0 billion (31 December 2015: £31.9 billion on an actual exchange rate basis), equivalent of 1,510 pence per share, up from 1,240 pence per share5 at 31 December 2015.
Corporate transactions
Sale of Korea life insurance business In November 2016 we announced the sale of our Korea life insurance business, PCA Life Insurance Co., Ltd. to Mirae Asset Life Insurance Co., Ltd., for KRW170 billion (equivalent to £114 million at 31 December 2016 closing exchange rate) cash consideration. The completion of this sale is subject to regulatory approval. Consistent with the classification of the business as held for sale, the IFRS and EEV carrying values have been set to £105 million, representing the estimated proceeds, net of related expenses of £9 million. The IFRS loss of £227 million and EEV loss of £410 million comprises the 2016 reduction on writing down the carrying value of the business to the agreed sale proceeds (net of costs) together with its profits for the year. The comparative profits for the year have been similarly
reclassified as non-operating for consistency of presentation.
Entrance into ZambiaIn June 2016 we completed the acquisition of Professional Life Assurance of Zambia, increasing Prudential’s insurance business footprint in Africa to four markets. Across Ghana, Kenya, Uganda and now Zambia we are gradually laying the foundations for what we hope will become a meaningful component of the Group in the years to come. Our current focus in these businesses is on growing our distribution; at 31 December we had 1,750 agents and were active in 181 branches of our four local bank partners (three exclusive) across these businesses.
DividendDuring 2016 the Group’s dividend policy was updated. The Board will maintain its focus on delivering a growing ordinary dividend. In line with this policy, Prudential aims to grow the ordinary dividend by 5 per cent per annum. The potential for additional distributions will continue to be determined after taking into account the Group’s financial flexibility across a broad range of financial metrics and our assessment of opportunities to generate attractive returns by investing in specific areas of the business.
The Board has decided to increase the full-year ordinary dividend by 12 per cent to 43.5 pence per share, reflecting our strong 2016 financial performance and our confidence in the future prospects of the Group. In line with this, the Directors have approved a second interim ordinary dividend of 30.57 pence per share (2015: 26.47 pence per share). In 2015, a special dividend of 10 pence per share was also awarded.
Notes1 The 2016 EEV basis results for UK insurance operations
have been prepared on a basis that reflect the Solvency II regime, effective from 1 January 2016. The 2015 comparative results for UK insurance operations reflect the Solvency I basis.
2 Excluding UK bulk annuities as Prudential has withdrawn from this market.
3 Following its reclassification to held for sale during 2016, operating results exclude the results of the Korea life business. The 2015 comparative results have been similarly adjusted.
4 Free surplus represents ‘underlying free surplus’ based on operating movements, including the general insurance commission earned during the year and excludes market movements, foreign exchange, capital movements, shareholders’ other income and expenditure and centrally arising restructuring and Solvency II implementation costs.
5 Includes adjustment for opening EEV shareholders’ funds of negative £0.5 billion for the impact of Solvency II as at 1 January 2016.
6 Before allowing for second interim ordinary dividend.7 The Group Solvency II surplus represents the shareholder
capital position excluding the contribution to Own Funds and the Solvency Capital Requirement from ring-fenced with-profits funds and staff pension schemes in surplus. The estimated solvency position includes the impact of recalculated transitionals at the valuation date, which has reduced the Group shareholder surplus from £12.9 billion to £12.5 billion. The formal Quantitative Reporting Templates (Solvency II regulatory templates) will include transitional measures without this recalculation.
8 Refer to note B1.1 in IFRS financial statements for the breakdown of other income and expenditure and other non-operating items.
9 Includes Group’s proportionate share of the liabilities and associated flows of the insurance joint ventures and associates in Asia.
10 Defined as movements in policyholder liabilities arising from premiums (net of charges), surrenders/withdrawals, maturities and deaths.
11 Following its reclassification to held for sale during 2016, the shareholder-backed policyholder liabilities for Korea exclude the value of policyholder liabilities held at 1 January 2016 and 2016 net liability flows for Korea life business.
12 For basis of preparation see note I (a) of Additional unaudited IFRS financial information.
13 Includes Group’s proportionate share in PPM South Africa and the Asia asset management joint ventures.
14 For our asset management business the level of funds managed on behalf of third parties, which are not therefore recorded on the balance sheet, is a driver of profitability. We therefore analyse the movement in the funds under management each period, focusing between those which are external to the Group and those held by the insurance business and included on the Group balance sheet. This is analysed in note II(b) of the Additional IFRS financial information.
15 Net inflows exclude Asia Money Market Fund (MMF) inflows of £403 million (2015: net inflows £1,065 million). External funds under management exclude Asia MMF balances of £7,714 million (2015: £6,006 million).
16 LIMRA/Secure Retirement Institute, US Individual Annuity Participants Report 3Q YTD 2016.
17 The 2015 comparative includes an adjustment to opening free surplus representing the impact of Solvency II at 1 January 2016, together with the effect of a reclassification between long-term business and other operations, as discussed in note 9(v) of the EEV basis results.
18 Net cash remitted by business units are included in the Holding company cash flow, which is disclosed in detail in note II(a) of Additional unaudited IFRS financial information.
19 Refer to the EEV basis supplementary information – Post-tax operating profit based on longer-term investment returns and Post-tax summarised consolidated income statement, for the breakdown of other income and expenditure, and other non-operating items.
20 The methodology and assumptions used in calculating the Solvency II capital results are set out in note II (c) of Additional unaudited financial information.
21 The UK Solvency II surplus represents the shareholder capital position excluding the contribution to Own Funds and the Solvency Capital Requirement from ring fenced with-profits funds and staff pension scheme in surplus. The estimated solvency position includes the impact of recalculated transitionals at the valuation date.
22 The with-profits Solvency II surplus represents the contribution to Own Funds and the Solvency Capital Requirement from ring fenced funds. The estimated solvency position includes the impact of recalculated transitionals at the valuation date.
23 Net of related charges to deferred acquisition costs and tax.
24 Operating profit after tax and non-controlling interests as percentage of opening shareholders’ funds.
25 Includes Unallocated surplus of with-profits business.
Nic Nicandrou Chief Financial Officer
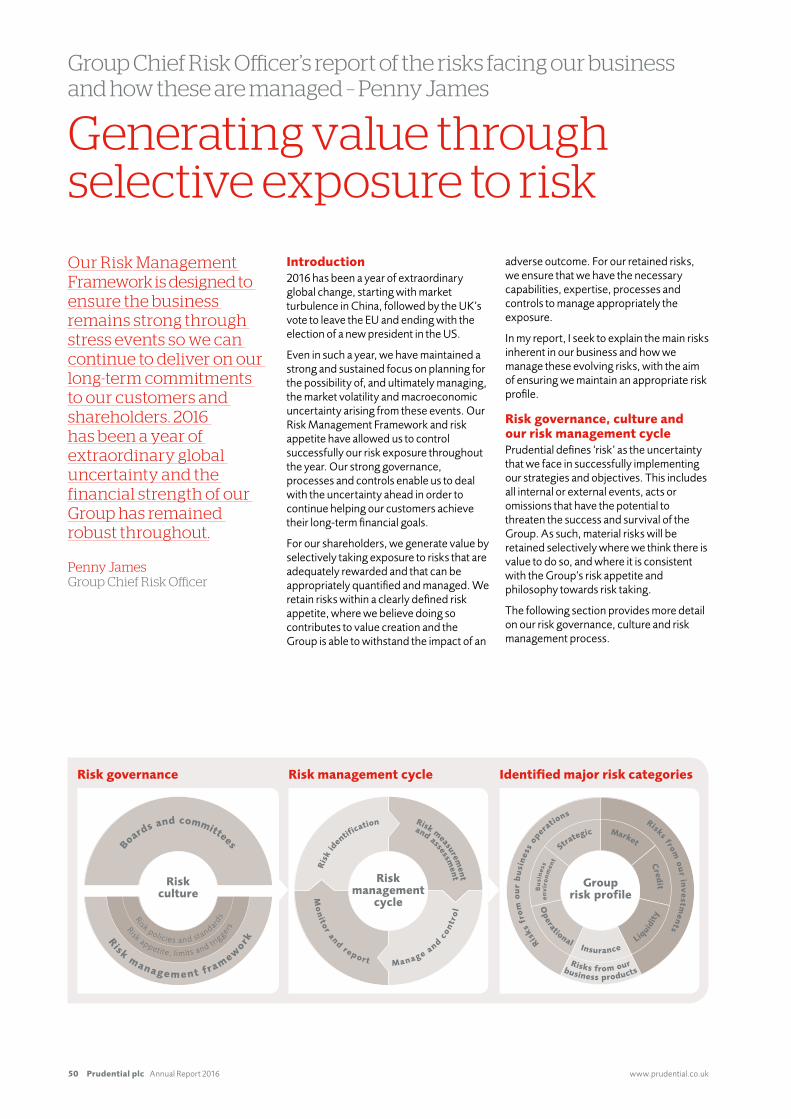
Prudential plc Annual Report 2016 www.prudential.co.uk50
Generating value through selective exposure to risk
Group Chief Risk Officer’s report of the risks facing our business and how these are managed – Penny James
Introduction2016 has been a year of extraordinary global change, starting with market turbulence in China, followed by the UK’s vote to leave the EU and ending with the election of a new president in the US.
Even in such a year, we have maintained a strong and sustained focus on planning for the possibility of, and ultimately managing, the market volatility and macroeconomic uncertainty arising from these events. Our Risk Management Framework and risk appetite have allowed us to control successfully our risk exposure throughout the year. Our strong governance, processes and controls enable us to deal with the uncertainty ahead in order to continue helping our customers achieve their long-term financial goals.
For our shareholders, we generate value by selectively taking exposure to risks that are adequately rewarded and that can be appropriately quantified and managed. We retain risks within a clearly defined risk appetite, where we believe doing so contributes to value creation and the Group is able to withstand the impact of an
adverse outcome. For our retained risks, we ensure that we have the necessary capabilities, expertise, processes and controls to manage appropriately the exposure.
In my report, I seek to explain the main risks inherent in our business and how we manage these evolving risks, with the aim of ensuring we maintain an appropriate risk profile.
Risk governance, culture and our risk management cyclePrudential defines ‘risk’ as the uncertainty that we face in successfully implementing our strategies and objectives. This includes all internal or external events, acts or omissions that have the potential to threaten the success and survival of the Group. As such, material risks will be retained selectively where we think there is value to do so, and where it is consistent with the Group’s risk appetite and philosophy towards risk taking.
The following section provides more detail on our risk governance, culture and risk management process.
Our Risk Management Framework is designed to ensure the business remains strong through stress events so we can continue to deliver on our long-term commitments to our customers and shareholders. 2016 has been a year of extraordinary global uncertainty and the financial strength of our Group has remained robust throughout.
Penny James Group Chief Risk Officer
Risk governance Risk management cycle Identified major risk categories
Boards and committees
Risk management framew
ork
Risk appetite, limits and triggers
Risk policies and standards
Riskculture
Ris
k id
entif
ication Risk measurement
and assessment
Manage and con
tro
l
Mo
nito
r and report
Riskmanagement
cycle
Risks from o
ur in
ve
stmen
ts
Risk
s fr
om
ou
r b
usi
nes
s op
eratio
ns
InsuranceLiq
uidi
ty
Cred
it
Strategic
Op
erational
Market
Risks from ourbusiness products
en
vir
on
men
t
Bu
sin
ess
Grouprisk profile
www.prudential.co.uk� Annual�Report�2016 Prudential plc 51
02Strategicreport
Risk governance Our risk governance comprises the organisational structures, reporting relationships, delegation of authority, roles and responsibilities, and risk policies that the Group head office and the business units establish to make decisions and control their activities on risk-related matters. This encompasses individuals, Group-wide functions and committees involved in the management of risk.
Risk committees and governance structureOur Risk governance structure is led by the Group’s Risk Committee, supported by independent non-executives on risk committees of major subsidiaries. These committees monitor the development of the risk management framework, and the Group’s risk appetites, limits, and policies as well as its risk culture. We have in place a comprehensive risk management cycle to identify, measure, manage and monitor our risk exposures.
In addition to the risk committees mentioned, there are various executive risk forums to ensure risk issues are shared and considered across the Group. These are led by the Group Executive Risk Committee which is supported by a number of specific committees including in relation to security and information security where specialist skills are required.
Risk Management Framework The Group’s Risk Management Framework has been developed to monitor and manage the risk of the business at all levels and is owned by the Board. The aggregate Group exposure to the key risk drivers is monitored and managed by the Group Risk function whose responsibility it is to review, assess and report on the Group’s risk exposure and solvency position from the Group economic, regulatory and ratings perspectives.
The Framework requires that all our businesses and functions establish processes for identifying, evaluating and managing the key risks faced by the Group – the ‘Risk Management Cycle’ (see below) and is based on the concept of the ‘three lines of defence’, comprising risk taking and management, risk control and oversight, and independent assurance. A major part of the Risk Management Cycle is the annual assessment of the Group’s risks which are considered key. These key risks range from risks associated with the economic, market, political and regulatory environment; those that we assume when writing our insurance products and by virtue of the investments we hold; and those that are inherent in our business model and its operation. This is used to inform risk reporting to the risk committees and the Board for the year.
Risk appetite, limits and triggersThe extent to which we are willing to take risk in the pursuit of our objective to create shareholder value is defined by a number of risk appetite statements, operationalised through measures such as limits, triggers and indicators. The Group risk appetite is approved by the Board and is set with reference to economic and regulatory capital, liquidity and earnings volatility. The Group risk appetite is aimed at ensuring that we take an appropriate level of aggregate risk and covers all risks to shareholders, including those from participating and third party business. We have no appetite for material losses (direct or indirect) suffered as a result of failing to develop, implement and monitor appropriate controls to manage operational risks. Group limits operate within the risk appetite to constrain the material risks, while triggers and indicators provide further constraint and ensure escalation. The Group Chief Risk Officer determines the action to be taken upon any breaches.
The Group Risk function is responsible for reviewing the scope and operation of these measures at least annually, to determine that they remain relevant. The Board approves all changes made to the Group’s Risk Appetite Framework. We define and monitor aggregate risk limits based on financial and non-financial stresses for our earnings volatility, liquidity and capital requirements.
Earnings volatility The objectives of the aggregate risk limits seek to ensure that:
— The volatility of earnings is consistent with the expectations of stakeholders;
— The Group has adequate earnings (and cash flows) to service debt, expected dividends and to withstand unexpected shocks; and
— Earnings (and cash flows) are managed properly across geographies and are consistent with funding strategies.
The two measures used to monitor the volatility of earnings are IFRS operating profit and EEV operating profit, although IFRS and EEV total profits are also considered.
Liquidity The objective is to ensure that the Group is able to generate sufficient cash resources to meet financial obligations as they fall due in business as usual and stressed scenarios. Risk appetite with respect to liquidity risk is measured using a Liquidity Coverage Ratio which considers the sources of liquidity versus liquidity requirements under stress scenarios.
Capital requirements The limits aim to ensure that:
— The Group meets its internal economic capital requirements;
— The Group achieves its desired target rating to meet its business objectives; and
— Supervisory intervention is avoided.
The two measures used at the Group level are Solvency II capital requirements and internal economic capital requirements. In addition, capital requirements are monitored on local statutory bases.
The Group Risk Committee is responsible for reviewing the risks inherent in the Group’s business plan and for providing the Board with input on the risk/reward trade-offs implicit therein. This review is supported by the Group Risk function, which uses submissions from our local business units to calculate the Group’s aggregated position (allowing for diversification effects between local business units) relative to the aggregate risk limits.
Risk policiesThese set out the specific requirements which cover the fundamental principles for risk management within the Group Risk Framework. Policies are designed to give some flexibility so that business users can determine how best to comply with policies based on their local expertise.
There are core risk policies for credit, market, insurance, liquidity and operational risks and a number of internal control policies covering internal model risk, underwriting, dealing controls and tax risk management. They form part of the Group Governance Manual, which was developed to make a key contribution to the sound system of internal control that we maintain in line with the UK Corporate Governance Code and the Hong Kong Code on Corporate Governance Practices. Group Head Office and business units must confirm that they have implemented the necessary controls to evidence compliance with the Group Governance Manual on an annual basis.
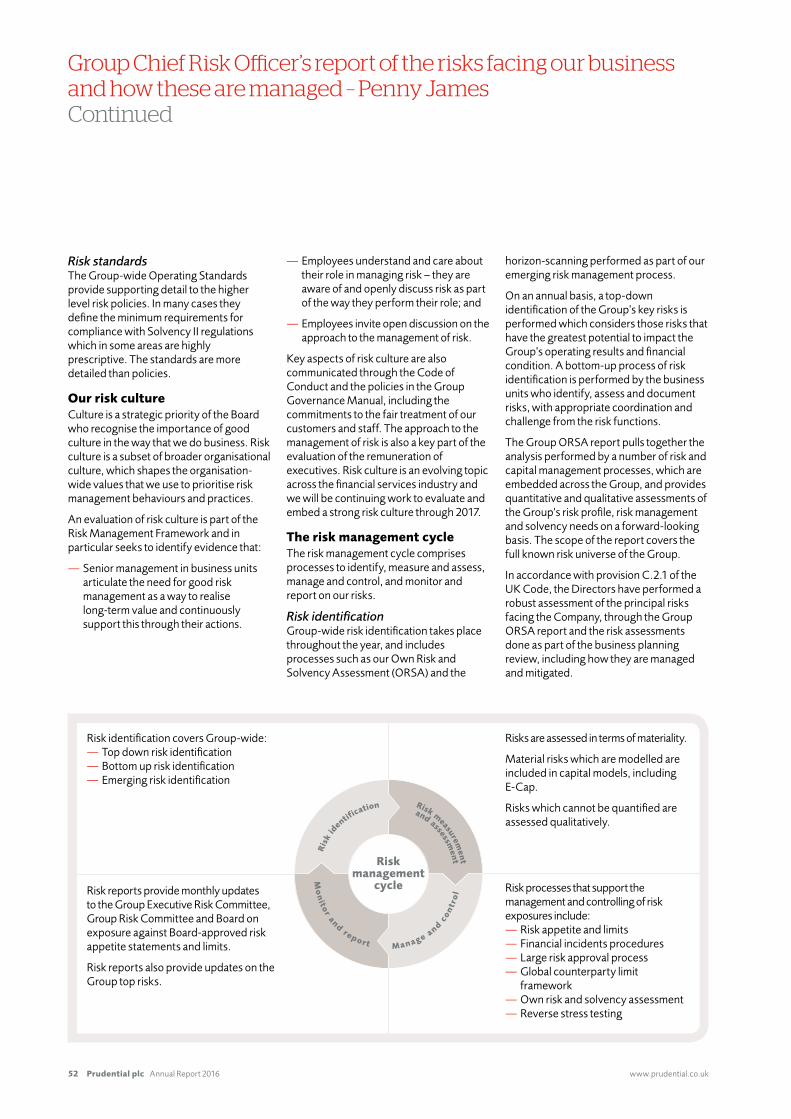
Prudential plc Annual Report 2016 www.prudential.co.uk52
Risk standardsThe Group-wide Operating Standards provide supporting detail to the higher level risk policies. In many cases they define the minimum requirements for compliance with Solvency II regulations which in some areas are highly prescriptive. The standards are more detailed than policies.
Our risk cultureCulture is a strategic priority of the Board who recognise the importance of good culture in the way that we do business. Risk culture is a subset of broader organisational culture, which shapes the organisation-wide values that we use to prioritise risk management behaviours and practices.
An evaluation of risk culture is part of the Risk Management Framework and in particular seeks to identify evidence that:
— Senior management in business units articulate the need for good risk management as a way to realise long-term value and continuously support this through their actions.
— Employees understand and care about their role in managing risk – they are aware of and openly discuss risk as part of the way they perform their role; and
— Employees invite open discussion on the approach to the management of risk.
Key aspects of risk culture are also communicated through the Code of Conduct and the policies in the Group Governance Manual, including the commitments to the fair treatment of our customers and staff. The approach to the management of risk is also a key part of the evaluation of the remuneration of executives. Risk culture is an evolving topic across the financial services industry and we will be continuing work to evaluate and embed a strong risk culture through 2017.
The risk management cycleThe risk management cycle comprises processes to identify, measure and assess, manage and control, and monitor and report on our risks.
Risk identificationGroup-wide risk identification takes place throughout the year, and includes processes such as our Own Risk and Solvency Assessment (ORSA) and the
horizon-scanning performed as part of our emerging risk management process.
On an annual basis, a top-down identification of the Group’s key risks is performed which considers those risks that have the greatest potential to impact the Group’s operating results and financial condition. A bottom-up process of risk identification is performed by the business units who identify, assess and document risks, with appropriate coordination and challenge from the risk functions.
The Group ORSA report pulls together the analysis performed by a number of risk and capital management processes, which are embedded across the Group, and provides quantitative and qualitative assessments of the Group’s risk profile, risk management and solvency needs on a forward-looking basis. The scope of the report covers the full known risk universe of the Group.
In accordance with provision C.2.1 of the UK Code, the Directors have performed a robust assessment of the principal risks facing the Company, through the Group ORSA report and the risk assessments done as part of the business planning review, including how they are managed and mitigated.
Group Chief Risk Officer’s report of the risks facing our business and how these are managed – Penny James Continued
Risk reports provide monthly updates to the Group Executive Risk Committee, Group Risk Committee and Board on exposure against Board-approved risk appetite statements and limits.
Risk reports also provide updates on the Group top risks.
Risks are assessed in terms of materiality.
Material risks which are modelled are included in capital models, including E-Cap.
Risks which cannot be quantified are assessed qualitatively.
Risk processes that support the management and controlling of risk exposures include:
— Risk appetite and limits — Financial incidents procedures — Large risk approval process — Global counterparty limit framework
— Own risk and solvency assessment — Reverse stress testing
Risk identification covers Group-wide: — Top down risk identification — Bottom up risk identification — Emerging risk identification
Ris
k id
entif
ication Risk measurement
and assessment
Manage and con
tro
l
Mo
nito
r and report
Riskmanagement
cycle
www.prudential.co.uk� Annual�Report�2016 Prudential plc 53
02Strategicreport
Reverse stress testing, which requires us to work backwards from an assumed point of business model failure, is another tool that helps us to identify the key risks and scenarios that may materially impact the Group.
Our emerging risk management process identifies potentially material risks which have a high degree of uncertainty around timing, magnitude and propensity to evolve. The Group holds emerging risk sessions over the year to identify emerging risks which includes input from local subject matter and industry experts. We maintain contacts with thought leaders and peers to benchmark and refine our process.
The risk profile is a key output from the risk identification and risk measurement processes, and is used as a basis for setting Group-wide limits, management information, assessment of solvency needs, and determining appropriate stress and scenario testing. The risk identification processes support the creation of our annual set of key risks, which are then given enhanced management and reporting focus.
Risk measurement and assessmentAll identified risks are assessed based on an appropriate methodology for that risk. All quantifiable risks which are material and mitigated by holding capital are modelled
in the Group’s internal model, which is used to determine capital requirements under Solvency II and our own economic capital basis. Governance arrangements are in place to support the internal model, including independent validation and process and controls around model changes and limitations.
Risk management and controlThe control procedures and systems established within the Group are designed to manage reasonably the risk of failing to meet business objectives and are detailed in the Group risk policies. This can of course only provide reasonable and not absolute assurance against material misstatement or loss. They focus on aligning the levels of risk taking with the achievement of business objectives.
The management and control of risks are set out in the Group risk policies, and form part of the holistic risk management approach under the Group’s ORSA. These risk policies define:
— The Group’s risk appetite in respect of material risks, and the framework under which the Group’s exposure to those risks is limited;
— The processes to enable Group senior management to effect the measurement
and management of the Group material risk profile in a consistent and coherent way; and
— The flows of management information required to support the measurement and management of the Group material risk profile and to meet the needs of external stakeholders.
The methods and risk management tools we employ to mitigate each of our major categories of risks are detailed in section 4 below.
Risk monitoring and reportingThe identification of the Group’s key risks informs the management information received by the Group risk committees and the Board. Risk reporting of key exposures against appetite is also included, as well as ongoing developments in other key and emerging risks.
Summary risksThe table below is a summary of the key risks facing the Group, which can be grouped into those which apply to us because of the global environment in which we operate, and those which arise as a result of the business that we operate – including risks arising from our investments, the nature of our products and from our business operations.
‘Macro’ risksSome of the risks that we are exposed to are necessarily broad given the external influences which may impact on the Group. These risks include:
Global economic conditionsChanges in global economic conditions can impact us directly; for example by leading to poor returns on our investments and increasing the cost of promises we have made to our customers. They can also have an indirect impact; for example economic pressures could lead to decreased savings, reducing the propensity for people to buy our products. Global economic conditions may also impact on regulatory risk for the Group by changing prevailing political attitudes towards regulation.
Geopolitical riskThe geopolitical environment is increasingly uncertain with political upheaval in the UK, the US and the Eurozone. Uncertainty in these regions, combined with conflict in the Middle East and increasing tensions in east Asia underline that geopolitical risks are truly global and their potential impacts are wide-ranging; for example through increased regulatory risk. The geopolitical and economic environments are increasingly closely linked, and changes in the political arena may have direct or indirect impacts on our Group.
Digital disruptionThe emergence of advance technologies such as artificial intelligence and block chain is providing an impetus for companies to rethink their existing operating models and how they interact with their customers. Prudential is embracing the opportunities presented by digitalisation and is closely monitoring any risks which arise.
Prudential plc Annual Report 2016 www.prudential.co.uk54
Risks from our investments Risks from our products Risks from our business operations
Global economic conditions – see above – have a large impact on those risks from our investments.
Our fund investment performance is a fundamental part of our business in providing appropriate returns for our customers and shareholders, and so is an important area of focus.
Credit riskIs the potential for reduced value of our investments due to the uncertainty around investment returns arising from the potential for defaults of our investment counterparties.
Invested credit risk arises from our asset portfolio. We increase sector focus where necessary.
The assets backing the UK and Jackson’s annuity business mean credit risk is a significant focus for the Group.
Market riskIs the potential for reduced value of our investments resulting from the volatility of asset prices as driven by fluctuations in equity prices, interest rates, foreign exchange rates and property prices. In our Asia business, our main market risks arise from the value of fees from our fee-earning products.
In the US, Jackson’s fixed and variable annuity books are exposed to a variety of market risks due to the assets backing these policies.
In the UK, exposure relates to the valuation of the proportion of the with-profits fund’s future profits which is transferred to the shareholders (future transfers), which is dependent on equity, property and bond values.
M&G invests in a broad range of asset classes and its income is subject to the price volatility of global financial and currency markets.
Liquidity riskIs the risk of not having sufficient liquid assets to meet our obligations as they fall, and incorporates the risk arising from funds composed of illiquid assets. It results from a mismatch between the liquidity profile of assets and liabilities.
Insurance risksThe nature of the products offered by the Group exposes it to insurance risks, which are a significant part of our overall risk profile.
The insurance risks that we are exposed to by virtue of our products include longevity risk (policyholders living longer than expected); mortality risk (policyholders with life protection dying); morbidity risk (policyholders with health protection becoming ill) and persistency risk (customers lapsing their policies).
From our health protection products, increases in the costs of claims (including the level of medical expenses) increasing over and above price inflation (claim inflation) is another risk.
The processes that determine the price of our products and reporting the results of our long-term business operations require us to make a number of assumptions. Where experience deviates from these assumptions our profitability may be impacted.
Across our business units, persistency and morbidity risks are among the largest insurance risks for our Asia business given our strong focus on health protection products in the region.
For the UK and Jackson, the most significant insurance risk is longevity risk driven by their annuity businesses.
Operational risksAs a Group, we are dependent on the appropriate and secure processing of a large number of transactions by our people, IT infrastructure and outsourcing partners, which exposes us to operational risks and reputational risks.
Information security risk is a significant consideration within operational risk, including both the risk of malicious attack on our systems as well as risks relating to data security and integrity and network disruption. The size of Prudential’s IT infrastructure and network, our move toward digitisation and the increasing number of high-profile cyber security incidents across industries means that this will continue to be an area of high focus.
Regulatory riskWe also operate under the ever-evolving requirements set out by diverse regulatory and legal regimes (including tax), as well as utilising a significant number of third parties to distribute products and to support business operations; all of which add to the complexity of the operating model if not properly managed.
The number of regulatory changes under way across Asia, in particular those focusing on consumer protection means that regulatory change in the region is also considered a key risk.
Both Jackson and the UK operate in highly regulated markets. Regulatory reforms could materially impact our businesses, and regulatory focus continues to be high.
Group Chief Risk Officer’s report of the risks facing our business and how these are managed – Penny James Continued
www.prudential.co.uk� Annual�Report�2016 Prudential plc 55
02Strategicreport
Further risk informationIn reading the sections below, it is useful to understand that there are some risks that our policyholders assume by virtue of the nature of their products, and some risks that the Company and its shareholders assume. Examples of the latter include those risks arising from assets held directly by and for the Company, or the risk that policyholder funds are exhausted. This report is focused mainly on risks to the shareholder, but will include those which arise indirectly through our policyholder exposures.
Risks from our investmentsMarket riskThe main drivers of market risk in the Group are:
— Investment risk (including equity and property risk);
— Interest rate risk; and
— Given the geographical diversity of our business, foreign exchange risk.
With respect to investment risk, equity and property risk arises from our holdings of equity and property investments, the prices of which can change depending on market conditions.
The valuation of our assets (particularly the bonds that we invest in) and liabilities are also dependent on market interest rates and exposes us to the risk of those moving in a way that is detrimental for us.
Given our global business, we earn our profits and hold assets in various currencies. The translation of those into our reporting currency exposes us to movements in foreign exchange rates.
Our main investment risk exposure arises from the portion of the profits from the UK with-profits fund to which we are entitled to receive; the value of the future fees from our fee-earning products in our Asia business; and from the asset returns backing Jackson’s variable annuities business.
Our interest rate risk is driven in the UK by our need to match our assets and liabilities; from the guarantees of some non unit-linked investment products in Asia; and the cost of guarantees in Jackson’s fixed, fixed index and variable annuity business. The methods that we use to manage and mitigate our market risks include the following:
— Our market risk policy;
— Risk appetite statements, limits and triggers that we have in place;
— The monitoring and oversight of market risks through the regular reporting of management information;
— Our asset and liability management programmes;
— Use of derivative programmes, including, for example, interest rate swaps, options and hybrid options for interest rate risk;
— Regular deep dive assessments; and
— Use of currency hedging.
Investment risk (Audited)In the UK business, our main investment risk arises from the assets held in the with-profits funds. Although this is mainly held by our policyholders, a proportion of the fund’s profit (one tenth) is transferred to us and so our investment exposure relates to the future valuation of that proportion (future transfers). This investment risk is driven mainly by equities in the fund, although there is some risk associated with other investments such as property and bonds. Some hedging to protect from a reduction in the value of these future transfers against falls in equity prices is performed outside the fund using derivatives. The with-profits funds’ large Solvency II own funds – estimated at £8.4 billion as at 31 December 2016 (31 December 2015: £7.6 billion) – helps to protect against market fluctuations and helps the fund to maintain appropriate solvency levels. The with-profits funds’ Solvency II own funds are partially protected against falls in equity markets through an active hedging programme within the fund.
In Asia, our shareholder exposure to equity price movements results from unit-linked products, where our fee income is linked to the market value of the funds under management. Further exposure arises from with-profits businesses where bonuses declared are broadly based on historical and current rates of return on equity.
In Jackson, investment risk arises from the assets backing customer policies. In the case of spread-based business, including fixed annuities, these assets are generally bonds, and shareholder exposure comes from the minimum returns needed to meet the guaranteed rates that we offer to policyholders. For our variable annuity business, these assets include both equities and bonds. In this case, the main risk to the shareholder comes from the guaranteed benefits that can be included as part of these products. Our exposure to this kind of situation is reduced by using a derivative hedging programme, as well as through the use of reinsurance to pass on the risk to third-party reinsurers.
Interest rate risk(Audited)While long-term interest rates in advanced economies have broadly increased since mid-2016, they remain close to historical lows. Some products that we offer are sensitive to movements in interest rates. We have already taken a number of actions
to reduce the risk to the in-force business, as well as re-pricing and restructuring new business offerings in response to these historically low interest rates. Nevertheless, we still retain some sensitivity to interest rate movements.
Interest rate risk arises in our UK business from the need to match cash payments to meet annuity obligations with the cash we receive from our investments. To minimise the impact on our profit, we aim to match the duration (a measure of interest rate sensitivity) of assets and liabilities as closely as possible and the position is monitored regularly. Under the Solvency II regulatory regime, additional interest rate risk results from the way the balance sheet is constructed, such as the requirement for us to include a risk margin. The UK business continually assesses the need for any derivatives in managing its interest rate sensitivity. The with-profits business is exposed to interest rate risk because of underlying guarantees in some of its products. Such risk is largely borne by the with-profits fund itself but shareholder support may be required in extreme circumstances where the fund has insufficient resources to support the risk.
In Asia, our exposure to interest rate risk arises from the guarantees of some non unit-linked investment products. This exposure exists because it may not be possible to hold assets which will provide cash payments to us which match exactly those payments we in turn need to make to policyholders – this is known as an asset and liability mismatch and although it is small and appropriately managed, it cannot be eliminated.
Jackson is exposed to interest rate risk in its fixed, fixed index and variable annuity books. Movements in interest rates can impact on the cost of guarantees in these products, in particular the cost of guarantees may increase when interest rates fall. We actively monitor the level of sales of variable annuity products with guaranteed living benefits, and together with the risk limits we have in place this helps us to ensure that we are comfortable with the interest rate and market risks we incur as a result. The Jackson hedging programme in place includes hybrid derivatives to protect us from a combined fall in interest rates and equity markets since Jackson is exposed to the combination of these market movements.
Foreign exchange risk(Audited)The geographical diversity of our businesses means that we have some exposure to the risk of exchange rate fluctuations. Our operations in the US and Asia, which represent a large proportion of our operating profit and shareholders’ funds, generally write policies and invest in assets in local currencies. Although this limits the effect of exchange rate
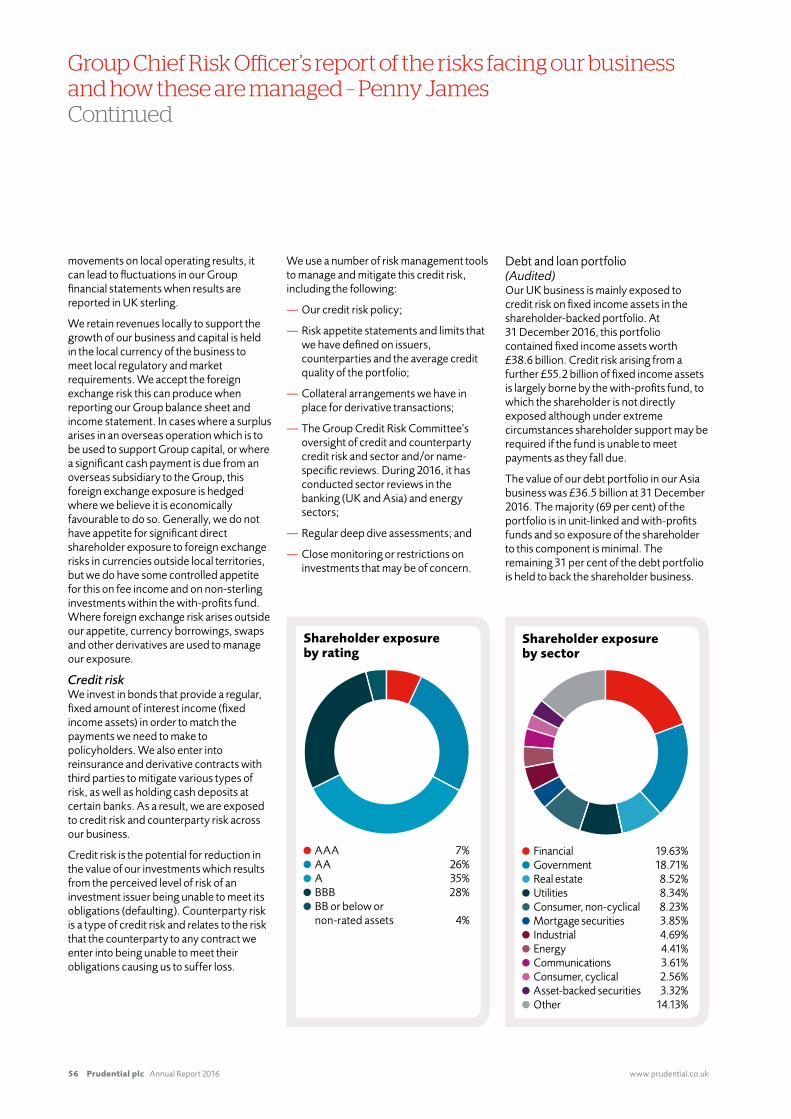
Prudential plc Annual Report 2016 www.prudential.co.uk56
movements on local operating results, it can lead to fluctuations in our Group financial statements when results are reported in UK sterling.
We retain revenues locally to support the growth of our business and capital is held in the local currency of the business to meet local regulatory and market requirements. We accept the foreign exchange risk this can produce when reporting our Group balance sheet and income statement. In cases where a surplus arises in an overseas operation which is to be used to support Group capital, or where a significant cash payment is due from an overseas subsidiary to the Group, this foreign exchange exposure is hedged where we believe it is economically favourable to do so. Generally, we do not have appetite for significant direct shareholder exposure to foreign exchange risks in currencies outside local territories, but we do have some controlled appetite for this on fee income and on non-sterling investments within the with-profits fund. Where foreign exchange risk arises outside our appetite, currency borrowings, swaps and other derivatives are used to manage our exposure.
Credit riskWe invest in bonds that provide a regular, fixed amount of interest income (fixed income assets) in order to match the payments we need to make to policyholders. We also enter into reinsurance and derivative contracts with third parties to mitigate various types of risk, as well as holding cash deposits at certain banks. As a result, we are exposed to credit risk and counterparty risk across our business.
Credit risk is the potential for reduction in the value of our investments which results from the perceived level of risk of an investment issuer being unable to meet its obligations (defaulting). Counterparty risk is a type of credit risk and relates to the risk that the counterparty to any contract we enter into being unable to meet their obligations causing us to suffer loss.
We use a number of risk management tools to manage and mitigate this credit risk, including the following:
— Our credit risk policy;
— Risk appetite statements and limits that we have defined on issuers, counterparties and the average credit quality of the portfolio;
— Collateral arrangements we have in place for derivative transactions;
— The Group Credit Risk Committee’s oversight of credit and counterparty credit risk and sector and/or name-specific reviews. During 2016, it has conducted sector reviews in the banking (UK and Asia) and energy sectors;
— Regular deep dive assessments; and
— Close monitoring or restrictions on investments that may be of concern.
Debt and loan portfolio(Audited)Our UK business is mainly exposed to credit risk on fixed income assets in the shareholder-backed portfolio. At 31 December 2016, this portfolio contained fixed income assets worth £38.6 billion. Credit risk arising from a further £55.2 billion of fixed income assets is largely borne by the with-profits fund, to which the shareholder is not directly exposed although under extreme circumstances shareholder support may be required if the fund is unable to meet payments as they fall due.
The value of our debt portfolio in our Asia business was £36.5 billion at 31 December 2016. The majority (69 per cent) of the portfolio is in unit-linked and with-profits funds and so exposure of the shareholder to this component is minimal. The remaining 31 per cent of the debt portfolio is held to back the shareholder business.
Group Chief Risk Officer’s report of the risks facing our business and how these are managed – Penny James Continued
Shareholder exposure by rating
AAA 7% AA 26% A 35% BBB 28% BB or below or non-rated assets 4%
Shareholder exposure by sector
Financial 19.63% Government 18.71% Real estate 8.52% Utilities 8.34% Consumer, non-cyclical 8.23% Mortgage securities 3.85% Industrial 4.69% Energy 4.41% Communications 3.61% Consumer, cyclical 2.56% Asset-backed securities 3.32% Other 14.13%
www.prudential.co.uk� Annual�Report�2016 Prudential plc 57
02Strategicreport
Credit risk also arises in the general account of the Jackson business, where £40.7 billion of fixed income assets are held to support shareholder liabilities including those from our fixed annuities, fixed index annuities and life insurance products.
The shareholder-owned debt and loan portfolio of the Group’s asset management business of £2.3 billion as at 31 December 2016 mostly belongs to our Prudential Capital (PruCap) operations.
Certain sectors have been under pressure during 2016, including the European banking sector. Most of the focus on the latter was around UK banks due to Brexit concerns, Italian banks and certain banks at risk of fines for the mis-selling of mortgage securities leading up to the 2008 financial crisis. We subject these sectors to ongoing monitoring and regular management information reporting to the Group’s risk committees. Certain sectors are also subject to our watch list and early warning indicator monitoring processes.
Further details of the composition and quality of our debt portfolio, and exposure to loans, can be found in the IFRS financial statements.
Group sovereign debt (Audited)We also invest in bonds issued by national governments, that are traditionally seen as safer investments. This sovereign debt represented 19 per cent or £17.1 billion of the shareholder debt portfolio as at 31 December 2016 (31 December 2015: 17 per cent or £12.8 billion). 4 per cent of this was rated AAA and 92 per cent was considered investment grade (31 December 2015: 94 per cent investment grade). At 31 December 2016, the Group’s shareholder holding in Eurozone sovereign debt1 was £767 million. 75 per cent of this was rated AAA (31 December 2015: 75 per cent rated AAA). We do not have any sovereign debt investments in Greece.
The particular risks associated with holding sovereign debt are detailed further in our disclosures on risk factors.
The exposures held by the shareholder-backed business and with-profits funds in sovereign debt securities at 31 December 2016 are given in Note C3.2(f) of the Group’s IFRS financial statements.
Bank debt exposure and counterparty credit risk (Audited)Our exposure to banks is a key part of our core investment business, as well as being important for the hedging and other activities we undertake to manage our various financial risks. Given the importance of our relationship with our banks, exposure to the sector is a considered a key risk for the Group with an appropriate level of management
information provided to the Group’s Risk Committees and the Board.
The exposures held by the shareholder-backed business and with-profits funds in bank debt securities at 31 December 2016 are given in Note C3.2(f) of the Group’s IFRS financial statements.
Our exposure to derivative counterparty and reinsurance counterparty credit risk is managed using an array of risk management tools, including a comprehensive system of limits.
Where appropriate, we reduce our exposure, buy credit protection or use additional collateral arrangements to manage our levels of counterparty credit risk.
At December 2016, shareholder exposures by rating and sector are shown below:
— 96 per cent of the shareholder portfolio is investment grade rated. In particular, 53 per cent of the portfolio is rated A- and above; and
— The Group’s shareholder portfolio is well diversified: no individual sector makes up more than 10 per cent of the total portfolio (excluding the financial and sovereign sectors).
Liquidity riskOur liquidity risk arises from the need to have sufficient liquid assets to meet policyholder and third-party payments as they fall due. This incorporates the risk arising from funds composed of illiquid assets and results from a mismatch between the liquidity profile of assets and liabilities. Liquidity risk may arise, for example, where external capital is unavailable at sustainable cost, increased liquid assets are required to be held as collateral under derivative transactions or redemption requests are made against Prudential issued illiquid funds.
We have significant internal sources of liquidity, which are sufficient to meet all of our expected cash requirements for at least 12 months from the date the financial statements are approved, without having to resort to external sources of funding. In total, the Group has £2.6 billion of undrawn committed facilities that we can make use of, expiring in 2020. We have access to further liquidity by way of the debt capital markets, and also have in place an unlimited commercial paper programme and have maintained a consistent presence as an issuer in this market for the last decade.
Liquidity uses and sources are assessed at a Group and business unit level under both base case and stressed assumptions. We calculate a Liquidity Coverage Ratio (LCR) under stress scenarios as one measure of our liquidity risk, and this ratio and the liquidity resources available to us are regularly monitored and are assessed to be sufficient.
Our risk management and mitigation of liquidity risk include:
— Our liquidity risk policy;
— The risk appetite statements, limits and triggers that we have in place;
— The monitoring of liquidity risk we perform through regular management information to committees and the Board;
— Our Liquidity Risk Management Plan, which includes details of the Group Liquidity Risk Framework as well as gap analysis of our liquidity risks and the adequacy of our available liquidity resources under normal and stressed conditions;
— Regular stress testing;
— Our established contingency plans and identified sources of liquidity;
— Our ability to access the money and debt capital markets;
— Regular deep dive assessments; and
— The access we enjoy to external sources of finance through committed credit facilities.
Risks from our productsInsurance riskInsurance risk makes up a significant proportion of our overall risk exposure. The profitability of our businesses depends on a mix of factors including levels of, and trends in, mortality (policyholders dying), morbidity (policyholders becoming ill) and persistency (customers lapsing their policies), and increases in the costs of claims, including the level of medical expenses increases over and above price inflation (claim inflation).
The key drivers of the Group’s insurance risks are persistency and morbidity risk in the Asia business; and longevity risk in the Jackson and Prudential UK & Europe businesses.
We manage and mitigate our insurance risk using the following:
— Our insurance and underwriting risk policies;
— The risk appetite statements, limits and triggers we have in place;
— Using longevity, morbidity and persistency assumptions that reflect recent experience and expectation of future trends, and industry data and expert judgement where appropriate;
— We use reinsurance to mitigate longevity and morbidity risks;
— Morbidity risk is also mitigated by appropriate underwriting when policies are issued and claims are received;
Prudential plc Annual Report 2016 www.prudential.co.uk58
Group Chief Risk Officer’s report of the risks facing our business and how these are managed – Penny James Continued
— Persistency risk is mitigated through the quality of sales processes and with initiatives to increase customer retention;
— Medical expense inflation risk mitigated through product re-pricing; and
— Regular deep dive assessments.
Longevity risk is an important element of our insurance risks for which we need to hold a large amount of capital under Solvency II regulations. Longevity reinsurance is a key tool for us in managing our risk. The enhanced pensions freedoms introduced in the UK during 2015 greatly reduced the demand for retail annuities and further liberalisation is anticipated. Although we have scaled down our participation in the annuity market by reducing new business acquisition, given our significant annuity portfolio the assumptions we make about future rates of improvement in mortality rates remain key to the measurement of our insurance liabilities and to our assessment of any reinsurance transactions.
We continue to conduct research into longevity risk using both experience from our annuity portfolio and industry data. Although the general consensus in recent years is that people are living longer, there is considerable volatility in year-on-year longevity experience, which is why we need expert judgement in setting our longevity basis.
Our morbidity risk is mitigated by appropriate underwriting when policies are issued and claims are received. Our morbidity assumptions reflect our recent experience and expectation of future trends for each relevant line of business.
In Asia, we write significant volumes of health protection business, and so a key assumption for us is the rate of medical inflation, which is often in excess of general price inflation. There is a risk that the expenses of medical treatment increase more than we expect, so the medical claim cost passed on to us is higher than anticipated. Medical expense inflation risk is best mitigated by retaining the right to re-price our products each year and by having suitable overall claim limits within our policies, either limits per type of claim or in total across a policy.
Our persistency assumptions similarly reflect a combination of recent past experience for each relevant line of business and expert judgement, especially where a lack of relevant and credible experience data exists. Any expected change in future persistency is also reflected in the assumption. Persistency risk is mitigated by appropriate training and sales processes and managed locally post-sale through regular experience monitoring and the identification of common characteristics of business with high lapse rates. Where appropriate, we make allowance for the relationship (either assumed or historically observed), between persistency and investment returns and account for the resulting additional risk. Modelling this dynamic policyholder behaviour is particularly important when assessing the likely take-up rate of options embedded within certain products. The effect of persistency on our financial results can vary but mostly depends on the value of the product features and market conditions.
Risks from our business operationsOperational riskOperational risk is the risk of loss (or unintended gain or profit) arising from inadequate or failed internal processes, personnel and systems, or from external events. This includes employee error, model error, system failures, fraud or some other event which disrupts business processes.
We manage and mitigate our operational risk using the following:
— Operational risk and outsourcing and third-party supply policies;
— Corporate insurance programmes to limit the impact of operational risks;
— Scenario analysis for operational risk capital requirements, which focus on extreme, yet plausible, events;
— Internal and external review of cyber security capability; and
— Regular testing of elements of the disaster-recovery plan.
An important element of operational risk relates to compliance with changing regulatory requirements. The high rate of global regulatory change, in an already complex regulatory landscape, increases the risk of non-compliance due to a failure to identify, correctly interpret, implement and/or monitor regulations. Legislative developments over recent years, together with enhanced regulatory oversight and increased capability to issue sanctions, have resulted in a complex regulatory environment that may lead to breaches of varying magnitude if the Group’s business-as-usual operations are not compliant. As well as prudential regulation, we focus on conduct regulation, including regulations related to anti-money laundering, bribery and corruption, and sales practices. We have a particular focus on these regulations in newer/emerging markets.
The performance of core activities places reliance on the IT infrastructure that supports day-to-day transaction processing. Our IT environment must also be secure and we must address an increasing cyber risk threat as our digital footprint increases – see separate Cyber risk section below. The risk that our IT infrastructure does not meet these requirements is a key area of focus, particularly the risk that legacy IT infrastructure supporting core activities/processes affects business continuity or impacts on business growth.
As well as the above, other key areas of focus within operational risk include:
— The risk of a significant failure of a third-party outsourcing partner impacting critical services;
— The risk of trading or transaction errors having a material cost across Group;
— The risk that errors within models and user-developed applications used by the Group result in incorrect or inappropriate transactions being instructed;
— Departure of key persons or teams resulting in disruption to current and planned business activities;
— The risk that key people, processes and systems are unable to operate (thus impacting on the on-going operation of the business) due to a significant
www.prudential.co.uk� Annual�Report�2016 Prudential plc 59
02Strategicreport
unexpected external event; for example pandemic, terrorist attack, natural disaster, or political unrest;
— The risk that a significant project fails or partially fails to meet its objectives, leading to financial loss; and
— The risk of inadequate or inappropriate controls, governance structures or communication channels in place to support the desired culture and ensure that the business is managed in line with the core business values, within the established risk appetite and in alignment with external stakeholder expectations.
Global regulatory and political riskOur risk management and mitigation of regulatory and political risk includes the following:
— A Risk and Capital Plan that includes considerations of current strategies;
— Close monitoring and assessment of our business environment and strategic risks;
— Board strategy sessions that consider risk themes;
— A Systemic Risk Management Plan that details the Group’s strategy and Risk Management Framework; and
— A Recovery Plan covering corporate and risk governance for managing risks in a distressed environment, a range of recovery options, and scenarios to assess the effectiveness of these recovery options
In June 2016, the UK voted to leave the EU. The potential outcome of the negotiations on UK withdrawal and any subsequent negotiations on trade and access to major trading markets, including the single EU market, is currently highly uncertain.
The ongoing uncertainty and likelihood of a lengthy negotiation period may increase volatility in the markets where we operate, creating the potential for a general downturn in economic activity and for further or prolonged falls in interest rates in some jurisdictions due to easing of monetary policy and investor sentiment. We have several UK-domiciled operations, including Prudential UK and M&G, and these may be impacted by a UK withdrawal from the EU. However, our diversification by geography, currency, product and distribution should reduce some of the potential impact. Contingency plans were developed ahead of the referendum by business units and operations that may be immediately impacted by a vote to withdraw the UK from the EU, and these plans have been enacted since the referendum result.
The EU’s Solvency II directive came into effect on 1 January 2016; however, the UK’s vote to leave the EU has the potential to result in changes to future applicability of the regime in the UK. In September 2016, following the Brexit vote, the UK Treasury published terms of reference of its consultation into Solvency II to consider the options for British insurers and to assess the impact of the regime on the competitiveness of the UK insurance industry, the needs of UK consumers and the wider UK business economy. The outcome is likely to be dependent on the overall Brexit agreement reached between the UK and EU. Separately, the European Commission has commenced a review of some elements of the application of the Solvency II legislation with a particular focus on the Solvency Capital Requirement calculated using the standard formula.
National and regional efforts to curb systemic risk and promote financial stability are also underway in certain jurisdictions in which Prudential operates, including the Dodd-Frank Wall Street Reform and Consumer Protection Act in the US, and other European Union legislation related to the financial services industry.
There are a number of ongoing policy initiatives and regulatory developments that are having, and will continue to have, an impact on the way Prudential is supervised. These include addressing Financial Conduct Authority (FCA) reviews, ongoing engagement with the Prudential Regulation Authority (PRA), and the work of the Financial Stability Board (FSB) and standard-setting institutions such as the International Association of Insurance Supervisors (IAIS). Decisions taken by regulators, including those related to solvency requirements and capital allocation may have an impact on our business.
The IAIS’s Global Systematically Important Insurers (G-SII) regime form additional compliance considerations for us. Groups designated as a G-SIIs are subject to additional regulatory requirements, including enhanced group-wide supervision, effective resolution planning, development of a Systemic Risk Management Plan, a Recovery Plan and a Liquidity Risk Management Plan. Prudential’s designation as a G-SII was reaffirmed by the IAIS in November 2016, based on the updated methodology published in June 2016. Prudential is monitoring the development and potential impact of the policy measures and is continuing to engage with the PRA on the implications of the policy measures and Prudential’s designation as a G-SII. We continue to engage with the IAIS on developments in capital requirements for groups with G-SII designation.
The IAIS is also developing a Common Framework (ComFrame) which is focused on the supervision of Internationally Active Insurance Groups. ComFrame will establish a set of common principles and standards designed to assist regulators in addressing risks that arise from insurance groups with operations in multiple jurisdictions. As part of this, work is underway to develop a global Insurance Capital Standard that is intended to apply to Internationally Active Insurance Groups. Once the development of the Insurance Capital Standard (ICS) has been concluded, it is intended to replace the Basic Capital Requirement as the minimum group capital requirement for G-SIIs.
A consultation on the ICS was concluded in 2016 and the IAIS intends to publish an interim version of ICS in 2017. Further field testing, consultations and private reporting to group-wide supervisors on the interim version of the ICS are expected over the coming years. It is currently planned to be adopted as part of ComFrame by the IAIS in late 2019.
The IAIS’s Insurance Core Principles, which provide a globally-accepted framework for the supervision of the insurance sector and ComFrame evolution, are expected to create continued development in both prudential and conduct regulations over the next two to three years.
In the US, the Department of Labor proposal in April 2016 to introduce new fiduciary obligations for distributors of investment products to holders of regulated accounts, which could dramatically reshape the distribution of retirement products. Jackson’s strong relationships with distributors, history of product innovation and efficient operations should help mitigate any impacts.
The US National Association of Insurance Commissioners (NAIC) is currently conducting an industry consultation with the aim of reducing the complexity in the variable annuity statutory balance sheet and risk management. Following an industry quantitative impact study, changes have been proposed to the current framework; however, these are considered to be at an early stage of development. Jackson continues to be engaged in the consultation and testing process. The proposal is currently planned to be effective from 2018.
With the new US administration having taken office in January 2017, the potential uncertainty as to the timetable and status of these key US reforms has increased given preliminary indications from Washington. Our preparations to manage the impact of these reforms will continue until further clarification is provided.

Prudential plc Annual Report 2016 www.prudential.co.uk60
Group Chief Risk Officer’s report of the risks facing our business and how these are managed – Penny James Continued
In Asia, regulatory regimes are developing at different speeds, driven by a combination of global factors and local considerations. New requirements could be introduced in these and other regulatory regimes that challenge legal structures and current sales practices.
Cyber risk Cyber risk is an area of increased scrutiny for global regulators after a number of recent high profile attacks and data losses. The growing maturity and industrialisation of cyber-criminal capability, together with an increasing level of understanding of complex financial transactions by criminal groups are two reasons why risks to the financial services industry are increasing.
Given this, cyber security is seen as a key risk for the Group. Our current threat assessment is that, while we are not individually viewed as a compelling target for a direct cyber-attack, we are at risk of suffering attacks as a member of the global financial services industry, with potentially significant impact on business continuity, our customer relationship and our brand reputation.
The Board receives periodic updates on cyber risk management throughout the year. The current Group-wide Cyber Risk Management Strategy and the associated Group-wide Coordinated Cyber Defence Plan were approved by the Board in 2016.
The Cyber Risk Management Strategy includes three core objectives: to develop a comprehensive situational awareness of our business in cyberspace; to proactively engage cyber attackers to minimise harm to our business and to enable the business to grow confidently and safely in cyberspace.
The Cyber Defence Plan consists of a number of work-streams, including developing our ability to deal with incidents; alignment with our digital transformation strategy; and increasing cyber oversight and assurance to the Board.
Protecting our customers remains core to our business, and the successful delivery of the Cyber Defence Plan will reinforce our capabilities to continue doing so in cyberspace as we transition to a digital business.
Group functions work with each of the business units to address cyber risks locally within the national and regional context of each business, following the strategic direction laid out in the Cyber Risk Management Strategy and managed through the execution of the Cyber Defence Plan.
The Group Information Security Committee, which consists of senior executives from each of the businesses and meets on a regular basis, governs the execution of the Cyber Defence Plan and reports on delivery and cyber risks to the Group Executive Risk Committee. Both committees also receive regular operational management information on the performance of controls.
Viability statementIn accordance with provision C.2.2 of the UK code, the Directors have assessed the prospects of the Company and the Group for a period longer than the 12 months required by the going concern statement.
Period of assessmentThe Directors performed the assessment by reference to the three-year period to December 2019. Three years is considered an appropriate period as it represents the period covered by the detailed business plan that is prepared annually on a rolling three-year basis. In approving the business plan the Director’s review the Group’s projected performance with regards to profitability, cash generation and capital position, together with the parent company’s liquidity over this three-year period. As well as implementing the Group’s strategic objectives, this projection involves setting a number of economic and other assumptions that are inherently volatile over a much longer reporting
period. Such assumptions include foreign exchange rates, interest rates, economic growth rates and the impact on the business environment for events such as the exit of the United Kingdom from the European Union.
Although three years is regarded as an appropriate period for the assessment of the Group’s viability, the Directors regularly consider strategic matters that may affect the longer-term prospects of the Group. Further, the Group as a whole and each of its life assurance operations are subject to extensive regulation and supervision, which are designed primarily to reinforce the company’s management of its long-term solvency, liquidity and viability to ensure that it can continue to meet obligations to policyholders.
In particular, the Group and UK insurance subsidiaries are subject to the capital adequacy requirements of the European Union Solvency II regulatory basis as implemented by the Prudential Regulation Authority in the UK. Capital requirements for the Group’s other subsidiaries are also monitored on their local regulatory bases. In addition to these external capital metrics, the Group uses an internal economic capital assessment to monitor its capital requirements across the Group. Further details on the capital strength of the Group are provided on pages 47 and 48.
Assessment of risks over the periodAssessment of the risks to achieving the projected performance remains an integral part of the planning process. The Group’s risk teams identify key risks to the delivery of the plan and set out mitigating actions where applicable. The Group’s business activities and the factors likely to affect its future development, successful performance and position in the current economic climate are set out on pages 4 to 36. The risks facing the Group’s capital and liquidity positions and their sensitivities are referred to on pages 50 to 60.
www.prudential.co.uk� Annual�Report�2016 Prudential plc 61
02Strategicreport
Note1 ExcludesGroup’sproportionateshareinjointventuresand
unit-linkedassetsandholdingsofconsolidatedunittrustandsimilarfunds.
Penny James Group Chief Risk Officer
ForthepurposesofassessingtheGroup’sviability,theDirectorsfurtherconsideredthoseriskswheretheimpactofpossibleadverseexternaldevelopmentscouldbeofsuchspeedandseveritytopresentashocktotheGroup’sfinancialposition.Therisksfurtherconsidered,fromthosedetailedonpage54,are:marketrisk,creditrisk,liquidityriskandregulatoryrisk.
ToevaluatetheGroup’sresiliencetosignificantdeteriorationsinmarketandcreditconditionsandothershockevents,theserisksaregroupedtogetherintoseverebutplausiblescenarioswhicharethenappliedtotheassumptionsunderlyingthebusinessplan.Forexample,theimpactsofscenariosassumingadisorderlytransitiontoamorenormalisedinterestrateenvironmentandaninternationalrecessionwereconsideredinthepreparationofthemostrecentbusinessplan,togetherwiththeimpactonGroupliquidityofascenarioassumingtheclosureofshort-termdebtmarketsforthreemonths.Inaddition,theGroupconductsanannualreversestresstestwhichgivestheDirectorsanunderstandingofthemaximumresilienceoftheGrouptoextremelysevereadversescenarios.
Inconsideringthesescenariostheimpactsofmitigatingmanagementactionsdesignedtomaintainorrestorekeycapital,liquidityandsolvencymetricstotheGroup’sapprovedriskappetiteareconsidered.Inthescenariostested,sufficientactionswereavailabletomanagementtomaintaintheviabilityoftheGroupoverthethreeyearperiodunderassessment.
Theimpactonthebusinessofknownareasofregulatorychangewhosefinancialimplicationscanbereasonablyquantifiedisalsoconsideredaspartoftheplan.AswellasknownareasofregulatorychangetheGroupisexposedtotheriskofsuddenandunexpectedchangesinregulatoryrequirementsattheGroupandlocallevel.TheriskofregulatorychangeismitigatedbycapitalheldbytheGroupanditssubsidiariesinexcessofGroupandlocalregulatoryrequirements,theGroup’sabilitytogeneratesignificantcapitalannuallythroughitsoperationaldeliveryandtheavailabilityofcompensatingactionsdesignedtorestorekeycapitalandsolvencymetrics.
Conclusion on viabilityBasedonthisassessment,theDirectorshaveareasonableexpectationthattheCompanyandtheGroupwillbeabletocontinueinoperationandmeettheirliabilitiesastheyfalldueoverthethree-yearplanperiodtoDecember2019.
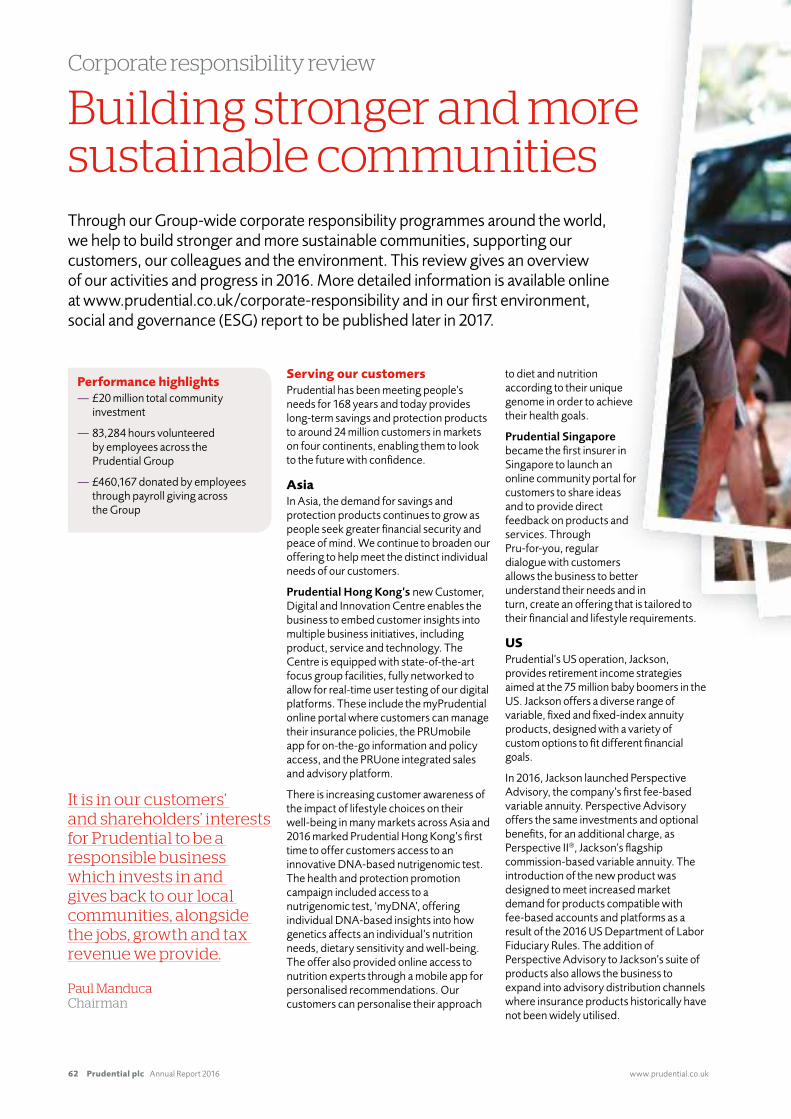
Prudential plc Annual Report 2016 www.prudential.co.uk62
Corporate responsibility review
Building stronger and more sustainable communities Through our Group-wide corporate responsibility programmes around the world, we help to build stronger and more sustainable communities, supporting our customers, our colleagues and the environment. This review gives an overview of our activities and progress in 2016. More detailed information is available online at www.prudential.co.uk/corporate-responsibility and in our first environment, social and governance (ESG) report to be published later in 2017.
Serving our customers Prudential has been meeting people’s needs for 168 years and today provides long-term savings and protection products to around 24 million customers in markets on four continents, enabling them to look to the future with confidence.
AsiaIn Asia, the demand for savings and protection products continues to grow as people seek greater financial security and peace of mind. We continue to broaden our offering to help meet the distinct individual needs of our customers.
Prudential Hong Kong’s new Customer, Digital and Innovation Centre enables the business to embed customer insights into multiple business initiatives, including product, service and technology. The Centre is equipped with state-of-the-art focus group facilities, fully networked to allow for real-time user testing of our digital platforms. These include the myPrudential online portal where customers can manage their insurance policies, the PRUmobile app for on-the-go information and policy access, and the PRUone integrated sales and advisory platform.
There is increasing customer awareness of the impact of lifestyle choices on their well-being in many markets across Asia and 2016 marked Prudential Hong Kong’s first time to offer customers access to an innovative DNA-based nutrigenomic test. The health and protection promotion campaign included access to a nutrigenomic test, ‘myDNA’, offering individual DNA-based insights into how genetics affects an individual’s nutrition needs, dietary sensitivity and well-being. The offer also provided online access to nutrition experts through a mobile app for personalised recommendations. Our customers can personalise their approach
to diet and nutrition according to their unique genome in order to achieve their health goals.
Prudential Singapore became the first insurer in Singapore to launch an online community portal for customers to share ideas and to provide direct feedback on products and services. Through Pru-for-you, regular dialogue with customers allows the business to better understand their needs and in turn, create an offering that is tailored to their financial and lifestyle requirements.
US Prudential’s US operation, Jackson, provides retirement income strategies aimed at the 75 million baby boomers in the US. Jackson offers a diverse range of variable, fixed and fixed-index annuity products, designed with a variety of custom options to fit different financial goals.
In 2016, Jackson launched Perspective Advisory, the company’s first fee-based variable annuity. Perspective Advisory offers the same investments and optional benefits, for an additional charge, as Perspective II®, Jackson’s flagship commission-based variable annuity. The introduction of the new product was designed to meet increased market demand for products compatible with fee-based accounts and platforms as a result of the 2016 US Department of Labor Fiduciary Rules. The addition of Perspective Advisory to Jackson’s suite of products also allows the business to expand into advisory distribution channels where insurance products historically have not been widely utilised.
It is in our customers’ and shareholders’ interests for Prudential to be a responsible business which invests in and gives back to our local communities, alongside the jobs, growth and tax revenue we provide.
Paul Manduca Chairman
Performance highlights — £20 million total community investment
— 83,284 hours volunteered by employees across the Prudential Group
— £460,167 donated by employees through payroll giving across the Group

www.prudential.co.uk� Annual�Report�2016 Prudential plc 63
02Strategicreport
Jackson is committed to providing education, service support and digital tools to increase the ease of doing business. The Center for Financial Insight is a resource designed to help investors and employees gain a better understanding of important financial and investing topics. The mission of the Center is to raise the overall level of financial education and confidence in the US by providing useful content framed in a way that is relevant, consumable and engaging for the modern customer.
Since the re-launch of the site in July 2016, more than 70,000 unique visitors have visited the content on the Center, 55,000 of whom are new visitors to Jackson.com. In addition, the most viewed articles on the site are seeing average viewing times of up to five minutes, showing a sustained level of interest.
UK and EuropeFollowing reform of the UK’s pension and retirement income system in 2015 Prudential has continued to develop both products and processes to meet an evolving set of customer expectations and requirements that increasingly include having to manage and take responsibility for their own savings and the associated risks of longevity, inflation and investment.
Most notably in 2016, we responded to changes in the market following the introduction of pension freedoms by launching the Prudential Retirement Account – an online account based plan that provides customers with the flexibility to save for their retirement, provide an income in retirement and facilitate access to their fund as they save.
Our PruFund franchise provides a unique range of investment fund options for advisers and savers, across the risk spectrum. From ISA and bond, to pension and income drawdown, the range of six different funds continues to flourish, with assets under management reaching £24.7 billion in 2016.
An important part of our service offering is the ongoing hands-on support for intermediary advisers from our regional sales units, technical helpline and business development and consultancy teams.
In 2016, Prudential hosted a series of national seminars covering over 20 locations nationwide, and a structured WebEx programme covered a range of topical and technical subjects, to help these advisers deal with the changing regulatory landscape. Our financial planning business, Prudential Financial Planning, also grew significantly in 2016, increasing its number of advisers to 288.
Rob’s storyChairman’s Challenge, Jakarta
The first week of the 2016 Chairman’s Challenge saw more than 200 employees from Prudential
Indonesia head to Taman Mataram in south Jakarta. Every Saturday for four weeks, the volunteers
worked with Prestasi Junior Indonesia and the local community to regenerate an under-utilised park
into a green community space incorporating fun activities and a financial education theme.
Rob Gardiner, Management Advisor Prestasi Junior Indonesia said, ‘The 2016 Chairman’s Challenge was
just what the name suggests – a very challenging undertaking. The initiative required both Prestasi Junior
Indonesia and Prudential Indonesia to move outside of their “comfort zones” and combine financial literacy
resources with the rejuvenation of the Taman Mataram city park. The end result was, however, beyond
our expectations. The corporation has set exceptionally high standards in its efforts to improve the
welfare of those within the communities in which it operates.’
Prudential plc Annual Report 2016 www.prudential.co.uk64
Corporate responsibility reviewContinued
A number of technology improvements were delivered in 2016, including the introduction of a fully flexible online application process for the popular Prudential ISA product. Additionally, improvements were made to the tele-underwriting service for the Prudential Investment Plan, reducing the amount of time advisers spend on administration and giving them more time with their clients.
Prudential UK & Europe’s success in the Financial Adviser Service Awards continued in 2016, with the retention of the coveted Five Star ratings in the Life and Pensions and Investments categories for the sixth consecutive year. Prudential was the biggest winner at the Investment Life & Pensions MoneyFacts Awards in 2016, scooping the top awards for the Best Investment Service, Best Investment Bond Provider and Best Online Service, once again achieving incredible success at one of the most sought-after awards in our industry.
Asset managementM&G, Prudential’s UK and European asset management business, is a long-term investor that takes seriously its responsibilities as a steward of clients’ assets, often working closely with the management of the companies in which we invest. M&G’s investment teams incorporate environmental, social and governance (ESG) factors into investment analysis and decision-making processes, wherever they have a meaningful impact on risk or return: www.mandg.com/en/corporate/about-mg/responsible-investment/
Active voting is an integral part of the investment approach, both adding value and protecting our interests as shareholders. The M&G website provides an overview of voting history: www.mandg.com/en/corporate/about-mg/investment-philosophy/voting-history/
Reflecting this approach, M&G is a signatory to the UN Principles for Responsible Investment (UNPRI), an international network of investors working together to promote responsible investment practices.
M&G provides market insights to clients, intermediaries and direct investors through a number of channels, including a programme of roadshows and events and multiple digital platforms. To better reflect the diversity of our customer base, during 2016 we significantly increased the size of our M&G Client Council, the panel of our direct investors that helps us design products, services and communications to better meet their needs. Members of our Client Council played a key role in the early stage of product concept testing for our two newest retail funds: the M&G Absolute Return Bond Fund and the M&G Global Target Return Fund, which we launched just before the end of the year.
Supporting local communities The inherent long-term social value of our business is complemented by investments in communities in each of the markets in which we operate. We provide support to charitable organisations through both funding and the experience and expertise of our employees.
Our investments in communities are designed to support the communities in which we operate and deepen engagement with colleagues. As such, our community investment programme is linked to our strategy and is focused around four principal areas:
— Social inclusion;
— Education and life skills;
— Disaster preparedness; and
— Employee engagement.
We establish long-term relationships with our charity partners to ensure that the projects we support are sustainable, and we work closely with them to ensure that our programmes continuously improve.
Education and life skills Cha-Ching – the first global financial education programme We have a long-standing commitment to financial literacy and Cha-Ching is our flagship financial education programme. Launched in Asia in partnership with the Cartoon Network in 2011, it is a multi-media programme built around three-minute animated music videos aimed at
children aged seven to 12. Developed with Cartoon Network and Dr Alice Wilder, an award-winning children’s education specialist, the programme helps children learn the fundamental money management concepts of earn, save, spend and donate. The programme has gained international recognition for promoting financial literacy and has won several industry awards. Over the past few years it has grown to become one of the top-rated children’s television programmes in Asia. Cha-Ching is now available in 10 languages and reaches 54.3 million households a day across Asia through the Cartoon Network. The Cha-Ching School Contact Programme brings Cha-Ching directly to schoolchildren across Asia and has reached more than 200,000 schoolchildren in nine Asian countries to date.
Now a Group-wide programme, Cha-Ching has been launched in Poland, the US, the UK and Africa. In the US, Jackson plans to distribute Cha-Ching with national educational partners and via social media to increase financial literacy with youth. In addition, partnering with Junior Achievement USA, Jackson plans to distribute a five-week teaching curriculum using the Cha-Ching topics and characters to help students engage with personal finance topics.
In the UK work will continue to roll out the Cha-Ching education website, which provides teachers with financial education resources built around the animated music videos, with supporting lesson plans and teacher’s guidance designed to improve the financial capability of Key Stage 2 pupils. The online educational resource will also support expansion across our African markets.
First Read – developing children’s skillsThe Prudence Foundation has funded and supported the First Read programme since 2013, partnering with Save the Children to focus on investing in early childhood care and development in Cambodia and the Philippines. First Read is a unique programme that helps parents to develop their children’s numeracy and literacy skills by providing books in the local language or dialect, and encouraging them to read, sing
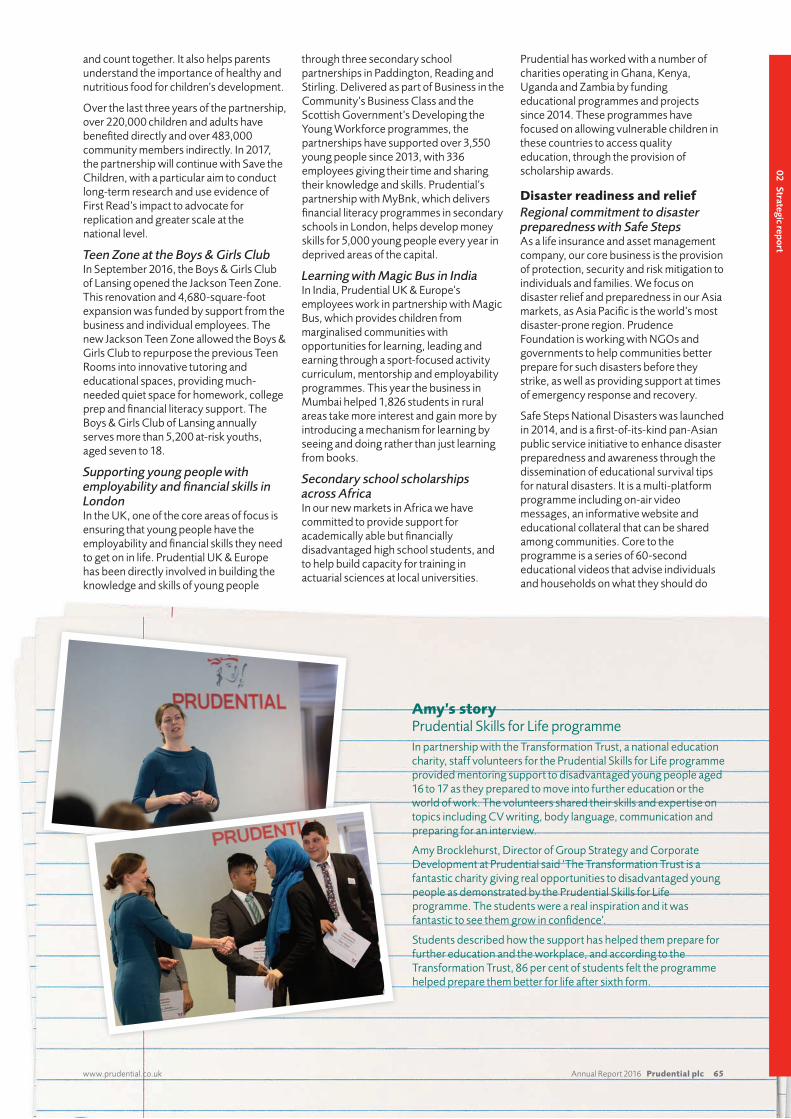
www.prudential.co.uk� Annual�Report�2016 Prudential plc 65
02Strategicreport
and�count�together.�It�also�helps�parents�understand�the�importance�of�healthy�and�nutritious�food�for�children’s�development.
Over�the�last�three�years�of�the�partnership,�over�220,000�children�and�adults�have�benefited�directly�and�over�483,000�community�members�indirectly.�In�2017,�the�partnership�will�continue�with�Save�the�Children,�with�a�particular�aim�to�conduct�long-term�research�and�use�evidence�of�First�Read’s�impact�to�advocate�for�replication�and�greater�scale�at�the�national�level.
Teen Zone at the Boys & Girls Club In�September�2016,�the�Boys�&�Girls�Club�of�Lansing�opened�the�Jackson�Teen�Zone.�This�renovation�and�4,680-square-foot�expansion�was�funded�by�support�from�the�business�and�individual�employees.�The�new�Jackson�Teen�Zone�allowed�the�Boys�&�Girls�Club�to�repurpose�the�previous�Teen�Rooms�into�innovative�tutoring�and�educational�spaces,�providing�much-needed�quiet�space�for�homework,�college�prep�and�financial�literacy�support.�The�Boys�&�Girls�Club�of�Lansing�annually�serves�more�than�5,200�at-risk�youths,�aged�seven�to�18.
Supporting young people with employability and financial skills in LondonIn�the�UK,�one�of�the�core�areas�of�focus�is�ensuring�that�young�people�have�the�employability�and�financial�skills�they�need�to�get�on�in�life.�Prudential�UK�&�Europe�has�been�directly�involved�in�building�the�knowledge�and�skills�of�young�people�
through�three�secondary�school�partnerships�in�Paddington,�Reading�and�Stirling.�Delivered�as�part�of�Business�in�the�Community’s�Business�Class�and�the�Scottish�Government’s�Developing�the�Young�Workforce�programmes,�the�partnerships�have�supported�over�3,550�young�people�since�2013,�with�336�employees�giving�their�time�and�sharing�their�knowledge�and�skills.�Prudential’s�partnership�with�MyBnk,�which�delivers�financial�literacy�programmes�in�secondary�schools�in�London,�helps�develop�money�skills�for�5,000�young�people�every�year�in�deprived�areas�of�the�capital.�
Learning with Magic Bus in IndiaIn�India,�Prudential�UK�&�Europe’s�employees�work�in�partnership�with�Magic�Bus,�which�provides�children�from�marginalised�communities�with�opportunities�for�learning,�leading�and�earning�through�a�sport-focused�activity�curriculum,�mentorship�and�employability�programmes.�This�year�the�business�in�Mumbai�helped�1,826�students�in�rural�areas�take�more�interest�and�gain�more�by�introducing�a�mechanism�for�learning�by�seeing�and�doing�rather�than�just�learning�from�books.
Secondary school scholarships across AfricaIn�our�new�markets�in�Africa�we�have�committed�to�provide�support�for�academically�able�but�financially�disadvantaged�high�school�students,�and�to�help�build�capacity�for�training�in�actuarial�sciences�at�local�universities.�
Prudential�has�worked�with�a�number�of�charities�operating�in�Ghana,�Kenya,�Uganda�and�Zambia�by�funding�educational�programmes�and�projects�since�2014.�These�programmes�have�focused�on�allowing�vulnerable�children�in�these�countries�to�access�quality�education,�through�the�provision�of�scholarship�awards.�
Disaster readiness and reliefRegional commitment to disaster preparedness with Safe StepsAs�a�life�insurance�and�asset�management�company,�our�core�business�is�the�provision�of�protection,�security�and�risk�mitigation�to�individuals�and�families.�We�focus�on�disaster�relief�and�preparedness�in�our�Asia�markets,�as�Asia�Pacific�is�the�world’s�most�disaster-prone�region.�Prudence�Foundation�is�working�with�NGOs�and�governments�to�help�communities�better�prepare�for�such�disasters�before�they�strike,�as�well�as�providing�support�at�times�of�emergency�response�and�recovery.
Safe�Steps�National�Disasters�was�launched�in�2014,�and�is�a�first-of-its-kind�pan-Asian�public�service�initiative�to�enhance�disaster�preparedness�and�awareness�through�the�dissemination�of�educational�survival�tips�for�natural�disasters.�It�is�a�multi-platform�programme�including�on-air�video�messages,�an�informative�website�and�educational�collateral�that�can�be�shared�among�communities.�Core�to�the�programme�is�a�series�of�60-second�educational�videos�that�advise�individuals�and�households�on�what�they�should�do�
Amy’s storyPrudential�Skills�for�Life�programmeIn�partnership�with�the�Transformation�Trust,�a�national�education�charity,�staff�volunteers�for�the�Prudential�Skills�for�Life�programme�provided�mentoring�support�to�disadvantaged�young�people�aged�16�to�17�as�they�prepared�to�move�into�further�education�or�the�world�of�work.�The�volunteers�shared�their�skills�and�expertise�on�topics�including�CV�writing,�body�language,�communication�and�preparing�for�an�interview.�
Amy�Brocklehurst,�Director�of�Group�Strategy�and�Corporate�Development�at�Prudential�said�‘The�Transformation�Trust�is�a�fantastic�charity�giving�real�opportunities�to�disadvantaged�young�people�as�demonstrated�by�the�Prudential�Skills�for�Life�programme.�The�students�were�a�real�inspiration�and�it�was�fantastic�to�see�them�grow�in�confidence’.
Students�described�how�the�support�has�helped�them�prepare�for�further�education�and�the�workplace,�and�according�to�the�Transformation�Trust,�86�per�cent�of�students�felt�the�programme�helped�prepare�them�better�for�life�after�sixth�form.�
Prudential plc Annual Report 2016 www.prudential.co.uk66
Corporate responsibility reviewContinued
when disasters strike. In 2015, Prudence Foundation launched its second Safe Steps programme, Safe Steps Road Safety, in partnership with National Geographic Channel and the Fédération Internationale de L’Automobile and endorsed by the International Federation of the Red Cross.
The programme has been well received and a number of partnerships across Asia have spread the campaign, including free-to-air channels, radio stations and cinema. Through these partnerships, Safe Steps currently has a potential reach of 200 million people a day in Asia.
Safe Schools programmePrudence Foundation continues its support of the Safe Schools programme, partnering with Plan International and Save the Children in Cambodia, Indonesia, the Philippines, Thailand and Vietnam. The programme focuses on capacity-building for students, teachers and local community members on disaster preparedness, placing schools at the heart of building a culture of disaster preparedness within communities. The programme trains students and their teachers in key disaster management skills and supporting the organisation of disaster simulations and evacuation drills for students and their community. Since 2013, more than 70,000 students and 18,000 teachers have participated. In 2017, the Prudence Foundation will continue to support this programme and explore further partnerships to increase its scale.
Volunteering to build disaster-resilient homesPrudence Foundation continues to provide support to major emergency relief efforts across the region. In 2016, support was provided in Cambodia to emergency drought response efforts. The long-term commitment of the business to the Typhoon Haiyan recovery efforts in Bantayan Island was demonstrated by sending a team of volunteers to continue the building of new houses for the community. The first 64 houses have been completed and families have now moved in. Around 80 volunteers in June supported the construction of the final 62 houses, which were due to be completed by the end of the first quarter in 2017. In September, over 50 regional volunteers
spent time in Vietnam to support the construction of a new school in Quang Binh province. This formed part of Prudential Vietnam’s partnership with Plan International and the Vietnamese government, which are collaborating together to build new disaster-resilient schools in poor regions throughout the country.
Emergency fund reliefPrudential has also been a Group-level supporter of Save the Children since 2010 and is one of the Children’s Emergency Fund’s major supporters. This allows us to act swiftly when disasters occur in any of our markets and provides an instant, effective fundraising mechanism for employees when needed. In 2016 more than 98 allocations from the Fund were made to more than 46 countries and we will continue to support this partnership in 2017.
Social inclusionPrudential RideLondon – social inclusion in the UKIn the past four years Prudential RideLondon has raised £41 million for charity and become one of the UK’s largest fundraising events. In 2016 alone, more than 740 charities benefited from riders’ fundraising. We have renewed our sponsorship for a further three years to 2018.
As title sponsor, in 2016 we partnered with three charities – Teach First, Greenhouse Sports and the Invictus Games Foundation – to provide aspirational challenges for 62 young people and injured service personnel tackling Prudential RideLondon for the first time. We provided support including bikes, equipment and training as well as employability and coaching workshops. Over £500,000 was raised as a result of fundraising from Prudential rider places by our charity partners and our employees.
Prudential RideLondon has inspired many to take control of their health and well-being. A BBC2 documentary called Fixing Dad featured Geoff Whitington, who was encouraged and supported by his sons to regain his health and reverse his Type 2 diabetes through significant changes to his diet and lifestyle, including taking on the
challenge of riding the Prudential RideLondon-Surrey 100. The Fixing Challenge will continue in 2017.
We are developing a new Prudential RideLondon programme for 2017 in partnership with Teach First, which will use the event as a focal point to promote inclusion and help eradicate educational inequality. The new PruGOals programme will have national reach, working with more than 15 schools with an increased focus on well-being and mental health.
Employee fundraisingJackson employees are actively engaged in our commitment to communities by taking part in programmes such as the Jackson National Community Fund Advisory Committee and the employee-nominated matching programme. The Jackson National Community Fund supports charities that help the elderly and children through quarterly grants in communities where Jackson’s four largest offices are located. Jackson’s matching programme offers a two-to-one match on all employee donations made to approved charities. This programme ensures that causes important to employees are given charitable consideration and that Jackson’s support is received by responsible organisations where funding will create a significant impact.
The elderly in the communityPrudential UK is a long-standing partner of Age UK, working to make a difference to the lives of the elderly. Building on the successful Planning for Later Life programme the business has launched a new programme – Later Life Links. This is focused on supporting older people in six communities across the UK to become more involved in their communities, through the provision of long-term companionship, advice and practical support.
Apprenticeships in the UKYouth unemployment is a huge social challenge. As one of the most respected brands in the UK, Prudential is taking a major role in helping to shape future job prospects for young people. Over the past three years we have recruited 178 young people to our apprenticeship programme, providing them with important work and
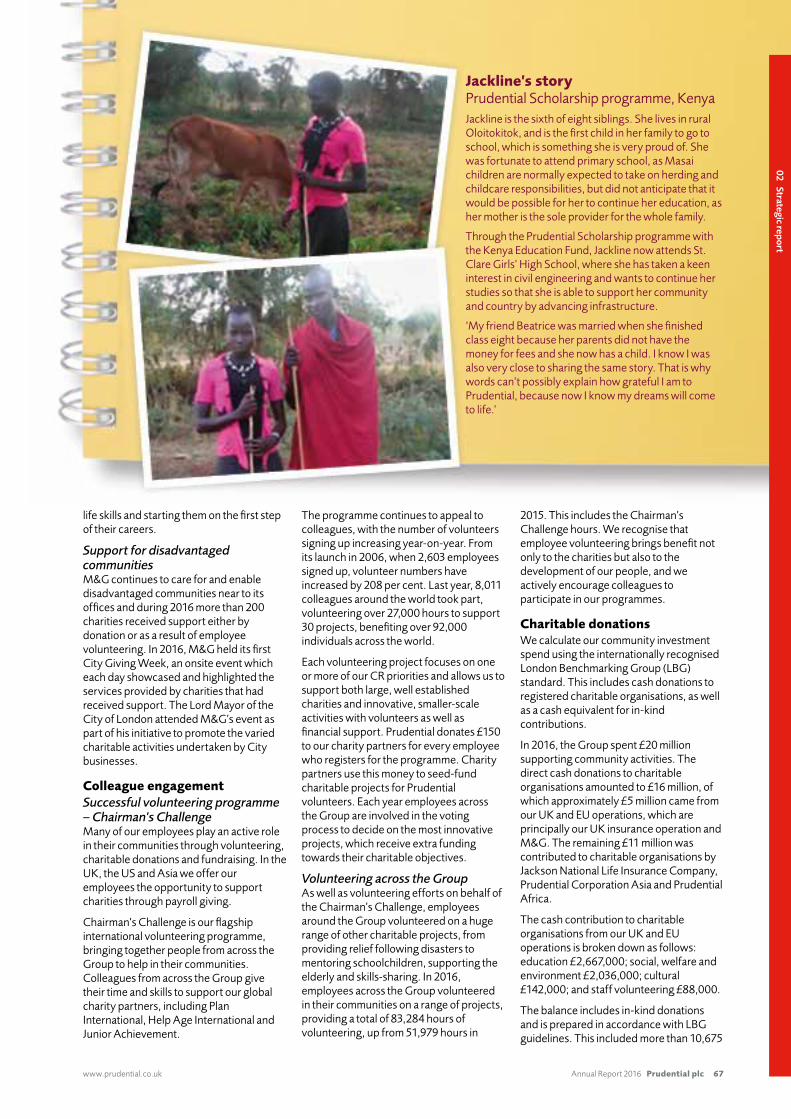
www.prudential.co.uk� Annual�Report�2016 Prudential plc 67
02Strategicreport
life skills and starting them on the first step of their careers.
Support for disadvantaged communitiesM&G continues to care for and enable disadvantaged communities near to its offices and during 2016 more than 200 charities received support either by donation or as a result of employee volunteering. In 2016, M&G held its first City Giving Week, an onsite event which each day showcased and highlighted the services provided by charities that had received support. The Lord Mayor of the City of London attended M&G’s event as part of his initiative to promote the varied charitable activities undertaken by City businesses.
Colleague engagementSuccessful volunteering programme – Chairman’s ChallengeMany of our employees play an active role in their communities through volunteering, charitable donations and fundraising. In the UK, the US and Asia we offer our employees the opportunity to support charities through payroll giving.
Chairman’s Challenge is our flagship international volunteering programme, bringing together people from across the Group to help in their communities. Colleagues from across the Group give their time and skills to support our global charity partners, including Plan International, Help Age International and Junior Achievement.
The programme continues to appeal to colleagues, with the number of volunteers signing up increasing year-on-year. From its launch in 2006, when 2,603 employees signed up, volunteer numbers have increased by 208 per cent. Last year, 8,011 colleagues around the world took part, volunteering over 27,000 hours to support 30 projects, benefiting over 92,000 individuals across the world.
Each volunteering project focuses on one or more of our CR priorities and allows us to support both large, well established charities and innovative, smaller-scale activities with volunteers as well as financial support. Prudential donates £150 to our charity partners for every employee who registers for the programme. Charity partners use this money to seed-fund charitable projects for Prudential volunteers. Each year employees across the Group are involved in the voting process to decide on the most innovative projects, which receive extra funding towards their charitable objectives.
Volunteering across the GroupAs well as volunteering efforts on behalf of the Chairman’s Challenge, employees around the Group volunteered on a huge range of other charitable projects, from providing relief following disasters to mentoring schoolchildren, supporting the elderly and skills-sharing. In 2016, employees across the Group volunteered in their communities on a range of projects, providing a total of 83,284 hours of volunteering, up from 51,979 hours in
2015. This includes the Chairman’s Challenge hours. We recognise that employee volunteering brings benefit not only to the charities but also to the development of our people, and we actively encourage colleagues to participate in our programmes.
Charitable donationsWe calculate our community investment spend using the internationally recognised London Benchmarking Group (LBG) standard. This includes cash donations to registered charitable organisations, as well as a cash equivalent for in-kind contributions.
In 2016, the Group spent £20 million supporting community activities. The direct cash donations to charitable organisations amounted to £16 million, of which approximately £5 million came from our UK and EU operations, which are principally our UK insurance operation and M&G. The remaining £11 million was contributed to charitable organisations by Jackson National Life Insurance Company, Prudential Corporation Asia and Prudential Africa.
The cash contribution to charitable organisations from our UK and EU operations is broken down as follows: education £2,667,000; social, welfare and environment £2,036,000; cultural £142,000; and staff volunteering £88,000.
The balance includes in-kind donations and is prepared in accordance with LBG guidelines. This included more than 10,675
Jackline’s storyPrudential Scholarship programme, KenyaJackline is the sixth of eight siblings. She lives in rural Oloitokitok, and is the first child in her family to go to school, which is something she is very proud of. She was fortunate to attend primary school, as Masai children are normally expected to take on herding and childcare responsibilities, but did not anticipate that it would be possible for her to continue her education, as her mother is the sole provider for the whole family.
Through the Prudential Scholarship programme with the Kenya Education Fund, Jackline now attends St. Clare Girls’ High School, where she has taken a keen interest in civil engineering and wants to continue her studies so that she is able to support her community and country by advancing infrastructure.
‘My friend Beatrice was married when she finished class eight because her parents did not have the money for fees and she now has a child. I know I was also very close to sharing the same story. That is why words can’t possibly explain how grateful I am to Prudential, because now I know my dreams will come to life.’
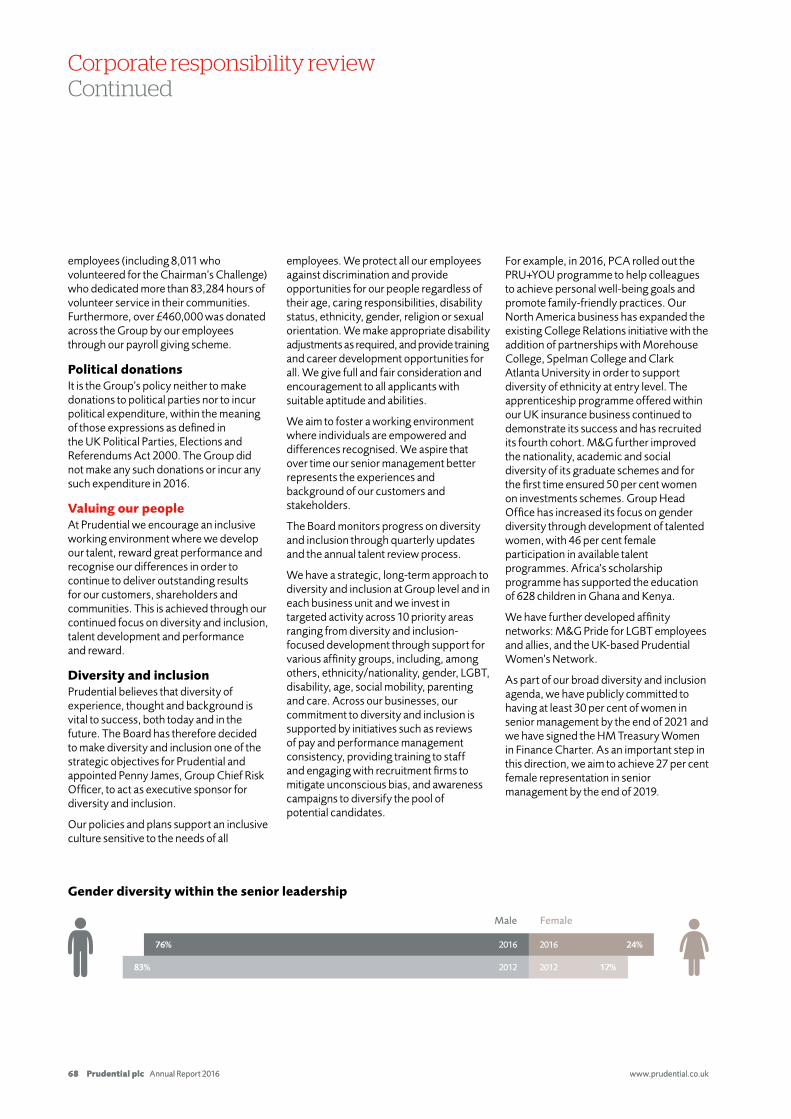
Prudential plc Annual Report 2016 www.prudential.co.uk68
Corporate responsibility reviewContinued
employees (including 8,011 who volunteered for the Chairman’s Challenge) who dedicated more than 83,284 hours of volunteer service in their communities. Furthermore, over £460,000 was donated across the Group by our employees through our payroll giving scheme.
Political donations It is the Group’s policy neither to make donations to political parties nor to incur political expenditure, within the meaning of those expressions as defined in the UK Political Parties, Elections and Referendums Act 2000. The Group did not make any such donations or incur any such expenditure in 2016.
Valuing our peopleAt Prudential we encourage an inclusive working environment where we develop our talent, reward great performance and recognise our differences in order to continue to deliver outstanding results for our customers, shareholders and communities. This is achieved through our continued focus on diversity and inclusion, talent development and performance and reward.
Diversity and inclusionPrudential believes that diversity of experience, thought and background is vital to success, both today and in the future. The Board has therefore decided to make diversity and inclusion one of the strategic objectives for Prudential and appointed Penny James, Group Chief Risk Officer, to act as executive sponsor for diversity and inclusion.
Our policies and plans support an inclusive culture sensitive to the needs of all
employees. We protect all our employees against discrimination and provide opportunities for our people regardless of their age, caring responsibilities, disability status, ethnicity, gender, religion or sexual orientation. We make appropriate disability adjustments as required, and provide training and career development opportunities for all. We give full and fair consideration and encouragement to all applicants with suitable aptitude and abilities.
We aim to foster a working environment where individuals are empowered and differences recognised. We aspire that over time our senior management better represents the experiences and background of our customers and stakeholders.
The Board monitors progress on diversity and inclusion through quarterly updates and the annual talent review process.
We have a strategic, long-term approach to diversity and inclusion at Group level and in each business unit and we invest in targeted activity across 10 priority areas ranging from diversity and inclusion-focused development through support for various affinity groups, including, among others, ethnicity/nationality, gender, LGBT, disability, age, social mobility, parenting and care. Across our businesses, our commitment to diversity and inclusion is supported by initiatives such as reviews of pay and performance management consistency, providing training to staff and engaging with recruitment firms to mitigate unconscious bias, and awareness campaigns to diversify the pool of potential candidates.
For example, in 2016, PCA rolled out the PRU+YOU programme to help colleagues to achieve personal well-being goals and promote family-friendly practices. Our North America business has expanded the existing College Relations initiative with the addition of partnerships with Morehouse College, Spelman College and Clark Atlanta University in order to support diversity of ethnicity at entry level. The apprenticeship programme offered within our UK insurance business continued to demonstrate its success and has recruited its fourth cohort. M&G further improved the nationality, academic and social diversity of its graduate schemes and for the first time ensured 50 per cent women on investments schemes. Group Head Office has increased its focus on gender diversity through development of talented women, with 46 per cent female participation in available talent programmes. Africa’s scholarship programme has supported the education of 628 children in Ghana and Kenya.
We have further developed affinity networks: M&G Pride for LGBT employees and allies, and the UK-based Prudential Women’s Network.
As part of our broad diversity and inclusion agenda, we have publicly committed to having at least 30 per cent of women in senior management by the end of 2021 and we have signed the HM Treasury Women in Finance Charter. As an important step in this direction, we aim to achieve 27 per cent female representation in senior management by the end of 2019.
Prudential plc Annual Report 2016 www.prudential.co.uk68
2016 201676% 24%
17%2012 201283%
Female
Gender diversity within the senior leadership
Male
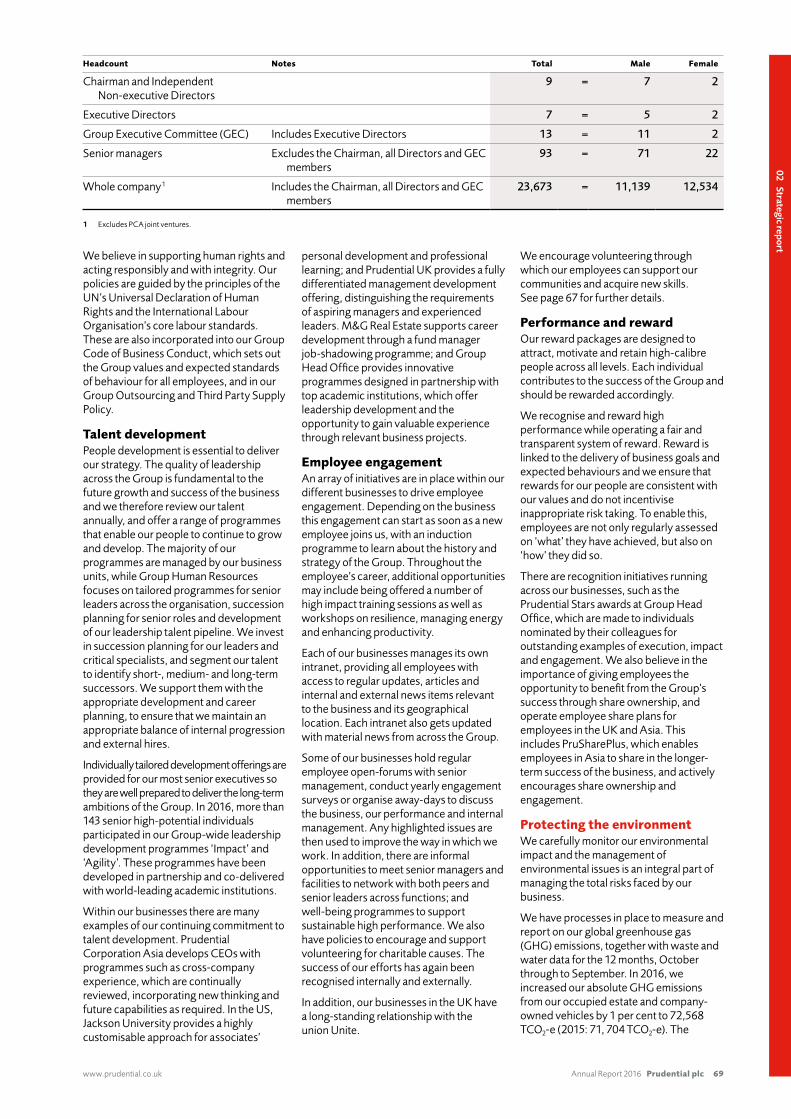
www.prudential.co.uk� Annual�Report�2016 Prudential plc 69
02Strategicreport
Headcount Notes Total Male Female
Chairman and Independent Non-executive Directors
9 = 7 2
Executive Directors 7 = 5 2
Group Executive Committee (GEC) Includes Executive Directors 13 = 11 2
Senior managers Excludes the Chairman, all Directors and GEC members
93 = 71 22
Whole company1 Includes the Chairman, all Directors and GEC members
23,673 = 11,139 12,534
1 Excludes PCA joint ventures.
We believe in supporting human rights and acting responsibly and with integrity. Our policies are guided by the principles of the UN’s Universal Declaration of Human Rights and the International Labour Organisation’s core labour standards. These are also incorporated into our Group Code of Business Conduct, which sets out the Group values and expected standards of behaviour for all employees, and in our Group Outsourcing and Third Party Supply Policy.
Talent developmentPeople development is essential to deliver our strategy. The quality of leadership across the Group is fundamental to the future growth and success of the business and we therefore review our talent annually, and offer a range of programmes that enable our people to continue to grow and develop. The majority of our programmes are managed by our business units, while Group Human Resources focuses on tailored programmes for senior leaders across the organisation, succession planning for senior roles and development of our leadership talent pipeline. We invest in succession planning for our leaders and critical specialists, and segment our talent to identify short-, medium- and long-term successors. We support them with the appropriate development and career planning, to ensure that we maintain an appropriate balance of internal progression and external hires.
Individually tailored development offerings are provided for our most senior executives so they are well prepared to deliver the long-term ambitions of the Group. In 2016, more than 143 senior high-potential individuals participated in our Group-wide leadership development programmes ‘Impact’ and ‘Agility’. These programmes have been developed in partnership and co-delivered with world-leading academic institutions.
Within our businesses there are many examples of our continuing commitment to talent development. Prudential Corporation Asia develops CEOs with programmes such as cross-company experience, which are continually reviewed, incorporating new thinking and future capabilities as required. In the US, Jackson University provides a highly customisable approach for associates’
personal development and professional learning; and Prudential UK provides a fully differentiated management development offering, distinguishing the requirements of aspiring managers and experienced leaders. M&G Real Estate supports career development through a fund manager job-shadowing programme; and Group Head Office provides innovative programmes designed in partnership with top academic institutions, which offer leadership development and the opportunity to gain valuable experience through relevant business projects.
Employee engagement An array of initiatives are in place within our different businesses to drive employee engagement. Depending on the business this engagement can start as soon as a new employee joins us, with an induction programme to learn about the history and strategy of the Group. Throughout the employee’s career, additional opportunities may include being offered a number of high impact training sessions as well as workshops on resilience, managing energy and enhancing productivity.
Each of our businesses manages its own intranet, providing all employees with access to regular updates, articles and internal and external news items relevant to the business and its geographical location. Each intranet also gets updated with material news from across the Group.
Some of our businesses hold regular employee open-forums with senior management, conduct yearly engagement surveys or organise away-days to discuss the business, our performance and internal management. Any highlighted issues are then used to improve the way in which we work. In addition, there are informal opportunities to meet senior managers and facilities to network with both peers and senior leaders across functions; and well-being programmes to support sustainable high performance. We also have policies to encourage and support volunteering for charitable causes. The success of our efforts has again been recognised internally and externally.
In addition, our businesses in the UK have a long-standing relationship with the union Unite.
We encourage volunteering through which our employees can support our communities and acquire new skills. See page 67 for further details.
Performance and rewardOur reward packages are designed to attract, motivate and retain high-calibre people across all levels. Each individual contributes to the success of the Group and should be rewarded accordingly.
We recognise and reward high performance while operating a fair and transparent system of reward. Reward is linked to the delivery of business goals and expected behaviours and we ensure that rewards for our people are consistent with our values and do not incentivise inappropriate risk taking. To enable this, employees are not only regularly assessed on ‘what’ they have achieved, but also on ‘how’ they did so.
There are recognition initiatives running across our businesses, such as the Prudential Stars awards at Group Head Office, which are made to individuals nominated by their colleagues for outstanding examples of execution, impact and engagement. We also believe in the importance of giving employees the opportunity to benefit from the Group’s success through share ownership, and operate employee share plans for employees in the UK and Asia. This includes PruSharePlus, which enables employees in Asia to share in the longer-term success of the business, and actively encourages share ownership and engagement.
Protecting the environment We carefully monitor our environmental impact and the management of environmental issues is an integral part of managing the total risks faced by our business.
We have processes in place to measure and report on our global greenhouse gas (GHG) emissions, together with waste and water data for the 12 months, October through to September. In 2016, we increased our absolute GHG emissions from our occupied estate and company-owned vehicles by 1 per cent to 72,568 TCO2-e (2015: 71, 704 TCO2-e). The
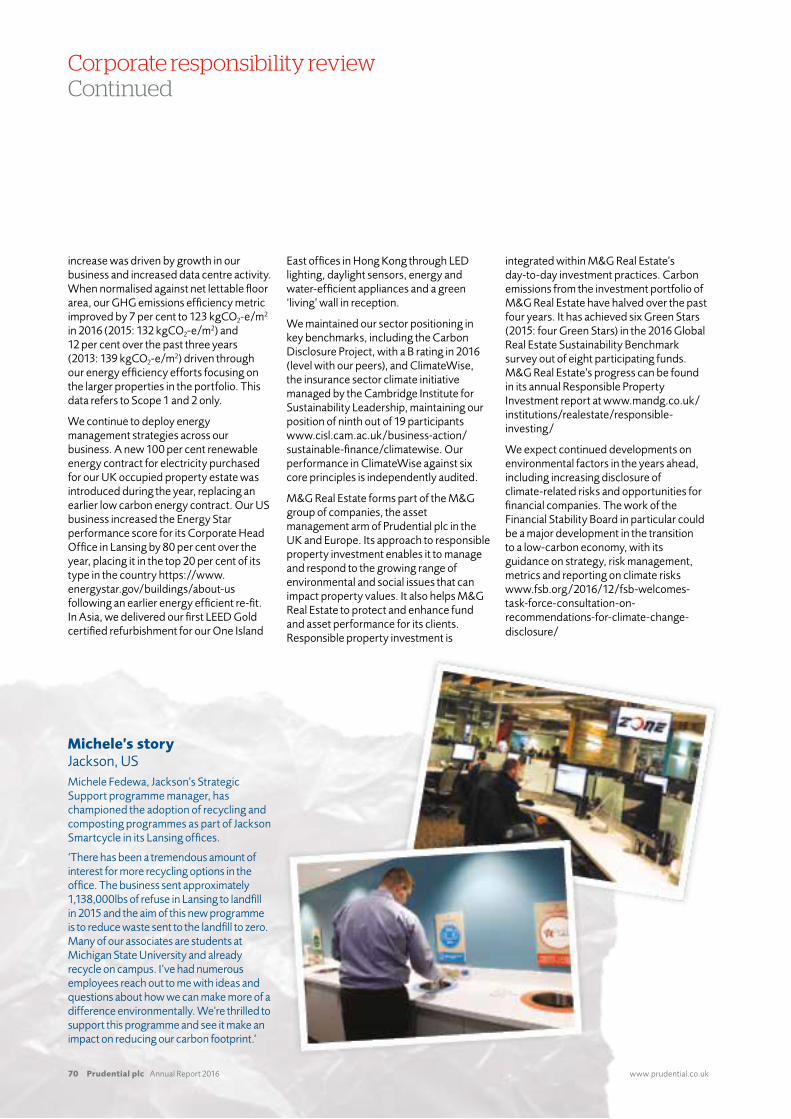
Prudential plc Annual Report 2016 www.prudential.co.uk70
Corporate responsibility reviewContinued
increase was driven by growth in our business and increased data centre activity. When normalised against net lettable floor area, our GHG emissions efficiency metric improved by 7 per cent to 123 kgCO2-e/m2 in 2016 (2015: 132 kgCO2-e/m2) and 12 per cent over the past three years (2013: 139 kgCO2-e/m2) driven through our energy efficiency efforts focusing on the larger properties in the portfolio. This data refers to Scope 1 and 2 only.
We continue to deploy energy management strategies across our business. A new 100 per cent renewable energy contract for electricity purchased for our UK occupied property estate was introduced during the year, replacing an earlier low carbon energy contract. Our US business increased the Energy Star performance score for its Corporate Head Office in Lansing by 80 per cent over the year, placing it in the top 20 per cent of its type in the country https://www.energystar.gov/buildings/about-us following an earlier energy efficient re-fit. In Asia, we delivered our first LEED Gold certified refurbishment for our One Island
East offices in Hong Kong through LED lighting, daylight sensors, energy and water-efficient appliances and a green ‘living’ wall in reception.
We maintained our sector positioning in key benchmarks, including the Carbon Disclosure Project, with a B rating in 2016 (level with our peers), and ClimateWise, the insurance sector climate initiative managed by the Cambridge Institute for Sustainability Leadership, maintaining our position of ninth out of 19 participants www.cisl.cam.ac.uk/business-action/sustainable-finance/climatewise. Our performance in ClimateWise against six core principles is independently audited.
M&G Real Estate forms part of the M&G group of companies, the asset management arm of Prudential plc in the UK and Europe. Its approach to responsible property investment enables it to manage and respond to the growing range of environmental and social issues that can impact property values. It also helps M&G Real Estate to protect and enhance fund and asset performance for its clients. Responsible property investment is
integrated within M&G Real Estate’s day-to-day investment practices. Carbon emissions from the investment portfolio of M&G Real Estate have halved over the past four years. It has achieved six Green Stars (2015: four Green Stars) in the 2016 Global Real Estate Sustainability Benchmark survey out of eight participating funds. M&G Real Estate’s progress can be found in its annual Responsible Property Investment report at www.mandg.co.uk/institutions/realestate/responsible-investing/
We expect continued developments on environmental factors in the years ahead, including increasing disclosure of climate-related risks and opportunities for financial companies. The work of the Financial Stability Board in particular could be a major development in the transition to a low-carbon economy, with its guidance on strategy, risk management, metrics and reporting on climate risks www.fsb.org/2016/12/fsb-welcomes-task-force-consultation-on-recommendations-for-climate-change-disclosure/
Michele’s storyJackson, USMichele Fedewa, Jackson’s Strategic Support programme manager, has championed the adoption of recycling and composting programmes as part of Jackson Smartcycle in its Lansing offices.
‘There has been a tremendous amount of interest for more recycling options in the office. The business sent approximately 1,138,000lbs of refuse in Lansing to landfill in 2015 and the aim of this new programme is to reduce waste sent to the landfill to zero. Many of our associates are students at Michigan State University and already recycle on campus. I’ve had numerous employees reach out to me with ideas and questions about how we can make more of a difference environmentally. We’re thrilled to support this programme and see it make an impact on reducing our carbon footprint.’
www.prudential.co.uk� Annual�Report�2016 Prudential plc 71
02Strategicreport
Prudential plc greenhouse gas emissions statementWe have compiled our greenhouse gas emissions data in accordance with the Companies Act 2006 (Strategic and Directors’ Reports) Regulations 2013.
We have included full reporting for Scope 1 (direct emissions such as combustion of gas for heating fugitive emissions and emissions from owned vehicles) and Scope 21 (indirect emissions for consumption of
electricity, heat or steam) emissions where operational control of the emissions of the sources concerned was demonstrated.
We have also reported on a number of Scope 3 emissions as a matter of best practice. These are emissions arising as a consequence of the activities of the company, but occur from sources not owned or controlled by the company. For the purpose of 2016 report, these Scope 3 emissions include: business travel booked
from the UK, global water consumption (occupied and investment properties) and waste. The waste reporting covers, all investment properties with operational control, UK and US occupied properties. We do not currently collect waste data for our occupied buildings in Asia and continental Europe. We are continuously working with our business units to review the extent of our Scope 3 reporting and increase where practicable.
Assessment parameters Baseline year: 1 October 2014 to 30 September 2015 Reporting year: 1 October 2015 to 30 September 2016
Assurance Deloitte LLP has provided limited assurance over selected environmental metrics in accordance with the International Auditing and Assurance Standards Board’s (ISAE3000 (Revised)) international standard. www.prudential.co.uk/responsibility/performance/external-assurance-of-responsibility-reporting
Consolidation approach Operational control.
Boundary summary All entities and all facilities under operational control (including those owned) are included.
Consistency with the financial statements The reporting period (1 October 2015 to 30 September 2016) does not correspond with the Directors’ Report period (1 January 2016 to 31 December 2016). The reporting period was brought forward by three months to improve the availability of invoice data (which often lags by one month or more after the usage period) and reduce the reliance on estimated data. Prudential owns assets, which are held on its balance sheet in the financial statements, over which it does not have operational control. These are excluded from the data below. Assets not included on the balance sheet but held under an operating lease and where we have operational control are included.
Emission factor data source We have used the UK DEFRA 2016 GHG Conversion Factors for Scope 1 and 3 reporting and the IEA GHG 2016 conversion factors for global Scope 2 reporting.
Assessment methodology The Greenhouse Gas Protocol Corporate Accounting and Reporting Standard 2004.
In 2016 Prudential reviewed its reporting methodology for Scope 2 (electricity) emissions in recognition of the release of the revised GHG Protocol Scope 2 Guidance that requires both location and market-based reporting. As the Group operates in a number of mature and emerging markets, the availability of market-based factors that met the necessary quality criteria was deemed insufficient for reporting, and as such our 2016 reporting continues to use the location-based factors already available.
Materiality threshold 5 per cent.
Intensity ratio Kilograms of Carbon Dioxide Equivalent per metre squared (net lettable area).
Note1 This is calculated using location-based methodology (GHG protocol).
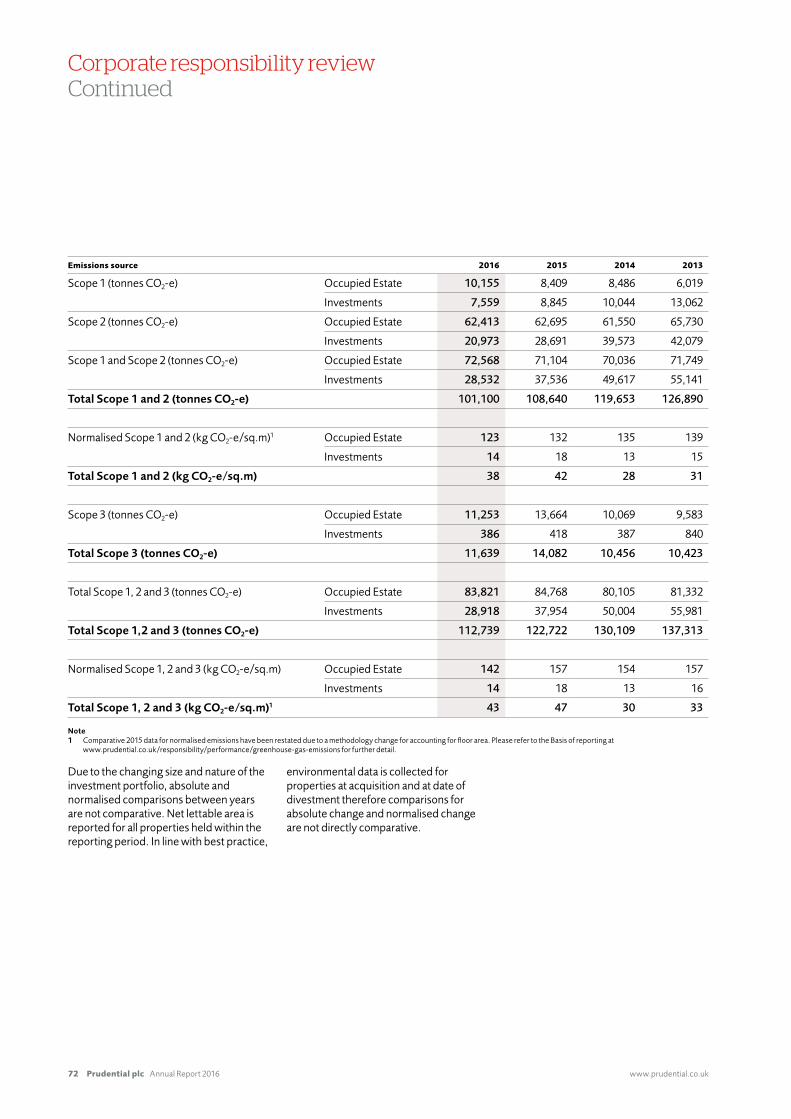
Prudential plc Annual Report 2016 www.prudential.co.uk72
Corporate responsibility reviewContinued
Emissions source 2016 2015 2014 2013
Scope 1 (tonnes CO2-e) Occupied Estate 10,155 8,409 8,486 6,019
Investments 7,559 8,845 10,044 13,062
Scope 2 (tonnes CO2-e) Occupied Estate 62,413 62,695 61,550 65,730
Investments 20,973 28,691 39,573 42,079
Scope 1 and Scope 2 (tonnes CO2-e) Occupied Estate 72,568 71,104 70,036 71,749
Investments 28,532 37,536 49,617 55,141
Total Scope 1 and 2 (tonnes CO2-e) 101,100 108,640 119,653 126,890
Normalised Scope 1 and 2 (kg CO2-e/sq.m)1 Occupied Estate 123 132 135 139
Investments 14 18 13 15
Total Scope 1 and 2 (kg CO2-e/sq.m) 38 42 28 31
Scope 3 (tonnes CO2-e) Occupied Estate 11,253 13,664 10,069 9,583
Investments 386 418 387 840
Total Scope 3 (tonnes CO2-e) 11,639 14,082 10,456 10,423
Total Scope 1, 2 and 3 (tonnes CO2-e) Occupied Estate 83,821 84,768 80,105 81,332
Investments 28,918 37,954 50,004 55,981
Total Scope 1,2 and 3 (tonnes CO2-e) 112,739 122,722 130,109 137,313
Normalised Scope 1, 2 and 3 (kg CO2-e/sq.m) Occupied Estate 142 157 154 157
Investments 14 18 13 16
Total Scope 1, 2 and 3 (kg CO2-e/sq.m)1 43 47 30 33
Note1 Comparative 2015 data for normalised emissions have been restated due to a methodology change for accounting for floor area. Please refer to the Basis of reporting at
www.prudential.co.uk/responsibility/performance/greenhouse-gas-emissions for further detail.
Due to the changing size and nature of the investment portfolio, absolute and normalised comparisons between years are not comparative. Net lettable area is reported for all properties held within the reporting period. In line with best practice,
environmental data is collected for properties at acquisition and at date of divestment therefore comparisons for absolute change and normalised change are not directly comparative.
www.prudential.co.uk� Annual�Report�2016 Prudential plc 73
02Strategicreport
Accountability and governance for corporate responsibility
The BoardThe Board regularly reviews the Group’s corporate responsibility performance and scrutinises and approves the Group corporate responsibility report and strategy on an annual basis.
Local governanceWe believe that CR is best managed on the ground by our people running the businesses. In M&G, Jackson and Prudential UK there are governance committees in place – with senior management representation – that agree strategy and spend. In Asia, the Prudence Foundation has been established as a unified charitable platform to align and maximise the impact of community efforts across the region. The Prudence Foundation is governed by a statutory Board of Directors, under which a Board of Trustees operates as a decision-making forum, directing the management of the programmes in collaboration with our local markets, and ensuring that we maximise the value of our spend to local communities.
Code of Business ConductConsideration of environmental, social and community matters is integrated in our Code of Business Conduct. Our code is reviewed by the Board on an annual basis. Refer to page 69 for more information.
Risk assessmentFor more information on the risks facing our business see page 50.
Supply chain managementIt is our policy to work in partnership with third parties whose values and standards are aligned with our Group Code of Business Conduct.
Procurement practices in Prudential UK have been successfully accredited with the Chartered Institute of Purchasing and Supply certification, an industry benchmark of recognised good practice. Prudential will publish its Modern Slavery statement later in the year.
Strategic report approval by the Board of DirectorsThe strategic report set out on pages 9 to 73 is approved by the Board of Directors.
Signed on behalf of the Board of Directors
Mike Wells Group Chief Executive 13 March 2017