Embed Size (px)
Citation preview
WEST AFRICAN INSTITUT MONETAIRE DE
MONETARY INSTITUTE (WAMI) L'AFRIQUE DE L'OUEST (IMAO)
WAMI OCCASIONAL PAPER SERIES
NO. 9
PRUDENTIAL INDICATORS
IN THE WAMZ : A GAP ANALYSIS
Prepared by:
Abdoulaye Barry, Kemoh Mansaray and George Okorie
ACCRA, GHANA
JUNE, 2016

i
Table of Contents
EXECUTIVE SUMMARY .................................................................................. ii
1.0 Introduction ..................................................................................................... 1
2.0 Overview of Prudential Rules/Indicators ..................................................... 3
3.0 Analysis of Key Prudential Indicators in WAMZ Countries ..................... 4
3.1 Regulatory Capital to Risk-Weighted Assets (Capital Adequacy Ratio) ........... 4
3.2 Non-performing Loans (NPLs) to Gross Loans ................................................... 7
3.3 NPLs Net of Provision to Capital........................................................................... 9
3.4 Leverage (Debt/Equity) ........................................................................................ 13
3.5 Large Exposure ..................................................................................................... 14
3.6 Single Obligor Limit ............................................................................................. 16
3.7 Insider Related Lending ....................................................................................... 17
3.8 Profitability Measures .......................................................................................... 19
3.8.1 Net Interest Margin to Gross Income .............................................................. 19
3.8.2 Return on Assets (ROA) and Return on Equity (ROE) ..................................... 21
3.9 Liquidity................................................................................................................. 23
3.9.1 Core Liquid Assets to Total Assets ................................................................... 23
3.9.2 Core Liquid Assets to Short-term Liabilities .................................................... 23
3.10 Net Open Position to Capital.............................................................................. 25
4.0 Summary, Conclusion and Recommendations .......................................... 26
4.1 Summary .......................................................................................................... 26
4.2 Conclusion and Recommendations ................................................................ 27
References ............................................................................................................ 29
ii
EXECUTIVE SUMMARY
uring its seventh meeting on the activities of the College of Supervisors of the West
African Monetary Zone (CSWAMZ), held on 16th January, 2014, in Accra, Ghana, the
Committee of Governors (CoGs), observed that there were different measurement of key
prudential indicators across Member States. The CoGs consequently directed the CSWAMZ to
undertake a comprehensive study to identify the gaps in the measurement or calculation of key
prudential indicators across the Zone and suggest ways for harmonizing them. The paper is in
pursuant of the directive of the COGs - to undertake a gap analysis of key prudential indicators in
the WAMZ and recommend ways of harmonizing them. The study adopted survey based techniques
to identify the different practices in the measurement of prudential indicators across the Zone.
The findings of the study indicate some level of convergence in the measurement of some indicators
(for example capital, earnings and liquidity) and degrees of divergence or disparities in measuring
other indicators (for instance NPLs, provisioning for NPLs and Exposure limits). A key implication
of the study is that there are difficulties in comparing countries on indicators that are measured
differently across Member States. This poses a particular challenge for WAMZ since its Member
States are aspiring for single currency through the convergence of macroeconomic policies
including the harmonizing of financial sector policies. The findings therefore underscore the need
to harmonize prudential regulations in the WAMZ not only to ensure comparability across all the
key indicators but also to provide a consistent framework for strengthening financial stability in the
Zone, a major objective of the CSWAMZ.
To facilitate the harmonization of prudential regulations, the paper proposed the introduction of a
harmonised framework for setting common standards for financial regulation and supervision, such
as the establishment of regional Financial Stability Board to set the relevant supervisory standards
that take into account regional peculiarities. This may provide a catalyst to the establishment and
operationalization of a common supervisory authority upon the launch of the single currency.
Furthermore, the paper called for the adoption a model or common banking law or code that
encapsulate as much as possible the core principles on effective banking supervision. In addition,
increased coordination should be adopted in the implementation of financial sector reforms,
especially regulatory reforms in the banking sector, in order to facilitate convergence of prudential
D

iii
regulations. Capacity building programmes for bank supervisors on contemporary issues in bank
supervision should also be strengthened in order to empower them to develop modern rules and
techniques for regulating and supervising banks in the Zone.
1
1.0 Introduction
The financial landscape in the West African
Monetary Zone1 (WAMZ) has witnessed
significant changes particularly with regard
to the increase in cross-border banking
activities in the last decade. Many experts
have attributed this to the consolidation of the
banking industry in Nigeria, the increasing
level of trade, relatively low minimum capital
requirement in other Member States and the
perceived interest rate differentials. In
addition, cross-border capital flows to bank
subsidiaries increased largely in compliance
with regulatory requirements as well as on
account of the introduction of new financial
products. These developments gave rise to
the need for close supervision of banks,
especially against the backdrop of the recent
global financial crises and the need to prevent
contagion. Furthermore, the financial crisis
showed that financial instability can occur
even in an environment where monetary
policy had achieved low and stable inflation.
The implication is that sound monetary
policy is a necessary but not a sufficient
condition for financial stability and
sustainable economic growth. Safeguarding
the stability of banks and other financial
intermediaries was therefore given greater
emphasis by regulators in Member States of
1 The WAMZ is a group of six (6) West African
countries (The Gambia, Ghana, Guinea, Liberia,
the WAMZ. The Central Banks of the
WAMZ consequently established the College
of Supervisors of the West African Monetary
Zone (CSWAMZ) in 2010 to enhance
supervisory co-operation, harmonize
supervisory processes, build capacity of bank
examiners, deepen information sharing and
strengthen financial stability in line with
international efforts aimed at improving
global financial stability.
Since its establishment, the CSWAMZ has
emerged as a key platform for deepening
cooperation among supervisors, harmonizing
supervisory processes as well as
strengthening information sharing and
capacity building among others. Through its
quarterly meetings and publications, the
CSWAMZ communicates its assessments of
developments in the banking systems
including the risks to the system and the
effort undertaken to mitigate the impending
risks. At the seventh meeting of the
Committee of Governors (CoGs) of the
CSWAMZ, it was observed that there were
different measurement of key prudential
indicators across Member States. The
situation implied that there were difficulties
in comparing countries on identical
Nigeria and Sierra Leone) with the joint objective
of attaining economic and monetary union.
2
indicators which are measured differently
across Member States. For WAMZ Member
States, aspiring for single currency through
the convergence of macroeconomic policies
including the harmonizing of financial sector
policies, this may poses a serious challenge
for financial regulation and supervision. The
CoG therefore directed the CSWAMZ to
undertake a comprehensive study to identify
the gaps in the measurement or calculation of
key prudential indicators across the Zone and
suggest ways for harmonizing them.
The objective of the paper is mainly in
pursuant of the directive of the COG - to
undertake a gap analysis of key prudential
indicators in the WAMZ and recommend
ways of harmonizing them. As this is a
maiden study on prudential indicators in the
sub-region, it will contribute significantly to
the literature and will assist Member State to
not only identify the gaps in their respective
computation of key prudential indicators but
to take steps to bridge the gap and harmonize
the measurement of indicators. The study
adopted survey based techniques to identify
the different practices in the measurement of
prudential indicators across the Zone. A
questionnaire on key prudential indicators
was sent to all central banks in Member
States. The responses were analyzed by
comparing countries’ computation of each
indicator to the standard international
definitions recommended by the Basel
Committee or the International Monetary
Fund (IMF) or both. Each indicator was
analyzed separately and scored as ‘YES’ if
consistent with international standards and
‘NO’ if otherwise. This approach will help us
identify the similarities or differences in the
computation of indicators across Member
States. A similar approach is adopted by the
Basel Committee in the assessment of
compliance with the Core Principles for
effective banking supervision.
The remaining part of this paper is organized
thus: section II gives an overview of
prudential indicators and why they are
important while section III undertake a
comparative analysis of key prudential
indicators across the zone in order to identify
the gaps. Section four IV presents the
summary and conclusion as well as policy
recommendations.
3
2.0 Overview of Prudential Rules/Indicators
Prudential rules/indicators are matrices or
measures adopted to maintain the stability of
the financial system. These include standards
adopted to ensure the solvency and financial
soundness of institutions as well as protecting
depositors and investors from losses resulting
from inefficient management, fraud and
bankruptcies of financial service providers.
At the minimum, prudential rules/indicators
intend to create a uniform framework for the
operation of the institutions within the
market.
Prudential rules/indicators may be generally
divided into two broad groups. The first
group includes those influencing the
conditions of access to the market and
intended to prevent the emergence of entities
with doubtful reputation or without the
financial capacity necessary for the
operations they intend to implement.
Specifically, they include those that control
the acquisition of qualifying holdings, the
reputation of the Board of Directors, and the
imposition of an amount for the start-up share
capital. The second group of prudential
rules/indicators are those aimed at controlling
the risks associated with financial activities.
They typically include the rules on the
adequacy of own funds to risks (credit,
market and exchange risks) incurred by the
credit institutions, the limits to the
concentration of risks on a single customer or
group of related customers, the limits of
financial participations and fixed assets, and
rules on the constitution of provisions
intended to face effective losses or to cover
potential risks. In order to control risks, the
supervisory authorities utilize preventive and
corrective prudential instruments.
The failure to appropriately calibrate risks
through prudential rule/indicators has been
associated with instances of systemic bank
failures. Recent events in global financial
markets (financial crisis) have heightened the
need for effective regulation of banking
institutions. The financial crisis showed that
banks did not always consistently measure,
aggregate and control the various risks across
their books and operations. In addition, the
liberalization of financial markets worldwide
has raised the level of cross-border risks
facing banks. Prudential regulation has
therefore arisen as a tool for mitigating
overall risks and containing the losses that
bank could face in the event of a sudden
counterparty. For example, the Basel III
capital regulation has enabled banks to
develop a reserve of capital (capital buffers)
which can be used in times of difficulty.
Furthermore, against the backdrop of regular
bank failures and increased globalization of
financial markets, the need to harmonize
prudential regulations and measures has been
brought to the front burner.

4
3.0 Analysis of Key Prudential Indicators in WAMZ Countries
The analysis of prudential indicators would
involve an assessment of the various laws
which are outside the scope of this work.
Therefore, this work was done mainly for the
second group of prudential measures which
are mainly aimed at controlling risk and
strengthening financial stability. This
approach is very critical in gauging the
attitude of Member States to financial
stability and ascertaining the potential risk to
financial stability through the gaps in the
measurement of prudential indicators. It also
helps to compare the performance of
countries on key risk indicators.
As mentioned earlier, the study adopted
survey based techniques by administering
questionnaires to identify the different
practices in the measurement of prudential
indicators across the Zone. The responses to
the questionnaire, which was sent to all
central banks in Member States, were
analyzed by comparing countries’
computation of each indicator to the standard
international definitions recommended by the
Basel Committee or the International
Monetary Fund (IMF) or both. Each indicator
was analyzed separately and scored as ‘YES’
if consistent with international standards and
‘NO’ if otherwise. In the end, Member States
were assessed based of their compliance with
international standards. The approach of the
study is similar to the Basel Committee’s
methodology for assessing compliance with
the Core Principles for effective banking
supervision.
3.1 Regulatory Capital to Risk-Weighted Assets (Capital Adequacy Ratio)
The capital adequacy ratio (CAR) is
calculated using the definition of regulatory
capital and risk-weighted assets. The Basel
Standard recommends that banks’ maintain
minimum capital adequacy ratios to ensure
that they can absorb a reasonable level of
losses before becoming insolvent.
Essentially, setting a minimum CAR will
help to protect depositors and promote the
stability and efficiency of the financial
system.
Regulatory Capital
The two components of regulatory capital are
Tier 1 and Tier 2 capital. Tier 1 capital serves
to determine if a bank can absorb losses
without ceasing operations. It mainly
includes ordinary share capital and disclosed
reserves. Tier 2 capital is supplementary bank

5
capital that includes items such as revaluation
reserves, undisclosed reserves, hybrid
instruments and subordinated term debt. Tier
2 capital determines if a bank can absorb
losses in the event of a winding-up and so
provides a lesser degree of protection to
depositors.
Risk Weighting
Under the Basel Capital Accord Framework
(Basel I), risk weighting was typically done
by measuring credit risk exposures through
adjustments to the amount of assets shown on
a bank's balance sheet. The adjustments are
made based on risk weights. For example,
bank loans are weighted, in a broad manner,
according to their degree of riskiness. Loans
to Governments are given a 0% weighting
whereas loans to individuals are weighted at
100%. Off-balance sheet contracts, such as
guarantees and foreign exchange contracts
also carry credit risks. These exposures are
converted to credit equivalent amounts which
are also weighted in the same way as on-
balance sheet credit exposures. On-balance
sheet and off-balance sheet credit exposures
are added to get total risk weighted credit
exposures.
According to the Basel Standards, the
minimum capital adequacy ratios that apply
are:
Tier-one capital to total risk weighted
credit exposures to be not less than 4
percent;
Total regulatory capital (tier one plus tier
two less certain deductions) to total risk
weighted credit exposures to be not less
than 8 percent.
Under Basel II, the risk weighted assets are
based on credit risk, operational risk and
market risk. Credit risk weighting is done in
line with credit risk charge under Basel I
while the risk weighting for operational and
market risks are based on the
recommendation of Basel II.
The WAMZ Evidence
In the WAMZ, there is some degree of
convergence among countries in defining
regulatory capital to risk-weighted assets. All
countries adopt the standard Basel definition
of the CAR, that is, Tier 1 plus Tier 2 capital
net of deductions divided by the sum of the
risk weighted assets (see Table 1). However,
some countries exercise national discretion to
limit the inclusion of Tier-two capital. In line
with the Basel recommendation, Ghana
restricts Tier 2 Capital to 100% of Tier 1
Capital while subordinated term debt is
accepted at a maximum of 50% of the core
capital element (Tier 1 Capital) and subject to
adequate amortization arrangements. The

6
Gambia restricts Tier 2 capital to 50% of Tier
1 Capital while subordinated debt is accepted
at 50% of Tier 1 capital. Nigeria on the other
hand, limits the inclusion of Tier 2 capital to
one-third of Tier 1 in calculating regulatory
capital. In Liberia, the inclusion of Tier 2
capital is limited to 50% of Tier 1, while
Sierra Leone restricts subordinated debt to
50% of Tier 1 Capital, based on the Basel I
guidelines, with deposit liabilities not
permitted to exceed 25 times the capital base.
In the WAMZ risk weighted assets for the
computation of capital adequacy are based on
credit risk charges in line with Basel I. In
Ghana, the risk weighted assets are based on
credit risk charge, market risk charge and
operational risk charge to align with the
introduction of Basel II. Nigeria has adopted
Basel II and hence computes risk weights for
capital adequacy ratio using the Basel II
framework. The Gambia, Guinea, Liberia
and Sierra Leone apply full risk weighting for
on and off balance sheet items to cover credit,
market and operational risk.
Table 1: Assessment of Similarity in the Definition of Capital Adequacy Ratio
Capital
Adequacy
Ratio
Regulatory Capital Risk Weighting
The Gambia YES YES YES (with some national
discretion)
Ghana YES YES Basel Standards (with some
national discretion)
Guinea YES YES Basel Standards
Liberia YES YES Basel Standards with
national discretion
Nigeria YES YES (but national discretion
is applied to Tier 2 Capital) Basel Standards
Sierra Leone YES Yes (but national discretion is
applied to Tier 2 Capital)
According to the Basel
Capital Accord (but with
national discretion)
NB; YES: implies consistent with the Basel Standards, No: means different from the Standard, and
N/A means Not Available
Source: Authors’ Compilation

7
3.2 Non-performing Loans (NPLs) to Gross Loans
This indicator is intended to identify
problems with asset quality in the loan
portfolio. It is calculated by using the value
of NPLs as the numerator and the total value
of the loan portfolio (including NPLs and
before the deduction of specific loan loss
provisions) as the denominator.
Non-performing loans (NPLs)
Large variations exist in terms of the
classification, scope, and content of non-
performing loans. Such a problem potentially
adds to disparity and uncertainty in the
classification of loans. Different jurisdictions
use different ways to classify loans. For
example, in the United States, federal
regulated banks are required to use the five-
tier loan classification system prescribed by
the Bank for International Settlements (BIS),
namely; Pass, Special Mention, Substandard,
Doubtful, and Loss. Presently, the five-tier
system is the most popular risk classification
method with variants in the use of the
classification terminologies such as standard
or current for pass, other loans especially
mentioned for special mention loans.
However, in some countries, there is a dual
system of reporting according to their
domestic policy guidelines as well as the
five-tier system. According to BIS, the
standard loan classifications are defined as
follows:
(1) Passed: means solvent loans (prompt
principal and interest payments);
(2) Special Mention: Loans to enterprises
which may pose some collection
difficulties, for instance, because of
continuing business losses;
(3) Substandard: Loans whose interest or
principal payments are longer than three
months in arrears of lending conditions
are used. The banks make 10% provision
for the unsecured portion of the loans
classified as substandard;
(4) Doubtful: Full liquidation of
outstanding debts appears doubtful and
the accounts suggest that there will be a
loss, the exact amount of which cannot
be determined as yet. Banks make 50%
provision for doubtful loans;
(5) Virtual Loss and Loss
(Unrecoverable): Outstanding debts are
regarded as not collectable, usually loans
to firms which applied for legal
resolution and protection under
bankruptcy laws. Banks make 100%
provision for loss loans.
According to BIS, NPLs comprise the loans
in the last three categories (Substandard,
Doubtful and Loss), and are further
8
differentiated according to the degree of
collection difficulties.
In addition, according to the Compilation
Guide on Financial Soundness Indicators
(IMF, 2008), “loans can be categorized as
nonperforming when payments of principal
and interest are past due by three months (90
days) or more, or interest payments
corresponding to three months (90 days) or
more have been capitalized (reinvested into
the principal amount), refinanced, or rolled
over (that is, payment has been delayed by
agreement)”. However, loans with payments
less than 90 days past due can be recognized
as nonperforming under national supervisory
guidance if evidence exists that the debtor has
filed for bankruptcy.
Critically, when a loan has been classified as
nonperforming, it (and/or any replacement
loan(s)) should remain so classified until
written-off or payments of interest and/or
principal are received on the initial or
subsequent loans that replace the original
loan. Going by the ‘Compilation Guide’,
replacement loans include loans arising from
rescheduling or refinancing the original
loan(s) and/or loans provided to make
payments on the original loan.
The paper considered the BIS definition of
NPLs as the Standard definition for two main
reasons. First, the standard definition makes
it possible to compare the non-performing
loan problem across countries and banks.
Second, the BIS definition is a prudential
definition for NPLs, which includes loans
with uncertainty in addition to the virtual
loss, thus, it enable banks to address the NPL
problems before it cause disasters.
Gross Loans
Gross loans imply the total credit exposure to
customers. According to the IMF (2008),
data on gross loans should exclude accrued
interest on nonperforming loans and lending
among deposit takers in the reporting
population that are part of the same group.
The WAMZ Evidence
The survey analysis in Table 2, indicates that
with the exception of Guinea, WAMZ
countries generally adopt the BIS
recommendation of classifying loans in a
tier-system with NPLs being the sum of loans
from the Substandard, Doubtful and Loss
categories). In addition, all Member States
include a duration of 90, 180 and 365 days
past due for substandard, doubtful and loss
categories, respectively. In practice,
qualitative factors are also used in classifying
loans so that the classifications are not based
only on time.

9
In terms of the definition of gross loan, all
Member States include the aggregate credit
exposure. However, it is not clear whether
deductions are made for accrued interest on
NPLs and interbank lending. In Ghana
interest on NPLs are kept in suspense
accounts and not included as part of gross
loans. Interbank lending is not customer
loans and is not included in gross loans
calculations.
Table 2: Assessment of Similarity in the Definition of the NPLs to Gross Loan
Non-performing Loans Gross Loans NPLs Ratio
The Gambia YES YES YES
Ghana YES YES 10% OR LESS
Guinea
NO: National Discretion is
applied (Unpaid credit after a
maturity of 6 months or
restructured facility for which
settlement terms were
breached).
YES (but without
deduction of provisions or
accrued interest on NPLs)
10% OR LESS
Liberia YES
YES (but without
deduction of provisions or
accrued interest on NPLs
10% OR LESS
Nigeria YES
YES (with the deduction
of provisions or accrued
interest on NPLs)
5% OR LESS
Sierra Leone YES
YES (but without
deduction of provisions or
accrued interest on NPLs)
10% OR LESS
NB; YES: implies consistent with the BIS definition, No: means different from Definition, and N/A:
implies Not Available
Source: Authors Compilation
3.3 NPLs Net of Provision to Capital
This indicator aims to provide a broader
measure of nonperforming assets in order to
ascertain the potential impact of NPL losses
on capital, which is uncertain in most
circumstances since banks sometime expect
to recover some of the potential NPL losses.
It is calculated by taking the total value of
NPLs less the value of specific loan
provisions as the numerator and capital as the
denominator. If it is the case that collateral
are widely used in the banking system, then
the indicator is the ratio of Provisions for
10
NPLs plus Collateral net of NPLs over capital
(IMF, 2008). This is to give a more realistic
picture of the potential for losses by banks
than when the ratio is calculated by excluding
collateral.
Provisions for NPLs
Provisions for loan losses are general and
specific provisions. Those relating to NPLs
are specific loan provisions. Banks are
therefore required to make specific
provisions when there is an indication that
there has been deterioration in the credit
quality of a loan wherein the borrower has
defaulted in making interest or principal
payments when due. This implies that loans
should be generally identified as impaired
when payments are contractually in arrears
for a minimum number of days, reflecting
payment practices for the type of loan in
question. Based on BIS definition of NPLs,
specific provisions should be made for the
three classification categories of loans
(Substandard, Doubtful and Loss). National
discretion is used in specifying the specific
charges for the various NPL categories.
Though OLEM is not defined as NPL in
computing specific provisions, this category
is included since the category is specifically
identified. The following are recommended
charges used by most countries for the
various specific provisions:
OLEM – 10%
Substandard – 25%
Doubtful – 50%
Loss – 100%
In addition, a bank should be required to
make a general provision to account for the
general risk of default inherent in the credit
portfolio. Under the Basel I regime general
provision is equivalent to 1% of pass
(standard or current) loans.
According to the Basel II framework, general
provisions or general loan-loss reserves
should be equal to:
i. 1.25 percentage points of weighted
risk assets or to the extent a bank uses
the Standardized Approach for credit
risk; and
ii. 0.6 percentage points of credit risk-
weighted assets or to the extent a bank
uses the Internal Risk Based (IRB)
Approach for credit risk.
The security of collateral should be
examined when evaluating the loan portfolio
since the consideration of collateral can have
significant impact on the amount of
provisioning in each category of loans
classified.
11
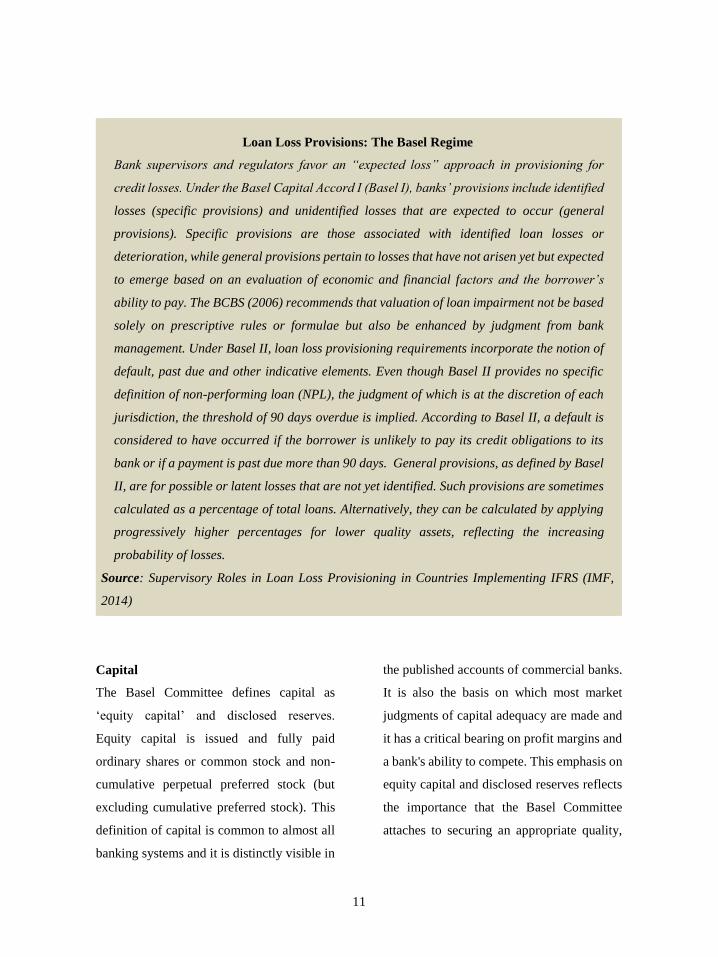
Loan Loss Provisions: The Basel Regime
Bank supervisors and regulators favor an “expected loss” approach in provisioning for
credit losses. Under the Basel Capital Accord I (Basel I), banks’ provisions include identified
losses (specific provisions) and unidentified losses that are expected to occur (general
provisions). Specific provisions are those associated with identified loan losses or
deterioration, while general provisions pertain to losses that have not arisen yet but expected
to emerge based on an evaluation of economic and financial factors and the borrower’s
ability to pay. The BCBS (2006) recommends that valuation of loan impairment not be based
solely on prescriptive rules or formulae but also be enhanced by judgment from bank
management. Under Basel II, loan loss provisioning requirements incorporate the notion of
default, past due and other indicative elements. Even though Basel II provides no specific
definition of non-performing loan (NPL), the judgment of which is at the discretion of each
jurisdiction, the threshold of 90 days overdue is implied. According to Basel II, a default is
considered to have occurred if the borrower is unlikely to pay its credit obligations to its
bank or if a payment is past due more than 90 days. General provisions, as defined by Basel
II, are for possible or latent losses that are not yet identified. Such provisions are sometimes
calculated as a percentage of total loans. Alternatively, they can be calculated by applying
progressively higher percentages for lower quality assets, reflecting the increasing
probability of losses.
Source: Supervisory Roles in Loan Loss Provisioning in Countries Implementing IFRS (IMF,
2014)
Capital
The Basel Committee defines capital as
‘equity capital’ and disclosed reserves.
Equity capital is issued and fully paid
ordinary shares or common stock and non-
cumulative perpetual preferred stock (but
excluding cumulative preferred stock). This
definition of capital is common to almost all
banking systems and it is distinctly visible in
the published accounts of commercial banks.
It is also the basis on which most market
judgments of capital adequacy are made and
it has a critical bearing on profit margins and
a bank's ability to compete. This emphasis on
equity capital and disclosed reserves reflects
the importance that the Basel Committee
attaches to securing an appropriate quality,

12
and the level, of the total capital resources
maintained by major banks.
The WAMZ Evidence
In terms of provisioning for nonperforming
assets, WAMZ countries generally use
national discretion in applying charges for
the NPLs categories. The analysis in Table 3
indicates that the charges are nonetheless
similar particularly for the ‘doubtful’ and
‘loss’ categories (50% and 100%
respectively). While The Gambia, Liberia
and Sierra Leone apply a charge of 20% for
‘substandard’ loans, Ghana applies a charge
of 25%. In Guinea, charges are applied to the
guaranteed and nonguaranteed loans based
on the duration of the “past due”. There is
also a large disparity among members in the
charges for OLEM.
Regarding the definition of capital used in the
computation of the indicator, it is largely
similar across Member States and based on
the Basel Standard, that is, ‘equity capital’
and disclosed reserves. However, in Guinea,
regulatory deductions are made.
Table 3: Assessment of Similarity in the Definition of NPLs Net of Provision to Capital
Provisions for NPLs Capital NPLs Net of Provision to Capital
Threshold
The Gambia
OLEM – 5%
Substandard – 20%
Doubtful – 50%
Loss – 100%
General – 1%
Restructured - 5%
YES Less than 100% is acceptable
Ghana
Substandard – 25%
Doubtful – 50%
Loss – 100%
Yes Not stated
Guinea
Nonguaranteed
3-6months – 50%
6-9months – 80%
9-12months – 100%
Guaranteed
6months – 30%
12months – 50%
18months – 80%
24months – 100%
Yes (but with
regulatory
deductions)
Not stated

13
Liberia
OLEM – 5%
Substandard – 20%
Doubtful – 50%
Loss – 100%
General – 1%
Yes Not stated
Nigeria
OLEM - 0%
Substandard - 10%
Doubtful - 50%
Loss - 100%
General - 2%
Yes 20%
Sierra Leone
Substandard – 20%
Doubtful – 50%
Loss – 100%
Yes Not stated
NB; YES: implies consistent with the Basel Standards, and No: means different from the Standard.
N/A: implies Not Available
Source: Authors’ Compilation
3.4 Leverage (Debt/Equity)
Leverage is defined as the ratio of total debt
to equity. It is principally the amount of debt
used to finance banks’ assets. There are three
main types of leverage, namely: balance
sheet, economic, and embedded. Leverage
allows a financial institution to increase the
potential gains or losses on a position or
investment beyond what would be possible
through a direct investment of its own funds
(IMF 2008). No single measure can capture
all three dimensions simultaneously.
However, the indicator is based on balance
sheet concepts of leverage because it is the
most visible and widely recognized form.
Whenever an entity’s assets exceed its equity
base, its balance sheet is said to be leveraged.
Banks typically engage in leverage by
borrowing to acquire more assets, with the
aim of increasing their return on equity.
Debt
The IMF FSI Compilation Guide defines debt
as the outstanding amount of those actual
current and non-contingent liabilities that
require payments of principal and/or interest
by the debtor at some point(s) in the future.
Hence, debt comprises all financial liabilities
including currency and deposits, loans, debt
securities, and other liabilities.
Equity
Equity is basically the Tier I capital which is
paid up capital plus reserves. “Capital and
reserves” is defined as the equity interest of
14
the owners in an enterprise and is the
difference between total assets and liabilities.
It represents the amount available to absorb
unidentified losses (IMF, 2008).
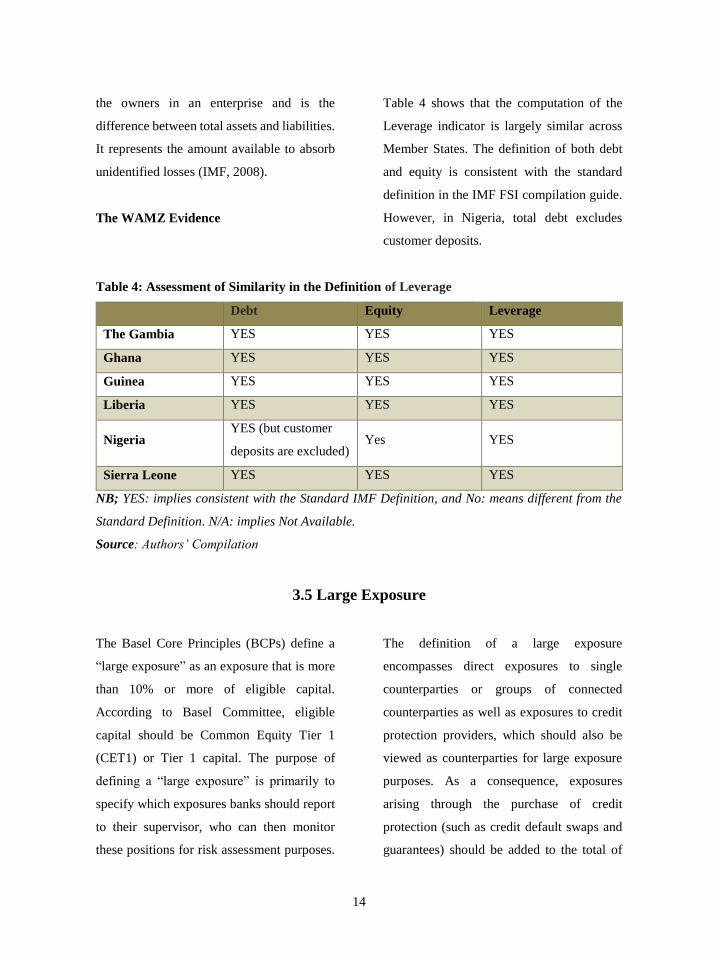
The WAMZ Evidence
Table 4 shows that the computation of the
Leverage indicator is largely similar across
Member States. The definition of both debt
and equity is consistent with the standard
definition in the IMF FSI compilation guide.
However, in Nigeria, total debt excludes
customer deposits.
Table 4: Assessment of Similarity in the Definition of Leverage
Debt Equity Leverage
The Gambia YES YES YES
Ghana YES YES YES
Guinea YES YES YES
Liberia YES YES YES
Nigeria YES (but customer
deposits are excluded) Yes YES
Sierra Leone YES YES YES
NB; YES: implies consistent with the Standard IMF Definition, and No: means different from the
Standard Definition. N/A: implies Not Available.
Source: Authors’ Compilation
3.5 Large Exposure
The Basel Core Principles (BCPs) define a
“large exposure” as an exposure that is more
than 10% or more of eligible capital.
According to Basel Committee, eligible
capital should be Common Equity Tier 1
(CET1) or Tier 1 capital. The purpose of
defining a “large exposure” is primarily to
specify which exposures banks should report
to their supervisor, who can then monitor
these positions for risk assessment purposes.
The definition of a large exposure
encompasses direct exposures to single
counterparties or groups of connected
counterparties as well as exposures to credit
protection providers, which should also be
viewed as counterparties for large exposure
purposes. As a consequence, exposures
arising through the purchase of credit
protection (such as credit default swaps and
guarantees) should be added to the total of

15
any other direct exposures to the same
counterparty.
Specifically, the additional criterion of
principle 19 of the BCPs states that:
With respect to credit exposure to single
counterparties or groups of connected
counterparties, banks are required to adhere
to the following definitions:
a) ten per cent or more of a bank’s capital
is defined as a large exposure; and
b) twenty-five per cent of a bank’s capital
is the limit for an individual large
exposure to a private sector non-bank
counterparty or a group of connected
counterparties.
Minor deviations from these limits may be
acceptable, especially if explicitly temporary
or related to very small or specialized banks.
A stocktaking exercise by the Basel
Committee revealed many jurisdictions
currently apply a large exposure limit of 25%
of a bank’s total regulatory capital. This
value is consistent with both the Committee’s
1991 large exposures guidance and the Core
principles for effective banking supervision.
Other member jurisdictions also apply
different limits from within a range of 10–
50% of capital and/or they base the limit on a
different definition of capital.
The purpose of monitoring large exposures is
to raise early warning flags that may then
warrant further investigation by the
supervisor. For these flags to be effective, the
Basel Committee proposes that banks should
report to their supervisor all their large
exposures or, if the number of large
exposures is less than 20, their largest 20
exposures irrespective of their size relative to
the bank’s capital base. The Committee is
also of the view that the reporting of large
exposures would be enhanced if the exposure
is reported both before and after applying
credit risk mitigation techniques. In addition,
large exposures to counterparties to which
the large exposure limit does not apply (for
example sovereigns) should also be reported.
The WAMZ Evidence
With the exception of Sierra Leone, Member
States generally have large exposure limits in
place. However, there is wide disparity
among WAMZ countries regarding the
definition of ‘large exposure’. Table 5 shows
that the limits for large exposure include 10%
(Ghana and Nigeria), 15% (Guinea) and 25%
(The Gambia). Furthermore, the limits are
not generally based on eligible capital as
prescribed by the Basel Committee. Large
exposure limits are based on net owned funds
(Ghana), net shareholders’ equity (Guinea),
net worth (The Gambia and Liberia) and
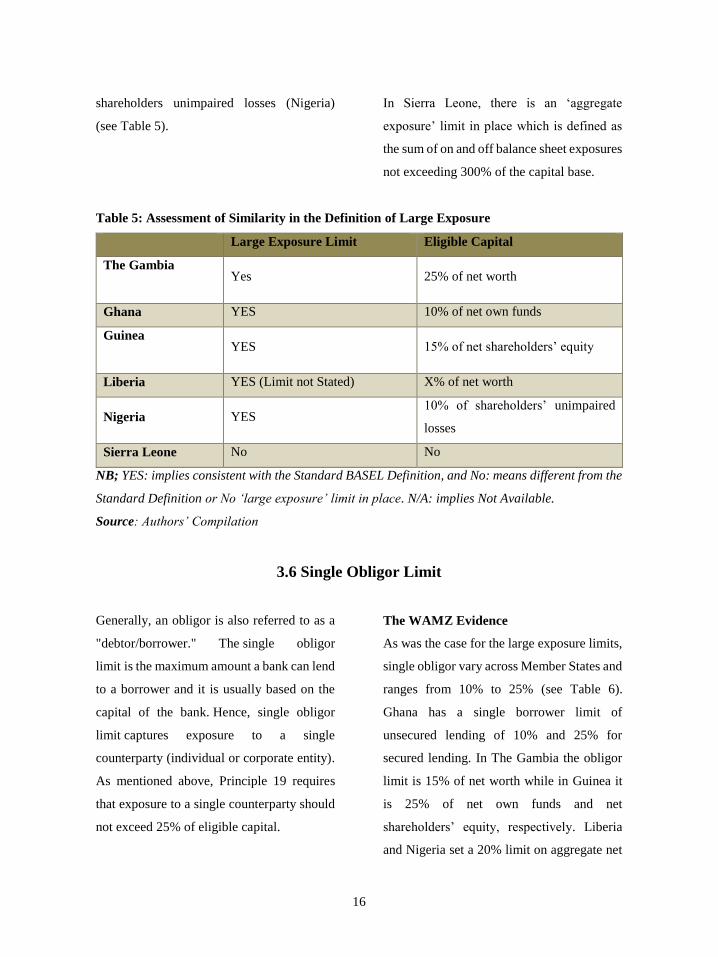
16
shareholders unimpaired losses (Nigeria)
(see Table 5).
In Sierra Leone, there is an ‘aggregate
exposure’ limit in place which is defined as
the sum of on and off balance sheet exposures
not exceeding 300% of the capital base.
Table 5: Assessment of Similarity in the Definition of Large Exposure
Large Exposure Limit Eligible Capital
The Gambia
Yes 25% of net worth
Ghana YES 10% of net own funds
Guinea
YES 15% of net shareholders’ equity
Liberia YES (Limit not Stated) X% of net worth
Nigeria YES 10% of shareholders’ unimpaired
losses
Sierra Leone No No
NB; YES: implies consistent with the Standard BASEL Definition, and No: means different from the
Standard Definition or No ‘large exposure’ limit in place. N/A: implies Not Available.
Source: Authors’ Compilation
3.6 Single Obligor Limit
Generally, an obligor is also referred to as a
"debtor/borrower." The single obligor
limit is the maximum amount a bank can lend
to a borrower and it is usually based on the
capital of the bank. Hence, single obligor
limit captures exposure to a single
counterparty (individual or corporate entity).
As mentioned above, Principle 19 requires
that exposure to a single counterparty should
not exceed 25% of eligible capital.
The WAMZ Evidence
As was the case for the large exposure limits,
single obligor vary across Member States and
ranges from 10% to 25% (see Table 6).
Ghana has a single borrower limit of
unsecured lending of 10% and 25% for
secured lending. In The Gambia the obligor
limit is 15% of net worth while in Guinea it
is 25% of net own funds and net
shareholders’ equity, respectively. Liberia
and Nigeria set a 20% limit on aggregate net

17
worth and shareholders’ fund. In Sierra
Leone, there is a 10% percent limit on capital
base for unsecured lending and 25% for
secured lending.
Table 6: Assessment of Similarity in the Definition of Single Obligor Limit
Single Obligor Limit Eligible Capital
The Gambia
YES 15% of net worth
Ghana YES
10%- unsecured and 25% secured
of net own funds (i.e. unimpaired
capital base)
Guinea
YES 25% of net shareholders’ equity
Liberia YES 20% of aggregate net worth
Nigeria YES 20% of shareholders’ funds
Sierra Leone YES 10% of capital base for unsecured
25% of capital base for secured
NB; YES: implies consistent with the Standard BASEL Definition, and No: means different from the
Standard Definition or No ‘large exposure’ limit in place. N/A: implies Not Available.
Source: Authors’ Compilation
3.7 Insider Related Lending
Principle 20 of the BCPs states that the
supervisor should require banks to enter into
any transactions with related parties on an
arm’s length basis in order to monitor these
transactions, take appropriate steps to control
or mitigate the risks and to write off
exposures to related parties in accordance
with standard policies and processes. The aim
of principle 20 is to prevent abuses arising in
transactions with related parties and to
address the risk of conflict of interest
Specifically, the Basel Committee defines
related party and related party transactions as
follows:
(i) Related parties can include, among other
things, the bank’s subsidiaries, affiliates,
and any party (including their

18
subsidiaries, affiliates and special
purpose entities) that the bank exerts
control over or that exerts control over
the bank, the bank’s major shareholders,
Board members, senior management and
key staff, their direct and related
interests, and their close family members
as well as corresponding persons in
affiliated companies.
(ii) Related party transactions include on-
balance sheet and off-balance sheet
credit exposures and claims, as well as,
dealings such as service contracts, asset
purchases and sales, construction
contracts, lease agreements, derivative
transactions, borrowings, and write-offs.
The term transaction should be
interpreted broadly to incorporate not
only transactions that are entered into
with related parties but also situations in
which an unrelated party (with whom a
bank has an existing exposure)
subsequently becomes a related party.
The Basel Committee recommends that the
exposure to related or connected
counterparties should not exceed 5% of the
eligible capital base and that the supervisor
should require banks to actively seek to
identify possible connected or related
counterparties and transactions.
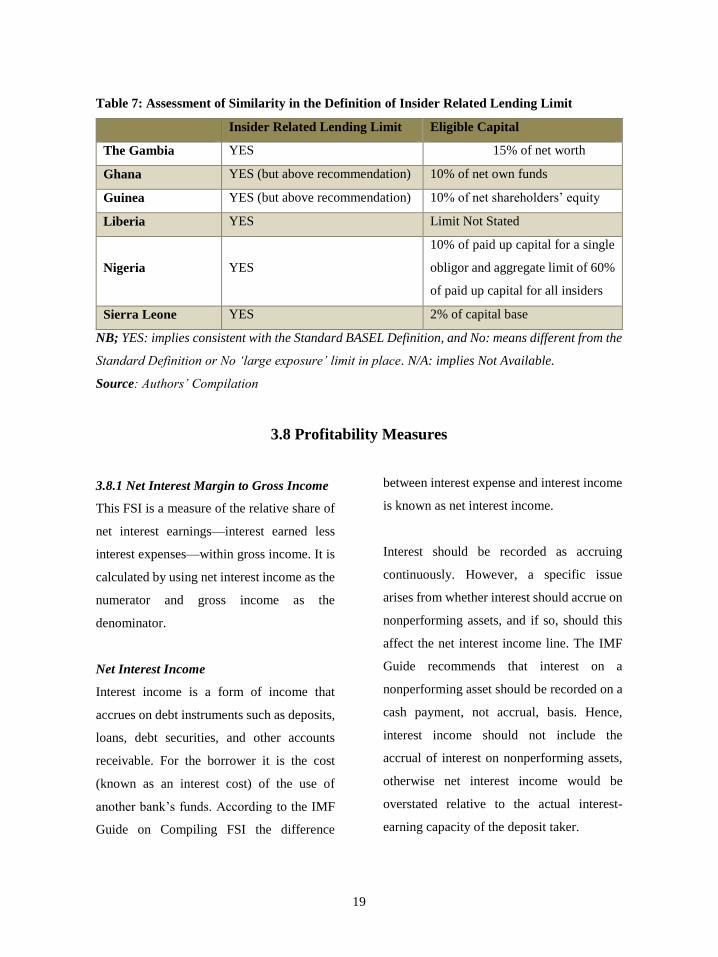
The WAMZ Experience
Table 7 shows that all Member States have
limits on ‘insider related lending’ and the
definition of insider or related parties are
fairly similar and consistent with the Basel
definition. However, the lending limit to
related party varies across member
jurisdictions. The Gambia limits insider
lending to 15% of net worth while Ghana and
Guinea limit credit exposure to the insider
related party at 10% of net own funds and net
shareholders’ equity, respectively, while in
Sierra Leone it is 2% of the capital base.
Insider related party transaction in Liberia
and Nigeria must be approved by their
respective central banks. In Nigeria, the
aggregate limit for all insiders is 60% of paid
up capital while that of single insider is 10%.
19
Table 7: Assessment of Similarity in the Definition of Insider Related Lending Limit
Insider Related Lending Limit Eligible Capital
The Gambia YES 15% of net worth
Ghana YES (but above recommendation) 10% of net own funds
Guinea YES (but above recommendation) 10% of net shareholders’ equity
Liberia YES Limit Not Stated
Nigeria YES
10% of paid up capital for a single
obligor and aggregate limit of 60%
of paid up capital for all insiders
Sierra Leone YES 2% of capital base
NB; YES: implies consistent with the Standard BASEL Definition, and No: means different from the
Standard Definition or No ‘large exposure’ limit in place. N/A: implies Not Available.
Source: Authors’ Compilation
3.8 Profitability Measures
3.8.1 Net Interest Margin to Gross Income
This FSI is a measure of the relative share of
net interest earnings—interest earned less
interest expenses—within gross income. It is
calculated by using net interest income as the
numerator and gross income as the
denominator.
Net Interest Income
Interest income is a form of income that
accrues on debt instruments such as deposits,
loans, debt securities, and other accounts
receivable. For the borrower it is the cost
(known as an interest cost) of the use of
another bank’s funds. According to the IMF
Guide on Compiling FSI the difference
between interest expense and interest income
is known as net interest income.
Interest should be recorded as accruing
continuously. However, a specific issue
arises from whether interest should accrue on
nonperforming assets, and if so, should this
affect the net interest income line. The IMF
Guide recommends that interest on a
nonperforming asset should be recorded on a
cash payment, not accrual, basis. Hence,
interest income should not include the
accrual of interest on nonperforming assets,
otherwise net interest income would be
overstated relative to the actual interest-
earning capacity of the deposit taker.

20
Gross Income
Gross income includes both net interest
income and other gross income. Other gross
income is also called non-interest income.
Noninterest income is all other income
received by the deposit taker. Included are
fees and commissions from the provision of
services, gains and losses on financial
instruments, and other income which
includes dividend income. Hence, gross
income is equal to net interest income plus
noninterest income.
According to the FSI Guide, noninterest
income inclusion of realized and unrealized
gains and losses arising during each period on
all financial instruments (financial assets and
liabilities, in domestic and foreign
currencies) valued at market or fair value in
the balance sheet, excluding equity in
associates, subsidiaries, and any reserve
equity investments. Gains and losses on
foreign exchange instruments and on
financial derivative instruments, such as
interest rate swaps, are also included.
However, Gains and losses on financial
instruments should exclude any interest
included in the net interest income account as
accrued for that instrument in the reporting
period, as such amounts have been already
accounted for in the income account as
interest income.
A number of adjustments are specified to
eliminate the impact of intra sector
transactions on sectoral gross income. These
include the elimination of the following
income items arising from positions and
transactions with other deposit takers in the
reporting population: fees and commissions
receivable; the investing deposit taker’s
prorated share of the earnings of associate
deposit takers, dividends receivable from
other deposit takers, other income receivable
from other deposit takers, and gains and
losses on deposit takers’ ownership of
equities of other deposit takers.
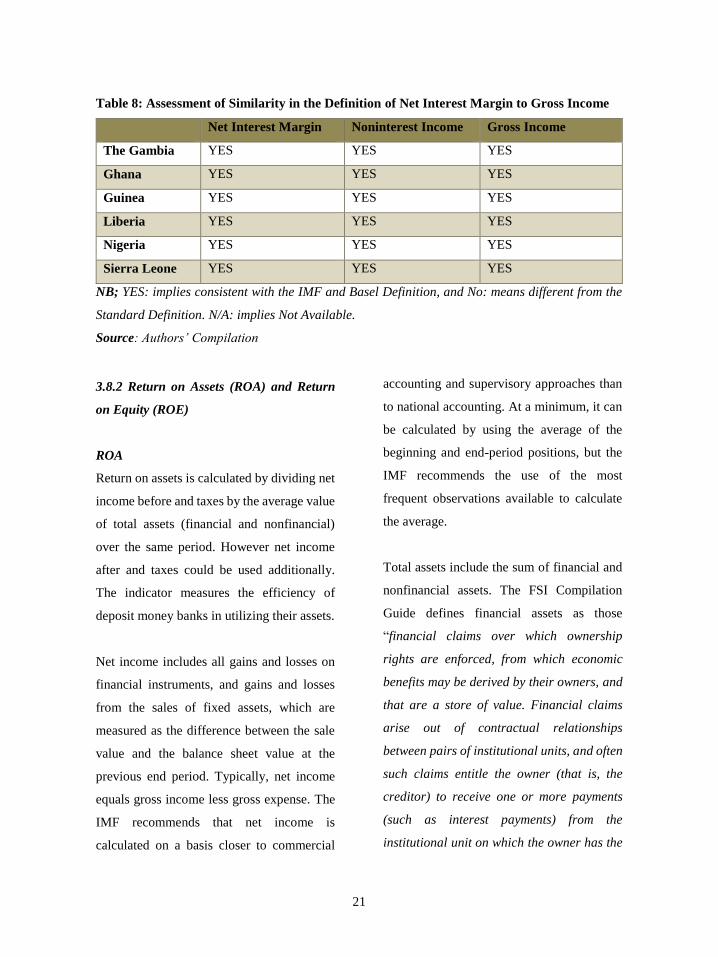
The WAMZ Experience
The definitions of Interest Income,
Noninterest income and gross income are
relatively similarly and consistent with the
IMF Guide and the Basel operational risk
framework for gross income definition (see
Table 8).
21
Table 8: Assessment of Similarity in the Definition of Net Interest Margin to Gross Income
Net Interest Margin Noninterest Income Gross Income
The Gambia YES YES YES
Ghana YES YES YES
Guinea YES YES YES
Liberia YES YES YES
Nigeria YES YES YES
Sierra Leone YES YES YES
NB; YES: implies consistent with the IMF and Basel Definition, and No: means different from the
Standard Definition. N/A: implies Not Available.
Source: Authors’ Compilation
3.8.2 Return on Assets (ROA) and Return
on Equity (ROE)
ROA
Return on assets is calculated by dividing net
income before and taxes by the average value
of total assets (financial and nonfinancial)
over the same period. However net income
after and taxes could be used additionally.
The indicator measures the efficiency of
deposit money banks in utilizing their assets.
Net income includes all gains and losses on
financial instruments, and gains and losses
from the sales of fixed assets, which are
measured as the difference between the sale
value and the balance sheet value at the
previous end period. Typically, net income
equals gross income less gross expense. The
IMF recommends that net income is
calculated on a basis closer to commercial
accounting and supervisory approaches than
to national accounting. At a minimum, it can
be calculated by using the average of the
beginning and end-period positions, but the
IMF recommends the use of the most
frequent observations available to calculate
the average.
Total assets include the sum of financial and
nonfinancial assets. The FSI Compilation
Guide defines financial assets as those
“financial claims over which ownership
rights are enforced, from which economic
benefits may be derived by their owners, and
that are a store of value. Financial claims
arise out of contractual relationships
between pairs of institutional units, and often
such claims entitle the owner (that is, the
creditor) to receive one or more payments
(such as interest payments) from the
institutional unit on which the owner has the
22
claim (the debtor)”. In addition, financial
claims generate holdings gains (and losses)
for their owners. When a financial claim is
created, a liability of equal value is
simultaneously incurred by the debtor as the
counterpart to the financial asset. On the
other hand, nonfinancial assets are all
economic assets other than financial assets.
ROE
Return on equity is calculated by dividing net
income (gross income less gross expenses)
by the average value of capital over the same
period. This measures the banks’ efficiency
in using their capital and also provides
information on the sustainability of deposit
takers’ capital position over time. It can be
interpreted in combination with FSIs on
capital adequacy, because a high ratio could
indicate high profitability and/or low
capitalization, and a low ratio could indicate
low profitability and/or high capitalization.
Capital is measured as capital and reserves or
Tier 1 capital. On a cross-border consolidated
basis, some countries may prefer to employ
total regulatory capital in calculating the
remaining capital-based ratios instead of, or
in addition to Tier 1 capital.
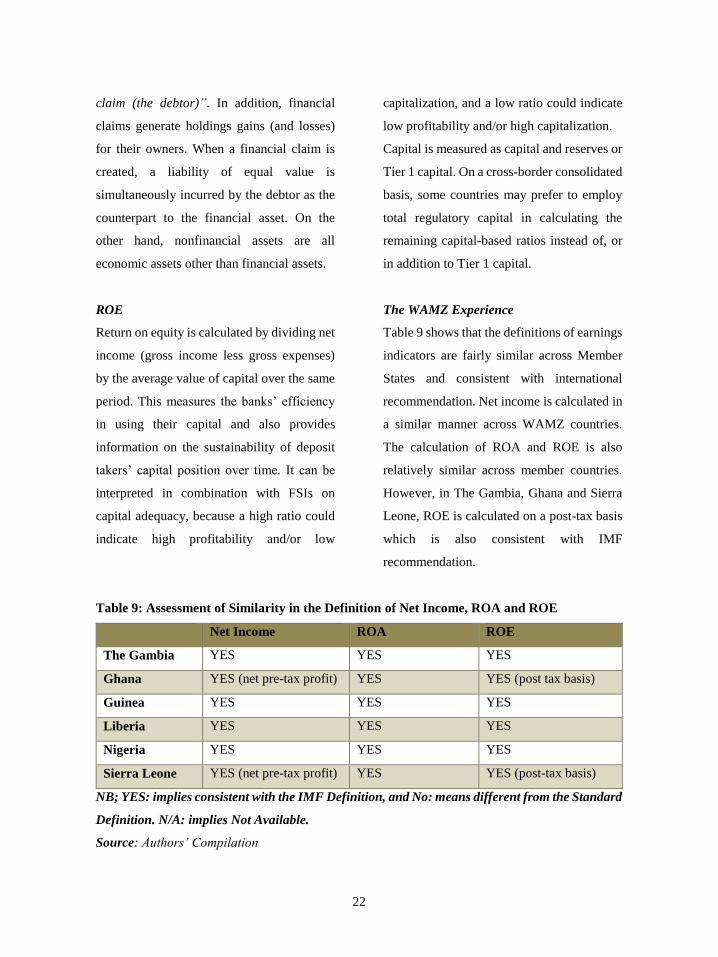
The WAMZ Experience
Table 9 shows that the definitions of earnings
indicators are fairly similar across Member
States and consistent with international
recommendation. Net income is calculated in
a similar manner across WAMZ countries.
The calculation of ROA and ROE is also
relatively similar across member countries.
However, in The Gambia, Ghana and Sierra
Leone, ROE is calculated on a post-tax basis
which is also consistent with IMF
recommendation.
Table 9: Assessment of Similarity in the Definition of Net Income, ROA and ROE
Net Income ROA ROE
The Gambia YES YES YES
Ghana YES (net pre-tax profit) YES YES (post tax basis)
Guinea YES YES YES
Liberia YES YES YES
Nigeria YES YES YES
Sierra Leone YES (net pre-tax profit) YES YES (post-tax basis)
NB; YES: implies consistent with the IMF Definition, and No: means different from the Standard
Definition. N/A: implies Not Available.
Source: Authors’ Compilation
23
3.9 Liquidity
3.9.1 Core Liquid Assets to Total Assets
The indicator is calculated by using the core
measure of liquid assets as the numerator and
total assets as the denominator. It can also be
calculated by using the broad measure of
liquid assets (IMF 2008). Generally, the
indicator provides an indication of the
liquidity available to meet expected and
unexpected demands for cash.
Liquid assets are those assets that are readily
available to an entity to meet a demand for
cash. For a financial asset to be classified as
a liquid asset, the holder must have the
reasonable certainty that it can be converted
into cash with speed and without significant
loss under normal business condition.
According to the FSI compilation guide,
liquid assets comprise mainly of currency,
deposits, other financial assets that are
available either on demand or within three
months or less and securities that are traded
in liquid markets (including repo markets)
that can be readily converted into cash, with
insignificant risk of change in value under
normal business conditions (IMF 2008).
However, deposit takers’ deposits and other
non-traded claims with other deposit takers
are excluded.
The IMF FSI Compilation Guide
distinguishes between core and broad liquid
assets. Core liquid assets comprise currency
and deposits and other financial assets that
are available either on demand or within three
months or less, excluding interbank deposits
(and other non-traded claims). On the other
hand, Broad liquid assets include those in the
core measure plus securities that are traded in
liquid markets (including repo markets) that
can be readily converted into cash without a
significant risk of change in value under
normal business conditions. Such securities
include those issued by the government.
Total assets include all financial and
nonfinancial assets, as earlier defined.
3.9.2 Core Liquid Assets to Short-term
Liabilities
This FSI is calculated by using the core
measure of liquid assets as the numerator and
the short-term liabilities as the denominator.
As mentioned above, an indicator of liquidity
can also be calculated by taking the broad
measure of liquid assets. The indicator is
intended to capture the liquidity mismatch of
assets and liabilities, and provides an
indication of the extent to which deposit
24
takers could meet the short-term withdrawal
of funds without facing liquidity problems.
Short-term liabilities are the short-term
element of the debt liabilities of banks plus
the net short-term market value of the
financial derivatives position (liabilities less
assets). However, it excludes liabilities to
other deposit takers in the banking system. In
addition, the indicator could also be
calculated excluding financial derivative
positions, that is, by using the ratio using
short-term debt only, especially if a net
financial derivative asset position were
significantly affecting the ratio. The IMF FSI
Guide recommends that “short term” should
be defined on a remaining maturity basis
although the original maturity could be an
alternative.
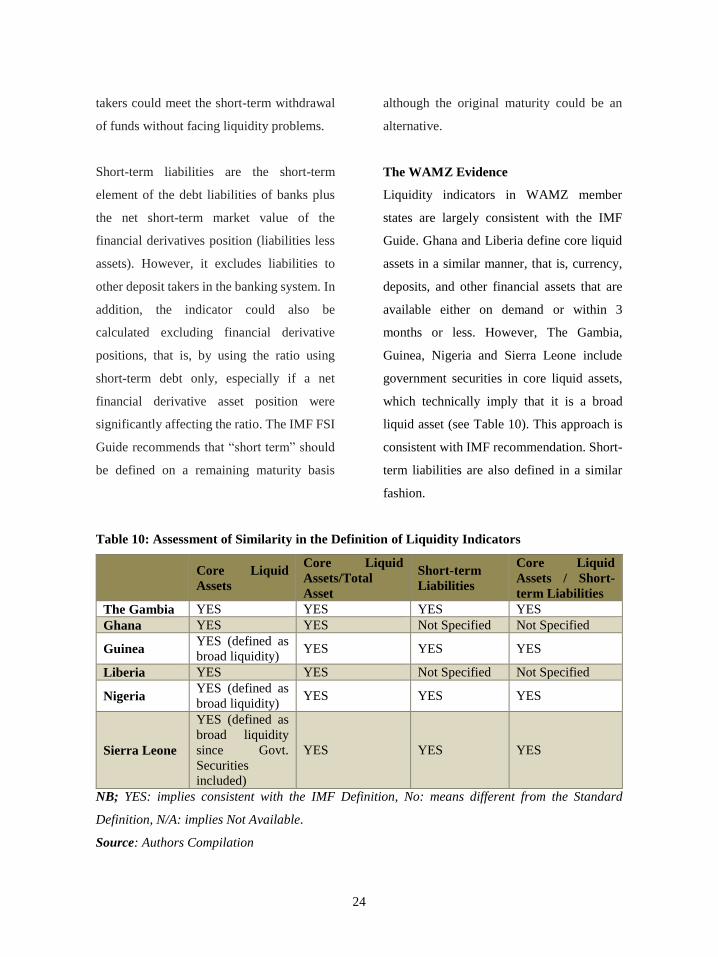
The WAMZ Evidence
Liquidity indicators in WAMZ member
states are largely consistent with the IMF
Guide. Ghana and Liberia define core liquid
assets in a similar manner, that is, currency,
deposits, and other financial assets that are
available either on demand or within 3
months or less. However, The Gambia,
Guinea, Nigeria and Sierra Leone include
government securities in core liquid assets,
which technically imply that it is a broad
liquid asset (see Table 10). This approach is
consistent with IMF recommendation. Short-
term liabilities are also defined in a similar
fashion.
Table 10: Assessment of Similarity in the Definition of Liquidity Indicators
Core Liquid
Assets
Core Liquid
Assets/Total
Asset
Short-term
Liabilities
Core Liquid
Assets / Short-
term Liabilities
The Gambia YES YES YES YES
Ghana YES YES Not Specified Not Specified
Guinea YES (defined as
broad liquidity) YES YES YES
Liberia YES YES Not Specified Not Specified
Nigeria YES (defined as
broad liquidity) YES YES YES
Sierra Leone
YES (defined as
broad liquidity
since Govt.
Securities
included)
YES YES YES
NB; YES: implies consistent with the IMF Definition, No: means different from the Standard
Definition, N/A: implies Not Available.
Source: Authors Compilation
25
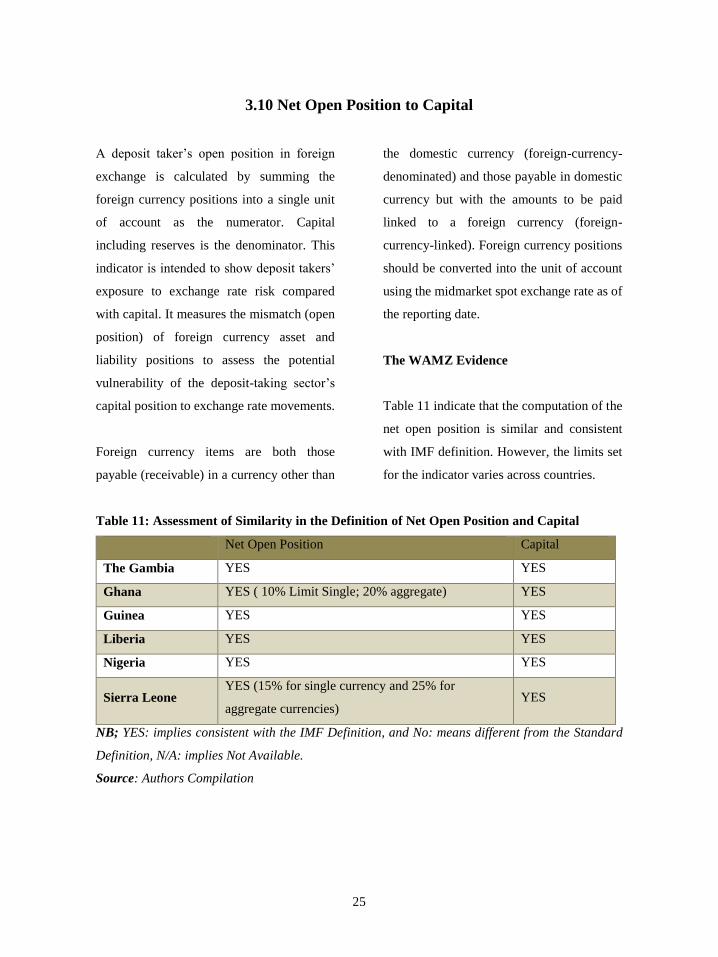
3.10 Net Open Position to Capital
A deposit taker’s open position in foreign
exchange is calculated by summing the
foreign currency positions into a single unit
of account as the numerator. Capital
including reserves is the denominator. This
indicator is intended to show deposit takers’
exposure to exchange rate risk compared
with capital. It measures the mismatch (open
position) of foreign currency asset and
liability positions to assess the potential
vulnerability of the deposit-taking sector’s
capital position to exchange rate movements.
Foreign currency items are both those
payable (receivable) in a currency other than
the domestic currency (foreign-currency-
denominated) and those payable in domestic
currency but with the amounts to be paid
linked to a foreign currency (foreign-
currency-linked). Foreign currency positions
should be converted into the unit of account
using the midmarket spot exchange rate as of
the reporting date.
The WAMZ Evidence
Table 11 indicate that the computation of the
net open position is similar and consistent
with IMF definition. However, the limits set
for the indicator varies across countries.
Table 11: Assessment of Similarity in the Definition of Net Open Position and Capital
Net Open Position Capital
The Gambia YES YES
Ghana YES ( 10% Limit Single; 20% aggregate) YES
Guinea YES YES
Liberia YES YES
Nigeria YES YES
Sierra Leone YES (15% for single currency and 25% for
aggregate currencies) YES
NB; YES: implies consistent with the IMF Definition, and No: means different from the Standard
Definition, N/A: implies Not Available.
Source: Authors Compilation
26
4.0 Summary, Conclusion and Recommendations
4.1 Summary
Overall, the results of the comparative
analysis indicates some level of convergence
in the definition of indicators of regulatory
capital, leverage, earnings, liquidity and loan
classification. However, there were major
areas of divergence on the computation of
NPLs, provisions for NPLs, limits to large
exposures as well as single counterparty and
insider lending,
All countries include Tier 1 and Tier 2 capital
in the computation of regulatory capital.
Although Ghana, Nigeria and Sierra Leone
apply national discretion for Tier 2, it is
consistent with the Basel I capital definitions
and Basel II recommendations (Nigeria). On
the other hand, there is a wide disparity in the
risk weight particularly for operational and
market risks. All Member States surveyed
used similar definitions of debt and equity to
compute leverage, consistent with IMF
recommendation. However, Nigeria excludes
customer deposits from total debt. In
addition, the major indicators of earnings
such as interest income, noninterest income,
ROA and ROE are defined in a similar
manner. The Gambia, Ghana and Sierra
Leone compute ROE on a post-tax basis but
the approach is consistent with the IMF
recommendation. Liquidity indicators are
also calculated according to IMF
recommendation in all countries. However,
core liquid assets in The Gambia, Sierra
Leone and Nigeria are technically broad
liquid assets since they include government
securities. All Member States except Guinea,
classify loan according to the 5-tier
classification system recommended by the
BIS.
Regarding the computation on the level of
NPLs and provisioning for NPLs, the results
showed some degree of divergence. While
Guinea has a national definition of NPLs,
Ghana, Liberia, Nigeria and Sierra Leone
classify loans in the substandard, doubtful
and loss categories as NPLs in line with the
recommendations of BIS. The level of
provisioning for the various categories of
NPLs also varies across countries (see Table
3). In terms of large exposures and exposures
to insiders and single counterparties, the
limits generally vary across countries but
within the Basel recommendations for large
exposures. In addition, the limits on insider
lending are generally above the Basel
recommendation (5% of eligible capital)
except in Sierra Leone.
27
4.2 Conclusion and Recommendations
The study reviews the practices in the
measurement of key prudential indicators in
Member States of the WAMZ in order to
provide the basis for harmonizing prudential
regulations. The findings of the study
indicate some level of convergence in the
measurement of some indicators (for
example capital, earnings and liquidity) and
degrees of divergence or disparities in
measuring other indicators (for instance
NPLs, provisioning for NPLs and Exposure
limits). A key implication of the study is that
there are difficulties in comparing countries
on indicators that are measured differently
across Member States. This poses a particular
challenge for WAMZ since its Member
States are aspiring for single currency
through the convergence of macroeconomic
policies including the harmonizing of
financial sector policies. The findings
therefore underscore the need to harmonize
prudential regulations in the WAMZ not only
to ensure comparability across all the key
indicators but also to provide a consistent
framework for strengthening financial
stability in the Zone, a major objective of the
CSWAMZ.
To facilitate the harmonization of prudential
regulations, the study therefore proposes the
following recommendations.
a) The Authorities of the WAMZ should
develop a framework for setting
common standards for financial
regulation and supervision. This may
include transforming the CSWAMZ into
a Regional Financial Stability Board
(RFSB) that will be responsible for
issuing common standards for regulating
and supervising banks and other
financial institutions.
The RFSB may collaborate with the
global Financial Stability Board to set
the standards that take into account
regional peculiarities. In addition, RFSB
will be a catalyst to the establishment
and operationalization of a regional
supervisory authority upon the launch of
the single currency.
b) The Authorities should develop for
adoption a model or common banking
law or code that encapsulate as much as
possible the core principles on effective
banking supervision.
c) The Authorities should coordinate the
implementation of Basel I and II,
financial sector reforms, especially
regulatory reforms in the banking sector,
28
in order to facilitate convergence of
prudential regulations.
d) Capacity building programmes for bank
supervisors on contemporary issues in
bank supervision should be strengthened
in order to empower them to develop
modern rules and techniques for
regulating and supervising banks.
Moreover, training should be at all levels
and on a continuous basis. Central banks
should endeavour to recruit highly
skilled staff as supervisors.
e) The Authorities should complement this
study with an External Assessment of
Compliance with the Basel Core
Principles and implementation of the
recommendations of the Assessment.

29
References
Basel Committee on Banking Supervision
(2011), Core Principles for Effective
Banking Supervision
Basel Committee on Banking Supervision
(2013), Supervisory framework for
measuring and controlling large
exposures
Basel Committee on Banking Supervision
(2014), Basel III leverage ratio
framework and disclosure requirements.
European Banking Coordination “Vienna”
Initiative (2012), Working Group on
NPLs in Central, Eastern and South-
eastern Europe.
Monetary Authority of Singapore (2012),
Related Party Transaction Requirements
for Banks.
IMF (2006), Financial Soundness Indicators:
Compilation Guide
IMF (2008), Financial Soundness Indicators:
Amendments to the Guide