Embed Size (px)
Citation preview
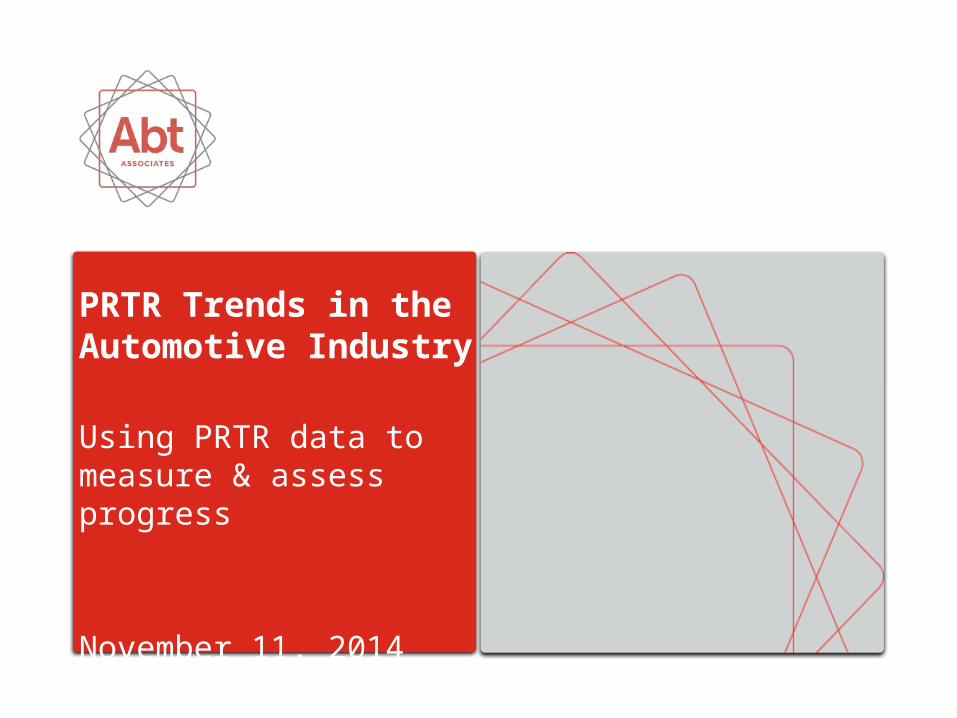
PRTR Trends in the Automotive Industry
Using PRTR data to measure & assess progress
November 11, 2014
Abt Associates | pg 2
Overview
PRTR data can be used to track industry-level trends in toxic releases and industry progress in pollution prevention
In this presentation, we use PRTR data to:
– Track trends in releases by the automotive sector
– Investigate the drivers changes in releases
– Look at the impact of pollution prevention on the sector’s releases
Automotive Industry as defined in this analysis:
– Motor Vehicle Manufacturing (NAICS 3361)
– Motor Vehicle Body and Trailer Manufacturing (NAICS 3362)
– Motor Vehicle Parts Manufacturing (NAICS 3363)
Abt Associates | pg 3
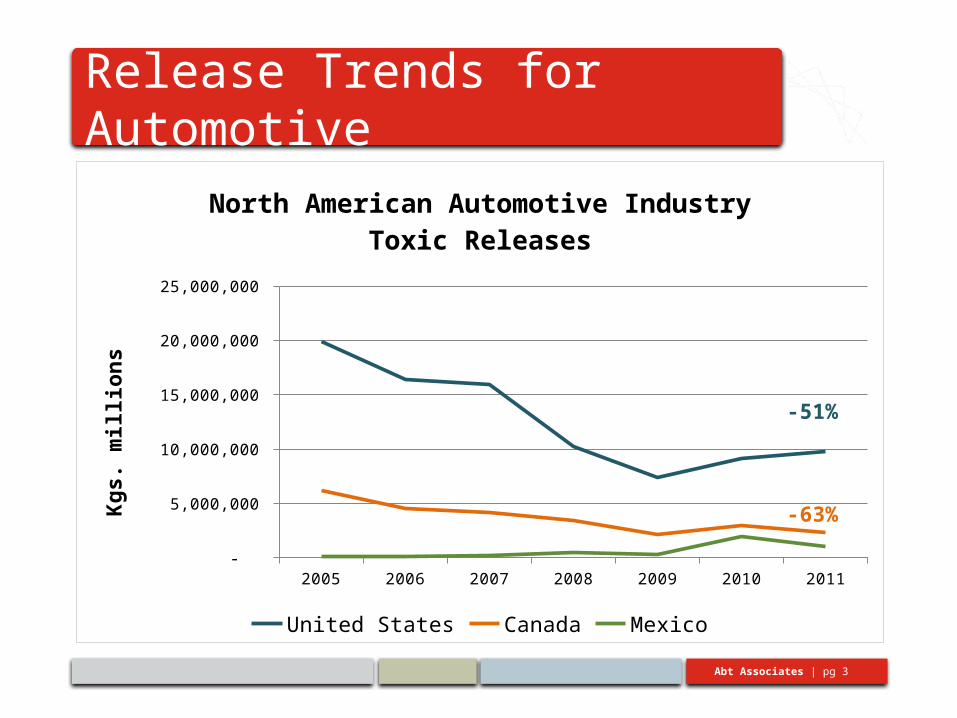
Release Trends for Automotive
2005 2006 2007 2008 2009 2010 2011 -
5,000,000
10,000,000
15,000,000
20,000,000
25,000,000
North American Automotive Industry Toxic Releases
United States Canada Mexico
Kgs.
mill
ions
-63%
-51%
Abt Associates | pg 4
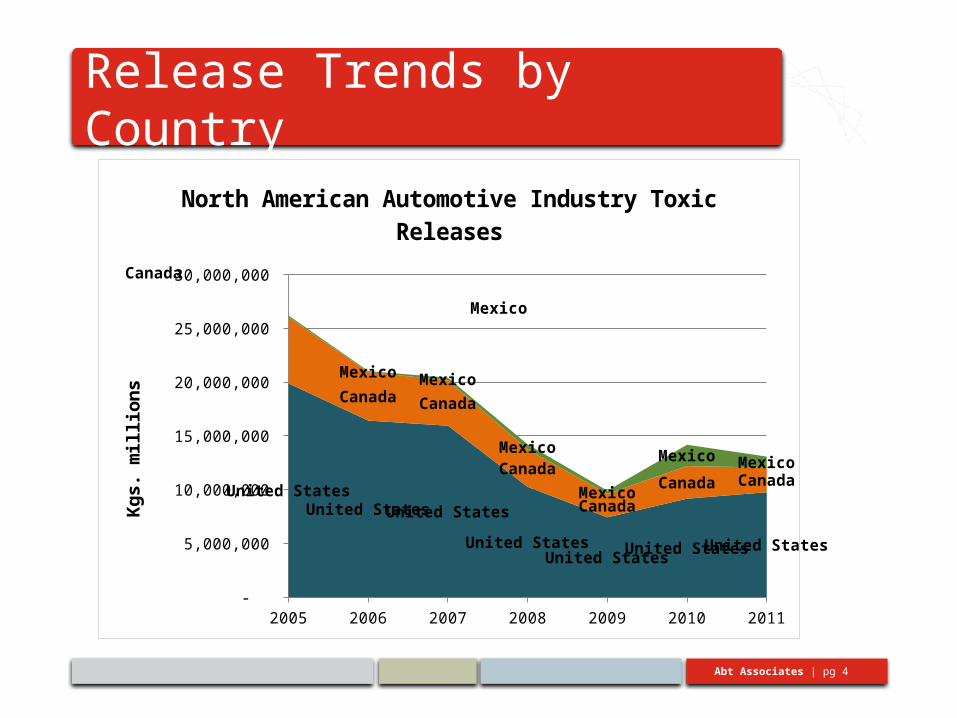
Release Trends by Country
2005 2006 2007 2008 2009 2010 2011 -
5,000,000
10,000,000
15,000,000
20,000,000
25,000,000
30,000,000
United StatesUnited StatesUnited States
United StatesUnited States
United StatesUnited States
Canada
Canada Canada
Canada
Canada
Canada Canada
Mexico
Mexico Mexico
Mexico
Mexico
Mexico Mexico
North American Automotive Industry Toxic Releases
Kgs.
mill
ions
Abt Associates | pg 5
What is driving the decrease in releases?
Is it due to pollution prevention or other factors?
– Economy?
– A shift from releases to other waste management methods (e.g., treating the waste)?
– Reductions from a few facilities that are driving the sector-wide trend?
– Outsourcing?
Abt Associates | pg 6
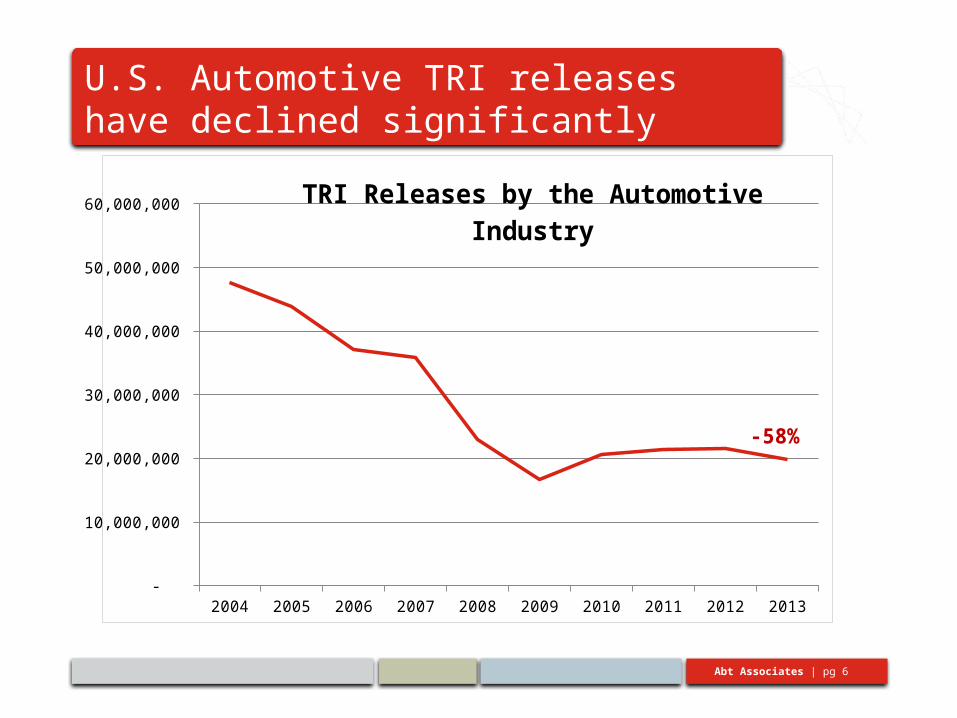
U.S. Automotive TRI releases have declined significantly
2004 2005 2006 2007 2008 2009 2010 2011 2012 2013 -
10,000,000
20,000,000
30,000,000
40,000,000
50,000,000
60,000,000 TRI Releases by the Automotive Industry
-58%
Abt Associates | pg 7
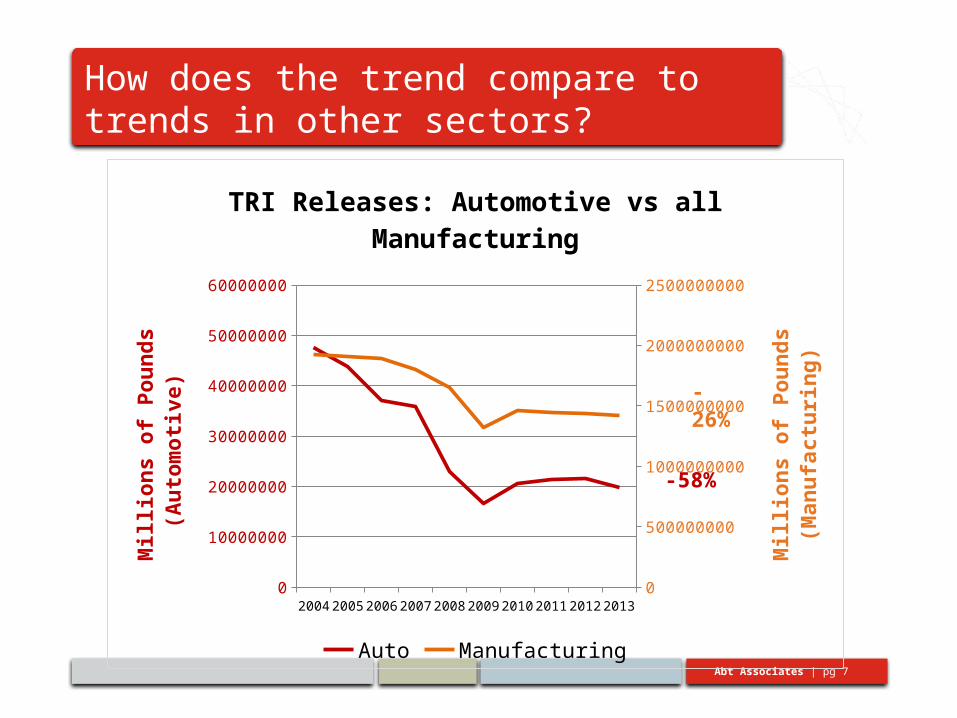
How does the trend compare to trends in other sectors?
2004 2005 2006 2007 2008 2009 2010 2011 2012 20130
10000000
20000000
30000000
40000000
50000000
60000000
0
500000000
1000000000
1500000000
2000000000
2500000000
TRI Releases: Automotive vs all Manufacturing
Auto Manufacturing
Mill
ions
of P
ound
s (Au
tom
otive
)
Mill
ions
of P
ound
s (M
anuf
actu
ring)
-58%
-26%
Abt Associates | pg 8
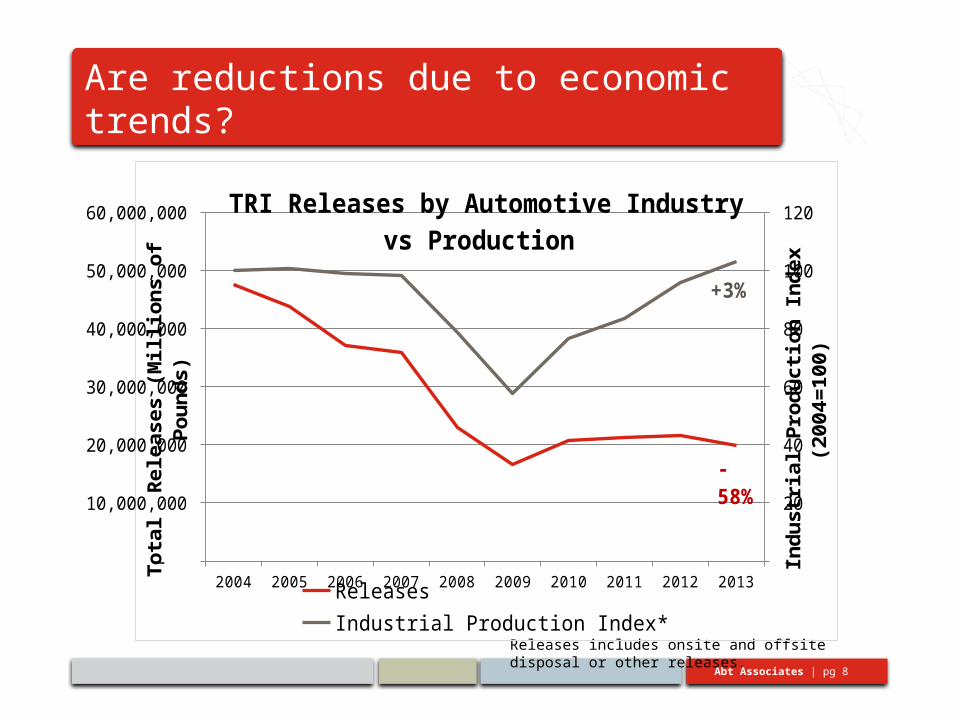
Are reductions due to economic trends?
Releases includes onsite and offsite disposal or other releases.
2004 2005 2006 2007 2008 2009 2010 2011 2012 2013 -
10,000,000
20,000,000
30,000,000
40,000,000
50,000,000
60,000,000
-
20
40
60
80
100
120 TRI Releases by Automotive Industry vs Production
Releases Industrial Production Index*
Tota
l Re
leas
es (M
illio
ns o
f Pou
nds)
Indu
stria
l Pro
ducti
on In
dex
(200
4=10
0)
-58%
+3%
Abt Associates | pg 9
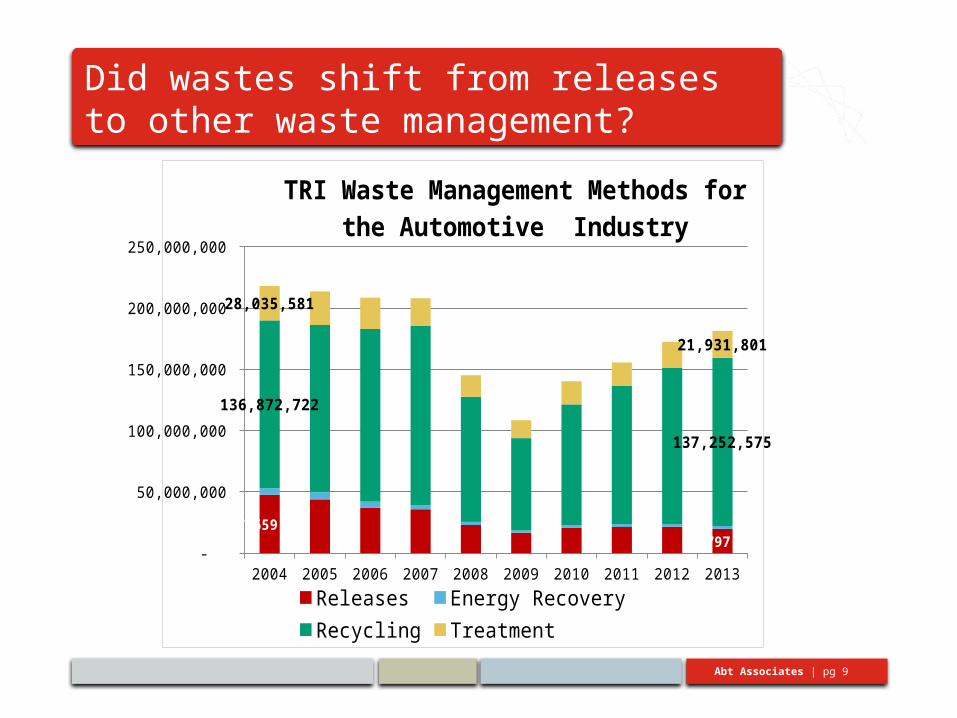
Did wastes shift from releases to other waste management?
2004 2005 2006 2007 2008 2009 2010 2011 2012 2013 -
50,000,000
100,000,000
150,000,000
200,000,000
250,000,000
47,659,854 19,797,301
136,872,722
137,252,575
28,035,581
21,931,801
TRI Waste Management Methods for the Automotive Industry
Releases Energy RecoveryRecycling Treatment
Abt Associates | pg 10
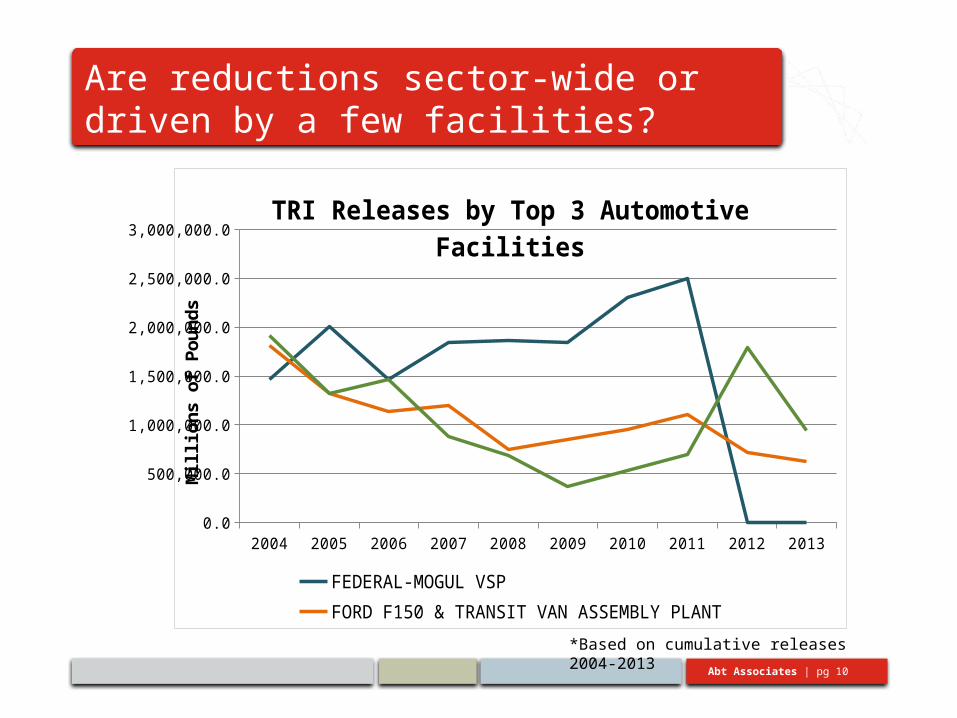
Are reductions sector-wide or driven by a few facilities?
*Based on cumulative releases 2004-2013
2004 2005 2006 2007 2008 2009 2010 2011 2012 20130.0
500,000.0
1,000,000.0
1,500,000.0
2,000,000.0
2,500,000.0
3,000,000.0TRI Releases by Top 3 Automotive Facilities
FEDERAL-MOGUL VSPFORD F150 & TRANSIT VAN ASSEMBLY PLANTNISSAN ASSEMBLY & BATTERY PLANT
Mill
ions
of P
ound
s
Abt Associates | pg 11
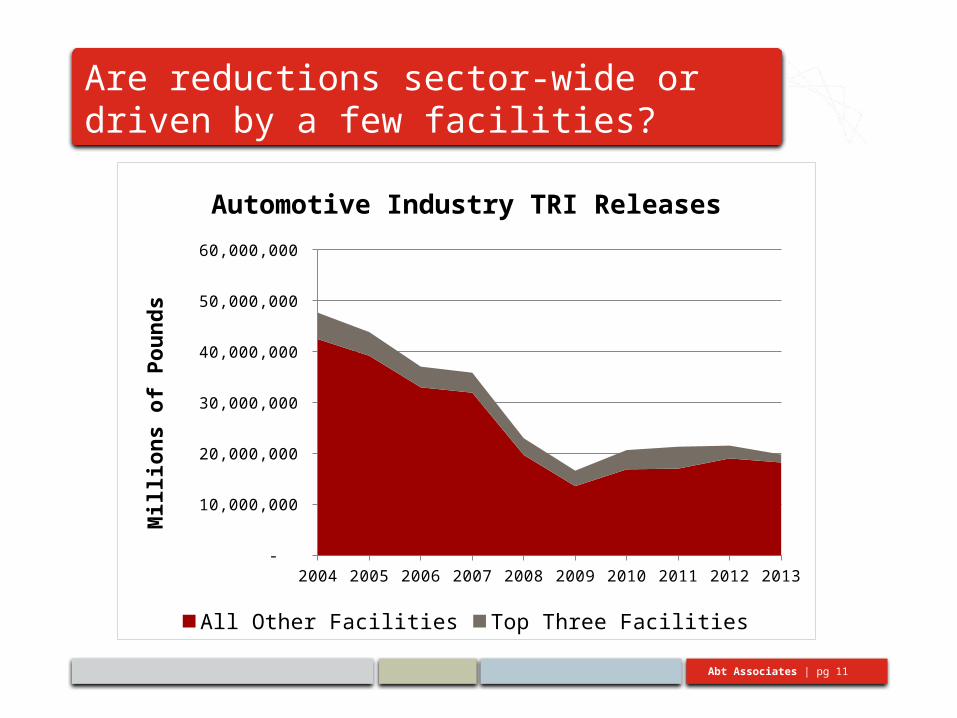
Are reductions sector-wide or driven by a few facilities?
2004 2005 2006 2007 2008 2009 2010 2011 2012 2013 -
10,000,000
20,000,000
30,000,000
40,000,000
50,000,000
60,000,000
Automotive Industry TRI Releases
All Other Facilities Top Three Facilities
Mill
ions
of P
ound
s
Abt Associates | pg 12
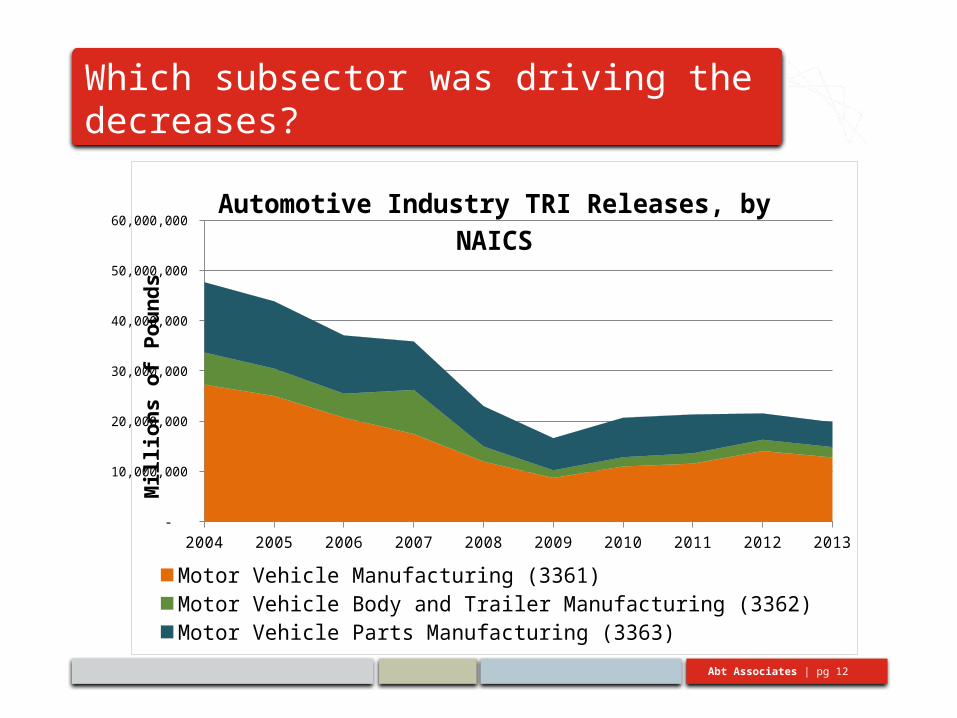
Which subsector was driving the decreases?
2004 2005 2006 2007 2008 2009 2010 2011 2012 2013 -
10,000,000
20,000,000
30,000,000
40,000,000
50,000,000
60,000,000 Automotive Industry TRI Releases, by NAICS
Motor Vehicle Manufacturing (3361)Motor Vehicle Body and Trailer Manufacturing (3362)Motor Vehicle Parts Manufacturing (3363)
Mill
ions
of P
ound
s
Abt Associates | pg 13
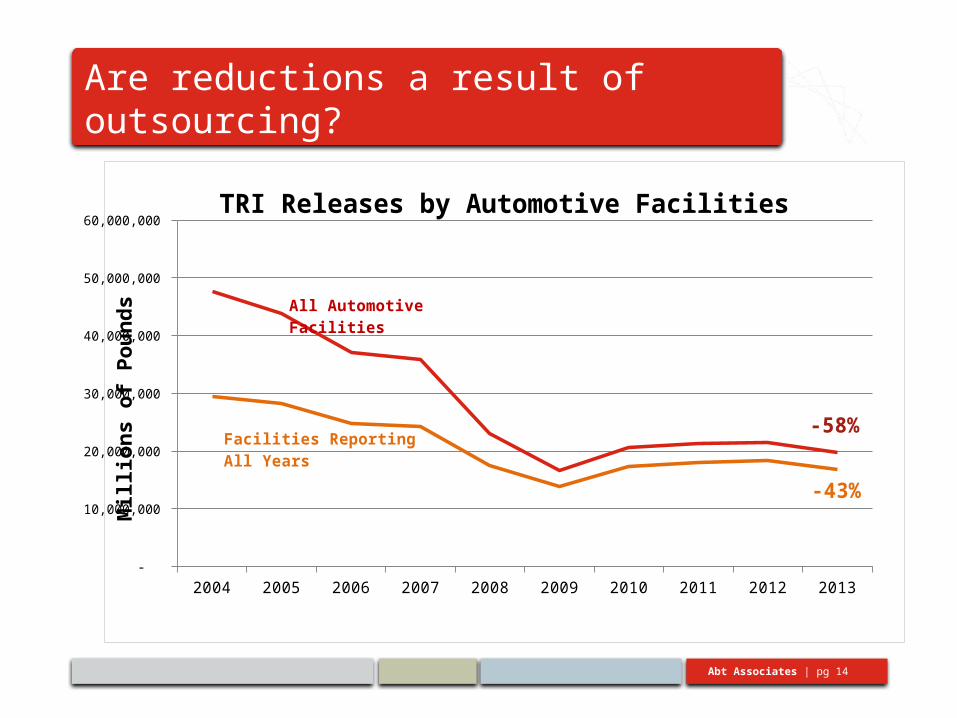
Are reductions a result of outsourcing?
Is an increase in outsourcing driving the reductions?
Data sources quantifying outsourcing were not identified
As a proxy, examine facilities that reported over the whole 10-year period (→facility still operating in U.S.)
– Examine the chemicals at those facilities that were reported over the 10-year period (→ process still operating in U.S.)
Abt Associates | pg 14
Are reductions a result of outsourcing?
2004 2005 2006 2007 2008 2009 2010 2011 2012 2013 -
10,000,000
20,000,000
30,000,000
40,000,000
50,000,000
60,000,000 TRI Releases by Automotive Facilities
Mill
ions
of P
ound
s
-43%
-58%Facilities Reporting All Years
All Automotive Facilities
Abt Associates | pg 15
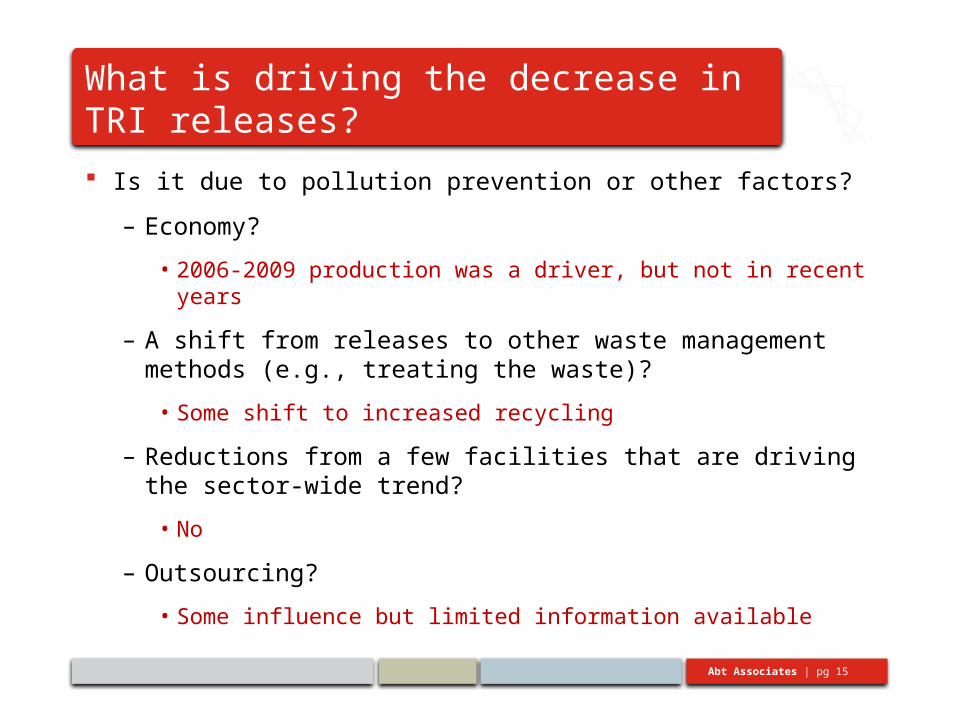
What is driving the decrease in TRI releases? Is it due to pollution prevention or other factors?
– Economy?
• 2006-2009 production was a driver, but not in recent years
– A shift from releases to other waste management methods (e.g., treating the waste)?
• Some shift to increased recycling
– Reductions from a few facilities that are driving the sector-wide trend?
• No
– Outsourcing?
• Some influence but limited information available
Abt Associates | pg 16
What chemicals were reduced?
2004 2005 2006 2007 2008 2009 2010 2011 2012 2013 -
10,000,000
20,000,000
30,000,000
40,000,000
50,000,000
60,000,000
Automotive Industry TRI Releases by Chemical
XYLENE (MIXED ISOMERS) N-BUTYL ALCOHOL CERTAIN GLYCOL ETHERS1,2,4-TRIMETHYLBENZENE ZINC COMPOUNDS All Other Chemicals
Mill
ions
of P
ound
s
Abt Associates | pg 17
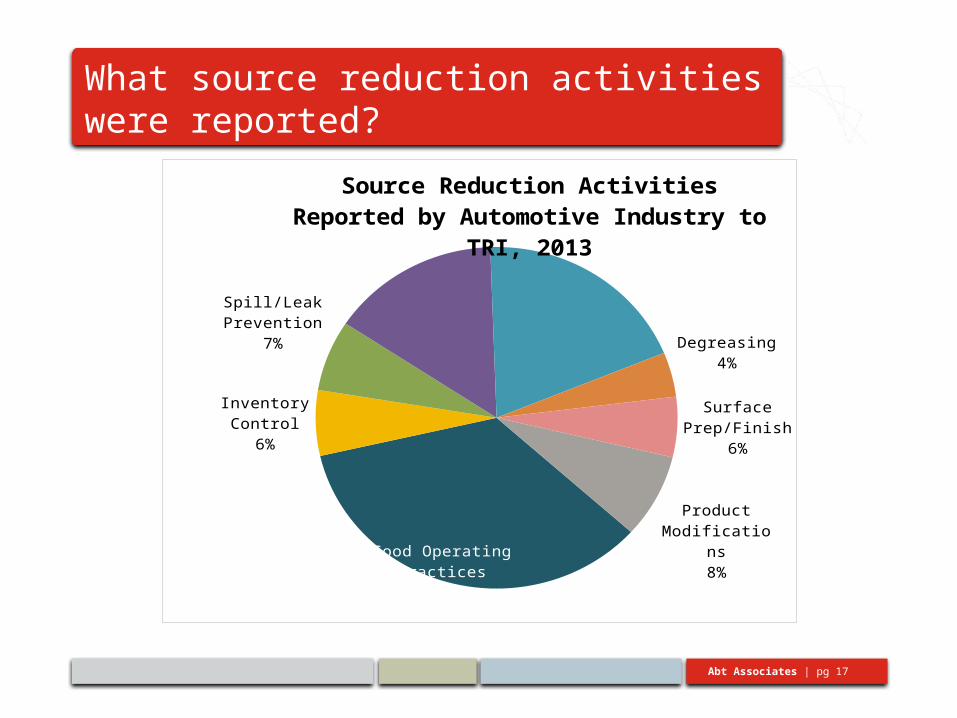
What source reduction activities were reported?
Good Operating Practices35%
Inventory Control6%
Spill/Leak Preven-tion7%
Raw Material Modifications
15%
Process Modifica-tions19%
Degreasing4%
Surface Prep/Fin-ish6%
Product Modifica-tions8%
Source Reduction Activities Reported by Automo-tive Industry to TRI, 2013
Abt Associates | pg 18
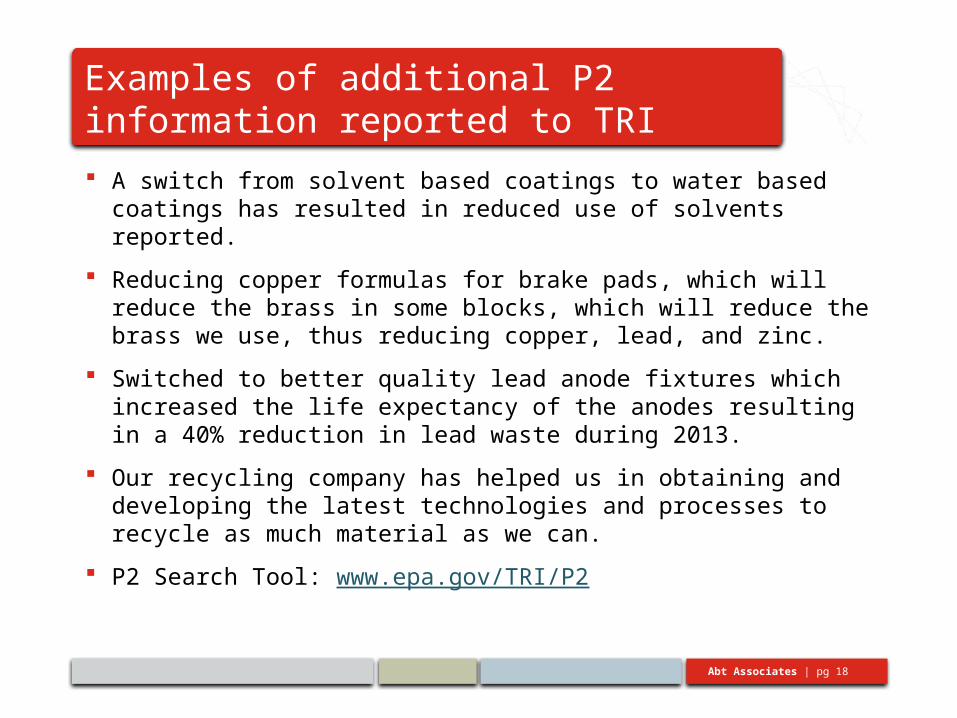
Examples of additional P2 information reported to TRI A switch from solvent based coatings to water based coatings
has resulted in reduced use of solvents reported.
Reducing copper formulas for brake pads, which will reduce the brass in some blocks, which will reduce the brass we use, thus reducing copper, lead, and zinc.
Switched to better quality lead anode fixtures which increased the life expectancy of the anodes resulting in a 40% reduction in lead waste during 2013.
Our recycling company has helped us in obtaining and developing the latest technologies and processes to recycle as much material as we can.
P2 Search Tool: www.epa.gov/TRI/P2
Abt Associates | pg 19
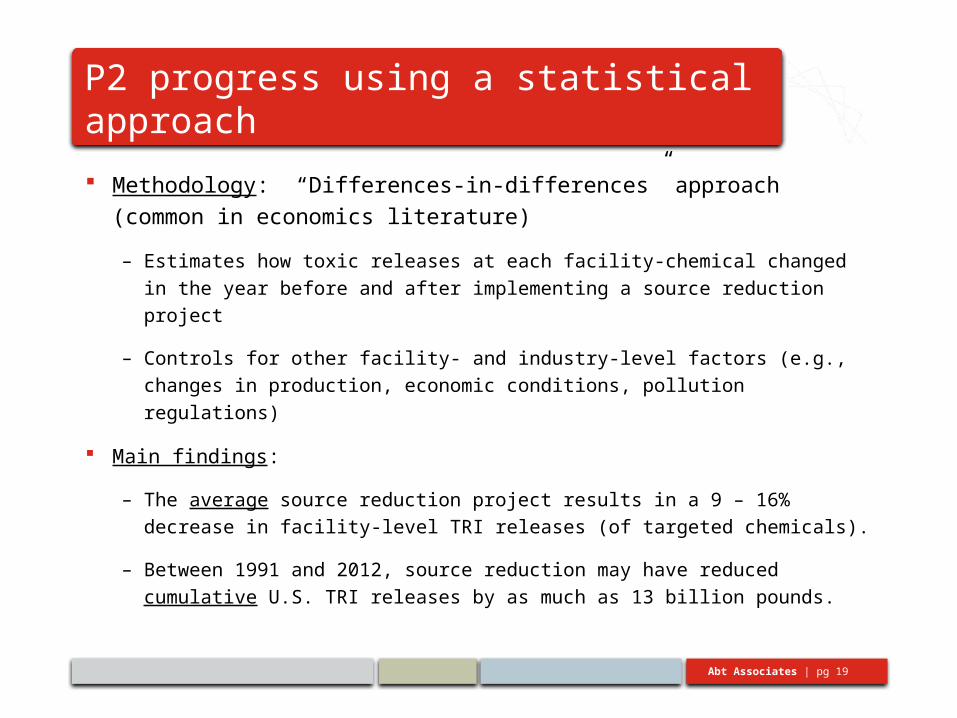
P2 progress using a statistical approach
Methodology: “Differences-in-differences” approach (common
in economics literature)
– Estimates how toxic releases at each facility-chemical changed in the
year before and after implementing a source reduction project
– Controls for other facility- and industry-level factors (e.g., changes in
production, economic conditions, pollution regulations)
Main findings:
– The average source reduction project results in a 9 – 16% decrease
in facility-level TRI releases (of targeted chemicals).
– Between 1991 and 2012, source reduction may have reduced
cumulative U.S. TRI releases by as much as 13 billion pounds.
Abt Associates | pg 20
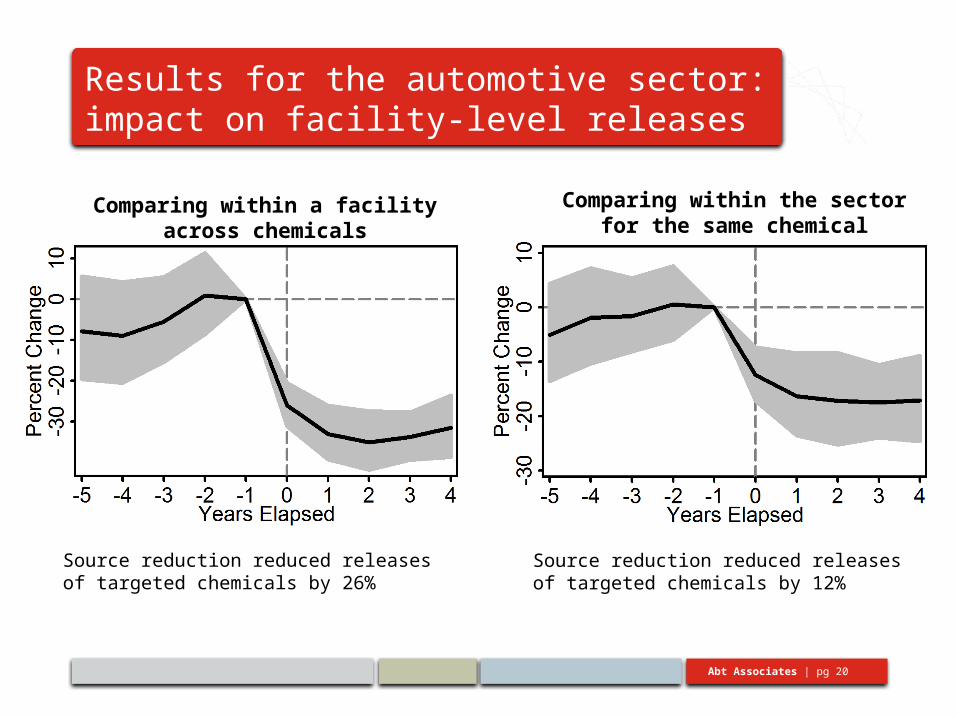
Results for the automotive sector: impact on facility-level releases
Comparing within a facility across chemicals
Comparing within the sector for the same chemical
Source reduction reduced releases of targeted chemicals by 26%
Source reduction reduced releases of targeted chemicals by 12%
Abt Associates | pg 21
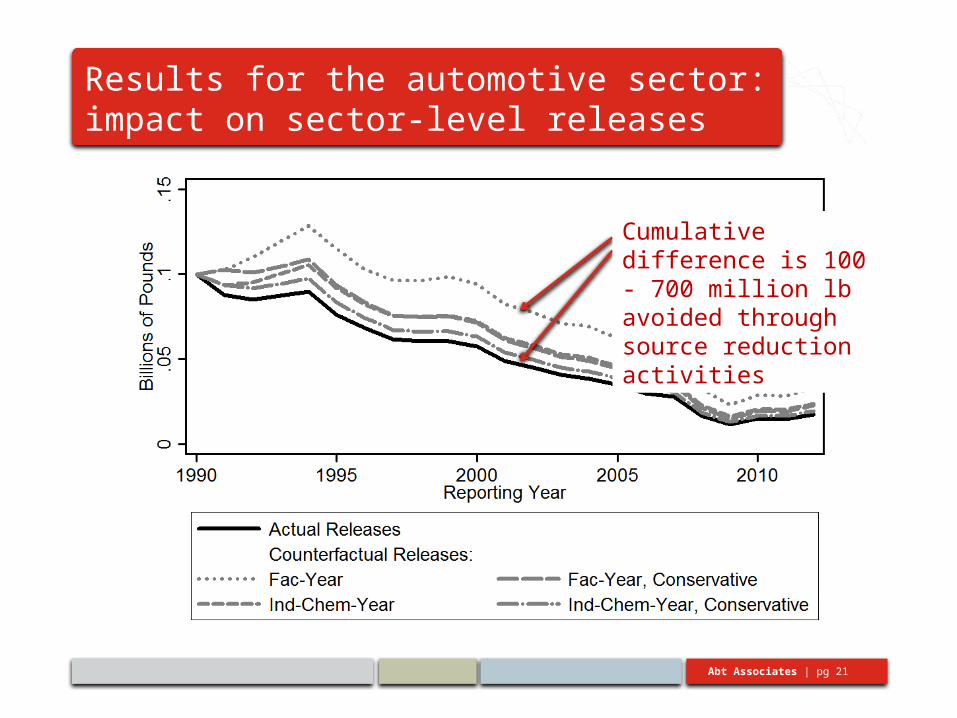
Results for the automotive sector: impact on sector-level releases
Cumulative difference is 100 - 700 million lb avoided through source reduction activities
Abt Associates | pg 22
Wrap up
Automotive sector TRI releases continue to decline, even as production has increased since 2009
Has pollution prevention been a driver of the reduced releases?
– Our analyses indicate that the implementation pollution prevention activities by the automotive industry has contributed to reduced releases
– The results more broadly suggest a potential for the use of PRTR data as a tool to track pollution prevention progress