Embed Size (px)
Citation preview

March 2020
Proxy Survey of Executive Compensation in the Russell 2000 Index
© 2020 Grant Thornton LLP | All rights reserved | U.S. member firm of Grant Thornton International Ltd 2
Table of Contents• Executive Summary: pages 3 – 15
• Methodology: pages 16 – 18
• Market Data by Sector: pages 19 – 126
All Companies: 19 – 27
Communications: 28 – 36
Consumer Discretionary: 37 – 45
Consumer Staples: 46 – 54
Energy: 55 – 63
Financials: 64 – 72
Health Care: 73 – 81
Industrials: 82 – 90
Information Technology: 91 – 99
Materials: 100 – 108
Real Estate: 109 – 117
Utilities: 118 – 126
Survey Constituents: pages 127 – 159

Executive Summary

© 2020 Grant Thornton LLP | All rights reserved | U.S. member firm of Grant Thornton International Ltd 4
Executive Summary –Index and Sectors in the Survey
• This proxy survey of executive compensation in the Russell 2000 index presents the most recently reported
compensation data in 11 Global Industry Classification Standard ("GICS") sectors:
Communications
Consumer Discretionary
Consumer Staples
Energy
Financials
Health Care
Industrials
Information Technology
Materials
Real Estate
Utilities

© 2020 Grant Thornton LLP | All rights reserved | U.S. member firm of Grant Thornton International Ltd 5
Executive Summary –Revenue Cuts
• Compensation data for each sector (with the exception of Utilities) was grouped into revenue cuts of
Emerging/Growth, Mid-Size, and Stable/Mature companies:
• Although a majority of sectors have similar ranges for the revenue groupings, certain sectors were tailored to
match the sector's revenue distribution in the Russell 2000
Revenue Ranges (values in $MM)
Sector Emerging/Growth Mid-Size Stable/Mature
Communications $0 – $250 $250 – $1,000 $1,000+
Consumer Discretionary $0 – $500 $500 – $1,000 $1,000+
Consumer Staples $0 – $500 $500 – $2,000 $2,000+
Energy $0 – $250 $250 – $1,000 $1,000+
Financials $0 – $250 $250 – $1,000 $1,000+
Health Care $0 – $250 $250 – $1,000 $1,000+
Industrials $0 – $300 $300 – $1,000 $1,000+
Information Technology $0 – $250 $250 – $1,000 $1,000+
Materials $0 – $750 $750 – $1,500 $1,500+
Real Estate $0 – $250 $250 – $500 $500+
Utilities Utilities companies have been included in the Mid-Size revenue cut (34 orgs in the Russell 2000)
© 2020 Grant Thornton LLP | All rights reserved | U.S. member firm of Grant Thornton International Ltd 6
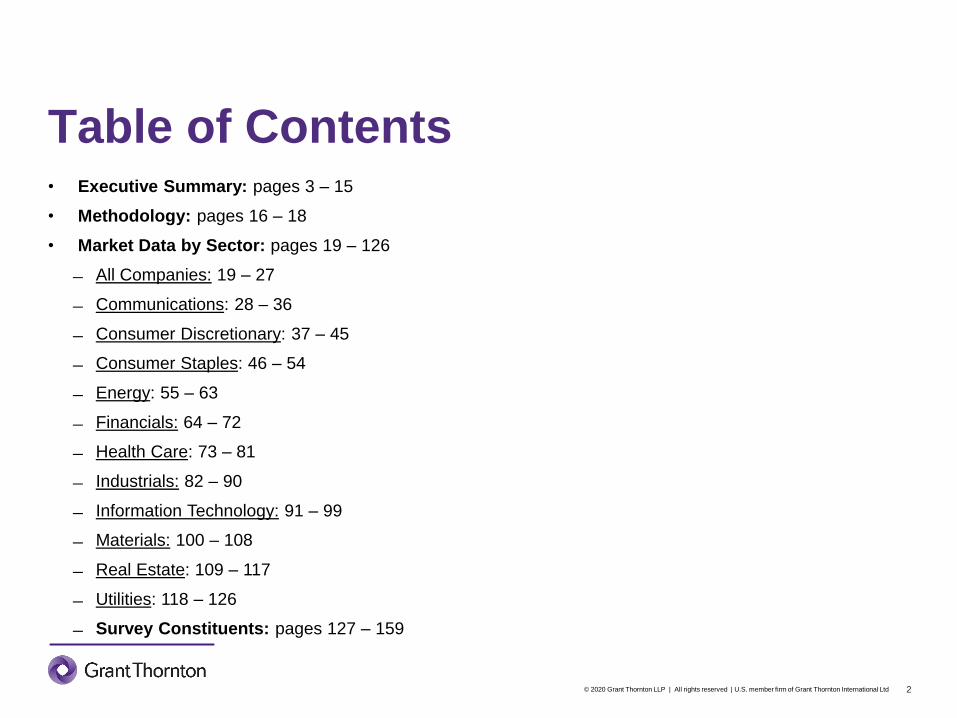
Executive Summary –CEO Compensation: Emerging/Growth
• The chart below details median CEO compensation for organizations in the Emerging/Growth revenue cut:
• Note the Utilities sector does not have enough companies in the Russell 2000 to form an Emerging/Growth
revenue cut, and have thus been compared against the Mid-Size range

© 2020 Grant Thornton LLP | All rights reserved | U.S. member firm of Grant Thornton International Ltd 7
Executive Summary –CEO Compensation: Mid-Size
• The chart below details median CEO compensation for organizations in the Mid-Size revenue cut:

© 2020 Grant Thornton LLP | All rights reserved | U.S. member firm of Grant Thornton International Ltd 8
Executive Summary –CEO Compensation: Stable/Mature
• The chart below details median CEO compensation for organizations in the Emerging/Growth revenue cut:
• Note the Utilities sector does not have enough companies in the Russell 2000 to form a Stable/Mature
revenue cut, and have thus been compared against the Mid-Size range

© 2020 Grant Thornton LLP | All rights reserved | U.S. member firm of Grant Thornton International Ltd 9
Executive Summary –CEO Annual & Long-term Incentives
A prominent trend in executive compensation is the increased use of performance-based compensation. Many
industries are placing a higher degree of compensation “at risk” in an effort to create a stronger tie between
company performance and the payouts of annual and long-term incentive ("LTI") pay. The use of performance-
based pay is especially critical for public companies, as both proxy advisors and institutional investors
(generally) have stated preferences for pay programs that align executive pay with shareholder outcomes. The
tables on the following pages express the median annual- and long-term incentive awards as a percent of salary
for sectors in each revenue range.

© 2020 Grant Thornton LLP | All rights reserved | U.S. member firm of Grant Thornton International Ltd 10
Executive Summary –CEO Annual Incentives
• The table to the right shows median
annual incentive payouts for CEOs in
each of the three revenue ranges
Median Actual Annual
Incentive (% of Salary)
Sector Emerging Mid Stable
Communications 86% 101% 125%
Consumer Discretionary 50% 120% 118%
Consumer Staples 92% 81% 79%
Energy 93% 117% 120%
Financials 52% 87% 168%
Health Care 56% 88% 65%
Industrials 96% 119% 119%
Information Technology 61% 90% 116%
Materials 88% 118% 131%
Real Estate 84% 131% 168%
Utilities - 99% -
Russell 2000 - All 66% 94% 98%
75th Percentile 91% 119% 130%
Median 85% 101% 119%
25th Percentile 57% 89% 117%

© 2020 Grant Thornton LLP | All rights reserved | U.S. member firm of Grant Thornton International Ltd 11
Executive Summary –CEO Long-term Incentives
• The table to the right shows median
long-term incentive payouts for CEOs in
each of the three revenue ranges
Median Long-term
Incentive (% of Salary)
Sector Emerging Mid Stable
Communications 134% 172% 225%
Consumer Discretionary 80% 158% 342%
Consumer Staples 97% 67% 249%
Energy 82% 329% 422%
Financials 37% 89% 183%
Health Care 88% 172% 343%
Industrials 87% 168% 294%
Information Technology 57% 379% 391%
Materials 118% 218% 281%
Real Estate 66% 273% 310%
Utilities - 116% -
Russell 2000 - All 57% 265% 377%
75th Percentile 95% 246% 343%
Median 85% 172% 302%
25th Percentile 70% 137% 257%
© 2020 Grant Thornton LLP | All rights reserved | U.S. member firm of Grant Thornton International Ltd 12
Executive Summary –Board Chair Compensation
Compensation for non-CEO Board of Director Chairs is commonplace in public companies, and is typically a
combination of cash and equity retainers. Board Chairs typically receive a premium on top of the annual cash
and equity retainers that "standard" Board members receive. The charts on the following pages detail the
median compensation of Board Chairs at each of the sectors in the Russell 2000

© 2020 Grant Thornton LLP | All rights reserved | U.S. member firm of Grant Thornton International Ltd 13
Executive Summary –Board Chair Compensation: Emerging/Growth
• The chart below details median Board Chair compensation for organizations in the Emerging/Growth
revenue cut:
• Note the Utilities sector does not have enough companies in the Russell 2000 to form an Emerging/Growth
revenue cut, and have thus been compared against the Mid-Size range

© 2020 Grant Thornton LLP | All rights reserved | U.S. member firm of Grant Thornton International Ltd 14
Executive Summary –Board Chair Compensation: Mid-Size
• The chart below details median Board Chair compensation for organizations in the Mid-Size revenue cut:

© 2020 Grant Thornton LLP | All rights reserved | U.S. member firm of Grant Thornton International Ltd 15
Executive Summary –Board Chair Compensation: Stable/Mature
• The chart below details median Board Chair compensation for organizations in the Stable/Mature revenue
cut:

Methodology

© 2020 Grant Thornton LLP | All rights reserved | U.S. member firm of Grant Thornton International Ltd 17
Methodology –Compensation Elements
Grant Thornton compiled compensation data from companies' most recently disclosed annual proxy statements.
Compensation for companies with December 31st fiscal year ends is generally current for their 2018 fiscal year.
We have provided compensation data for the following elements:
• Base salaries: salaries as disclosed in the Summary Compensation Table
• Total Cash Compensation: (i) base salaries + (ii) total annual bonuses, including both Discretionary and
Non-Equity Incentive Plan Payouts, as disclosed in the Summary Compensation Table
• Total Direct Compensation: (i) Total Cash Compensation + (ii) long-term incentives, which are measured as
the three-year average of the grant-date fair value ("GDFV") of all equity awards. Note Grant Thornton used
two-year average and one year values, respectively, for executives who had two and one years of Summary
Compensation Table data
• Short-term Incentive %: expressed as the total annual bonuses as a percent of base salary
• Long-term Incentive %: expressed as the three-year average equity award as a percent of base salary

© 2020 Grant Thornton LLP | All rights reserved | U.S. member firm of Grant Thornton International Ltd 18
Methodology –Benchmark Positions and Ranks
Grant Thornton has compiled compensation data for the following positions:
• Chief/Principal Executive Officers ("CEOs")
• Chief/Principal Financial Officers ("CFOs")
• Chief Operating Officers ("COOs")
• General Counsels/Top Legal Officers ("GCs")
• Board Chair
Grant Thornton has also compiled compensation data for the following proxy ranks within each company; note
executives were ranked by their total direct compensation figures:
• Rank #3
• Rank #4
• Rank #5
Positon matches were not used/included for revenue ranges with less than 5 incumbents (listed in the charts as
"ISD")

All Companies

© 2020 Grant Thornton LLP | All rights reserved | U.S. member firm of Grant Thornton International Ltd 20
All Companies –Chief Executive Officer
Top executive for the organization. Responsible for the overall success and creation of shareholder value. Manages the
profitability and growth of the organization. Develops and establishes long-range plans and strategies, and represents the
organization to external constituents, authorities, and the public. Reports to the Board of Directors.
Russell 2000 - All Companies: CEO P25 P50 P75 P90
Revenue (Millions) $46 $127 $213 $333
Base Salary $390,889 $497,500 $608,384 $748,581
Total Cash $545,500 $821,250 $1,108,456 $1,556,272
Total Direct $609,726 $1,014,318 $1,645,835 $3,577,625
Short Term Incentive (%) 28% 66% 108% 150%
Long Term Incentive (%) 0% 57% 297% 498%
Revenue (Millions) $383 $551 $765 $876
Base Salary $484,278 $620,000 $750,000 $950,000
Total Cash $825,224 $1,155,542 $1,575,693 $1,831,333
Total Direct $1,776,790 $2,810,433 $4,067,562 $4,636,848
Short Term Incentive (%) 48% 94% 135% 178%
Long Term Incentive (%) 153% 265% 384% 505%
Revenue (Millions) $1,339 $1,654 $3,045 $5,442
Base Salary $645,035 $825,000 $926,923 $1,000,000
Total Cash $946,134 $1,581,213 $2,158,375 $2,915,000
Total Direct $3,590,731 $4,457,814 $6,375,084 $8,713,165
Short Term Incentive (%) 58% 98% 149% 202%
Long Term Incentive (%) 292% 377% 538% 853%
Emerging/
GrowthN = 194
Mid-Size N = 123
Stable/
MatureN = 113

© 2020 Grant Thornton LLP | All rights reserved | U.S. member firm of Grant Thornton International Ltd 21
All Companies –Chief Financial Officer
Establishes, implements and maintains the financial plans and policies of the organization, including fiscal controls,
preparation and interpretation of financial reports, and safeguarding of the organization’s assets. Develops and maintains
overall accounting policies and controls. Assists in long-range planning and advises management on financial affairs.
Russell 2000 - All Companies: CFO P25 P50 P75 P90
Revenue (Millions) $46 $127 $213 $333
Base Salary $253,750 $321,550 $379,475 $446,920
Total Cash $323,906 $462,142 $614,727 $793,761
Total Direct $370,860 $563,240 $801,040 $1,890,731
Short Term Incentive (%) 27% 46% 73% 107%
Long Term Incentive (%) 0% 48% 246% 367%
Revenue (Millions) $383 $551 $765 $876
Base Salary $297,597 $360,000 $400,000 $450,000
Total Cash $371,629 $536,694 $637,762 $718,325
Total Direct $758,054 $1,216,869 $1,420,294 $1,705,242
Short Term Incentive (%) 24% 53% 79% 109%
Long Term Incentive (%) 71% 184% 251% 338%
Revenue (Millions) $1,339 $1,654 $3,045 $5,442
Base Salary $367,500 $436,700 $495,192 $579,473
Total Cash $541,158 $694,564 $871,527 $1,084,137
Total Direct $1,408,557 $1,758,651 $2,284,718 $2,943,120
Short Term Incentive (%) 40% 68% 93% 124%
Long Term Incentive (%) 201% 257% 347% 460%
Stable/
MatureN = 100
Emerging/
GrowthN = 184
Mid-Size N = 95

© 2020 Grant Thornton LLP | All rights reserved | U.S. member firm of Grant Thornton International Ltd 22
All Companies –Chief Operating Officer
Directs and controls the organization's processes and operations as necessary to ensure efficient and effective execution
of policies and procedures. Oversees the designed, operation and improvement of the system that creates and delivers
the organization's products or services. Ensures the achievement of short- and long- range goals for operations, human
resources, financial performance and growth.
Russell 2000 - All Companies: COO P25 P50 P75 P90
Revenue (Millions) $46 $127 $213 $333
Base Salary $265,202 $312,394 $350,000 $387,317
Total Cash $333,354 $499,166 $581,054 $626,960
Total Direct $479,538 $587,902 $680,913 $1,683,890
Short Term Incentive (%) 23% 39% 79% 89%
Long Term Incentive (%) 0% 46% 124% 276%
Revenue (Millions) $383 $551 $765 $876
Base Salary $316,404 $349,514 $424,816 $480,364
Total Cash $524,843 $580,480 $784,455 $907,677
Total Direct $1,077,381 $1,530,523 $2,112,227 $2,565,877
Short Term Incentive (%) 47% 80% 93% 112%
Long Term Incentive (%) 174% 224% 325% 486%
Revenue (Millions) $1,339 $1,654 $3,045 $5,442
Base Salary $399,872 $450,000 $567,500 $663,385
Total Cash $764,565 $950,856 $1,156,048 $1,485,466
Total Direct $1,994,308 $2,355,872 $3,096,219 $4,172,076
Short Term Incentive (%) 66% 95% 127% 154%
Long Term Incentive (%) 250% 328% 406% 472%
Emerging/
GrowthN = 21
Mid-Size N = 26
Stable/
MatureN = 39

© 2020 Grant Thornton LLP | All rights reserved | U.S. member firm of Grant Thornton International Ltd 23
All Companies –General Counsel / Top Legal Officer
Manages legal functions to ensure the organization's legal position is developed and maintained. Establishes legal
services required by the organization and ensures that the organization is protected from any legal action. Provides
executives with guidance in identifying the critical problems to which the application of legal principals yields the greatest
opportunities for reducing risks and maximizing profits.
Russell 2000 - All Companies: General Counsel P25 P50 P75 P90
Revenue (Millions) $46 $127 $213 $333
Base Salary $259,731 $300,577 $360,016 $390,000
Total Cash $366,161 $441,955 $505,067 $672,328
Total Direct $416,474 $499,153 $850,032 $1,381,930
Short Term Incentive (%) 29% 49% 76% 80%
Long Term Incentive (%) 16% 46% 222% 292%
Revenue (Millions) $383 $551 $765 $876
Base Salary $290,201 $336,746 $375,000 $424,135
Total Cash $376,311 $466,870 $675,385 $818,100
Total Direct $951,060 $1,119,529 $1,543,313 $2,102,810
Short Term Incentive (%) 31% 52% 87% 117%
Long Term Incentive (%) 163% 217% 283% 354%
Revenue (Millions) $1,339 $1,654 $3,045 $5,442
Base Salary $358,750 $396,346 $444,691 $541,000
Total Cash $511,791 $608,400 $782,361 $1,173,973
Total Direct $1,233,462 $1,396,586 $1,647,760 $3,151,456
Short Term Incentive (%) 35% 59% 98% 141%
Long Term Incentive (%) 179% 219% 291% 431%
Mid-Size N = 60
Stable/
MatureN = 75
Emerging/
GrowthN = 52

© 2020 Grant Thornton LLP | All rights reserved | U.S. member firm of Grant Thornton International Ltd 24
All Companies –3rd Highest Paid
Third highest paid executive according to total direct compensation. Common 3rd highest paid positions include: Senior
Vice President – Operations, Vice President – Marketing, Corporate Secretary and General Manager.
Russell 2000 - All Companies: 3rd Highest Rank P25 P50 P75 P90
Revenue (Millions) $46 $127 $213 $333
Base Salary $272,933 $325,000 $376,341 $450,005
Total Cash $382,920 $480,133 $616,467 $768,500
Total Direct $420,000 $572,455 $882,101 $1,879,978
Short Term Incentive (%) 30% 48% 73% 104%
Long Term Incentive (%) 0% 39% 201% 346%
Revenue (Millions) $383 $551 $765 $876
Base Salary $284,963 $335,000 $374,808 $425,000
Total Cash $373,987 $484,280 $596,356 $703,828
Total Direct $710,775 $1,106,673 $1,336,518 $1,491,382
Short Term Incentive (%) 19% 45% 68% 97%
Long Term Incentive (%) 41% 186% 248% 305%
Revenue (Millions) $1,339 $1,654 $3,045 $5,442
Base Salary $377,500 $420,000 $471,478 $565,200
Total Cash $577,241 $703,947 $841,350 $966,185
Total Direct $1,439,628 $1,775,000 $2,225,550 $2,619,102
Short Term Incentive (%) 37% 60% 90% 107%
Long Term Incentive (%) 197% 242% 308% 377%
Emerging/
GrowthN = 135
Mid-Size N = 115
Stable/
MatureN = 183
© 2020 Grant Thornton LLP | All rights reserved | U.S. member firm of Grant Thornton International Ltd 25
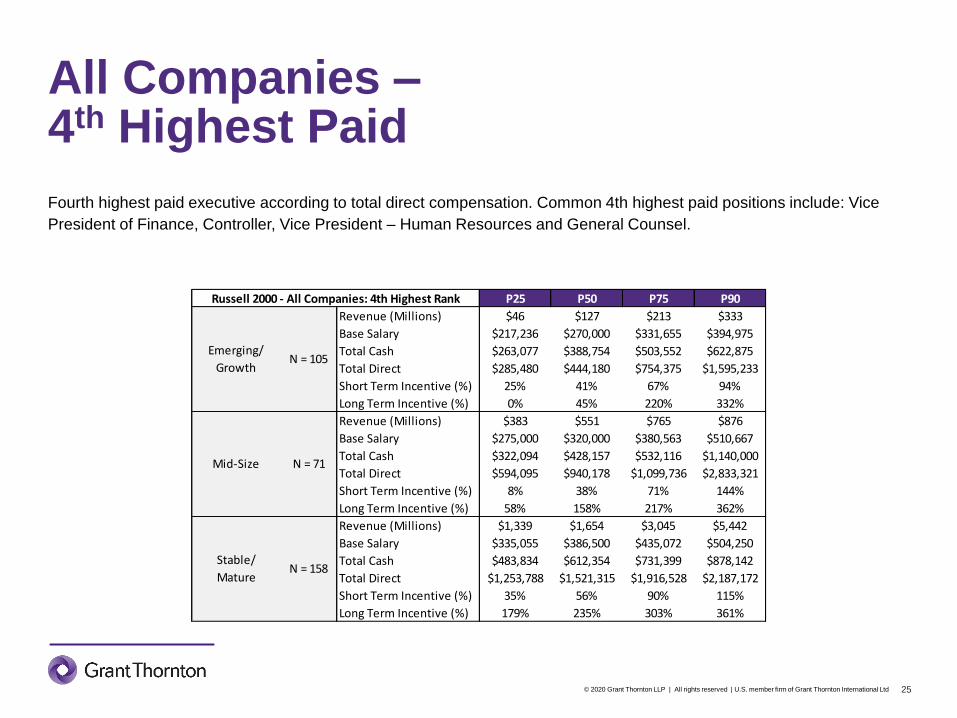
All Companies –4th Highest Paid
Fourth highest paid executive according to total direct compensation. Common 4th highest paid positions include: Vice
President of Finance, Controller, Vice President – Human Resources and General Counsel.
Russell 2000 - All Companies: 4th Highest Rank P25 P50 P75 P90
Revenue (Millions) $46 $127 $213 $333
Base Salary $217,236 $270,000 $331,655 $394,975
Total Cash $263,077 $388,754 $503,552 $622,875
Total Direct $285,480 $444,180 $754,375 $1,595,233
Short Term Incentive (%) 25% 41% 67% 94%
Long Term Incentive (%) 0% 45% 220% 332%
Revenue (Millions) $383 $551 $765 $876
Base Salary $275,000 $320,000 $380,563 $510,667
Total Cash $322,094 $428,157 $532,116 $1,140,000
Total Direct $594,095 $940,178 $1,099,736 $2,833,321
Short Term Incentive (%) 8% 38% 71% 144%
Long Term Incentive (%) 58% 158% 217% 362%
Revenue (Millions) $1,339 $1,654 $3,045 $5,442
Base Salary $335,055 $386,500 $435,072 $504,250
Total Cash $483,834 $612,354 $731,399 $878,142
Total Direct $1,253,788 $1,521,315 $1,916,528 $2,187,172
Short Term Incentive (%) 35% 56% 90% 115%
Long Term Incentive (%) 179% 235% 303% 361%
Emerging/
GrowthN = 105
Mid-Size N = 71
Stable/
MatureN = 158

© 2020 Grant Thornton LLP | All rights reserved | U.S. member firm of Grant Thornton International Ltd 26
All Companies –5th Highest Paid
Fifth highest paid executive according to total direct compensation. Common 5th highest paid positions include: Chief
Strategy Officer, Vice President – Sales, Division Senior Vice President and Executive Vice President.
Russell 2000 - All Companies: 5th Highest Rank P25 P50 P75 P90
Revenue (Millions) $46 $127 $213 $333
Base Salary $215,029 $264,000 $308,788 $399,719
Total Cash $261,236 $366,547 $463,931 $599,022
Total Direct $261,236 $417,039 $715,042 $1,404,401
Short Term Incentive (%) 16% 39% 51% 64%
Long Term Incentive (%) 0% 36% 215% 312%
Revenue (Millions) $383 $551 $765 $876
Base Salary $242,496 $290,000 $332,046 $350,000
Total Cash $289,927 $385,169 $456,980 $603,933
Total Direct $585,976 $868,863 $1,029,340 $1,121,278
Short Term Incentive (%) 0% 32% 54% 99%
Long Term Incentive (%) 125% 163% 200% 238%
Revenue (Millions) $1,339 $1,654 $3,045 $5,442
Base Salary $325,500 $377,500 $458,025 $539,597
Total Cash $461,686 $567,702 $925,952 $1,199,202
Total Direct $1,095,396 $1,231,122 $2,347,488 $3,239,668
Short Term Incentive (%) 36% 58% 98% 148%
Long Term Incentive (%) 161% 198% 306% 460%
Stable/
MatureN = 94
Emerging/
GrowthN = 71
Mid-Size N = 63

© 2020 Grant Thornton LLP | All rights reserved | U.S. member firm of Grant Thornton International Ltd 27
All Companies –Board Chair
Responsible for leading the Board of Directors. This individual provides leadership to an organization's officer and
executive team, and ensures the organization is fulfilling its duties to their shareholders. Note this position does not
include Executive Chairman.
Russell 2000 - All Companies: Board Chair P25 P50 P75 P90
Revenue (Millions) $46 $127 $213 $333
Cash Compensation $51,000 $72,500 $100,000 $116,200
Equity Compensation $50,000 $75,000 $119,996 $167,827
Total Compensation $93,125 $140,600 $186,111 $240,000
Revenue (Millions) $383 $551 $765 $876
Cash Compensation $81,250 $110,000 $160,000 $200,000
Equity Compensation $92,500 $110,795 $167,215 $205,170
Total Compensation $197,500 $242,000 $300,000 $370,000
Revenue (Millions) $1,339 $1,654 $3,045 $5,442
Cash Compensation $120,000 $150,000 $190,000 $250,000
Equity Compensation $100,000 $125,000 $174,375 $211,375
Total Compensation $250,000 $290,000 $350,000 $420,750
Emerging/
GrowthN = 135
Mid-Size N = 131
Stable/
MatureN = 139

Communications

© 2020 Grant Thornton LLP | All rights reserved | U.S. member firm of Grant Thornton International Ltd 29
Communications –Chief Executive Officer
Top executive for the organization. Responsible for the overall success and creation of shareholder value. Manages the
profitability and growth of the organization. Develops and establishes long-range plans and strategies, and represents the
organization to external constituents, authorities, and the public. Reports to the Board of Directors.
Communications: CEO P25 P50 P75 P90
Revenue (Millions) $169 $181 $250 $256
Base Salary $447,327 $512,500 $612,500 $858,535
Total Cash $721,250 $939,084 $1,269,971 $1,755,270
Total Direct $988,165 $1,920,244 $2,883,177 $3,376,064
Short Term Incentive (%) 51% 86% 108% 158%
Long Term Incentive (%) 0% 134% 310% 426%
Revenue (Millions) $449 $631 $673 $721
Base Salary $597,442 $745,577 $1,184,616 $1,275,000
Total Cash $1,224,243 $1,427,675 $2,215,302 $2,900,000
Total Direct $2,023,266 $3,100,434 $4,128,734 $5,464,416
Short Term Incentive (%) 93% 101% 133% 154%
Long Term Incentive (%) 89% 172% 214% 333%
Revenue (Millions) $1,378 $1,654 $2,767 $4,097
Base Salary $950,000 $1,000,000 $1,100,000 $1,232,491
Total Cash $1,725,391 $2,248,778 $2,934,152 $3,598,119
Total Direct $3,488,213 $4,487,223 $5,427,553 $8,209,012
Short Term Incentive (%) 100% 125% 149% 206%
Long Term Incentive (%) 176% 225% 389% 468%
$0 - $250MM N = 23
$250 - $1,000MM N = 11
$1,000MM+ N = 17
© 2020 Grant Thornton LLP | All rights reserved | U.S. member firm of Grant Thornton International Ltd 30
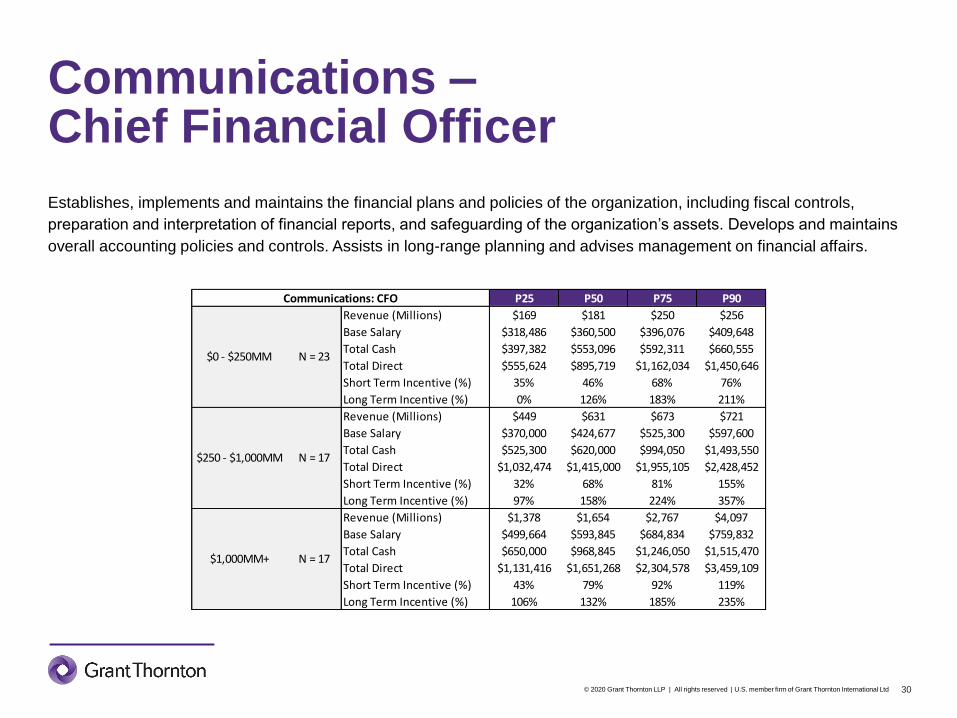
Communications –Chief Financial Officer
Establishes, implements and maintains the financial plans and policies of the organization, including fiscal controls,
preparation and interpretation of financial reports, and safeguarding of the organization’s assets. Develops and maintains
overall accounting policies and controls. Assists in long-range planning and advises management on financial affairs.
Communications: CFO P25 P50 P75 P90
Revenue (Millions) $169 $181 $250 $256
Base Salary $318,486 $360,500 $396,076 $409,648
Total Cash $397,382 $553,096 $592,311 $660,555
Total Direct $555,624 $895,719 $1,162,034 $1,450,646
Short Term Incentive (%) 35% 46% 68% 76%
Long Term Incentive (%) 0% 126% 183% 211%
Revenue (Millions) $449 $631 $673 $721
Base Salary $370,000 $424,677 $525,300 $597,600
Total Cash $525,300 $620,000 $994,050 $1,493,550
Total Direct $1,032,474 $1,415,000 $1,955,105 $2,428,452
Short Term Incentive (%) 32% 68% 81% 155%
Long Term Incentive (%) 97% 158% 224% 357%
Revenue (Millions) $1,378 $1,654 $2,767 $4,097
Base Salary $499,664 $593,845 $684,834 $759,832
Total Cash $650,000 $968,845 $1,246,050 $1,515,470
Total Direct $1,131,416 $1,651,268 $2,304,578 $3,459,109
Short Term Incentive (%) 43% 79% 92% 119%
Long Term Incentive (%) 106% 132% 185% 235%
$0 - $250MM N = 23
$250 - $1,000MM N = 17
$1,000MM+ N = 17

© 2020 Grant Thornton LLP | All rights reserved | U.S. member firm of Grant Thornton International Ltd 31
Communications –Chief Operating Officer
Directs and controls the organization's processes and operations as necessary to ensure efficient and effective execution
of policies and procedures. Oversees the designed, operation and improvement of the system that creates and delivers
the organization's products or services. Ensures the achievement of short- and long- range goals for operations, human
resources, financial performance and growth.
Communications: COO P25 P50 P75 P90
Revenue (Millions) $169 $181 $250 $256
Base Salary $290,739 $360,167 $410,003 $480,253
Total Cash $459,732 $697,269 $752,597 $846,379
Total Direct $459,732 $745,538 $1,708,388 $1,712,691
Short Term Incentive (%) 48% 67% 88% 107%
Long Term Incentive (%) 0% 11% 197% 248%
Revenue (Millions) $449 $631 $673 $721
Base Salary ISD ISD ISD ISD
Total Cash ISD ISD ISD ISD
Total Direct ISD ISD ISD ISD
Short Term Incentive (%) ISD ISD ISD ISD
Long Term Incentive (%) ISD ISD ISD ISD
Revenue (Millions) $1,378 $1,654 $2,767 $4,097
Base Salary $547,553 $564,063 $718,229 $841,954
Total Cash $937,500 $1,083,626 $1,277,800 $2,893,064
Total Direct $1,587,908 $2,017,531 $2,765,552 $3,716,629
Short Term Incentive (%) 67% 98% 108% 223%
Long Term Incentive (%) 92% 136% 159% 200%
$1,000MM+ N = 8
$0 - $250MM N = 8
$250 - $1,000MM N = 4

© 2020 Grant Thornton LLP | All rights reserved | U.S. member firm of Grant Thornton International Ltd 32
Communications –General Counsel / Top Legal Officer
Manages legal functions to ensure the organization's legal position is developed and maintained. Establishes legal
services required by the organization and ensures that the organization is protected from any legal action. Provides
executives with guidance in identifying the critical problems to which the application of legal principals yields the greatest
opportunities for reducing risks and maximizing profits.
Communications: General Counsel P25 P50 P75 P90
Revenue (Millions) $169 $181 $250 $256
Base Salary $318,664 $331,619 $362,225 $388,000
Total Cash $468,624 $572,443 $590,637 $634,836
Total Direct $830,087 $861,275 $930,738 $1,097,695
Short Term Incentive (%) 49% 63% 73% 87%
Long Term Incentive (%) 72% 102% 125% 147%
Revenue (Millions) $449 $631 $673 $721
Base Salary $306,582 $338,577 $431,382 $526,125
Total Cash $432,981 $459,820 $917,276 $1,320,075
Total Direct $757,219 $922,591 $1,546,099 $2,046,218
Short Term Incentive (%) 36% 58% 70% 196%
Long Term Incentive (%) 74% 108% 152% 190%
Revenue (Millions) $1,378 $1,654 $2,767 $4,097
Base Salary $436,654 $487,677 $676,949 $750,000
Total Cash $668,640 $831,963 $1,003,000 $1,472,114
Total Direct $1,012,454 $1,176,525 $1,729,199 $2,355,222
Short Term Incentive (%) 30% 70% 89% 100%
Long Term Incentive (%) 59% 99% 129% 142%
$1,000MM+ N = 11
$250 - $1,000MM N = 14
$0 - $250MM N = 6

© 2020 Grant Thornton LLP | All rights reserved | U.S. member firm of Grant Thornton International Ltd 33
Communications –3rd Highest Paid
Third highest paid executive according to total direct compensation. Common 3rd highest paid positions include: Senior
Vice President – Operations, Vice President – Marketing, Corporate Secretary and General Manager.
Communications: 3rd Highest Paid P25 P50 P75 P90
Revenue (Millions) $169 $181 $250 $256
Base Salary $288,154 $360,500 $408,242 $476,005
Total Cash $408,242 $551,583 $640,394 $716,350
Total Direct $524,420 $873,928 $1,193,395 $2,189,460
Short Term Incentive (%) 40% 49% 64% 75%
Long Term Incentive (%) 0% 95% 169% 371%
Revenue (Millions) $449 $631 $673 $721
Base Salary $369,375 $455,592 $626,000 $742,308
Total Cash $558,648 $689,826 $1,398,000 $1,664,996
Total Direct $988,839 $1,543,000 $2,586,816 $2,845,308
Short Term Incentive (%) 33% 67% 109% 195%
Long Term Incentive (%) 77% 117% 165% 212%
Revenue (Millions) $1,378 $1,654 $2,767 $4,097
Base Salary $499,664 $538,348 $575,000 $736,967
Total Cash $810,212 $953,684 $1,125,000 $1,464,274
Total Direct $1,568,844 $1,918,303 $2,304,578 $2,435,950
Short Term Incentive (%) 75% 87% 100% 104%
Long Term Incentive (%) 114% 132% 172% 293%
$0 - $250MM N = 37
$250 - $1,000MM N = 11
$1,000MM+ N = 13

© 2020 Grant Thornton LLP | All rights reserved | U.S. member firm of Grant Thornton International Ltd 34
Communications –4th Highest Paid
Fourth highest paid executive according to total direct compensation. Common 4th highest paid positions include: Vice
President of Finance, Controller, Vice President – Human Resources and General Counsel.
Communications: 4th Highest Paid P25 P50 P75 P90
Revenue (Millions) $169 $181 $250 $256
Base Salary $211,442 $302,894 $369,576 $385,906
Total Cash $305,625 $464,358 $560,744 $589,382
Total Direct $453,988 $726,646 $880,895 $891,316
Short Term Incentive (%) 36% 55% 68% 75%
Long Term Incentive (%) 57% 78% 85% 117%
Revenue (Millions) $449 $631 $673 $721
Base Salary $317,500 $368,908 $530,475 $662,100
Total Cash $437,676 $557,607 $1,062,809 $1,333,807
Total Direct $829,729 $976,847 $1,632,703 $2,014,724
Short Term Incentive (%) 40% 59% 86% 178%
Long Term Incentive (%) 67% 90% 149% 158%
Revenue (Millions) $1,378 $1,654 $2,767 $4,097
Base Salary $380,388 $498,125 $559,828 $624,000
Total Cash $534,113 $684,135 $980,998 $1,070,309
Total Direct $880,384 $1,066,854 $1,890,911 $1,938,982
Short Term Incentive (%) 31% 70% 83% 98%
Long Term Incentive (%) 71% 110% 157% 173%
$0 - $250MM N = 12
$250 - $1,000MM N = 12
$1,000MM+ N = 10

© 2020 Grant Thornton LLP | All rights reserved | U.S. member firm of Grant Thornton International Ltd 35
Communications –5th Highest Paid
Fifth highest paid executive according to total direct compensation. Common 5th highest paid positions include: Chief
Strategy Officer, Vice President – Sales, Division Senior Vice President and Executive Vice President.
Communications: 5th Highest Paid P25 P50 P75 P90
Revenue (Millions) $169 $181 $250 $256
Base Salary ISD ISD ISD ISD
Total Cash ISD ISD ISD ISD
Total Direct ISD ISD ISD ISD
Short Term Incentive (%) ISD ISD ISD ISD
Long Term Incentive (%) ISD ISD ISD ISD
Revenue (Millions) $449 $631 $673 $721
Base Salary $274,769 $350,473 $402,469 $456,530
Total Cash $345,538 $399,222 $545,309 $647,103
Total Direct $592,920 $758,260 $945,616 $1,001,861
Short Term Incentive (%) 10% 43% 49% 49%
Long Term Incentive (%) 64% 85% 138% 159%
Revenue (Millions) $1,378 $1,654 $2,767 $4,097
Base Salary $380,000 $458,307 $506,560 $566,663
Total Cash $606,731 $608,307 $760,000 $854,478
Total Direct $856,723 $979,997 $1,072,247 $1,529,499
Short Term Incentive (%) 29% 33% 81% 92%
Long Term Incentive (%) 51% 58% 168% 176%
$0 - $250MM N = 4
$250 - $1,000MM N = 6
$1,000MM+ N = 5
© 2020 Grant Thornton LLP | All rights reserved | U.S. member firm of Grant Thornton International Ltd 36
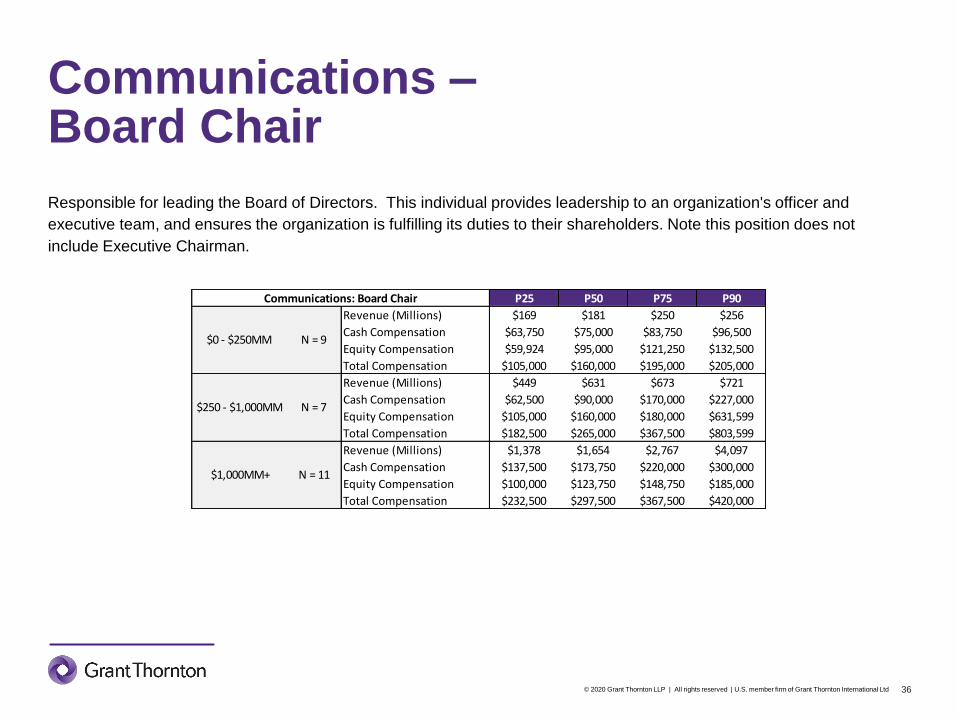
Communications –Board Chair
Responsible for leading the Board of Directors. This individual provides leadership to an organization's officer and
executive team, and ensures the organization is fulfilling its duties to their shareholders. Note this position does not
include Executive Chairman.
Communications: Board Chair P25 P50 P75 P90
Revenue (Millions) $169 $181 $250 $256
Cash Compensation $63,750 $75,000 $83,750 $96,500
Equity Compensation $59,924 $95,000 $121,250 $132,500
Total Compensation $105,000 $160,000 $195,000 $205,000
Revenue (Millions) $449 $631 $673 $721
Cash Compensation $62,500 $90,000 $170,000 $227,000
Equity Compensation $105,000 $160,000 $180,000 $631,599
Total Compensation $182,500 $265,000 $367,500 $803,599
Revenue (Millions) $1,378 $1,654 $2,767 $4,097
Cash Compensation $137,500 $173,750 $220,000 $300,000
Equity Compensation $100,000 $123,750 $148,750 $185,000
Total Compensation $232,500 $297,500 $367,500 $420,000
$1,000MM+ N = 11
$0 - $250MM N = 9
$250 - $1,000MM N = 7

Consumer Discretionary

© 2020 Grant Thornton LLP | All rights reserved | U.S. member firm of Grant Thornton International Ltd 38
Consumer Discretionary –Chief Executive Officer
Top executive for the organization. Responsible for the overall success and creation of shareholder value. Manages the
profitability and growth of the organization. Develops and establishes long-range plans and strategies, and represents the
organization to external constituents, authorities, and the public. Reports to the Board of Directors.
Consumer Discretionary: CEO P25 P50 P75 P90
Revenue (Millions) $153 $253 $378 $444
Base Salary $427,308 $600,000 $728,960 $1,015,384
Total Cash $600,000 $900,000 $1,113,487 $1,467,256
Total Direct $844,500 $1,624,302 $2,364,891 $2,801,628
Short Term Incentive (%) 0% 50% 101% 126%
Long Term Incentive (%) 0% 80% 197% 244%
Revenue (Millions) $623 $682 $790 $876
Base Salary $548,654 $701,000 $872,499 $1,154,423
Total Cash $1,004,993 $1,455,000 $1,962,793 $2,242,405
Total Direct $1,751,648 $2,643,402 $3,394,721 $4,657,744
Short Term Incentive (%) 59% 120% 156% 187%
Long Term Incentive (%) 102% 158% 202% 296%
Revenue (Millions) $1,251 $1,654 $2,298 $3,949
Base Salary $732,913 $900,000 $990,385 $1,260,923
Total Cash $1,364,993 $1,976,985 $2,763,125 $3,432,401
Total Direct $3,359,446 $5,242,608 $7,115,144 $8,768,403
Short Term Incentive (%) 92% 118% 181% 232%
Long Term Incentive (%) 235% 342% 438% 612%
$0 - $500MM N = 21
$500 - $1,000MM N = 20
$1,000MM+ N = 23

© 2020 Grant Thornton LLP | All rights reserved | U.S. member firm of Grant Thornton International Ltd 39
Consumer Discretionary –Chief Financial Officer
Establishes, implements and maintains the financial plans and policies of the organization, including fiscal controls,
preparation and interpretation of financial reports, and safeguarding of the organization’s assets. Develops and maintains
overall accounting policies and controls. Assists in long-range planning and advises management on financial affairs.
Consumer Discretionary: CFO P25 P50 P75 P90
Revenue (Millions) $153 $253 $378 $444
Base Salary $309,250 $355,173 $413,545 $433,392
Total Cash $342,275 $544,019 $631,502 $688,883
Total Direct $557,349 $746,067 $894,683 $1,174,344
Short Term Incentive (%) 5% 50% 60% 67%
Long Term Incentive (%) 0% 66% 124% 162%
Revenue (Millions) $623 $682 $790 $876
Base Salary $357,827 $382,500 $431,600 $506,202
Total Cash $538,684 $629,355 $796,866 $910,787
Total Direct $731,099 $1,073,645 $1,407,296 $1,595,941
Short Term Incentive (%) 41% 59% 78% 105%
Long Term Incentive (%) 52% 87% 182% 200%
Revenue (Millions) $1,251 $1,654 $2,298 $3,949
Base Salary $449,625 $511,096 $601,923 $650,000
Total Cash $743,462 $916,583 $1,220,536 $1,383,958
Total Direct $1,423,363 $1,991,874 $2,436,109 $2,907,714
Short Term Incentive (%) 52% 88% 119% 127%
Long Term Incentive (%) 154% 190% 238% 316%
$500 - $1,000MM N = 18
$1,000MM+ N = 24
$0 - $500MM N = 12

© 2020 Grant Thornton LLP | All rights reserved | U.S. member firm of Grant Thornton International Ltd 40
Consumer Discretionary –Chief Operating Officer
Directs and controls the organization's processes and operations as necessary to ensure efficient and effective execution
of policies and procedures. Oversees the designed, operation and improvement of the system that creates and delivers
the organization's products or services. Ensures the achievement of short- and long- range goals for operations, human
resources, financial performance and growth.
Consumer Discretionary: COO P25 P50 P75 P90
Revenue (Millions) $153 $253 $378 $444
Base Salary $398,798 $399,616 $400,300 $515,200
Total Cash $427,121 $543,858 $737,789 $912,946
Total Direct $556,197 $997,015 $1,032,386 $1,080,047
Short Term Incentive (%) 17% 45% 66% 80%
Long Term Incentive (%) 3% 30% 85% 122%
Revenue (Millions) $623 $682 $790 $876
Base Salary ISD ISD ISD ISD
Total Cash ISD ISD ISD ISD
Total Direct ISD ISD ISD ISD
Short Term Incentive (%) ISD ISD ISD ISD
Long Term Incentive (%) ISD ISD ISD ISD
Revenue (Millions) $1,251 $1,654 $2,298 $3,949
Base Salary $445,938 $488,354 $566,250 $693,936
Total Cash $722,205 $975,313 $1,113,378 $1,359,757
Total Direct $1,476,136 $2,113,092 $2,382,118 $3,457,685
Short Term Incentive (%) 46% 76% 143% 169%
Long Term Incentive (%) 172% 188% 250% 410%
$0 - $500MM N = 6
$500 - $1,000MM N = 4
$1,000MM+ N = 12
© 2020 Grant Thornton LLP | All rights reserved | U.S. member firm of Grant Thornton International Ltd 41
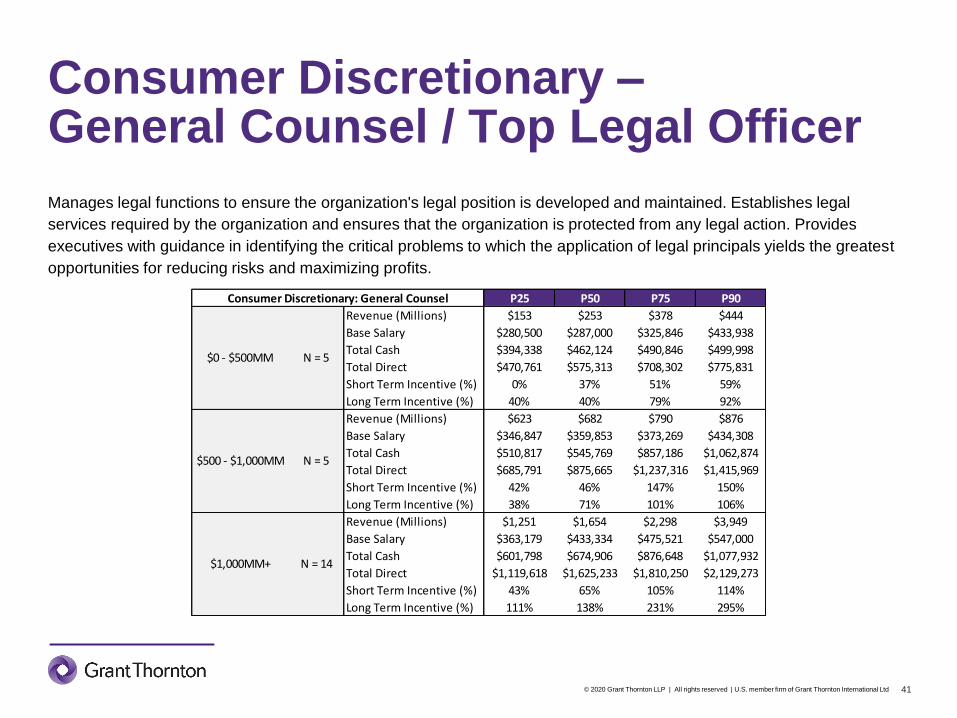
Consumer Discretionary –General Counsel / Top Legal Officer
Manages legal functions to ensure the organization's legal position is developed and maintained. Establishes legal
services required by the organization and ensures that the organization is protected from any legal action. Provides
executives with guidance in identifying the critical problems to which the application of legal principals yields the greatest
opportunities for reducing risks and maximizing profits.
Consumer Discretionary: General Counsel P25 P50 P75 P90
Revenue (Millions) $153 $253 $378 $444
Base Salary $280,500 $287,000 $325,846 $433,938
Total Cash $394,338 $462,124 $490,846 $499,998
Total Direct $470,761 $575,313 $708,302 $775,831
Short Term Incentive (%) 0% 37% 51% 59%
Long Term Incentive (%) 40% 40% 79% 92%
Revenue (Millions) $623 $682 $790 $876
Base Salary $346,847 $359,853 $373,269 $434,308
Total Cash $510,817 $545,769 $857,186 $1,062,874
Total Direct $685,791 $875,665 $1,237,316 $1,415,969
Short Term Incentive (%) 42% 46% 147% 150%
Long Term Incentive (%) 38% 71% 101% 106%
Revenue (Millions) $1,251 $1,654 $2,298 $3,949
Base Salary $363,179 $433,334 $475,521 $547,000
Total Cash $601,798 $674,906 $876,648 $1,077,932
Total Direct $1,119,618 $1,625,233 $1,810,250 $2,129,273
Short Term Incentive (%) 43% 65% 105% 114%
Long Term Incentive (%) 111% 138% 231% 295%
$1,000MM+ N = 14
$500 - $1,000MM N = 5
$0 - $500MM N = 5

© 2020 Grant Thornton LLP | All rights reserved | U.S. member firm of Grant Thornton International Ltd 42
Consumer Discretionary –3rd Highest Paid
Third highest paid executive according to total direct compensation. Common 3rd highest paid positions include: Senior
Vice President – Operations, Vice President – Marketing, Corporate Secretary and General Manager.
Consumer Discretionary: 3rd Highest Rank P25 P50 P75 P90
Revenue (Millions) $153 $253 $378 $444
Base Salary $284,375 $318,369 $363,510 $409,954
Total Cash $298,558 $412,554 $539,933 $664,159
Total Direct $514,366 $658,054 $757,568 $962,466
Short Term Incentive (%) 4% 28% 52% 65%
Long Term Incentive (%) 13% 71% 144% 154%
Revenue (Millions) $623 $682 $790 $876
Base Salary $347,635 $374,525 $416,385 $482,500
Total Cash $476,329 $582,329 $805,695 $1,040,228
Total Direct $735,305 $890,843 $1,472,010 $1,609,625
Short Term Incentive (%) 41% 53% 88% 149%
Long Term Incentive (%) 50% 85% 141% 190%
Revenue (Millions) $1,251 $1,654 $2,298 $3,949
Base Salary $456,250 $497,596 $614,911 $682,940
Total Cash $655,547 $981,858 $1,137,599 $1,383,649
Total Direct $1,561,757 $2,052,974 $2,377,238 $2,537,289
Short Term Incentive (%) 47% 80% 119% 136%
Long Term Incentive (%) 143% 180% 238% 302%
$1,000MM+ N = 28
$0 - $500MM N = 12
$500 - $1,000MM N = 18
© 2020 Grant Thornton LLP | All rights reserved | U.S. member firm of Grant Thornton International Ltd 43
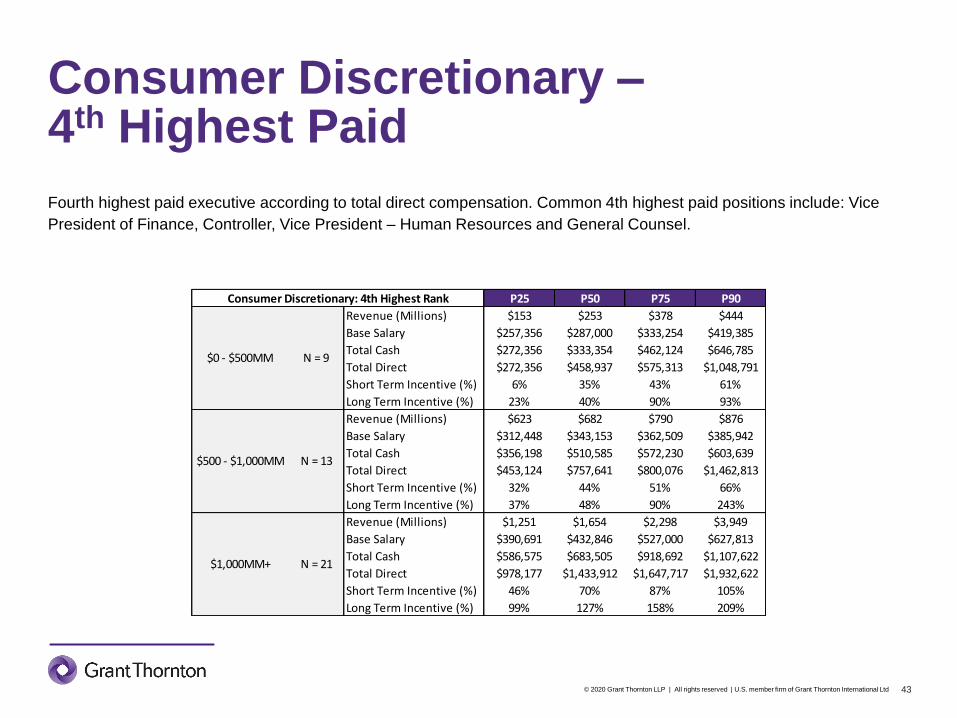
Consumer Discretionary –4th Highest Paid
Fourth highest paid executive according to total direct compensation. Common 4th highest paid positions include: Vice
President of Finance, Controller, Vice President – Human Resources and General Counsel.
Consumer Discretionary: 4th Highest Rank P25 P50 P75 P90
Revenue (Millions) $153 $253 $378 $444
Base Salary $257,356 $287,000 $333,254 $419,385
Total Cash $272,356 $333,354 $462,124 $646,785
Total Direct $272,356 $458,937 $575,313 $1,048,791
Short Term Incentive (%) 6% 35% 43% 61%
Long Term Incentive (%) 23% 40% 90% 93%
Revenue (Millions) $623 $682 $790 $876
Base Salary $312,448 $343,153 $362,509 $385,942
Total Cash $356,198 $510,585 $572,230 $603,639
Total Direct $453,124 $757,641 $800,076 $1,462,813
Short Term Incentive (%) 32% 44% 51% 66%
Long Term Incentive (%) 37% 48% 90% 243%
Revenue (Millions) $1,251 $1,654 $2,298 $3,949
Base Salary $390,691 $432,846 $527,000 $627,813
Total Cash $586,575 $683,505 $918,692 $1,107,622
Total Direct $978,177 $1,433,912 $1,647,717 $1,932,622
Short Term Incentive (%) 46% 70% 87% 105%
Long Term Incentive (%) 99% 127% 158% 209%
$0 - $500MM N = 9
$500 - $1,000MM N = 13
$1,000MM+ N = 21

© 2020 Grant Thornton LLP | All rights reserved | U.S. member firm of Grant Thornton International Ltd 44
Consumer Discretionary –5th Highest Paid
Fifth highest paid executive according to total direct compensation. Common 5th highest paid positions include: Chief
Strategy Officer, Vice President – Sales, Division Senior Vice President and Executive Vice President.
Consumer Discretionary: 5th Highest Rank P25 P50 P75 P90
Revenue (Millions) $153 $253 $378 $444
Base Salary $200,000 $250,425 $263,077 $273,231
Total Cash $263,077 $270,425 $328,000 $383,200
Total Direct $270,425 $403,210 $470,761 $636,579
Short Term Incentive (%) 0% 8% 50% 58%
Long Term Incentive (%) 28% 38% 79% 102%
Revenue (Millions) $623 $682 $790 $876
Base Salary $308,394 $317,770 $342,563 $370,075
Total Cash $380,631 $429,916 $491,843 $599,595
Total Direct $440,277 $631,509 $806,844 $994,392
Short Term Incentive (%) 20% 36% 60% 87%
Long Term Incentive (%) 19% 47% 83% 148%
Revenue (Millions) $1,251 $1,654 $2,298 $3,949
Base Salary $344,789 $427,601 $490,144 $541,167
Total Cash $544,318 $649,152 $923,806 $1,045,360
Total Direct $920,395 $1,298,731 $1,485,854 $1,604,508
Short Term Incentive (%) 49% 62% 93% 107%
Long Term Incentive (%) 101% 118% 130% 172%
$500 - $1,000MM N = 7
$1,000MM+ N = 14
$0 - $500MM N = 5

© 2020 Grant Thornton LLP | All rights reserved | U.S. member firm of Grant Thornton International Ltd 45
Consumer Discretionary –Board Chair
Responsible for leading the Board of Directors. This individual provides leadership to an organization's officer and
executive team, and ensures the organization is fulfilling its duties to their shareholders. Note this position does not
include Executive Chairman.
Consumer Discretionary: Board Chair P25 P50 P75 P90
Revenue (Millions) $153 $253 $378 $444
Cash Compensation $61,500 $72,500 $83,750 $122,000
Equity Compensation $50,442 $60,000 $75,000 $129,156
Total Compensation $114,332 $136,250 $149,375 $196,500
Revenue (Millions) $623 $682 $790 $876
Cash Compensation $80,000 $90,000 $107,500 $163,600
Equity Compensation $73,750 $84,127 $101,250 $107,500
Total Compensation $146,500 $190,000 $215,000 $273,000
Revenue (Millions) $1,251 $1,654 $2,298 $3,949
Cash Compensation $90,000 $150,000 $180,000 $244,000
Equity Compensation $112,500 $140,000 $193,750 $221,500
Total Compensation $238,750 $270,000 $363,750 $412,000
$500 - $1,000MM N = 29
$1,000MM+ N = 40
$0 - $500MM N = 10

Consumer Staples

© 2020 Grant Thornton LLP | All rights reserved | U.S. member firm of Grant Thornton International Ltd 47
Consumer Staples –Chief Executive Officer
Top executive for the organization. Responsible for the overall success and creation of shareholder value. Manages the
profitability and growth of the organization. Develops and establishes long-range plans and strategies, and represents the
organization to external constituents, authorities, and the public. Reports to the Board of Directors.
Consumer Staples: CEO P25 P50 P75 P90
Revenue (Millions) $224 $333 $480 $500
Base Salary $460,581 $625,000 $705,000 $748,800
Total Cash $524,102 $1,039,844 $1,620,515 $2,100,600
Total Direct $1,202,200 $1,465,101 $2,497,055 $2,791,487
Short Term Incentive (%) 35% 92% 134% 181%
Long Term Incentive (%) 20% 97% 154% 253%
Revenue (Millions) $966 $1,198 $1,411 $1,723
Base Salary $579,086 $720,563 $827,831 $921,500
Total Cash $828,565 $1,260,725 $1,864,669 $3,300,428
Total Direct $1,216,144 $1,934,648 $3,704,540 $5,896,724
Short Term Incentive (%) 36% 81% 124% 193%
Long Term Incentive (%) 41% 67% 191% 1691%
Revenue (Millions) $2,383 $3,509 $7,755 $21,058
Base Salary $950,000 $1,018,457 $1,195,385 $1,216,440
Total Cash $1,341,248 $1,720,420 $2,103,609 $2,563,433
Total Direct $3,820,633 $4,362,393 $5,724,080 $6,988,667
Short Term Incentive (%) 11% 79% 102% 120%
Long Term Incentive (%) 202% 249% 358% 409%
$0 - $500MM N = 10
$500 - $2,000MM N = 16
$2,000MM+ N = 13

© 2020 Grant Thornton LLP | All rights reserved | U.S. member firm of Grant Thornton International Ltd 48
Consumer Staples –Chief Financial Officer
Establishes, implements and maintains the financial plans and policies of the organization, including fiscal controls,
preparation and interpretation of financial reports, and safeguarding of the organization’s assets. Develops and maintains
overall accounting policies and controls. Assists in long-range planning and advises management on financial affairs.
Consumer Staples: CFO P25 P50 P75 P90
Revenue (Millions) $224 $333 $480 $500
Base Salary $258,333 $302,500 $360,000 $373,320
Total Cash $363,867 $491,563 $587,738 $840,068
Total Direct $507,501 $681,000 $905,800 $1,107,405
Short Term Incentive (%) 37% 57% 68% 128%
Long Term Incentive (%) 0% 62% 107% 166%
Revenue (Millions) $966 $1,198 $1,411 $1,723
Base Salary $373,300 $411,333 $441,245 $559,231
Total Cash $539,553 $633,699 $692,298 $725,088
Total Direct $766,968 $832,778 $980,840 $1,193,610
Short Term Incentive (%) 37% 48% 64% 79%
Long Term Incentive (%) 40% 52% 60% 91%
Revenue (Millions) $2,383 $3,509 $7,755 $21,058
Base Salary $375,111 $449,017 $517,844 $643,656
Total Cash $515,289 $612,341 $691,588 $999,726
Total Direct $792,500 $996,164 $1,180,957 $2,542,298
Short Term Incentive (%) 16% 38% 70% 73%
Long Term Incentive (%) 25% 93% 157% 288%
$0 - $500MM N = 13
$500 - $2,000MM N = 14
$2,000MM+ N = 16

© 2020 Grant Thornton LLP | All rights reserved | U.S. member firm of Grant Thornton International Ltd 49
Consumer Staples –Chief Operating Officer
Directs and controls the organization's processes and operations as necessary to ensure efficient and effective execution
of policies and procedures. Oversees the designed, operation and improvement of the system that creates and delivers
the organization's products or services. Ensures the achievement of short- and long- range goals for operations, human
resources, financial performance and growth.
Consumer Staples: COO P25 P50 P75 P90
Revenue (Millions) $224 $333 $480 $500
Base Salary $281,247 $322,756 $357,732 $382,969
Total Cash $431,426 $445,274 $459,186 $580,605
Total Direct $555,985 $613,269 $675,823 $689,836
Short Term Incentive (%) 32% 37% 55% 68%
Long Term Incentive (%) 11% 43% 52% 62%
Revenue (Millions) $966 $1,198 $1,411 $1,723
Base Salary $400,305 $430,721 $453,542 $501,517
Total Cash $430,721 $616,605 $817,380 $947,528
Total Direct $767,165 $915,103 $1,343,780 $1,402,416
Short Term Incentive (%) 0% 54% 80% 88%
Long Term Incentive (%) 22% 38% 76% 158%
Revenue (Millions) $2,383 $3,509 $7,755 $21,058
Base Salary $561,913 $740,772 $854,614 $917,498
Total Cash $736,431 $950,856 $1,387,749 $1,781,638
Total Direct $1,505,484 $1,692,249 $1,986,159 $2,914,237
Short Term Incentive (%) 6% 68% 94% 101%
Long Term Incentive (%) 98% 153% 187% 219%
$0 - $500MM N = 6
$500 - $2,000MM N = 5
$2,000MM+ N = 7

© 2020 Grant Thornton LLP | All rights reserved | U.S. member firm of Grant Thornton International Ltd 50
Consumer Staples –General Counsel / Top Legal Officer
Manages legal functions to ensure the organization's legal position is developed and maintained. Establishes legal
services required by the organization and ensures that the organization is protected from any legal action. Provides
executives with guidance in identifying the critical problems to which the application of legal principals yields the greatest
opportunities for reducing risks and maximizing profits.
Consumer Staples: General Counsel P25 P50 P75 P90
Revenue (Millions) $224 $333 $480 $500
Base Salary ISD ISD ISD ISD
Total Cash ISD ISD ISD ISD
Total Direct ISD ISD ISD ISD
Short Term Incentive (%) ISD ISD ISD ISD
Long Term Incentive (%) ISD ISD ISD ISD
Revenue (Millions) $966 $1,198 $1,411 $1,723
Base Salary $339,316 $359,464 $410,416 $446,450
Total Cash $423,707 $501,453 $549,909 $630,870
Total Direct $529,374 $685,876 $938,801 $992,181
Short Term Incentive (%) 29% 45% 51% 73%
Long Term Incentive (%) 46% 56% 69% 88%
Revenue (Millions) $2,383 $3,509 $7,755 $21,058
Base Salary $411,620 $437,836 $456,230 $479,471
Total Cash $473,954 $569,520 $633,354 $690,069
Total Direct $659,026 $897,691 $1,142,096 $1,255,292
Short Term Incentive (%) 4% 29% 50% 66%
Long Term Incentive (%) 47% 74% 104% 129%
$0 - $500MM N = 4
$500 - $2,000MM N = 6
$2,000MM+ N = 6

© 2020 Grant Thornton LLP | All rights reserved | U.S. member firm of Grant Thornton International Ltd 51
Consumer Staples –3rd Highest Paid
Third highest paid executive according to total direct compensation. Common 3rd highest paid positions include: Senior
Vice President – Operations, Vice President – Marketing, Corporate Secretary and General Manager.
Consumer Staples: 3rd Highest Rank P25 P50 P75 P90
Revenue (Millions) $224 $333 $480 $500
Base Salary $302,500 $363,462 $375,000 $516,200
Total Cash $461,209 $495,760 $647,391 $804,720
Total Direct $565,358 $681,000 $831,685 $1,059,493
Short Term Incentive (%) 27% 52% 63% 84%
Long Term Incentive (%) 24% 50% 66% 83%
Revenue (Millions) $966 $1,198 $1,411 $1,723
Base Salary $373,852 $431,546 $531,404 $609,669
Total Cash $566,765 $630,936 $767,099 $1,005,136
Total Direct $723,388 $831,225 $1,043,081 $1,703,745
Short Term Incentive (%) 41% 47% 67% 85%
Long Term Incentive (%) 30% 49% 65% 156%
Revenue (Millions) $2,383 $3,509 $7,755 $21,058
Base Salary $408,166 $461,267 $498,755 $635,045
Total Cash $549,536 $612,341 $765,217 $1,003,645
Total Direct $789,205 $1,116,295 $1,356,156 $2,015,079
Short Term Incentive (%) 20% 40% 73% 90%
Long Term Incentive (%) 37% 113% 142% 167%
$0 - $500MM N = 9
$500 - $2,000MM N = 8
$2,000MM+ N = 16

© 2020 Grant Thornton LLP | All rights reserved | U.S. member firm of Grant Thornton International Ltd 52
Consumer Staples –4th Highest Paid
Fourth highest paid executive according to total direct compensation. Common 4th highest paid positions include: Vice
President of Finance, Controller, Vice President – Human Resources and General Counsel.
Consumer Staples: 4th Highest Rank P25 P50 P75 P90
Revenue (Millions) $224 $333 $480 $500
Base Salary $261,776 $288,047 $308,046 $462,197
Total Cash $430,443 $436,650 $475,770 $633,380
Total Direct $563,806 $578,013 $703,491 $760,564
Short Term Incentive (%) 30% 46% 63% 79%
Long Term Incentive (%) 43% 49% 78% 104%
Revenue (Millions) $966 $1,198 $1,411 $1,723
Base Salary $329,271 $397,665 $425,105 $469,942
Total Cash $398,851 $598,759 $645,811 $677,082
Total Direct $516,316 $767,165 $870,696 $961,916
Short Term Incentive (%) 22% 39% 51% 52%
Long Term Incentive (%) 42% 48% 53% 60%
Revenue (Millions) $2,383 $3,509 $7,755 $21,058
Base Salary $390,063 $444,986 $461,876 $496,440
Total Cash $513,165 $594,343 $665,615 $724,965
Total Direct $650,945 $1,037,517 $1,081,091 $1,180,153
Short Term Incentive (%) 20% 37% 47% 65%
Long Term Incentive (%) 45% 89% 101% 127%
$0 - $500MM N = 6
$500 - $2,000MM N = 7
$2,000MM+ N = 12

© 2020 Grant Thornton LLP | All rights reserved | U.S. member firm of Grant Thornton International Ltd 53
Consumer Staples –5th Highest Paid
Fifth highest paid executive according to total direct compensation. Common 5th highest paid positions include: Chief
Strategy Officer, Vice President – Sales, Division Senior Vice President and Executive Vice President.
Consumer Staples: 5th Highest Rank P25 P50 P75 P90
Revenue (Millions) $224 $333 $480 $500
Base Salary $213,794 $247,500 $273,750 $420,500
Total Cash $285,794 $360,000 $442,268 $586,846
Total Direct $335,347 $467,111 $664,954 $713,164
Short Term Incentive (%) 28% 36% 48% 58%
Long Term Incentive (%) 5% 35% 55% 75%
Revenue (Millions) $966 $1,198 $1,411 $1,723
Base Salary $290,668 $335,000 $345,569 $377,807
Total Cash $425,078 $466,321 $572,412 $643,120
Total Direct $529,993 $646,826 $746,415 $769,576
Short Term Incentive (%) 42% 51% 69% 100%
Long Term Incentive (%) 26% 29% 59% 88%
Revenue (Millions) $2,383 $3,509 $7,755 $21,058
Base Salary $365,145 $374,373 $392,632 $437,790
Total Cash $460,867 $501,060 $549,907 $641,584
Total Direct $570,792 $791,347 $1,003,037 $1,043,620
Short Term Incentive (%) 23% 36% 45% 57%
Long Term Incentive (%) 34% 77% 118% 154%
$0 - $500MM N = 6
$500 - $2,000MM N = 7
$2,000MM+ N = 10

© 2020 Grant Thornton LLP | All rights reserved | U.S. member firm of Grant Thornton International Ltd 54
Consumer Staples –Board Chair
Responsible for leading the Board of Directors. This individual provides leadership to an organization's officer and
executive team, and ensures the organization is fulfilling its duties to their shareholders. Note this position does not
include Executive Chairman.
Consumer Staples: Board Chair P25 P50 P75 P90
Revenue (Millions) $224 $333 $480 $500
Cash Compensation $73,000 $92,500 $111,750 $124,200
Equity Compensation $53,125 $70,000 $74,645 $99,159
Total Compensation $125,000 $135,000 $147,996 $183,042
Revenue (Millions) $966 $1,198 $1,411 $1,723
Cash Compensation $72,500 $95,000 $123,750 $148,500
Equity Compensation $62,500 $65,000 $92,500 $109,000
Total Compensation $119,500 $157,500 $202,500 $252,000
Revenue (Millions) $2,383 $3,509 $7,755 $21,058
Cash Compensation $125,000 $162,500 $173,750 $200,000
Equity Compensation $72,368 $97,500 $120,000 $142,500
Total Compensation $197,750 $262,735 $293,750 $342,500
$0 - $500MM N = 13
$500 - $2,000MM N = 5
$2,000MM+ N = 8

Energy

© 2020 Grant Thornton LLP | All rights reserved | U.S. member firm of Grant Thornton International Ltd 56
Energy –Chief Executive Officer
Top executive for the organization. Responsible for the overall success and creation of shareholder value. Manages the
profitability and growth of the organization. Develops and establishes long-range plans and strategies, and represents the
organization to external constituents, authorities, and the public. Reports to the Board of Directors.
Energy: CEO P25 P50 P75 P90
Revenue (Millions) $76 $143 $230 $261
Base Salary $397,952 $492,275 $557,084 $670,333
Total Cash $730,875 $851,500 $1,095,896 $1,343,333
Total Direct $804,426 $1,109,212 $2,084,628 $3,638,426
Short Term Incentive (%) 49% 93% 127% 189%
Long Term Incentive (%) 0% 82% 205% 340%
Revenue (Millions) $453 $590 $874 $978
Base Salary $631,000 $730,000 $793,752 $889,200
Total Cash $1,152,510 $1,621,807 $1,888,196 $2,449,919
Total Direct $3,385,816 $4,035,215 $5,154,106 $7,548,078
Short Term Incentive (%) 97% 117% 167% 205%
Long Term Incentive (%) 246% 329% 480% 1100%
Revenue (Millions) $1,144 $1,548 $2,353 $3,853
Base Salary $670,000 $790,385 $867,308 $1,005,000
Total Cash $1,380,200 $1,812,224 $2,084,615 $2,859,148
Total Direct $3,625,018 $5,162,109 $7,080,967 $8,600,080
Short Term Incentive (%) 82% 120% 180% 208%
Long Term Incentive (%) 308% 422% 539% 676%
$0 - $250MM N = 20
$250 - $1,000MM N = 19
$1,000MM+ N = 29
© 2020 Grant Thornton LLP | All rights reserved | U.S. member firm of Grant Thornton International Ltd 57
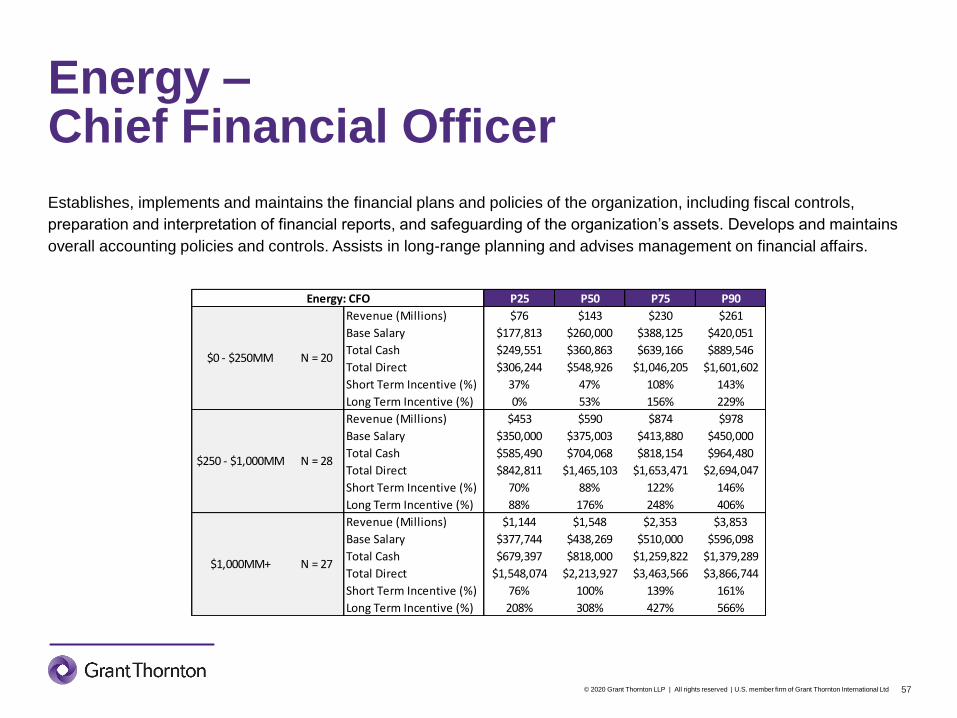
Energy –Chief Financial Officer
Establishes, implements and maintains the financial plans and policies of the organization, including fiscal controls,
preparation and interpretation of financial reports, and safeguarding of the organization’s assets. Develops and maintains
overall accounting policies and controls. Assists in long-range planning and advises management on financial affairs.
Energy: CFO P25 P50 P75 P90
Revenue (Millions) $76 $143 $230 $261
Base Salary $177,813 $260,000 $388,125 $420,051
Total Cash $249,551 $360,863 $639,166 $889,546
Total Direct $306,244 $548,926 $1,046,205 $1,601,602
Short Term Incentive (%) 37% 47% 108% 143%
Long Term Incentive (%) 0% 53% 156% 229%
Revenue (Millions) $453 $590 $874 $978
Base Salary $350,000 $375,003 $413,880 $450,000
Total Cash $585,490 $704,068 $818,154 $964,480
Total Direct $842,811 $1,465,103 $1,653,471 $2,694,047
Short Term Incentive (%) 70% 88% 122% 146%
Long Term Incentive (%) 88% 176% 248% 406%
Revenue (Millions) $1,144 $1,548 $2,353 $3,853
Base Salary $377,744 $438,269 $510,000 $596,098
Total Cash $679,397 $818,000 $1,259,822 $1,379,289
Total Direct $1,548,074 $2,213,927 $3,463,566 $3,866,744
Short Term Incentive (%) 76% 100% 139% 161%
Long Term Incentive (%) 208% 308% 427% 566%
$250 - $1,000MM N = 28
$1,000MM+ N = 27
$0 - $250MM N = 20

© 2020 Grant Thornton LLP | All rights reserved | U.S. member firm of Grant Thornton International Ltd 58
Energy –Chief Operating Officer
Directs and controls the organization's processes and operations as necessary to ensure efficient and effective execution
of policies and procedures. Oversees the designed, operation and improvement of the system that creates and delivers
the organization's products or services. Ensures the achievement of short- and long- range goals for operations, human
resources, financial performance and growth.
Energy: COO P25 P50 P75 P90
Revenue (Millions) $76 $143 $230 $261
Base Salary $268,750 $290,000 $432,000 $468,025
Total Cash $305,000 $581,750 $672,898 $809,090
Total Direct $352,533 $581,750 $1,344,323 $1,747,754
Short Term Incentive (%) 19% 51% 89% 103%
Long Term Incentive (%) 0% 54% 158% 216%
Revenue (Millions) $453 $590 $874 $978
Base Salary $373,750 $423,308 $482,731 $542,800
Total Cash $693,491 $860,214 $1,056,899 $1,145,575
Total Direct $1,466,769 $1,883,161 $2,304,842 $2,873,449
Short Term Incentive (%) 76% 87% 128% 153%
Long Term Incentive (%) 163% 201% 352% 386%
Revenue (Millions) $1,144 $1,548 $2,353 $3,853
Base Salary $420,703 $446,375 $530,871 $612,500
Total Cash $731,994 $978,267 $1,184,250 $1,334,000
Total Direct $1,691,049 $2,360,009 $3,460,557 $3,906,735
Short Term Incentive (%) 60% 98% 144% 179%
Long Term Incentive (%) 208% 346% 503% 520%
$0 - $250MM N = 7
$250 - $1,000MM N = 15
$1,000MM+ N = 16

© 2020 Grant Thornton LLP | All rights reserved | U.S. member firm of Grant Thornton International Ltd 59
Energy –General Counsel / Top Legal Officer
Manages legal functions to ensure the organization's legal position is developed and maintained. Establishes legal
services required by the organization and ensures that the organization is protected from any legal action. Provides
executives with guidance in identifying the critical problems to which the application of legal principals yields the greatest
opportunities for reducing risks and maximizing profits.
Energy: General Counsel P25 P50 P75 P90
Revenue (Millions) $76 $143 $230 $261
Base Salary $287,500 $301,500 $363,536 $397,000
Total Cash $372,503 $504,225 $540,857 $582,195
Total Direct $353,750 $619,522 $773,078 $849,997
Short Term Incentive (%) 28% 48% 62% 70%
Long Term Incentive (%) 0% 11% 78% 100%
Revenue (Millions) $453 $590 $874 $978
Base Salary $323,019 $360,000 $397,308 $476,040
Total Cash $500,000 $652,483 $798,943 $914,526
Total Direct $917,740 $1,375,333 $1,520,713 $1,801,662
Short Term Incentive (%) 71% 83% 94% 130%
Long Term Incentive (%) 126% 174% 214% 299%
Revenue (Millions) $1,144 $1,548 $2,353 $3,853
Base Salary $300,000 $392,000 $421,250 $452,456
Total Cash $523,180 $684,616 $768,830 $927,932
Total Direct $840,284 $1,527,894 $2,069,846 $2,287,613
Short Term Incentive (%) 50% 81% 101% 141%
Long Term Incentive (%) 81% 217% 315% 363%
$0 - $250MM N = 9
$250 - $1,000MM N = 17
$1,000MM+ N = 17

© 2020 Grant Thornton LLP | All rights reserved | U.S. member firm of Grant Thornton International Ltd 60
Energy –3rd Highest Paid
Third highest paid executive according to total direct compensation. Common 3rd highest paid positions include: Senior
Vice President – Operations, Vice President – Marketing, Corporate Secretary and General Manager.
Energy: 3rd Highest Rank P25 P50 P75 P90
Revenue (Millions) $76 $143 $230 $261
Base Salary $223,240 $300,000 $341,562 $393,000
Total Cash $308,783 $470,586 $614,507 $689,179
Total Direct $322,500 $599,986 $1,128,669 $1,340,938
Short Term Incentive (%) 38% 49% 85% 123%
Long Term Incentive (%) 0% 51% 156% 176%
Revenue (Millions) $453 $590 $874 $978
Base Salary $347,500 $375,630 $444,460 $464,377
Total Cash $649,350 $719,736 $806,099 $922,777
Total Direct $1,213,244 $1,434,026 $1,699,927 $2,354,155
Short Term Incentive (%) 71% 89% 97% 134%
Long Term Incentive (%) 106% 175% 219% 373%
Revenue (Millions) $1,144 $1,548 $2,353 $3,853
Base Salary $366,276 $425,000 $484,000 $574,721
Total Cash $601,300 $798,500 $1,004,568 $1,479,075
Total Direct $1,184,008 $1,956,194 $2,870,712 $3,808,278
Short Term Incentive (%) 62% 100% 120% 195%
Long Term Incentive (%) 156% 238% 375% 473%
$0 - $250MM N = 25
$250 - $1,000MM N = 32
$1,000MM+ N = 25

© 2020 Grant Thornton LLP | All rights reserved | U.S. member firm of Grant Thornton International Ltd 61
Energy –4th Highest Paid
Fourth highest paid executive according to total direct compensation. Common 4th highest paid positions include: Vice
President of Finance, Controller, Vice President – Human Resources and General Counsel.
Energy: 4th Highest Rank P25 P50 P75 P90
Revenue (Millions) $76 $143 $230 $261
Base Salary $191,241 $261,250 $343,625 $391,200
Total Cash $235,264 $401,467 $522,267 $568,661
Total Direct $266,825 $506,892 $913,917 $1,081,514
Short Term Incentive (%) 24% 34% 75% 100%
Long Term Incentive (%) 0% 53% 121% 170%
Revenue (Millions) $453 $590 $874 $978
Base Salary $319,995 $370,000 $392,116 $437,782
Total Cash $514,360 $714,655 $772,254 $865,672
Total Direct $872,446 $1,374,338 $1,491,324 $1,587,731
Short Term Incentive (%) 66% 85% 111% 143%
Long Term Incentive (%) 107% 168% 231% 285%
Revenue (Millions) $1,144 $1,548 $2,353 $3,853
Base Salary $302,894 $357,128 $413,000 $424,625
Total Cash $511,194 $627,878 $749,419 $780,247
Total Direct $888,055 $1,300,296 $1,635,366 $1,890,083
Short Term Incentive (%) 50% 68% 99% 113%
Long Term Incentive (%) 89% 169% 262% 370%
$0 - $250MM N = 18
$250 - $1,000MM N = 24
$1,000MM+ N = 22

© 2020 Grant Thornton LLP | All rights reserved | U.S. member firm of Grant Thornton International Ltd 62
Energy –5th Highest Paid
Fifth highest paid executive according to total direct compensation. Common 5th highest paid positions include: Chief
Strategy Officer, Vice President – Sales, Division Senior Vice President and Executive Vice President.
Energy: 5th Highest Rank P25 P50 P75 P90
Revenue (Millions) $76 $143 $230 $261
Base Salary ISD ISD ISD ISD
Total Cash ISD ISD ISD ISD
Total Direct ISD ISD ISD ISD
Short Term Incentive (%) ISD ISD ISD ISD
Long Term Incentive (%) ISD ISD ISD ISD
Revenue (Millions) $453 $590 $874 $978
Base Salary $242,496 $273,500 $350,000 $425,000
Total Cash $392,298 $531,250 $587,368 $618,695
Total Direct $642,962 $753,572 $1,251,387 $1,523,317
Short Term Incentive (%) 56% 72% 78% 146%
Long Term Incentive (%) 90% 157% 220% 233%
Revenue (Millions) $1,144 $1,548 $2,353 $3,853
Base Salary $304,800 $348,708 $371,082 $422,903
Total Cash $507,548 $607,020 $707,575 $895,092
Total Direct $796,140 $1,173,433 $1,583,495 $1,791,138
Short Term Incentive (%) 46% 91% 100% 148%
Long Term Incentive (%) 77% 159% 239% 275%
$0 - $250MM N = 4
$250 - $1,000MM N = 22
$1,000MM+ N = 22
© 2020 Grant Thornton LLP | All rights reserved | U.S. member firm of Grant Thornton International Ltd 63
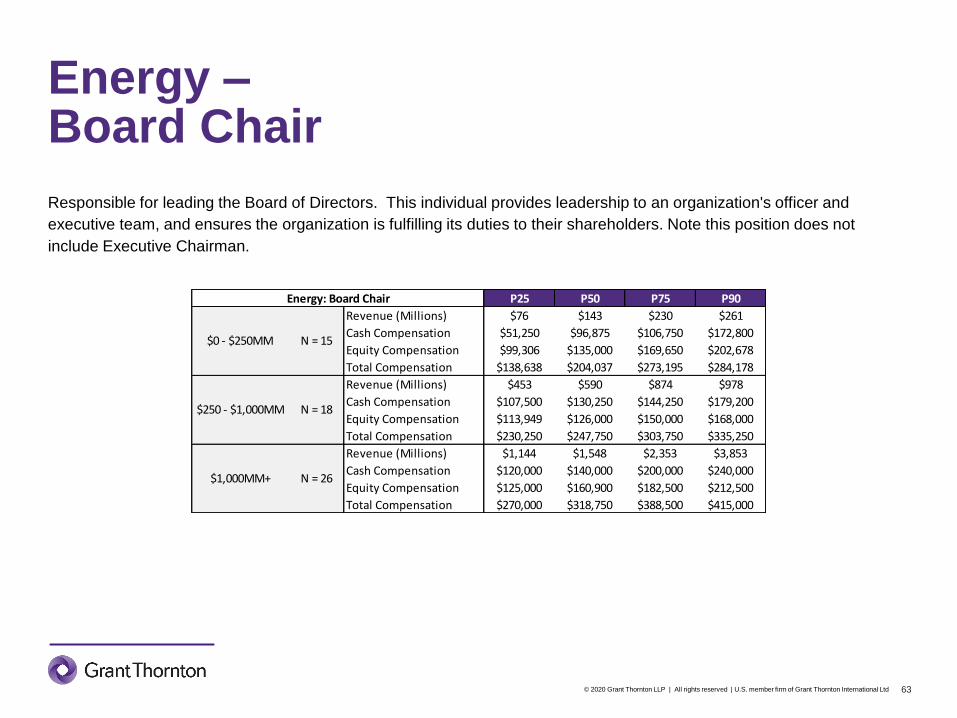
Energy –Board Chair
Responsible for leading the Board of Directors. This individual provides leadership to an organization's officer and
executive team, and ensures the organization is fulfilling its duties to their shareholders. Note this position does not
include Executive Chairman.
Energy: Board Chair P25 P50 P75 P90
Revenue (Millions) $76 $143 $230 $261
Cash Compensation $51,250 $96,875 $106,750 $172,800
Equity Compensation $99,306 $135,000 $169,650 $202,678
Total Compensation $138,638 $204,037 $273,195 $284,178
Revenue (Millions) $453 $590 $874 $978
Cash Compensation $107,500 $130,250 $144,250 $179,200
Equity Compensation $113,949 $126,000 $150,000 $168,000
Total Compensation $230,250 $247,750 $303,750 $335,250
Revenue (Millions) $1,144 $1,548 $2,353 $3,853
Cash Compensation $120,000 $140,000 $200,000 $240,000
Equity Compensation $125,000 $160,900 $182,500 $212,500
Total Compensation $270,000 $318,750 $388,500 $415,000
$1,000MM+ N = 26
$0 - $250MM N = 15
$250 - $1,000MM N = 18

Financials

© 2020 Grant Thornton LLP | All rights reserved | U.S. member firm of Grant Thornton International Ltd 65
Financials –Chief Executive Officer
Top executive for the organization. Responsible for the overall success and creation of shareholder value. Manages the
profitability and growth of the organization. Develops and establishes long-range plans and strategies, and represents the
organization to external constituents, authorities, and the public. Reports to the Board of Directors.
Financials: CEO P25 P50 P75 P90
Revenue (Millions) $53 $97 $155 $186
Base Salary $400,000 $465,000 $600,000 $700,000
Total Cash $574,462 $664,272 $846,105 $1,543,128
Total Direct $677,880 $907,600 $1,509,768 $2,081,498
Short Term Incentive (%) 30% 52% 66% 72%
Long Term Incentive (%) 8% 37% 75% 128%
Revenue (Millions) $379 $561 $772 $837
Base Salary $588,312 $725,000 $905,216 $994,089
Total Cash $1,033,333 $1,441,549 $1,903,955 $2,316,844
Total Direct $1,166,410 $2,240,511 $3,911,262 $4,683,987
Short Term Incentive (%) 57% 87% 134% 153%
Long Term Incentive (%) 49% 89% 200% 218%
Revenue (Millions) $1,160 $1,321 $1,781 $2,165
Base Salary $729,327 $800,000 $950,000 $1,037,789
Total Cash $1,475,000 $2,236,068 $3,100,000 $3,517,500
Total Direct $2,745,695 $3,941,746 $4,775,641 $5,933,057
Short Term Incentive (%) 103% 168% 266% 397%
Long Term Incentive (%) 138% 183% 234% 322%
$0 - $250MM N = 21
$250 - $1,000MM N = 25
$1,000MM+ N = 21

© 2020 Grant Thornton LLP | All rights reserved | U.S. member firm of Grant Thornton International Ltd 66
Financials –Chief Financial Officer
Establishes, implements and maintains the financial plans and policies of the organization, including fiscal controls,
preparation and interpretation of financial reports, and safeguarding of the organization’s assets. Develops and maintains
overall accounting policies and controls. Assists in long-range planning and advises management on financial affairs.
Financials: CFO P25 P50 P75 P90
Revenue (Millions) $53 $97 $155 $186
Base Salary $227,722 $271,772 $333,875 $432,600
Total Cash $279,602 $340,627 $567,898 $654,294
Total Direct $308,322 $503,033 $692,911 $826,933
Short Term Incentive (%) 17% 39% 53% 95%
Long Term Incentive (%) 3% 30% 49% 92%
Revenue (Millions) $379 $561 $772 $837
Base Salary $358,897 $405,000 $460,373 $507,500
Total Cash $539,802 $701,118 $848,625 $1,265,450
Total Direct $743,783 $985,815 $1,672,106 $2,976,924
Short Term Incentive (%) 46% 64% 93% 166%
Long Term Incentive (%) 38% 79% 114% 412%
Revenue (Millions) $1,160 $1,321 $1,781 $2,165
Base Salary $425,000 $500,000 $575,000 $627,834
Total Cash $822,635 $1,132,783 $1,447,500 $1,647,427
Total Direct $1,354,912 $1,865,962 $2,311,796 $2,553,960
Short Term Incentive (%) 98% 114% 200% 267%
Long Term Incentive (%) 89% 136% 178% 200%
$0 - $250MM N = 23
$250 - $1,000MM N = 28
$1,000MM+ N = 25
© 2020 Grant Thornton LLP | All rights reserved | U.S. member firm of Grant Thornton International Ltd 67
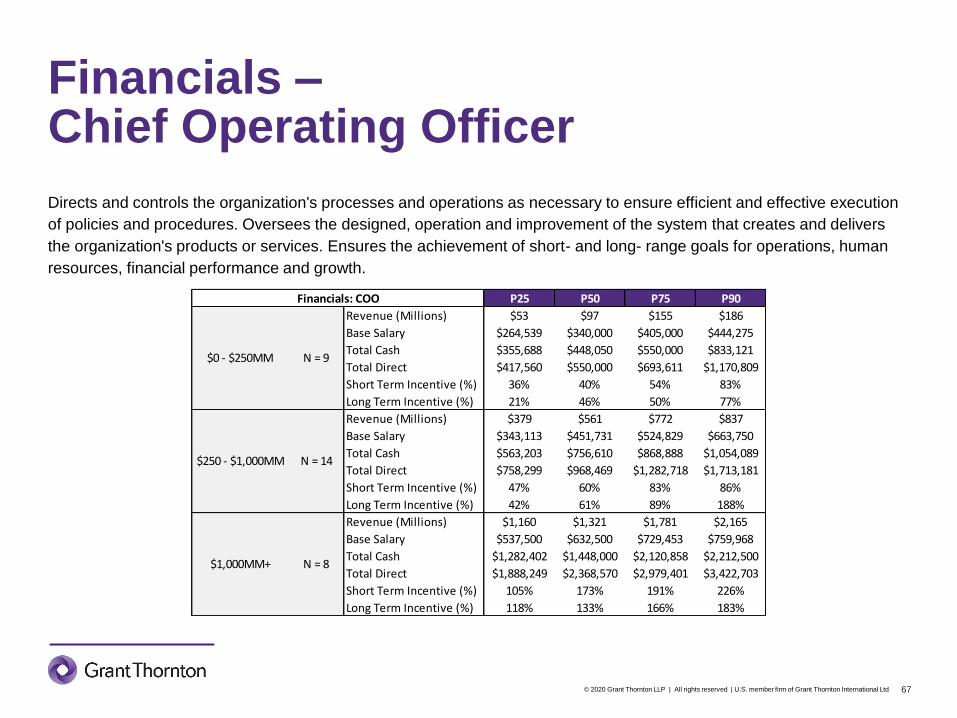
Financials –Chief Operating Officer
Directs and controls the organization's processes and operations as necessary to ensure efficient and effective execution
of policies and procedures. Oversees the designed, operation and improvement of the system that creates and delivers
the organization's products or services. Ensures the achievement of short- and long- range goals for operations, human
resources, financial performance and growth.
Financials: COO P25 P50 P75 P90
Revenue (Millions) $53 $97 $155 $186
Base Salary $264,539 $340,000 $405,000 $444,275
Total Cash $355,688 $448,050 $550,000 $833,121
Total Direct $417,560 $550,000 $693,611 $1,170,809
Short Term Incentive (%) 36% 40% 54% 83%
Long Term Incentive (%) 21% 46% 50% 77%
Revenue (Millions) $379 $561 $772 $837
Base Salary $343,113 $451,731 $524,829 $663,750
Total Cash $563,203 $756,610 $868,888 $1,054,089
Total Direct $758,299 $968,469 $1,282,718 $1,713,181
Short Term Incentive (%) 47% 60% 83% 86%
Long Term Incentive (%) 42% 61% 89% 188%
Revenue (Millions) $1,160 $1,321 $1,781 $2,165
Base Salary $537,500 $632,500 $729,453 $759,968
Total Cash $1,282,402 $1,448,000 $2,120,858 $2,212,500
Total Direct $1,888,249 $2,368,570 $2,979,401 $3,422,703
Short Term Incentive (%) 105% 173% 191% 226%
Long Term Incentive (%) 118% 133% 166% 183%
$0 - $250MM N = 9
$250 - $1,000MM N = 14
$1,000MM+ N = 8

© 2020 Grant Thornton LLP | All rights reserved | U.S. member firm of Grant Thornton International Ltd 68
Financials –General Counsel / Top Legal Officer
Manages legal functions to ensure the organization's legal position is developed and maintained. Establishes legal
services required by the organization and ensures that the organization is protected from any legal action. Provides
executives with guidance in identifying the critical problems to which the application of legal principals yields the greatest
opportunities for reducing risks and maximizing profits.
Financials: General Counsel P25 P50 P75 P90
Revenue (Millions) $53 $97 $155 $186
Base Salary ISD ISD ISD ISD
Total Cash ISD ISD ISD ISD
Total Direct ISD ISD ISD ISD
Short Term Incentive (%) ISD ISD ISD ISD
Long Term Incentive (%) ISD ISD ISD ISD
Revenue (Millions) $379 $561 $772 $837
Base Salary $331,084 $350,000 $399,520 $500,000
Total Cash $477,313 $623,101 $800,611 $900,000
Total Direct $601,913 $864,828 $1,209,976 $1,891,594
Short Term Incentive (%) 46% 57% 79% 117%
Long Term Incentive (%) 41% 58% 120% 198%
Revenue (Millions) $1,160 $1,321 $1,781 $2,165
Base Salary $406,250 $455,950 $539,664 $547,500
Total Cash $886,688 $963,993 $1,512,281 $1,697,468
Total Direct $1,342,045 $1,555,294 $2,226,768 $2,357,259
Short Term Incentive (%) 94% 113% 191% 245%
Long Term Incentive (%) 69% 137% 166% 225%
$0 - $250MM N = 2
$250 - $1,000MM
$1,000MM+ N = 14
N = 11

© 2020 Grant Thornton LLP | All rights reserved | U.S. member firm of Grant Thornton International Ltd 69
Financials –3rd Highest Paid
Third highest paid executive according to total direct compensation. Common 3rd highest paid positions include: Senior
Vice President – Operations, Vice President – Marketing, Corporate Secretary and General Manager.
Financials: 3rd Highest Rank P25 P50 P75 P90
Revenue (Millions) $53 $97 $155 $186
Base Salary $230,789 $297,010 $363,625 $463,861
Total Cash $306,716 $370,058 $576,978 $952,265
Total Direct $344,954 $545,329 $746,058 $1,514,650
Short Term Incentive (%) 31% 38% 54% 123%
Long Term Incentive (%) 17% 35% 79% 136%
Revenue (Millions) $379 $561 $772 $837
Base Salary $345,200 $400,000 $457,292 $500,008
Total Cash $544,657 $629,292 $838,306 $1,071,008
Total Direct $754,563 $939,524 $1,440,082 $2,497,392
Short Term Incentive (%) 46% 64% 91% 160%
Long Term Incentive (%) 39% 67% 113% 308%
Revenue (Millions) $1,160 $1,321 $1,781 $2,165
Base Salary $450,000 $490,904 $598,083 $627,000
Total Cash $1,045,689 $1,361,362 $1,648,119 $2,218,850
Total Direct $1,566,652 $2,226,768 $2,606,377 $3,519,859
Short Term Incentive (%) 103% 154% 258% 372%
Long Term Incentive (%) 92% 129% 177% 200%
$0 - $250MM N = 22
$250 - $1,000MM N = 25
$1,000MM+ N = 25
© 2020 Grant Thornton LLP | All rights reserved | U.S. member firm of Grant Thornton International Ltd 70
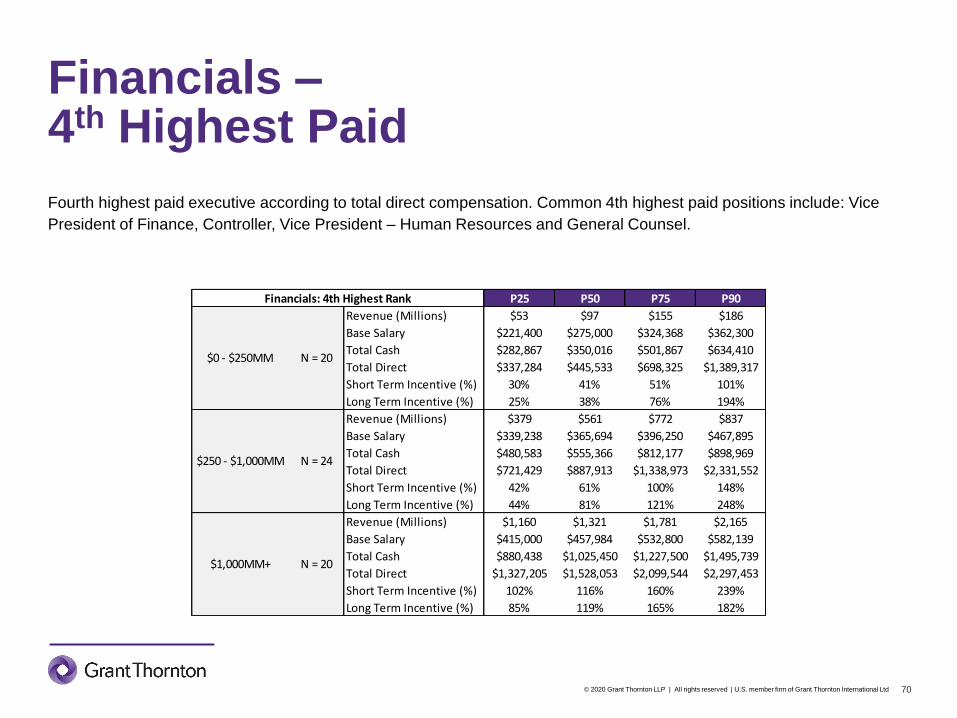
Financials –4th Highest Paid
Fourth highest paid executive according to total direct compensation. Common 4th highest paid positions include: Vice
President of Finance, Controller, Vice President – Human Resources and General Counsel.
Financials: 4th Highest Rank P25 P50 P75 P90
Revenue (Millions) $53 $97 $155 $186
Base Salary $221,400 $275,000 $324,368 $362,300
Total Cash $282,867 $350,016 $501,867 $634,410
Total Direct $337,284 $445,533 $698,325 $1,389,317
Short Term Incentive (%) 30% 41% 51% 101%
Long Term Incentive (%) 25% 38% 76% 194%
Revenue (Millions) $379 $561 $772 $837
Base Salary $339,238 $365,694 $396,250 $467,895
Total Cash $480,583 $555,366 $812,177 $898,969
Total Direct $721,429 $887,913 $1,338,973 $2,331,552
Short Term Incentive (%) 42% 61% 100% 148%
Long Term Incentive (%) 44% 81% 121% 248%
Revenue (Millions) $1,160 $1,321 $1,781 $2,165
Base Salary $415,000 $457,984 $532,800 $582,139
Total Cash $880,438 $1,025,450 $1,227,500 $1,495,739
Total Direct $1,327,205 $1,528,053 $2,099,544 $2,297,453
Short Term Incentive (%) 102% 116% 160% 239%
Long Term Incentive (%) 85% 119% 165% 182%
$0 - $250MM N = 20
$250 - $1,000MM N = 24
$1,000MM+ N = 20

© 2020 Grant Thornton LLP | All rights reserved | U.S. member firm of Grant Thornton International Ltd 71
Financials –5th Highest Paid
Fifth highest paid executive according to total direct compensation. Common 5th highest paid positions include: Chief
Strategy Officer, Vice President – Sales, Division Senior Vice President and Executive Vice President.
Financials: 5th Highest Rank P25 P50 P75 P90
Revenue (Millions) $53 $97 $155 $186
Base Salary $179,182 $225,385 $268,750 $292,000
Total Cash $248,185 $282,867 $327,115 $406,144
Total Direct $275,834 $347,142 $498,373 $556,560
Short Term Incentive (%) 17% 37% 41% 46%
Long Term Incentive (%) 9% 29% 50% 90%
Revenue (Millions) $379 $561 $772 $837
Base Salary $309,924 $328,574 $393,203 $430,000
Total Cash $427,543 $477,722 $541,547 $815,754
Total Direct $583,552 $666,100 $794,588 $1,360,507
Short Term Incentive (%) 42% 52% 64% 83%
Long Term Incentive (%) 45% 60% 83% 153%
Revenue (Millions) $1,160 $1,321 $1,781 $2,165
Base Salary $347,500 $433,100 $451,633 $510,800
Total Cash $721,000 $900,000 $1,151,114 $1,427,906
Total Direct $1,007,238 $1,350,178 $1,741,630 $2,105,649
Short Term Incentive (%) 89% 107% 156% 226%
Long Term Incentive (%) 72% 110% 155% 200%
$0 - $250MM N = 14
$250 - $1,000MM N = 20
$1,000MM+ N = 15

© 2020 Grant Thornton LLP | All rights reserved | U.S. member firm of Grant Thornton International Ltd 72
Financials –Board Chair
Responsible for leading the Board of Directors. This individual provides leadership to an organization's officer and
executive team, and ensures the organization is fulfilling its duties to their shareholders. Note this position does not
include Executive Chairman.
Financials: Board Chair P25 P50 P75 P90
Revenue (Millions) $53 $97 $155 $186
Cash Compensation $31,200 $59,250 $78,750 $105,200
Equity Compensation $34,675 $61,954 $71,252 $97,501
Total Compensation $37,050 $67,200 $151,252 $189,341
Revenue (Millions) $379 $561 $772 $837
Cash Compensation $73,000 $130,000 $151,000 $195,000
Equity Compensation $33,781 $128,125 $171,250 $197,500
Total Compensation $133,000 $225,000 $321,000 $390,000
Revenue (Millions) $1,160 $1,321 $1,781 $2,165
Cash Compensation $112,500 $150,000 $175,000 $210,000
Equity Compensation $75,002 $105,000 $168,750 $226,500
Total Compensation $199,420 $265,000 $318,000 $400,000
$0 - $250MM N = 20
$250 - $1,000MM N = 13
$1,000MM+ N = 31

Health Care

© 2020 Grant Thornton LLP | All rights reserved | U.S. member firm of Grant Thornton International Ltd 74
Health Care –Chief Executive Officer
Top executive for the organization. Responsible for the overall success and creation of shareholder value. Manages the
profitability and growth of the organization. Develops and establishes long-range plans and strategies, and represents the
organization to external constituents, authorities, and the public. Reports to the Board of Directors.
Health Care: CEO P25 P50 P75 P90
Revenue (Millions) $2 $21 $81 $219
Base Salary $480,800 $521,200 $546,364 $611,178
Total Cash $721,166 $835,932 $891,975 $1,027,164
Total Direct $830,000 $891,975 $2,325,571 $2,947,076
Short Term Incentive (%) 40% 56% 66% 73%
Long Term Incentive (%) 0% 88% 238% 393%
Revenue (Millions) $409 $525 $730 $843
Base Salary $534,645 $638,371 $750,159 $903,563
Total Cash $934,158 $1,271,412 $1,514,639 $1,742,894
Total Direct $1,090,178 $2,291,429 $3,728,201 $4,363,468
Short Term Incentive (%) 47% 88% 128% 148%
Long Term Incentive (%) 0% 172% 291% 415%
Revenue (Millions) $1,504 $1,960 $4,537 $5,748
Base Salary $804,144 $886,296 $1,000,511 $1,088,625
Total Cash $1,113,396 $1,379,611 $2,119,197 $3,109,722
Total Direct $3,293,411 $4,303,700 $5,967,736 $7,272,109
Short Term Incentive (%) 40% 65% 127% 200%
Long Term Incentive (%) 216% 343% 424% 504%
$0 - $250MM N = 19
$250 - $1,000MM N = 24
$1,000MM+ N = 20
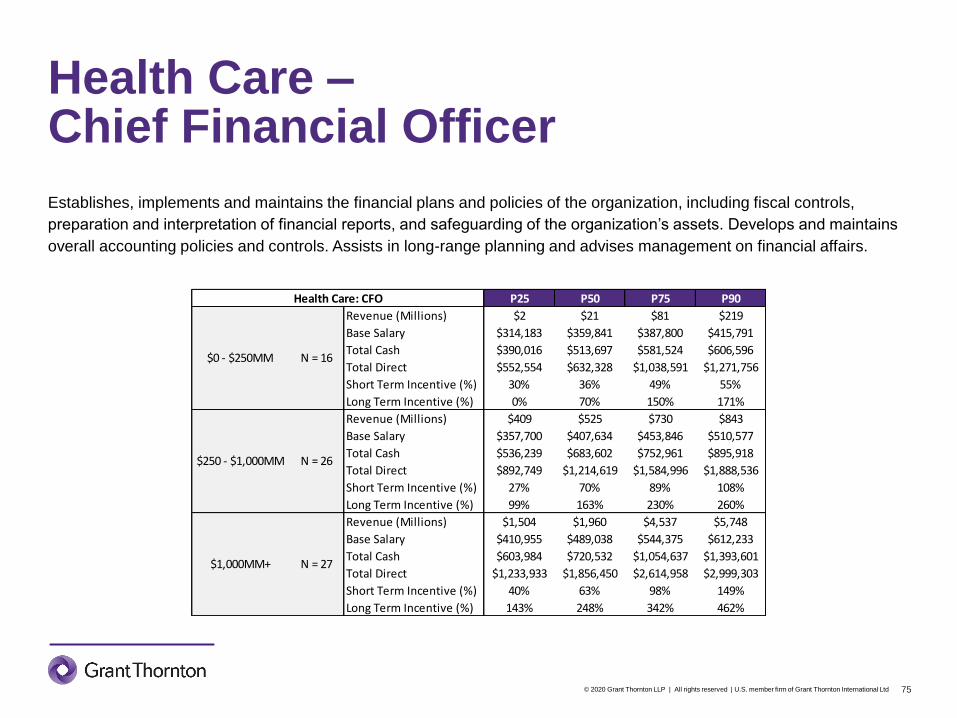
© 2020 Grant Thornton LLP | All rights reserved | U.S. member firm of Grant Thornton International Ltd 75
Health Care –Chief Financial Officer
Establishes, implements and maintains the financial plans and policies of the organization, including fiscal controls,
preparation and interpretation of financial reports, and safeguarding of the organization’s assets. Develops and maintains
overall accounting policies and controls. Assists in long-range planning and advises management on financial affairs.
Health Care: CFO P25 P50 P75 P90
Revenue (Millions) $2 $21 $81 $219
Base Salary $314,183 $359,841 $387,800 $415,791
Total Cash $390,016 $513,697 $581,524 $606,596
Total Direct $552,554 $632,328 $1,038,591 $1,271,756
Short Term Incentive (%) 30% 36% 49% 55%
Long Term Incentive (%) 0% 70% 150% 171%
Revenue (Millions) $409 $525 $730 $843
Base Salary $357,700 $407,634 $453,846 $510,577
Total Cash $536,239 $683,602 $752,961 $895,918
Total Direct $892,749 $1,214,619 $1,584,996 $1,888,536
Short Term Incentive (%) 27% 70% 89% 108%
Long Term Incentive (%) 99% 163% 230% 260%
Revenue (Millions) $1,504 $1,960 $4,537 $5,748
Base Salary $410,955 $489,038 $544,375 $612,233
Total Cash $603,984 $720,532 $1,054,637 $1,393,601
Total Direct $1,233,933 $1,856,450 $2,614,958 $2,999,303
Short Term Incentive (%) 40% 63% 98% 149%
Long Term Incentive (%) 143% 248% 342% 462%
$250 - $1,000MM N = 26
$1,000MM+ N = 27
$0 - $250MM N = 16
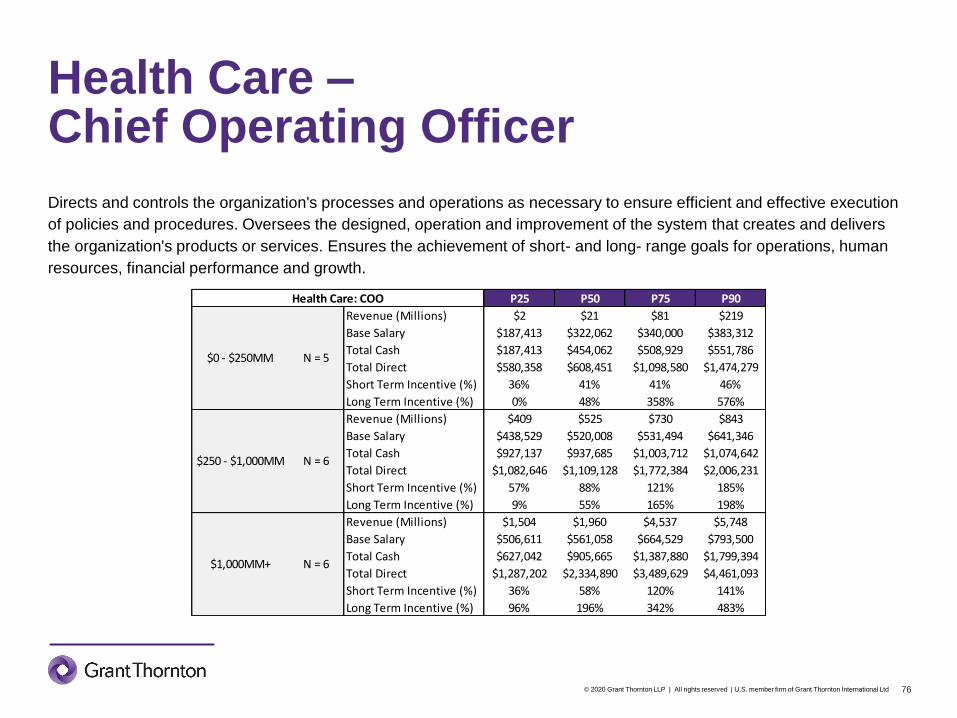
© 2020 Grant Thornton LLP | All rights reserved | U.S. member firm of Grant Thornton International Ltd 76
Health Care –Chief Operating Officer
Directs and controls the organization's processes and operations as necessary to ensure efficient and effective execution
of policies and procedures. Oversees the designed, operation and improvement of the system that creates and delivers
the organization's products or services. Ensures the achievement of short- and long- range goals for operations, human
resources, financial performance and growth.
Health Care: COO P25 P50 P75 P90
Revenue (Millions) $2 $21 $81 $219
Base Salary $187,413 $322,062 $340,000 $383,312
Total Cash $187,413 $454,062 $508,929 $551,786
Total Direct $580,358 $608,451 $1,098,580 $1,474,279
Short Term Incentive (%) 36% 41% 41% 46%
Long Term Incentive (%) 0% 48% 358% 576%
Revenue (Millions) $409 $525 $730 $843
Base Salary $438,529 $520,008 $531,494 $641,346
Total Cash $927,137 $937,685 $1,003,712 $1,074,642
Total Direct $1,082,646 $1,109,128 $1,772,384 $2,006,231
Short Term Incentive (%) 57% 88% 121% 185%
Long Term Incentive (%) 9% 55% 165% 198%
Revenue (Millions) $1,504 $1,960 $4,537 $5,748
Base Salary $506,611 $561,058 $664,529 $793,500
Total Cash $627,042 $905,665 $1,387,880 $1,799,394
Total Direct $1,287,202 $2,334,890 $3,489,629 $4,461,093
Short Term Incentive (%) 36% 58% 120% 141%
Long Term Incentive (%) 96% 196% 342% 483%
$0 - $250MM N = 5
$250 - $1,000MM N = 6
$1,000MM+ N = 6

© 2020 Grant Thornton LLP | All rights reserved | U.S. member firm of Grant Thornton International Ltd 77
Health Care –General Counsel / Top Legal Officer
Manages legal functions to ensure the organization's legal position is developed and maintained. Establishes legal
services required by the organization and ensures that the organization is protected from any legal action. Provides
executives with guidance in identifying the critical problems to which the application of legal principals yields the greatest
opportunities for reducing risks and maximizing profits.
Health Care: General Counsel P25 P50 P75 P90
Revenue (Millions) $2 $21 $81 $219
Base Salary ISD ISD ISD ISD
Total Cash ISD ISD ISD ISD
Total Direct ISD ISD ISD ISD
Short Term Incentive (%) ISD ISD ISD ISD
Long Term Incentive (%) ISD ISD ISD ISD
Revenue (Millions) $409 $525 $730 $843
Base Salary $336,396 $365,750 $382,221 $472,984
Total Cash $420,000 $538,896 $716,250 $798,059
Total Direct $748,180 $1,056,164 $1,292,524 $1,560,488
Short Term Incentive (%) 15% 40% 60% 83%
Long Term Incentive (%) 84% 107% 165% 216%
Revenue (Millions) $1,504 $1,960 $4,537 $5,748
Base Salary $385,002 $410,166 $482,661 $549,230
Total Cash $499,997 $620,800 $859,302 $1,203,065
Total Direct $1,020,777 $1,263,533 $1,640,958 $2,589,222
Short Term Incentive (%) 30% 45% 91% 135%
Long Term Incentive (%) 88% 145% 226% 347%
$0 - $250MM N = 5
$1,000MM+ N = 19
$250 - $1,000MM N = 14

© 2020 Grant Thornton LLP | All rights reserved | U.S. member firm of Grant Thornton International Ltd 78
Health Care –3rd Highest Paid
Third highest paid executive according to total direct compensation. Common 3rd highest paid positions include: Senior
Vice President – Operations, Vice President – Marketing, Corporate Secretary and General Manager.
Health Care: 3rd Highest Rank P25 P50 P75 P90
Revenue (Millions) $2 $21 $81 $219
Base Salary $320,694 $375,341 $416,700 $454,971
Total Cash $438,305 $526,277 $596,962 $655,207
Total Direct $537,193 $615,702 $1,308,049 $2,016,594
Short Term Incentive (%) 33% 39% 51% 60%
Long Term Incentive (%) 0% 48% 193% 387%
Revenue (Millions) $409 $525 $730 $843
Base Salary $360,913 $390,722 $535,444 $560,283
Total Cash $580,365 $693,244 $929,149 $1,106,427
Total Direct $940,446 $1,227,466 $1,871,304 $2,208,515
Short Term Incentive (%) 37% 57% 90% 173%
Long Term Incentive (%) 76% 163% 230% 334%
Revenue (Millions) $1,504 $1,960 $4,537 $5,748
Base Salary $453,014 $500,000 $538,688 $715,500
Total Cash $662,713 $746,310 $1,010,190 $1,371,270
Total Direct $1,335,869 $1,749,328 $2,485,926 $3,375,090
Short Term Incentive (%) 37% 59% 92% 141%
Long Term Incentive (%) 102% 176% 291% 351%
$0 - $250MM N = 28
$250 - $1,000MM N = 16
$1,000MM+ N = 18

© 2020 Grant Thornton LLP | All rights reserved | U.S. member firm of Grant Thornton International Ltd 79
Health Care –4th Highest Paid
Fourth highest paid executive according to total direct compensation. Common 4th highest paid positions include: Vice
President of Finance, Controller, Vice President – Human Resources and General Counsel.
Health Care: 4th Highest Rank P25 P50 P75 P90
Revenue (Millions) $2 $21 $81 $219
Base Salary ISD ISD ISD ISD
Total Cash ISD ISD ISD ISD
Total Direct ISD ISD ISD ISD
Short Term Incentive (%) ISD ISD ISD ISD
Long Term Incentive (%) ISD ISD ISD ISD
Revenue (Millions) $409 $525 $730 $843
Base Salary $337,332 $359,604 $382,560 $437,397
Total Cash $437,237 $547,407 $724,981 $822,342
Total Direct $812,937 $1,156,359 $1,504,247 $1,576,699
Short Term Incentive (%) 18% 56% 77% 93%
Long Term Incentive (%) 102% 147% 200% 264%
Revenue (Millions) $1,504 $1,960 $4,537 $5,748
Base Salary $387,542 $452,266 $498,830 $588,300
Total Cash $521,491 $638,062 $867,500 $1,184,392
Total Direct $1,063,328 $1,350,085 $1,572,241 $2,032,857
Short Term Incentive (%) 27% 41% 85% 152%
Long Term Incentive (%) 82% 151% 180% 250%
$0 - $250MM N = 4
$250 - $1,000MM N = 16
$1,000MM+ N = 14

© 2020 Grant Thornton LLP | All rights reserved | U.S. member firm of Grant Thornton International Ltd 80
Health Care –5th Highest Paid
Fifth highest paid executive according to total direct compensation. Common 5th highest paid positions include: Chief
Strategy Officer, Vice President – Sales, Division Senior Vice President and Executive Vice President.
Health Care: 5th Highest Rank P25 P50 P75 P90
Revenue (Millions) $2 $21 $81 $219
Base Salary ISD ISD ISD ISD
Total Cash ISD ISD ISD ISD
Total Direct ISD ISD ISD ISD
Short Term Incentive (%) ISD ISD ISD ISD
Long Term Incentive (%) ISD ISD ISD ISD
Revenue (Millions) $409 $525 $730 $843
Base Salary $291,934 $326,250 $384,578 $427,188
Total Cash $400,000 $461,663 $674,980 $731,921
Total Direct $699,653 $889,228 $1,279,918 $1,457,327
Short Term Incentive (%) 30% 62% 65% 88%
Long Term Incentive (%) 109% 137% 219% 233%
Revenue (Millions) $1,504 $1,960 $4,537 $5,748
Base Salary $339,758 $395,673 $448,558 $503,269
Total Cash $485,288 $504,673 $578,959 $769,605
Total Direct $749,069 $991,994 $1,265,102 $1,678,518
Short Term Incentive (%) 27% 38% 57% 71%
Long Term Incentive (%) 86% 145% 167% 180%
$0 - $250MM N = 4
$250 - $1,000MM N = 9
$1,000MM+ N = 7
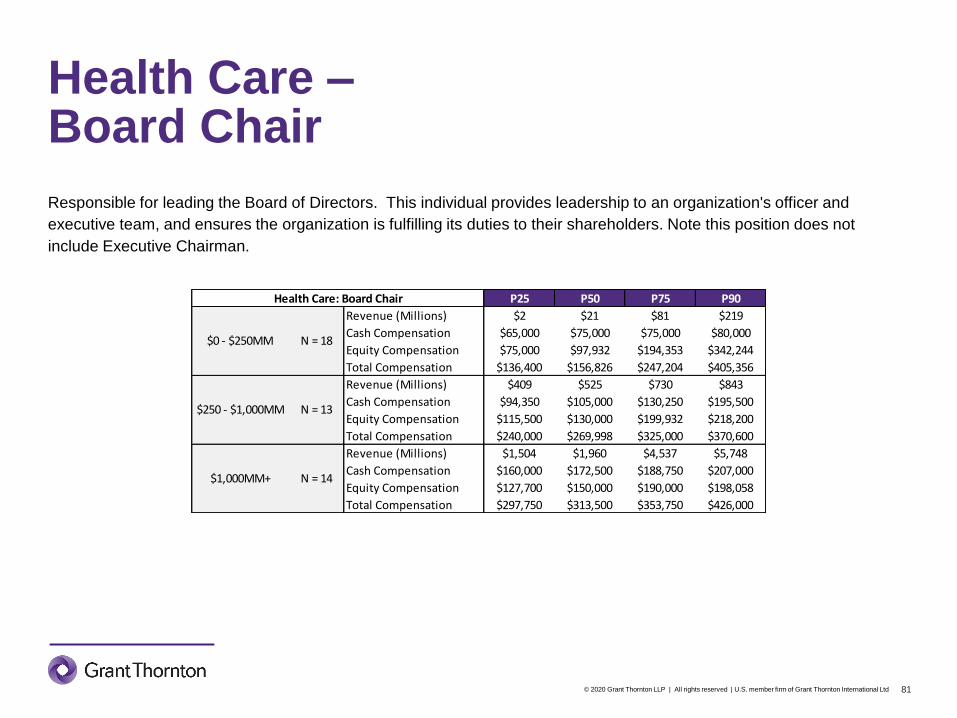
© 2020 Grant Thornton LLP | All rights reserved | U.S. member firm of Grant Thornton International Ltd 81
Health Care –Board Chair
Responsible for leading the Board of Directors. This individual provides leadership to an organization's officer and
executive team, and ensures the organization is fulfilling its duties to their shareholders. Note this position does not
include Executive Chairman.
Health Care: Board Chair P25 P50 P75 P90
Revenue (Millions) $2 $21 $81 $219
Cash Compensation $65,000 $75,000 $75,000 $80,000
Equity Compensation $75,000 $97,932 $194,353 $342,244
Total Compensation $136,400 $156,826 $247,204 $405,356
Revenue (Millions) $409 $525 $730 $843
Cash Compensation $94,350 $105,000 $130,250 $195,500
Equity Compensation $115,500 $130,000 $199,932 $218,200
Total Compensation $240,000 $269,998 $325,000 $370,600
Revenue (Millions) $1,504 $1,960 $4,537 $5,748
Cash Compensation $160,000 $172,500 $188,750 $207,000
Equity Compensation $127,700 $150,000 $190,000 $198,058
Total Compensation $297,750 $313,500 $353,750 $426,000
$1,000MM+ N = 14
$0 - $250MM N = 18
$250 - $1,000MM N = 13

Industrials

© 2020 Grant Thornton LLP | All rights reserved | U.S. member firm of Grant Thornton International Ltd 83
Industrials –Chief Executive Officer
Top executive for the organization. Responsible for the overall success and creation of shareholder value. Manages the
profitability and growth of the organization. Develops and establishes long-range plans and strategies, and represents the
organization to external constituents, authorities, and the public. Reports to the Board of Directors.
Industrials: CEO P25 P50 P75 P90
Revenue (Millions) $71 $113 $228 $268
Base Salary $420,153 $439,013 $479,117 $596,644
Total Cash $684,240 $922,509 $1,087,464 $1,489,058
Total Direct $1,038,076 $1,182,496 $2,246,270 $2,563,760
Short Term Incentive (%) 63% 96% 126% 163%
Long Term Incentive (%) 0% 87% 154% 290%
Revenue (Millions) $345 $586 $784 $869
Base Salary $526,250 $627,985 $797,656 $858,350
Total Cash $1,115,005 $1,383,122 $1,596,713 $1,862,871
Total Direct $1,830,860 $2,248,524 $3,164,661 $4,403,099
Short Term Incentive (%) 64% 119% 136% 166%
Long Term Incentive (%) 97% 168% 215% 289%
Revenue (Millions) $1,415 $1,934 $2,920 $4,395
Base Salary $799,849 $900,000 $952,693 $1,030,000
Total Cash $1,500,722 $1,871,655 $2,496,296 $3,487,500
Total Direct $3,761,237 $4,261,037 $5,719,295 $7,257,782
Short Term Incentive (%) 79% 119% 176% 240%
Long Term Incentive (%) 185% 294% 374% 451%
$0 - $300MM N = 12
$300 - $1,000MM N = 26
$1,000MM+ N = 31

© 2020 Grant Thornton LLP | All rights reserved | U.S. member firm of Grant Thornton International Ltd 84
Industrials –Chief Financial Officer
Establishes, implements and maintains the financial plans and policies of the organization, including fiscal controls,
preparation and interpretation of financial reports, and safeguarding of the organization’s assets. Develops and maintains
overall accounting policies and controls. Assists in long-range planning and advises management on financial affairs.
Industrials: CFO P25 P50 P75 P90
Revenue (Millions) $71 $113 $228 $268
Base Salary $242,793 $320,500 $370,577 $447,501
Total Cash $321,476 $383,584 $609,386 $879,862
Total Direct $426,401 $554,304 $1,245,333 $1,736,682
Short Term Incentive (%) 0% 42% 77% 113%
Long Term Incentive (%) 0% 32% 100% 199%
Revenue (Millions) $345 $586 $784 $869
Base Salary $308,423 $343,337 $400,452 $420,786
Total Cash $520,880 $609,000 $741,079 $900,000
Total Direct $787,281 $1,136,657 $1,590,148 $1,760,227
Short Term Incentive (%) 58% 77% 111% 128%
Long Term Incentive (%) 55% 109% 164% 271%
Revenue (Millions) $1,415 $1,934 $2,920 $4,395
Base Salary $432,571 $464,517 $514,542 $639,742
Total Cash $700,044 $867,680 $1,017,613 $1,437,754
Total Direct $1,218,260 $1,699,478 $1,967,724 $2,959,720
Short Term Incentive (%) 60% 85% 103% 134%
Long Term Incentive (%) 100% 147% 195% 303%
$0 - $300MM N = 22
$300 - $1,000MM N = 31
$1,000MM+ N = 29

© 2020 Grant Thornton LLP | All rights reserved | U.S. member firm of Grant Thornton International Ltd 85
Industrials –Chief Operating Officer
Directs and controls the organization's processes and operations as necessary to ensure efficient and effective execution
of policies and procedures. Oversees the designed, operation and improvement of the system that creates and delivers
the organization's products or services. Ensures the achievement of short- and long- range goals for operations, human
resources, financial performance and growth.
Industrials: COO P25 P50 P75 P90
Revenue (Millions) $71 $113 $228 $268
Base Salary $298,011 $343,614 $350,554 $368,051
Total Cash $347,149 $427,651 $591,813 $996,390
Total Direct $563,776 $709,382 $1,035,863 $1,577,886
Short Term Incentive (%) 0% 40% 83% 197%
Long Term Incentive (%) 2% 5% 121% 161%
Revenue (Millions) $345 $586 $784 $869
Base Salary $291,837 $355,193 $402,947 $473,443
Total Cash $465,446 $604,462 $739,249 $867,053
Total Direct $572,727 $902,749 $1,226,907 $1,490,238
Short Term Incentive (%) 66% 81% 94% 132%
Long Term Incentive (%) 47% 84% 135% 207%
Revenue (Millions) $1,415 $1,934 $2,920 $4,395
Base Salary $400,596 $469,952 $702,333 $714,883
Total Cash $764,295 $1,062,094 $1,187,012 $1,624,582
Total Direct $1,047,090 $1,698,958 $2,220,664 $3,117,311
Short Term Incentive (%) 61% 76% 123% 131%
Long Term Incentive (%) 76% 103% 167% 198%
$0 - $300MM N = 8
$300 - $1,000MM N = 14
$1,000MM+ N = 12

© 2020 Grant Thornton LLP | All rights reserved | U.S. member firm of Grant Thornton International Ltd 86
Industrials –General Counsel / Top Legal Officer
Manages legal functions to ensure the organization's legal position is developed and maintained. Establishes legal
services required by the organization and ensures that the organization is protected from any legal action. Provides
executives with guidance in identifying the critical problems to which the application of legal principals yields the greatest
opportunities for reducing risks and maximizing profits.
Industrials: General Counsel P25 P50 P75 P90
Revenue (Millions) $71 $113 $228 $268
Base Salary $286,297 $300,282 $305,193 $313,003
Total Cash $348,234 $426,779 $442,297 $465,673
Total Direct $533,834 $641,356 $707,964 $795,963
Short Term Incentive (%) 26% 46% 53% 64%
Long Term Incentive (%) 46% 70% 107% 140%
Revenue (Millions) $345 $586 $784 $869
Base Salary $260,338 $300,282 $337,096 $381,082
Total Cash $384,415 $446,483 $588,164 $692,044
Total Direct $609,781 $734,210 $1,133,573 $1,236,781
Short Term Incentive (%) 29% 59% 76% 116%
Long Term Incentive (%) 52% 81% 114% 352%
Revenue (Millions) $1,415 $1,934 $2,920 $4,395
Base Salary $348,625 $383,157 $438,842 $451,752
Total Cash $524,940 $621,564 $734,124 $855,829
Total Direct $790,825 $984,090 $1,202,692 $1,534,760
Short Term Incentive (%) 37% 61% 89% 105%
Long Term Incentive (%) 57% 94% 131% 145%
$0 - $300MM N = 7
N = 13
$1,000MM+ N = 20
$300 - $1,000MM
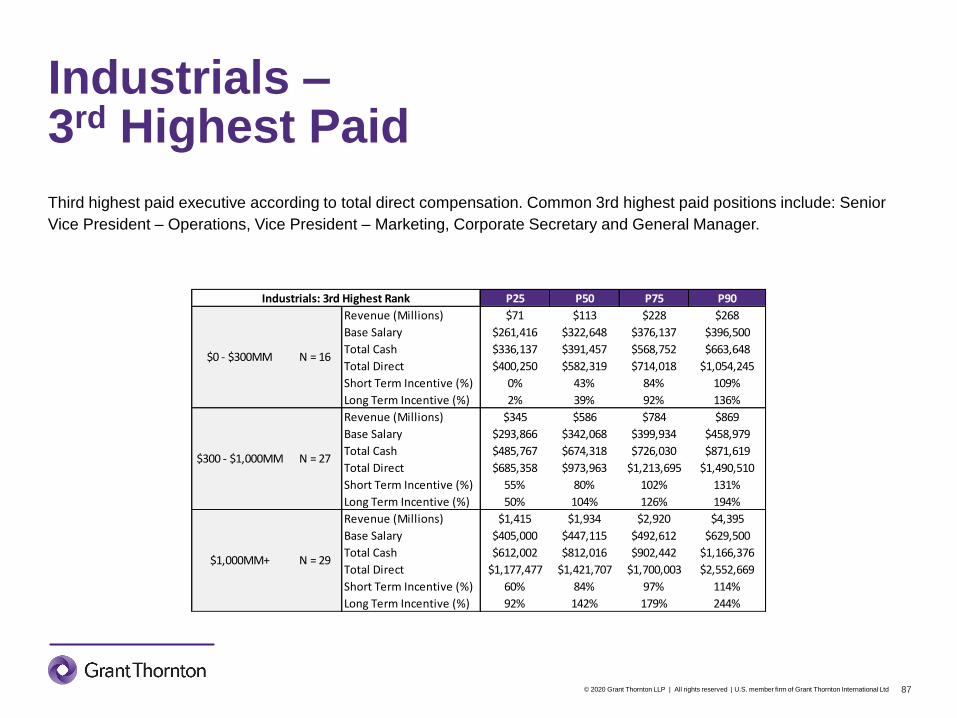
© 2020 Grant Thornton LLP | All rights reserved | U.S. member firm of Grant Thornton International Ltd 87
Industrials –3rd Highest Paid
Third highest paid executive according to total direct compensation. Common 3rd highest paid positions include: Senior
Vice President – Operations, Vice President – Marketing, Corporate Secretary and General Manager.
Industrials: 3rd Highest Rank P25 P50 P75 P90
Revenue (Millions) $71 $113 $228 $268
Base Salary $261,416 $322,648 $376,137 $396,500
Total Cash $336,137 $391,457 $568,752 $663,648
Total Direct $400,250 $582,319 $714,018 $1,054,245
Short Term Incentive (%) 0% 43% 84% 109%
Long Term Incentive (%) 2% 39% 92% 136%
Revenue (Millions) $345 $586 $784 $869
Base Salary $293,866 $342,068 $399,934 $458,979
Total Cash $485,767 $674,318 $726,030 $871,619
Total Direct $685,358 $973,963 $1,213,695 $1,490,510
Short Term Incentive (%) 55% 80% 102% 131%
Long Term Incentive (%) 50% 104% 126% 194%
Revenue (Millions) $1,415 $1,934 $2,920 $4,395
Base Salary $405,000 $447,115 $492,612 $629,500
Total Cash $612,002 $812,016 $902,442 $1,166,376
Total Direct $1,177,477 $1,421,707 $1,700,003 $2,552,669
Short Term Incentive (%) 60% 84% 97% 114%
Long Term Incentive (%) 92% 142% 179% 244%
$1,000MM+ N = 29
$0 - $300MM N = 16
$300 - $1,000MM N = 27

© 2020 Grant Thornton LLP | All rights reserved | U.S. member firm of Grant Thornton International Ltd 88
Industrials –4th Highest Paid
Fourth highest paid executive according to total direct compensation. Common 4th highest paid positions include: Vice
President of Finance, Controller, Vice President – Human Resources and General Counsel.
Industrials: 4th Highest Rank P25 P50 P75 P90
Revenue (Millions) $71 $113 $228 $268
Base Salary $253,003 $271,648 $313,125 $332,878
Total Cash $309,820 $357,684 $452,653 $607,854
Total Direct $370,240 $541,987 $706,262 $917,171
Short Term Incentive (%) 2% 29% 80% 103%
Long Term Incentive (%) 7% 53% 104% 134%
Revenue (Millions) $345 $586 $784 $869
Base Salary $264,615 $302,900 $351,589 $400,000
Total Cash $443,230 $490,409 $641,425 $852,699
Total Direct $591,919 $843,632 $1,099,407 $1,485,776
Short Term Incentive (%) 60% 76% 107% 122%
Long Term Incentive (%) 59% 106% 125% 210%
Revenue (Millions) $1,415 $1,934 $2,920 $4,395
Base Salary $348,438 $392,467 $448,678 $479,250
Total Cash $535,417 $652,010 $870,696 $1,008,511
Total Direct $862,393 $1,101,400 $1,386,089 $1,616,553
Short Term Incentive (%) 42% 80% 119% 135%
Long Term Incentive (%) 67% 97% 125% 156%
$0 - $300MM N = 14
$300 - $1,000MM N = 21
$1,000MM+ N = 28

© 2020 Grant Thornton LLP | All rights reserved | U.S. member firm of Grant Thornton International Ltd 89
Industrials –5th Highest Paid
Fifth highest paid executive according to total direct compensation. Common 5th highest paid positions include: Chief
Strategy Officer, Vice President – Sales, Division Senior Vice President and Executive Vice President.
Industrials: 5th Highest Rank P25 P50 P75 P90
Revenue (Millions) $71 $113 $228 $268
Base Salary $197,355 $265,202 $301,154 $306,000
Total Cash $252,355 $306,000 $425,581 $438,249
Total Direct $300,052 $321,218 $606,427 $791,154
Short Term Incentive (%) 0% 32% 51% 60%
Long Term Incentive (%) 2% 27% 69% 104%
Revenue (Millions) $345 $586 $784 $869
Base Salary $249,486 $282,308 $335,322 $346,458
Total Cash $389,389 $474,955 $531,139 $717,416
Total Direct $506,396 $679,590 $846,896 $1,000,084
Short Term Incentive (%) 37% 71% 102% 116%
Long Term Incentive (%) 29% 74% 100% 129%
Revenue (Millions) $1,415 $1,934 $2,920 $4,395
Base Salary $320,000 $356,825 $430,717 $457,951
Total Cash $444,940 $552,298 $694,827 $921,440
Total Direct $761,076 $948,094 $1,162,782 $1,540,011
Short Term Incentive (%) 51% 61% 82% 106%
Long Term Incentive (%) 52% 89% 116% 134%
$0 - $300MM N = 11
$300 - $1,000MM N = 14
$1,000MM+ N = 23

© 2020 Grant Thornton LLP | All rights reserved | U.S. member firm of Grant Thornton International Ltd 90
Industrials –Board ChairResponsible for leading the Board of Directors. This individual provides leadership to an organization's officer and
executive team, and ensures the organization is fulfilling its duties to their shareholders. Note this position does not
include Executive Chairman.
Industrials: Board Chair P25 P50 P75 P90
Revenue (Millions) $71 $113 $228 $268
Cash Compensation $50,000 $75,000 $80,004 $140,000
Equity Compensation $26,500 $75,000 $104,025 $130,000
Total Compensation $80,663 $122,400 $172,013 $207,001
Revenue (Millions) $345 $586 $784 $869
Cash Compensation $95,000 $112,500 $145,000 $233,000
Equity Compensation $70,000 $80,000 $110,000 $142,305
Total Compensation $162,481 $225,000 $250,000 $380,000
Revenue (Millions) $1,415 $1,934 $2,920 $4,395
Cash Compensation $130,000 $157,500 $187,500 $200,000
Equity Compensation $94,998 $100,000 $117,872 $120,497
Total Compensation $235,249 $253,750 $291,247 $301,500
$0 - $300MM N = 14
$300 - $1,000MM N = 12
$1,000MM+ N = 20

Information Technology
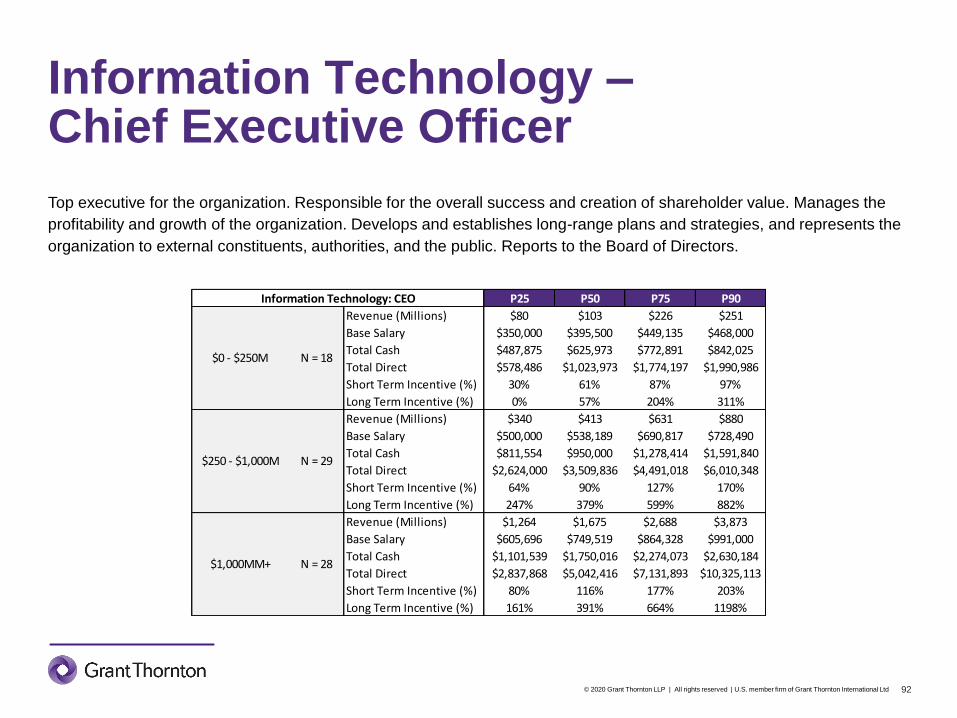
© 2020 Grant Thornton LLP | All rights reserved | U.S. member firm of Grant Thornton International Ltd 92
Information Technology –Chief Executive Officer
Top executive for the organization. Responsible for the overall success and creation of shareholder value. Manages the
profitability and growth of the organization. Develops and establishes long-range plans and strategies, and represents the
organization to external constituents, authorities, and the public. Reports to the Board of Directors.
Information Technology: CEO P25 P50 P75 P90
Revenue (Millions) $80 $103 $226 $251
Base Salary $350,000 $395,500 $449,135 $468,000
Total Cash $487,875 $625,973 $772,891 $842,025
Total Direct $578,486 $1,023,973 $1,774,197 $1,990,986
Short Term Incentive (%) 30% 61% 87% 97%
Long Term Incentive (%) 0% 57% 204% 311%
Revenue (Millions) $340 $413 $631 $880
Base Salary $500,000 $538,189 $690,817 $728,490
Total Cash $811,554 $950,000 $1,278,414 $1,591,840
Total Direct $2,624,000 $3,509,836 $4,491,018 $6,010,348
Short Term Incentive (%) 64% 90% 127% 170%
Long Term Incentive (%) 247% 379% 599% 882%
Revenue (Millions) $1,264 $1,675 $2,688 $3,873
Base Salary $605,696 $749,519 $864,328 $991,000
Total Cash $1,101,539 $1,750,016 $2,274,073 $2,630,184
Total Direct $2,837,868 $5,042,416 $7,131,893 $10,325,113
Short Term Incentive (%) 80% 116% 177% 203%
Long Term Incentive (%) 161% 391% 664% 1198%
$1,000MM+ N = 28
$0 - $250M N = 18
$250 - $1,000M N = 29

© 2020 Grant Thornton LLP | All rights reserved | U.S. member firm of Grant Thornton International Ltd 93
Information Technology –Chief Financial Officer
Establishes, implements and maintains the financial plans and policies of the organization, including fiscal controls,
preparation and interpretation of financial reports, and safeguarding of the organization’s assets. Develops and maintains
overall accounting policies and controls. Assists in long-range planning and advises management on financial affairs.
Information Technology: CFO P25 P50 P75 P90
Revenue (Millions) $80 $103 $226 $251
Base Salary $261,883 $305,000 $354,200 $373,000
Total Cash $329,335 $424,066 $552,044 $623,295
Total Direct $384,479 $578,400 $975,002 $1,870,993
Short Term Incentive (%) 23% 41% 63% 77%
Long Term Incentive (%) 0% 41% 131% 328%
Revenue (Millions) $340 $413 $631 $880
Base Salary $315,000 $351,009 $378,667 $435,279
Total Cash $399,165 $522,988 $639,219 $694,722
Total Direct $1,029,856 $1,579,880 $1,978,580 $3,483,177
Short Term Incentive (%) 36% 53% 74% 95%
Long Term Incentive (%) 180% 260% 444% 741%
Revenue (Millions) $1,264 $1,675 $2,688 $3,873
Base Salary $372,692 $435,846 $514,275 $581,002
Total Cash $618,007 $744,663 $1,092,909 $1,252,187
Total Direct $1,429,925 $1,879,348 $2,519,522 $3,727,550
Short Term Incentive (%) 66% 88% 108% 183%
Long Term Incentive (%) 83% 207% 342% 686%
$0 - $250MM N = 23
$250 - $1,000MM N = 32
$1,000MM+ N = 29

© 2020 Grant Thornton LLP | All rights reserved | U.S. member firm of Grant Thornton International Ltd 94
Information Technology –Chief Operating Officer
Directs and controls the organization's processes and operations as necessary to ensure efficient and effective execution
of policies and procedures. Oversees the designed, operation and improvement of the system that creates and delivers
the organization's products or services. Ensures the achievement of short- and long- range goals for operations, human
resources, financial performance and growth.
Information Technology: COO P25 P50 P75 P90
Revenue (Millions) $80 $103 $226 $251
Base Salary $247,919 $322,217 $350,000 $362,250
Total Cash $322,217 $397,103 $521,650 $811,716
Total Direct $471,083 $521,650 $1,847,663 $2,293,167
Short Term Incentive (%) 23% 38% 53% 130%
Long Term Incentive (%) 0% 65% 414% 428%
Revenue (Millions) $340 $413 $631 $880
Base Salary $307,336 $363,594 $452,289 $518,423
Total Cash $464,643 $515,543 $711,094 $812,082
Total Direct $1,294,496 $1,576,204 $1,705,092 $3,011,330
Short Term Incentive (%) 15% 49% 91% 140%
Long Term Incentive (%) 196% 294% 421% 523%
Revenue (Millions) $1,264 $1,675 $2,688 $3,873
Base Salary $403,461 $429,854 $580,337 $975,500
Total Cash $621,141 $936,173 $953,629 $1,435,660
Total Direct $1,132,328 $1,693,192 $2,442,078 $5,419,317
Short Term Incentive (%) 45% 77% 136% 149%
Long Term Incentive (%) 134% 185% 241% 407%
$0 - $250MM N = 9
$250 - $1,000MM N = 14
$1,000MM+ N = 8

© 2020 Grant Thornton LLP | All rights reserved | U.S. member firm of Grant Thornton International Ltd 95
Information Technology –General Counsel / Top Legal Officer
Manages legal functions to ensure the organization's legal position is developed and maintained. Establishes legal
services required by the organization and ensures that the organization is protected from any legal action. Provides
executives with guidance in identifying the critical problems to which the application of legal principals yields the greatest
opportunities for reducing risks and maximizing profits.
Information Technology: General Counsel P25 P50 P75 P90
Revenue (Millions) $80 $103 $226 $251
Base Salary $281,875 $315,628 $345,016 $372,046
Total Cash $380,728 $453,265 $553,128 $740,786
Total Direct $551,998 $846,964 $1,496,306 $1,633,168
Short Term Incentive (%) 33% 41% 61% 94%
Long Term Incentive (%) 56% 128% 237% 282%
Revenue (Millions) $340 $413 $631 $880
Base Salary $295,112 $321,077 $349,524 $376,250
Total Cash $371,126 $419,414 $552,148 $621,446
Total Direct $772,793 $1,030,247 $1,180,097 $1,310,860
Short Term Incentive (%) 26% 39% 61% 94%
Long Term Incentive (%) 89% 128% 231% 306%
Revenue (Millions) $1,264 $1,675 $2,688 $3,873
Base Salary $349,250 $379,577 $399,450 $471,665
Total Cash $538,759 $636,656 $738,075 $1,005,844
Total Direct $1,059,075 $1,210,156 $1,485,093 $1,943,754
Short Term Incentive (%) 59% 68% 88% 119%
Long Term Incentive (%) 100% 164% 218% 316%
$0 - $250MM
$250 - $1,000MM N = 16
N = 8
$1,000MM+ N = 18

© 2020 Grant Thornton LLP | All rights reserved | U.S. member firm of Grant Thornton International Ltd 96
Information Technology –3rd Highest Paid
Third highest paid executive according to total direct compensation. Common 3rd highest paid positions include: Senior
Vice President – Operations, Vice President – Marketing, Corporate Secretary and General Manager.
Information Technology: 3rd Highest Rank P25 P50 P75 P90
Revenue (Millions) $80 $103 $226 $251
Base Salary $284,461 $292,917 $311,942 $337,475
Total Cash $376,902 $426,564 $497,913 $536,320
Total Direct $518,638 $562,262 $940,577 $1,562,712
Short Term Incentive (%) 35% 39% 52% 64%
Long Term Incentive (%) 56% 72% 162% 333%
Revenue (Millions) $340 $413 $631 $880
Base Salary $316,487 $352,636 $401,000 $447,534
Total Cash $457,083 $522,335 $656,935 $755,814
Total Direct $1,030,247 $1,406,599 $1,682,059 $2,354,117
Short Term Incentive (%) 27% 56% 81% 98%
Long Term Incentive (%) 128% 212% 289% 456%
Revenue (Millions) $1,264 $1,675 $2,688 $3,873
Base Salary $400,000 $422,231 $501,283 $631,499
Total Cash $646,229 $793,391 $1,182,535 $1,273,447
Total Direct $1,245,192 $1,652,536 $2,279,969 $2,749,210
Short Term Incentive (%) 60% 76% 107% 170%
Long Term Incentive (%) 94% 184% 252% 339%
$0 - $250MM N = 8
$250 - $1,000MM N = 33
$1,000MM+ N = 26

© 2020 Grant Thornton LLP | All rights reserved | U.S. member firm of Grant Thornton International Ltd 97
Information Technology –4th Highest Paid
Fourth highest paid executive according to total direct compensation. Common 4th highest paid positions include: Vice
President of Finance, Controller, Vice President – Human Resources and General Counsel.
Information Technology: 4th Highest Rank P25 P50 P75 P90
Revenue (Millions) $80 $103 $226 $251
Base Salary $270,000 $297,500 $300,000 $307,500
Total Cash $344,723 $357,500 $366,000 $461,813
Total Direct $357,500 $561,036 $706,486 $841,049
Short Term Incentive (%) 22% 28% 33% 54%
Long Term Incentive (%) 12% 80% 113% 123%
Revenue (Millions) $340 $413 $631 $880
Base Salary $299,904 $318,529 $363,573 $400,300
Total Cash $394,198 $439,830 $560,053 $618,326
Total Direct $881,171 $1,091,210 $1,405,626 $1,618,897
Short Term Incentive (%) 15% 39% 66% 93%
Long Term Incentive (%) 104% 180% 289% 377%
Revenue (Millions) $1,264 $1,675 $2,688 $3,873
Base Salary $346,347 $370,290 $425,253 $535,000
Total Cash $484,101 $650,000 $868,131 $1,036,363
Total Direct $968,402 $1,278,019 $1,644,994 $2,178,265
Short Term Incentive (%) 39% 68% 94% 125%
Long Term Incentive (%) 110% 177% 205% 377%
$0 - $250MM N = 5
$250 - $1,000MM N = 28
$1,000MM+ N = 31

© 2020 Grant Thornton LLP | All rights reserved | U.S. member firm of Grant Thornton International Ltd 98
Information Technology –5th Highest Paid
Fifth highest paid executive according to total direct compensation. Common 5th highest paid positions include: Chief
Strategy Officer, Vice President – Sales, Division Senior Vice President and Executive Vice President.
Information Technology: 5th Highest Rank P25 P50 P75 P90
Revenue (Millions) $80 $103 $226 $251
Base Salary $197,917 $232,000 $277,500 $321,000
Total Cash $237,208 $319,141 $466,811 $559,055
Total Direct $237,208 $471,083 $620,551 $754,792
Short Term Incentive (%) 21% 38% 68% 74%
Long Term Incentive (%) 0% 0% 65% 108%
Revenue (Millions) $340 $413 $631 $880
Base Salary $274,639 $303,116 $341,506 $365,079
Total Cash $340,599 $365,396 $454,317 $546,179
Total Direct $559,451 $1,048,268 $1,346,160 $1,465,442
Short Term Incentive (%) 0% 28% 49% 66%
Long Term Incentive (%) 76% 204% 285% 322%
Revenue (Millions) $1,264 $1,675 $2,688 $3,873
Base Salary $293,662 $343,727 $415,096 $489,881
Total Cash $442,215 $548,856 $724,208 $937,714
Total Direct $792,383 $932,026 $1,212,646 $1,661,397
Short Term Incentive (%) 45% 75% 93% 109%
Long Term Incentive (%) 46% 100% 179% 251%
$0 - $250MM N = 5
$250 - $1,000MM N = 20
$1,000MM+ N = 27

© 2020 Grant Thornton LLP | All rights reserved | U.S. member firm of Grant Thornton International Ltd 99
Information Technology –Board ChairResponsible for leading the Board of Directors. This individual provides leadership to an organization's officer and
executive team, and ensures the organization is fulfilling its duties to their shareholders. Note this position does not
include Executive Chairman.
Information Technology: Board Chair P25 P50 P75 P90
Revenue (Millions) $80 $103 $226 $251
Cash Compensation $49,000 $60,000 $75,000 $88,000
Equity Compensation $95,000 $125,000 $158,075 $179,000
Total Compensation $160,000 $205,000 $217,500 $250,460
Revenue (Millions) $340 $413 $631 $880
Cash Compensation $63,000 $90,000 $105,000 $123,000
Equity Compensation $116,069 $155,000 $192,513 $213,600
Total Compensation $197,500 $239,000 $292,215 $318,400
Revenue (Millions) $1,264 $1,675 $2,688 $3,873
Cash Compensation $95,250 $136,000 $162,500 $292,800
Equity Compensation $136,250 $162,327 $200,000 $259,572
Total Compensation $270,000 $290,000 $346,662 $475,200
$0 - $250MM N = 15
$250 - $1,000MM N = 23
$1,000MM+ N = 19

Materials

© 2020 Grant Thornton LLP | All rights reserved | U.S. member firm of Grant Thornton International Ltd 101
Materials –Chief Executive Officer
Top executive for the organization. Responsible for the overall success and creation of shareholder value. Manages the
profitability and growth of the organization. Develops and establishes long-range plans and strategies, and represents the
organization to external constituents, authorities, and the public. Reports to the Board of Directors.
Materials: CEO P25 P50 P75 P90
Revenue (Millions) $182 $281 $481 $585
Base Salary $440,481 $500,206 $647,389 $746,699
Total Cash $852,201 $1,020,797 $1,136,954 $1,661,245
Total Direct $1,188,947 $1,522,581 $2,031,095 $3,161,617
Short Term Incentive (%) 53% 88% 123% 138%
Long Term Incentive (%) 62% 118% 181% 253%
Revenue (Millions) $1,035 $1,134 $1,387 $1,472
Base Salary $750,000 $830,000 $895,833 $985,946
Total Cash $1,509,000 $1,581,213 $2,035,192 $2,488,628
Total Direct $2,824,938 $3,150,695 $4,162,970 $4,783,544
Short Term Incentive (%) 60% 118% 141% 198%
Long Term Incentive (%) 159% 218% 222% 381%
Revenue (Millions) $1,787 $2,134 $3,831 $4,735
Base Salary $866,367 $932,800 $1,008,465 $1,245,000
Total Cash $1,690,056 $2,076,834 $3,194,688 $5,506,962
Total Direct $3,702,337 $4,936,479 $6,564,102 $8,410,743
Short Term Incentive (%) 83% 131% 209% 320%
Long Term Incentive (%) 204% 281% 397% 458%
N = 18
N = 13
N = 28
$0 - $750MM
$750 - $1,500MM
$1,500MM+

© 2020 Grant Thornton LLP | All rights reserved | U.S. member firm of Grant Thornton International Ltd 102
Materials –Chief Financial Officer
Establishes, implements and maintains the financial plans and policies of the organization, including fiscal controls,
preparation and interpretation of financial reports, and safeguarding of the organization’s assets. Develops and maintains
overall accounting policies and controls. Assists in long-range planning and advises management on financial affairs.
Materials: CFO P25 P50 P75 P90
Revenue (Millions) $182 $281 $481 $585
Base Salary $265,393 $287,709 $364,441 $398,057
Total Cash $357,690 $451,905 $601,816 $765,537
Total Direct $488,521 $627,681 $838,780 $1,037,911
Short Term Incentive (%) 35% 53% 82% 100%
Long Term Incentive (%) 4% 58% 97% 116%
Revenue (Millions) $1,035 $1,134 $1,387 $1,472
Base Salary $399,380 $421,800 $472,404 $502,250
Total Cash $591,261 $673,975 $925,205 $1,074,843
Total Direct $1,008,369 $1,310,052 $1,596,338 $1,737,046
Short Term Incentive (%) 27% 76% 97% 140%
Long Term Incentive (%) 91% 121% 154% 218%
Revenue (Millions) $1,787 $2,134 $3,831 $4,735
Base Salary $424,766 $477,500 $536,500 $656,591
Total Cash $663,076 $847,310 $1,147,380 $1,559,655
Total Direct $1,194,049 $1,639,610 $1,935,282 $2,453,142
Short Term Incentive (%) 52% 80% 127% 164%
Long Term Incentive (%) 99% 146% 213% 258%
$0 - $750MM
$750 - $1,500MM
$1,500MM+ N = 32
N = 22
N = 15

© 2020 Grant Thornton LLP | All rights reserved | U.S. member firm of Grant Thornton International Ltd 103
Materials –Chief Operating Officer
Directs and controls the organization's processes and operations as necessary to ensure efficient and effective execution
of policies and procedures. Oversees the designed, operation and improvement of the system that creates and delivers
the organization's products or services. Ensures the achievement of short- and long- range goals for operations, human
resources, financial performance and growth.
Materials: COO P25 P50 P75 P90
Revenue (Millions) $182 $281 $481 $585
Base Salary $387,317 $399,500 $499,166 $504,282
Total Cash $499,166 $507,317 $607,500 $712,799
Total Direct $693,671 $1,260,495 $1,330,365 $1,488,120
Short Term Incentive (%) 27% 31% 52% 53%
Long Term Incentive (%) 48% 108% 163% 197%
Revenue (Millions) $1,035 $1,134 $1,387 $1,472
Base Salary $313,846 $338,253 $389,154 $402,100
Total Cash $313,846 $540,378 $706,919 $983,023
Total Direct $653,675 $1,062,558 $1,271,834 $2,050,576
Short Term Incentive (%) 17% 60% 82% 143%
Long Term Incentive (%) 33% 91% 91% 637%
Revenue (Millions) $1,787 $2,134 $3,831 $4,735
Base Salary $525,000 $550,000 $663,462 $888,400
Total Cash $1,077,400 $1,261,547 $1,479,231 $1,942,890
Total Direct $1,650,638 $2,848,450 $3,473,814 $3,573,248
Short Term Incentive (%) 97% 118% 140% 171%
Long Term Incentive (%) 114% 233% 370% 429%
$0 - $750MM
$750 - $1,500MM
$1,500MM+
N = 5
N = 5
N = 9

© 2020 Grant Thornton LLP | All rights reserved | U.S. member firm of Grant Thornton International Ltd 104
Materials –General Counsel / Top Legal Officer
Manages legal functions to ensure the organization's legal position is developed and maintained. Establishes legal
services required by the organization and ensures that the organization is protected from any legal action. Provides
executives with guidance in identifying the critical problems to which the application of legal principals yields the greatest
opportunities for reducing risks and maximizing profits.
Materials: General Counsel P25 P50 P75 P90
Revenue (Millions) $182 $281 $481 $585
Base Salary $236,372 $269,484 $293,025 $326,634
Total Cash $335,070 $397,916 $450,517 $491,798
Total Direct $396,837 $548,850 $694,014 $845,886
Short Term Incentive (%) 30% 45% 65% 74%
Long Term Incentive (%) 43% 53% 72% 112%
Revenue (Millions) $1,035 $1,134 $1,387 $1,472
Base Salary $359,381 $384,409 $388,193 $407,700
Total Cash $469,983 $549,147 $750,927 $855,500
Total Direct $783,528 $951,646 $1,098,142 $1,261,470
Short Term Incentive (%) 36% 76% 106% 121%
Long Term Incentive (%) 75% 97% 105% 125%
Revenue (Millions) $1,787 $2,134 $3,831 $4,735
Base Salary $399,183 $425,914 $462,664 $525,687
Total Cash $663,485 $745,549 $844,747 $1,078,814
Total Direct $1,111,335 $1,409,904 $1,758,765 $2,084,725
Short Term Incentive (%) 54% 81% 103% 129%
Long Term Incentive (%) 100% 138% 189% 257%
N = 20
$750 - $1,500MM N = 11
$0 - $750MM N = 8
$1,500MM+

© 2020 Grant Thornton LLP | All rights reserved | U.S. member firm of Grant Thornton International Ltd 105
Materials –3rd Highest Paid
Third highest paid executive according to total direct compensation. Common 3rd highest paid positions include: Senior
Vice President – Operations, Vice President – Marketing, Corporate Secretary and General Manager.
Materials: 3rd Highest Rank P25 P50 P75 P90
Revenue (Millions) $182 $281 $481 $585
Base Salary $270,000 $295,000 $370,096 $389,914
Total Cash $373,518 $483,320 $554,478 $613,398
Total Direct $534,366 $611,956 $905,458 $1,273,694
Short Term Incentive (%) 24% 49% 73% 82%
Long Term Incentive (%) 21% 64% 98% 169%
Revenue (Millions) $1,035 $1,134 $1,387 $1,472
Base Salary $396,000 $407,700 $420,417 $445,615
Total Cash $508,329 $636,903 $810,802 $890,559
Total Direct $1,003,059 $1,035,754 $1,261,470 $1,368,098
Short Term Incentive (%) 19% 71% 88% 123%
Long Term Incentive (%) 73% 90% 124% 171%
Revenue (Millions) $1,787 $2,134 $3,831 $4,735
Base Salary $418,750 $442,170 $520,837 $588,845
Total Cash $674,789 $951,372 $1,278,000 $1,486,004
Total Direct $1,403,357 $1,650,837 $1,903,108 $2,483,329
Short Term Incentive (%) 55% 89% 133% 174%
Long Term Incentive (%) 108% 138% 206% 247%
$0 - $750MM
$750 - $1,500MM
$1,500MM+
N = 23
N = 13
N = 33

© 2020 Grant Thornton LLP | All rights reserved | U.S. member firm of Grant Thornton International Ltd 106
Materials –4th Highest Paid
Fourth highest paid executive according to total direct compensation. Common 4th highest paid positions include: Vice
President of Finance, Controller, Vice President – Human Resources and General Counsel.
Materials: 4th Highest Rank P25 P50 P75 P90
Revenue (Millions) $182 $281 $481 $585
Base Salary $269,519 $285,118 $318,649 $330,000
Total Cash $377,851 $415,298 $441,694 $511,581
Total Direct $544,400 $572,587 $658,718 $782,724
Short Term Incentive (%) 27% 33% 61% 79%
Long Term Incentive (%) 48% 60% 86% 96%
Revenue (Millions) $1,035 $1,134 $1,387 $1,472
Base Salary $335,900 $381,250 $389,581 $395,878
Total Cash $448,873 $579,751 $697,013 $743,519
Total Direct $746,048 $875,945 $992,872 $1,189,289
Short Term Incentive (%) 31% 67% 90% 119%
Long Term Incentive (%) 59% 86% 108% 125%
Revenue (Millions) $1,787 $2,134 $3,831 $4,735
Base Salary $368,943 $405,769 $480,000 $495,692
Total Cash $518,687 $728,598 $851,532 $1,110,346
Total Direct $967,005 $1,200,293 $1,600,460 $1,846,807
Short Term Incentive (%) 51% 74% 114% 128%
Long Term Incentive (%) 111% 146% 162% 215%
$0 - $750MM
$750 - $1,500MM
$1,500MM+
N = 12
N = 27
N = 11

© 2020 Grant Thornton LLP | All rights reserved | U.S. member firm of Grant Thornton International Ltd 107
Materials –5th Highest Paid
Fifth highest paid executive according to total direct compensation. Common 5th highest paid positions include: Chief
Strategy Officer, Vice President – Sales, Division Senior Vice President and Executive Vice President.
Materials: 5th Highest Rank P25 P50 P75 P90
Revenue (Millions) $182 $281 $481 $585
Base Salary $222,535 $257,967 $268,421 $275,000
Total Cash $272,790 $342,252 $380,183 $385,385
Total Direct $401,814 $487,929 $549,404 $587,260
Short Term Incentive (%) 27% 36% 45% 59%
Long Term Incentive (%) 41% 56% 69% 106%
Revenue (Millions) $1,035 $1,134 $1,387 $1,472
Base Salary $300,000 $338,253 $350,000 $379,000
Total Cash $454,265 $486,500 $544,456 $605,275
Total Direct $664,524 $740,165 $861,162 $938,643
Short Term Incentive (%) 33% 56% 87% 116%
Long Term Incentive (%) 63% 72% 107% 110%
Revenue (Millions) $1,787 $2,134 $3,831 $4,735
Base Salary $329,039 $396,731 $462,433 $509,722
Total Cash $532,409 $690,341 $932,931 $1,114,017
Total Direct $849,240 $1,010,606 $1,408,847 $1,780,695
Short Term Incentive (%) 40% 77% 123% 146%
Long Term Incentive (%) 71% 101% 141% 205%
$0 - $750MM
$750 - $1,500MM
$1,500MM+
N = 11
N = 9
N = 27
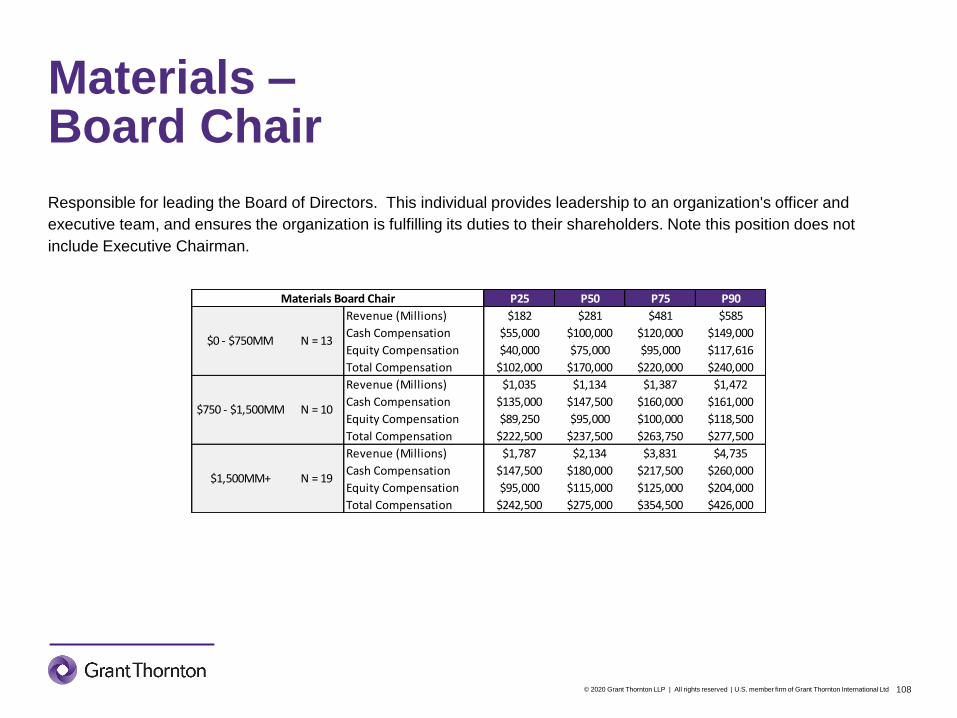
© 2020 Grant Thornton LLP | All rights reserved | U.S. member firm of Grant Thornton International Ltd 108
Materials –Board Chair
Responsible for leading the Board of Directors. This individual provides leadership to an organization's officer and
executive team, and ensures the organization is fulfilling its duties to their shareholders. Note this position does not
include Executive Chairman.
Materials Board Chair P25 P50 P75 P90
Revenue (Millions) $182 $281 $481 $585
Cash Compensation $55,000 $100,000 $120,000 $149,000
Equity Compensation $40,000 $75,000 $95,000 $117,616
Total Compensation $102,000 $170,000 $220,000 $240,000
Revenue (Millions) $1,035 $1,134 $1,387 $1,472
Cash Compensation $135,000 $147,500 $160,000 $161,000
Equity Compensation $89,250 $95,000 $100,000 $118,500
Total Compensation $222,500 $237,500 $263,750 $277,500
Revenue (Millions) $1,787 $2,134 $3,831 $4,735
Cash Compensation $147,500 $180,000 $217,500 $260,000
Equity Compensation $95,000 $115,000 $125,000 $204,000
Total Compensation $242,500 $275,000 $354,500 $426,000
$0 - $750MM
$750 - $1,500MM
$1,500MM+ N = 19
N = 13
N = 10

Real Estate

© 2020 Grant Thornton LLP | All rights reserved | U.S. member firm of Grant Thornton International Ltd 110
Real Estate –Chief Executive Officer
Top executive for the organization. Responsible for the overall success and creation of shareholder value. Manages the
profitability and growth of the organization. Develops and establishes long-range plans and strategies, and represents the
organization to external constituents, authorities, and the public. Reports to the Board of Directors.
Real Estate: CEO P25 P50 P75 P90
Revenue (Millions) $87 $130 $158 $189
Base Salary $422,025 $519,038 $610,337 $788,250
Total Cash $562,500 $850,000 $1,289,872 $1,444,000
Total Direct $785,000 $1,691,141 $1,907,014 $2,545,319
Short Term Incentive (%) 21% 84% 124% 172%
Long Term Incentive (%) 5% 66% 176% 336%
Revenue (Millions) $301 $351 $418 $487
Base Salary $510,000 $650,000 $772,500 $850,000
Total Cash $1,179,584 $1,674,098 $1,877,471 $2,063,196
Total Direct $2,314,264 $3,693,500 $4,208,757 $5,926,858
Short Term Incentive (%) 105% 131% 197% 233%
Long Term Incentive (%) 148% 273% 387% 634%
Revenue (Millions) $741 $848 $1,141 $1,829
Base Salary $742,500 $800,000 $918,874 $1,000,000
Total Cash $1,812,882 $2,243,568 $2,422,722 $3,125,214
Total Direct $3,613,995 $4,864,165 $5,295,052 $6,539,119
Short Term Incentive (%) 137% 168% 226% 319%
Long Term Incentive (%) 198% 310% 375% 411%
N = 19
$250 - $500MM N = 27
$500MM+ N = 22
$0 - $250MM

© 2020 Grant Thornton LLP | All rights reserved | U.S. member firm of Grant Thornton International Ltd 111
Real Estate –Chief Financial Officer
Establishes, implements and maintains the financial plans and policies of the organization, including fiscal controls,
preparation and interpretation of financial reports, and safeguarding of the organization’s assets. Develops and maintains
overall accounting policies and controls. Assists in long-range planning and advises management on financial affairs.
Real Estate: CFO P25 P50 P75 P90
Revenue (Millions) $87 $130 $158 $189
Base Salary $266,875 $321,438 $344,000 $383,769
Total Cash $390,509 $480,417 $628,094 $749,695
Total Direct $516,625 $699,192 $986,390 $1,187,307
Short Term Incentive (%) 37% 63% 101% 135%
Long Term Incentive (%) 0% 55% 101% 167%
Revenue (Millions) $301 $351 $418 $487
Base Salary $291,250 $360,000 $426,250 $447,216
Total Cash $537,476 $697,887 $864,281 $1,063,081
Total Direct $973,941 $1,500,772 $1,753,751 $1,932,542
Short Term Incentive (%) 93% 111% 145% 177%
Long Term Incentive (%) 145% 193% 237% 318%
Revenue (Millions) $741 $848 $1,141 $1,829
Base Salary $407,961 $460,172 $501,111 $533,556
Total Cash $854,562 $1,016,447 $1,112,550 $1,296,095
Total Direct $1,207,821 $1,818,366 $2,169,317 $2,406,969
Short Term Incentive (%) 97% 116% 133% 176%
Long Term Incentive (%) 79% 177% 232% 258%
N = 16
$250 - $500MM N = 24
$500MM+ N = 22
$0 - $250MM
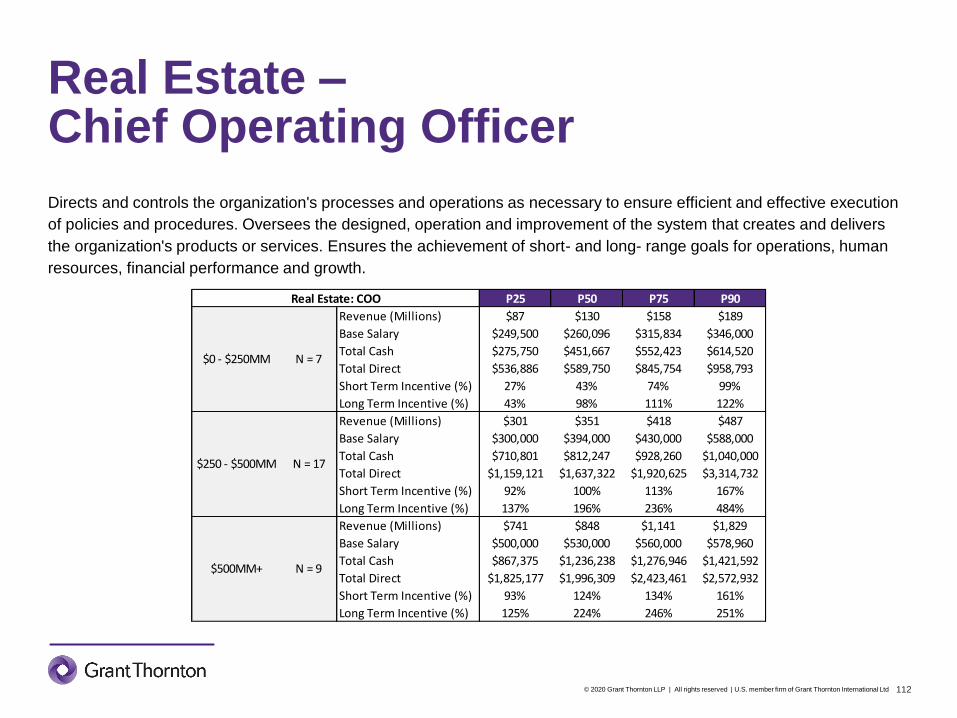
© 2020 Grant Thornton LLP | All rights reserved | U.S. member firm of Grant Thornton International Ltd 112
Real Estate –Chief Operating Officer
Directs and controls the organization's processes and operations as necessary to ensure efficient and effective execution
of policies and procedures. Oversees the designed, operation and improvement of the system that creates and delivers
the organization's products or services. Ensures the achievement of short- and long- range goals for operations, human
resources, financial performance and growth.
Real Estate: COO P25 P50 P75 P90
Revenue (Millions) $87 $130 $158 $189
Base Salary $249,500 $260,096 $315,834 $346,000
Total Cash $275,750 $451,667 $552,423 $614,520
Total Direct $536,886 $589,750 $845,754 $958,793
Short Term Incentive (%) 27% 43% 74% 99%
Long Term Incentive (%) 43% 98% 111% 122%
Revenue (Millions) $301 $351 $418 $487
Base Salary $300,000 $394,000 $430,000 $588,000
Total Cash $710,801 $812,247 $928,260 $1,040,000
Total Direct $1,159,121 $1,637,322 $1,920,625 $3,314,732
Short Term Incentive (%) 92% 100% 113% 167%
Long Term Incentive (%) 137% 196% 236% 484%
Revenue (Millions) $741 $848 $1,141 $1,829
Base Salary $500,000 $530,000 $560,000 $578,960
Total Cash $867,375 $1,236,238 $1,276,946 $1,421,592
Total Direct $1,825,177 $1,996,309 $2,423,461 $2,572,932
Short Term Incentive (%) 93% 124% 134% 161%
Long Term Incentive (%) 125% 224% 246% 251%
$500MM+ N = 9
$0 - $250MM N = 7
$250 - $500MM N = 17
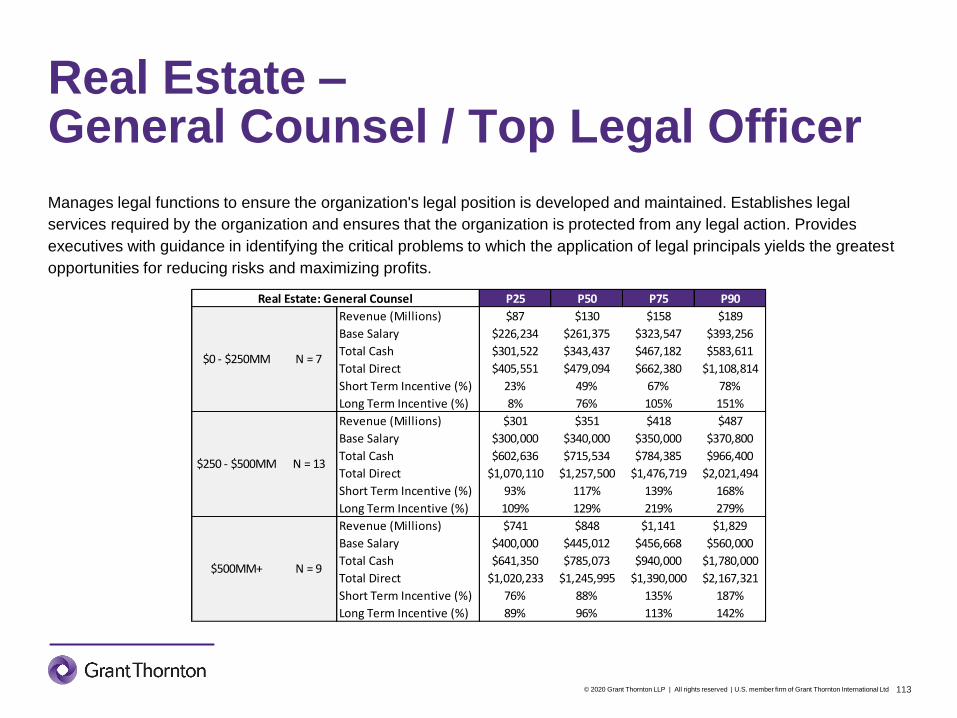
© 2020 Grant Thornton LLP | All rights reserved | U.S. member firm of Grant Thornton International Ltd 113
Real Estate –General Counsel / Top Legal Officer
Manages legal functions to ensure the organization's legal position is developed and maintained. Establishes legal
services required by the organization and ensures that the organization is protected from any legal action. Provides
executives with guidance in identifying the critical problems to which the application of legal principals yields the greatest
opportunities for reducing risks and maximizing profits.
Real Estate: General Counsel P25 P50 P75 P90
Revenue (Millions) $87 $130 $158 $189
Base Salary $226,234 $261,375 $323,547 $393,256
Total Cash $301,522 $343,437 $467,182 $583,611
Total Direct $405,551 $479,094 $662,380 $1,108,814
Short Term Incentive (%) 23% 49% 67% 78%
Long Term Incentive (%) 8% 76% 105% 151%
Revenue (Millions) $301 $351 $418 $487
Base Salary $300,000 $340,000 $350,000 $370,800
Total Cash $602,636 $715,534 $784,385 $966,400
Total Direct $1,070,110 $1,257,500 $1,476,719 $2,021,494
Short Term Incentive (%) 93% 117% 139% 168%
Long Term Incentive (%) 109% 129% 219% 279%
Revenue (Millions) $741 $848 $1,141 $1,829
Base Salary $400,000 $445,012 $456,668 $560,000
Total Cash $641,350 $785,073 $940,000 $1,780,000
Total Direct $1,020,233 $1,245,995 $1,390,000 $2,167,321
Short Term Incentive (%) 76% 88% 135% 187%
Long Term Incentive (%) 89% 96% 113% 142%
N = 7
$250 - $500MM N = 13
$500MM+ N = 9
$0 - $250MM

© 2020 Grant Thornton LLP | All rights reserved | U.S. member firm of Grant Thornton International Ltd 114
Real Estate –3rd Highest Paid
Third highest paid executive according to total direct compensation. Common 3rd highest paid positions include: Senior
Vice President – Operations, Vice President – Marketing, Corporate Secretary and General Manager.
Real Estate: 3rd Highest Rank P25 P50 P75 P90
Revenue (Millions) $87 $130 $158 $189
Base Salary $279,094 $319,771 $325,000 $340,300
Total Cash $373,750 $440,152 $583,149 $693,739
Total Direct $562,866 $718,638 $987,501 $1,177,382
Short Term Incentive (%) 31% 48% 80% 104%
Long Term Incentive (%) 52% 95% 130% 176%
Revenue (Millions) $301 $351 $418 $487
Base Salary $301,500 $355,000 $414,000 $438,777
Total Cash $607,518 $715,774 $826,988 $1,056,763
Total Direct $923,527 $1,567,466 $1,708,462 $2,376,556
Short Term Incentive (%) 88% 101% 141% 175%
Long Term Incentive (%) 80% 192% 225% 282%
Revenue (Millions) $741 $848 $1,141 $1,829
Base Salary $398,824 $452,672 $496,250 $561,057
Total Cash $801,418 $871,529 $998,266 $1,119,106
Total Direct $1,388,212 $1,665,671 $2,174,826 $2,409,026
Short Term Incentive (%) 86% 108% 128% 138%
Long Term Incentive (%) 113% 166% 228% 285%
$0 - $250MM N = 12
$250 - $500MM N = 23
$500MM+ N = 16

© 2020 Grant Thornton LLP | All rights reserved | U.S. member firm of Grant Thornton International Ltd 115
Real Estate –4th Highest Paid
Fourth highest paid executive according to total direct compensation. Common 4th highest paid positions include: Vice
President of Finance, Controller, Vice President – Human Resources and General Counsel.
Real Estate: 4th Highest Rank P25 P50 P75 P90
Revenue (Millions) $87 $130 $158 $189
Base Salary $228,886 $265,272 $310,906 $347,485
Total Cash $337,542 $404,016 $486,334 $558,228
Total Direct $394,900 $512,709 $785,384 $894,494
Short Term Incentive (%) 23% 40% 84% 93%
Long Term Incentive (%) 6% 52% 93% 119%
Revenue (Millions) $301 $351 $418 $487
Base Salary $268,750 $313,405 $362,500 $416,495
Total Cash $452,560 $582,139 $715,134 $853,551
Total Direct $767,869 $1,056,850 $1,241,233 $1,472,782
Short Term Incentive (%) 63% 92% 128% 154%
Long Term Incentive (%) 102% 125% 192% 207%
Revenue (Millions) $741 $848 $1,141 $1,829
Base Salary $350,899 $394,167 $430,968 $455,502
Total Cash $700,880 $747,848 $790,747 $960,678
Total Direct $1,090,719 $1,255,438 $1,548,485 $1,914,827
Short Term Incentive (%) 83% 99% 106% 131%
Long Term Incentive (%) 96% 127% 189% 222%
$0 - $250MM N = 6
$250 - $500MM N = 24
$500MM+ N = 12

© 2020 Grant Thornton LLP | All rights reserved | U.S. member firm of Grant Thornton International Ltd 116
Real Estate –5th Highest Paid
Fifth highest paid executive according to total direct compensation. Common 5th highest paid positions include: Chief
Strategy Officer, Vice President – Sales, Division Senior Vice President and Executive Vice President.
Real Estate: 5th Highest Rank P25 P50 P75 P90
Revenue (Millions) $87 $130 $158 $189
Base Salary $226,867 $233,734 $246,250 $255,688
Total Cash $254,367 $285,753 $428,336 $484,885
Total Direct $362,539 $516,779 $589,635 $684,093
Short Term Incentive (%) 19% 53% 79% 101%
Long Term Incentive (%) 20% 58% 108% 127%
Revenue (Millions) $301 $351 $418 $487
Base Salary $250,000 $300,000 $341,000 $362,307
Total Cash $448,399 $580,189 $642,297 $655,771
Total Direct $623,548 $942,372 $1,147,308 $1,336,037
Short Term Incentive (%) 47% 89% 112% 158%
Long Term Incentive (%) 38% 123% 209% 241%
Revenue (Millions) $741 $848 $1,141 $1,829
Base Salary $330,000 $343,053 $415,374 $440,900
Total Cash $580,000 $641,125 $760,909 $805,872
Total Direct $826,746 $1,020,233 $1,191,125 $1,700,151
Short Term Incentive (%) 65% 86% 98% 103%
Long Term Incentive (%) 89% 130% 167% 216%
$0 - $250MM N = 6
$250 - $500MM N = 16
$500MM+ N = 13

© 2020 Grant Thornton LLP | All rights reserved | U.S. member firm of Grant Thornton International Ltd 117
Real Estate –Board Chair
Responsible for leading the Board of Directors. This individual provides leadership to an organization's officer and
executive team, and ensures the organization is fulfilling its duties to their shareholders. Note this position does not
include Executive Chairman.
Real Estate Board Chair P25 P50 P75 P90
Revenue (Millions) $87 $130 $158 $189
Cash Compensation $100,000 $104,642 $107,000 $120,800
Equity Compensation $57,500 $65,000 $75,000 $81,000
Total Compensation $102,661 $120,321 $145,000 $161,000
Revenue (Millions) $301 $351 $418 $487
Cash Compensation $65,000 $110,000 $120,000 $149,400
Equity Compensation $86,881 $94,762 $100,000 $132,500
Total Compensation $159,018 $177,500 $244,375 $268,750
Revenue (Millions) $741 $848 $1,141 $1,829
Cash Compensation $93,750 $110,000 $137,000 $185,000
Equity Compensation $82,500 $110,000 $120,000 $160,000
Total Compensation $182,500 $220,000 $274,500 $280,000
$500MM+ N = 11
$0 - $250MM N = 6
$250 - $500MM N = 6

Utilities

© 2020 Grant Thornton LLP | All rights reserved | U.S. member firm of Grant Thornton International Ltd 119
Utilities –Chief Executive Officer
Top executive for the organization. Responsible for the overall success and creation of shareholder value. Manages the
profitability and growth of the organization. Develops and establishes long-range plans and strategies, and represents the
organization to external constituents, authorities, and the public. Reports to the Board of Directors.
Utilities: CEO P25 P50 P75 P90
Revenue (Millions) $407 $718 $1,483 $1,964
Base Salary $472,949 $629,220 $774,159 $858,110
Total Cash $885,431 $1,345,247 $1,691,256 $2,125,548
Total Direct $983,901 $2,295,343 $3,033,039 $3,784,169
Short Term Incentive (%) 81% 99% 130% 159%
Long Term Incentive (%) 56% 116% 191% 238%
All N = 34

© 2020 Grant Thornton LLP | All rights reserved | U.S. member firm of Grant Thornton International Ltd 120
Utilities –Chief Financial Officer
Establishes, implements and maintains the financial plans and policies of the organization, including fiscal controls,
preparation and interpretation of financial reports, and safeguarding of the organization’s assets. Develops and maintains
overall accounting policies and controls. Assists in long-range planning and advises management on financial affairs.
Utilities: CFO P25 P50 P75 P90
Revenue (Millions) $407 $718 $1,483 $1,964
Base Salary $336,202 $381,755 $431,994 $444,004
Total Cash $478,768 $625,175 $736,100 $806,647
Total Direct $689,095 $1,003,857 $1,251,038 $1,307,137
Short Term Incentive (%) 40% 60% 83% 101%
Long Term Incentive (%) 28% 84% 119% 154%
All N = 30

© 2020 Grant Thornton LLP | All rights reserved | U.S. member firm of Grant Thornton International Ltd 121
Utilities –Chief Operating Officer
Directs and controls the organization's processes and operations as necessary to ensure efficient and effective execution
of policies and procedures. Oversees the designed, operation and improvement of the system that creates and delivers
the organization's products or services. Ensures the achievement of short- and long- range goals for operations, human
resources, financial performance and growth.
Utilities: COO P25 P50 P75 P90
Revenue (Millions) $407 $718 $1,483 $1,964
Base Salary $340,549 $373,045 $423,831 $439,716
Total Cash $531,802 $633,694 $732,507 $895,535
Total Direct $845,125 $974,319 $1,317,413 $1,484,769
Short Term Incentive (%) 57% 61% 88% 110%
Long Term Incentive (%) 94% 105% 139% 163%
All N = 8

© 2020 Grant Thornton LLP | All rights reserved | U.S. member firm of Grant Thornton International Ltd 122
Utilities –General Counsel / Top Legal Officer
Manages legal functions to ensure the organization's legal position is developed and maintained. Establishes legal
services required by the organization and ensures that the organization is protected from any legal action. Provides
executives with guidance in identifying the critical problems to which the application of legal principals yields the greatest
opportunities for reducing risks and maximizing profits.
Utilities: General Counsel P25 P50 P75 P90
Revenue (Millions) $407 $718 $1,483 $1,964
Base Salary $316,058 $345,000 $366,115 $381,177
Total Cash $552,596 $572,189 $602,414 $648,600
Total Direct $786,588 $887,346 $986,370 $1,013,100
Short Term Incentive (%) 55% 70% 77% 96%
Long Term Incentive (%) 69% 90% 104% 113%
All N = 18

© 2020 Grant Thornton LLP | All rights reserved | U.S. member firm of Grant Thornton International Ltd 123
Utilities –3rd Highest Paid
Third highest paid executive according to total direct compensation. Common 3rd highest paid positions include: Senior
Vice President – Operations, Vice President – Marketing, Corporate Secretary and General Manager.
Utilities: 3rd Highest Rank P25 P50 P75 P90
Revenue (Millions) $407 $718 $1,483 $1,964
Base Salary $329,109 $358,027 $400,686 $434,021
Total Cash $505,309 $640,099 $684,897 $744,544
Total Direct $714,080 $935,832 $1,105,451 $1,289,565
Short Term Incentive (%) 51% 60% 83% 102%
Long Term Incentive (%) 35% 83% 121% 146%
All N = 28

© 2020 Grant Thornton LLP | All rights reserved | U.S. member firm of Grant Thornton International Ltd 124
Utilities –4th Highest Paid
Fourth highest paid executive according to total direct compensation. Common 4th highest paid positions include: Vice
President of Finance, Controller, Vice President – Human Resources and General Counsel.
Utilities: 4th Highest Rank P25 P50 P75 P90
Revenue (Millions) $407 $718 $1,483 $1,964
Base Salary $283,241 $316,914 $356,995 $369,539
Total Cash $438,784 $535,369 $570,778 $599,476
Total Direct $613,966 $778,606 $948,614 $997,659
Short Term Incentive (%) 49% 57% 71% 80%
Long Term Incentive (%) 44% 77% 103% 123%
All N = 26

© 2020 Grant Thornton LLP | All rights reserved | U.S. member firm of Grant Thornton International Ltd 125
Utilities –5th Highest Paid
Fifth highest paid executive according to total direct compensation. Common 5th highest paid positions include: Chief
Strategy Officer, Vice President – Sales, Division Senior Vice President and Executive Vice President.
Utilities: 5th Highest Rank P25 P50 P75 P90
Revenue (Millions) $407 $718 $1,483 $1,964
Base Salary $276,499 $315,000 $337,697 $362,339
Total Cash $415,122 $511,077 $567,640 $588,507
Total Direct $549,697 $737,500 $817,030 $947,310
Short Term Incentive (%) 47% 55% 75% 94%
Long Term Incentive (%) 35% 68% 89% 116%
All N = 27

© 2020 Grant Thornton LLP | All rights reserved | U.S. member firm of Grant Thornton International Ltd 126
Utilities –Board Chair
Responsible for leading the Board of Directors. This individual provides leadership to an organization's officer and
executive team, and ensures the organization is fulfilling its duties to their shareholders. Note this position does not
include Executive Chairman.
Utilities Board Chair P25 P50 P75 P90
Revenue (Millions) $407 $718 $1,483 $1,964
Cash Compensation $70,938 $125,000 $158,750 $174,500
Equity Compensation $60,000 $80,000 $111,731 $181,250
Total Compensation $167,500 $237,500 $275,000 $317,475
All N = 22

Appendix

© 2020 Grant Thornton LLP | All rights reserved | U.S. member firm of Grant Thornton International Ltd 128
Survey Constituents –Communications (Emerging/Growth)
Company Name Sub-Industry Revenue ($MM) q Net Income ($MM) Market Cap ($MM)
BOINGO WIRELESS INC Wireless Telecommunication Services $250 ($1) $496
FLUENT INC Advertis ing $250 $3 $208
NOVOCURE LTD Health Care Equipment $248 ($64) $8,060
CARDIOVASCULAR SYSTEMS INC Health Care Equipment $248 ($0) $1,598
MIMEDX GROUP, INC. Biotechnology $245 $12 $819
ACADIA PHARMACEUTICALS INC Biotechnology $224 ($245) $6,132
EAGLE PHARMACEUTICALS, INC. Biotechnology $213 $32 $736
AKEBIA THERAPEUTICS INC Biotechnology $208 ($144) $858
TABULA RASA HEALTHCARE INC Health Care Technology $204 ($47) $1,289
ATRICURE, INC. Health Care Equipment $202 ($21) $1,538
ANI PHARMACEUTICALS INC Pharmaceutica ls $202 $15 $749
REPLIGEN CORP Li fe Sciences Tools & Services $194 $17 $5,226
CARE.COM INC Interactive Media & Services $192 $53 $495
TANDEM DIABETES CARE INC Health Care Equipment $184 ($123) $4,489
ORASURE TECHNOLOGIES INC Health Care Suppl ies $182 $20 $435
GLAUKOS CORP Health Care Equipment $181 ($13) $2,077
INTERCEPT PHARMACEUTICALS, INC. Biotechnology $180 ($309) $3,025
VOCERA COMMUNICATIONS INC Health Care Technology $180 ($10) $694
MEET GROUP INC (THE) Interactive Media & Services $179 $1 $388
ROSETTA STONE INC Appl ication Software $174 ($21) $413
SPOK HOLDINGS INC Wireless Telecommunication Services $169 ($1) $200
ARROWHEAD PHARMACEUTICALS, INC. Biotechnology $169 $68 $4,003
RETROPHIN, INC. Biotechnology $164 ($103) $664
CUTERA INC Health Care Equipment $163 ($31) $400
INTREXON CORP Biotechnology $161 ($509) $756
CARDLYTICS, INC. Advertis ing $151 ($53) $2,154
HEMISPHERE MEDIA GROUP INC Broadcasting $141 ($11) $527
OOMA INC Integrated Telecommunication Services $129 ($15) $281
SAGA COMMUNICATIONS -CL A Broadcasting $125 $14 $180
TECHTARGET INC Advertis ing $121 $13 $711
TRAVELZOO Interactive Media & Services $111 $5 $119
DAILY JOURNAL CORP Publ ishing $49 ($25) $380
LIVEXLIVE MEDIA Movies & Enterta inment $34 ($38) $81
LORAL SPACE & COMMUNICATIONS Cable & Satel l i te $0 $10 $995

© 2020 Grant Thornton LLP | All rights reserved | U.S. member firm of Grant Thornton International Ltd 129
Survey Constituents –Communications (Mid-Size)
Company Name Sub-Industry Revenue ($MM) q Net Income ($MM) Market Cap ($MM)
YELP INC Interactive Media & Services $943 $55 $2,289
WORLD WRESTLING ENTERTAINMENTINC Movies & Enterta inment $930 $100 $3,840
GOGO INC Wireless Telecommunication Services $894 ($162) $464
MSG NETWORKS INC Cable & Satel l i te $721 $186 $1,143
MARCUS CORP Movies & Enterta inment $707 $53 $901
CENTRAL EUROPEAN MEDIA Broadcasting $704 $97 $1,134
CARS.COM INC Interactive Media & Services $662 $39 $778
SHENANDOAH TELECOMMUN CO Wireless Telecommunication Services $631 $47 $2,012
NII HOLDINGS INC Wireless Telecommunication Services $621 ($135) $223
IRIDIUM COMMUNICATIONS INC Alternative Carriers $523 ($13) $3,349
COGENT COMMUNICATIONS HLDGS Alternative Carriers $520 $29 $3,321
QUINSTREET INC Interactive Media & Services $455 $62 $662
CARGURUS, INC. Interactive Media & Services $454 $65 $3,986
ATN INTERNATIONAL INC Integrated Telecommunication Services $451 $20 $926
NATIONAL CINEMEDIA, INC. Advertis ing $441 $30 $571
EMERALD EXPOSITIONS EVENTS, INC. Advertis ing $381 ($25) $747
IMAX CORP Movies & Enterta inment $374 $23 $1,014
ENTRAVISION COMMUNICATIONS Broadcasting $298 $12 $188
ORBCOMM INC Alternative Carriers $276 ($26) $281

© 2020 Grant Thornton LLP | All rights reserved | U.S. member firm of Grant Thornton International Ltd 130
Survey Constituents –Communications (Stable/Mature)
Company Name Sub-Industry Revenue ($MM) q Net Income ($MM) Market Cap ($MM)
FRONTIER COMMUNICATIONS CORP Integrated Telecommunication Services $8,611 ($643) $58
AMC ENTERTAINMENT HOLDINGS Movies & Enterta inment $5,461 $110 $677
MEREDITH CORP Publ ishing $3,189 $129 $1,361
SINCLAIR BROADCAST GP -CL A Broadcasting $3,055 $341 $2,755
GANNETT CO INC -OLD Publ ishing $2,917 $15 $0
NEXSTAR MEDIA GROUP Broadcasting $2,767 $389 $5,590
CLEAR CHANNEL OUTDOOR HLDGS Advertis ing $2,722 ($218) $1,272
TEGNA INC Broadcasting $2,207 $401 $3,664
NEW YORK TIMES CO Publ ishing $1,749 $126 $5,315
SCHOLASTIC CORP Publ ishing $1,654 $16 $1,140
LIBERTY TRIPADVISOR HOLDINGS Interactive Media & Services $1,615 ($64) $442
GANNETT CO INC Publ ishing $1,526 $18 $370
MDC PARTNERS INC Advertis ing $1,476 ($124) $164
ENTERCOM COMMUNICATIONS CORP Broadcasting $1,463 ($363) $546
CONSOLIDATED COMM HLDGS INC Integrated Telecommunication Services $1,392 ($51) $348
CINCINNATI BELL INC Integrated Telecommunication Services $1,378 ($70) $691
EW SCRIPPS -CL A Broadcasting $1,208 $57 $982
WIDEOPENWEST INC Cable & Satel l i te $1,154 ($91) $569
GRAY TELEVISION INC Broadcasting $1,084 $211 $2,038
VONAGE HOLDINGS CORP Alternative Carriers $1,049 $36 $2,152

© 2020 Grant Thornton LLP | All rights reserved | U.S. member firm of Grant Thornton International Ltd 131
Survey Constituents – Consumer Discretionary (Emerging/Growth)
Company Name Sub-Industry Revenue ($MM) q Net Income ($MM) Market Cap ($MM)
MOTORCAR PARTS OF AMER INC Auto Parts & Equipment $466 ($8) $376
BASSETT FURNITURE INDS Home Furnishings $452 ($2) $124
FLEXSTEEL INDUSTRIES INC Home Furnishings $444 ($33) $130
EL POLLO LOCO HOLDINGS INC Restaurants $436 ($9) $481
HABIT RESTAURANTS INC (THE) Restaurants $402 $3 $289
NAUTILUS INC Leisure Products $397 $15 $95
QUOTIENT TECHNOLOGY INC Internet & Direct Marketing Retai l $387 ($28) $895
DEL FRISCOS RESTURNT GRP INC Restaurants $378 ($50) $266
SUPERIOR GROUP OF COS INC Apparel , Accessories & Luxury Goods $346 $17 $176
WEYCO GROUP INC Distributors $298 $20 $225
AMERICAN PUBLIC EDUCATION Education Services $298 $26 $372
CARRIAGE SERVICES INC Specia l i zed Consumer Services $268 $12 $422
ROCKY BRANDS INC Footwear $253 $15 $201
MONARCH CASINO & RESORT INC Cas inos & Gaming $240 $34 $971
LIQUIDITY SERVICES INC Internet & Direct Marketing Retai l $227 ($19) $179
CLARUS CORP Leisure Products $212 $7 $393
EMPIRE RESORTS INC Cas inos & Gaming $195 ($139) $336
RCI HOSPITALITY HLDGS INC Leisure Faci l i ties $166 $22 $171
CAMBIUM LEARNING GROUP INC Education Services $158 $45 $685
WINGSTOP INC Restaurants $153 $22 $2,732
REMARK HOLDINGS INC Internet & Direct Marketing Retai l $79 ($22) $28
VUZIX CORP Consumer Electronics $8 ($22) $61

© 2020 Grant Thornton LLP | All rights reserved | U.S. member firm of Grant Thornton International Ltd 132
Survey Constituents – Consumer Discretionary (Mid-Size)
Company Name Sub-Industry Revenue ($MM) q Net Income ($MM) Market Cap ($MM)
CAVCO INDUSTRIES INC. Homebui lding $963 $69 $2,045
BUCKLE INC Apparel Retai l $885 $96 $1,202
ELLIS PERRY INTL INC Apparel , Accessories & Luxury Goods $875 $57 $437
STONERIDGE INC Auto Parts & Equipment $866 $54 $763
CATO CORP -CL A Apparel Retai l $830 $30 $395
HAVERTY FURNITURE COMPANIES INC Homefurnishing Retai l $818 $30 $395
DINE BRANDS GLOBAL INC Restaurants $781 $80 $1,431
CITI TRENDS INC Apparel Retai l $770 $21 $271
ETHAN ALLEN INTERIORS INC Home Furnishings $747 $26 $429
BLUEGREEN VACATNS CORP Hotels , Resorts & Cruise Lines $737 $88 $683
UNIFI INC Texti les $709 $2 $398
NUTRISYSTEM INC Internet & Direct Marketing Retai l $691 $59 $1,267
FIESTA RESTAURANT GROUP INC Restaurants $689 $8 $257
FUNKO INC Distributors $686 $9 $521
MALIBU BOATS INC Leisure Products $684 $66 $896
MOVADO GROUP INC Apparel , Accessories & Luxury Goods $680 $62 $396
UNIVERSAL ELECTRONICS INC Consumer Electronics $678 $12 $690
KIRKLAND'S, INC Homefurnishing Retai l $647 $4 $16
AMERICAN OUTDOOR BRANDS CORP Leisure Products $638 $18 $519
STRATEGIC EDUCATION INC Education Services $634 ($16) $3,565
GREEN BRICK PARTNERS INC Homebui lding $624 $52 $585
SHUTTERSTOCK INC Internet & Direct Marketing Retai l $623 $55 $1,536
FOX FACTORY HOLDING CP Auto Parts & Equipment $619 $84 $2,536
STAMPS.COM INC Internet & Direct Marketing Retai l $587 $169 $1,274
PERDOCEO EDUCATION CORP Education Services $581 $56 $1,250
PLANET FITNESS INC Leisure Faci l i ties $573 $88 $6,606
ZAGG INC Consumer Electronics $538 $39 $220
DEL TACO RESTAURANTS INC Restaurants $505 $19 $279

© 2020 Grant Thornton LLP | All rights reserved | U.S. member firm of Grant Thornton International Ltd 133
Survey Constituents – Consumer Discretionary (Stable/Mature)
Company Name Sub-Industry Revenue ($MM) q Net Income ($MM) Market Cap ($MM)
PENNEY (J C) CO Department Stores $12,019 ($255) $240
TENNECO INC Auto Parts & Equipment $11,763 $55 $766
SIGNET JEWELERS LTD Specia l ty Stores $6,247 ($657) $1,271
BIG LOTS INC General Merchandise Stores $5,238 $157 $1,056
BLOOMIN' BRANDS INC Restaurants $4,126 $107 $1,804
SCIENTIFIC GAMES CORP Cas inos & Gaming $3,363 ($352) $2,310
TAILORED BRANDS INC Apparel Retai l $3,240 $83 $193
MARRIOTT VACATIONS WORLDWIDE Hotels , Resorts & Cruise Lines $2,968 $55 $5,121
GROUPON INC Internet & Direct Marketing Retai l $2,637 ($11) $1,622
BOYD GAMING CORP Cas inos & Gaming $2,627 $115 $3,318
PINNACLE ENTERTAINMENT INC Cas inos & Gaming $2,562 $63 $1,917
FOSSIL GROUP INC Apparel , Accessories & Luxury Goods $2,541 ($3) $340
TEXAS ROADHOUSE INC Restaurants $2,457 $158 $4,344
TOPBUILD CORP Homebui lding $2,384 $135 $3,888
MODINE MANUFACTURING CO Auto Parts & Equipment $2,213 $85 $357
WILLIAM LYON HOMES Homebui lding $2,087 $92 $878
VISTA OUTDOOR INC Leisure Products $2,059 ($648) $429
LA-Z-BOY INC Home Furnishings $1,745 $69 $1,423
MADDEN STEVEN LTD Footwear $1,668 $129 $3,241
FIVE BELOW, INC Specia l ty Stores $1,560 $150 $6,303
SLEEP NUMBER CORP Homefurnishing Retai l $1,532 $70 $1,467
SUPERIOR INDUSTRIES INTL Auto Parts & Equipment $1,502 $24 $80
RED ROBIN GOURMET BURGERS Restaurants $1,339 ($6) $426
HOUGHTON MIFFLIN HARCOURT CO Education Services $1,322 ($137) $686
DAVE & BUSTER'S ENTMT INC Restaurants $1,265 $117 $1,350
MARINEMAX INC Specia l ty Stores $1,237 $36 $425
LUMBER LIQUIDATORS HLDGS INC Home Improvement Retai l $1,085 ($54) $218
REGIS CORP/MN Specia l i zed Consumer Services $1,069 ($20) $552
GENTHERM INC Auto Parts & Equipment $1,038 $42 $1,510
K12 INC Education Services $1,016 $37 $661
CHURCHILL DOWNS INC Cas inos & Gaming $1,009 $183 $5,761
HIBBETT SPORTS INC Specia l ty Stores $1,009 $28 $431
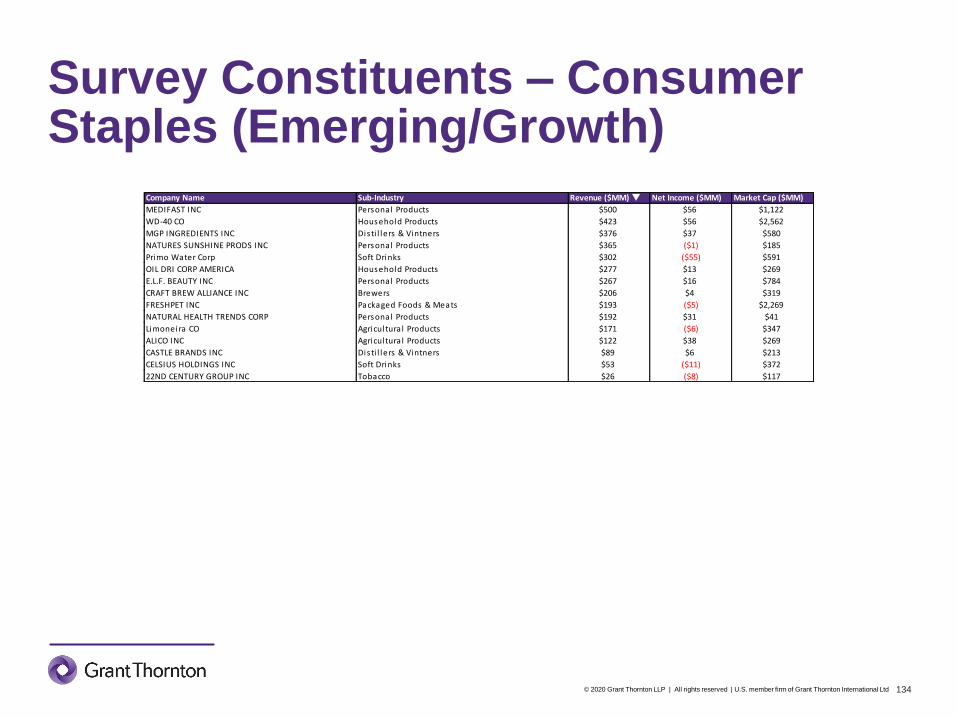
© 2020 Grant Thornton LLP | All rights reserved | U.S. member firm of Grant Thornton International Ltd 134
Survey Constituents – Consumer Staples (Emerging/Growth)
Company Name Sub-Industry Revenue ($MM) q Net Income ($MM) Market Cap ($MM)
MEDIFAST INC Personal Products $500 $56 $1,122
WD-40 CO Household Products $423 $56 $2,562
MGP INGREDIENTS INC Disti l lers & Vintners $376 $37 $580
NATURES SUNSHINE PRODS INC Personal Products $365 ($1) $185
Primo Water Corp Soft Drinks $302 ($55) $591
OIL DRI CORP AMERICA Household Products $277 $13 $269
E.L.F. BEAUTY INC Personal Products $267 $16 $784
CRAFT BREW ALLIANCE INC Brewers $206 $4 $319
FRESHPET INC Packaged Foods & Meats $193 ($5) $2,269
NATURAL HEALTH TRENDS CORP Personal Products $192 $31 $41
Limoneira CO Agricultura l Products $171 ($6) $347
ALICO INC Agricultura l Products $122 $38 $269
CASTLE BRANDS INC Disti l lers & Vintners $89 $6 $213
CELSIUS HOLDINGS INC Soft Drinks $53 ($11) $372
22ND CENTURY GROUP INC Tobacco $26 ($8) $117

© 2020 Grant Thornton LLP | All rights reserved | U.S. member firm of Grant Thornton International Ltd 135
Survey Constituents –Consumer Staples (Mid-Size)
Company Name Sub-Industry Revenue ($MM) q Net Income ($MM) Market Cap ($MM)
PYXUS INTERNATIONAL INC Tobacco $1,802 ($70) $63
B&G FOODS INC Packaged Foods & Meats $1,701 $172 $1,029
VILLAGE SUPER MARKET -CL A Food Retai l $1,644 $26 $320
CHEFS' WAREHOUSE INC Food Dis tributors $1,445 $20 $1,103
VECTOR GROUP LTD Tobacco $1,400 $58 $1,942
CAL-MAINE FOODS INC Packaged Foods & Meats $1,361 $54 $1,738
LANCASTER COLONY CORP Packaged Foods & Meats $1,308 $151 $4,251
SENECA FOODS CORP Packaged Foods & Meats $1,200 ($36) $365
CALAVO GROWERS INC Packaged Foods & Meats $1,196 $37 $1,348
USANA HEALTH SCIENCES INC Personal Products $1,189 $126 $1,335
J & J SNACK FOODS CORP Packaged Foods & Meats $1,186 $95 $3,134
NATIONAL BEVERAGE CORP Soft Drinks $1,014 $141 $2,003
BOSTON BEER CO INC Brewers $996 $93 $4,289
NATURAL GROCERS VITAMIN CTGE Food Retai l $904 $9 $203
SANFILIPPO JOHN B&SON Packaged Foods & Meats $876 $39 $960
HOSTESS BRANDS, INC. Packaged Foods & Meats $850 $63 $1,623
INTER PARFUMS INC Personal Products $676 $54 $2,175
FARMER BROTHERS CO Packaged Foods & Meats $596 ($74) $205
LANDEC CORP Packaged Foods & Meats $558 $2 $327

© 2020 Grant Thornton LLP | All rights reserved | U.S. member firm of Grant Thornton International Ltd 136
Survey Constituents –Consumer Staples (Stable/Mature)
Company Name Sub-Industry Revenue ($MM) q Net Income ($MM) Market Cap ($MM)
RITE AID CORP Drug Retai l $21,640 ($667) $656
UNITED NATURAL FOODS INC Food Dis tributors $21,387 ($351) $385
PERFORMANCE FOOD GROUP CO Food Dis tributors $19,744 $167 $5,397
SPARTANNASH CO Food Dis tributors $8,065 $34 $443
DEAN FOODS CO Packaged Foods & Meats $7,755 ($332) $28
SMART & FINAL STORES INC Food Retai l $4,742 ($112) $497
COCA COLA CONSOLIDATED INC Soft Drinks $4,625 ($20) $2,539
FRESH DEL MONTE PRODUCE INC Agricultura l Products $4,494 ($22) $1,507
INGLES MARKETS INC -CL A Food Retai l $4,202 $82 $845
WEIS MARKETS INC Food Retai l $3,509 $63 $987
SANDERSON FARMS INC Packaged Foods & Meats $3,440 $53 $3,057
DARLING INGREDIENTS INC Agricultura l Products $3,388 $101 $4,453
PRICESMART INC Hypermarkets & Super Centers $3,224 $73 $1,875
ANDERSONS, INC. Food Dis tributors $3,045 $41 $749
REVLON INC -CL A Personal Products $2,576 ($294) $1,179
CENTRAL GARDEN & PET CO Household Products $2,383 $93 $1,683
UNIVERSAL CORP/VA Tobacco $2,227 $104 $1,320
EDGEWELL PERSONAL CARE CO Personal Products $2,141 ($372) $1,400

© 2020 Grant Thornton LLP | All rights reserved | U.S. member firm of Grant Thornton International Ltd 137
Survey Constituents –Energy (Emerging/Growth)
Company Name Sub-Industry Revenue ($MM) q Net Income ($MM) Market Cap ($MM)
SEACOR MARINE HLDGS INC Oi l & Gas Equipment & Services $250 ($78) $228
RIGNET INC Oi l & Gas Equipment & Services $239 ($62) $83
NCS MULTISTAGE HLDG INC Oi l & Gas Equipment & Services $227 ($190) $72
NUVERRA ENVIRONMENTAL SOLUTN Oi l & Gas Equipment & Services $197 ($59) $43
SOLARIS OILFIELD IF INC Oi l & Gas Equipment & Services $197 $42 $358
EARTHSTONE ENERGY INC Oi l & Gas Exploration & Production $165 $42 $323
DORIAN LPG LTD Oi l & Gas Storage & Transportation $161 ($51) $717
ABRAXAS PETROLEUM CORP/NV Oi l & Gas Exploration & Production $149 $58 $39
INDEPENDENCE CONTRACT DRLLNG Oi l & Gas Dri l l ing $143 ($20) $54
NACCO INDUSTRIES -CL A Coal & Consumable Fuels $135 $35 $330
RING ENERGY, INC. Oi l & Gas Exploration & Production $120 $9 $146
APPROACH RESOURCES INC Oi l & Gas Exploration & Production $114 ($20) $0
GOODRICH PETROLEUM CORP Oi l & Gas Exploration & Production $88 $2 $82
ISRAMCO INC Oi l & Gas Exploration & Production $79 $18 $331
LILIS ENERGY INC Oi l & Gas Exploration & Production $70 ($4) $20
AMYRIS INC Specia l ty Chemicals $64 ($230) $265
PANHANDLE OIL & GAS INC Oi l & Gas Exploration & Production $47 ($41) $118
PROFIRE ENERGY INC Oi l & Gas Equipment & Services $46 $6 $66
EVOLUTION PETROLEUM CORP Oi l & Gas Exploration & Production $43 $15 $166
TELLURIAN INC Oi l & Gas Exploration & Production $10 ($126) $1,700
URANIUM ENERGY CORP Coal & Consumable Fuels $0 ($17) $151
ZION OIL & GAS INC Oi l & Gas Exploration & Production $0 ($39) $21

© 2020 Grant Thornton LLP | All rights reserved | U.S. member firm of Grant Thornton International Ltd 138
Survey Constituents –Energy (Mid-Size)
Company Name Sub-Industry Revenue ($MM) q Net Income ($MM) Market Cap ($MM)
TETRA TECHNOLOGIES INC/DE Oi l & Gas Equipment & Services $999 ($20) $192
BASIC ENERGY SERVICES INC Oi l & Gas Equipment & Services $965 ($145) $0
NEWPARK RESOURCES Oi l & Gas Equipment & Services $947 $32 $448
ARCHROCK INC Oi l & Gas Equipment & Services $904 $21 $1,268
MATADOR RESOURCES CO Oi l & Gas Exploration & Production $900 $274 $1,711
UNIT CORP Integrated Oi l & Gas $843 ($45) $22
CLOUD PEAK ENERGY INC Coal & Consumable Fuels $832 ($718) $1
HELIX ENERGY SOLUTIONS GROUP Oi l & Gas Equipment & Services $740 $29 $1,241
PHI INC Oi l & Gas Equipment & Services $674 ($142) $0
SRC ENERGY INC Oi l & Gas Exploration & Production $646 $260 $974
PIONEER ENERGY SERVICES CORP Oi l & Gas Dri l l ing $590 ($49) $3
W&T OFFSHORE INC Oi l & Gas Exploration & Production $581 $249 $582
FRANK'S INTL NV Oi l & Gas Equipment & Services $522 ($91) $789
KEY ENERGY SERVICES INC Oi l & Gas Equipment & Services $522 ($89) $2
WILDHORSE RES DVLPT Oi l & Gas Exploration & Production $427 $50 $1,731
DRIL-QUIP INC Oi l & Gas Equipment & Services $385 ($96) $1,480
OVERSEAS SHIPHOLDING GROUP Oi l & Gas Storage & Transportation $366 $13 $152
SANDRIDGE ENERGY INC Oi l & Gas Exploration & Production $349 ($9) $91
RESOLUTE ENERGY CORP Oi l & Gas Exploration & Production $303 ($1) $716
HALLADOR ENERGY CO Coal & Consumable Fuels $292 $8 $50
INTERNATIONAL SEAWAYS, INC. Oi l & Gas Storage & Transportation $270 ($89) $662

© 2020 Grant Thornton LLP | All rights reserved | U.S. member firm of Grant Thornton International Ltd 139
Survey Constituents –Energy (Stable/Mature)
Company Name Sub-Industry Revenue ($MM) q Net Income ($MM) Market Cap ($MM)
DELEK US HOLDINGS INC Oi l & Gas Refining & Marketing $10,233 $357 $2,040
CVR ENERGY INC Oi l & Gas Refining & Marketing $7,124 $289 $3,479
MCDERMOTT INTL INC Oi l & Gas Equipment & Services $6,705 ($2,687) $0
PEABODY ENERGY CORP Coal & Consumable Fuels $5,582 $629 $668
SOUTHWESTERN ENERGY CO Oi l & Gas Exploration & Production $3,862 $537 $850
GREEN PLAINS INC Oi l & Gas Refining & Marketing $3,843 $16 $455
PAR PACIFIC HOLDINGS INC Oi l & Gas Refining & Marketing $3,411 $39 $1,030
CALIFORNIA RESOURCES CORP Oi l & Gas Exploration & Production $3,063 $328 $361
SEMGROUP CORP Oi l & Gas Storage & Transportation $2,503 ($27) $1,195
ARCH COAL INC Coal & Consumable Fuels $2,452 $313 $778
RENEWABLE ENERGY GROUP INC Oi l & Gas Refining & Marketing $2,383 $304 $1,024
OASIS PETROLEUM INC. Oi l & Gas Exploration & Production $2,322 ($35) $723
C&J ENERGY SERVICES INC Oi l & Gas Equipment & Services $2,222 ($130) $486
NEXTIER OILFIELD SOLUTNS INC Oi l & Gas Equipment & Services $2,137 $59 $541
SUPERIOR ENERGY SERVICES INC Oi l & Gas Equipment & Services $2,130 ($857) $8
OCEANEERING INTERNATIONAL Oi l & Gas Equipment & Services $1,909 ($212) $1,228
ADAMS RESOURCES & ENERGY INC Oi l & Gas Refining & Marketing $1,750 $3 $150
PROPETRO HOLDING CORP Oi l & Gas Equipment & Services $1,705 $174 $980
MAMMOTH ENERGY SERVICES INC Oi l & Gas Equipment & Services $1,690 $236 $64
U S SILICA HOLDINGS INC Oi l & Gas Equipment & Services $1,577 ($201) $378
PDC ENERGY INC Oi l & Gas Exploration & Production $1,549 $2 $1,337
CONSOL ENERGY INC Coal & Consumable Fuels $1,526 $153 $211
DENBURY RESOURCES INC Oi l & Gas Exploration & Production $1,454 $323 $465
MATRIX SERVICE CO Oi l & Gas Equipment & Services $1,417 $28 $546
BRISTOW GROUP INC Oi l & Gas Equipment & Services $1,362 ($337) $0
EXTERRAN CORP Oi l & Gas Equipment & Services $1,358 $0 $181
GULFPORT ENERGY CORP Oi l & Gas Exploration & Production $1,355 $431 $248
EP ENERGY CORP Oi l & Gas Exploration & Production $1,324 ($1,003) $0
OIL STATES INTL INC Oi l & Gas Equipment & Services $1,088 ($19) $652
DIAMOND OFFSHRE DRILLING INC Oi l & Gas Dri l l ing $1,083 ($180) $638
NOBLE CORP PLC Oi l & Gas Dri l l ing $1,083 ($885) $212
CARRIZO OIL & GAS INC Oi l & Gas Exploration & Production $1,066 $404 $725
FORUM ENERGY TECH INC Oi l & Gas Equipment & Services $1,064 ($374) $117

© 2020 Grant Thornton LLP | All rights reserved | U.S. member firm of Grant Thornton International Ltd 140
Survey Constituents –Financials (Emerging/Growth)
Company Name Sub-Industry Revenue ($MM) q Net Income ($MM) Market Cap ($MM)
LAKELAND FINANCIAL CORP Regional Banks $239 $80 $1,207
BENEFICIAL BANCORP INC Thri fts & Mortgage Finance $237 $48 $1,206
CONNECTONE BANCORP, INC. Regional Banks $222 $60 $828
NATIONAL COMMERCE CORP Regional Banks $191 $42 $814
STOCK YARDS BANCORP INC Regional Banks $175 $56 $875
CAPITAL CITY BK GROUP INC Regional Banks $151 $26 $478
HERITAGE COMMERCE CORP Regional Banks $139 $35 $689
MBIA INC Property & Casualty Insurance $138 ($296) $729
UNITED COMMUNITY FINL CORP Thri fts & Mortgage Finance $134 $37 $526
SOUTHERN NATIONAL BANCORP VA Regional Banks $129 $34 $375
FARMERS NATL BANC CORP/OH Regional Banks $117 $33 $438
PEOPLES FINANCIAL SERVICES CORP. Regional Banks $98 $25 $342
DYNEX CAPITAL INC Mortgage REITs $85 $7 $409
ARMOUR RESIDENTIAL REIT, INC. Mortgage REITs $83 ($106) $1,134
CAPSTAR FINANCIAL HOLDINGS, INC. Regional Banks $83 $10 $275
ACNB CORP Regional Banks $80 $22 $227
CENTRAL VALLEY COMMUNITY BANCORP Regional Banks $74 $21 $245
SI FINANCIAL GROUP INC Thri fts & Mortgage Finance $69 $10 $179
1ST CONSTITUTION BANCORP Regional Banks $59 $12 $175
FARMERS & MERCHANTS BANCORP INC Regional Banks $57 $15 $327
CB FINANCIAL SERVICES INC Regional Banks $52 $7 $159
OAK VALLEY BANCORP Regional Banks $45 $12 $152
OCONEE FEDERAL FINANCIAL CP Thri fts & Mortgage Finance $21 $4 $149

© 2020 Grant Thornton LLP | All rights reserved | U.S. member firm of Grant Thornton International Ltd 141
Survey Constituents –Financials (Mid-Size)
Company Name Sub-Industry Revenue ($MM) q Net Income ($MM) Market Cap ($MM)
DONNELLEY FINANCIAL SOLTNS Financia l Exchanges & Data $963 $74 $311
FULTON FINANCIAL CORP Regional Banks $954 $208 $2,705
BRIGHTSPHERE INVEST GRP INC Asset Management & Custody Banks $928 $136 $818
UNITED BANKSHARES INC/WV Regional Banks $846 $256 $3,483
ENSTAR GROUP LTD Reinsurance $839 ($150) $4,197
EMPLOYERS HOLDINGS, INC. Property & Casualty Insurance $800 $141 $1,357
HOME BANCSHARES INC Regional Banks $788 $300 $3,181
ELEVATE CREDIT, INC. Consumer Finance $787 $13 $257
WALKER & DUNLOP INC Thri fts & Mortgage Finance $780 $161 $1,988
DONEGAL GROUP INC Property & Casualty Insurance $769 ($33) $399
WASHINGTON FEDERAL INC Thri fts & Mortgage Finance $735 $210 $2,656
FGL HOLDINGS Other Divers i fied Financia l Services $711 $13 $2,075
HOPE BANCORP INC Regional Banks $710 $190 $1,749
FIRST BANCORP /PR/ Regional Banks $705 $202 $2,015
FIRST FINL BANCORP INC/OH Regional Banks $644 $173 $2,368
TIPTREE INC Property & Casualty Insurance $626 ($13) $237
CADENCE BANCORPORATION Regional Banks $602 $166 $1,994
UNITED COMMUNITY BANKS INC Regional Banks $593 $166 $2,206
META FINANCIAL GROUP INC Thri fts & Mortgage Finance $548 $97 $1,407
PENNYMAC MORTGAGE INVEST TR Mortgage REITs $526 $153 $2,101
BANC OF CALIFORNIA INC Regional Banks $447 $42 $812
PROVIDENT FINANCIAL SVCS INC Thri fts & Mortgage Finance $419 $118 $1,500
FIRST COMMONWLTH FINL CP/PA Regional Banks $381 $107 $1,329
HALLMARK FINANCIAL SERVICES Property & Casualty Insurance $379 $10 $312
FB FINANCIAL CORP Regional Banks $370 $80 $1,106
1ST SOURCE CORP Regional Banks $354 $82 $1,204
INDEPENDENCE HOLDING CO Li fe & Health Insurance $353 $28 $601
S & T BANCORP INC Regional Banks $337 $105 $1,287
SEACOAST BANKING CORP OF FLORIDA Regional Banks $291 $67 $1,399
CAPSTEAD MORTGAGE CORP Mortgage REITs $277 $50 $778
NMI HOLDINGS INC Thri fts & Mortgage Finance $275 $108 $2,168
FLUSHING FINANCIAL CORP Regional Banks $266 $55 $559

© 2020 Grant Thornton LLP | All rights reserved | U.S. member firm of Grant Thornton International Ltd 142
Survey Constituents –Financials (Stable/Mature)
Company Name Sub-Industry Revenue ($MM) q Net Income ($MM) Market Cap ($MM)
GENWORTH FINANCIAL INC Li fe & Health Insurance $8,428 $119 $2,064
NATIONAL GENERAL HOLDINGS CP Multi -l ine Insurance $4,608 $207 $2,467
CNO FINANCIAL GROUP INC Li fe & Health Insurance $4,314 ($315) $2,677
KEMPER CORP/DE Property & Casualty Insurance $3,714 $188 $4,959
STIFEL FINANCIAL CORP Investment Banking & Brokerage $3,180 $394 $4,456
SELECTIVE INSURANCE GROUP INC Property & Casualty Insurance $2,568 $179 $3,935
MAIDEN HOLDINGS LTD Reinsurance $2,165 ($451) $73
STEWART INFORMATION SERVICES Property & Casualty Insurance $1,905 $48 $990
PRIMERICA INC Li fe & Health Insurance $1,900 $324 $4,919
ARGO GROUP INTL HOLDINGS LTD Property & Casualty Insurance $1,799 $64 $2,251
FIRSTCASH, INC Consumer Finance $1,781 $153 $3,730
HILLTOP HOLDINGS INC Regional Banks $1,602 $121 $2,052
AMERICAN EQTY INVT LIFE HLDG Li fe & Health Insurance $1,546 $458 $2,403
NAVIGATORS GROUP INC Property & Casualty Insurance $1,439 $34 $2,097
LADENBURG THALMANN FINL SERV Investment Banking & Brokerage $1,391 $34 $519
IBERIABANK CORP Regional Banks $1,374 $370 $3,800
ENCORE CAPITAL GROUP INC Consumer Finance $1,362 $116 $1,054
STATE AUTO FINANCIAL CORP Property & Casualty Insurance $1,276 $13 $1,310
RADIAN GROUP INC Thri fts & Mortgage Finance $1,273 $606 $4,952
CANNAE HOLDINGS INC Multi -Sector Holdings $1,200 $28 $2,931
WADDELL&REED FINL INC -CL A Asset Management & Custody Banks $1,183 $184 $1,138
LENDINGCLUB CORP Consumer Finance $1,180 ($128) $1,033
HORACE MANN EDUCATORS CORP Multi -l ine Insurance $1,176 $18 $1,773
FEDERATED INVESTORS INC Asset Management & Custody Banks $1,136 $220 $3,665
UMB FINANCIAL CORP Regional Banks $1,134 $196 $3,262
MGIC INVESTMENT CORP Thri fts & Mortgage Finance $1,124 $670 $4,809
FLAGSTAR BANCORP INC Thri fts & Mortgage Finance $1,122 $187 $1,991
OCWEN FINANCIAL CORP Thri fts & Mortgage Finance $1,072 ($72) $166
UNITED FIRE GROUP INC Property & Casualty Insurance $1,070 $2 $1,110
PENNYMAC FINANCIAL SERVICES Thri fts & Mortgage Finance $1,068 $101 $850

© 2020 Grant Thornton LLP | All rights reserved | U.S. member firm of Grant Thornton International Ltd 143
Survey Constituents –Health Care (Emerging/Growth)
Company Name Sub-Industry Revenue ($MM) q Net Income ($MM) Market Cap ($MM)
LIGAND PHARMACEUTICAL INC Biotechnology $250 $143 $1,542
HEALTHSTREAM INC Health Care Technology $232 $13 $827
REGENXBIO INC Biotechnology $219 $100 $1,604
FIBROGEN INC Biotechnology $213 ($86) $3,650
ENANTA PHARMACEUTICALS INC Biotechnology $205 $46 $1,015
MERIDIAN BIOSCIENCE INC Health Care Suppl ies $201 $24 $420
VANDA PHARMACEUTICALS INC Biotechnology $193 $25 $680
VIEWRAY INC Health Care Equipment $81 ($76) $310
TELIGENT INC Pharmaceutica ls $66 ($36) $22
LEXICON PHARMACEUTICALS INC Biotechnology $63 ($121) $328
AVID BIOSERVICES INC Biotechnology $54 ($5) $372
NEOS THERAPEUTICS INC Pharmaceutica ls $50 ($52) $79
CYTOKINETICS INC Biotechnology $32 ($106) $727
INOVIO PHARMACEUTICALS INC Biotechnology $30 ($97) $449
TRANSENTERIX INC Health Care Equipment $24 ($62) $27
LOXO ONCOLOGY INC Biotechnology $21 ($149) $7,173
CONCERT PHARMACEUTICALS, INC. Biotechnology $11 ($56) $255
DICERNA PHARMACEUTICALS INC Biotechnology $6 ($89) $1,350
ACCELERATE DIAGNOSTICS INC Li fe Sciences Tools & Services $6 ($88) $918
RA PHARMACEUTICALS INC Biotechnology $3 ($65) $2,207
IMMUNE DESIGN CORP Biotechnology $2 ($55) $282
SYROS PHARMACEUTICALS INC Biotechnology $2 ($62) $300
CLEARSIDE BIOMEDICAL INC Pharmaceutica ls $0 ($83) $155
ACHILLION PHARMACEUTICALS INC Biotechnology $0 ($70) $946
IOVANCE BIOTHERAPEUTICS INC Biotechnology $0 ($124) $2,743
MADRIGAL PHARMACEUTICALS INC Biotechnology $0 ($33) $1,281
OVID THRPUTCS INC Biotechnology $0 ($52) $135
ZAFGEN INC Biotechnology $0 ($61) $43

© 2020 Grant Thornton LLP | All rights reserved | U.S. member firm of Grant Thornton International Ltd 144
Survey Constituents –Health Care (Mid-Size)
Company Name Sub-Industry Revenue ($MM) q Net Income ($MM) Market Cap ($MM)
NATIONAL HEALTHCARE CORP Health Care Faci l i ties $979 $59 $1,286
RADNET, INC. Health Care Services $975 $32 $1,134
MERIT MEDICAL SYSTEMS INC Health Care Suppl ies $883 $42 $2,011
CONMED CORP Health Care Equipment $860 $41 $2,885
CROSS COUNTRY HEALTHCARE INC Health Care Services $816 ($17) $355
AMERICAN RENAL ASSOCS HLDGS Health Care Services $806 ($29) $296
EMERGENT BIOSOLUTIONS INC Biotechnology $782 $63 $2,843
VAREX IMAGING CORP Health Care Equipment $781 $16 $1,061
GLOBUS MEDICAL INC Health Care Equipment $713 $156 $5,197
MEDPACE HOLDINGS INC Li fe Sciences Tools & Services $705 $73 $3,064
TIVITY HEALTH INC Health Care Services $606 $98 $1,037
HMS HOLDINGS CORP Health Care Technology $598 $55 $2,407
CAMBREX CORP Li fe Sciences Tools & Services $531 $93 $2,023
PETIQ, INC. Health Care Dis tributors $529 ($1) $693
INOVALON HOLDINGS INC Health Care Technology $528 ($39) $3,140
QUIDEL CORP Health Care Suppl ies $522 $74 $3,198
APOLLO MEDICAL HOLDING INC Health Care Services $520 $11 $624
AMAG PHARMACEUTICALS, INC. Biotechnology $474 ($169) $300
CAPITAL SENIOR LIVING CORP Health Care Faci l i ties $460 ($54) $88
U S PHYSICAL THERAPY INC Health Care Faci l i ties $454 $35 $1,496
ORTHOFIX MEDICAL INC Health Care Equipment $453 $14 $817
NEOGEN CORP Health Care Suppl ies $414 $60 $3,546
BIOTELEMETRY, INC. Health Care Services $399 $43 $1,663
GENOMIC HEALTH INC Biotechnology $394 $26 $2,382
NEVRO CORP Health Care Equipment $387 ($49) $4,119
IRONWOOD PHARMACEUTICALS INC Biotechnology $347 ($282) $1,894
LUMINEX CORP Li fe Sciences Tools & Services $316 $19 $1,003
AAC HOLDINGS, INC. Health Care Faci l i ties $302 ($59) $10
NEOGENOMICS INC Li fe Sciences Tools & Services $277 $3 $3,357
K2M GROUP HOLDINGS INC Health Care Equipment $258 ($37) $1,203
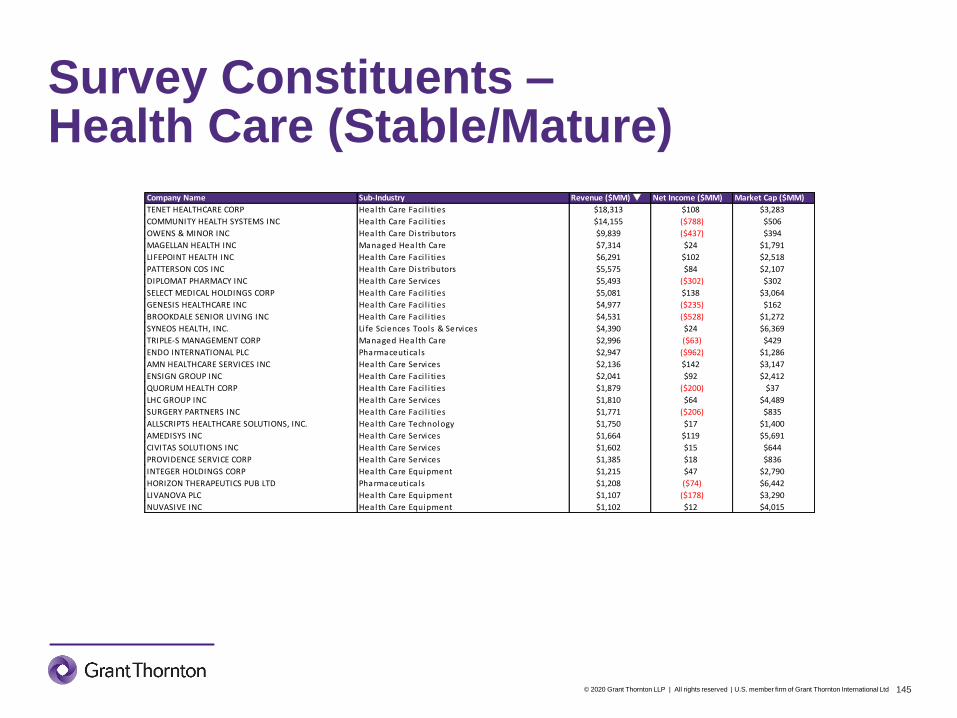
© 2020 Grant Thornton LLP | All rights reserved | U.S. member firm of Grant Thornton International Ltd 145
Survey Constituents –Health Care (Stable/Mature)
Company Name Sub-Industry Revenue ($MM) q Net Income ($MM) Market Cap ($MM)
TENET HEALTHCARE CORP Health Care Faci l i ties $18,313 $108 $3,283
COMMUNITY HEALTH SYSTEMS INC Health Care Faci l i ties $14,155 ($788) $506
OWENS & MINOR INC Health Care Dis tributors $9,839 ($437) $394
MAGELLAN HEALTH INC Managed Health Care $7,314 $24 $1,791
LIFEPOINT HEALTH INC Health Care Faci l i ties $6,291 $102 $2,518
PATTERSON COS INC Health Care Dis tributors $5,575 $84 $2,107
DIPLOMAT PHARMACY INC Health Care Services $5,493 ($302) $302
SELECT MEDICAL HOLDINGS CORP Health Care Faci l i ties $5,081 $138 $3,064
GENESIS HEALTHCARE INC Health Care Faci l i ties $4,977 ($235) $162
BROOKDALE SENIOR LIVING INC Health Care Faci l i ties $4,531 ($528) $1,272
SYNEOS HEALTH, INC. Li fe Sciences Tools & Services $4,390 $24 $6,369
TRIPLE-S MANAGEMENT CORP Managed Health Care $2,996 ($63) $429
ENDO INTERNATIONAL PLC Pharmaceutica ls $2,947 ($962) $1,286
AMN HEALTHCARE SERVICES INC Health Care Services $2,136 $142 $3,147
ENSIGN GROUP INC Health Care Faci l i ties $2,041 $92 $2,412
QUORUM HEALTH CORP Health Care Faci l i ties $1,879 ($200) $37
LHC GROUP INC Health Care Services $1,810 $64 $4,489
SURGERY PARTNERS INC Health Care Faci l i ties $1,771 ($206) $835
ALLSCRIPTS HEALTHCARE SOLUTIONS, INC. Health Care Technology $1,750 $17 $1,400
AMEDISYS INC Health Care Services $1,664 $119 $5,691
CIVITAS SOLUTIONS INC Health Care Services $1,602 $15 $644
PROVIDENCE SERVICE CORP Health Care Services $1,385 $18 $836
INTEGER HOLDINGS CORP Health Care Equipment $1,215 $47 $2,790
HORIZON THERAPEUTICS PUB LTD Pharmaceutica ls $1,208 ($74) $6,442
LIVANOVA PLC Health Care Equipment $1,107 ($178) $3,290
NUVASIVE INC Health Care Equipment $1,102 $12 $4,015

© 2020 Grant Thornton LLP | All rights reserved | U.S. member firm of Grant Thornton International Ltd 146
Survey Constituents –Industrials (Emerging/Growth)
Company Name Sub-Industry Revenue ($MM) q Net Income ($MM) Market Cap ($MM)
VICOR CORP Electrica l Components & Equipment $291 $32 $1,257
VIVINT SOLAR INC Electrica l Components & Equipment $290 ($16) $861
BG STAFFING INC Human Resource & Employment Services $287 $18 $197
WILLDAN GROUP INC Research & Consulting Services $272 $10 $375
MANITEX INTERNATIONAL INC Construction Machinery & Heavy Trucks $242 ($13) $118
EASTERN CO Industria l Machinery $234 $15 $153
FRANKLIN COVEY CO Research & Consulting Services $210 ($6) $474
PLUG POWER INC Electrica l Components & Equipment $175 ($78) $604
NORTHWEST PIPE CO Construction & Engineering $172 $20 $261
EVI INDUSTRIES INC Trading Companies & Dis tributors $150 $4 $402
ACACIA RESEARCH CORP Research & Consulting Services $132 ($105) $125
COMPX INTERNATIONAL INC Office Services & Suppl ies $118 $15 $173
NL INDUSTRIES Office Services & Suppl ies $118 ($41) $169
OMEGA FLEX INC Industria l Machinery $108 $20 $939
GENCOR INDUSTRIES INC Industria l Machinery $99 $13 $157
GRAHAM CORP Industria l Machinery $92 ($0) $193
FUELCELL ENERGY INC Electrica l Components & Equipment $89 ($47) $5
ENERGY RECOVERY INC Industria l Machinery $75 $22 $489
REIS INC Research & Consulting Services $48 ($3) $266
AMERICAN RAILCAR INDS INC Construction Machinery & Heavy Trucks $38 $142 $1,335
KEYW HOLDING CORP Aerospace & Defense $20 ($22) $562
PICO HOLDINGS INC Environmental & Faci l i ties Services $14 ($3) $199
ENERGOUS CORP Electrica l Components & Equipment $1 ($51) $99

© 2020 Grant Thornton LLP | All rights reserved | U.S. member firm of Grant Thornton International Ltd 147
Survey Constituents –Industrials (Mid-Size)
Company Name Sub-Industry Revenue ($MM) q Net Income ($MM) Market Cap ($MM)
BARRETT BUSINESS SVCS INC Human Resource & Employment Services $941 $38 $623
CBIZ INC Research & Consulting Services $922 $62 $1,269
COVENANT TRANSPORTATION GRP Trucking $885 $43 $276
HURON CONSULTING GROUP INC Research & Consulting Services $878 $14 $1,371
COLUMBUS MCKINNON CORP Industria l Machinery $876 $43 $801
STANDEX INTERNATIONAL CORP Industria l Machinery $868 $37 $868
ESTERLINE TECHNOLOGIES CORP Aerospace & Defense $843 $69 $3,636
LYDALL INC Industria l Machinery $786 $35 $388
INFRASTRUCTR & ENRGY ALT INC Construction & Engineering $779 $4 $95
SUNRUN INC. Electrica l Components & Equipment $760 $27 $1,899
HEIDRICK & STRUGGLES INTL Human Resource & Employment Services $736 $49 $486
MILLER INDUSTRIES INC/TN Construction Machinery & Heavy Trucks $712 $34 $353
PGT INNOVATIONS INC Bui lding Products $698 $54 $1,027
VSE CORP Divers i fied Support Services $697 $35 $355
KIMBALL INTERNATIONAL -CL B Office Services & Suppl ies $686 $34 $695
RESOURCES CONNECTION INC Research & Consulting Services $654 $19 $444
DUCOMMUN INC Aerospace & Defense $629 $9 $462
MERCURY SYSTEMS INC Aerospace & Defense $493 $41 $3,439
WAGEWORKS INC Human Resource & Employment Services $472 $26 $2,046
POWELL INDUSTRIES INC Electrica l Components & Equipment $449 ($7) $430
PREFORMED LINE PRODUCTS CO Electrica l Components & Equipment $421 $27 $256
NV5 GLOBAL INC Construction & Engineering $418 $27 $873
THERMON GROUP HOLDINGS INC Electrica l Components & Equipment $413 $23 $713
ENNIS INC Commercia l Printing $401 $37 $511
GENCO SHIPPING & TRADING Marine $368 ($33) $387
WILLIS LEASE FINANCE CORP Trading Companies & Dis tributors $348 $43 $341
CECO ENVIRONMENTAL CORP Environmental & Faci l i ties Services $337 ($7) $239
DMC GLOBAL INC Oi l & Gas Equipment & Services $326 $30 $591
ENPHASE ENERGY INC Semiconductor Equipment $316 ($12) $2,673
AEROVIRONMENT INC Aerospace & Defense $314 $42 $1,306
ALLIED MOTION TECHNOLOGIES Electrica l Components & Equipment $311 $16 $323
EAGLE BULK SHIPPING INC Marine $310 $13 $313
HURCO COS INC Industria l Machinery $301 $21 $215

© 2020 Grant Thornton LLP | All rights reserved | U.S. member firm of Grant Thornton International Ltd 148
Survey Constituents –Industrials (Stable/Mature)
Company Name Sub-Industry Revenue ($MM) q Net Income ($MM) Market Cap ($MM)
NAVISTAR INTERNATIONAL CORP Construction Machinery & Heavy Trucks $10,250 $340 $2,577
MASTEC INC Construction & Engineering $6,909 $260 $4,882
TUTOR PERINI CORP Construction & Engineering $4,455 $83 $701
QUAD/GRAPHICS INC Commercia l Printing $4,194 $9 $510
MERITOR INC Construction Machinery & Heavy Trucks $4,178 $120 $1,396
NEXEO SOLUTIONS INC Trading Companies & Dis tributors $4,034 $29 $891
DYCOM INDUSTRIES INC Construction & Engineering $3,128 $63 $1,423
APPLIED INDUSTRIAL TECH INC Trading Companies & Dis tributors $3,073 $142 $2,037
PRIMORIS SERVICES CORP Construction & Engineering $2,939 $77 $994
BLUELINX HOLDINGS INC Trading Companies & Dis tributors $2,863 ($48) $289
CIMPRESS NV Commercia l Printing $2,593 $44 $3,931
HNI CORP Office Services & Suppl ies $2,258 $93 $1,475
REXNORD CORP Industria l Machinery $2,051 $189 $2,695
GENERAC HOLDINGS INC Electrica l Components & Equipment $2,023 $238 $4,786
KORN FERRY Human Resource & Employment Services $1,974 $103 $2,003
ACCO BRANDS CORP Office Services & Suppl ies $1,941 $107 $972
ENGILITY HOLDINGS INC Aerospace & Defense $1,932 ($35) $1,076
ATKORE INTL GROUP INC Electrica l Components & Equipment $1,835 $137 $1,362
HARSCO CORP Industria l Machinery $1,722 $137 $1,362
SAIA INC Trucking $1,654 $105 $2,336
BARNES GROUP INC Industria l Machinery $1,496 $166 $2,485
TRITON INTERNATIONAL LTD Trading Companies & Dis tributors $1,433 $350 $2,540
APOGEE ENTERPRISES INC Bui lding Products $1,403 $46 $974
EVOQUA WATER TECH Industria l Machinery $1,340 $6 $1,758
KNOLL INC Office Services & Suppl ies $1,302 $73 $1,175
AMERICAN WOODMARK CORP Bui lding Products $1,250 $63 $1,562
H&E EQUIPMENT SERVICES INC Trading Companies & Dis tributors $1,239 $77 $946
ACTUANT CORP -CL A Industria l Machinery $1,183 ($22) $1,343
FEDERAL SIGNAL CORP Construction Machinery & Heavy Trucks $1,090 $94 $1,855
CHART INDUSTRIES INC Industria l Machinery $1,084 $54 $1,784
BABCOCK & WILCOX ENTERPRISES Heavy Electrica l Equipment $1,062 ($658) $697
STERLING CONSTRUCTION CO INC Construction & Engineering $1,038 $25 $383

© 2020 Grant Thornton LLP | All rights reserved | U.S. member firm of Grant Thornton International Ltd 149
Survey Constituents – Information Technology (Emerging/Growth)
Company Name Sub-Industry Revenue ($MM) q Net Income ($MM) Market Cap ($MM)
SAILPOINT TECHNOLOGIES HOLDINGS, INC. Systems Software $249 $4 $1,664
SPS COMMERCE INC Appl ication Software $248 $24 $828
WORKIVA INC Appl ication Software $244 ($50) $1,987
RAPID7 INC Systems Software $244 ($56) $2,298
Q2 HOLDINGS INC Appl ication Software $241 ($35) $3,254
SERVICESOURCE INTL INC IT Consulting & Other Services $238 ($25) $79
A10 NETWORKS, INC. Systems Software $232 ($28) $483
DIGI INTERNATIONAL INC Communications Equipment $228 $1 $374
BLACKLINE INC Appl ication Software $228 ($28) $2,574
ONESPAN INC Systems Software $212 $4 $571
PAR TECHNOLOGY CORP Electronic Equipment & Instruments $201 ($24) $359
PROS HOLDINGS INC Appl ication Software $197 ($64) $2,268
LIMELIGHT NETWORKS INC Internet Services & Infrastructure $196 $10 $331
BRIGHTCOVE INC Internet Services & Infrastructure $165 ($14) $393
CHANNELADVISOR CORP Appl ication Software $131 ($8) $253
AQUANTIA CORP Semiconductors $121 ($10) $470
IMMERSION CORP Technology Hardware, Storage & Periphera ls $111 $54 $235
TELENAV INC Appl ication Software $106 ($89) $213
USA TECHNOLOGIES INC Data Process ing & Outsourced Services $104 ($2) $397
MESA LABORATORIES INC Health Care Equipment $103 $7 $875
AXT INC Semiconductor Equipment $102 $10 $114
MAXWELL TECHNOLOGIES INC Electronic Manufacturing Services $90 ($44) $208
ASURE SOFTWARE INC Appl ication Software $89 ($8) $128
CEVA INC Semiconductors $78 $1 $614
CLEARFIELD INC Communications Equipment $78 $4 $162
EGAIN CORP Appl ication Software $61 ($2) $229
TELARIA INC Appl ication Software $55 ($9) $331
SHOTSPOTTER INC Appl ication Software $35 ($3) $230
VERITONE INC Appl ication Software $27 ($61) $63

© 2020 Grant Thornton LLP | All rights reserved | U.S. member firm of Grant Thornton International Ltd 150
Survey Constituents –Information Technology (Mid-Size)
Company Name Sub-Industry Revenue ($MM) q Net Income ($MM) Market Cap ($MM)
INFINERA CORP Communications Equipment $943 ($214) $942
NETSCOUT SYSTEMS INC Communications Equipment $910 ($73) $1,702
EXLSERVICE HOLDINGS INC Data Process ing & Outsourced Services $883 $57 $2,250
ROGERS CORP Electronic Components $879 $88 $2,417
CSG SYSTEMS INTL INC Data Process ing & Outsourced Services $875 $66 $1,668
BLACKBAUD INC Appl ication Software $849 $45 $4,418
TIVO CORP Systems Software $696 ($353) $918
3D SYSTEMS CORP Technology Hardware, Storage & Periphera ls $688 ($46) $869
VEECO INSTRUMENTS INC Semiconductor Equipment $542 ($407) $543
PHOTRONICS INC Semiconductor Equipment $535 $42 $699
HUBSPOT INC Appl ication Software $513 ($64) $6,643
TIVO INC Appl ication Software $490 $22 $0
CLOUDERA INC Appl ication Software $480 ($193) $2,344
CTS CORP Electronic Manufacturing Services $470 $47 $1,021
CALIX INC Communications Equipment $441 ($19) $341
POWER INTEGRATIONS INC Semiconductors $416 $70 $2,504
AVID TECHNOLOGY INC Technology Hardware, Storage & Periphera ls $413 ($11) $264
FARO TECHNOLOGIES INC Electronic Equipment & Instruments $408 $5 $806
XPERI CORP Semiconductor Equipment $406 ($0) $971
HARMONIC INC Communications Equipment $404 ($21) $538
PROGRESS SOFTWARE CORP /MA Systems Software $397 $63 $1,683
BOTTOMLINE TECHNOLOGIES INC Appl ication Software $394 $9 $1,574
MAXLINEAR INC Semiconductors $385 ($26) $1,493
PAYLOCITY HOLDING CORP Appl ication Software $368 $39 $5,061
NIC INC Data Process ing & Outsourced Services $345 $58 $1,342
ACACIA COMMUNICATIONS INC Communications Equipment $340 $5 $2,625
QAD INC Appl ication Software $333 $10 $890
NANOMETRICS INC Semiconductor Equipment $325 $58 $787
FORESCOUT TECH INC Systems Software $298 ($75) $1,771
CARBONITE INC Internet Services & Infrastructure $296 $8 $491
HACKETT GROUP INC IT Consulting & Other Services $286 $27 $472
DASAN ZHONE SOLUTIONS INC Communications Equipment $282 $3 $127
RUDOLPH TECHNOLOGIES INC Semiconductor Equipment $274 $45 $805
ALTERYX, INC. Appl ication Software $254 $28 $6,727
LIVEPERSON INC Appl ication Software $250 ($25) $2,371

© 2020 Grant Thornton LLP | All rights reserved | U.S. member firm of Grant Thornton International Ltd 151
Survey Constituents –Information Technology (Stable/Mature)
Company Name Sub-Industry Revenue ($MM) q Net Income ($MM) Market Cap ($MM)
SANMINA CORP Electronic Manufacturing Services $7,110 ($96) $2,023
INSIGHT ENTERPRISES INC Technology Dis tributors $7,080 $164 $1,970
DIEBOLD NIXDORF INC Technology Hardware, Storage & Periphera ls $4,579 ($569) $709
AMKOR TECHNOLOGY INC Semiconductor Equipment $4,316 $127 $2,289
SCANSOURCE INC Technology Dis tributors $3,846 $33 $751
CIENA CORP Communications Equipment $3,094 ($345) $5,692
TTM TECHNOLOGIES INC Electronic Manufacturing Services $2,847 $174 $1,232
UNISYS CORP IT Consulting & Other Services $2,825 $76 $354
BENCHMARK ELECTRONICS INC Electronic Manufacturing Services $2,566 $23 $1,133
TRAVELPORT WORLDWIDE LTD Data Process ing & Outsourced Services $2,551 $45 $1,993
MAXIMUS INC Data Process ing & Outsourced Services $2,392 $221 $4,726
MINDBODY INC Appl ication Software $2,187 ($15) $1,747
VIASAT INC Communications Equipment $2,068 ($68) $4,296
MANTECH INTL CORP IT Consulting & Other Services $1,959 $82 $2,707
SENDGRID INC Appl ication Software $1,936 ($6) $2,544
AVX CORP Electronic Components $1,792 $272 $2,536
SUNPOWER CORP Semiconductors $1,726 ($811) $1,441
PLANTRONICS INC Communications Equipment $1,675 ($136) $1,308
SYNAPTICS INC Semiconductors $1,630 ($124) $1,376
SYKES ENTERPRISES INC Data Process ing & Outsourced Services $1,626 $49 $1,235
ENTEGRIS INC Semiconductor Equipment $1,550 $241 $6,174
TTEC HOLDINGS INC Data Process ing & Outsourced Services $1,509 $36 $2,139
CREE INC Semiconductors $1,494 ($280) $4,772
KEMET CORP Electronic Manufacturing Services $1,383 $207 $1,130
FABRINET Electronic Manufacturing Services $1,372 $84 $1,796
CARDTRONICS PLC Data Process ing & Outsourced Services $1,345 $4 $1,331
FINISAR CORP Communications Equipment $1,280 ($53) $2,805
VIRTUSA CORP IT Consulting & Other Services $1,248 $16 $1,025
J2 GLOBAL INC Appl ication Software $1,207 $129 $4,335
II-VI INC Electronic Components $1,159 $88 $2,027
ENDURANCE INTL GRP HLDGS INC Internet Services & Infrastructure $1,145 $5 $551
OSI SYSTEMS INC Electronic Equipment & Instruments $1,089 ($29) $1,757
KIMBALL ELECTRONICS INC Electronic Manufacturing Services $1,072 $17 $359
ELECTRONICS FOR IMAGING INC Technology Hardware, Storage & Periphera ls $1,015 ($1) $1,585
METHODE ELECTRONICS INC Electronic Manufacturing Services $1,000 $92 $1,169

© 2020 Grant Thornton LLP | All rights reserved | U.S. member firm of Grant Thornton International Ltd 152
Survey Constituents –Materials (Emerging/Growth)
Company Name Sub-Industry Revenue ($MM) q Net Income ($MM) Market Cap ($MM)
BALCHEM CORP -CL B Specia l ty Chemicals $644 $79 $3,115
COEUR MINING INC Gold $626 ($49) $1,099
HECLA MINING CO Si lver $567 ($27) $971
MYERS INDUSTRIES INC Metal & Glass Containers $567 ($2) $573
HAWKINS INC Commodity Chemicals $504 ($9) $422
KMG CHEMICALS INC Specia l ty Chemicals $466 $65 $1,181
AMERICAN VANGUARD CORP Ferti l i zers & Agricultura l Chemicals $454 $24 $445
LIVENT CORP Specia l ty Chemicals $443 $126 $959
HAYNES INTERNATIONAL INC Steel $435 ($22) $425
LSB INDUSTRIES INC Divers i fied Chemicals $378 ($72) $145
FUTUREFUEL CORP Specia l ty Chemicals $291 $53 $488
TRECORA RESOURCES Commodity Chemicals $288 ($2) $219
CHASE CORP Specia l ty Chemicals $284 $43 $960
SYNALLOY CORP Steel $281 $13 $132
UNVL STAINLESS & ALLOY PRODS Steel $256 $11 $126
RAMACO RESOURCES INC Steel $228 $25 $133
INTREPID POTASH INC Ferti l i zers & Agricultura l Chemicals $208 $12 $419
UFP TECHNOLOGIES INC Paper Packaging $190 $14 $293
AGROFRESH SOLUTIONS INC Ferti l i zers & Agricultura l Chemicals $179 ($30) $98
FLOTEK INDUSTRIES INC Specia l ty Chemicals $178 ($73) $115
U S LIME & MINERALS Construction Materia ls $145 $27 $428
AMYRIS INC Specia l ty Chemicals $143 ($72) $256
GOLD RESOURCE CORP Gold $115 $9 $223
MARRONE BIO INNOVTIONS Ferti l i zers & Agricultura l Chemicals $21 ($20) $149
KAPSTONE PAPER & PACKAGING Paper Products $0 $244 $3,423
NOVAGOLD RESOURCES LTD Gold $0 ($31) $2,207

© 2020 Grant Thornton LLP | All rights reserved | U.S. member firm of Grant Thornton International Ltd 153
Survey Constituents –Materials (Mid-Size)
Company Name Sub-Industry Revenue ($MM) q Net Income ($MM) Market Cap ($MM)
COMPASS MINERALS INTL INC Divers i fied Metals & Mining $1,494 $69 $1,838
FORTERRA INC Construction Materia ls $1,480 ($24) $441
INNOSPEC INC Specia l ty Chemicals $1,477 $85 $2,126
SUNCOKE ENERGY INC Steel $1,451 $26 $335
SENSIENT TECHNOLOGIES CORP Specia l ty Chemicals $1,387 $157 $2,703
WARRIOR MET COAL INC Steel $1,378 $697 $996
MATERION CORP Divers i fied Metals & Mining $1,208 $21 $1,182
INGEVITY CORP Specia l ty Chemicals $1,134 $169 $3,344
GCP APPLIED TECHNOLOGIES INC Specia l ty Chemicals $1,125 ($16) $1,354
TREDEGAR CORP Commodity Chemicals $1,065 $25 $629
SCHWEITZER-MAUDUIT INTL INC Paper Products $1,041 $95 $1,108
NEENAH PAPER INC Paper Products $1,035 $37 $995
QUAKER CHEMICAL CORP Specia l ty Chemicals $868 $59 $2,036
GLATFELTER Paper Products $866 ($0) $607
INNOPHOS HOLDINGS INC Specia l ty Chemicals $802 $36 $590
OMNOVA SOLUTIONS INC Specia l ty Chemicals $770 $21 $452
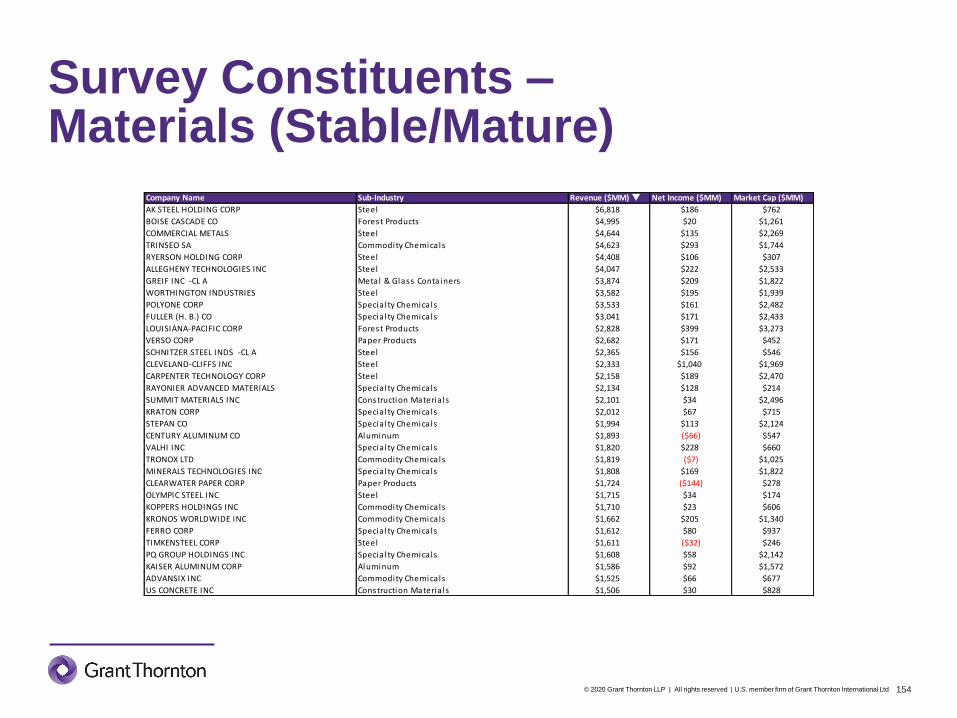
© 2020 Grant Thornton LLP | All rights reserved | U.S. member firm of Grant Thornton International Ltd 154
Survey Constituents –Materials (Stable/Mature)
Company Name Sub-Industry Revenue ($MM) q Net Income ($MM) Market Cap ($MM)
AK STEEL HOLDING CORP Steel $6,818 $186 $762
BOISE CASCADE CO Forest Products $4,995 $20 $1,261
COMMERCIAL METALS Steel $4,644 $135 $2,269
TRINSEO SA Commodity Chemicals $4,623 $293 $1,744
RYERSON HOLDING CORP Steel $4,408 $106 $307
ALLEGHENY TECHNOLOGIES INC Steel $4,047 $222 $2,533
GREIF INC -CL A Metal & Glass Containers $3,874 $209 $1,822
WORTHINGTON INDUSTRIES Steel $3,582 $195 $1,939
POLYONE CORP Specia l ty Chemicals $3,533 $161 $2,482
FULLER (H. B.) CO Specia l ty Chemicals $3,041 $171 $2,433
LOUISIANA-PACIFIC CORP Forest Products $2,828 $399 $3,273
VERSO CORP Paper Products $2,682 $171 $452
SCHNITZER STEEL INDS -CL A Steel $2,365 $156 $546
CLEVELAND-CLIFFS INC Steel $2,333 $1,040 $1,969
CARPENTER TECHNOLOGY CORP Steel $2,158 $189 $2,470
RAYONIER ADVANCED MATERIALS Specia l ty Chemicals $2,134 $128 $214
SUMMIT MATERIALS INC Construction Materia ls $2,101 $34 $2,496
KRATON CORP Specia l ty Chemicals $2,012 $67 $715
STEPAN CO Specia l ty Chemicals $1,994 $113 $2,124
CENTURY ALUMINUM CO Aluminum $1,893 ($66) $547
VALHI INC Specia l ty Chemicals $1,820 $228 $660
TRONOX LTD Commodity Chemicals $1,819 ($7) $1,025
MINERALS TECHNOLOGIES INC Specia l ty Chemicals $1,808 $169 $1,822
CLEARWATER PAPER CORP Paper Products $1,724 ($144) $278
OLYMPIC STEEL INC Steel $1,715 $34 $174
KOPPERS HOLDINGS INC Commodity Chemicals $1,710 $23 $606
KRONOS WORLDWIDE INC Commodity Chemicals $1,662 $205 $1,340
FERRO CORP Specia l ty Chemicals $1,612 $80 $937
TIMKENSTEEL CORP Steel $1,611 ($32) $246
PQ GROUP HOLDINGS INC Specia l ty Chemicals $1,608 $58 $2,142
KAISER ALUMINUM CORP Aluminum $1,586 $92 $1,572
ADVANSIX INC Commodity Chemicals $1,525 $66 $677
US CONCRETE INC Construction Materia ls $1,506 $30 $828

© 2020 Grant Thornton LLP | All rights reserved | U.S. member firm of Grant Thornton International Ltd 155
Survey Constituents –Real Estate (Emerging/Growth)
Company Name Sub-Industry Revenue ($MM) q Net Income ($MM) Market Cap ($MM)
RE/MAX HOLDINGS INC Real Estate Services $213 $27 $572
SERITAGE GROWTH PROPERTIES Retai l REITs $212 ($73) $1,561
INVESTORS REAL ESTATE TRUST Res identia l REITs $183 $0 $884
EASTERLY GOVERNMENT PPTYS Office REITs $161 $6 $1,478
CARETRUST REIT INC Health Care REITs $157 $58 $2,069
TERRENO REALTY CORP Industria l REITs $155 $63 $3,348
MONMOUTH REAL ESTATE INVESTMENT CORP Industria l REITs $153 $56 $1,360
CEDAR REALTY TRUST INC Retai l REITs $152 $4 $297
URSTADT BIDDLE PROPERTIES Retai l REITs $138 $37 $942
WHITESTONE REIT Retai l REITs $129 $21 $546
ST JOE CO Divers i fied Real Estate Activi ties $110 $32 $1,075
CLIPPER REALTY INC Res identia l REITs $110 ($4) $157
UMH PROPERTIES, INC. Res identia l REITs $91 ($36) $562
STRATUS PROPERTIES INC Real Estate Development $88 ($4) $231
CONSOLIDATED TOMOKA LAND CO Divers i fied Real Estate Activi ties $87 $39 $345
FORESTAR GROUP INC Real Estate Development $78 $69 $785
FARMLAND PARTNERS INC Specia l i zed REITs $56 $12 $212
TEJON RANCH CO Divers i fied Real Estate Activi ties $46 $4 $429
GRIFFIN INDUSTRIAL REALTY Real Estate Operating Companies $34 ($2) $191
JERNIGAN CAPITAL INC Specia l i zed REITs $33 $54 $387
INNOVATIVE INDUSTRIAL PPTYS Industria l REITs $16 $7 $755

© 2020 Grant Thornton LLP | All rights reserved | U.S. member firm of Grant Thornton International Ltd 156
Survey Constituents –Real Estate (Mid-Size)
Company Name Sub-Industry Revenue ($MM) q Net Income ($MM) Market Cap ($MM)
TANGER FACTORY OUTLET CTRS Retai l REITs $496 $44 $1,474
HERSHA HOSPITALITY TRUST Hotel & Resort REITs $496 $10 $546
COUSINS PROPERTIES INC Office REITs $487 $79 $3,900
REDFIN CORP Real Estate Services $487 ($42) $1,599
NEW SENIOR INVESTMENT GROUP Health Care REITs $484 ($159) $556
SELECT INCOME REIT Office REITs $470 $67 $659
HEALTHCARE REALTY TRUST INC Health Care REITs $451 $70 $4,331
QTS REALTY TRUST INC Specia l i zed REITs $451 ($4) $2,903
PHYSICIANS REALTY TR Health Care REITs $423 $56 $3,244
URBAN EDGE PROPERTIES Retai l REITs $422 $105 $2,419
PS BUSINESS PARKS Divers i fied REITs $415 $227 $4,938
RMR GROUP INC Divers i fied Real Estate Activi ties $405 $96 $720
FIRST INDL REALTY TRUST INC Industria l REITs $404 $163 $5,038
PREFERRED APARTMENT CMNTYS Res identia l REITs $397 $43 $623
LEXINGTON REALTY TRUST Divers i fied REITs $397 $227 $2,459
PENNSYLVANIA RE INVS TRUST Retai l REITs $374 ($110) $409
KITE REALTY GROUP TRUST Retai l REITs $354 ($47) $1,387
STAG INDUSTRIAL INC Industria l REITs $351 $93 $3,579
WASHINGTON REIT Divers i fied REITs $337 $26 $2,278
AMERICAN ASSETS TRUST INC Divers i fied REITs $331 $20 $2,257
NATIONAL STORAGE AFFILIATES Specia l i zed REITs $329 $14 $1,957
CHATHAM LODGING TRUST Hotel & Resort REITs $324 $31 $819
EASTGROUP PROPERTIES Industria l REITs $301 $89 $4,640
RETAIL OPPORTUNITY INVTS CP Retai l REITs $296 $43 $2,111
NATIONAL HEALTH INVESTORS Health Care REITs $295 $154 $3,573
ACADIA REALTY TRUST Retai l REITs $285 $31 $2,371
FRANKLIN STREET PROPERTIES Office REITs $276 $13 $936
RPT REALTY Retai l REITs $266 $18 $1,091

© 2020 Grant Thornton LLP | All rights reserved | U.S. member firm of Grant Thornton International Ltd 157
Survey Constituents –Real Estate (Stable/Mature)
Company Name Sub-Industry Revenue ($MM) q Net Income ($MM) Market Cap ($MM)
GEO GROUP INC Specia l i zed REITs $2,331 $145 $1,875
NEWMARK GROUP INC Real Estate Services $2,048 $107 $1,689
CORECIVIC INC Specia l i zed REITs $1,836 $159 $1,825
RLJ LODGING TRUST Hotel & Resort REITs $1,767 $189 $2,881
RYMAN HOSPITALITY PPTYS INC Hotel & Resort REITs $1,411 $265 $4,210
SUNSTONE HOTEL INVESTORS INC Hotel & Resort REITs $1,168 $250 $3,093
LASALLE HOTEL PROPERTIES Hotel & Resort REITs $1,105 $195 $3,539
XENIA HOTELS & RESORTS INC Hotel & Resort REITs $1,058 $194 $2,317
POTLATCHDELTIC CORP Specia l i zed REITs $975 $123 $2,854
CBL & ASSOCIATES PPTYS INC Retai l REITs $875 ($79) $260
DIAMONDROCK HOSPITALITY CO Hotel & Resort REITs $866 $88 $1,992
ALTISOURCE PORTFOLIO SOLTNS Real Estate Services $838 ($5) $369
PEBBLEBROOK HOTEL TRUST Hotel & Resort REITs $829 $13 $3,440
MARCUS & MILLICHAP INC Real Estate Services $815 $87 $1,406
ISTAR INC Divers i fied REITs $803 ($32) $857
KENNEDY-WILSON HOLDINGS, INC. Real Estate Operating Companies $774 $150 $3,244
WASHINGTON PRIME GROUP INC. Retai l REITs $724 $94 $759
HFF INC Real Estate Services $662 $116 $1,811
CHESAPEAKE LODGING TRUST Hotel & Resort REITs $598 $97 $1,651
SUMMIT HOTEL PROPERTIES INC Hotel & Resort REITs $567 $91 $1,234
MACK-CALI REALTY CORP Office REITs $534 $73 $1,959
PIEDMONT OFFICE REALTY TRUST Office REITs $528 $130 $2,616

© 2020 Grant Thornton LLP | All rights reserved | U.S. member firm of Grant Thornton International Ltd 158
Survey Constituents –Utilities (All)
Company Name Sub-Industry Revenue ($MM) q Net Income ($MM) Market Cap ($MM)
NEW JERSEY RESOURCES CORP Gas Uti l i ties $2,915 $233 $3,904
SOUTHWEST GAS HOLDINGS INC Gas Uti l i ties $2,880 $182 $4,764
PORTLAND GENERAL ELECTRIC CO Electric Uti l i ties $1,991 $212 $5,096
SPIRE INC Gas Uti l i ties $1,965 $214 $4,275
BLACK HILLS CORP Multi -Uti l i ties $1,754 $265 $4,748
SOUTH JERSEY INDUSTRIES INC Gas Uti l i ties $1,641 $18 $2,965
ONE GAS INC Gas Uti l i ties $1,634 $172 $5,009
ALLETE INC Electric Uti l i ties $1,499 $174 $4,493
PNM RESOURCES INC Electric Uti l i ties $1,437 $86 $4,144
AVISTA CORP Multi -Uti l i ties $1,397 $136 $3,156
IDACORP INC Electric Uti l i ties $1,371 $227 $5,522
NORTHWESTERN CORP Multi -Uti l i ties $1,192 $197 $3,775
SPARK ENERGY INC Electric Uti l i ties $1,006 ($1) $133
OTTER TAIL CORP Electric Uti l i ties $916 $82 $2,184
EL PASO ELECTRIC CO Electric Uti l i ties $904 $84 $2,721
NORTHWEST NATURAL GAS CO Gas Uti l i ties $781 ($56) $2,015
TERRAFORM POWER INC Renewable Electrici ty $767 $12 $3,568
ORMAT TECHNOLOGIES INC Renewable Electrici ty $719 $98 $3,840
CHESAPEAKE UTILITIES CORP Gas Uti l i ties $717 $57 $1,530
NORTHWEST NATURAL HLDNG CO Gas Uti l i ties $706 $67 $2,026
CALIFORNIA WATER SERVICE GP Water Uti l i ties $698 $66 $2,644
MGE ENERGY INC Electric Uti l i ties $560 $84 $2,654
PATTERN ENERGY GROUP INC Renewable Electrici ty $477 $142 $2,620
UNITIL CORP Multi -Uti l i ties $444 $33 $933
AMERICAN STATES WATER CO Water Uti l i ties $437 $64 $3,466
SJW GROUP Water Uti l i ties $398 $39 $2,073
ATLANTIC POWER CORP Independent Power Producers & Energy Traders $282 $37 $257
AQUAVENTURE HOLDINGS LTD Water Uti l i ties $146 ($21) $522
MIDDLESEX WATER CO Water Uti l i ties $138 $32 $1,071
CONNECTICUT WATER SVC INC Water Uti l i ties $118 $17 $844
ARTESIAN RESOURCES -CL A Water Uti l i ties $80 $14 $345
CONSOLIDATED WATER CO INC Water Uti l i ties $66 $10 $243
RGC RESOURCES INC Gas Uti l i ties $66 $7 $241
YORK WATER CO Water Uti l i ties $48 $13 $563
PURE CYCLE CORP Water Uti l i ties $7 $0 $264
CADIZ INC Water Uti l i ties $0 ($26) $306

© 2020 Grant Thornton LLP | All rights reserved | U.S. member firm of Grant Thornton International Ltd 159
About UsThe professionals within the Human Capital Services (HCS) practice have extensive experience with compensation, in
addition to health & welfare, retirement, human resources, and employment tax issues. The Grant Thornton HCS practice
is a full-service human capital consulting provider, but we also provide advice and counsel via our other lines of service in
Audit, Tax, and Business Advisory services. Our collective background and credentials include public sector decision-
makers, accountants, actuaries, ERISA practitioners, technology practitioners, former private-sector compensation and
benefit administrators, and former IRS and other regulatory agency officials.
Survey Team:
Eric Gonzaga, Managing Principal, National Compensation Consulting Practice
Eric Myszka, West Region Leader, Senior Manager
Rob Storrick, Manager
Jordan Bridges, Senior Associate
Nick Martell, Senior Associate
Mason Hodges, Associate
Phil Tsien, Associate

© 2020 Grant Thornton LLP | All rights reserved | U.S. member firm of Grant Thornton International Ltd160
Eric Gonzaga
Managing Principal
Human Capital Services
T +1 612 677 5336
Eric Myszka
West Region Leader
Human Capital Services
T +1 949 431 9031
Rob Storrick
Manager
Human Capital Services
T +1 612 677 5105
Contact Us

“Grant Thornton” refers to Grant Thornton LLP, the U.S. member firm of Grant Thornton International Ltd (GTIL), and/or refers to the brand under which the independent network of GTIL member firms provide services to
their clients, as the context requires. GTIL and each of its member firms are not a worldwide partnership and are not liable for one another’s acts or omissions. In the United States, visit grantthornton.com for details.
© 2020 Grant Thornton LLP | All rights reserved | U.S. member firm of Grant Thornton International Ltd