Embed Size (px)
Citation preview

Proximus Group Company presentation
November 2017

2
Fit for Growth Strategy - key achievements 3
Zoom in on Q3’17 Group highlights 23
Consumer segment 34
Enterprise segment 50
Wholesale 57
BICS 58
Additional information 61
Regulation 62
BICS acquisition of TeleSign 64
Headcount evolution 66
Corporate Social Responsibility 67
Pricing 68
Spectrum 73
Shareholder structure & remuneration 74
Contact details 75
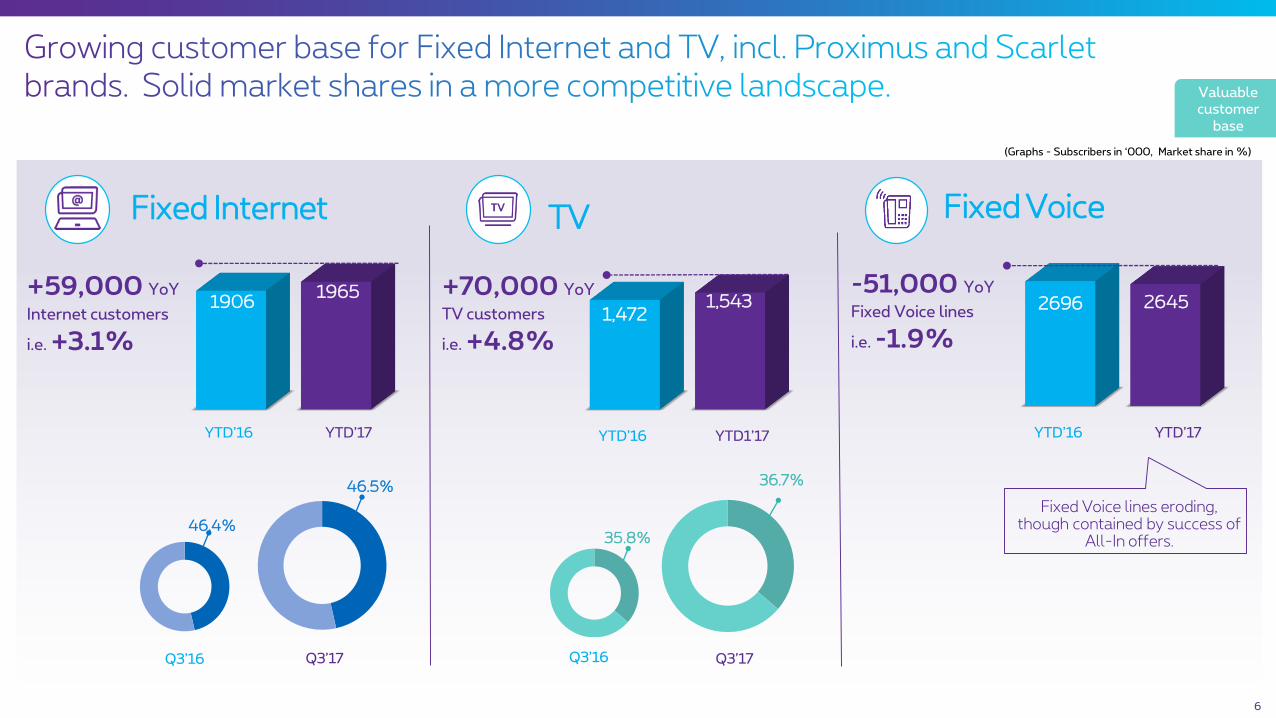
We rebranded to Proximus and adopted a multi-brand strategy
We grew a valuable converged customer base and improved our market position, while keeping a sound pricing strategy
We put high focus on bringing superior customer experience.
Innovative solutions to secure future growth
We further enhanced our high-quality networks and launched a future-proof fiber roll-out.
We transform and simplify to structurally reduce the cost base
Achieving EBITDA growth, in spite of regulatory pressure
We generate solid FCF, allowing for investments and attractive shareholder return, while maintaining a sound financial position
We connect everyone and everything so people live better and work smarter
Enhanced networks
Reducing costs
Customer experience
Sound FCF & financial
position
Valuable customer
base
EBITDA growth
Multi brands
3
Innovation

Our complementary brands meet the demandsof a wide range of customers
Best quality and service with a full choice of features – bringing consumers and businesses instantly close to what matters.
4
Dual-brand strategy in Belgium
BelgiumNetherlandsLuxembourg
GlobalLuxembourg
The Proximus Group telecom operator in Luxembourg, offering fixed, mobile and convergent services.
Best-in-class international wholesale solutions for voice and mobile data service providers. Expertise in Security and CPAAS solutions.
Specialised in ICT, delivering access, connectivity and data center solutions combined with managed services and multi-vendor support.
No frills offering for customers looking for the best prices.
Multi brands

— Convergent offerings that have evolved
from discount to product features
Dual-brand strategy in Belgium
No frills, no convergent standard offering, low priced
Postpaid Red + Data Boost
4P @€52
4P @ €101.94 @ €39
@ €13
+
TV: ~80 linear channelsTV Replay
TV bundle of choice1 blockbuster/month
+Fixed Voice line: National & International
free calls to Fix & Mob in EV & WE Free family calls
+Internet: Unlimited volume
Down 100Mbps - Up 15Mbps
Mobile:unlimited min & SMS
Free Family calls 10 GB
Favorite app
TV: ~30 channels+
Fixed Voice line: Free calls to fix Off Peak+
Internet: Unlimited volume Down 50 Mbps
Up 4 Mbps
Mobile:150 min
1000 SMS1.5 GB
Multi brands
5
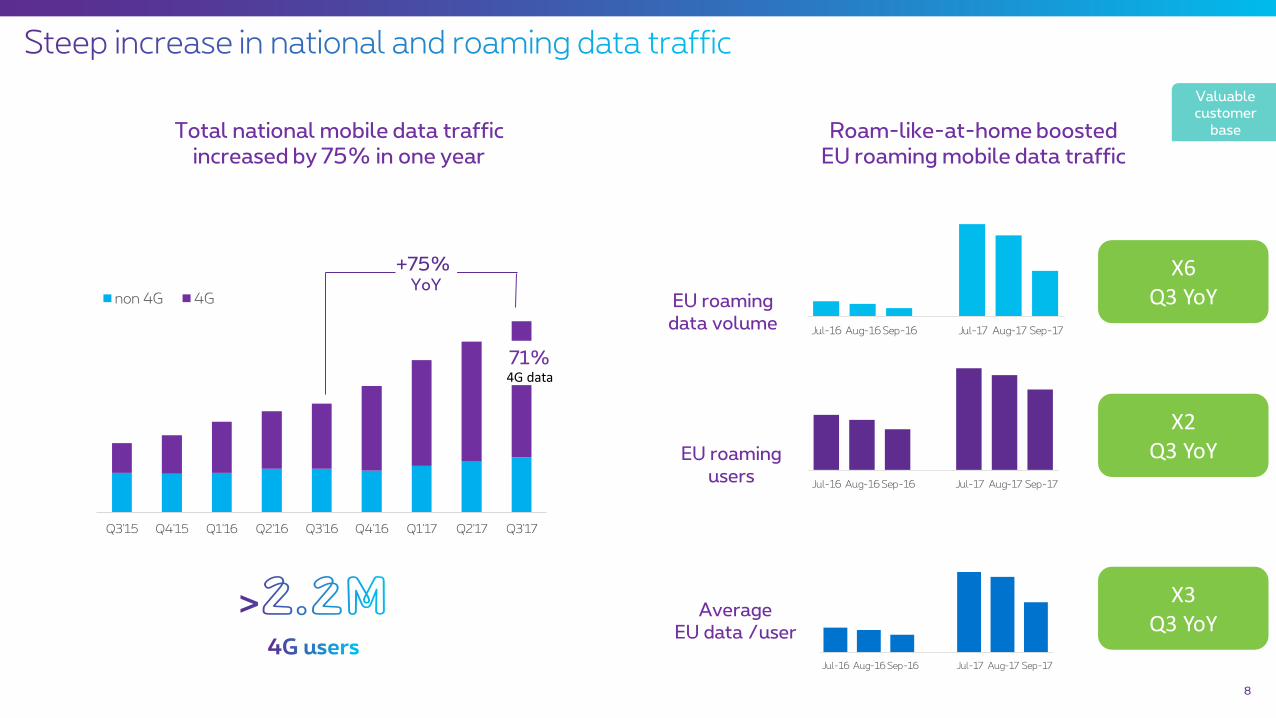
+59,000 YoY
Internet customers
i.e. +3.1%
-51,000 YoY
Fixed Voice lines
i.e. -1.9%
6
Fixed Internet TV Fixed Voice
46.4%
46.5%
35.8%
36.7%
19061965
YTD’17YTD’16
Q3’17Q3’16
1,4721,543
YTD1’17YTD’16
Q3’17Q3’16
2696 2645
YTD’17YTD’16
(Graphs - Subscribers in ‘000, Market share in %)
+70,000 YoY
TV customers
i.e. +4.8%
Valuable customer
base
Fixed Voice lines eroding, though contained by success of
All-In offers.

7
Retention and churn managementDevelopment of value
National Mobile data usage (av. Mb/m)
Smartphone Penetration
Tariff migration management Prepaid to Postpaid conversion Real time data option selling
via app
Mobile Postpaid Churn under control in spite of intense competition.
Acquisition value management
Strong Postpaid Market Share43.1%
YTD’17YTD’16
43.4%
Growing Postpaid park
Share of Medium & High Tier in total Mobile Voice Park growing YoY
3669 3860
+191KYoY or+5.2%
YTD’16 YTD’17
All devices4G-devices
14.9% 15.1%
YTD'16 YTD'17
10.1% 10.2%
YTD'16 YTD'17
Consumer Enterprise
4G users 3G & 4G users884
895
YTD'16 YTD'17
+1.2%
Mobile PostpaidService revenue up, including significant roaming regulation impact
Mobile Postpaid Service revenue Consumer + Enterprise (M€)
Valuable customer
base
65%71%
16Q3 17Q3
45%59%
16Q3 17Q3
Total national mobile data traffic increased by 75% in one year
Q3'15 Q4'15 Q1'16 Q2'16 Q3'16 Q4'16 Q1'17 Q2'17 Q3'17
non 4G 4G
71%4G data
+75% YoY
Roam-like-at-home boosted EU roaming mobile data traffic
EU roamingusers
EU roamingdata volume
Average EU data /user
X2 Q3 YoY
X6 Q3 YoY
X3Q3 YoY
Jul-16 Aug-16 Sep-16 Jul-17 Aug-17 Sep-17
Jul-16 Aug-16 Sep-16 Jul-17 Aug-17 Sep-17
Jul-16 Aug-16 Sep-16 Jul-17 Aug-17 Sep-17
Valuable customer
base
8
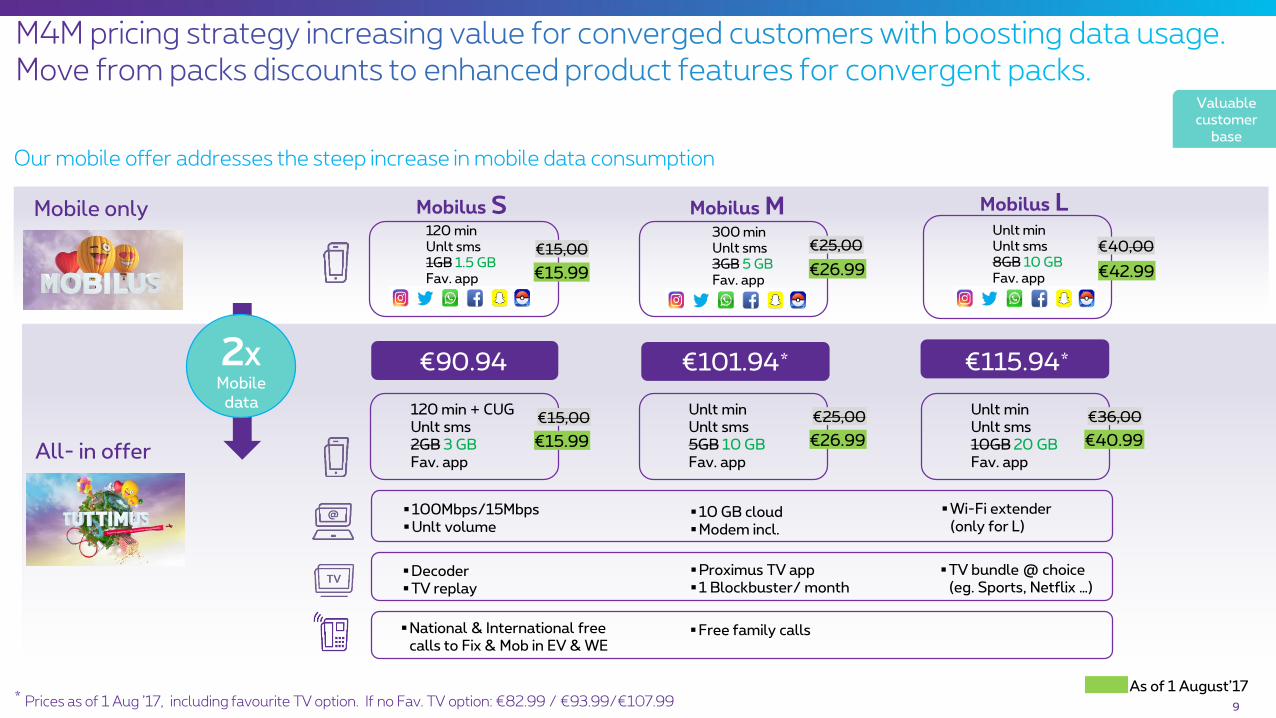
All- in offer
As of 1 August’17
€15.99
€15,00120 min + CUGUnlt sms2GB 3 GBFav. app
€26.99
€25,00Unlt minUnlt sms5GB 10 GBFav. app
€40.99
€36,00Unlt minUnlt sms10GB 20 GBFav. app
€90.94* €101.94* €115.94*2XMobile
data
* Prices as of 1 Aug ’17, including favourite TV option. If no Fav. TV option: €82.99 / €93.99/€107.99
100Mbps/15MbpsUnlt volume
10 GB cloudModem incl.
Decoder TV replay
Proximus TV app1 Blockbuster/ month
TV bundle @ choice (eg. Sports, Netflix …)
Wi-Fi extender (only for L)
National & International free calls to Fix & Mob in EV & WE
Free family calls
Mobile only Mobilus S
€15.99
€15,00
120 minUnlt sms1GB 1.5 GBFav. app
Mobilus M
€26.99
300 minUnlt sms3GB 5 GBFav. app
€25,00
Mobilus L
€42.99
€40,00Unlt minUnlt sms8GB 10 GBFav. app
Our mobile offer addresses the steep increase in mobile data consumption
Valuable customer
base
9

YTD'16 YTD'17
1158 1111
445 413
774 744
605 673
4-Play
3-Play
2-Play
1-Play
10
2,951 2,942
HH/SOin ‘000
Solid increase in number of HH/SO taking 4 Plays
Strong uptake of all-in offers, increasing 4-Play HH/SO
Higher revenue per HH/SO Driven by uptake in 4-Play at higher ARPH
More Plays results in lower full-churn levels
Tuttimus/BizzAll-in
subscribers in ‘000
22.7%
11.7% 10.1% 3.1%
1P 2P 3P 4P
Valuable customer
base
124192
255306
Jan-17 Mar-17 Jun-17 Sep-17
115.5 € 116.4 €
79.8 €76.6 €
66.6 € 67.7 €
58.9 58.5
36.8 € 36.3 €Q3'16 Q3'17
4-Play 3-Play Total 2-Play 1-Play
HH/SO: Households and Small Offices RGU: Revenue Generating Units ARPH: Average Revenue per Household/Small Office

best convergent network with national reach
fiber roll out
dynamically guide customers in their voice & UC journey (from Telco to applications)
convergent ICT solutions
seasoned Benelux integrator
adding application capability
deep API expertise to digitize solutions portfolios (Enco.io)
building a strong European Smart Mobility player (BeMobile)
continued IOT expansion
broad account based sales channel
managed services and SLAs
major ICT outsourcing contracts in BeLux
strong and expanding security expertise (Da Vinsi Labs)
strong partnerships (Vodafone, Cisco, Microsoft, …)
…with a big opportunity
11
An increasingly challenging enterprise environment
• competitors ambition to make inroads in our leading market shares
• fixed voice erosion due to VoIP• fragmented IT market increasingly driven by applications• regulatory pressure
digital transformation is our customers' first priority
Future proof communication portfolio
E2E service provider bringing peace of mind
Digital Transformation Partner
Strengths
387m38% 642m
62%
YTD’17
357m35%
662m65%
YTD’16
ICT* Telco
*ICT and Advanced Business services (BeMobile, Big data)
1,019m 1,029m+1.0%
Valuable customer
base
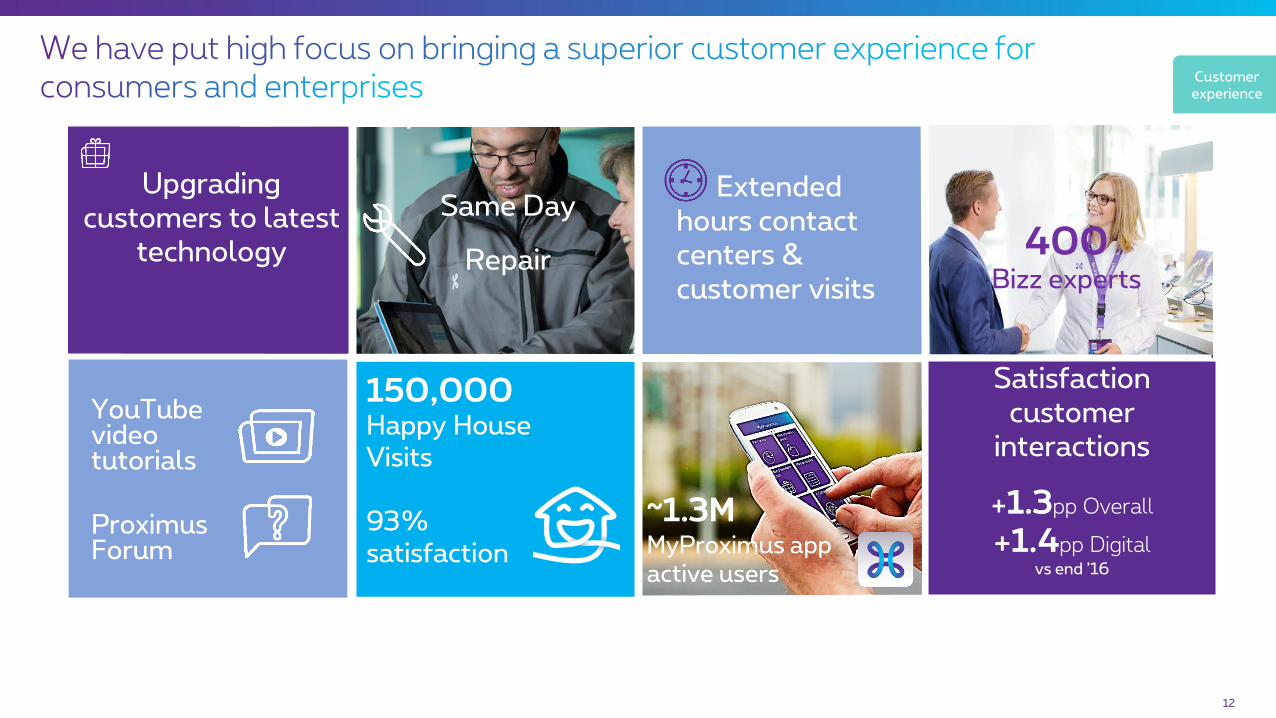
Upgrading customers to latest
technology
12
Same Day
Repair
Extended hours contact centers & customer visits
Full Install,
1st time right
150,000 Happy House Visits
93% satisfaction
~1.3MMyProximus appactive users
Satisfactioncustomer
interactions
+1.3pp Overall
+1.4pp Digital vs end ’16
400Bizz experts
Proximus Forum
YouTube videotutorials
Customer experience

W
Attractivekids offer
French & Dutchco-productions
Large international& national sports offer
Complementarymovies & seriesoffer
Customer experience
13

14
IoT
MyThingsUnified Communication and Cloud
Smart Mobility
Be-Mobile
Smart Home
Enabling company
Innovation
SecuritySmart advertising
Application development
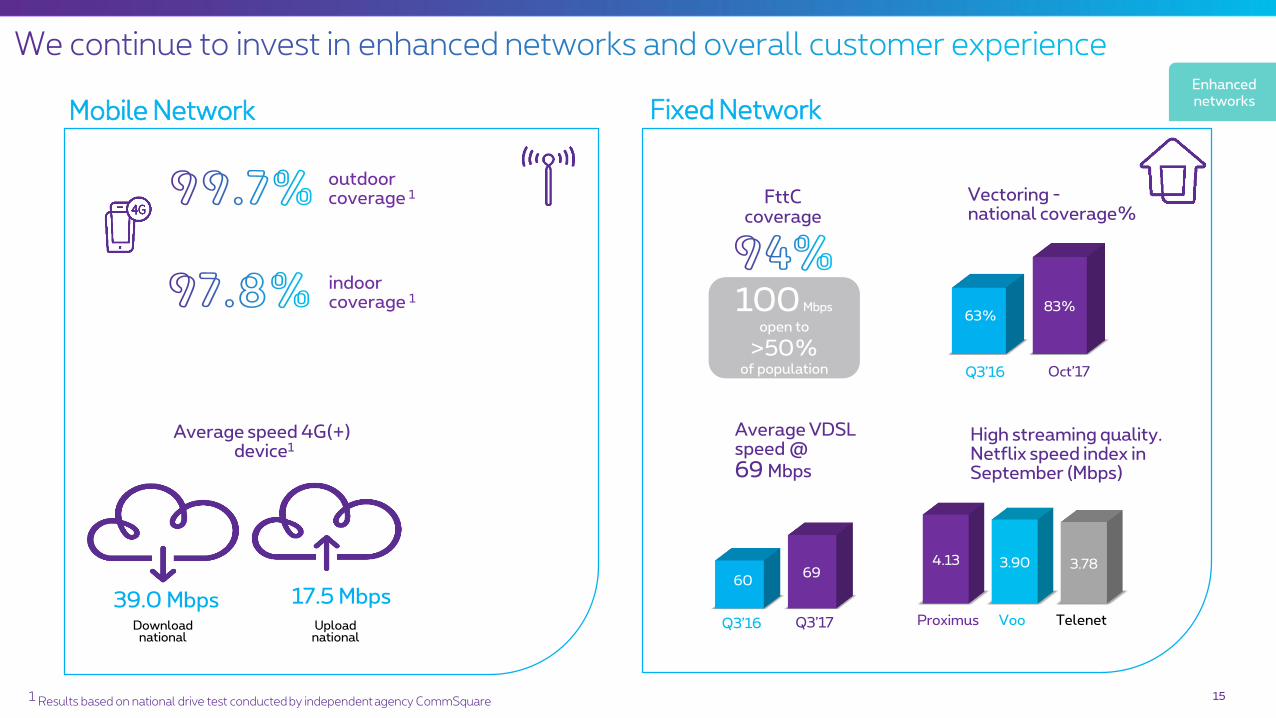
151 Results based on national drive test conducted by independent agency CommSquare
Enhanced networks
63%83%
Oct’17Q3’16
Vectoring -national coverage%
FttC coverage
Uploadnational
Downloadnational
outdoor coverage 1
indoorcoverage 1
Average speed 4G(+)device1
Fixed Network
6069
Q3’17Q3’16
Average VDSL speed @69 Mbps
4.13 3.90 3.78
TelenetVooProximus
High streaming quality.Netflix speed index in September (Mbps)
17.5 Mbps39.0 Mbps
100 Mbps
open to
>50%of population
Mobile Network

Enterprise Residential
In densecity areas
Integrated Fiber-To-The-Home & Business (FTTH&Bus)
Outside dense city areas
Fiber-To-The-Business (FTTBus) Fiber-To-The-Curb (FTTC)
Fiber coverage ambition with initial priority
given to FTTBus
16
• GPON to serve all businesses & living units
• Wall mounting & underground roll-out
• Switch-off existing copper in mid-long term to lower costs
3 years 5 years 10 years 15 years
From FTTH in dense city areas and FTTH Greenfields
7%
~18%
>50%
~40%
• GPON to clusters of businesses
• P2P to individual business sites upon request
• Densify the network to shorten average distance to the optical node (from 530m to <350m)
• Upgrade performance through ultra-vectoring
From FTTH&Bus in dense city areas and FTTBus outside cities
3 years 5 years 10 years
40%
~65%
>85%
Sup Business ARPU uplift Lower churn
Consumer market share uplift Structural lower network cost
Supporting topline, lowering costs 16
Enhanced networks

Partly offset by…
Company-wide cost program resulted in further OPEX savings:
17
• Volume-driven costs• Capacity driven maintenance costs• Opex linked to mobile spectrum licenses• Opex linked to Fiber roll-out• New taxes on e.g. electricity, real-estate• New skills needed for innovative
solutions• Inflation-based wage indexations &
higher pension cost
Decrease in Domestic OPEX 2016 and YTD 2017 in M€
FTE
Reducing costs
Headcount reduction, supported by Early leave plan prior to retirement
Network efficiencies leading to lower electricity, maintenance and repair costs
1116
957
574
364
all switches to be powered down end’17
Done
YE13 YE14 YE15 YE16 YE17
24 buildings
sold *
Ongoing digital transformation
MyProximusapp
E-Billing
Online salesincreasing
YTD’16
YTD’17
+26%
~ 1.3M active users
Call center volume deflation
14,090
13,599
13,120
Q4'15 Q3'16 Q3'17
1,226
1,766
-59
1,7071,282
-56
FY'15 FY'16 YTD'16 YTD'17
*Of which 19 technical buildings
-4.4%-3.4%
Website
Digital inter-
actions
1st call right
IVR
Improved experience to reduce ‘waste’
volumes
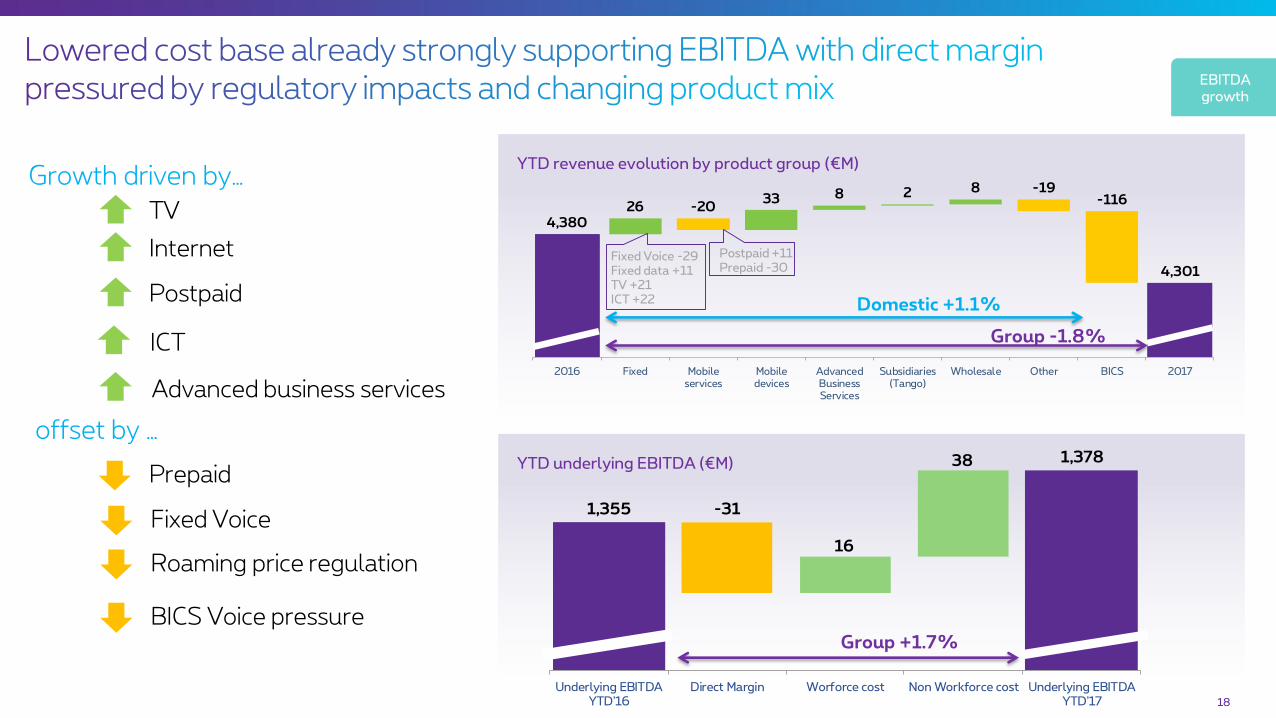
YTD underlying EBITDA (€M)
1,355
1,378
-31
16
38
Underlying EBITDAYTD'16
Direct Margin Worforce cost Non Workforce cost Underlying EBITDAYTD'17
YTD revenue evolution by product group (€M)
18
Roaming price regulation
Fixed Voice
TV
Internet
Postpaid
Prepaid
ICT
Advanced business services
BICS Voice pressure
Growth driven by…
offset by …
EBITDA growth
4,380
4,301
26 -2033 8 2 8 -19
-116
2016 Fixed Mobileservices
Mobiledevices
AdvancedBusinessServices
Subsidiaries(Tango)
Wholesale Other BICS 2017
Group -1.8%
Domestic +1.1%
Fixed Voice -29Fixed data +11TV +21ICT +22
Postpaid +11Prepaid -30
Group +1.7%
19
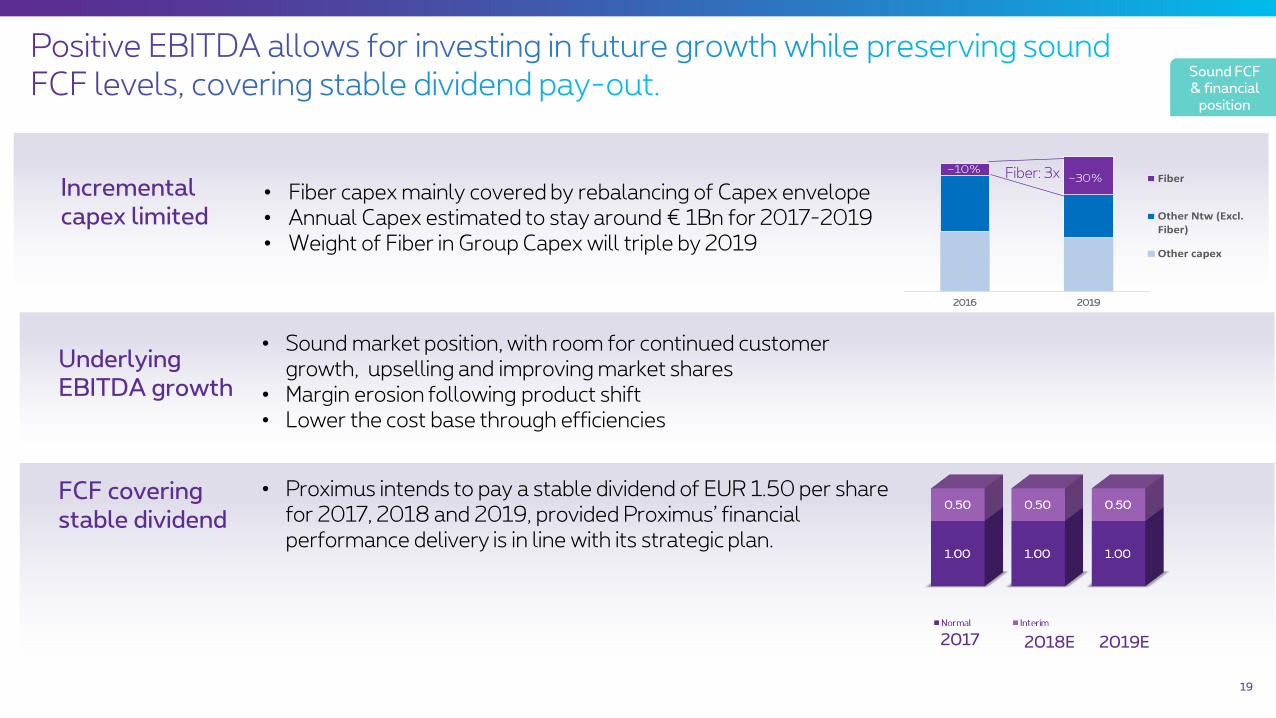
• Sound market position, with room for continued customer growth, upselling and improving market shares
• Margin erosion following product shift• Lower the cost base through efficiencies
• Fiber capex mainly covered by rebalancing of Capex envelope• Annual Capex estimated to stay around € 1Bn for 2017-2019• Weight of Fiber in Group Capex will triple by 2019
Underlying EBITDA growth
2016 2019
Fiber
Other Ntw (Excl.Fiber)
Other capex
~10%~30%Fiber: 3x
Incremental capex limited
FCF covering stable dividend
• Proximus intends to pay a stable dividend of EUR 1.50 per share for 2017, 2018 and 2019, provided Proximus’ financial performance delivery is in line with its strategic plan.
2017 2018E 2019E
Sound FCF & financial
position

20
• Credit ratings: Standard & Poor’s A, Moody’s A1, both stable outlook
• Proximus issued a new €500m 5y Eurobond at 0.5% in March 2017
Net Debt (YTD, M€)
Net debt/EBITDA
Debt maturity schedule (M€)
Sound FCF & financial
position
405500
100
600
500
15011
2018 2019 2020 2021 2022 2023 2024 2025 2026 2027 2028
Institutional Eurobonds Ұ private placement
-1,733-1,919
559 -485
-26 11
-1,861
480 -326
-32 6
Net Debt DEC2015 FCF Dividends
Dividends tonon-controlling
interests OtherNet Debt DEC
2016 FCF Dividends
Dividends tonon-controlling
interests OtherNet Debt SEP
2017

21
EMTN bonds
• € 531m Investments, Cash and cash equivalents
• EMTN Programme: 3.500m (2,255m outstanding)
• Committed credit line (bilaterals/club/syndicate): € 710 m
• CP Programme: € 1.000m
Liquidity at end-September 2017
Average debt duration Weighted average coupon
405M EUR 7 years 7 February 2018 3.875% BE6215434620
500M EUR 5 years 22 March 2022 0.500% BE0002273424
100M EUR 10 years 22 May 2023 2.256% BE6252911977
600M EUR 10 years 4 April 2024 2.375% BE6265262327
500M EUR 10 years 1 October 2025 1.875% BE0002237064
150M EUR 15 years 20 March 2028 3.190% BE6251142749
Amount Tenor Maturity Coupon ISIN
Sound FCF & financial
position

22
With financials over the first nine months of 2017 in line with estimations, Proximus is confident of closing the year with nearly stable Domestic revenue and slightly growing Group EBITDA, supported by its cost reduction plan. Proximus’ Group Capex for the year 2017 is expected to be around EUR 1 billion, excluding the capitalization of football broadcasting rights.
Group
Domestic underlying revenue €4,410m Nearly stable +1.1%
Group underlying EBITDA €1,796m Slight growth +1.7%
Capex €949m Around €1Bn* €707m**
Guidance metrics Actuals FY'16 Outlook FY'17YTD'17
Achievement
* Capex outlook excludes the capitalization of the Jupiler League football broadcasting rights** Actuals 2017 include the capitalization of the Jupiler League football broadcasting rights for the next three seasons, acquired mid-May 2017
Outlook
Proximus Board of Directors approved to return to the shareholders a total gross interim dividend of EUR 0.50 per share:
• Ex-coupon date: 6 December 2017• Record date: 7 December 2017 • Payment date: 8 December 2017
Proximus expects to return over 2017 a total gross dividend per share of €1.50, in line with the announced three-year commitment.
Dividend

Q3 2017 results

24
Domestic revenue stable at €1,105m
+ Growing base for Fixed Data and TV
+ ICT revenue growth+ Postpaid services growth Fixed Voice erosion Mobile Prepaid revenue
loss
BICS revenue -12.1%+ Increase non-Voice
revenue on A2P2 volumes- Voice erosion, less
favorable destination mix, USD effect
Group Revenue1
€1,441m-3.2% YoY
GroupEBITDA1
€464m-2.2% YoY
Capex€205m
FCF€267m
Commercial drivers
+ 9,000TV Households (unique customers)
+ 7,000Fixed Internet Lines
+20,000Mobile Postpaid cards
- 95,000Mobile Prepaid cards
- 26,000Fixed Voice lines
+ 8,0003 & 4-Play Households/ Small offices, i.e. 48% of total base
Domestic EBITDA of € 426m, -1.9% YoY
+ Lower expenses ,-1.4% on low comparable base
− Lower direct margin (-1.7%) on unfavorable revenue mix
BICS EBITDA -5.0% YoY
+ Lower expenses (-3.5%)
– Lower direct margin (-4.3%)
YTD FCF of €480m
+ Higher underlying EBITDA
+ Less cash paid for Capex
– Higher income tax (incl higher legal pre-payments)
Capex YTD of €707m
Jupiler League soccer broadcasting rights for 3 seasons
Simplification and transformation
Enhancing Mobile and Fixed networks
Fiber roll-out
1 underlying basis 2 Application to Person messages

1,487
1,441
-1 1 5 -6 -46
UnderlyingQ3'16
Consumer Enterprise Wholesale Other BICS UnderlyingQ3'17
25
Consumer: -0.1% YoY
+ Continued growth for TV, Internet, and Mobile postpaid
Fixed voice revenue decline on a reduced customer base and lower usage
Loss in Mobile Prepaid revenue prompted by the identification legislation.
Enterprise: +0.4% YoY
+ Growth in ICT and Advanced Business Services
Erosion legacy Fixed Voice and data
Mitigated pressure on mobile services revenue (roaming regulation)
Wholesale: +9.5% YoY
+ Increase in roaming-in revenue
- Decline in traditional wholesale products
Q3’17 revenue -12.1%YoY+ Strong increase in A2P*
volumes, leading to a solid 7.9% increase in non-Voice revenue
- Further erosion in Voice traffic, combined with a less favorable destination mix, and negative USD currency effect
Group -3.2%
Domestic +0.0%
Group revenue by quarter (M€ & YoY %) Group revenue by segment (M€)
Domestic
Group
1,117 1,077 1,101 1,105 1,127 1,111 1,105 1,105
385 356 359 382 363 332 312 336
1,502 1,433 1,460 1,487 1,490 1,443 1,417 1,441
-0.3% -3.1% -3.0% -1.4% -0.8% 0.7% -2.9% -3.2%
Q4'15 Q1'16 Q2'16 Q3'16 Q4'16 Q1'17 Q2'17 Q3'17
Domestic BICS
* Application to Person

1,487
1,441
3 -4 5 2 -1 5 -11-46
2016 Fixed Mobileservices
Mobiledevices
AdvancedBusinessServices
Subsidiaries(Tango)
Wholesale Other BICS 2017
26
Group -3.2%
Domestic +0.0%
* Advanced Business Services groups new solutions offered aside from traditional Telecom and ICT, such as smart mobility solutions (BeMobile), Road User Charging, Converging Solutions, Big data.
( in M€ )
Group
YTD
Q3
Postpaid +5Prepaid -9
Fixed Voice -12Fixed data +4TV +6ICT +6
4,380
4,301
26 -2033 8 2 8 -19
-116
2016 Fixed Mobileservices
Mobiledevices
AdvancedBusinessServices
Subsidiaries(Tango)
Wholesale Other BICS 2017
Group -1.8%
Domestic +1.1%
Fixed Voice -29Fixed data +11TV +21ICT +22
Postpaid +11Prepaid -30
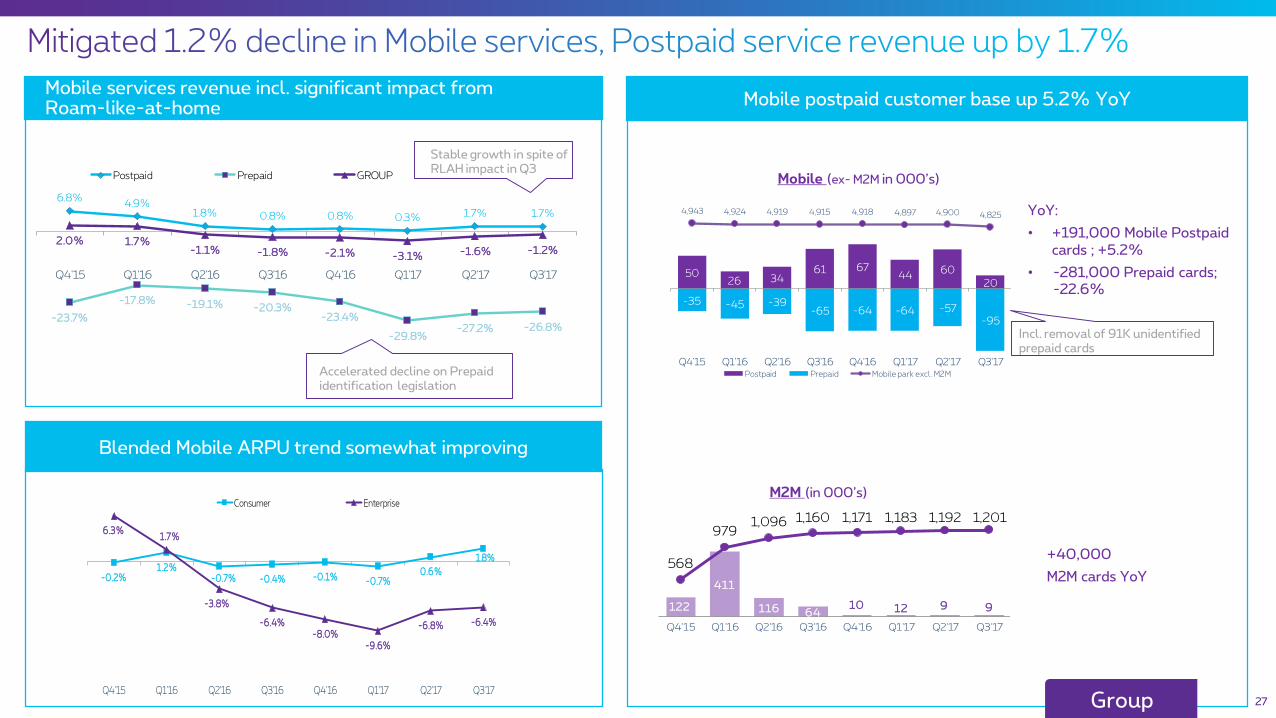
Blended Mobile ARPU trend somewhat improving
27
Mobile services revenue incl. significant impact from Roam-like-at-home Mobile postpaid customer base up 5.2% YoY
+40,000
M2M cards YoY
Mobile (ex- M2M in 000’s)
M2M (in 000’s)
YoY:
• +191,000 Mobile Postpaid cards ; +5.2%
• -281,000 Prepaid cards; -22.6%
416416
Accelerated decline on Prepaid identification legislation
6.8%4.9%
1.8% 0.8% 0.8% 0.3% 1.7% 1.7%
-23.7%
-17.8% -19.1% -20.3%-23.4%
-29.8%-27.2% -26.8%
2.0% 1.7%-1.1% -1.8% -2.1% -3.1% -1.6% -1.2%
Q4'15 Q1'16 Q2'16 Q3'16 Q4'16 Q1'17 Q2'17 Q3'17
Postpaid Prepaid GROUP
-0.2%1.2%
-0.7% -0.4% -0.1% -0.7%0.6%
1.8%
6.3%1.7%
-3.8%
-6.4%-8.0%
-9.6%
-6.8% -6.4%
Q4'15 Q1'16 Q2'16 Q3'16 Q4'16 Q1'17 Q2'17 Q3'17
Consumer Enterprise
122
411
116 6410 12 9 9
568
9791,096 1,160 1,171 1,183 1,192 1,201
Q4'15 Q1'16 Q2'16 Q3'16 Q4'16 Q1'17 Q2'17 Q3'17
5026 34
61 6744
60
20
-35 -45 -39-65 -64 -64 -57
-95
4,943 4,924 4,919 4,915 4,918 4,897 4,900 4,825
Q4'15 Q1'16 Q2'16 Q3'16 Q4'16 Q1'17 Q2'17 Q3'17Postpaid Prepaid Mobile park excl. M2M
Incl. removal of 91K unidentified prepaid cards
Stable growth in spite of RLAH impact in Q3
Group
2,731 2,700-13 -9 2 -6 -5
DM UnderlyingYTD '16
Consumer Enterprise Wholesale Other BICS DM UnderlyingYTD '17
918
901
-10-4 2 -2 -3
DM UnderlyingQ3'16
Consumer Enterprise Wholesale Other BICS DM UnderlyingQ3'17
28
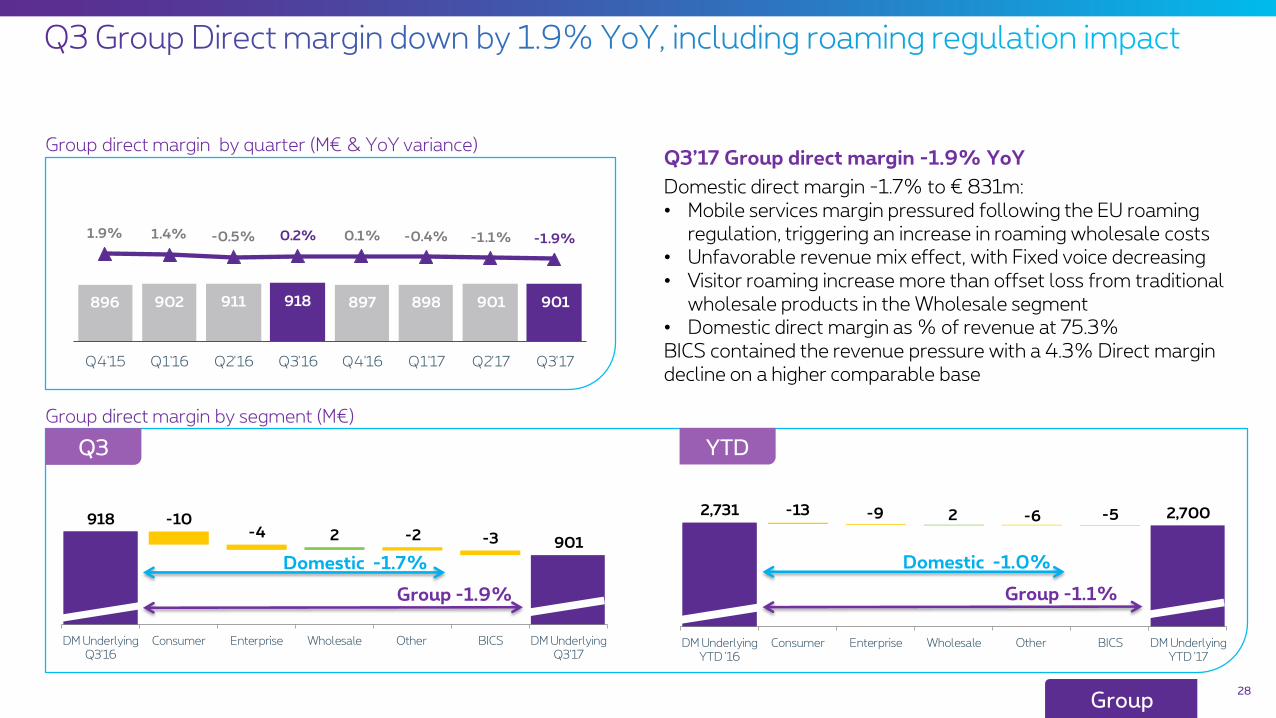
Q3’17 Group direct margin -1.9% YoY
Domestic direct margin -1.7% to € 831m: • Mobile services margin pressured following the EU roaming
regulation, triggering an increase in roaming wholesale costs• Unfavorable revenue mix effect, with Fixed voice decreasing• Visitor roaming increase more than offset loss from traditional
wholesale products in the Wholesale segment• Domestic direct margin as % of revenue at 75.3%BICS contained the revenue pressure with a 4.3% Direct margin decline on a higher comparable base
Domestic -1.7%
Group -1.9%
Group direct margin by quarter (M€ & YoY variance)
Group direct margin by segment (M€)
Domestic -1.0%
Group -1.1%
Group
Q3 YTD
896 902 911 918 897 898 901 901
1.9% 1.4% -0.5% 0.2% 0.1% -0.4% -1.1% -1.9%
Q4'15 Q1'16 Q2'16 Q3'16 Q4'16 Q1'17 Q2'17 Q3'17
Underlying Direct Margin (€m)
288 295 293 289 282 287 288 287
190 189 155 156 174 162 149 151
478 484448 444 456 449 436 437
Q4'15 Q1'16 Q2'16 Q3'16 Q4'16 Q1'17 Q2'17 Q3'17
Workforce expenses Non-Workforce expenses
1,376 -562 1,322
YTD'16 Domestic BICS YTD'17
29
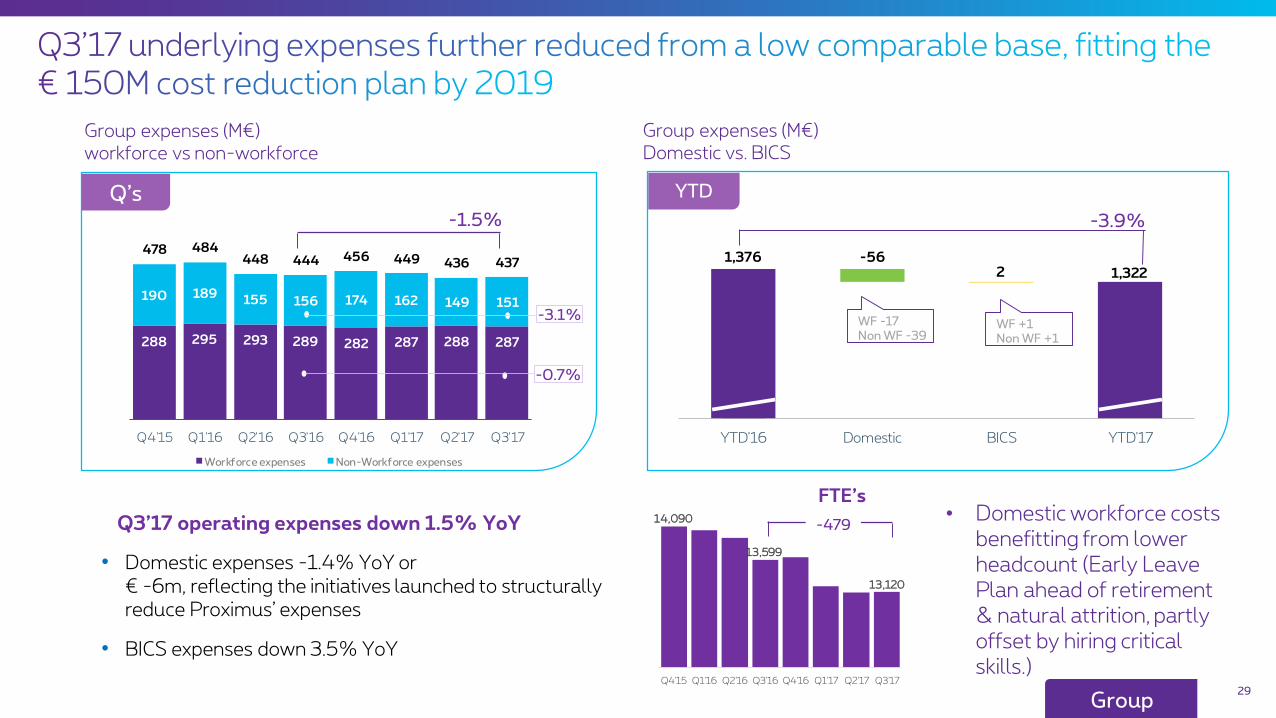
Q3’17 operating expenses down 1.5% YoY
• Domestic expenses -1.4% YoY or € -6m, reflecting the initiatives launched to structurally reduce Proximus’ expenses
• BICS expenses down 3.5% YoY
Group expenses (M€) Domestic vs. BICS
-3.9%
WF -17Non WF -39
WF +1Non WF +1
Q’s YTD
-1.5%
Group expenses (M€) workforce vs non-workforce
-0.7%
-3.1%
14,090
13,599
13,120
Q4'15 Q1'16 Q2'16 Q3'16 Q4'16 Q1'17 Q2'17 Q3'17
FTE’s
-479
Group
• Domestic workforce costs benefitting from lower headcount (Early Leave Plan ahead of retirement & natural attrition, partly offset by hiring critical skills.)

1,355
1,378
1,355 -31
16
38
Underlying EBITDAYTD'16
Direct Margin Worforce cost Non Workforce cost Underlying EBITDAYTD'17
474
464
474 -17
25
Underlying EBITDAQ3'16
Direct Margin Worforce cost Non Workforce cost Underlying EBITDAQ3'17
30
Q3’17 underlying Group EBITDA down -2.2% YoY:
Domestic Q3 EBITDA down -1.9%
• Direct margin impacted by Roaming regulation
• Total roaming margin € -18m* YoY. This aside, Q3 Domestic EBITDA +2.3%
• Partly offset by ongoing reduction of operating expenses.
BICS Q3 EBITDA -5.0% YoY
• Lower direct margin
• Partly compensated by lower expenses
Group -2.2%
Group +1.7%
Group
Q3
YTD
384 383 425 435 405 416 430 426
34 3538 40
36 33 34 38418 418
463 474441 449 464 464
9.5% 2.5% 1.7% 4.7% 5.5% 7.5% 0.4% -2.2%
Q4'15 Q1'16 Q2'16 Q3'16 Q4'16 Q1'17 Q2'17 Q3'17Domestic BICS
Group underlying EBITDA (M€) & YoY variance
*Total direct margin from roaming-out and roaming-in (visitor roaming) from Proximus and Tango, covering price and volume impacts

31
100
200
300
400
500
600
700
800 635
YTD’17YTD’16
Jupiler League football rights season 2017-2020
• Additional mobile sites, increasing capacity, and coverage
• Improved Fixed experience
• Investments in simplification and transformation to decrease cost base
• Renewed & simplified IT systems
• Attractive TV content
• Fiber for Belgium initiated for 5 cities.
707
Capex (M€)
Group
Q4'15 Q1'16 Q2'16 Q3'16 Q4'16 Q1'17 Q2'17 Q3'17
303
237215 183
314
221
281
205

32
* Incidentals for an amount of € 69m in 2016 . Incidentals 2017 of € 36m, mainly related to the voluntary early leave plan prior to retirement, and partially offset by a capital gain on building sales.
• YTD’17 net income (Group share) of €385m, -3.3% YoY, mainly explained by higher tax expenses, and depreciation and amortization, partly offset by higher underlying Group EBITDA and lower finance costs
Group
YoY Net income (YTD, M€)
398 38523
33 -29 27 -69
4 -1
Net incomeYTD'16
UnderlyingEBITDA variance
Incidentals (*) D&A Net Financeresult
Tax expense Non-controllinginterest
Share of lossfrom associates
Net incomeYTD '17

555480
23 6 -8 -90
-6
YTD'16 Higher
underlying
EBIT DA
Lower cash
paid for Capex
Accounts Pay able/
Receiv able,
Inventory
Income tax
payments
Other YTD'17
• Lower Free Cash Flow YoY mainly driven by higher payments of corporate income taxes (including increased legal prepayment percentage to 59%)
• Slightly higher working capital needs
• Partially offset by the higher underlying Ebitda and somewhat less cash paid for Capex
33
YoY FCF (YTD, M€)
Group


• Q3’17 Consumer revenue remained fairly stable to the prior year, with growth of TV, Internet and Mobile postpaid revenue offsetting revenue pressure on Fixed Voice and Mobile prepaid
Slow-down in revenue growth vs. prior quarters largely driven by Mobile device revenue
• Mobile services margin impacted by the EU RLAH regulation, triggering steep increase in data roaming usage during the summer, increasing related wholesale costs
• Direct margin further impacted by unfavorable revenue mix effect, with Fixed voice decreasing
• Underlying direct margin of 75.5% of revenue,-1.2 p.p. YoY
35Consumer
728 706 715 730 737 720 727 729
-0.3% -1.1% 1.9% 1.3% 1.9% 1.7% -0.1%
Q4'15 Q1'16 Q2'16 Q3'16 Q4'16 Q1'17 Q2'17 Q3'17
Consumer underlying revenue (M€ ) & YoY
2,151 2,176
YTD'16 YTD'17
+1.2%
185 158 162 170 194 174 175 179
-6.4% -6.3% 7.1% 5.1% 9.8% 8.5% 5.1%
Q4'15 Q1'16 Q2'16 Q3'16 Q4'16 Q1'17 Q2'17 Q3'17
Consumer underlying COGS (M€) & YoY
490528
0
0
0
0
0
0
0
0
0
0
0
YTD'16 YTD'17
+7.7%
543 548 553 560 543 547 552 550
1.7% 0.5% 0.4% 0.0% -0.3% -0.2% -1.7%
Q4'15 Q1'16 Q2'16 Q3'16 Q4'16 Q1'17 Q2'17 Q3'17
Consumer underlying DM (M€) & YoY
1,661 1,649
YTD'16 YTD'17
-0.8%

Consumer revenue by product group
Note
In line with Proximus’ strategy, most products are sold through multi-play bundles. Therefore, the revenue and ARPU of standalone products are largely the result of the allocation of revenue and discounts to the respective products included in the Packs, as required by IFRS rules.
Consumer 36

2,151
2,176
-16 14
21
17 -30
3
16
UnderlyingYTD '16
Fixed Voice Fixed Data TV MobilePostpaid
MobilePrepaid
TANGO Terminals& others
UnderlyingYTD'17
730 729-76
6
6 -9
0 -1
UnderlyingQ3'16
Fixed Voice Fixed Data TV MobilePostpaid
MobilePrepaid
TANGO Terminals& others
UnderlyingQ3'17
Q3’17:• Continued growth in Proximus’ customer base
for its main products: 6.1% growth for TV, 3.7% for Interne and, in spite of roaming regulation headwinds, -2.6% for Mobile postpaid
• In contrast, revenue from Fixed voice continued to erode, due to the combination of a reduced customer base and lower usage
• Revenue loss in Mobile Prepaid reflecting the impact from the legal identification process, which started in December 2016
37
-0.1%
+1.2%
Q3
YTD
Consumer
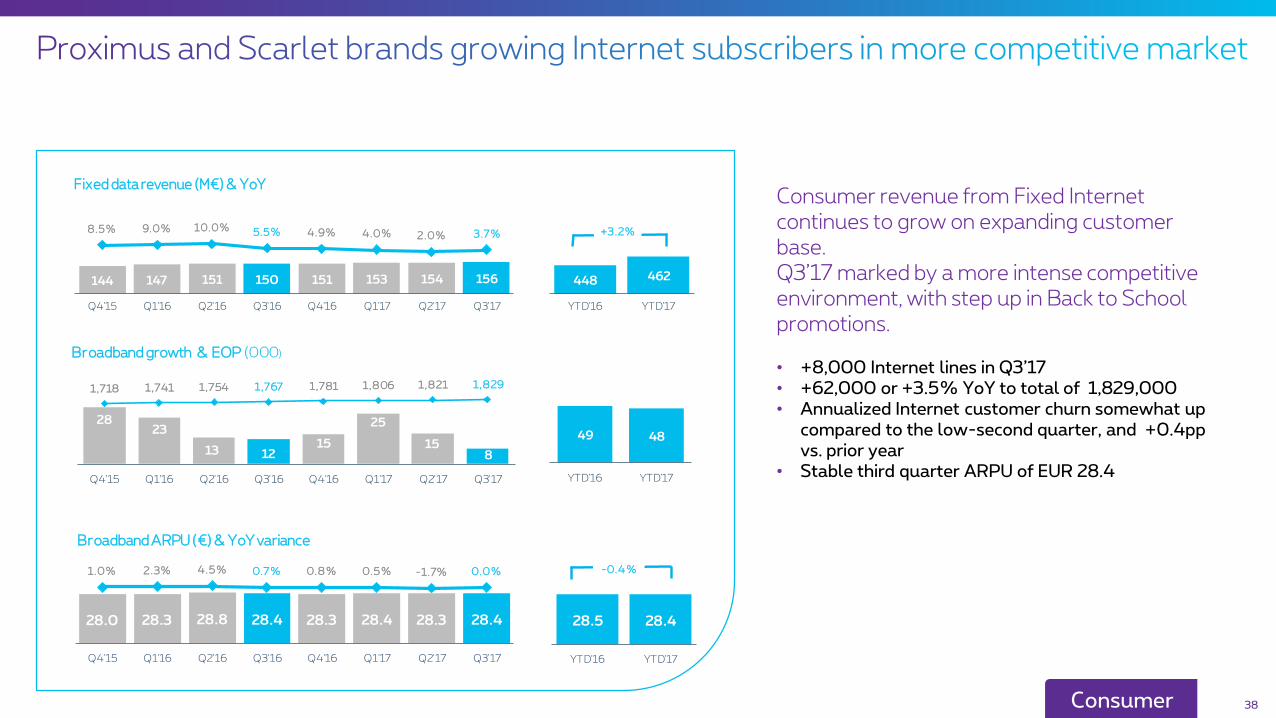
Consumer revenue from Fixed Internet continues to grow on expanding customer base. Q3’17 marked by a more intense competitive environment, with step up in Back to School promotions.
• +8,000 Internet lines in Q3’17• +62,000 or +3.5% YoY to total of 1,829,000• Annualized Internet customer churn somewhat up
compared to the low-second quarter, and +0.4pp vs. prior year
• Stable third quarter ARPU of EUR 28.4
38Consumer
144 147 151 150 151 153 154 156
8.5% 9.0% 10.0% 5.5% 4.9% 4.0% 2.0% 3.7%
Q4'15 Q1'16 Q2'16 Q3'16 Q4'16 Q1'17 Q2'17 Q3'17
Fixed data revenue (M€) & YoY
448 462
YTD'16 YTD'17
+3.2%
28.0 28.3 28.8 28.4 28.3 28.4 28.3 28.4
1.0% 2.3% 4.5% 0.7% 0.8% 0.5% -1.7% 0.0%
Q4'15 Q1'16 Q2'16 Q3'16 Q4'16 Q1'17 Q2'17 Q3'17
Broadband ARPU (€) & YoY variance
28.5 28.4
YTD'16 YTD'17
-0.4%
2823
13 1215
25
158
1,718 1,741 1,754 1,767 1,781 1,806 1,821 1,829
Q4'15 Q1'16 Q2'16 Q3'16 Q4'16 Q1'17 Q2'17 Q3'17
Broadband growth & EOP (000)
49 48
YTD'16 YTD'17
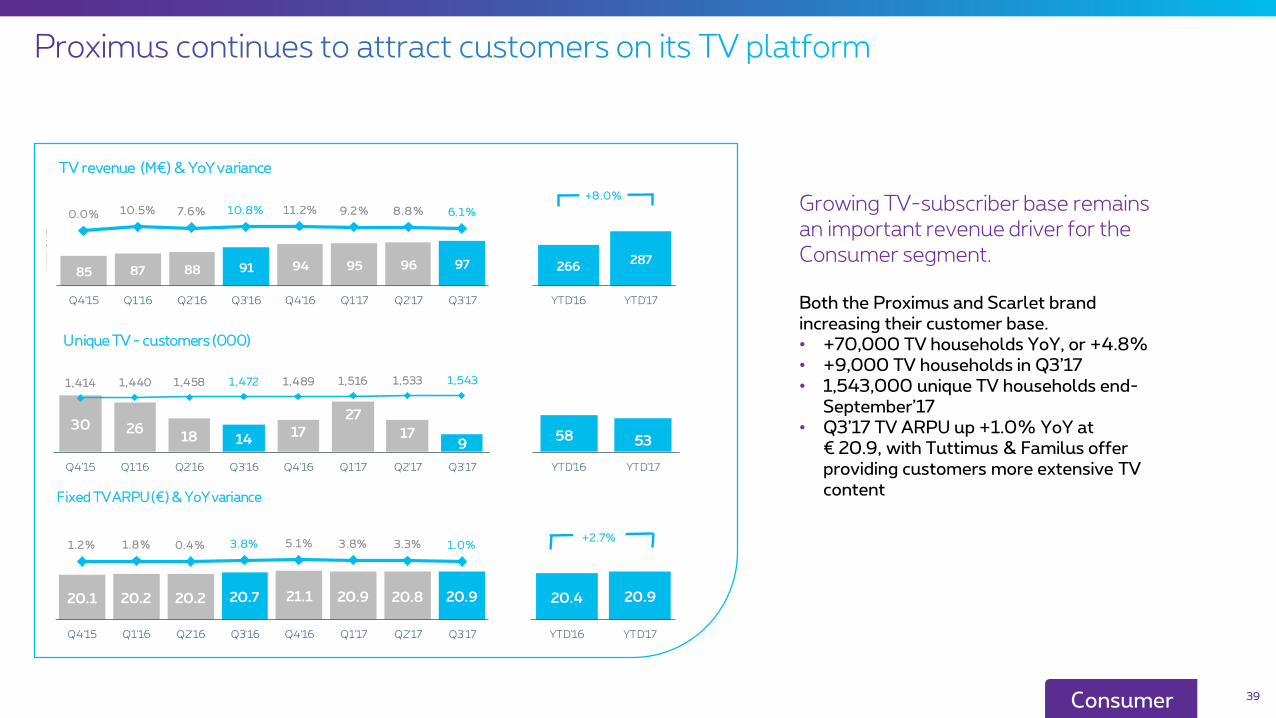
Growing TV-subscriber base remains an important revenue driver for the Consumer segment.
Both the Proximus and Scarlet brand increasing their customer base.• +70,000 TV households YoY, or +4.8%• +9,000 TV households in Q3’17• 1,543,000 unique TV households end-
September’17• Q3’17 TV ARPU up +1.0% YoY at
€ 20.9, with Tuttimus & Familus offer providing customers more extensive TV content
39Consumer
85 87 88 91 94 95 96 97
0.0% 10.5% 7.6% 10.8% 11.2% 9.2% 8.8% 6.1%
0
Q4'15 Q1'16 Q2'16 Q3'16 Q4'16 Q1'17 Q2'17 Q3'17
Mill
ions
TV revenue (M€) & YoY variance
266287
0
0
YTD'16 YTD'17
Mill
ions
+8.0%
30 2618 14
17
27
179
1,414 1,440 1,458 1,472 1,489 1,516 1,533 1,543
Q4'15 Q1'16 Q2'16 Q3'16 Q4'16 Q1'17 Q2'17 Q3'17
Unique TV - customers (000)
58 53
YTD'16 YTD'17
20.1 20.2 20.2 20.7 21.1 20.9 20.8 20.9
1.2% 1.8% 0.4% 3.8% 5.1% 3.8% 3.3% 1.0%
Q4'15 Q1'16 Q2'16 Q3'16 Q4'16 Q1'17 Q2'17 Q3'17
Fixed TV ARPU(€) & YoY variance
20.4 20.9
YTD'16 YTD'17
+2.7%
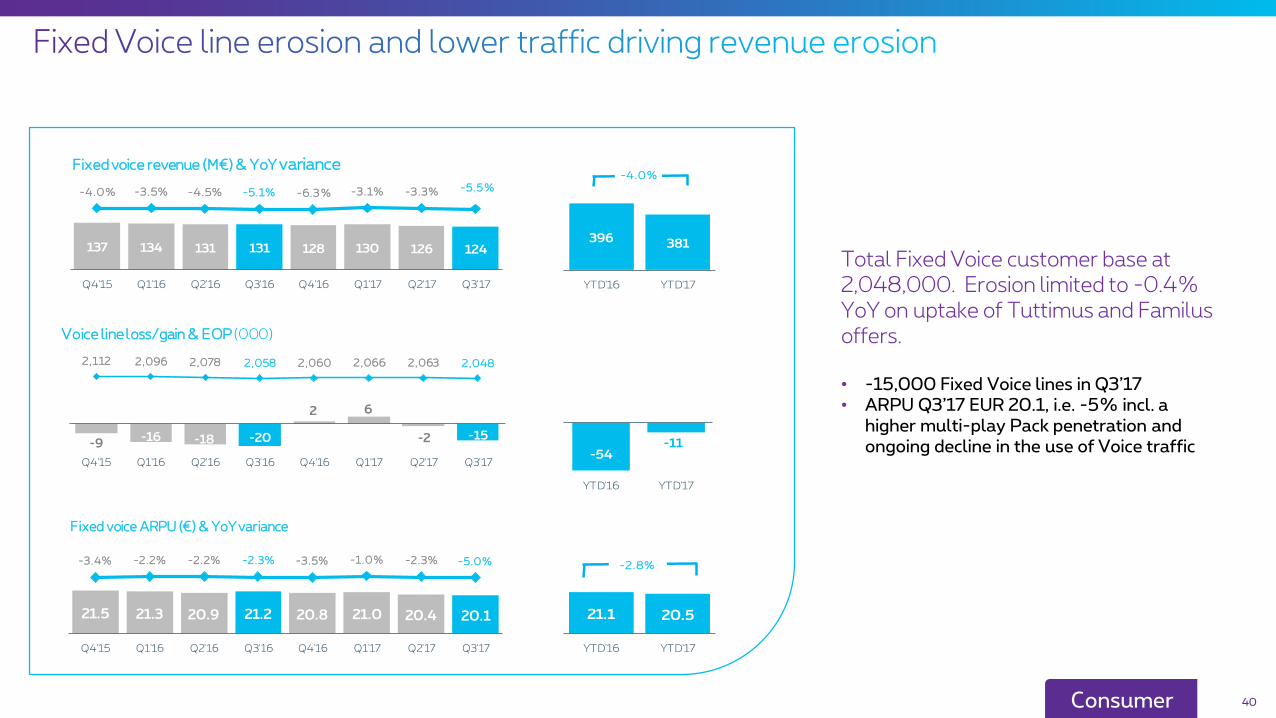
Total Fixed Voice customer base at 2,048,000. Erosion limited to -0.4% YoY on uptake of Tuttimus and Familus offers.
• -15,000 Fixed Voice lines in Q3’17• ARPU Q3’17 EUR 20.1, i.e. -5% incl. a
higher multi-play Pack penetration and ongoing decline in the use of Voice traffic
40Consumer
137 134 131 131 128 130 126 124
-4.0% -3.5% -4.5% -5.1% -6.3% -3.1% -3.3% -5.5%
Q4'15 Q1'16 Q2'16 Q3'16 Q4'16 Q1'17 Q2'17 Q3'17
Fixed voice revenue (M€) & YoY variance
396 381
YTD'16 YTD'17
-4.0%
21.5 21.3 20.9 21.2 20.8 21.0 20.4 20.1
-3.4% -2.2% -2.2% -2.3% -3.5% -1.0% -2.3% -5.0%
Q4'15 Q1'16 Q2'16 Q3'16 Q4'16 Q1'17 Q2'17 Q3'17
Fixed voice ARPU (€) & YoY variance
21.1 20.5
YTD'16 YTD'17
-2.8%
-9-16 -18 -20
2 6
-2 -15
2,112 2,096 2,078 2,058 2,060 2,066 2,063 2,048
Q4'15 Q1'16 Q2'16 Q3'16 Q4'16 Q1'17 Q2'17 Q3'17
Voice line loss/gain & EOP (000)
-54-11
YTD'16 YTD'17
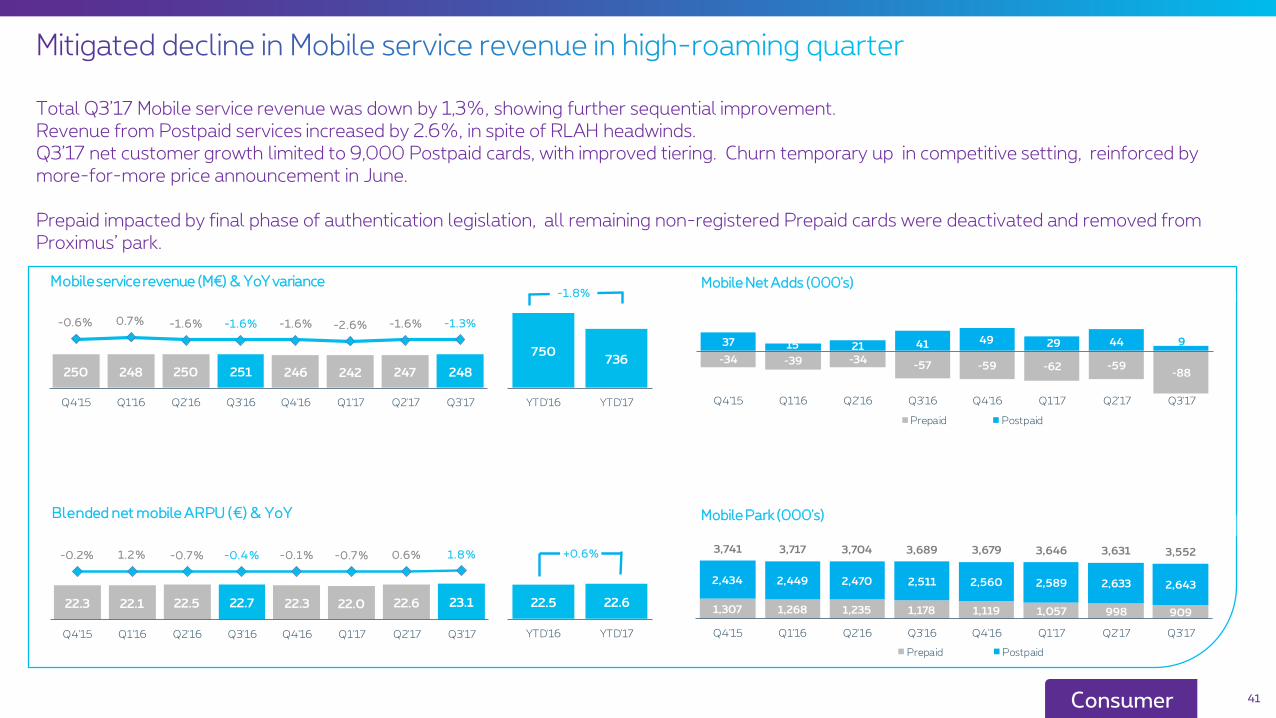
Total Q3’17 Mobile service revenue was down by 1,3%, showing further sequential improvement.Revenue from Postpaid services increased by 2.6%, in spite of RLAH headwinds. Q3’17 net customer growth limited to 9,000 Postpaid cards, with improved tiering. Churn temporary up in competitive setting, reinforced by more-for-more price announcement in June.
Prepaid impacted by final phase of authentication legislation, all remaining non-registered Prepaid cards were deactivated and removed from Proximus’ park.
41Consumer
250 248 250 251 246 242 247 248
-0.6% 0.7% -1.6% -1.6% -1.6% -2.6% -1.6% -1.3%
Q4'15 Q1'16 Q2'16 Q3'16 Q4'16 Q1'17 Q2'17 Q3'17
Mobile service revenue (M€) & YoY variance
750736
YTD'16 YTD'17
-1.8%
-34 -39 -34-57 -59 -62 -59
-88
37 15 21 41 49 29 44 9
Q4'15 Q1'16 Q2'16 Q3'16 Q4'16 Q1'17 Q2'17 Q3'17
Prepaid Postpaid
1,307 1,268 1,235 1,178 1,119 1,057 998 909
2,434 2,449 2,470 2,511 2,560 2,589 2,633 2,643
3,741 3,717 3,704 3,689 3,679 3,646 3,631 3,552
Q4'15 Q1'16 Q2'16 Q3'16 Q4'16 Q1'17 Q2'17 Q3'17
Prepaid Postpaid
22.5 22.6
YTD'16 YTD'17
+0.6%
22.3 22.1 22.5 22.7 22.3 22.0 22.6 23.1
-0.2% 1.2% -0.7% -0.4% -0.1% -0.7% 0.6% 1.8%
Q4'15 Q1'16 Q2'16 Q3'16 Q4'16 Q1'17 Q2'17 Q3'17
Blended net mobile ARPU (€) & YoY Mobile Park (000's)
Mobile Net Adds (000's)

42
Q3 Postpaid revenue increased by 2.6%, in spite of the Roam-like-at-Home (RLAH) headwinds.
• Usage of data roaming increased significantly in the summer holiday season
• The regulatory price impact was more than offset by the increase in Proximus’ Postpaid customer base, + 5.3% YoY, and uptiering benefits
In declining Prepaid market, erosion was accelerated since December’17 by the legislation on Prepaid card identification.
• In accordance with the Royal Decree, 7 September all remaining unidentified cards were deactivated and removed from Proximus’ Prepaid park
Consumer
40 38 38 34 30 27 28 25
-17.8% -19.1% -20.3% -23.4% -29.8% -27.2% -26.8%
Q4'15 Q1'16 Q2'16 Q3'16 Q4'16 Q1'17 Q2'17 Q3'17
Prepaid revenue (M€) & YoY variance
109 79
YTD'16 YTD'17
-27.9%
210 210 213 218 215 215 219 223
4.9% 2.4% 2.1% 2.5% 2.3% 3.0% 2.6%
Q4'15 Q1'16 Q2'16 Q3'16 Q4'16 Q1'17 Q2'17 Q3'17
Postpaid revenue (M€) & YoY variance
641657
YTD'16 YTD'17
+2.6%
29.1 28.7 28.8 29.2 28.4 27.9 28.0 28.3
-0.5% -2.3% -2.5% -2.2% -2.9% -2.8% -3.1%
Q4'15 Q1'16 Q2'16 Q3'16 Q4'16 Q1'17 Q2'17 Q3'17
Postpaid ARPU (€) & YoY variance
28.9 28.1
YTD'16 YTD'17
-3.0%
10.0 9.8 10.1 9.3 8.8 8.1 9.0 8.7
-8.6% -9.7% -9.9% -11.8% -16.7% -11.0% -6.6%
Q4'15 Q1'16 Q2'16 Q3'16 Q4'16 Q1'17 Q2'17 Q3'17
Prepaid ARPU (€) & YoY variance
9.7 8.6
YTD'16 YTD'17
-11.7%

Tango Q3’17 Consumer revenue up by 0.7% YoY, despite the aggressive competitive market conditions, the Prepaid card identification legislation and the application of the Roaming-Like-At-Home legislation from 15 June 2017.
This growth is mainly driven by the commercial success of the revamped Smart portfolio, and its success in executing a convergence strategy on fixed services (Voice, Internet and TV).
43Consumer
31 27 26 28 29 27 29 29
0.5% -3.0% -0.1% -4.8%0.8%
9.6%0.7%
Q4'15 Q1'16 Q2'16 Q3'16 Q4'16 Q1'17 Q2'17 Q3'17
Tango revenue (M€) & YoY variance
82 85
YTD'16 YTD'17
+3.6%

X-Play view
44

2,151
2,176
98 -29
-14-13
-3035 3 -24
UnderlyingYTD'16
4-Play 3-Play 2-Play 1-Play Prepaid Terminalsales
Tango Other UnderlyingYTD'17
730 729
36 -13
-6
-6-9
5 0 -8
UnderlyingQ3'16
4-Play 3-Play 2-Play 1-Play Prepaid Terminalsales
Tango Other UnderlyingQ3'17
• Proximus’ strategy to focus on attractive multi-play offers, supported by Tuttimus and Bizz All-in, resulted in continued uptiering to 4-Play, leading to 18.2% 4-Play revenue increase in Q3’17 and a more valuable and loyal customer base
Total Consumer -0.1%
45
HH/SO +1.7%
Total Consumer +1.2%
HH/SO +2.4%
Q3
YTD
Revenue in M€
Consumer
589 599
34 25
43 49
28 2936 29
Q3'16 Q3'17
Revenues X-Play Prepaid
Terminals sales Tango
Other
730 729
1,747 1,788
109 79110 14582 85104 80
YTD'16 YTD'17
Revenues X-Play Prepaid
Terminals sales Tango
Other
2,151 2,176
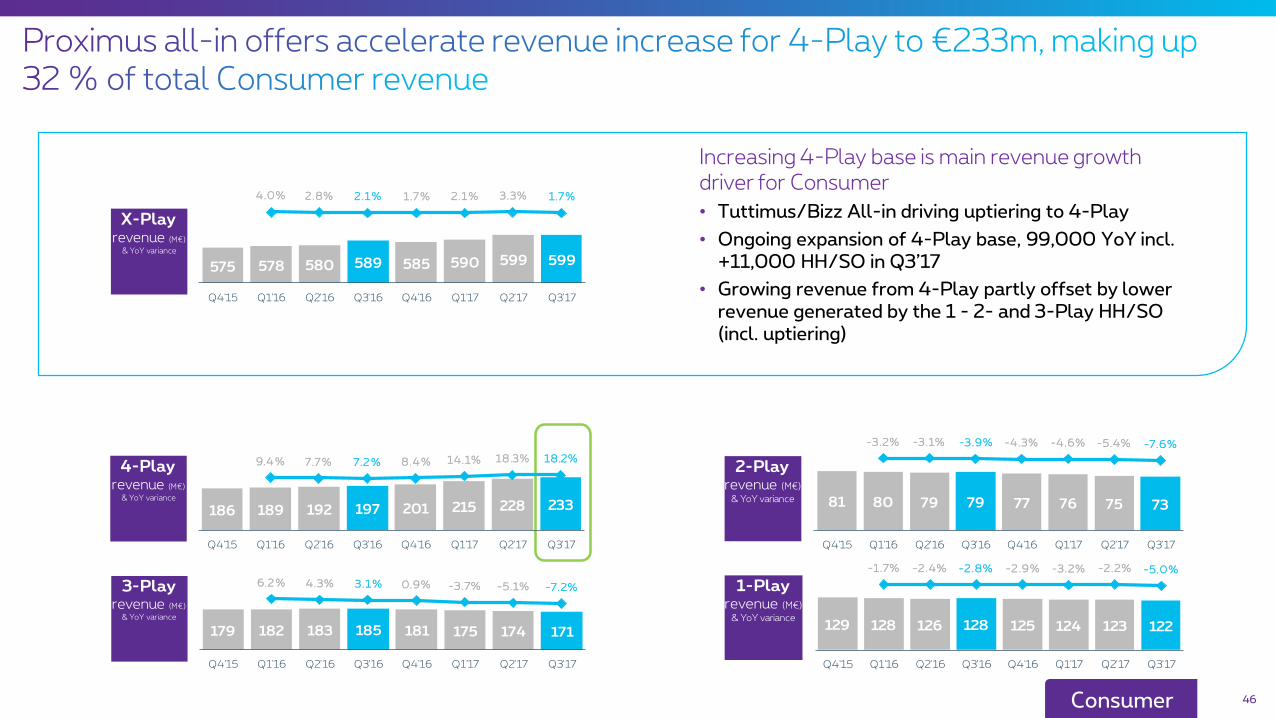
Increasing 4-Play base is main revenue growth driver for Consumer
• Tuttimus/Bizz All-in driving uptiering to 4-Play
• Ongoing expansion of 4-Play base, 99,000 YoY incl. +11,000 HH/SO in Q3’17
• Growing revenue from 4-Play partly offset by lower revenue generated by the 1 - 2- and 3-Play HH/SO (incl. uptiering)
46Consumer
575 578 580 589 585 590 599 599
4.0% 2.8% 2.1% 1.7% 2.1% 3.3% 1.7%
Q4'15 Q1'16 Q2'16 Q3'16 Q4'16 Q1'17 Q2'17 Q3'17
X-Playrevenue (M€)
& YoY variance
186 189 192 197 201 215 228 233
9.4% 7.7% 7.2% 8.4% 14.1% 18.3% 18.2%
Q4'15 Q1'16 Q2'16 Q3'16 Q4'16 Q1'17 Q2'17 Q3'17
4-Playrevenue (M€)
& YoY variance 81 80 79 79 77 76 75 73
-3.2% -3.1% -3.9% -4.3% -4.6% -5.4% -7.6%
Q4'15 Q1'16 Q2'16 Q3'16 Q4'16 Q1'17 Q2'17 Q3'17
2-Playrevenue (M€)
& YoY variance
129 128 126 128 125 124 123 122
-1.7% -2.4% -2.8% -2.9% -3.2% -2.2% -5.0%
Q4'15 Q1'16 Q2'16 Q3'16 Q4'16 Q1'17 Q2'17 Q3'17
1-Playrevenue (M€)
& YoY variance
179 182 183 185 181 175 174 171
6.2% 4.3% 3.1% 0.9% -3.7% -5.1% -7.2%
Q4'15 Q1'16 Q2'16 Q3'16 Q4'16 Q1'17 Q2'17 Q3'17
3-Playrevenue (M€)
& YoY variance

• X-Play Households/Small offices totaled 2,942,000 end Q3’17; ie. down YoY by -0.3% or -9,000.
• Customer mix improving with ongoing expansion of 4-Play base, 99,000 YoY incl. +11,000 HH/SO in Q3’17, driven by the new Tuttimus and Bizz All-in portfolio
47Consumer
16 8 9 1031 35
22 11
547 555 564 574 605 640 662 673
Q4'15 Q1'16 Q2'16 Q3'16 Q4'16 Q1'17 Q2'17 Q3'17
4-Playgrowth & EOP
(000)
10 13 3 2
-13 -11-2 -4
755 768 771 774 760 750 748 744
Q4'15 Q1'16 Q2'16 Q3'16 Q4'16 Q1'17 Q2'17 Q3'17
3-Playgrowth & EOP
(000)
-7 -4-3 -3 -9 -10 -8 -6
455 451 448 445 437 427 419 413
Q4'15 Q1'16 Q2'16 Q3'16 Q4'16 Q1'17 Q2'17 Q3'17
2-Playgrowth & EOP
(000)
-10-17
-11 -9 -8-19 -4 -15
1,194 1,177 1,167 1,158 1,150 1,130 1,127 1,111
Q4'15 Q1'16 Q2'16 Q3'16 Q4'16 Q1'17 Q2'17 Q3'17
1-Playgrowth & EOP
(000)
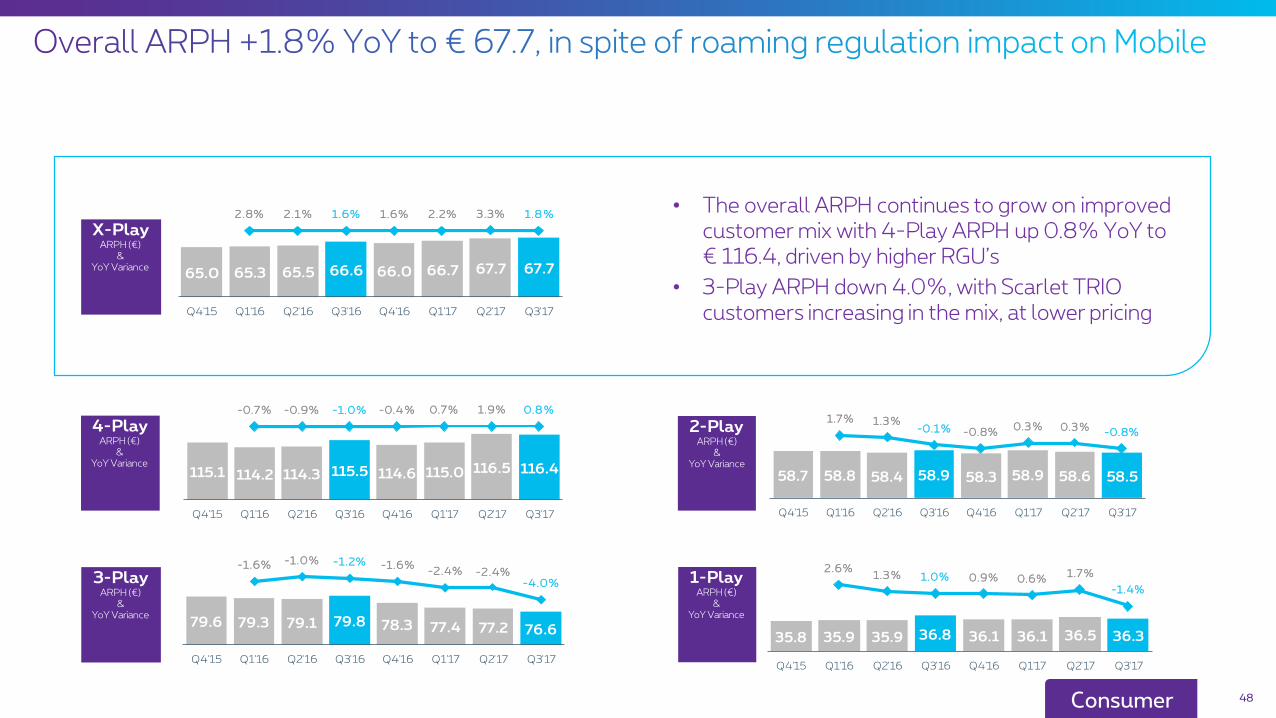
• The overall ARPH continues to grow on improved customer mix with 4-Play ARPH up 0.8% YoY to € 116.4, driven by higher RGU’s
• 3-Play ARPH down 4.0%, with Scarlet TRIO customers increasing in the mix, at lower pricing
48Consumer
65.0 65.3 65.5 66.6 66.0 66.7 67.7 67.7
2.8% 2.1% 1.6% 1.6% 2.2% 3.3% 1.8%
Q4'15 Q1'16 Q2'16 Q3'16 Q4'16 Q1'17 Q2'17 Q3'17
X-PlayARPH (€)
&YoY Variance
115.1 114.2 114.3 115.5 114.6 115.0 116.5 116.4
-0.7% -0.9% -1.0% -0.4% 0.7% 1.9% 0.8%
Q4'15 Q1'16 Q2'16 Q3'16 Q4'16 Q1'17 Q2'17 Q3'17
4-PlayARPH (€)
&YoY Variance
79.6 79.3 79.1 79.8 78.3 77.4 77.2 76.6
-1.6% -1.0% -1.2% -1.6%-2.4% -2.4%
-4.0%
Q4'15 Q1'16 Q2'16 Q3'16 Q4'16 Q1'17 Q2'17 Q3'17
3-PlayARPH (€)
&YoY Variance
58.7 58.8 58.4 58.9 58.3 58.9 58.6 58.5
1.7% 1.3%-0.1% -0.8%
0.3% 0.3%-0.8%
Q4'15 Q1'16 Q2'16 Q3'16 Q4'16 Q1'17 Q2'17 Q3'17
2-PlayARPH (€)
&YoY Variance
35.8 35.9 35.9 36.8 36.1 36.1 36.5 36.3
2.6%1.3% 1.0% 0.9% 0.6%
1.7%
-1.4%
30.0
32.0
34.0
36.0
38.0
40.0
42.0
44.0
Q4'15 Q1'16 Q2'16 Q3'16 Q4'16 Q1'17 Q2'17 Q3'17
1-PlayARPH (€)
&YoY Variance

49
• The annualized full-churn rate on average for all Plays was 13.5 %, somewhat up from the prior year and the low Q2 , driven by a competitive step-up in promotions
• 4-Play churn remaining however low at 3.1%
Consumer
13.4% 13.4% 12.0% 12.6% 13.5% 13.7% 11.7% 13.5%
Q4'15 Q1'16 Q2'16 Q3'16 Q4'16 Q1'17 Q2'17 Q3'17
X-PlayAnnualized full churn
rate
2.9% 2.8% 2.7% 2.4% 2.7% 2.8% 2.5% 3.1%
Q4'15 Q1'16 Q2'16 Q3'16 Q4'16 Q1'17 Q2'17 Q3'17
4-PlayAnnualized full
churn rate
20.3% 20.8% 18.7% 20.3%21.9% 22.6% 19.3%
22.7%
Q4'15 Q1'16 Q2'16 Q3'16 Q4'16 Q1'17 Q2'17 Q3'17
1-PlayAnnualized full
churn rate
11.3% 12.1% 10.3% 10.9% 11.6% 12.3% 10.5% 11.7%
Q4'15 Q1'16 Q2'16 Q3'16 Q4'16 Q1'17 Q2'17 Q3'17
2-PlayAnnualized full
churn rate
11.2% 10.4% 9.6% 9.6% 10.3% 10.2% 8.9% 10.1%
Q4'15 Q1'16 Q2'16 Q3'16 Q4'16 Q1'17 Q2'17 Q3'17
3-PlayAnnualized full
churn rate

50
51Enterprise
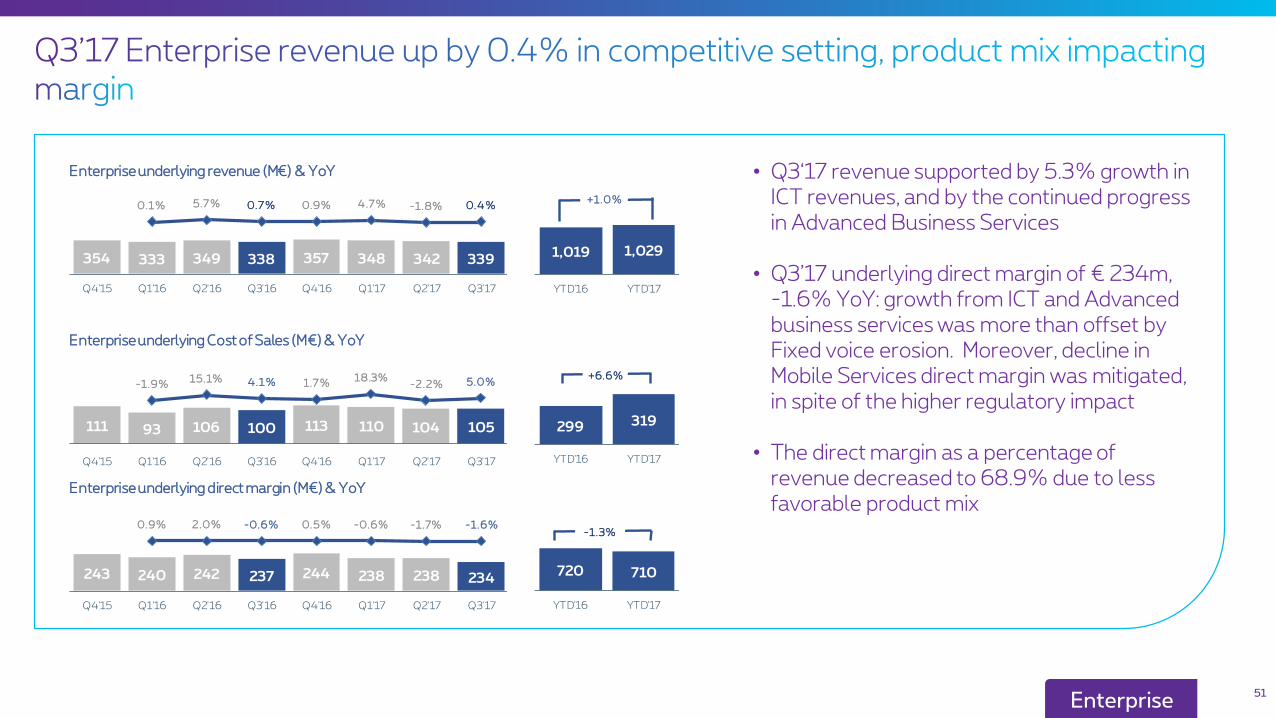
• Q3‘17 revenue supported by 5.3% growth in ICT revenues, and by the continued progress in Advanced Business Services
• Q3’17 underlying direct margin of € 234m, -1.6% YoY: growth from ICT and Advanced business services was more than offset by Fixed voice erosion. Moreover, decline in Mobile Services direct margin was mitigated, in spite of the higher regulatory impact
• The direct margin as a percentage of revenue decreased to 68.9% due to less favorable product mix
354 333 349 338 357 348 342 339
0.1% 5.7% 0.7% 0.9% 4.7% -1.8% 0.4%
Q4'15 Q1'16 Q2'16 Q3'16 Q4'16 Q1'17 Q2'17 Q3'17
Enterprise underlying revenue (M€) & YoY
1,019 1,029
YTD'16 YTD'17
+1.0%
111 93 106 100 113 110 104 105
-1.9%15.1% 4.1% 1.7%
18.3%-2.2% 5.0%
Q4'15 Q1'16 Q2'16 Q3'16 Q4'16 Q1'17 Q2'17 Q3'17
Enterpriseunderlying Cost of Sales (M€) & YoY
299 319
YTD'16 YTD'17
+6.6%
243 240 242 237 244 238 238 234
0.9% 2.0% -0.6% 0.5% -0.6% -1.7% -1.6%
Q4'15 Q1'16 Q2'16 Q3'16 Q4'16 Q1'17 Q2'17 Q3'17
Enterprise underlying direct margin (M€) & YoY
720 710
YTD'16 YTD'17
-1.3%

1,019 1,029-13 -3 22 -6 8 3
UnderlyingYTD '16
Fixed Voice Fixed Data ICT MobileService
Revenue
AdvancedBusinessServices
Terminals &others
UnderlyingYTD'17
338 339-5
-26 -1
2 1
UnderlyingQ3'16
Fixed Voice Fixed Data ICT MobileService
Revenue
AdvancedBusinessServices
Terminals &others
UnderlyingQ3'17
52
+0.4%
+1.0%
Enterprise
Q3
YTD
• Operating in a competitive environment, Proximus’ Enterprise segment achieved a 0.4% growth in Q3’17 revenue
• Enterprise segment benefitted from a 5.3% growth in ICT revenues, and from the continued progress in Advanced Business Services
• Q3 Mobile services revenue decline was limited, in spite of a full 3-month Roam-like-at-home impact

53
• The Enterprise segment faces an ongoing rationalization by customers on Fixed line connections, lower usage, technology migrations to VoIP and competitive pressure. The net Fixed line erosion remains however fairly stable with -10,000 lines in Q3’17
• Fixed Voice ARPU eroded to €29.9, -2.5% YoY on less traffic per line and a lower average traffic price due to a rising penetration of unlimited call options
Enterprise
61 61 60 58 58 57 55 53
-3.8% -4.4% -2.8% -4.9% -5.5% -5.6% -7.7% -8.7%
0
0
Q4'15 Q1'16 Q2'16 Q3'16 Q4'16 Q1'17 Q2'17 Q3'17
Fixed voice revenue (M€) & YoY variance
179 166
0
0
0
YTD'16 YTD'17
Mill
ions
-7.3%
30.7 31.1 31.1 30.7 30.8 31.2 30.5 29.9
1.2% 1.1% 3.2% 1.0% 0.6% 0.2% -2.0% -2.5%
Q4'15 Q1'16 Q2'16 Q3'16 Q4'16 Q1'17 Q2'17 Q3'17
Fixed voice ARPU (EUR ) & YoY variance
31.0 30.5
YTD'16 YTD'17
-1.4%
-10-14 -10
-7-10 -12 -10 -10
660 647 637 630 620 609 599 589
0
0
0
0
0
1
1
1
0
0
0
0
0
Q4'15 Q1'16 Q2'16 Q3'16 Q4'16 Q1'17 Q2'17 Q3'17
Voice line loss/gain & EOP (000)
-30 -32
0
0
0
0
0
0
0
0
0
0
YTD'16 YTD'17
54
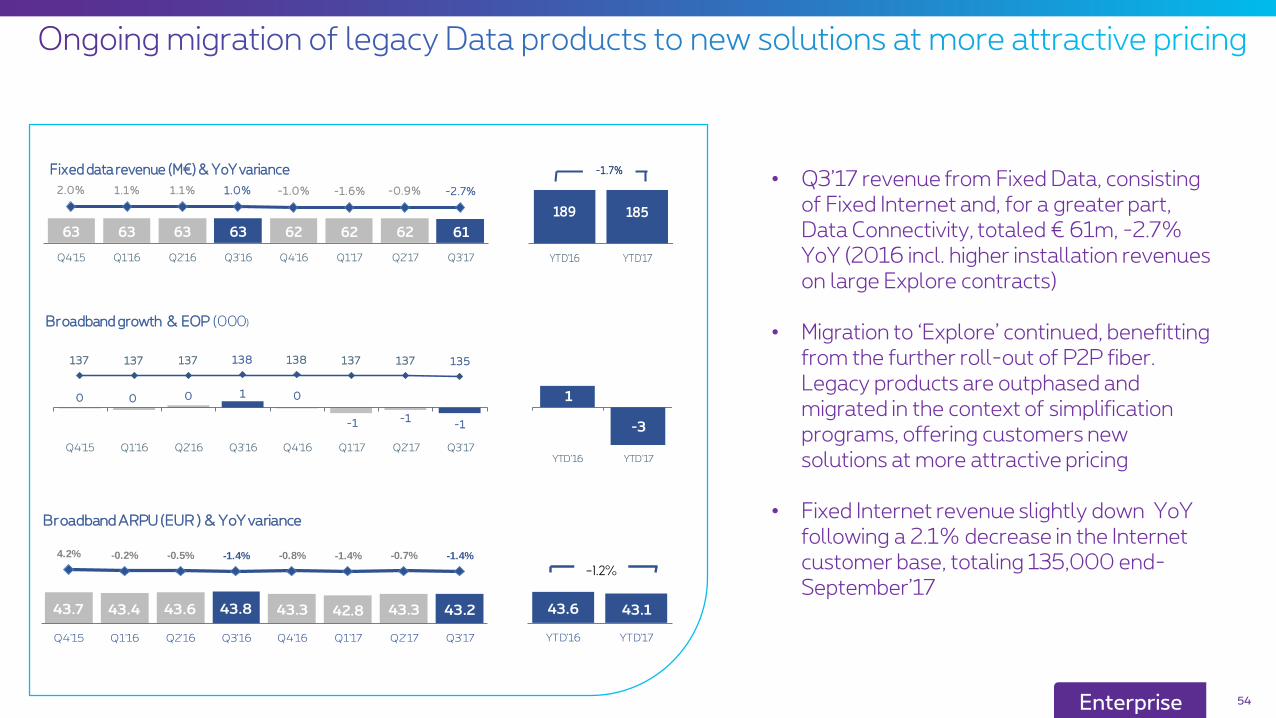
• Q3’17 revenue from Fixed Data, consisting of Fixed Internet and, for a greater part, Data Connectivity, totaled € 61m, -2.7% YoY (2016 incl. higher installation revenues on large Explore contracts)
• Migration to ‘Explore’ continued, benefitting from the further roll-out of P2P fiber. Legacy products are outphased and migrated in the context of simplification programs, offering customers new solutions at more attractive pricing
• Fixed Internet revenue slightly down YoY following a 2.1% decrease in the Internet customer base, totaling 135,000 end-September’17
Enterprise
63 63 63 63 62 62 62 61
2.0% 1.1% 1.1% 1.0% -1.0% -1.6% -0.9% -2.7%
0
0
Q4'15 Q1'16 Q2'16 Q3'16 Q4'16 Q1'17 Q2'17 Q3'17
Fixed data revenue (M€) & YoY variance
189 185
0
0
YTD'16 YTD'17
Millions
-1.7%
43.7 43.4 43.6 43.8 43.3 42.8 43.3 43.2
4.2% -0.2% -0.5% -1.4% -0.8% -1.4% -0.7% -1.4%
35.0
36.0
37.0
38.0
39.0
40.0
41.0
42.0
43.0
44.0
45.0
46.0
47.0
48.0
49.0
50.0
Q4'15 Q1'16 Q2'16 Q3'16 Q4'16 Q1'17 Q2'17 Q3'17
Broadband ARPU (EUR ) & YoY variance
43.6 43.1
YTD'16 YTD'17
-1.2%
0 0 0 1 0
-1 -1-1
137 137 137 138 138 137 137 135
0
0
0
0
0
0
0
0
0
0
0
0
0
0
0
0
Q4'15 Q1'16 Q2'16 Q3'16 Q4'16 Q1'17 Q2'17 Q3'17
Thousands
Broadband growth & EOP (000)
1
-3-2 .0
-1 .5
-1 .0
-0 .5
0.0
0.5
1.0
1.5
2.0
YTD'16 YTD'17

55
• € 7m revenue from Advanced Business Services in Q3’17, mainly driven by BeMobile, occupying a unique market position in the field of Smart Mobility. Further supported by growth for Proximus’ convergent business solutions
Advanced Business Services groups new solutions offered aside from traditional Telecom and ICT, such as smart mobility solutions (BeMobile), Road User Charging, Converging Solutions, Big data.
Enterprise
• Q3’17 ICT revenue benefited from growth in Cloud, Security and Outsourcing services and from the revenue contribution from Davinsi Labs* (integrated since May’17 )
* Antwerp-based cyber security company with a strong position on the Benelux cybersecurity market. FY’16 revenue of €3.4m.
127 108 123 115 129 126 121 121
-0.3% 1.1% 14.2% 1.1% 2.1% 16.1%-1.3% 5.3%
0
0
0
Q4'15 Q1'16 Q2'16 Q3'16 Q4'16 Q1'17 Q2'17 Q3'17
Underlying ICT revenue (M€) & YoY
346 368
YTD'16 YTD'17
6.3%
1 25 5
7 6 6 7
Q4'15 Q1'16 Q2'16 Q3'16 Q4'16 Q1'17 Q2'17 Q3'17
Advanced Business Services (M€)
11 19
YTD'16 YTD'17
56
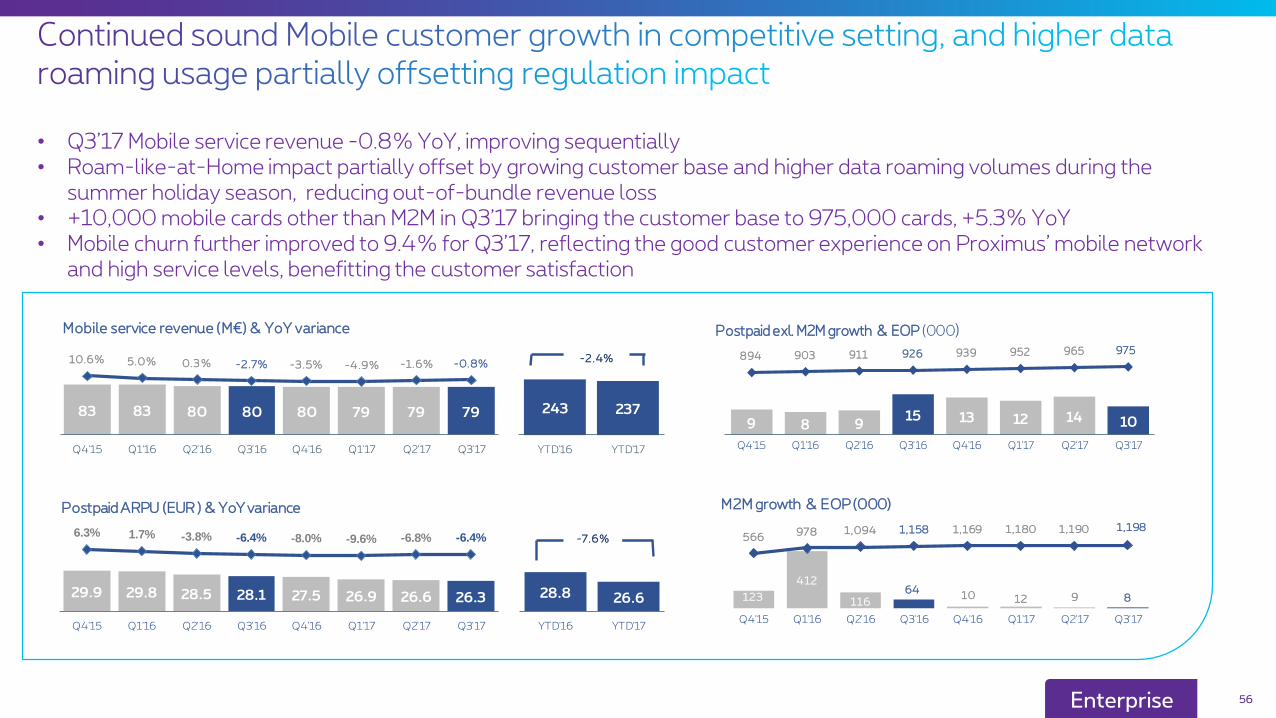
• Q3’17 Mobile service revenue -0.8% YoY, improving sequentially • Roam-like-at-Home impact partially offset by growing customer base and higher data roaming volumes during the
summer holiday season, reducing out-of-bundle revenue loss • +10,000 mobile cards other than M2M in Q3’17 bringing the customer base to 975,000 cards, +5.3% YoY • Mobile churn further improved to 9.4% for Q3’17, reflecting the good customer experience on Proximus’ mobile network
and high service levels, benefitting the customer satisfaction
Enterprise
29.9 29.8 28.5 28.1 27.5 26.9 26.6 26.3
6.3% 1.7% -3.8% -6.4% -8.0% -9.6% -6.8% -6.4%
Q4'15 Q1'16 Q2'16 Q3'16 Q4'16 Q1'17 Q2'17 Q3'17
Postpaid ARPU (EUR ) & YoY variance
28.8 26.6
YTD'16 YTD'17
-7.6%
83 83 80 80 80 79 79 79
10.6% 5.0% 0.3% -2.7% -3.5% -4.9% -1.6% -0.8%
Q4'15 Q1'16 Q2'16 Q3'16 Q4'16 Q1'17 Q2'17 Q3'17
Mobile service revenue (M€) & YoY variance
243 237
YTD'16 YTD'17
-2.4%
9 8 915 13 12 14 10
894 903 911 926 939 952 965 975
0
0
0
0
0
0
Q4'15 Q1'16 Q2'16 Q3'16 Q4'16 Q1'17 Q2'17 Q3'17
Postpaid exl. M2M growth & EOP (000)
123
412
11664
10 12 9 8
566978 1,094 1,158 1,169 1,180 1,190 1,198
0
0
0
0
0
0
0
0
0
0
Q4'15 Q1'16 Q2'16 Q3'16 Q4'16 Q1'17 Q2'17 Q3'17
M2M growth & EOP (000)

57Wholesale
• Revenues & Direct Margin growth following higher roaming-in margin driven by higher data volumes
• Partially offset by decline in traditional wholesale products (fix/mobile voice, data connectivity and broadband access)
48 48 49 51 46 52 48 56
-12.2% -4.9% -7.3% 1.1% -3.3% 8.0% -1.6% 9.5%
Q4'15 Q1'16 Q2'16 Q3'16 Q4'16 Q1'17 Q2'17 Q3'17
Wholesale underlying revenue (M€) & YoY
148 156
YTD'16 YTD'17
+5.4%
41 43 43 44 40 45 41 46
-12.0% -1.7% -5.4% 0.4% -3.6% 5.6% -4.0% 3.7%
Q4'15 Q1'16 Q2'16 Q3'16 Q4'16 Q1'17 Q2'17 Q3'17
Wholesale underlying direct margin (M€) &YoY
130 132
YTD'16 YTD'17
+1.8%


59
• BICS operates in a market facing ongoing erosion of Voice traffic, with a shift from Voice to data usage
• BICS Voice revenue -17.3% for Q3’17 • Solid Q3’17 non-Voice revenue of
EUR 85m, up 7.9% YoY
BICS
• Q3’17 direct margin of € 70m, -4.3% on higher comparable base, with Q3’16 benefitting from higher settlement agreements with foreign operators
• This aside, BICS’ Direct margin was slightly positive: strong growth in SMS A2P volumes and a solid performance in Mobile Data (Roaming and Mobile IP businesses)
877 754
220 227
YTD'16 YTD'17
-10.6%
30 29 30 32 29 29 30 29
35 38 37 41 39 36 37 40
4.7% 3.5%-11.2%
-0.1% 3.9% -3.5% 0.4% -4.3%
Q4'15 Q1'16 Q2'16 Q3'16 Q4'16 Q1'17 Q2'17 Q3'17
Voice Non-Voice
BICS Direct Margin (M€)
91 88
116 113
YTD'16 YTD'17
-2.5%
318 286 288 303 291 262 241 251
67 70 71 79 72 70 71 85
-2.7%
-10.9% -12.7%-9.1%
-5.6% -6.6%
-12.9% -12.1%
Q4'15 Q1'16 Q2'16 Q3'16 Q4'16 Q1'17 Q2'17 Q3'17
Non-Voice Voice
BICS Revenue (M€)
60BICS
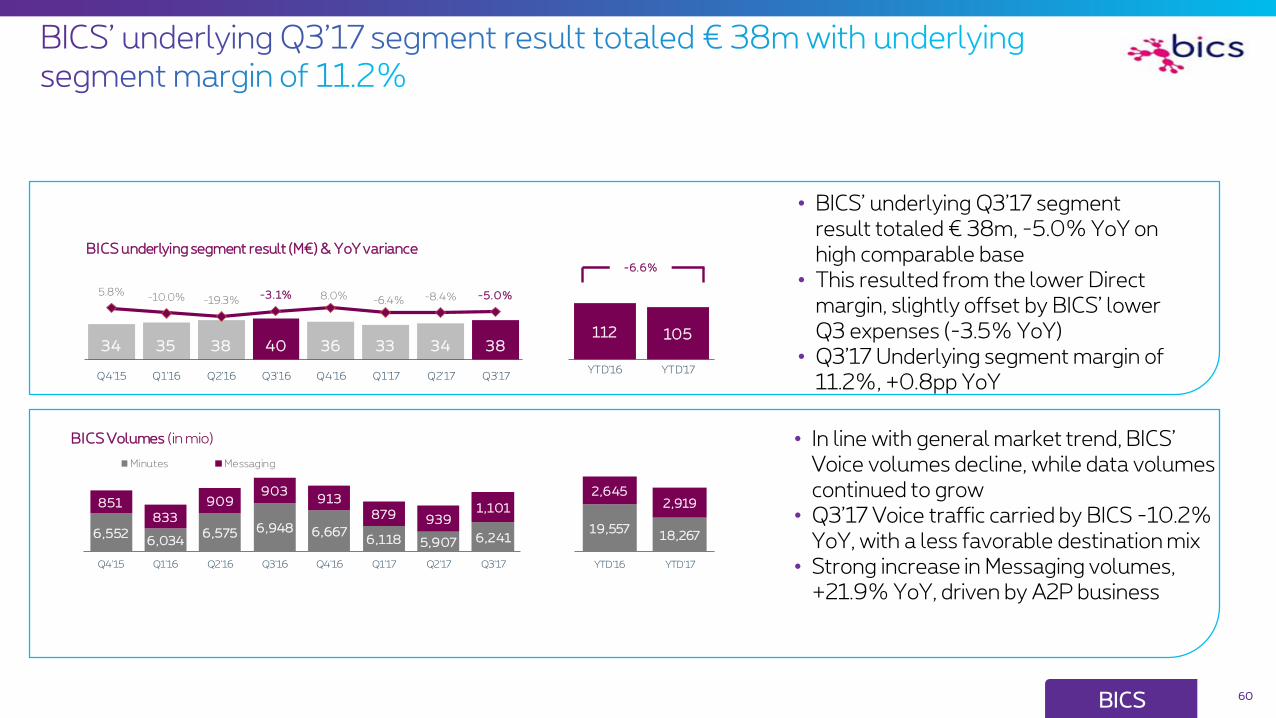
• BICS’ underlying Q3’17 segment result totaled € 38m, -5.0% YoY on high comparable base
• This resulted from the lower Direct margin, slightly offset by BICS’ lower Q3 expenses (-3.5% YoY)
• Q3’17 Underlying segment margin of 11.2%, +0.8pp YoY
• In line with general market trend, BICS’ Voice volumes decline, while data volumes continued to grow
• Q3’17 Voice traffic carried by BICS -10.2% YoY, with a less favorable destination mix
• Strong increase in Messaging volumes, +21.9% YoY, driven by A2P business
112 105
YTD'16 YTD'17
-6.6%
6,5526,034
6,575 6,948 6,6676,118 5,907 6,241
851833
909903
913
879 9391,101
Q4'15 Q1'16 Q2'16 Q3'16 Q4'16 Q1'17 Q2'17 Q3'17
Minutes Messaging
BICS Volumes (in mio)
19,55718,267
2,6452,919
YTD'16 YTD'17
34 35 38 40 36 33 34 38
5.8%-10.0% -19.3%
-3.1% 8.0% -6.4% -8.4% -5.0%
Q4'15 Q1'16 Q2'16 Q3'16 Q4'16 Q1'17 Q2'17 Q3'17
BICS underlying segment result (M€) & YoY variance

Additional info• Regulation• BICS acquisition of TeleSign• Headcount evolution• Corporate Social Responsibility• Pricing (status 9 November 2017)
• Spectrum• Shareholder structure & remuneration• Contact details

• Transitory period towards Roam-like-at Home from 30 April ‘16 till 14 June ’17: surcharge up to the current regulated wholesale rates.
• As from 15 June 2017, ‘Roam-Like-At-Home’ implemented in the EU zone with the obligation to charge retail roaming within the EU at domestic retail price for consumption within the Fair Use Policy.
• Roaming wholesale prices for data caps, a step by step reduction over 5 years is foreseen, with a decrease from € 7.7/GB as of 15 June 2017 to € 2.5/GB as of 1 January 2022.
• The Q3’17 Roaming-out price impact of € -21M was partly offset by a positive volume impact from roaming-out and visitor roaming, leading to an overall net reduction in roaming margin by € -18M YoY.
Roaming-Out price impactDefined as: Volumes of year-1 multiplied by the year-
on-year price decrease as set by the regulator.
62
EU roaming regulation
On 31 May 2017, the BIPT published its 3rd round analysis of the mobile termination market. The decision applies a MTR level of 0.99 eurocent/minute for the period 2017-2019 (vs 1.18 eurocent previously). The new MTR has been applicable since 1 July. The estimated impact is less than EUR 6 million in revenue for 2017, with a fairly neutral EBITDA impact. In Luxembourg, the new MTR have been set at 0.89 eurocent/min since 1 July until 31 December 2019 (from 0.97 eurocent previously).
Mobile Termination rates
The identification of old and new mobile Prepaid cards became mandatory under Belgian law. Proximus implemented different solutions in order to make it easier for its customers to identify their prepaid cards. Since 7 June 2017, all active prepaid cards have been identified in line with the Belgian law.A validation period ran until the 7th of September, after which all remaining non-identified cards were removed from Proximus’ park. In total, Proximus removed 91,000 unidentified prepaid cards in Q3’17.
Prepaid identification
(EUR million)Q3'17
ActualsYTD'17 Actuals
FY'17 Estimate
Revenue -21 -48 -61
National -18 -40 -50
Tango -4 -8 -11
EBITDA -21 -48 -61
National -18 -40 -50
Tango -4 -8 -11
On 7 July 2017, the Belgian regulators (BIPT and media regulators CSA, VRM and Medienrat) launched a public consultation on their review of the broadband internet and TV market analysis (the last analysis dates from July 2011). The regulators consider that these markets are still characterized by competition shortcomings and take as a stance that the market needs a third fixed player. Overall they propose a scheme for deepening the cable regulation and extending Proximus’ regulation from its copper to also its fiber network. The concrete modalities of the regulation are not yet defined. The consultation ran until end-September 2017. The contributions will now be processed by the regulators. The new draft will then be submitted to the Competition Council and the EU Commission. A final decision is expected at the earliest in the first quarter of 2018.
63
BIPT market analysis
The “Easy Switch procedure launched by the BIPT at the request of the Telecom Minister to facilitate the switch-over for fixed services (voice, internet, television and packs) effectively entered into force on 3 July 2017. The new obligations will be reassessed by the BIPT by 1 July 2019.Easy switch
Fixed Termination Rates
On 15 March 2017, the Brussels Appeal Court annulled BIPT’s earlier decision setting the FTR at 0.092 eurocent/min. The tariffs in force before 1 November 2016 are therefore applicable again. The BIPT is working on a new market analysis expected to be submitted to consultation this year.

64
TeleSignTeleSign’s Communications
platformBridge Operator-Internet
worlds
Digital services providers need connectivity, interoperability, off-net Voice/SMS termination, mobile end-user related data, …
Connection to 700+ Operators Worldwide
• Global leader in Mobile Identity Verification and Assurance through SMS, Voice, …
• Offering the broadest, highest quality and furthest-reaching consumer account security solution in the world
• Diversified, International Customer base
• 250 employees worldwide
• 6Bn+ transactions processed per year
• Developer-friendly API’s & SDK’s, combining data intelligence and messaging communications
• Expansive global network with 100’s off high-quality, direct-to-carrier routes ensuring highest availability and market-leading delivery and completion rates
• Unparalleled service and support
Connection to 500+ Digital Service Providers
Acquisition closed 31 Oct’17 for agreed price of $230M. Companies to operate independently, with TeleSign a subsidiary of BICS TeleSign financial results incorporated in BICS’ consolidated results as from 1 Nov 2017.
65
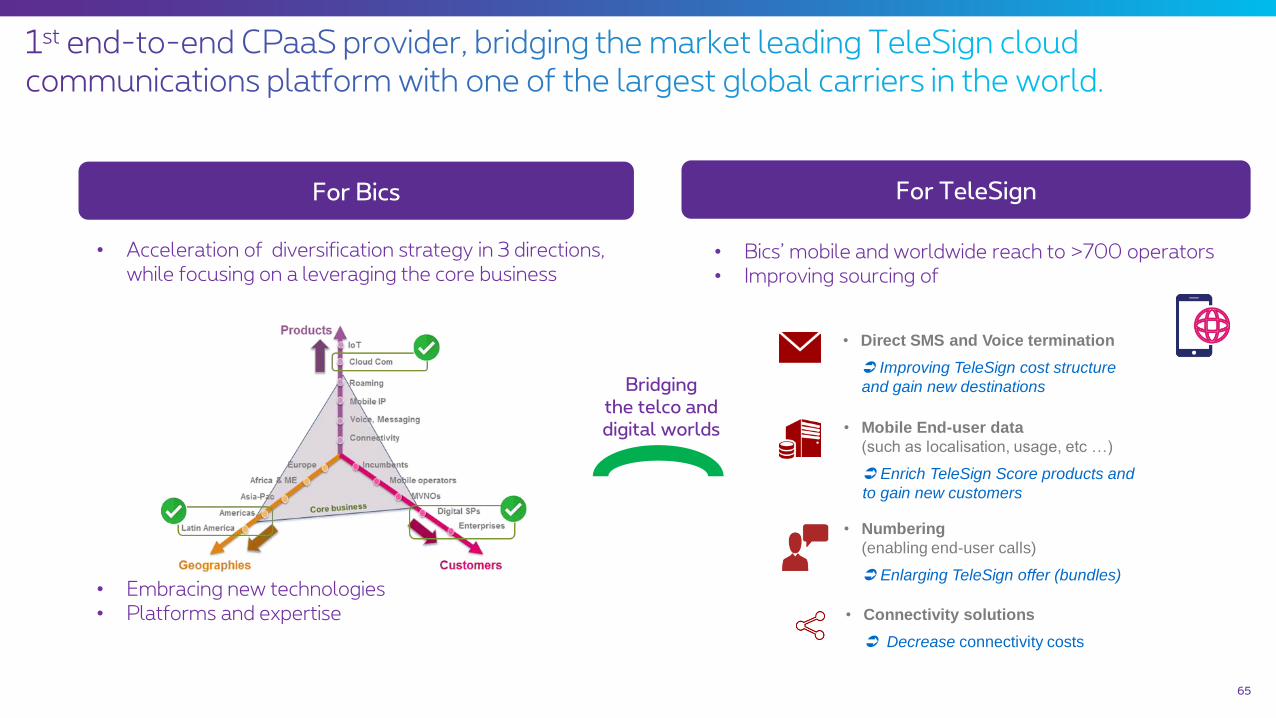
For Bics For TeleSign
• Acceleration of diversification strategy in 3 directions, while focusing on a leveraging the core business
• Embracing new technologies• Platforms and expertise
• Bics’ mobile and worldwide reach to >700 operators• Improving sourcing of
• Direct SMS and Voice termination
Improving TeleSign cost structure
and gain new destinations
• Numbering
(enabling end-user calls)
Enlarging TeleSign offer (bundles)
• Mobile End-user data
(such as localisation, usage, etc …)
Enrich TeleSign Score products and
to gain new customers
• Connectivity solutions
Decrease connectivity costs
Bridging the telco and digital worlds

End'13 End'14 End'15 End'16 End Q3'17
15,69914,187 14,090 13,633 13,120
66
Headcount evolution (FTE’s)
What:• Employees as from 60 years could opt to voluntary stop their active career, first wave left on 1 July 2016• Last 2 years of active career, the work time is reduced to 80%• Replacement income paid by Proximus until earliest retirement date
Outcome:• 1.855 FTEs subscribed to the plan, leaving in 2016-2020. • In addition, a significant number of employees will retire in the
period 2016-2020
• This will be slightly offset by limited external hiring for some specific domains and skills.
Early leave plan and retirements expected to lead to total outflow of about 2,750 FTEs by 2020
Financial implications:• Cumulated over the period 2016-2019, Proximus will report
€ 239M in non-recurring expense covering all costs related to the early leave plan.
• YTD’17 a non-recurring expense was recorded for € 56m.• The benefit as of H2’16 of the lower headcount is reflected in
underlying EBITDA, • Net Cash Flow impact slightly positive as of 2016 and will
build up over the years.
- 479 FTE’s in 1 year
End Q3’17: 29% of civil servants
AGE pyramid (excl. employees opting for Early leave plan & subsidiaries)
0
100
200
300
400
500
600
700
19 21 23 25 27 29 31 33 35 37 39 41 43 45 47 49 51 53 55 57 59 61 63 65
Contractual Statutory

16921442 1401
295
182 164
556
441 431
2010 2015 2016
Terajoule
Electricity Heating Vehicle fuel
61.8
47.3 45.4
8.7
3.0 3.0
2010 2015 2016
kTo
n C
O2
eScope 1 - Proximus Group * Scope 2 (market-based) – Proximus Group *
kton CO2e
67
Education
• Safe use of internet for children• Young people teaching the older
generation (www.webexperts.be)• Supporting technology-training for job
seekers (www.proximusdigitalent.com)
Environment
• Reduce our CO2 footprint • -70% (2007-2015).• -30% (2015-2025)
• Climate neutral for our own activities• Help customers reducing CO2 footprint• Collect & recycle for schools and
customers• Green business products
Communities
• School-videoconferencing for long-term ill children (www.bednet.be/www.takeoff-asbl.be )
• Accessible smartphones and tablets for disabled people
• Support local communities (homeless, refugees, disabled people…)
children educated on a safe use of internet
Long-term ill children connected with school in 2016
Read more in the annual CSR report on Proximus.com
CO2 footprint vs. 2010 Energy consumption vs. 2010
* Calculated according to the guidelines of the Greenhouse Gas Protocol

3GB to share between 2 cards
Always free calls to all numbers in Belgium. Mobile and with your fixed device. International calls not included.
Paying options available. (Play 10€, Play More 24,95€, Play Sports 18,40€)
Superfast unlimited surf
€100/m
10GB to share between 5 cards
Paying options available.(Play 10€, Play More 24,95€, Play Sports 18,40€)
Superfast unlimited surf
€120/m
10GB
Free national mobile calls. Free nat. and int. calls with fix line, evening and weekend, to fix and mobile numbers. Free calls between all numbers of your Tuttimus, always.
1 Blockbuster of your choice/month
Choose your favorite content
€101,94/m
3GB + 3GB
Superfast unlimited surfSuperfast unlimited surf
240 min national mobile calls.Nat. and int. calls with fixed line, evening and weekend, to fix and mobile numbers.Free calls between all numbers of your Tuttimus, always.
€106,93/m68
1 Blockbuster of your choice/month
Choose your favorite content
Always free calls to all numbers in Belgium. Mobile and with your fixed device. International calls not included.
Tuttimus MTuttimus S + 2nd mobile
with Mobilus S
Choose your favorite App : Choose your favorite App :
Wigo 100 Wigo 120

!
Mobile: 600 min to EU
FixUnl. to fix in EU
M L XL
Unlimited fixed and mobile callsUnlimited calls from mobile or fixed line to all fix & mobiles in Belgium. Take your fixed line with you on your smartphone thanks to Bizz Office Switch
A maximum of internet, fix and mobileUnlimited surfing at the office with INTENSE (100/20)2nd SIM with 3GB for your tabletUnlimited use of Facebook or another app of your choice
5 GB 10 GB
24h/24 assistance for your business Same day assistance for internet, fixed line or TV + Helpdesk 24/7Bizz Install : Configuration of your e-mail, OneDrive and Bizz Office Switch
Your business in the cloudSafe storage in the cloud (1TB) with OneDrive for BusinessProfessional e-mail address
Digital TV on all your screens (option €10)Free blockbuster, Netflix (original at €9,99 VAT incl.) and a discount of €1,65 VAT excl/mth on pack, TV Replay (36 h) & decoder included
WiFi Extender or
MCE for free if
needed
€79 €88 €105
€89 €98 €115
69
Extra mobile subscriptions for employees or family €20 €29 €46€13
S
Flexible & professional call management : Call Connect€20 for the 2 first licences
+€24 for each additional licence
€20+400 min international to EU and +6GB data national and EU
Option Bizz Data & International Calls (for Bizz Mobile XL)
20 GB
Prices including the changes as of August 2017 (4P: +2€ and +2 GB for M ; +3€ and +2GB for L; +8GB for XL)

Free installation
1 blockbuster for free / month
1 blockbuster for free/ month1 Choose your favorite content:
• Netflix• Belgian foot• International Sport• All kids• Movie&Series Pass• Entertainment Channels• ...
80 channels – TV Replay – Proximus TV app
Pick your favourite TV bundle and blockbuster
Free Evening & Weekends Calls National/International with your Fix Voice line to Fix and Mobile
Free calling in the evening and
in weekends
Familus M
€67
Familus L
€74.95
max. 100 Mbps download ; 15 Mbps upload ; unlimited Unlimited
fast internet
70
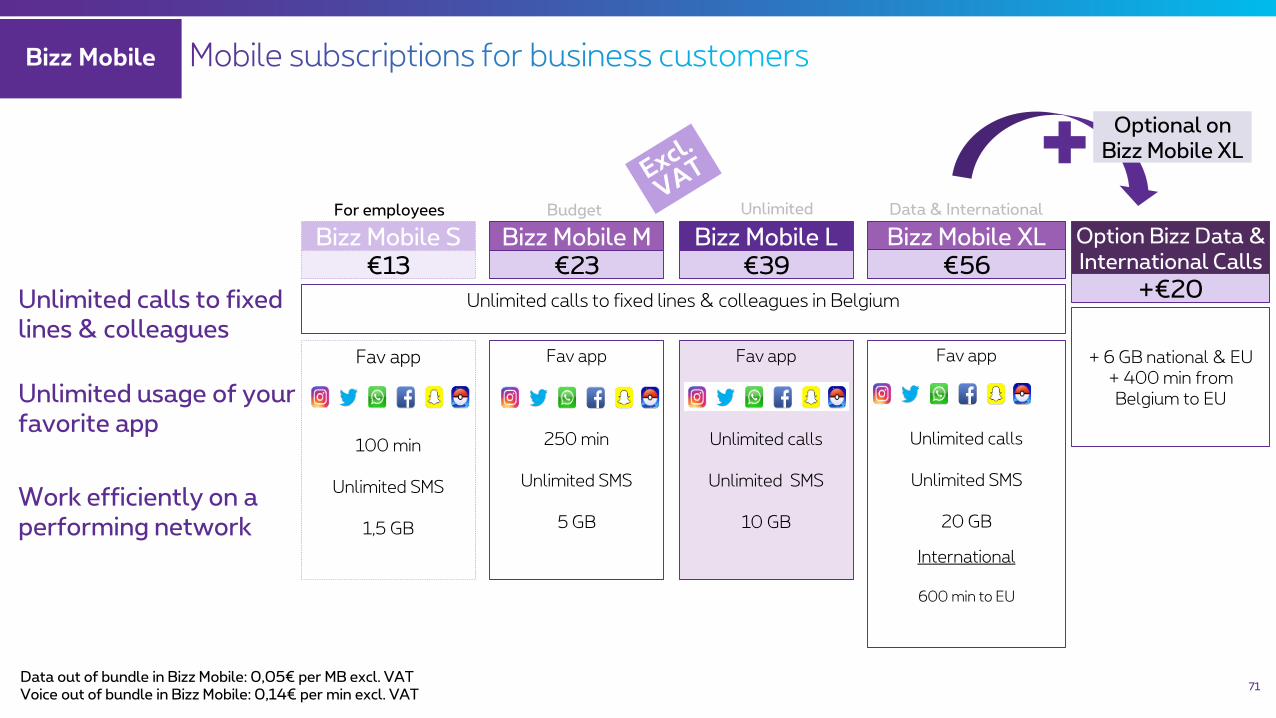
Bizz Mobile
71
Unlimited calls to fixed lines & colleagues
Unlimited usage of your favorite app
Work efficiently on a performing network
Data & International
Bizz Mobile XL€56
Fav app
Unlimited calls
Unlimited SMS
20 GB
International
600 min to EU
Bizz Mobile S€13
Fav app
100 min
Unlimited SMS
1,5 GB
For employees
Unlimited calls to fixed lines & colleagues in Belgium
Budget
Bizz Mobile M€23
Fav app
250 min
Unlimited SMS
5 GB
Unlimited
Bizz Mobile L€39
Fav app
Unlimited calls
Unlimited SMS
10 GB
Option Bizz Data & International Calls
+€20
+ 6 GB national & EU+ 400 min from Belgium to EU
Optional on Bizz Mobile XL
Data out of bundle in Bizz Mobile: 0,05€ per MB excl. VATVoice out of bundle in Bizz Mobile: 0,14€ per min excl. VAT

Positioning Scarlet as no frills brand, with very attractive pricing for ‘price seekers’
€ 8
150 min 1000 SMS
500 MB
€ 0.16 / minute€ 0.07 / SMS€ 0.05 / MB
Red
€ 28
1000 min 5000 SMS
4 GB
€ 0.16 / minute€ 0.07 / SMS€ 0.05 / MB
Chili
€ 18
500 min 2000 SMS
2 GB
€ 0.16 / minute€ 0.07 / SMS€ 0.05 / MB
Hot
Postpaid
€ 23 / monthInternet: 50 GB
Extra € 3 per block of 50 GBDown 30 Mbps
Up 2 Mbps
€ 39 / month
TV: ~30 channels+
Fixed Voice line: Free calls to fix Off Peak
+Internet: Unlimited volume
Down 50 Mbps Up 4 Mbps
TV + Fix + Internet
€ 35 / monthInternet: Unlimited volume
Down 50 Mbps Up 4 Mbps
72
Fixed
€ 15
0 min 0 SMS
5 GB
€ 0.20 / minute€ 0.05 / SMS€ 0.05 / MB
HiFive
90 min1000 SMS
+3€

Proximus, largest spectrum holder, allowing best in class customer experience
• Used for 3G
• 20 year-licenses valid until 15/3/21 :
Proximus paid €150m (one-off
payment)
• 2 Aug ‘11, BIPT awarded 4th license to
Telenet/Voo for €71.5m (2X 14.8 MHz)
• In May ‘14 Telenet/Voo handed back
their license (including their option in
the 900MHz band)
• Will be used for 4G
• Licenses granted in July
‘12
• 15 year-license valid
until 30/6/27
• Proximus paid €20.22m
(one-off payment)
• No coverage obligations
2600 MHz• 20 year-license valid
until 29/11/33
• Proximus paid €120
Mio (annual
instalments)
• License submitted to
coverage obligations
800 MHz 900MHz & 1800 MHz 2100 MHz
• Initially used for 2G but refarmed in 2011 to use 900MHz to deliver 3G services and 1800MHz to deliver 4G services
• 900MHz granted in ‘95 and 1800MHz in ‘99• 1st tacit extension (‘10-’15): Proximus paid €74m
(annual instalments)• 2nd tacit extension (8/4/15-14/03/21):
Proximus paid €75m (annual instalments)• Regulator re-assigned the 900MHz spectrum initially
reserved for Telenet/Voo : Proximus paid €16m (annual instalments)
Unallocated2 x 15
2600 MHz
Proximus
2 x 24.8OBEL
2 x 24.8Telenet*
2 x 24.81800 MHz
2100 MHz
Proximus 2 x 15
OBEL2 x 14.8
Telenet*2 x 14.8
1x5.4
1x5 1x5Unallocated
2 x 14.81x5
Proximus 2 x 20
OBEL2 x 20
Telenet*2 x 15
Voyacom1 x 45
Proximus
2 x 12.4OBEL
2 x 11.6Telenet*2 x 10.2
900 MHz
800 MHz
Proximus2 x 10
OBEL2 x 10
Telenet*2 x 10
For these
renewals
auctions
will be
organized
in 2018
29/11/33
15/03/21
15/03/21
15/03/21
30/06/27
Expiry dates
Current spectrum holdings New spectrum auctions
700 MHz
2X30MHz
Proposed expiry dates
1400 MHz 90MHz
3.4-3.8 GHz
Includedin BIPT
consultation
Allaround
2040
400MHz
* Telenet/Base following the acquisition in 2016
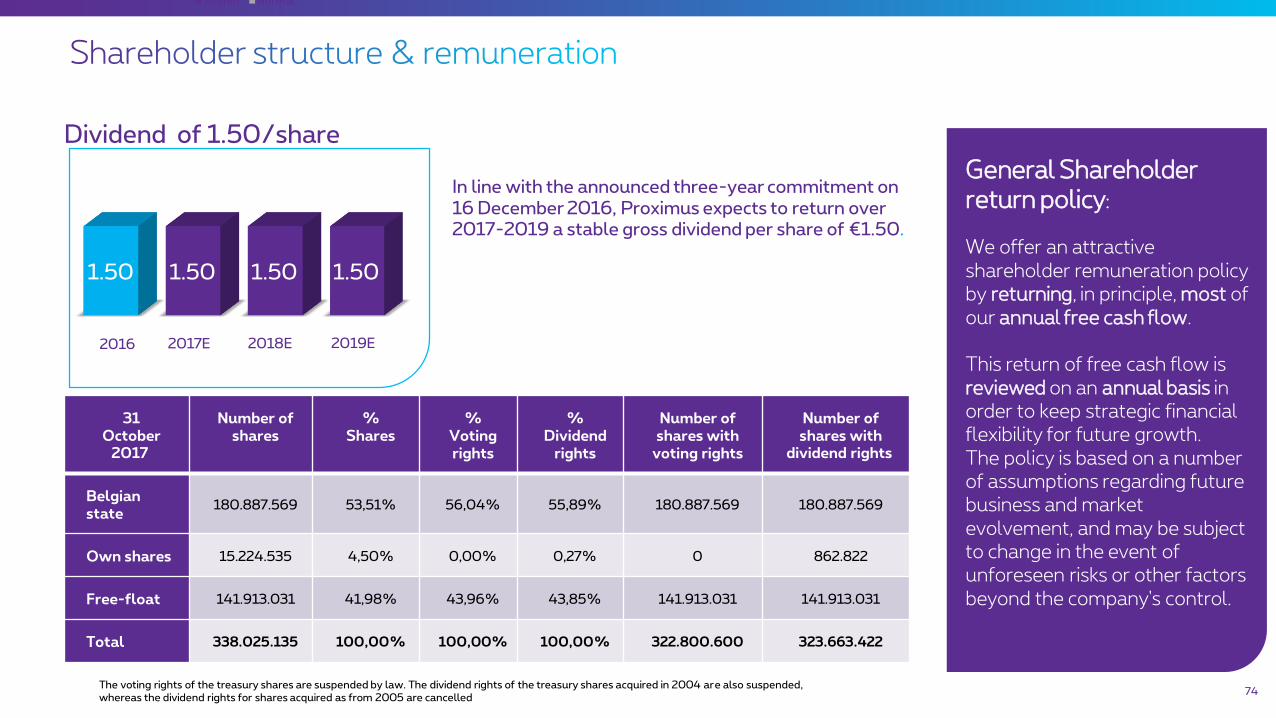
The voting rights of the treasury shares are suspended by law. The dividend rights of the treasury shares acquired in 2004 are also suspended,whereas the dividend rights for shares acquired as from 2005 are cancelled
status on
30/09/2015
General Shareholder return policy:
We offer an attractive shareholder remuneration policy by returning, in principle, most of our annual free cash flow.
This return of free cash flow is reviewed on an annual basis in order to keep strategic financial flexibility for future growth. The policy is based on a number of assumptions regarding future business and market evolvement, and may be subject to change in the event of unforeseen risks or other factors beyond the company's control.
31October
2017
Number of shares
% Shares
% Voting rights
% Dividend
rights
Number of shares with
voting rights
Number of shares with
dividend rights
Belgian state
180.887.569 53,51% 56,04% 55,89% 180.887.569 180.887.569
Own shares 15.224.535 4,50% 0,00% 0,27% 0 862.822
Free-float 141.913.031 41,98% 43,96% 43,85% 141.913.031 141.913.031
Total 338.025.135 100,00% 100,00% 100,00% 322.800.600 323.663.422
Dividend of 1.50/share
74
In line with the announced three-year commitment on 16 December 2016, Proximus expects to return over 2017-2019 a stable gross dividend per share of €1.50.
1.50 1.50 1.50 1.50
Interim Normal
2019E2016 2017E 2018E

Nancy Goossens
+32 2 202 82 41
Director Investor Relations
Sarah Franklin
+32 2 202 77 11
Investor Relations Manager
E-mail: [email protected]
Proximus investor relations website: www.proximus.com/en/investors
75

Cautionary statement
“This communication might include some forward-looking statements, without limitation,regarding Proximus’ financial or operational results, certain strategic plans or objectives,macro-economic trends, regulation, future market conditions and other risk factors. Theseforward-looking statements rely on a number of assumptions concerning future events andare subject to uncertainties and other factors, many of which are outside Proximus’ control.Therefore the actual future results may differ materially from those expressed in or impliedby the statements.
Readers are cautioned not to put undue reliance on forward-looking statements, which speak only of the date of this communication.
Proximus disclaims any intention or obligation to update and revise any forward-looking statements, whether as a result of new information, future events or otherwise”.
76