Embed Size (px)
Citation preview

Early Enhancement of Fluid Transport in Rabbit
Proximal Straight Tubules after Loss of
Contralateral Renal Excretory Function
KAORUTABEI, DAVID J. LEVENSON, and BARRYM. BRENNER,Laboratory of Kidneyand Electrolyte Physiology and Department of Medicine, Brigham andWomen's Hospital and Harvard Medical School, Boston, Massachusetts 02115
A B S T R A C T To assess the renal functional adapta-tion to reduced excretory capacity, we studied wholekidney and single nephron function in anesthetizedvolume-replete rabbits after unilateral (left kidney)nephrectomy (UNX), ureteral obstruction (UO), orureteroperitoneostomy (UP). At 24 h, despite the ab-sence of measurable hypertrophy of the contralateral(right) kidney, these procedures significantly increasedp-aminohippurate clearance (45-54%) and inulinclearance (CIN) (64-110%) compared with sham-op-erated control animals. In each group, whole kidneysodium reabsorption increased in proportion to the risein CIN-
To determine whether the intrinsic transport ca-pacity of proximal tubule segments is altered by thesemaneuvers, we measured fluid volume reabsorptionrate (Jv) in isolated superficial proximal straight tubule(PST) segments perfused in vitro, comparing each con-trol tubule (obtained by biopsy of the left kidney im-mediately before an experimental maneuver) with acorresponding tubule segment obtained 24 h or 7 dlater from the contralateral kidney. Control tubule Jvin sham-24 h animals averaged 0.48±0.04 nl/(min.mm). Jv did not change significantly at 24 h or 7 dafter sham maneuvers but increased significantly at 24h after UNX [AJv = 0.13±0.03 nl/(min-mm)], UO[AJv = 0.10±0.04 nl/(min-mm)], and UP [AJv= 0.13±0.04 nl/(min * mm)]. Jv remained increased bysimilar amounts at 7 d after UNXand UO. To evaluatewhether an increase in glomerular filtration rate (GFR)might be the stimulus to this augmentation in Jv val-
A preliminary abstract was presented at the 14th AnnualMeeting of the American Society of Nephrology, Washing-ton, DC, 22-24 November 1981.
Received for publication 6 June 1982 and in revised form18 May 1983.
ues, methylprednisolone (MP) (15 mg/kg per d) wasadministered daily to sham-operated animals, a ma-neuver which induced a 73% rise in CIN by day 5. Thisprocedure also produced a significant increase in Jvin PST at 5 d [AJv = 0.16±0.05 nl/(min * mm)]. Theincrease in Jv evident in each group at 5 or 7 d wasparalleled by an equivalent change in tubule cell vol-ume and apparent tubule luminal surface area inUNX-7d and MP-5d; no such increments in these in-dices, or in apparent tubule serosal surface area wereevident at 24 h in any group.
Thus, a 50% reduction in renal excetory function inthe rabbit provokes adjustments in renal plasma flowrate and GFR in the contralateral kidney, which areevident by 24 h. The concurrent change in Jv in PSTis closely related to CIN or some associated hemody-namic process, but does not appear to require an in-crease in tubule cell volume or apparent surface area.The ability to detect these small in vivo changes in Jvmay derive from the enhanced sensitivity of paired-kidney experiments using tubule segments obtainedby renal biopsy.
INTRODUCTION
Reduction of renal mass is usually followed by adap-tive increases in the size and function of the remnantkidney that serve to mitigate the disturbances of saltand water balance that would otherwise be likely toensue (1). Although the chronic adjustments in neph-ron size (2, 3), glomerular filtration rate (GFR)' (3-7),
I Abbreviations used in this paper: AL, apparent tubuleluminal surface area; As, apparent tubule serosal surfacearea; BW, body weight; C, control tubule; CIN, inulin clear-ance; CPAH, PAH clearance; EXP, experimental tubule;FENa, fractional sodium excretion; GFR, glomerular filtra-tion rate; ID, tubule inner diameter; Jv, net fluid volume
871J. Clin. Invest. © The American Society for Clinical Investigation, Inc. * 0021-9738/83/09/0871/11 $1.00Volume 72 September 1983 871-881
and tubule sodium and water reabsorption (7-12) thatresult have been well studied, less attention has beenpaid to the early alterations in renal function andmorphology that follow loss of functional renal tissue.Recent studies indicate that within several hours afterunilateral nephrectomy (UNX) in volume-replete an-imals, the remaining kidney exhibits a significant risein GFRand filtered load of sodium (13, 14). Becauseonly a small fraction of the increment in filtered so-dium is excreted in the urine, it may be deduced thatwhole kidney sodium reabsorption (TNa) rises duringthis acute period. A variety of hemodynamic and hor-monal alterations contribute to this phenomenon, butan increase in the intrinsic fluid reabsorptive capacityof tubule segments may also be an important factor.Such increases have been demonstrated by in vitroperfusion of isolated proximal straight tubule (PST)and proximal convoluted tubule (PCT) segments ob-tained from rabbits weeks to months after reductionin nephron mass (15, 16). Since increases in tubuleweight and luminal surface area were also observedin the PCTsegments (16), tubule hypertrophy was sug-gested to be the mechanism underlying these chronicadaptations in tubule sodium reabsorption.
To assess the relationship between the early func-tional and hypertrophic responses, we performedclearance and in vitro tubule perfusion studies in rab-bits 24 h and 7 d after elimination of unilateral renalexcretory function. Regardless of the technique usedto abolish unilateral excretory function-UNX, uni-lateral ureteral ligation (UO), or unilateral uretero-peritoneostomy (UP)-GFR and TNa were increased.The rise in TNa that resulted from these maneuvers,or from administration of methylprednisolone (MP),was accompanied by an increase in the in vitro fluidreabsorption rate (Jv) of PST segments. Although tu-bule hypertrophy may account for the augmented Jvvalues seen 7 d after loss of contralateral renal func-tion, this mechanism does not appear to explain theearly increases in Jv which were demonstratedat 24 h.
METHODSGeneral. Since animal-to-animal variations in net trans-
tubular fluid transport in PST contribute to the variability
reabsorption rate; MP, methylprednisolone; Pa, mean arte-rial blood pressure; PAH, p-aminohippurate; PCT, proximalconvoluted tubule; PD, transepithelial electrical potentialdifference; PNa, plasma sodiuim concentration; PST, proximalstraight tubule; RtKW, right kidney wet weight; TNa, wholekidney sodium reabsorption rate; UNaV, urinary sodium ex-cretion rate; UNX, unilateral nephrectomy; UO, unilateralureteral ligation; UP, unilateral ureteroperitoneostomy; VOL,tubule cell volume.
in measured Jv values, we developed a technique that per-mits paired comparison of results from the same animal be-fore and after experimental manipulations. In each animal,the initial control tubule (C) was dissected from tissue ob-tained by open left renal biopsy immediately before the ex-perimental maneuver; the experimental tubule (EXP) wasobtained 24 h, 5 d, or 7 d later from the right kidney. Clear-ance studies were performed on an unpaired basis 1 or 5 dafter the experimental manipulation; animal preparation,including open biopsy, was in all respects the same as forin vitro tubule perfusion.
Animal preparation. Female New Zealand white rabbitsweighing 1.25-2.27 kg were housed in temperature-con-trolled quarters and were fed standard rabbit chow (CharlesRiver Formula, Agway-Country Foods, Agway Inc., Wav-erly, NY). Animals were anesthetized with pentobarbital so-dium (Nembutal, Abbott Laboratories, North Chicago, IL),20-25 mg/kg body wt i.v., and the left kidney was exposedretroperitoneally via a flank incision. A small longitudinalwedge biopsy specimen (10-15-mm long by 1.5-2.0-mmwide by 7-mm deep) was obtained from the midline of thekidney surface by making parallel incisions with a scalpelblade, and cutting the medullary pole of the specimen witha pair of right-angle forceps introduced into the incisions.The specimen was used for in vitro perfusion experiments(C) or discarded if clearance studies were subsequently per-formed. Hemostasis was established within 1-2 min by pack-ing the biopsy site with an absorbable gelatin sponge (Gel-foam, Upjohn Co., Kalamazoo, MI); specific experimentalmanipulations were then performed (see below). The ani-mals regained consciousness within 2-3 h and were givenfree access to food and water.
Experimental manipulations that followed immediatelyafter left renal biopsy included (a) sham: the ipsilateral renalpedicle was manipulated and the flank incision was thenclosed with 2-0 silk sutures (26 rabbits); (b) UNX: ipsilateralnephrectomy was performed before closure of the flank in-cision (26 rabbits); (c) UO: the ipsilateral ureter was occludedby a ligature placed just below the renal pelvis and the in-cision was then closed (26 rabbits); (d) UP: a 3-cm lengthof silicone elastomer tubing, 1.2 mmo.d. (Retract-0-Tape,Med-Pro Division, Quest Medical Inc., Carrolton, TX), wasinserted into the ipsilateral ureter 1-2 cm below the renalpelvis. The distal end of the catheter was inserted into theperitoneum, thereby creating a UP, after which the flankincision was closed (18 rabbits). Eight additional rabbits inthis group were subsequently found to have peritonitis orcatheter obstruction within 24 h and were discarded; (e)normal: these unoperated animals served as additional con-trols in clearance experiments only (six rabbits); (f) MP: afterclosure of the flank incision, MP sodium succinate, (Solu-Medrol, Upjohn Co.) was administered intramuscularly in0.9% saline in a dose of 15 mg/kg per d for 4 consecutived (15 rabbits); (g) MP-control: animals were prepared as forMP, but received daily injections of 0.9% NaCl instead ofMP for 4 consecutive d (five rabbits).
Evaluation of the right kidney by clearance study or invitro tubule perfusion was performed at 24 h in sham-24 h,UO-24 h, and UP-24 h groups. In vitro perfusion of PSTsegments from the right kidney was also performed at 7 din sham-7 d, UNX-7 d, and UO-7 d groups. UP animals werenot studied at 7 d. Right kidney clearance and in vitro tubuleperfusion studies were performed in MP-5 d and MP-control-5 d groups at 5 d, an interval known to be sufficient for MPto induce significant increases in GFR in the rat (17).
At the time of the right kidney studies, animals wereweighed and again anesthetized with pentobarbital. For in
872 K. Tabei, D. J. Levenson, and B. M. Brenner
vitro perfusion studies (experimental tubule), the right kid-ney was immediately removed, and several 1-2-mm-thicktransverse midline slices were obtained and dissected as de-scribed below. For clearance studies, the right kidney wasleft in place and the animal was prepared as described below.
Clearance studies. After induction of anesthesia, a tra-cheostomy was performed, the left femoral artery and veinwere catheterized with PE 50 tubing (Becton, Dickinson andCo., Parsippany, NJ) and the venous hematocrit was deter-mined. A small suprapubic incision was made and a silasticcatheter was inserted into the distal right ureter for collec-tion of urine. A sample of urine was aspirated from thebladder for sodium determination. Rabbit serum (M.A. Bio-products, Walkersville, MD) was infused via femoral veinat a rate of 33 mI/h for 10-14 min until a total of 0.4% bodywt had been delivered. Thereafter, a maintenance infusionof plasma was given at the rate of 3.1 ml/h for the durationof the experiment. A solution containing 14 mg/ml p-ami-nohippurate (PAH, Merck, Sharp and Dohme, Division ofMerck and Co., Inc., West Point, PA) and 70 mg/ml inulin(Arnar-Stone Lab., Inc., Mt. Prospect, IL) in 0.9% NaCl wasalso infused by femoral vein throughout the experimentmaintaining plasma PAHconcentration below 4 mg/100 ml.Mean arterial blood pressure (Pa) was measured in the fem-oral artery via a pressure transducer (Statham Model P23Db,Gould Statham Instruments Co., Hato-Ray, Puerto Rico) andrecorded on a strip-chart recorder (Gould Brush 2200, GouldInc., Cleveland, OH). In most experiments, Pa fell by 10-20mmHgduring the first 30-60 min after blood pressure re-cording was begun and then became stable. Rabbits in whichPa fell by 30 mmHgor more, or in which mean Pa was<70 mmHg, were discarded. After a 90-120-min equilibra-tion period, three or four timed urine collections (10 mineach) were obtained in plastic tubes and urine volume wasdetermined by weighing. At the midpoint of each urine col-lection period, blood samples were collected from the fem-oral artery for measurement of hematocrit and PAH, inulin,and sodium concentrations. At the end of the experiment thekidney was removed, decapsulated, squeezed to removeblood and urine, and weighed.
Analysis. Sodium concentrations in urine and plasmawere measured by flame photometry (Instrumentation Lab-oratory, Inc., Lexington, MA). PAH was measured by themethod of Bratton and Marshall (18), and inulin by themacroanthrone method of Fiihr et al. (19).
Preparation of perfusate and bath solutions. In thesham-24 h, UNX-24 h, UO-24 h, and UP-24 h groups, ar-tificial perfusate and bath solutions were used in perfusionexperiments involving both control and experimental tu-bules. The composition of perfusate solution (in millimolesper liter) was: NaCl, 114; NaHCO3, 25; MgSO4, 1.2;K2HPO4, 2.5; Na3 citrate, 1.0; sodium lactate, 4.0; CaCl2,2.0; glucose, 5.5; l-alanine, 6.0. The composition of the bathsolution was identical, except that it contained 6.0 g/100 mldefatted bovine serum albumin (Sigma Chemical Co., St.Louis, MO), 3 mmol/liter CaCl2, and sufficient 1 M NaClto match the final osmolality of the perfusate (mean, 295mosmol). Both solutions were bubbled with 95% 02/5% CO2for 25-30 min before use, and pH was adjusted to 7.40. Forany given pair of C and EXP perfusion experiments, thesame batches of bath and perfusion solutions were employed,and the solutions were stored at 4°C during the 24-h periodbetween observations.
In later experiments involving sham-7 d, UNX-7 d, UO-7 d, MP-5 d, and MP-control-5 d groups, normal rabbit serum(M.A. Bioproducts) was used as bath solution instead of ar-tificial bath, because available supplies of defatted albumin
resulted in tubule cell vacuolization and degeneration, withunstable and near-zero values for Jv. In these experiments,tubules were perfused with serum ultrafiltrate, prepared bythe use of Amicon CF 25 ultrafiltration membrane cones(Amicon Corp., Lexington, MA), with serum centrifuged atthe rate of 1,500 rpm for 15 min at 4°C. After bubbling, thepH was adjusted to 7.4 and osmolality to 300 mosmol. Thesame batches of serum and ultrafiltrate were used for anygiven pair of control and experimental observations. Solu-tioIns were stored at minus 20°C during the 5- or 7-d periodbetween study of C and EXP, and the osmolality was re-checked after thawing.
In vitro tubule perfusion. For tubule dissection, the renalbiopsy or tissue slice was transferred to a bath of chilledartificial perfusion solution bubbled with 95% 02/5% CO2.To ensure that all tubules were obtained from the same an-atomic region of the kidneys, i.e., the intersection of thelongitudinal and transverse axes, PST were dissected fromthe midportion of biopsy or tissue slice specimens. Tubulebundles were grasped at the corticomedullary junction withfine forceps, and pulled in the direction of the outer cortex;individual PST were teased free from these bundles. Onlysuperficial PST that joined PCT in the outermost 0.5 mmofcortex were used in these studies. When possible, the lengthof the experimental tubule was adjusted by trimming thedistal end of the tubule, so as to match the length of itspaired control tubule. Tubule lengths ranged from 1.15 to3.5 mm.
Each tubule was transferred to a 38°C thermostaticallycontrolled bath containing 1.4 ml of artificial bath solutionor rabbit serum that was bubbled continuously with 95% 02/5% CO2 to maintain pH 7.40. Tubules were perfused withconcentric glass pipets by the method of Burg et al. (20, 21),with outermost pipets containing Sylgard 184 dielectric(Dow Corning Corp., Midland, MI). 14C-Carboxy inulin(New England Nuclear, Boston, MA) was added to the per-fusate (25 MCi/ml) as a volume marker and FD-C No. 3 dye(Aniline and Chemical Co., Chicago, IL) was also added (0.2mg/ml) to detect leaks or damaged cells. If more than fivecells were stained with dye, the tubule was discarded. In allexperiments, perfusion rate was maintained within the rangeof 7 to 12 nl/min by altering the height of the perfusatereservoir. After a 25-30-min period of equilibration, fourto five consecutive collections of tubule fluid were madeunder mineral oil into a constriction pipette that was cali-brated before the experiment. Samples of collected fluidwere transferred into scintillation vials containing 3 ml 0.1Macetic acid and 7 ml Aquasol liquid scintillation fluid (NewEngland Nuclear), and were counted in a Tri-Carb liquidscintillation spectrometer (Packard Instrument Co., Inc.,Downers Grove, IL) to determine '4C activity. Jv was cal-culated as follows (21): Jv = [(CQ/Co) - 1]Vi/l, where C,and Co are 14C activities in the collected and perfused fluids,respectively, Vi is the rate of tubule fluid collection, and 1is the tubule length. Bath solution was collected at the endof each tubule fluid collection period and the 14C-inulin con-centration determined. If the calculated leakage rate ex-ceeded 0.5% of the perfusion rate, the experiment was dis-carded. Tubule lengths were measured at the end of exper-iments with a calibrated reticle in the eyepiece of themicrosope. Outer and inner tubule diameters (OD and ID,respectively) were measured from a photograph taken at amagnification of X400; measurements were made every 0.05mmalong the central portion of the tubule and mean valuescalculated. The inner diameter was measured as the distancebetween the tops of the opposing brush border membranes.Tubule cell volume (VOL) and apparent tubule serosal and
Fluid Transport in Rabbit Proximal Straight Tubules 873
luminal surface areas (As and AL, respectively) were cal-culated with standard formulas for a simple thick-walledtube.
The perfusion pipette, which served as the luminal elec-trode, was connected to a calomel half-cell through a 0.16MNaCl-4% agar bridge. The half-cell was connected to theinput of a dual electrometer (model F-233 A, W-P Instru-ments Inc., New Haven, CT). From the bath, the circuit wascompleted with a similar agar bridge connected to a ref-erence calomel half-cell grounded through a precision mil-livolt reference source (model 101, W-P Instruments Inc.),which was used to calibrate the electrometer. Transepithelialelectrical potential difference (PD) was nulled on the elec-trometer before attaching the tubule and was monitoredcontinuously throughout each tubule perfusion experiment.
Statistics. Results are presented as mean±SE. Statisticalsignificance was accepted at P < 0.05. Results for clearancestudies for sham-24 h, normal, UNX-24 h, UO-24 h, and UP-24 h groups were compared by one-way analysis of variance(22). When significant differences were identified, Bonfer-roni's test (23), a version of the t test appropriate for multiplecomparisons, was used to identify significant differences be-tween sham-24 h and each of the other groups. Clearancedata from MP-5 and MP-control-5 d groups were comparedby the unpaired t test (22). In perfused tubule experiments,each EXP was compared with the C from the same animal,permitting calculation of paired differences (A) for eachparameter within each group. These paired differences werethen compared, by one-way analysis of variance and Bon-ferroni's test as described above, among sham-24 h, UNX-24 h, UO-24 h, and UP-24 h groups, and among sham-7 d,UNX-7 d, and UO-7 d groups. Since no control group wasavailable for comparison with MP-5 d, EXP and C data forthis group were compared directly by the paired t test (22).Data organization and statistical calculations were per-formed on CLINFO data management and analysis systemof the General Clinical Research Center, Brigham andWomen's Hospital.
RESULTS
Clearance studies. The results obtained in clear-ance studies in sham-24 h, normal, UNX-24 h, UO-24h, and UP-24 h rabbits are summarized in Table I.There were no significant differences in body weight(BW), right kidney wet weight (RtKW), Pa, or plasmasodium concentration (PNa) among these groups. Sham-24 h and normal did not differ significantly in valuesfor inulin clearance (CIN), PAH clearance (CPAH),plasma sodium concentration (PNa) X CIN, urinary so-dium excretion rate (UNaV), whole kidney sodiumreabsorption rate (TNa), and fractional sodium excre-tion (FENa), although these measures of renal functiontended to be lower in sham-24 h animals. There werealso no significant differences between sham-24 h andnormal in values for hematocrit (36.2±1.4 vs. 39.5±1.3)or urinary sodium concentration (97.9±16.6 vs.53.4±13.7 meq/liter) measured at the start of clear-ance studies. These data indicate that the surgicalpreparation of the animals (i.e., flank incision and renalbiopsy) did not significantly alter contralateral renalfunction and sodium metabolism when studied 24 hlater.
In contrast, inulin clearance increased significantlyin UNX-24 h, UO-24 h, and UP-24 h, when comparedwith sharn-24 h, on average by 110, 69, and 64%, re-spectively. PAHclearance also increased significantly,on average by 54 and 45% in UNX-24 h and UO-24h groups, respectively, compared with sham-24 h. The40% increase in CPAH observed in UP-24 h did not
TABLE ISummary of Results Obtained in Right Kidney Clearance Studies 24 h after Left Kidney Manipulation
No. ofStudy animals BW RtKW Pa CIN CPAH' PN. PN. X CIN UN.V TN. FeN. X 100
kg g mmHg ml/min m/min meqlliter peq/min jeq/min peq/min %
Sham-24 h 7 1.70 6.31 88.1 2.45 14.4 139.7 342 1.90 340 0.56±0.07 ±0.38 ±3.6 ±0.19 ±0.9 ±1.2 ±24 ±0.63 ±24 ±0.20
Normal 6 1.81 6.20 88.2 3.20 15.1 141.4 454 3.15 450 0.67±0.13 ±0.30 ±1.3 ±0.24 ±0.7 ±2.7 ±39 ±1.06 ±38 ±0.23
UNX-24 h 7 1.75 6.67 92.3 5.14t 22.2t 138.8 712t 4.87 707t 0.72±0.13 ±0.40 ±2.9 ±0.50 ±2.9 ±0.7 ±68 ±0.62 ±68 ±0.10
UO-24 h 9 1.88 7.44 90.1 4.14t 20.9§ 138.4 5861 4.68 581t 0.84±0.11 ±0.39 ±3.5 ±0.43 ±1.5 ±1.0 ±60 ±1.32 ±66 ±0.22
UP-24 h 8 1.75 6.55 93.9 4.02§ 20.3 139.0 557§ 3.01 554§ 0.54±0.12 ±0.30 ±2.9 ±0.25 ±1.3 ±1.1 ±33 ±0.94 ±33 ±0.18
All data±SE.o For CPAII: UNX-24 h, n = 6; UO-24 h, n = 8; UP-24 h, n = 6. For UNaV:I P < 0.01 vs. sham-24 h.§ P < 0.05 vs. sham-24 h.
UO-24 h, n = 8.
874 K. Tabei, D. J. Levenson, and B. M. Brenner
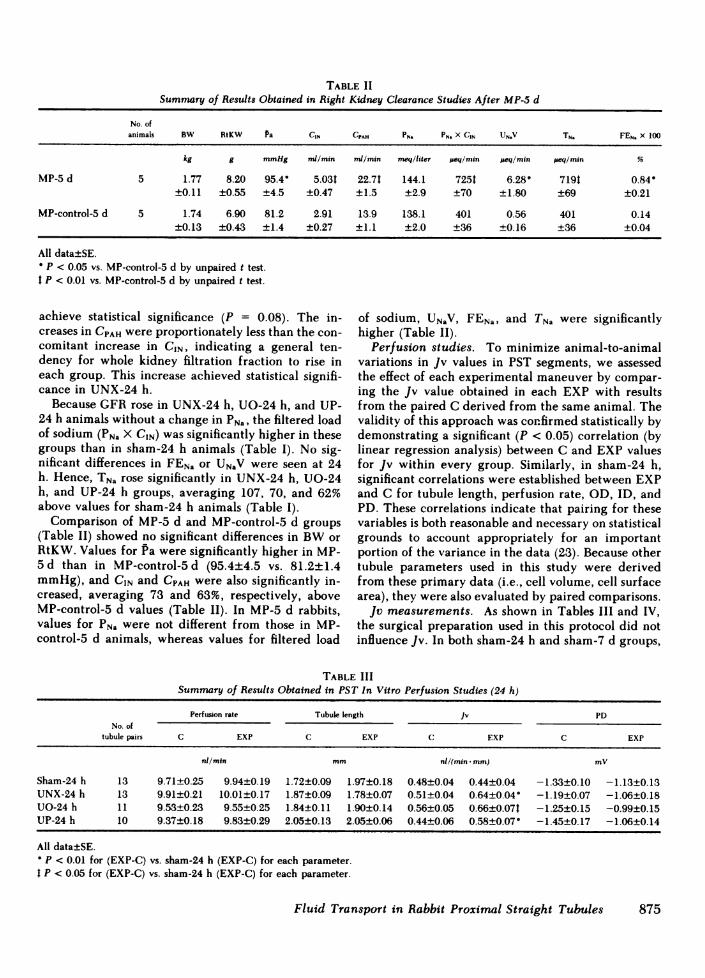
TABLE IISummary of Results Obtained in Right Kidney Clearance Studies After MP-5 d
No. ofanimals BW RtKW Pa CIN CPAH PN. PN. X CIN UN.V TN. FEN. X 100
kg g mmHg nd/min mi/min meq/liter peq/min ueq/min #eq/min %
MP-5 d 5 1.77 8.20 95.4 5.03t 22.71 144.1 7251 6.28" 719t 0.84-±0.11 ±0.55 ±4.5 ±0.47 ±1.5 ±2.9 ±70 ±1.80 ±69 ±0.21
MP-control-5 d 5 1.74 6.90 81.2 2.91 13.9 138.1 401 0.56 401 0.14±0.13 ±0.43 ±1.4 ±0.27 ±1.1 ±2.0 ±36 ±0.16 ±36 ±0.04
All data±SE.P < 0.05 vs. MP-control-5 d by unpaired t test.
t P < 0.01 vs. MP-control-5 d by unpaired t test.
achieve statistical significance (P = 0.08). The in- of sodium, UNaV, FENa, and TNa were significantlycreases in CPAHwere proportionately less than the con- higher (Table II).comitant increase in CIN, indicating a general ten- Perfusion studies. To minimize animal-to-animaldency for whole kidney filtration fraction to rise in variations in Jv values in PST segments, we assessedeach group. This increase achieved statistical signifi- the effect of each experimental maneuver by compar-cance in UNX-24 h. ing the Jv value obtained in each EXP with results
Because GFRrose in UNX-24 h, UO-24 h, and UP- from the paired C derived from the same animal. The24 h animals without a change in PNa, the filtered load validity of this approach was confirmed statistically byof sodium (PNa X CIN) was significantly higher in these demonstrating a significant (P < 0.05) correlation (bygroups than in sham-24 h animals (Table I). No sig- linear regression analysis) between C and EXP valuesnificant differences in FENa or UNaV were seen at 24 for Jv within every group. Similarly, in sham-24 h,h. Hence, TNa rose significantly in UNX-24 h, UO-24 significant correlations were established between EXPh, and UP-24 h groups, averaging 107, 70, and 62% and C for tubule length, perfusion rate, OD, ID, andabove values for sham-24 h animals (Table I). PD. These correlations indicate that pairing for these
Comparison of MP-5 d and MP-control-5 d groups variables is both reasonable and necessary on statistical(Table II) showed no significant differences in BWor grounds to account appropriately for an importantRtKW. Values for Pa were significantly higher in MP- portion of the variance in the data (23). Because other5 d than in MP-control-5 d (95.4±4.5 vs. 81.2±1.4 tubule parameters used in this study were derivedmmHg), and CIN and CPAH were also significantly in- from these primary data (i.e., cell volume, cell surfacecreased, averaging 73 and 63%, respectively, above area), they were also evaluated by paired comparisons.MP-control-5 d values (Table II). In MP-5 d rabbits, Jv measurements. As shown in Tables III and IV,values for PNa were not different from those in MP- the surgical preparation used in this protocol did notcontrol-5 d animals, whereas values for filtered load influence Jv. In both sham-24 h and sham-7 d groups,
TABLE IIISummary of Results Obtained in PST In Vitro Perfusion Studies (24 h)
Perfusion rate Tubule length Jv PDNo. of
tubule pairs C EXP C EXP C EXP C EXP
nl/min mm nl/(min- mm) mv
Sham-24 h 13 9.71±0.25 9.94±0.19 1.72±0.09 1.97±0.18 0.48±0.04 0.44±0.04 -1.33±0.10 -1.13±0.13UNX-24 h 13 9.91±0.21 10.01±0.17 1.87±0.09 1.78±0.07 0.51±0.04 0.64±0.04" -1.19±0.07 -1.06±0.18UO-24 h 11 9.53±0.23 9.55±0.25 1.84±0.11 1.90±0.14 0.56±0.05 0.66±0.071 -1.25±0.15 -0.99±0.15UP-24 h 10 9.37±0.18 9.83±0.29 2.05±0.13 2.05±0.06 0.44±0.06 0.58±0.07 -1.45±0.17 -1.06±0.14
All data±SE.P < 0.01 for (EXP-C) vs. sham-24 h (EXP-C) for each parameter.
I P < 0.05 for (EXP-C) vs. sham-24 h (EXP-C) for each parameter.
Fluid Transport in Rabbit Proximal Straight Tubules 875
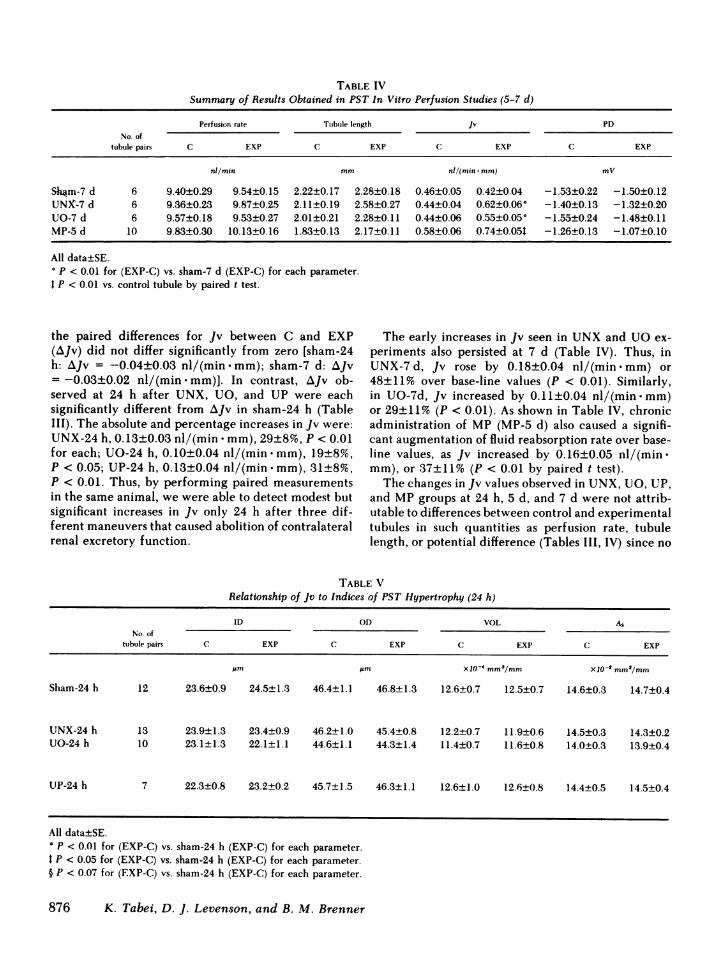
TABLE IVSummary of Results Obtained in PST In Vitro Perfusion Studies (5-7 d)
Perfusion rate Tubule length Jv PDNo. of
tubule pairs C EXP C EXP C EXP C EXP
nl/min mm nl/(min * mm) mV
Sh4m-7 d 6 9.40±0.29 9.54±0.15 2.22±0.17 2.28±0.18 0.46±0.05 0.42±0.04 -1.53±0.22 -1.50±0.12UNX-7 d 6 9.36±0.23 9.87±0.25 2.11±0.19 2.58±0.27 0.44±0.04 0.62±0.06° -1.40±0.13 -1.32±0.20UO-7 d 6 9.57±0.18 9.53±0.27 2.01±0.21 2.28±0.11 0.44±0.06 0.55±0.05* -1.55±0.24 -1.48±0.11MP-5 d 10 9.83±0.30 10.13±0.16 1.83±0.13 2.17±0.11 0.58±0.06 0.74±0.05t -1.26±0.13 -1.07±0.10
All data±SE.° P < 0.01 for (EXP-C) vs. sham-7 d (EXP-C) for each parameter.t P < 0.01 vs. control tubule by paired t test.
the paired differences for Jv between C and EXP The early increases in Jv seen in UNXand UOex-(AJv) did not differ significantly from zero [sham-24 periments also persisted at 7 d (Table IV). Thus, inh: AJv = -0.04±0.03 nl/(min mm); sham-7 d: AJv UNX-7d, Jv rose by 0.18±0.04 nl/(min.mm) or=-0.03±0.02 nl/(min mm)]. In contrast, AJv ob- 48±11% over base-line values (P < 0.01). Similarly,served at 24 h after UNX, UO, and UP were each in UO-7d, Jv increased by 0.11±0.04 nl/(min.mm)significantly different from AJv in sham-24 h (Table or 29±11% (P < 0.01). As shown in Table IV, chronicIII). The absolute and percentage increases in Jv were: administration of MP (MP-5 d) also caused a signifi-UNX-24 h, 0.13±0.03 nl/(min * mm), 29±8%, P < 0.01 cant augmentation of fluid reabsorption rate over base-for each; UO-24 h, 0.10±0.04 nl/(min -mm), 19±8%, line values, as Jv increased by 0.16±0.05 nl/(min .P < 0.05; UP-24 h, 0.13±0.04 nl/(min -mm), 31±8%, mm), or 37±11% (P < 0.01 by paired t test).P < 0.01. Thus, by performing paired measurements The changes in Jv values observed in UNX, UO, UP,in the same animal, we were able to detect modest but and MPgroups at 24 h, 5 d, and 7 d were not attrib-significant increases in Jv only 24 h after three dif- utable to differences between control and experimentalferent maneuvers that caused abolition of contralateral tubules in such quantities as perfusion rate, tubulerenal excretory function. length, or potential difference (Tables III, IV) since no
TABLE VRelationship of Jv to Indices of PST Hypertrophy (24 h)
ID OD VOL A,No. of
tubule pairs C EXP C EXP C EXP C EXP
jam pm X10' mma/mm X10-2 mm2/mm
Sham-24 h 12 23.6±0.9 24.5±1.3 46.4±1.1 46.8±1.3 12.6±0.7 12.5±0.7 14.6±0.3 14.7±0.4
UNX-24 h 13 23.9±1.3 23.4±0.9 46.2±1.0 45.4±0.8 12.2±0.7 11.9+0.6 14.5+0.3 14.3±0.2UO-24 h 10 23.1±1.3 22.1±1.1 44.6±1.1 44.3±1.4 11.4±0.7 11.6±0.8 14.0±0.3 13.9±0.4
UP-24 h 7 22.3±0.8 23.2±0.2 45.7±1.5 46.3±1.1 12.6±1.0 12.6±0.8 14.4±0.5 14.5±0.4
All data±SE.° P < 0.01 for (EXP-C) vs. sham-24 h (EXP-C) for each parameter.t P < 0.05 for (EXP-C) vs. sham-24 h (EXP-C) for each parameter.§ P < 0.07 for (EXP-C) vs. sham-24 h (EXP-C) for each parameter.
876 K. Tabei, D. J. Levenson, and B. M. Brenner
significant changes in these parameters were foundbetween control and experimental tubules in anygroup. Although comparison of AJv results between24 h and 7 d groups may not be strictly appropriate,because different types of bath and perfusate solutionswere used, no significant differences were evident invalues for AJv between UNX-24 h and UNX-7 d, orbetween UO-24 h and UO-7 d.
Relationship of Jv to tubule hypertrophy. Asshown in Tables I and II, no significant increase wasnoted in RtKW at 24 h after UNX, UO, or UP, nor at5 d in the MP-5 d group. However, the possibilityexisted that more subtle hypertrophic changes couldaccount for observed increases in Jv. To assess whetherincreases in tubule volume or surface area paralleledthe rise in fluid reabsorption rate seen after UNX, UO,UP, and MP, we used mean ID and ODto calculateVOL, AL, and AS, on the assumption that these surfacescould be represented by simple cylinders. Results ofthese measurements and calculations are shown inTables V and VI. (Because photographs adequate formeasurements of ID and ODwere not obtained in alltubules in which Jv was measured, fewer tubule pairsare included in these analyses than were used for mea-surement of Jv).
No differences in values for control tubule OD, ID,VOL, AL, and As were found when sham-24 h, UNX-24 h, UO-24 h, and UP-24 h groups were compared(Table V). Furthermore, no significant changes in theseparameters were seen in paired comparisons of controland experimental tubules from each of these groups(Table V). These findings indicate that tubule hyper-trophy is not evident at this early period after loss of
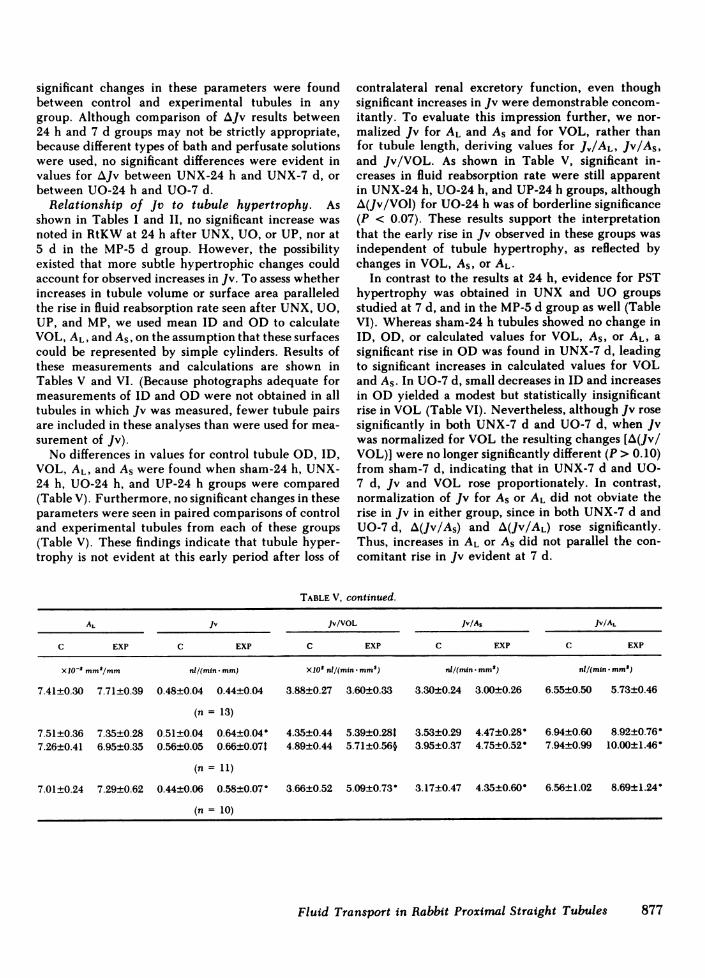
contralateral renal excretory function, even thoughsignificant increases in Jv were demonstrable concom-itantly. To evaluate this impression further, we nor-malized Jv for AL and AS and for VOL, rather thanfor tubule length, deriving values for J,/AL, Jv/As,and Jv/VOL. As shown in Table V, significant in-creases in fluid reabsorption rate were still apparentin UNX-24 h, UO-24 h, and UP-24 h groups, althoughA(Jv/VOl) for UO-24 h was of borderline significance(P < 0.07). These results support the interpretationthat the early rise in Jv observed in these groups wasindependent of tubule hypertrophy, as reflected bychanges in VOL, As, or AL-
In contrast to the results at 24 h, evidence for PSThypertrophy was obtained in UNX and UO groupsstudied at 7 d, and in the MP-5 d group as well (TableVI). Whereas sham-24 h tubules showed no change inID, OD, or calculated values for VOL, AS, or AL, asignificant rise in ODwas found in UNX-7 d, leadingto significant increases in calculated values for VOLand As. In UO-7 d, small decreases in ID and increasesin ODyielded a modest but statistically insignificantrise in VOL (Table VI). Nevertheless, although Jv rosesignificantly in both UNX-7 d and UO-7 d, when Jvwas normalized for VOL the resulting changes [A(Jv/VOL)] were no longer significantly different (P > 0.10)from sham-7 d, indicating that in UNX-7 d and UO-7 d, Jv and VOL rose proportionately. In contrast,normalization of Jv for AS or AL did not obviate therise in Jv in either group, since in both UNX-7 d andUO-7 d, A(Jv/As) and A(Jv/AL) rose significantly.Thus, increases in AL or As did not parallel the con-comitant rise in Jv evident at 7 d.
TABLE V, continued.
AL Jv Jv/VOL Jv/As Jv/AL
C EXP C EXP C EXP C EXP C EXP
XIO-' Mm'/mm nl/(min -mm) X102 nl/(min mm,9) nl/(min -mm2) nl/(min-mm")
7.41±0.30 7.71±0.39 0.48±0.04 0.44±0.04 3.88±0.27 3.60±0.33 3.30±0.24 3.00±0.26 6.55±0.50 5.73±0.46
(n= 13)
7.51±0.36 7.35±0.28 0.51±0.04 0.64±0.04 4.35±0.44 5.39±0.28t 3.53±0.29 4.47+0.28 6.94±0.60 8.92±0.76-7.26±0.41 6.95±0.35 0.56±0.05 0.66±0.071 4.89±0.44 5.71±0.56§ 3.95±0.37 4.75±0.52 7.94±0.99 10.00±1.46
(n = 11)
7.01±0.24 7.29±0.62 0.44±0.06 0.58±0.07 3.66±0.52 5.09±0.73 3.17±0.47 4.35±0.60- 6.56±1.02 8.69±1.24-
(n= 10)
Fluid Transport in Rabbit Proximal Straight Tubules 877

TABLE VIRelationship of Jv to Indices of PST Hypertrophy (5-7 d)
ID OD VOL As
No. oftubule pairs C EXP C EXP C EXP C EXP
Jm 'Um Xl0-4 mM3/mm X10-2 mm'/mm
Sham-7 d 6 22.7±1.0 21.8±1.3 47.8±1.8 48.4±1.7 13.9±1.1 14.7±0.9 15.0±0.6 15.2±0.5UNX-7 d 6 22.9±1.0 25.4±1.7 48.8±2.2 54.6±2.0" 14.7±1.4 18.3±1.3t 15.3±0.7 17.1±0.60UO-7 d 6 24.8±1.4 21.6±1.1 48.5±1.3 49.6±1.2 13.6±0.5 15.6±0.9 15.2±0.4 15.6±0.4MP-5 d 10 23.0±1.2 24.1±0.7 44.5±1.3 47.5±1.0§ 11.4±0.7 13.2±0.5§ 14.0±0.4 14.9±0.3§
All data±SE.P < 0.01 for (EXP-C) vs. sham-7 d (EXP-C).P < 0.05 for (EXP-C) vs. sham-7 d (EXP-C).
§ P < 0.01 vs. C by paired t test."P < 0.05 vs. C by paired t test.
A similar pattern of results was seen with MP-5 danimals (Table VI). After chronic MPadministration,OD, VOL, and As rose significantly, but a significantincrease in Jv was still apparent in the MPgroup whenJv was normalized for luminal or serosal surface area.However, no significant increase was seen after chronicMPadministration when Jv was related to cell volume.Thus, as seen with UNX-7 d and UO-7 d, the increasein Jv that follows MPadministration is proportionalto the rise in cell volume, but can be dissociated fromother measures of tubule hypertrophy.
DISCUSSION
It is well established that the chronic reductions inrenal mass and excretory function induced by UNXinitiate compensatory increases in the function andsize of the remaining kidney (1, 24). The time courseand magnitude of these increases remain somewhatcontroversial, however. In this study, we found thatin volume-replete rabbits studied 24 h after UNXval-ues for CIN and CPAH were 110 and 54% greater thanthose of sham-24 h animals, respectively (Table I). Themagnitude of these increases is larger than previouslyreported by others (13), and may, in part, reflect theeffect of surgery to reduce the value for these param-eters in sham-24 h control group. Nevertheless, com-parison of UNX-24 h and unoperated normal groupstill shows a 47% increase in CPAHand a 60% increasein CIN, indicating that the rabbit kidney displays astriking capacity to compensate rapidly for the loss ofrenal mass and excretory function by increasing renalplasma flow rate and GFR.
Along with the increase in GFRat 24 h after UNX,a significant increase in TNa was also evident. Themagnitude of this change in TNa was comparable tothe rise in CIN, indicating a high degree of glomeru-lotubular balance at this early stage after loss of renal
mass. Others have shown that the rise in TNa afterchronic subtotal ablation of renal mass is accompaniedby an increase in the intrinsic transport capacity ofPCT and PST segments of the remaining nephrons(15, 16). Wereasoned that the early and large increasein TNa resulting from UNXmight be paralleled by asimilar early increase in Jv values in PST. Our resultsshow that such a rise in Jv in PST is demonstrable asearly as 24 h after UNX, and is sustained for at least7 d. These data are in contrast to those of others, whodid not identify a statistically significant rise in Jv inPST segments 1-4 mo after a slightly lesser degree ofreduction in renal mass (15). A greater degree of renalablation, on the other hand, induced a large (70%)increase in Jv in PST. Similarly, in PCT, the increasein Jv after uninephrectomy is not consistently signif-icant (16, 25) whereas a significant rise is seen afterchronic subtotal ablation (16). These results suggestthat either the small difference in the degree of abla-tion or the greater sensitivity of our paired-tubuleanalysis accounts for the apparent discrepancy be-tween those data and ours.
In view of the foregoing evidence that both wholekidney and local PST functions respond quickly to re-moval of the contralateral kidney, we next investigatedwhether these changes were a consequence either ofthe loss of metabolically active renal tissue or of areduction in renal excretory function. To assess thisquestion, we utilized UOand UP, maneuvers whichhalved renal excretory function without removingrenal mass. We found that at 24 h, UOand UP pro-duced significant increases in contralateral kidneyCPAH, CIN, and TNa compared with sham-24 h, al-though the magnitude of these increases was smallerthan those seen with UNX-24 h. Although other in-terpretations are possible, these data are consistentwith the view that retention of one or more urinarysolutes, through some direct or indirect effects, pro-
878 K. Tabei, D. J. Levenson, and B. M. Brenner

TABLE VI, continued.
AL Jv Jv/VOL Jv/As jv/AL
C EXP C EXP C EXP C EXP C EXP
X10-2 mm"/mm nl/(min * mm) X1O2 nl/(min* mm3) nl/(min * mm2) nl/(min - mm')
7.14±0.31 6.84±0.427.18±0.32 7.99±0.547.78±0.44 6.78±0.357.21±0.38 7.57±0.24
0.46±0.05 0.42±0.040.44±0.04 0.62±0.06'0.44±0.06 0.55±0.05'0.58±0.06 0.74±0.05§
3.38±0.39 2.98±0.423.13±0.41 3.47±0.433.24±0.40 3.54±0.345.11±0.43 5.67±0.36
3.06±0.31 2.82±0.322.88±0.29 3.62±0.34-2.91±0.39 3.52±0.32-4.14±0.40 4.97±0.2911
6.45±0.65 6.30±0.686.12±0.55 7.79±0.65t5.80±0.89 8.14±0.72'8.32±1.06 9.82±0.56"
duces the observed changes in renal function (26). Therelatively greater increases in CPAHand CIN in the UNXgroup compared with the UOand UP groups mightbe accounted for by an early and rapid accumulationof unexcreted solutes in plasma after UNX, in contrastto the UOand UPgroups, in which urine may continueto accumulate in the obstructed urinary collecting sys-tem or in the peritoneal space for some minutes tohours before being reabsorbed into the plasma. Thegreater stimulatory effect of UNX on CPAH and CINmay reflect an independent influence of a reducedrenal mass per se on contralateral renal function (27).
The consequences of halving renal excretory func-tion without loss of renal mass were also manifest inisolated nephron segments as well. As was found afterUNX, UOand UP led to significant increases in Jv inPST at 24 h, and this effect persisted for 7 d after UO.The observed changes in Jv values were not relatedto any systematic differences in tubule length, perfu-sion rate, or PD (Tables III, IV). Differences betweencontrol and experimental tubules in the proportion ofcortical (S2) to medullary (S3) PST segments might alsoinfluence the results of our Jv measurements, since themore superficial PST segments are known to exhibithigher values for Jv and lower values for PD than domore distal PST segments (28). That this form of ex-perimental bias is unlikely is suggested by (a) lack ofchange in jv in sham-24 h and sham-7 d animals, (b)rigorous criteria used for the selection of superficialPST (S2) segments, and (c) absence of significant dif-ferences between control and experimental tubules ofeach group in values for PDdespite the increase in Jv.To negate the potential influence of surface location(i.e., kidney pole vs. midsection) on reabsorption rate,all tubules were obtained from the region at the in-tersection of the longitudinal and transverse axes ofthe kidney.
The parallel changes in GFRand Jv after UNX, UO,
and UPsuggest that the two are in some fashion linked.Although retention of urinary solutes may exert in-dependent stimulatory influences on GFR and Jv, amore parsimonious explanation is that proximal tubuleJv is modulated by GFR or some related dependentvariable, such as filtered solute load, peritubular Star-ling forces, or tubule fluid flow rate (16, 28). To de-termine whether the rise in Jv observed in UNX, UO,and UP groups was related to the concomitant rise inGFR, we used MPadministration, a maneuver knownto increase GFR in the rat (17). Consistent with thishypothesis, concomitant augmentation of both CIN andJv in PST was observed in MP-5 d animals.
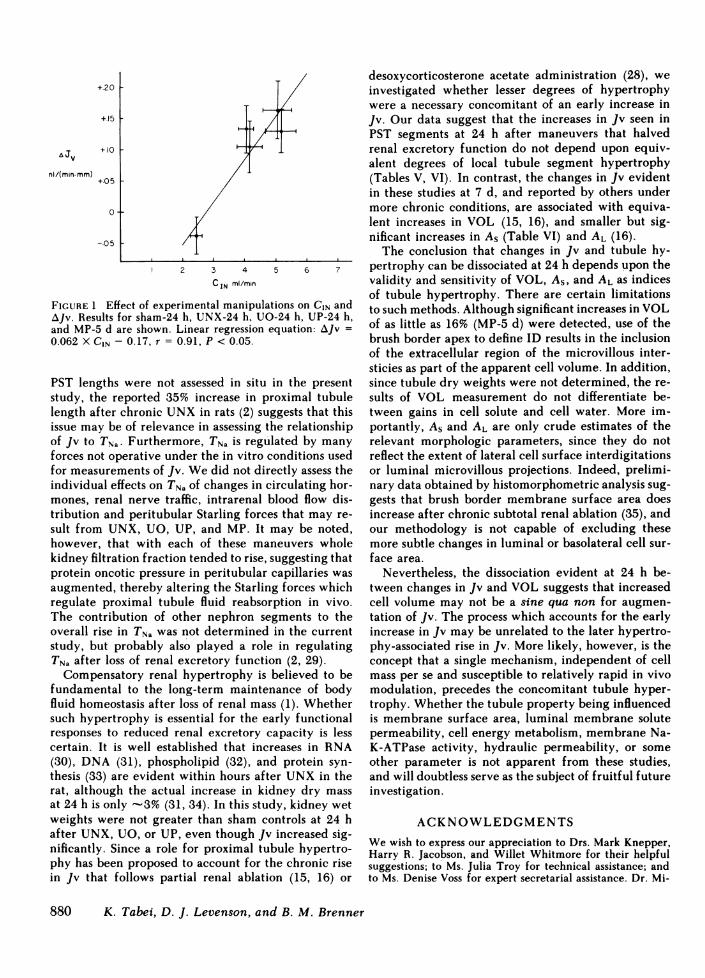
Further support for this interpretation is derivedfrom a statistical analysis of the relationship betweenthe changes in Jv and CIN induced by these variousmaneuvers. As shown in Fig. 1, a significant correlationexists (by linear regression analysis) between CIN andJv, when mean values for these parameters in sham-24 h, UNX-24 h, UO-24 h, UP-24 h, and MP-5 d groupsare considered together (linear regression: AJv = 0.062X CIN - 0.17, r = 0.91, P < 0.05). Thus, the prevailinglevel of GFRat time of study may play a central rolein modulating proximal tubule Jv under circumstancesnot limited to compensatory adaptation to reducedrenal mass. Consonant with this concept are the dataof Knepper and Burg (28), who observed that the stim-ulatory effect of desoxycorticosterone acetate on PSTJv appeared to depend on expansion of extracellularfluid volume. GFRand renal blood flow were not mea-sured in those studies but they very likely increasedas well, a pattern consistent with our current obser-vations.
The modest increases in Jv (19-43%) seen after eachof the experimental maneuvers used in this study weremuch less than the simultaneous increases in TNa-However, increases in tubule length would add to thein vivo effect of the observed changes in Jv. Although
Fluid Transport in Rabbit Proximal Straight Tubules 879
+20 F+15 1
a Jv +10 1
nl/(min mm) +05 I
0
-.05
2 3 4 5 6 7
C IN ml/min
FIGURE 1 Effect of experimental manipulations on CIN andAJv. Results for sham-24 h, UNX-24 h, UO-24 h, UP-24 h,and MP-5 d are shown. Linear regression equation: AJv =0.062 X CIN - 0.17, r = 0.91, P < 0.05.
PST lengths were not assessed in situ in the presentstudy, the reported 35% increase in proximal tubulelength after chronic UNX in rats (2) suggests that thisissue may be of relevance in assessing the relationshipof Jv to TNa. Furthermore, TNa is regulated by manyforces not operative under the in vitro conditions usedfor measurements of Jv. Wedid not directly assess theindividual effects on TNa of changes in circulating hor-mones, renal nerve traffic, intrarenal blood flow dis-tribution and peritubular Starling forces that may re-sult from UNX, UO, UP, and MP. It may be noted,however, that with each of these maneuvers wholekidney filtration fraction tended to rise, suggesting thatprotein oncotic pressure in peritubular capillaries wasaugmented, thereby altering the Starling forces whichregulate proximal tubule fluid reabsorption in vivo.The contribution of other nephron segments to theoverall rise in TNa was not determined in the currentstudy, but probably also played a role in regulatingTNa after loss of renal excretory function (2, 29).
Compensatory renal hypertrophy is believed to befundamental to the long-term maintenance of bodyfluid homeostasis after loss of renal mass (1). Whethersuch hypertrophy is essential for the early functionalresponses to reduced renal excretory capacity is lesscertain. It is well established that increases in RNA(30), DNA (31), phospholipid (32), and protein syn-thesis (33) are evident within hours after UNXin therat, although the actual increase in kidney dry massat 24 h is only -3% (31, 34). In this study, kidney wetweights were not greater than sham controls at 24 hafter UNX, UO, or UP, even though Jv increased sig-nificantly. Since a role for proximal tubule hypertro-phy has been proposed to account for the chronic risein Jv that follows partial renal ablation (15, 16) or
desoxycorticosterone acetate administration (28), weinvestigated whether lesser degrees of hypertrophywere a necessary concomitant of an early increase inJv. Our data suggest that the increases in Jv seen inPST segments at 24 h after maneuvers that halvedrenal excretory function do not depend upon equiv-alent degrees of local tubule segment hypertrophy(Tables V, VI). In contrast, the changes in Jv evidentin these studies at 7 d, and reported by others undermore chronic conditions, are associated with equiva-lent increases in VOL (15, 16), and smaller but sig-nificant increases in AS (Table VI) and AL (16).
The conclusion that changes in Jv and tubule hy-pertrophy can be dissociated at 24 h depends upon thevalidity and sensitivity of VOL, AS, and AL as indicesof tubule hypertrophy. There are certain limitationsto such methods. Although significant increases in VOLof as little as 16% (MP-5 d) were detected, use of thebrush border apex to define ID results in the inclusionof the extracellular region of the microvillous inter-sticies as part of the apparent cell volume. In addition,since tubule dry weights were not determined, the re-sults of VOL measurement do not differentiate be-tween gains in cell solute and cell water. More im-portantly, AS and AL are only crude estimates of therelevant morphologic parameters, since they do notreflect the extent of lateral cell surface interdigitationsor luminal microvillous projections. Indeed, prelimi-nary data obtained by histomorphometric analysis sug-gests that brush border membrane surface area doesincrease after chronic subtotal renal ablation (35), andour methodology is not capable of excluding thesemore subtle changes in luminal or basolateral cell sur-face area.
Nevertheless, the dissociation evident at 24 h be-tween changes in Jv and VOL suggests that increasedcell volume may not be a sine qua non for augmen-tation of Jv. The process which accounts for the earlyincrease in Jv may be unrelated to the later hypertro-phy-associated rise in Jv. More likely, however, is theconcept that a single mechanism, independent of cellmass per se and susceptible to relatively rapid in vivomodulation, precedes the concomitant tubule hyper-trophy. Whether the tubule property being influencedis membrane surface area, luminal membrane solutepermeability, cell energy metabolism, membrane Na-K-ATPase activity, hydraulic permeability, or someother parameter is not apparent from these studies,and will doubtless serve as the subject of fruitful futureinvestigation.
ACKNOWLEDGMENTSWewish to express our appreciation to Drs. Mark Knepper,Harry R. Jacobson, and Willet Whitmore for their helpfulsuggestions; to Ms. Julia Troy for technical assistance; andto Ms. Denise Voss for expert secretarial assistance. Dr. Mi-
880 K. Tabei, D. J. Levenson, and B. M. Brenner
a~~~~~~~~~~~~~~~~~~~~~~~~~~~~~~~~~~
chael Feldstein, Biostatistics Consulting Laboratory, Har-vard School of Public Health, provided advice and guidancein the data analysis.
CLINFO computing facilities were supported by a grantfrom the Division of Research Resources, National Institutesof Health (RR 00888). This study was supported in part bya grant from the National Institutes of Health (AM 19467).
REFERENCES1. Hayslett, J. P. 1979. Functional adaptation to reduction
in renal mass. Physiol. Rev. 59:137-164.2. Hayslett, J. P., M. Kashgarian, and F. H. Epstein. 1968.
Functional correlates of compensatory renal hypertro-phy. J. Clin. Invest. 47:774-782.
3. Kaufman, J. M., H. J. Dimeola, N. J. Siegel, B. Lytton,M. Kashgarian, and J. P. Hayslett. 1974. Compensatoryadaptation of structure and function following progres-sive renal ablation. Kidney Int. 6:10-17.
4. Katz, A. I., and F. H. Epstein. 1967. Relation of glo-merular filtration rate and sodium reabsorption to kid-ney size in compensatory renal hypertrophy. Yale J.Biol. Med. 40:222-230.
5. Deen, W. M., D. A. Maddox, C. R. Robertson, andB. M. Brenner. 1974. Dynamics of glomerular ultrafil-tration in the rat. VII. Response to reduced renal mass.Am. J. Physiol. 227:556-562.
6. Rous, S. N., and K. G. Wakin. 1967. Kidney functionbefore, during and after compensatory hypertrophy. J.Urol. 98:30-35.
7. Pabico, R. C., B. A. McKenna, and R. B. Freeman. 1975.Renal function before and after unilateral nephrectomyin renal donors. Kidney Int. 8:166-175.
8. Schultze, R. G., H. S. Shapiro, and N. S. Bricker. 1969.Studies on the control of sodium excretion in experi-mental uremia. J. Clin. Invest. 48:869-877.
9. Hayslett, J. P., M. Kashgarian, and F. H. Epstein. 1969.Mechanism of change in the excretion of sodium pernephron when renal mass is reduced. J. Clin. Invest.48:1002-1006.
10. Slatopolsky, E., I. 0. Elkan, C. Weerts, and N. S. Bricker.1968. Studies on the characteristics of the control systemgoverning sodium excretion in uremic man. J. Clin. In-vest. 47:521-530.
11. Emmanouel, D. S., M. D. Lindheimer, and A. I. Katz.1975. Urinary concentration and dilution after unilat-eral nephrectomy in the rat. Clin. Sci. Mol. Med.49:563-572.
12. Sachtjen, E., L. Rabinowitz, and P. E. Binkerd. 1977.Renal concentrating ability in the uninephrectomizedrat. Am. J. Physiol. 23:F428-F437.
13. Potter, D. E., E. P. Leumann, T. Sakai, and M. A. Hol-liday. 1974. Early responses of glomerular filtration rateto unilateral nephrectomy. Kidney Int. 5:131-136.
14. Shirley, D. G., and J. Skinner. 1978. Acute compensatoryadaptation of renal function following contralateral kid-ney exclusion in Brattleboro rats with diabetes insipidus.J. Physiol. (Lond.). 283:425-438.
15. Fine, L. G., W. Trizna, J. J. Bourgoignie, and N. S.Bricker. 1978. Functional profile of the isolated uremicnephron. Role of compensatory hypertrophy in the con-trol of fluid reabsorption by the proximal straight tubule.J. Clin. Invest. 61:1508-1518.
16. Trizna, W., N. Yanagawa, Y. Bar-Khayim, B. Houston,and L. G. Fine. 1981. Functional profile of the isolated
uremic nephron. Evidence of proximal tubular "mem-ory" in experimental renal disease. J. Clin. Invest.68:760-767.
17. Baylis, C., and B. M. Brenner. 1978. Mechanism of theglucocorticoid-induced increase in glomerular filtrationrate. Am. J. Physiol. 234:F166-F170.
18. Bratton, A. D., and E. K. Marshall. 1939. A new couplingcomponent for sulfanilamide determination. J. Biol.Chem. 128:537-550.
19. Fiihr, J., J. Kaczmarszyk, and C. D. Kruttgen. 1955. Eineinfache colorimetrische Methode zur Inulin Bestim-mung fur Nierenclearanceuntersuchungen bei Stoff-wechselgesunden und Diabetikern. Klin. Wochschr.33:729-730.
20. lino, Y., and M. B. Burg. 1979. Effect of parathyroidhormone on bicarbonate absorption by proximal tubulesin vitro. Am. J. Physiol. 236:F387-F391.
21. Burg, M. B., and J. Orloff. 1968. Control of fluid ab-sorption in the renal proximal tubule. J. Clin. Invest.47:2016-2024.
22. Snedecor, G. W., and W. G. Cochran. 1967. Statisticalmethods. 6th Edition. Iowa State University Press, Ames,Iowa.
23. Bailey, B. J. R. 1977. Tables of the Bonferroni t statistic.J. Am. Statistical Assoc. 72:469-477.
24. Malt, R. A. 1969. Compensatory growth of the kidney.N. Engi. J. Med. 280:1446-1459.
25. Brazy, P. C., J. W. McKeown, R. H. Harris, and V. W.Dennis. 1980. Comparative effects of dietary phosphate,unilateral nephrectomy and parathyroid hormone onphosphate transport by the rabbit proximal tubule. Kid-ney Int. 17:788-800.
26. Harris, R. H., and C. F. Best. 1977. Circulatory retentionof urinary growth factors as a stimulus to renal growth.Kidney Int. 12:305-312.
27. Obertop, H., and R. A. Malt. 1977. Lost mass and ex-cretion as stimuli to parabiotic compensatory renal hy-pertrophy. Am. J. Physiol. 232:F405-F408.
28. Knepper, M. A., and M. B. Burg. 1981. Increased fluidabsorption and cell volume in isolated rabbit proximalstraight tubules after in vivo DOCAadministration. Am.J. Physio. 241:F502-F508.
29. Diezi, J., P. Michoud, A. Grandchamp, and G. Giebisch.1976. Effects of nephrectomy on renal salt and watertransport in the remaining kidney. Kidney Int. 19:450-462.
30. Halliburton, I. W., and R. Y. Thomson. 1965. Chemicalaspects of compensatory renal hypertrophy. Cancer Res.25:1882-1887.
31. Toback, F. G., and L. M. Lowenstein. 1974. Thymidinemetabolism during normal and compensatory renalgrowth. Growth. 38:35-44.
32. Toback, F. G., P. D. Smith, and L. M. Lowenstein. 1974.Phospholipid metabolism in the initiation of renal com-pensatory growth after reduction of renal mass. J. Clin.Invest. 54:91-97.
33. Coe, F. L., and P. R. Korty. 1967. Protein synthesis dur-ing compensatory renal hypertrophy. Am. J. Physiol.213:2585-2589.
34. Johnson, H. A., and J. M. Vera-Roman. 1966. Compen-satory renal enlargment. Hypertrophy versus hyperpla-sia. Am. J. Pathol. 49:1-13.
35. Fine, L. G., E. P. Nord, and T. Bradley. The nature ofthe adaptive response of the proximal tubulc brush bor-der membrane in the remnant kidney. 1983. Kidney Int.23:213. (Abstr.)
Fluid Transport in Rabbit Proximal Straight Tubules 881