Embed Size (px)
Citation preview

Eva l uat io n o f t h e S c ho o l N u t r i t io n
P r o g r a m m e
Provincial Report: Easte rn Cape
May 2008
EducationDepartment:
REPUBLIC OF SOUTH AFRICA
education
© 2008 UNICEF
This research was commissioned by UNICEF South Africa in collaboration with the Department of Education, and produced by KPMG International.
This report is intended solely and exclusively for the benefit, information and use by UNICEF and the Department of Education. No party, other than UNICEF and the Department of Education, may rely on the contents of this report, either in whole or in part. KPMG Services (Pty) Ltd (hereinafter referred to as “KPMG”), its directors or employees or agents or any body or entity controlled by or owned by or associated with KPMG, accepts no liability or responsibility whatsoever, resulting directly or indirectly from the disclosure of this report to any third party and/or reliance of any third party on the contents of this report, whether in whole or in part.
EnquiriesNokuthula PrusentUNICEF, PO Box 4884, Pretoria, 0001, South AfricaTel: +27 12 3548201Email: [email protected]
Design and Production: Handmade Communications

Department of Education – UNICEF
Eva l uat io n o f t h e S c ho o l N u t r i t io n
P r o g r a m m e
Provincial Report: Easte rn Cape
May 2008
Department of Education – UNICEF

1 Introduction ............................................................................................................................ 1
2 Background ............................................................................................................................. 2
3 Methodology ........................................................................................................................... 43.1 Limitations ..............................................................................................................................6
4 Objectives ............................................................................................................................... 74.1 Findings ...................................................................................................................................74.2 Conclusion.................................................................................................................................7
5 Systems ................................................................................................................................... 85.1 Financial management ..............................................................................................................85.2 Supply chain management .........................................................................................................95.3 Administrative systems .............................................................................................................10
6 Outputs .................................................................................................................................176.1 Findings .................................................................................................................................176.2 Conclusion...............................................................................................................................18
7 Outcomes ...............................................................................................................................197.1 Findings .................................................................................................................................197.2 Conclusion...............................................................................................................................20
8 Conclusion .............................................................................................................................21
9 Recommendations ................................................................................................................. 22
Contents
Table 1: Number of schools and learners by district ................................................................................3Table 2: Distribution of sample size ......................................................................................................4Table 3: Sample schools ........................................................................................................................5Table 4: Findings from school visits ....................................................................................................13Table 5: Storage facilities and preparation and serving of food ..............................................................13Table 6: Percentage of schools with active food gardens .........................................................................17Table 7: Percentage of schools with economic activity related to food gardens ..........................................18Table 8: Percentage of schools with community participation ................................................................18Table 9: Percentage of targeted learners fed ..........................................................................................19Table 10: Percentage of schools complying with feeding days ..................................................................19Table 11: Percentage of schools complying with required time of feeding ................................................20Table 12: Percentage of schools complying with the prescribed menu ......................................................20
List of tabLes

1
1 introduCtion
This report presents findings of the evaluation of the National School Nutrition Programme (NSNP) in the Eastern Cape Province. The evaluation period runs from 2004/05 to 2006/07. KPMG was awarded the tender to evaluate the implementation of the NSNP in all nine provinces. The core requirements of the evaluation are to determine the extent to which the programme is meeting its objectives and to assess whether allocated resources are utilised effectively and efficiently. The pro-gramme was evaluated at provincial, district and school levels.
2
2 baCkground
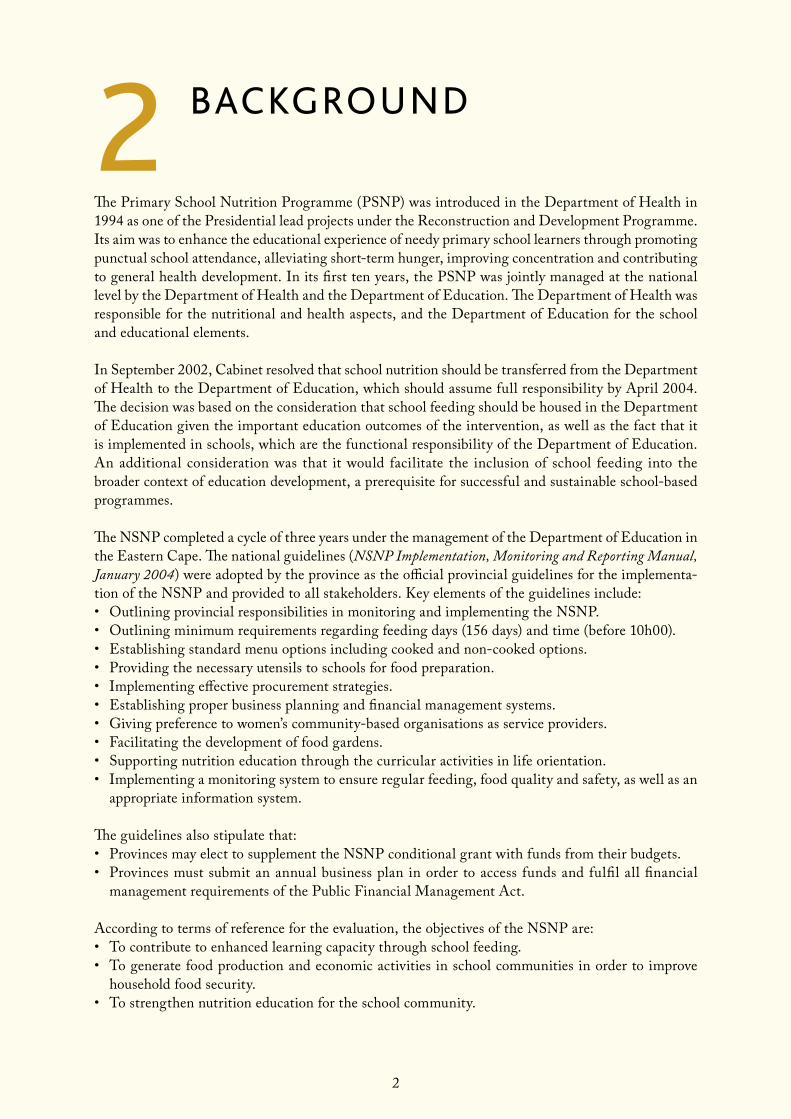
The Primary School Nutrition Programme (PSNP) was introduced in the Department of Health in 1994 as one of the Presidential lead projects under the Reconstruction and Development Programme. Its aim was to enhance the educational experience of needy primary school learners through promoting punctual school attendance, alleviating short-term hunger, improving concentration and contributing to general health development. In its first ten years, the PSNP was jointly managed at the national level by the Department of Health and the Department of Education. The Department of Health was responsible for the nutritional and health aspects, and the Department of Education for the school and educational elements.
In September 2002, Cabinet resolved that school nutrition should be transferred from the Department of Health to the Department of Education, which should assume full responsibility by April 2004. The decision was based on the consideration that school feeding should be housed in the Department of Education given the important education outcomes of the intervention, as well as the fact that it is implemented in schools, which are the functional responsibility of the Department of Education. An additional consideration was that it would facilitate the inclusion of school feeding into the broader context of education development, a prerequisite for successful and sustainable school-based programmes.
The NSNP completed a cycle of three years under the management of the Department of Education in the Eastern Cape. The national guidelines (NSNP Implementation, Monitoring and Reporting Manual, January 2004) were adopted by the province as the official provincial guidelines for the implementa-tion of the NSNP and provided to all stakeholders. Key elements of the guidelines include:• Outlining provincial responsibilities in monitoring and implementing the NSNP.• Outlining minimum requirements regarding feeding days (156 days) and time (before 10h00).• Establishing standard menu options including cooked and non-cooked options.• Providing the necessary utensils to schools for food preparation.• Implementing effective procurement strategies.• Establishing proper business planning and financial management systems.• Giving preference to women’s community-based organisations as service providers.• Facilitating the development of food gardens.• Supporting nutrition education through the curricular activities in life orientation.• Implementing a monitoring system to ensure regular feeding, food quality and safety, as well as an
appropriate information system.
The guidelines also stipulate that:• Provinces may elect to supplement the NSNP conditional grant with funds from their budgets.• Provinces must submit an annual business plan in order to access funds and fulfil all financial
management requirements of the Public Financial Management Act.
According to terms of reference for the evaluation, the objectives of the NSNP are:• To contribute to enhanced learning capacity through school feeding.• To generate food production and economic activities in school communities in order to improve
household food security.• To strengthen nutrition education for the school community.
3
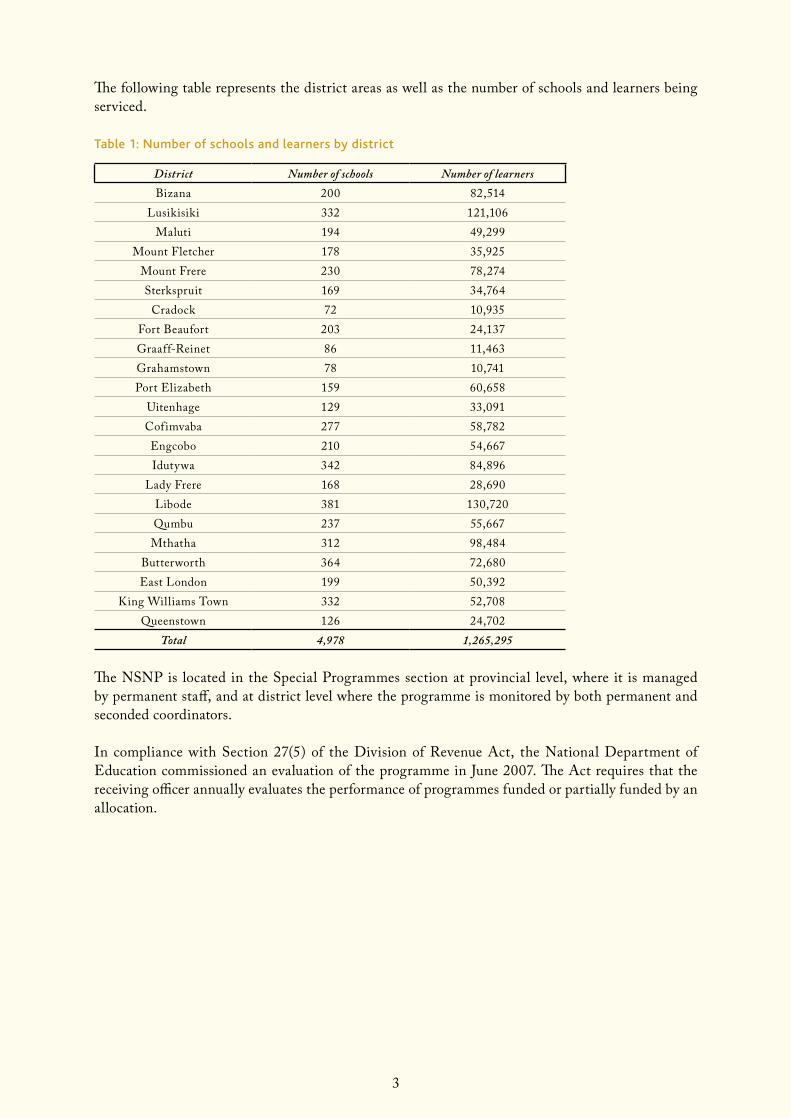
The following table represents the district areas as well as the number of schools and learners being serviced.
Table 1: Number of schools and learners by district
District Number of schools Number of learnersBizana 200 82,514
Lusikisiki 332 121,106Maluti 194 49,299
Mount Fletcher 178 35,925Mount Frere 230 78,274Sterkspruit 169 34,764
Cradock 72 10,935Fort Beaufort 203 24,137Graaff-Reinet 86 11,463Grahamstown 78 10,741Port Elizabeth 159 60,658
Uitenhage 129 33,091Cofimvaba 277 58,782Engcobo 210 54,667Idutywa 342 84,896
Lady Frere 168 28,690Libode 381 130,720Qumbu 237 55,667Mthatha 312 98,484
Butterworth 364 72,680East London 199 50,392
King Williams Town 332 52,708Queenstown 126 24,702
Total 4,978 1,265,295
The NSNP is located in the Special Programmes section at provincial level, where it is managed by permanent staff, and at district level where the programme is monitored by both permanent and seconded coordinators.
In compliance with Section 27(5) of the Division of Revenue Act, the National Department of Education commissioned an evaluation of the programme in June 2007. The Act requires that the receiving officer annually evaluates the performance of programmes funded or partially funded by an allocation.

4
3 MethodoLogy
The evaluation was made up of three main components and included both qualitative and quantitative elements. First, key stakeholder interviews were carried out at provincial, district and school levels. Second, a school survey was carried out in a nationally representative sample of 271 schools. Third, 30 school visits were made across nine provinces. These components are discussed in more detail below.
key stakeholder interviews: Semi-structured interviews were carried out at provincial level with the programme manager, at district level with the nutrition coordinators and liaison officers, and at school level with principals and/or nutrition coordinators in schools. The main aim of these interviews was to get a sense of programme achievements and challenges.
school survey: A nationally representative sample of schools was selected to form the basis of the school survey. The sample size of 271 schools is representative at a national level with a 90% confidence interval and 5% margin of error. The table below shows that the sample of 271 schools was distributed to each province according to population size (Stats SA, 2001). The school survey was based on data available in district offices responsible for monitoring the programme in schools.
Table 2: Distribution of sample size
no of schools in categories
Province Urban Rural Total Urban (%)
Rural (%)
Total (%)
Total Schools
Urban Schools
Rural Schools
Eastern Cape Total
2,451,452 3,985,315 6,436,767 38 62 14 39 15 24
Free State Total
2,016,016 690,764 2,706,780 74 26 6 16 12 4
Gauteng Total 8,723,381 456,684 9,180,065 95 5 20 56 53 3KwaZulu-
Natal Total4,263,415 5,162,602 9,426,017 45 55 21 57 26 31
Mpumalanga Total
1,198,962 2,064,009 3,262,971 37 63 7 20 7 13
Northern Cape Total
689,971 210,239 900,210 77 23 2 5 4 1
Limpopo Total
540,295 4,561,262 5,101,557 11 89 11 31 3 28
North-West Total
1,285,806 1,995,278 3,281,084 39 61 7 20 8 12
Western Cape Total
4,061,229 463,104 4,524,333 90 10 10 27 24 3
Grand Total 25,230,527 19,589,257 44,819,784 56 44 100 271 153 118
As shown in the table above, the provincial sample (highlighted) was divided into rural and urban samples, proportionate to the overall rural and urban population of the province (Stats SA, 1996). Three districts were then selected per province (two in Northern Cape due to the small population) to participate in the evaluation, shown in the table below.
The rural and urban school samples were then randomly selected from a Department of Education list per province which reflected urban and rural schools, from within the three districts selected.
5
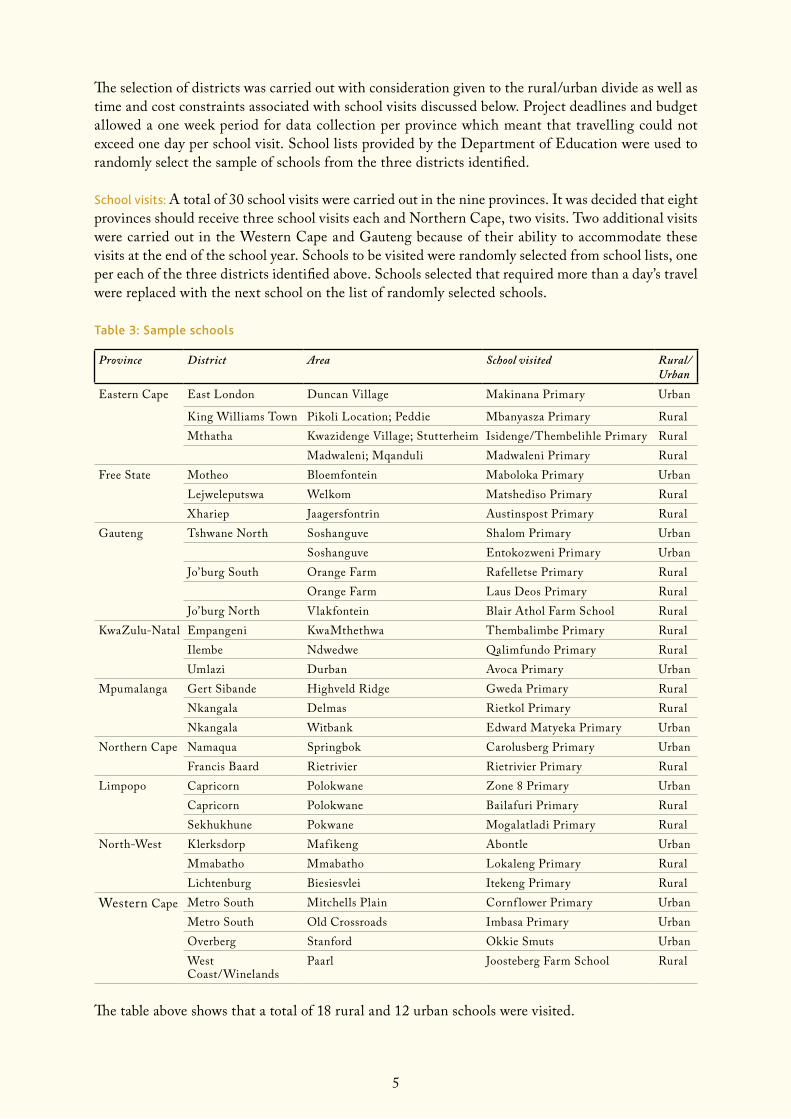
The selection of districts was carried out with consideration given to the rural/urban divide as well as time and cost constraints associated with school visits discussed below. Project deadlines and budget allowed a one week period for data collection per province which meant that travelling could not exceed one day per school visit. School lists provided by the Department of Education were used to randomly select the sample of schools from the three districts identified.
school visits: A total of 30 school visits were carried out in the nine provinces. It was decided that eight provinces should receive three school visits each and Northern Cape, two visits. Two additional visits were carried out in the Western Cape and Gauteng because of their ability to accommodate these visits at the end of the school year. Schools to be visited were randomly selected from school lists, one per each of the three districts identified above. Schools selected that required more than a day’s travel were replaced with the next school on the list of randomly selected schools.
Table 3: Sample schools
Province District Area School visited Rural/Urban
Eastern Cape East London Duncan Village Makinana Primary Urban
King Williams Town Pikoli Location; Peddie Mbanyasza Primary RuralMthatha Kwazidenge Village; Stutterheim Isidenge/Thembelihle Primary Rural
Madwaleni; Mqanduli Madwaleni Primary RuralFree State Motheo Bloemfontein Maboloka Primary Urban
Lejweleputswa Welkom Matshediso Primary RuralXhariep Jaagersfontrin Austinspost Primary Rural
Gauteng Tshwane North Soshanguve Shalom Primary UrbanSoshanguve Entokozweni Primary Urban
Jo’burg South Orange Farm Rafelletse Primary RuralOrange Farm Laus Deos Primary Rural
Jo’burg North Vlakfontein Blair Athol Farm School RuralKwaZulu-Natal Empangeni KwaMthethwa Thembalimbe Primary Rural
Ilembe Ndwedwe Qalimfundo Primary RuralUmlazi Durban Avoca Primary Urban
Mpumalanga Gert Sibande Highveld Ridge Gweda Primary RuralNkangala Delmas Rietkol Primary RuralNkangala Witbank Edward Matyeka Primary Urban
Northern Cape Namaqua Springbok Carolusberg Primary UrbanFrancis Baard Rietrivier Rietrivier Primary Rural
Limpopo Capricorn Polokwane Zone 8 Primary UrbanCapricorn Polokwane Bailafuri Primary RuralSekhukhune Pokwane Mogalatladi Primary Rural
North-West Klerksdorp Mafikeng Abontle UrbanMmabatho Mmabatho Lokaleng Primary RuralLichtenburg Biesiesvlei Itekeng Primary Rural
Western Cape Metro South Mitchells Plain Cornf lower Primary UrbanMetro South Old Crossroads Imbasa Primary UrbanOverberg Stanford Okkie Smuts UrbanWest Coast/Winelands
Paarl Joosteberg Farm School Rural
The table above shows that a total of 18 rural and 12 urban schools were visited.
6
3.1 Limitations
The school survey used data available in district offices. Record keeping, particularly for 2004, was generally found to be poor. Many district offices across the country do not keep files on each school in their jurisdiction that is on the Nutrition Programme. This meant that in certain instances, district programme staff familiar with a school had to be interviewed in order to answer the questionnaire. In some instances, schools were contacted directly for information or submitted their records to the district office in order for the school survey to be completed. Records kept by food and beverage interns responsible for monitoring schools in certain areas were used in Gauteng.
The randomness of sampling was constrained by time deadlines and budget. As highlighted above, three districts were selected per province first, based on travel time anticipated to reach district offices. To ensure completion of fieldwork within one week per province, this needed to be within one day. The sample of schools was then randomly selected from within the three districts. Furthermore, schools identified for visits were also randomly selected, but from within the three districts identified.

7
4 objeCtives
4.1 Findings
All three levels (i.e. provincial office, district office and schools) list the following as the objectives of the programme:• The primary objective is that learners are fed.• The secondary objective is that of food production and nutrition education.
The provincial office further states that its other objectives are:• Improved working capacity of district offices.• Decentralisation of procurement and payments. It is important to note that the Eastern Cape is
forging ahead with changing their procurement model from a centralised model to a decentralised set-up.
The schools had the following as their other objectives:• Identifying the orphaned and vulnerable children within their communities and ensuring that they
are fed at all times.• Ensuring that orphaned and vulnerable children are given the necessary support through other
initiatives, e.g. Social Services, Department of Health, etc.
The following is what the interviewees concluded:
objective 1 – to contribute to enhanced learning capacity through school feeding
The province, district officials and schools could not agree that this objective was being met as feeding was not taking place every day. This is due to irregular deliveries of foodstuffs and the delivery of stale bread at times.
objective 2 – to generate food production and economic activities in school communities in order to im-
prove household food security
This objective is difficult to achieve because of the lack of water at some schools as well as security problems at schools.
objective 3 – to strengthen nutrition education for the school community
This objective is being met as it is imperative in the classroom.
4.2 Conclusion
It is our conclusion that the objectives of the programme are thoroughly understood by all involved in the programme. However, whilst a lot is being done to ensure that the programme achieves its stated objectives, the following challenges limit performance:• Late payments to service providers which frequently lead to non-delivery of foodstuffs.• Late payments to meal servers which may lead to non-attendance by them and ultimately no
feeding.• The service level agreements that are in place between the province and the service providers are
not monitored and this has resulted in the delivery of inadequate quality of foodstuffs.
8
5 systeMs
5.1 Financialmanagement
5.1.1 Findings
Current processAt the beginning of each year, a budgeting process is undertaken whereby district offices determine the exact budget requirement of each school. This is done through a survey where the exact number of learners enrolled at a school is determined. The number of learners is then multiplied by a factor (R1.19 per learner) to arrive at the total daily feeding budget per school.
At the same time, the province has also determined the number of feeding days for the period. The total number of learners is also multiplied by the factor above to arrive at the total feeding budget for the year. Other costs are also calculated and the total budget for the School Nutrition Programme (SNP) is determined.
A budget allocation letter is sent to each district office. This budget allocation letter is broken down between the following:• Food budget.• Meal server budget.
This letter also indicates the exact feeding days per month.
Systems for financial reporting/accountabilityThe province utilises Basic Accounting System (BAS) and LOGIS to manage its finances. Payments are made through these after the verification of all supporting documentation. The following refers:• Original contract.• School details (i.e. school name, EMIS number, plus the total learners fed).• Stamped goods received vouchers.• Correct invoices.
Budget and expenditureNo financial information could be obtained due to the ongoing fraud investigations in the province. None of the current officials have access to the required information.
StrengthsThe province has adequate financial management systems in place that enable it to compile efficient reports.
Challenges
Suspension of previous officials
All provincial officials on the programme were recently put on suspension during the fraud investiga-tions and this means that all the current staff are new officials. The investigation has also resulted in the non-availability of the previous year’s records.
9
Financial management capacity
A backlog of payments to service providers was experienced during the 2006/07 period and this has been attributed to inadequate staff capacity in the finance office at provincial level.
BAS
District office coordinators do not readily have access to BAS so as to check progress of payments to service providers.
Meal server payments
Payments to meal servers are always late (i.e. in some cases as late as eight months) and this is attrib-uted to the fact that payments are only processed once the relevant attendance registers are received from schools.
5.1.2 ConclusionThe programme was recently suspended for procedural flaws and possible fraud which resulted in the suspension of a number of programme officials. This has placed a major burden on remaining staff who have been unable to manage the workload and maintain payments to service providers. This has, in turn, resulted in irregular deliveries of food to schools.
5.2 Supplychainmanagement
5.2.1 Findings
OverviewThe Eastern Cape currently uses a centralised provincial procurement model. This means that all procurement and payments are effected at provincial level. Challenges related to the fraud investiga-tion that impact on the supply chain management (SCM) system have been discussed above.
Feeding contracts in the 2006/07 period were awarded to small, medium and micro enterprises (SMMEs) in 17 districts and cooperatives in six districts. Service level agreements are also meant to have been signed with all stakeholders that will be involved in delivering food to schools. Goods are then inspected upon receipt by schools, and the goods received vouchers are then forwarded to district offices for capturing. The service providers will, at the same time, compile their invoices and these are forwarded to the provincial office (i.e. the programme payment centre). This is where all documents are then reconciled and verified, and payments are processed through BAS/LOGIS.
Roles and responsibilities
Provincial office
• Overall programme management.• Appointment of suppliers.• Placement of orders.• Ensures that all supporting documentation is kept and filed.• Appointment of meal servers and payment of meal servers.• Payment of suppliers.• Management of grant funds and budget.
District office
• Monitoring and support.
10
School
• Ensures that all learners are fed.• Regularly monitors food delivery as well as its quality.• Encourages community and parent involvement.
Supplier
• Supplies food to school according to the feeding calendar and according to quantity and quality specifications.
Challenges• Food products for cooked meals were not delivered in 2006 due to non-payment by province. As
discussed above, this was due to the suspension of officials in the provincial programme office.• The use of non-local suppliers is considered to be a major inconvenience, at times, as the bread
sometimes arrives late and is stale.
5.2.2 Conclusion
The procurement model currently in use, although appropriate for the vastness of the province as well as the number of schools being serviced, does need to be improved so that service delivery can go back to the routine provision of cooked meals. The reported fraud and the late deliveries of stale bread are all due to a breakdown in the internal control systems.
5.3 Administrativesystems
5.3.1 Human resources
Findings
Current structure
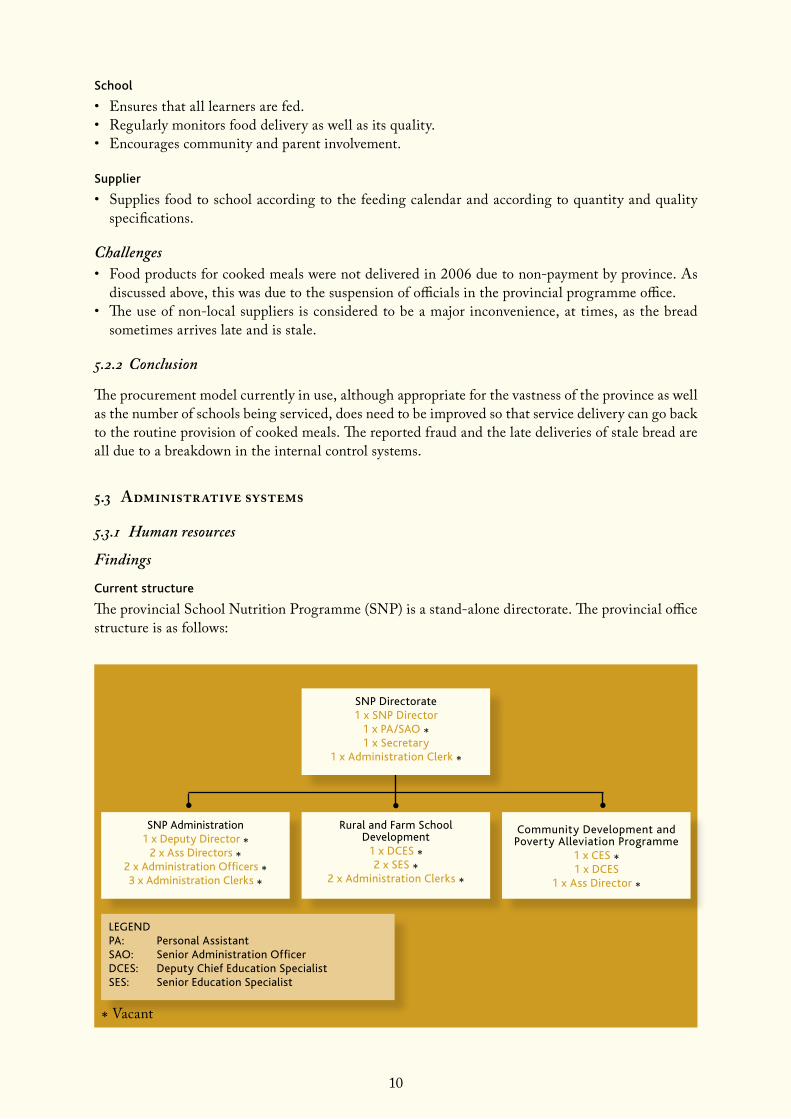
The provincial School Nutrition Programme (SNP) is a stand-alone directorate. The provincial office structure is as follows:
* Vacant
snP administration1 x deputy director *
2 x ass directors *2 x administration officers *3 x administration Clerks *
rural and farm school development
1 x dCes *2 x ses *
2 x administration Clerks *
Community development and Poverty alleviation Programme
1 x Ces *1 x dCes
1 x ass director *
snP directorate1 x snP director
1 x Pa/sao *1 x secretary
1 x administration Clerk *
LegendPa: Personal assistantsao: senior administration officerdCes: deputy Chief education specialistses: senior education specialist
11
The diagram shows that there are a high number of vacancies in the programme. The province has been reluctant to make new appointments whilst the fraud investigations are under way.
The following represents filled posts in the district offices:• 23 x senior education specialists.• 23 x senior administration officers.• 23 x administration officers.
We were unable to determine the exact approved organogram as the people currently employed in the programme are all new (i.e. all old officials were suspended during the fraud investigations).
Roles and functions
The NSNP staff members at provincial level are responsible for the facilitation and coordination of the programme outlined below. As reflected in the organogram above, only the director post is filled.• The director is responsible for overall programme management; planning framework; and policy
formulation.• The deputy director is responsible for mobilising community and stakeholder participation; ensur-
ing function of administrative structures; risk management; and monitoring of service delivery.• The assistant directors are responsible for implementing procurement policies and strategies; ensur-
ing monthly preparation of financial and operational reports; and monitoring service delivery.
Training and development
Staff members at provincial as well as district level indicated that they have the appropriate skills to implement the programme. Competencies required at provincial and district levels are project management financial management, report writing, computer literacy, monitoring and evaluation, and facilitation skills.
The province has access to training and development programmes in the following:• Sustainable food production.• Nutrition education.
ConclusionThe following represents our conclusion on human resources in the Eastern Cape:• The province has 4,978 schools to feed and monitor, which means that each district has an average
of 216.4 schools each. Considering the distances that have to be covered by the district coordinators in visiting these schools, it is concluded that the current structure is grossly under-resourced.
• The number of vacancies at provincial office is also seriously hampering progress in managing and implementing the programme. Delays in the payment of service providers and meal servers are a likely result of this problem. Although a training budget existed for the 2007/08 period, it is considered to be seriously inadequate for any meaningful staff development. Reference has been made to the current financial period as a base since we could not obtain figures for the previous financial periods.
5.3.2 Planning
Findings
Current system
The provincial office is responsible for the compilation of the yearly business plan which includes:• Programme objectives.• Feeding schedule and menu options.• Procurement of services and goods.• Programme management team.
12
• Monitoring and reporting.• Communication strategy.• Budget and cash flow.
Once compiled, the business plan is forwarded to the national office for collation and approval.
At district level, coordinators are required to compile their own weekly activity plans in line with the business plan. They are also required to visit all schools within their respective district areas. It was noted, however, that none of the districts made use of weekly activity plans and therefore many of the schools do not receive visits.
ConclusionIt is our belief that the business plan can never be complete and accurate without proper input from district offices. It is thus our conclusion that the business plan, as it stands currently, is incomplete as it is insufficiently informed by district reports. Planning for the effective monitoring of the programme at school level needs to be improved.
5.3.3 Monitoring and evaluation
Findings
Schools
Eastern Cape schools have Section 20 status which means that all procurement and payments are done centrally, at provincial level. The following represents procedures carried out by schools when it comes to monitoring and evaluation:• Inspect all deliveries and check that quantities received agree with orders.• Check that all food delivered is of good quality (e.g. ensure that food items are not expired).• Check food being served to learners and ensure compliance to approved menu.• Taste all food being served and ensure that it is edible.
District offices
District coordinators are responsible for all monitoring and evaluation work at schools. This is done through the following:• Visits to monitor feeding implementation.• Telephone calls to all other schools not visited during that quarter to determine if the schools are
coping.
Province
On a monthly basis, the province is supposed to visit the districts and do the following:• Check that files are kept for all schools and that all monitoring and evaluation information is kept
on file.• Visit schools and complete the same monitoring and evaluation tool as is completed by district
coordinators.
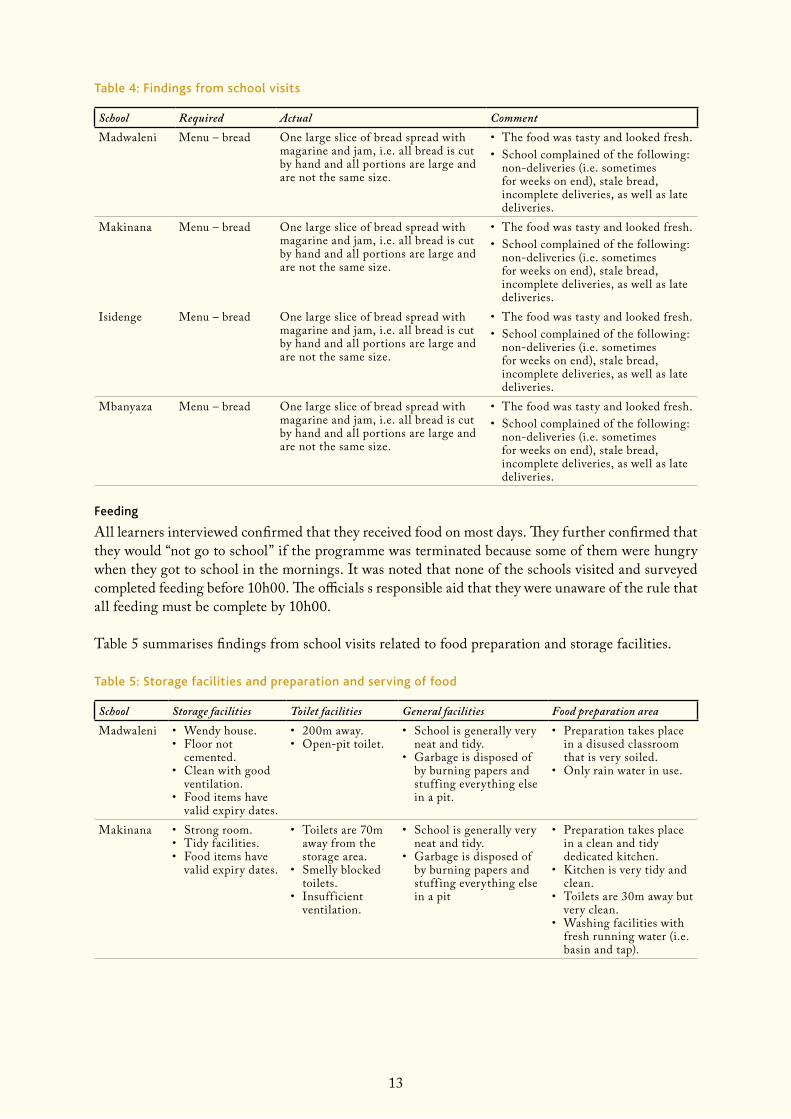
School visitsFour schools were visited as part of the evaluation and the following represents our observations. Although the programme is currently experiencing some challenges (i.e. procurement model not working and there are investigations of fraud), feeding still takes place daily. Food provided is un-cooked due to these disruptions. Table 4 summarises findings from school visits.
13
Table 4: Findings from school visits
School Required Actual CommentMadwaleni Menu – bread One large slice of bread spread with
magarine and jam, i.e. all bread is cut by hand and all portions are large and are not the same size.
• The food was tasty and looked fresh.• School complained of the following:
non-deliveries (i.e. sometimes for weeks on end), stale bread, incomplete deliveries, as well as late deliveries.
Makinana Menu – bread One large slice of bread spread with magarine and jam, i.e. all bread is cut by hand and all portions are large and are not the same size.
• The food was tasty and looked fresh.• School complained of the following:
non-deliveries (i.e. sometimes for weeks on end), stale bread, incomplete deliveries, as well as late deliveries.
Isidenge Menu – bread One large slice of bread spread with magarine and jam, i.e. all bread is cut by hand and all portions are large and are not the same size.
• The food was tasty and looked fresh.• School complained of the following:
non-deliveries (i.e. sometimes for weeks on end), stale bread, incomplete deliveries, as well as late deliveries.
Mbanyaza Menu – bread One large slice of bread spread with magarine and jam, i.e. all bread is cut by hand and all portions are large and are not the same size.
• The food was tasty and looked fresh.• School complained of the following:
non-deliveries (i.e. sometimes for weeks on end), stale bread, incomplete deliveries, as well as late deliveries.
Feeding
All learners interviewed confirmed that they received food on most days. They further confirmed that they would “not go to school” if the programme was terminated because some of them were hungry when they got to school in the mornings. It was noted that none of the schools visited and surveyed completed feeding before 10h00. The officials s responsible aid that they were unaware of the rule that all feeding must be complete by 10h00.
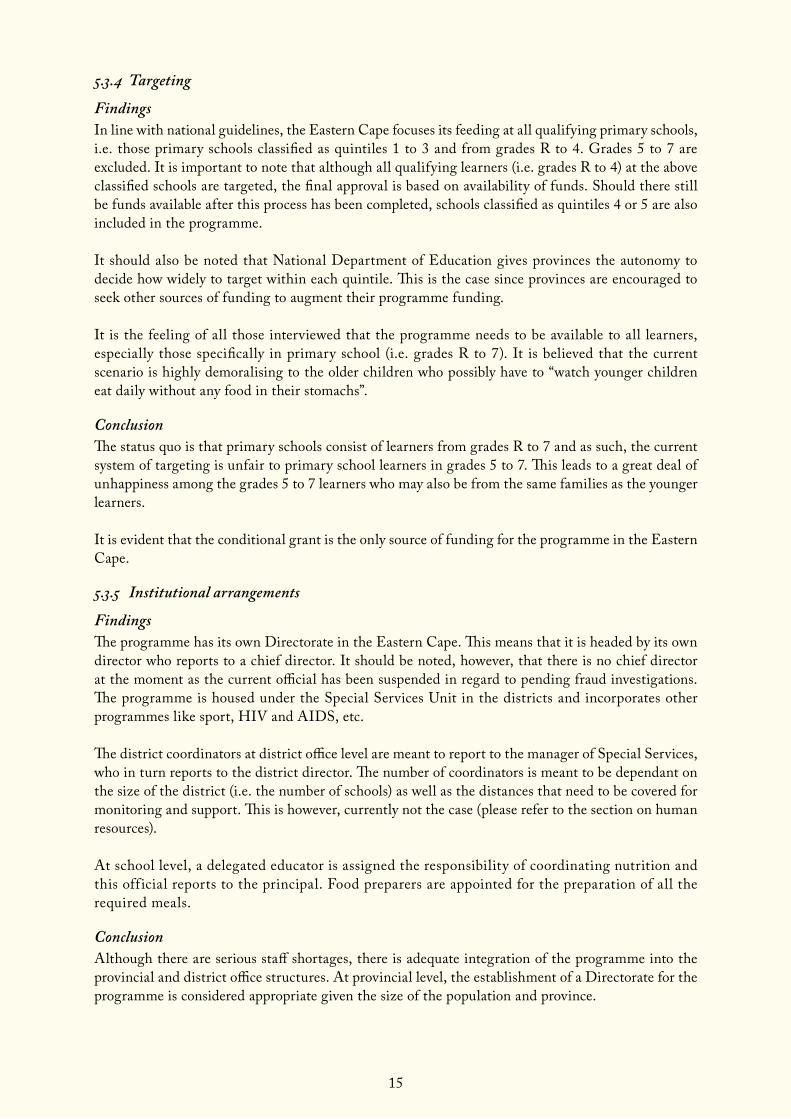
Table 5 summarises findings from school visits related to food preparation and storage facilities.
Table 5: Storage facilities and preparation and serving of food
School Storage facilities Toilet facilities General facilities Food preparation areaMadwaleni • Wendy house.
• Floor not cemented.
• Clean with good ventilation.
• Food items have valid expiry dates.
• 200m away.• Open-pit toilet.
• School is generally very neat and tidy.
• Garbage is disposed of by burning papers and stuff ing everything else in a pit.
• Preparation takes place in a disused classroom that is very soiled.
• Only rain water in use.
Makinana • Strong room.• Tidy facilities.• Food items have
valid expiry dates.
• Toilets are 70m away from the storage area.
• Smelly blocked toilets.
• Insufficient ventilation.
• School is generally very neat and tidy.
• Garbage is disposed of by burning papers and stuff ing everything else in a pit
• Preparation takes place in a clean and tidy dedicated kitchen.
• Kitchen is very tidy and clean.
• Toilets are 30m away but very clean.
• Washing facilities with fresh running water (i.e. basin and tap).

14
School Storage facilities Toilet facilities General facilities Food preparation areaIsidenge • Food stored in a
dilapidated shed.• Floor not
cemented.• Food items have
valid expiry dates.
• Toilets are 100m away.
• Smelly blocked toilets.
• School is generally very neat and tidy.
• Garbage is disposed of by burning papers and stuff ing everything else in a pit.
• Preparation takes place in a garden shed.
• There is dirt behind the shed.
• Smell of urine behind the shed.
• Shed full of f lies.• No table for food
preparation.• Water point is about
70m away.Mbanyaza • Lockable off ice.
• Tidy and clean facilities.
• Food items have valid expiry dates.
• Toilets are far away.
• School is generally very neat and tidy.
• Garbage is disposed of by burning papers and stuff ing everything else in a pit.
• Preparation takes place in a clean dedicated kitchen.
• Kitchen is very hygienic and secure.
• Only rain water in use.
All bread is cut by hand by the food preparers. None of the servings were measured by the meal servers.
Food gardens
• Of the four schools visited, only Isidenge had a food garden.• Makinana has had a garden in the past which was discontinued after theft and vandalism was
experienced.• Mbanyaza and Madwaleni have no water sources and thus no food gardens.
Garbage disposal
It was noted that all the schools visited had inadequate garbage disposal facilities, i.e. these consisted of open pits where all litter (including paper and plastics) would be burnt once the pits were full. The problem with this facility is that paper and plastic blow about in the wind and then litter the area around the pit. All schools visited disposed of biodegradable material from the kitchen in gardens.
Reporting
Very minimal reporting takes place in that the districts appear to visit the schools only when delivery problems are experienced. This appears to be due to the limited availability of vehicles and staff who do not have drivers licenses.
ConclusionThe following represents our conclusions:• There is insufficient monitoring and evaluation taking place both at district and school levels, by
district coordinators and provincial staff. This is due to uncertainties being experienced by the current staff (i.e. these are all new staff) as well as the limited availability of staff (please refer to section on human resources).
• The pending fraud investigations have caused fear among new office bearers and thus it takes time to make crucial decisions.
• Staff has not been given adequate training in monitoring, evaluation and support practices.• The challenges currently being experienced in relation to bread deliveries mean that learners are
not always fed and sometimes not on time.• It is our conclusion that none of the schools visited completed feeding before 10h00, as required
per the national guidelines.• Schools have insufficient facilities and this may result in unintended incidents, e.g. outbreaks of
diseases.• Food gardens are still going to take a long time to be implemented as most schools do not have
access to water and adequate security.
15
5.3.4 Targeting
FindingsIn line with national guidelines, the Eastern Cape focuses its feeding at all qualifying primary schools, i.e. those primary schools classified as quintiles 1 to 3 and from grades R to 4. Grades 5 to 7 are excluded. It is important to note that although all qualifying learners (i.e. grades R to 4) at the above classified schools are targeted, the final approval is based on availability of funds. Should there still be funds available after this process has been completed, schools classified as quintiles 4 or 5 are also included in the programme.
It should also be noted that National Department of Education gives provinces the autonomy to decide how widely to target within each quintile. This is the case since provinces are encouraged to seek other sources of funding to augment their programme funding.
It is the feeling of all those interviewed that the programme needs to be available to all learners, especially those specifically in primary school (i.e. grades R to 7). It is believed that the current scenario is highly demoralising to the older children who possibly have to “watch younger children eat daily without any food in their stomachs”.
ConclusionThe status quo is that primary schools consist of learners from grades R to 7 and as such, the current system of targeting is unfair to primary school learners in grades 5 to 7. This leads to a great deal of unhappiness among the grades 5 to 7 learners who may also be from the same families as the younger learners.
It is evident that the conditional grant is the only source of funding for the programme in the Eastern Cape.
5.3.5 Institutional arrangements
FindingsThe programme has its own Directorate in the Eastern Cape. This means that it is headed by its own director who reports to a chief director. It should be noted, however, that there is no chief director at the moment as the current official has been suspended in regard to pending fraud investigations. The programme is housed under the Special Services Unit in the districts and incorporates other programmes like sport, HIV and AIDS, etc.
The district coordinators at district office level are meant to report to the manager of Special Services, who in turn reports to the district director. The number of coordinators is meant to be dependant on the size of the district (i.e. the number of schools) as well as the distances that need to be covered for monitoring and support. This is however, currently not the case (please refer to the section on human resources).
At school level, a delegated educator is assigned the responsibility of coordinating nutrition and this off icial reports to the principal. Food preparers are appointed for the preparation of all the required meals.
ConclusionAlthough there are serious staff shortages, there is adequate integration of the programme into the provincial and district office structures. At provincial level, the establishment of a Directorate for the programme is considered appropriate given the size of the population and province.

16
5.3.6 Communication
FindingsThe province facilitates between six and seven inter-district meetings per year. These meetings are intended to convey crucial messages to the district coordinators, as well as identify challenges that may be experienced at the time. Although district coordinators did confirm that such meetings do take place, we are of the opinion that much was lacking by way of training on procedures and policies, e.g. some of the district coordinators were unaware that schools had to complete feeding by 10h00 every morning.
We were informed that meetings with schools and suppliers are only organised when there are chal-lenges to be discussed. It is also important to note that information sessions are held with suppliers at the beginning of the financial period, to ensure that all service providers have a uniform understand-ing of their requirements.
ConclusionIt is our conclusion that although the province facilitates inter-district meetings, their effectiveness could not be ascertained. It is evident that there are important gaps in information and training provided to districts.

17
6 outPuts
For the purposes of this evaluation, outputs of the programme were defined as achievements of the programme that impact indirectly on learning. Outcomes of the programme, discussed in the next section, were regarded as achievements of the programme that impact more directly on learning, namely the percentage of targeted learners fed and compliance with minimum feeding days. Outputs of the programme were identified as:• The presence of active food gardens in school.• Economic activity related to food gardens.• Community participation in the running of the programme in the school.
Assessments of all of these achievements were included in the school survey, the findings of which are presented below along with other sources of information.
6.1 Findings
6.1.1 Active food gardensThe establishment of active food gardens at schools and immediate communities is seen as an impor-tant indicator of performance of the programme because it ensures sustainability of the programme in the long term and also improves food security of school communities.
The table below shows the percentage of schools in the Eastern Cape with food gardens active during the evaluation period.
Table 6: Percentage of schools with active food gardens
Calendar year Complies No record Does not comply2004 15.4% 0.0% 84.6%2005 25.6% 0.0% 74.4%2006 48.7% 0.0% 51.3%
It is evident from the above table that while a little less than half of schools in the province have active food gardens, there are still many schools that do not. The percentage of schools that have active food gardens has been increasing from the 2004 period to the 2006/07 period. The following represents challenges being experienced by schools and therefore hindrances to starting and maintaining active food gardens in more schools:• The Eastern Cape experiences poor water reticulation and thus unavailability of water at schools.• Inadequate security leads to theft and vandalism.
6.1.2 Schools with economic activity related to food gardensTable 7 shows the percentage of schools with economic activity related to food gardens.
18
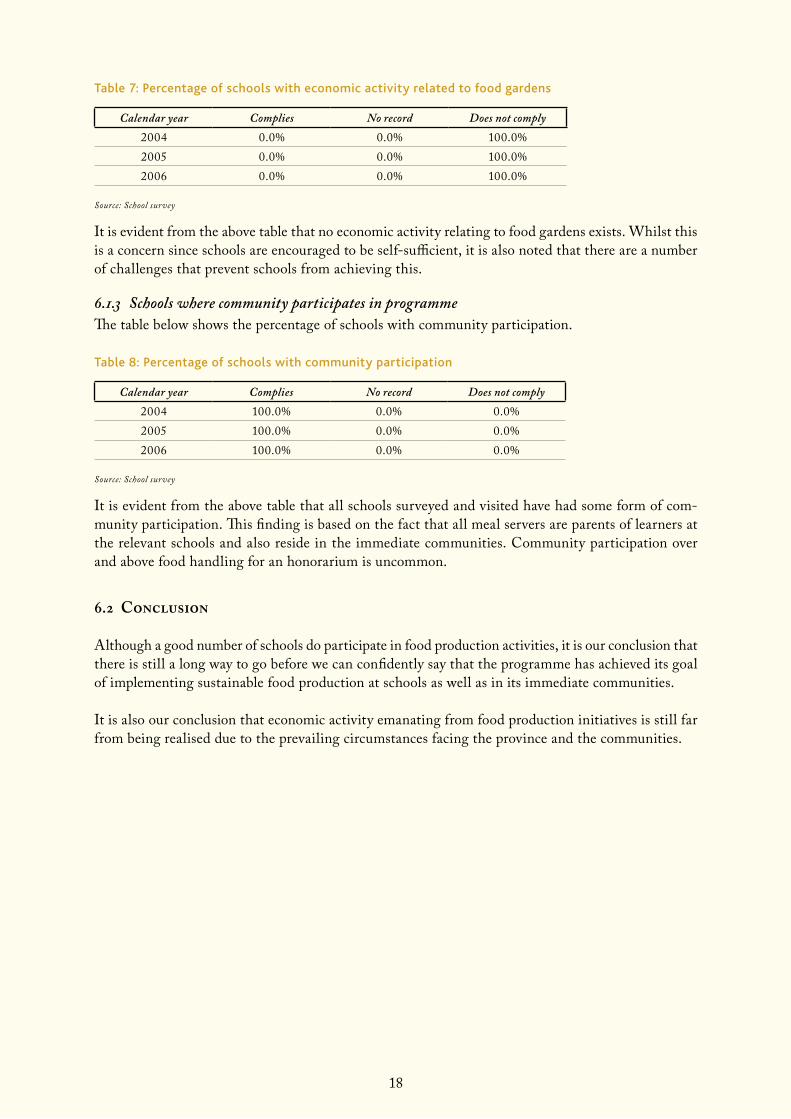
Table 7: Percentage of schools with economic activity related to food gardens
Calendar year Complies No record Does not comply2004 0.0% 0.0% 100.0%2005 0.0% 0.0% 100.0%2006 0.0% 0.0% 100.0%
Source: School survey
It is evident from the above table that no economic activity relating to food gardens exists. Whilst this is a concern since schools are encouraged to be self-sufficient, it is also noted that there are a number of challenges that prevent schools from achieving this.
6.1.3 Schools where community participates in programmeThe table below shows the percentage of schools with community participation.
Table 8: Percentage of schools with community participation
Calendar year Complies No record Does not comply2004 100.0% 0.0% 0.0%2005 100.0% 0.0% 0.0%2006 100.0% 0.0% 0.0%
Source: School survey
It is evident from the above table that all schools surveyed and visited have had some form of com-munity participation. This finding is based on the fact that all meal servers are parents of learners at the relevant schools and also reside in the immediate communities. Community participation over and above food handling for an honorarium is uncommon.
6.2 Conclusion
Although a good number of schools do participate in food production activities, it is our conclusion that there is still a long way to go before we can confidently say that the programme has achieved its goal of implementing sustainable food production at schools as well as in its immediate communities.
It is also our conclusion that economic activity emanating from food production initiatives is still far from being realised due to the prevailing circumstances facing the province and the communities.

19
7 outCoMes
For the purposes of the evaluation, outcomes were defined as programme achievements that have a direct impact on learning. These include: whether the targeted number of learners was reached by the programme in the evaluation period; whether feeding took place on the minimum required number of days; whether feeding took place before 10h00 daily; and whether meals provided complied with the prescribed menu. Given that these are key indicators of whether the objectives of the programme are being met, they were central to the school survey. The findings of the survey along with other sources of information on these indicators are reported below.
7.1 Findings
7.1.1 Targeted learners fedThe Eastern Cape provincial policy is to feed all qualifying primary school learners (i.e. those primary schools residing in areas falling within quintiles 1 to 3) but only limited to grades R to 7.
The table below shows the percentage of targeted learners that were reached by the programme during the evaluation period.
Table 9: Percentage of targeted learners fed
Calendar year 100% and above 90% to 100% No record2004 0.0% 0.0% 100.0%2005 0.0% 0.0% 100.0%2006 79.5.0% 20.5% 0.0%
Source: School survey
It is apparent from the table above that there was a dramatic improvement in the reporting of learners fed (i.e. from 2004 to 2006). This is largely due to the fact that no information could be obtained for the previous periods in the limited time we had at our disposal to complete the evaluation.
7.1.2 Compliance with number of feeding daysThe table below presents the percentage of schools that complied with the provincial targets for feed-ing days for the evaluation period.
Table 10: Percentage of schools complying with feeding days
Calendar year 100% and above No record2004 0.0% 100.0%2005 100.0% 0.0%2006 100.0% 0.0%
Source: School survey
Between 2005 and 2006, the feeding days required were 156 for both years. The table above thus shows that 100% of schools fed on all required feeding days and more. Observations at three of the four schools visited, however, reflected that food was not delivered and that the bread was stale on some days (refer to the section on Targeting). This then resulted in non-feeding during those days.
20
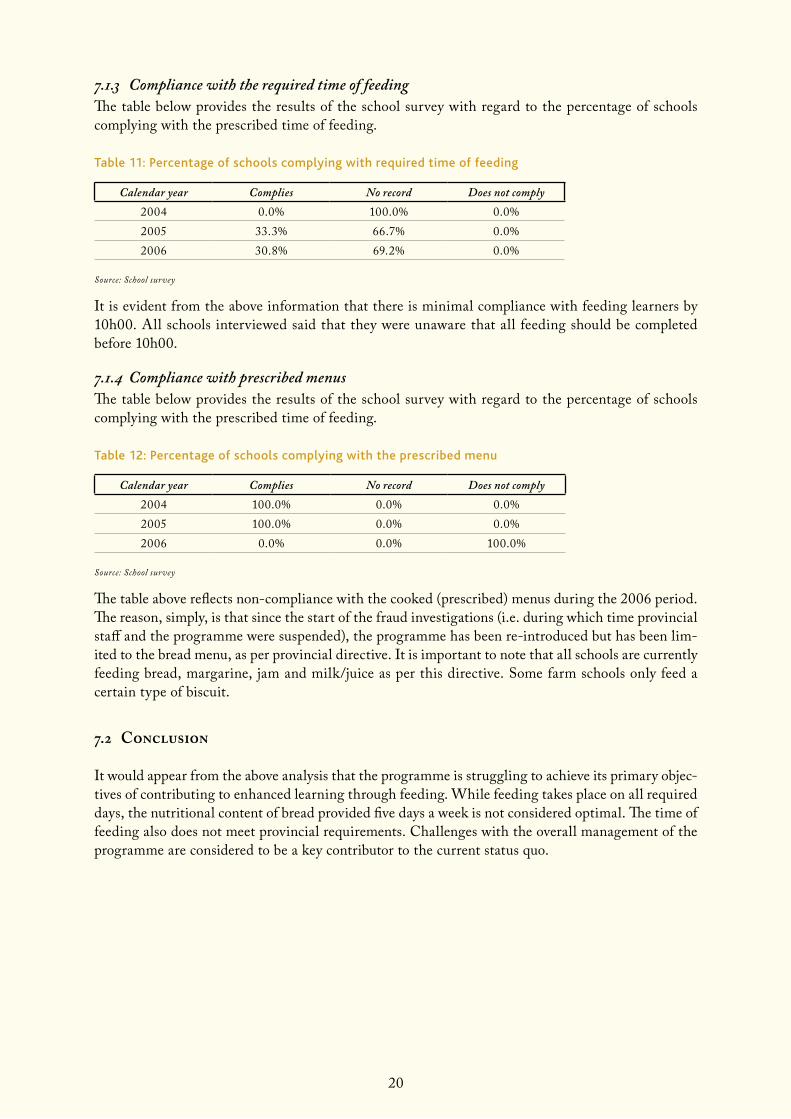
7.1.3 Compliance with the required time of feedingThe table below provides the results of the school survey with regard to the percentage of schools complying with the prescribed time of feeding.
Table 11: Percentage of schools complying with required time of feeding
Calendar year Complies No record Does not comply2004 0.0% 100.0% 0.0%2005 33.3% 66.7% 0.0%2006 30.8% 69.2% 0.0%
Source: School survey
It is evident from the above information that there is minimal compliance with feeding learners by 10h00. All schools interviewed said that they were unaware that all feeding should be completed before 10h00.
7.1.4 Compliance with prescribed menusThe table below provides the results of the school survey with regard to the percentage of schools complying with the prescribed time of feeding.
Table 12: Percentage of schools complying with the prescribed menu
Calendar year Complies No record Does not comply2004 100.0% 0.0% 0.0%2005 100.0% 0.0% 0.0%2006 0.0% 0.0% 100.0%
Source: School survey
The table above reflects non-compliance with the cooked (prescribed) menus during the 2006 period. The reason, simply, is that since the start of the fraud investigations (i.e. during which time provincial staff and the programme were suspended), the programme has been re-introduced but has been lim-ited to the bread menu, as per provincial directive. It is important to note that all schools are currently feeding bread, margarine, jam and milk/juice as per this directive. Some farm schools only feed a certain type of biscuit.
7.2 Conclusion
It would appear from the above analysis that the programme is struggling to achieve its primary objec-tives of contributing to enhanced learning through feeding. While feeding takes place on all required days, the nutritional content of bread provided five days a week is not considered optimal. The time of feeding also does not meet provincial requirements. Challenges with the overall management of the programme are considered to be a key contributor to the current status quo.
21
8 ConCLusion
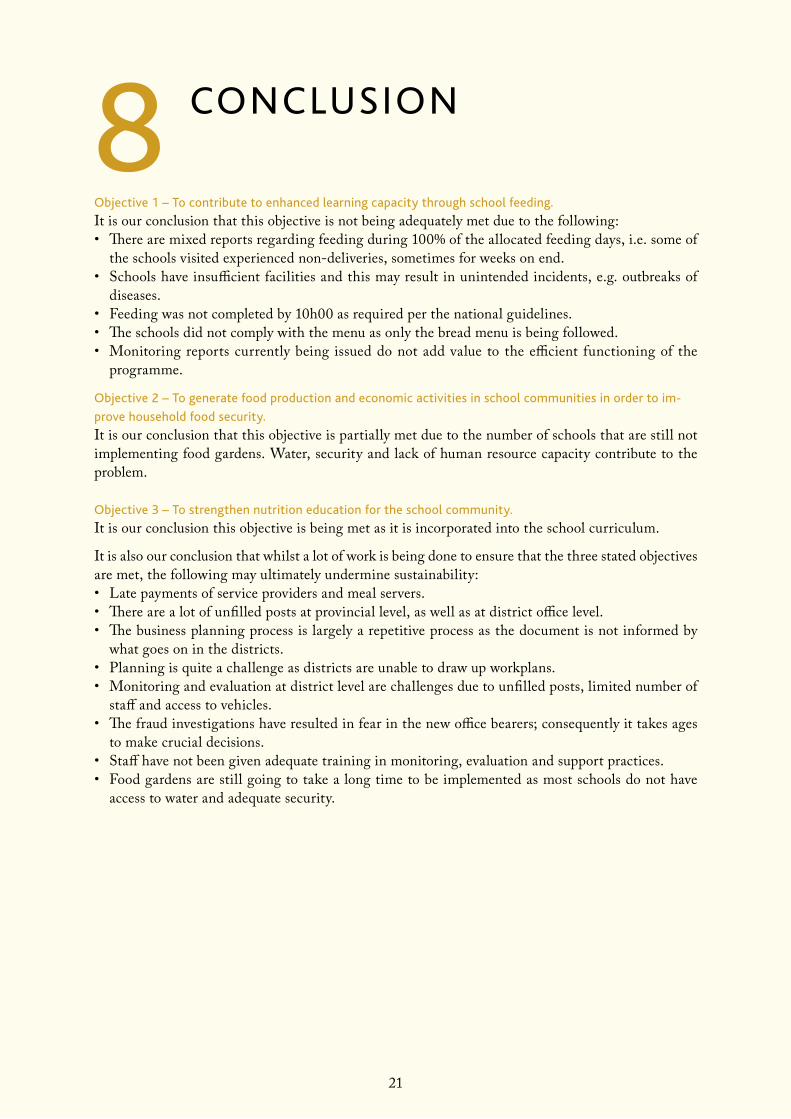
objective 1 – to contribute to enhanced learning capacity through school feeding.
It is our conclusion that this objective is not being adequately met due to the following:• There are mixed reports regarding feeding during 100% of the allocated feeding days, i.e. some of
the schools visited experienced non-deliveries, sometimes for weeks on end.• Schools have insufficient facilities and this may result in unintended incidents, e.g. outbreaks of
diseases.• Feeding was not completed by 10h00 as required per the national guidelines.• The schools did not comply with the menu as only the bread menu is being followed.• Monitoring reports currently being issued do not add value to the efficient functioning of the
programme.
objective 2 – to generate food production and economic activities in school communities in order to im-
prove household food security.
It is our conclusion that this objective is partially met due to the number of schools that are still not implementing food gardens. Water, security and lack of human resource capacity contribute to the problem.
objective 3 – to strengthen nutrition education for the school community.
It is our conclusion this objective is being met as it is incorporated into the school curriculum.
It is also our conclusion that whilst a lot of work is being done to ensure that the three stated objectives are met, the following may ultimately undermine sustainability:• Late payments of service providers and meal servers.• There are a lot of unfilled posts at provincial level, as well as at district office level.• The business planning process is largely a repetitive process as the document is not informed by
what goes on in the districts.• Planning is quite a challenge as districts are unable to draw up workplans.• Monitoring and evaluation at district level are challenges due to unfilled posts, limited number of
staff and access to vehicles.• The fraud investigations have resulted in fear in the new office bearers; consequently it takes ages
to make crucial decisions.• Staff have not been given adequate training in monitoring, evaluation and support practices.• Food gardens are still going to take a long time to be implemented as most schools do not have
access to water and adequate security.
22
9 reCoMMendations
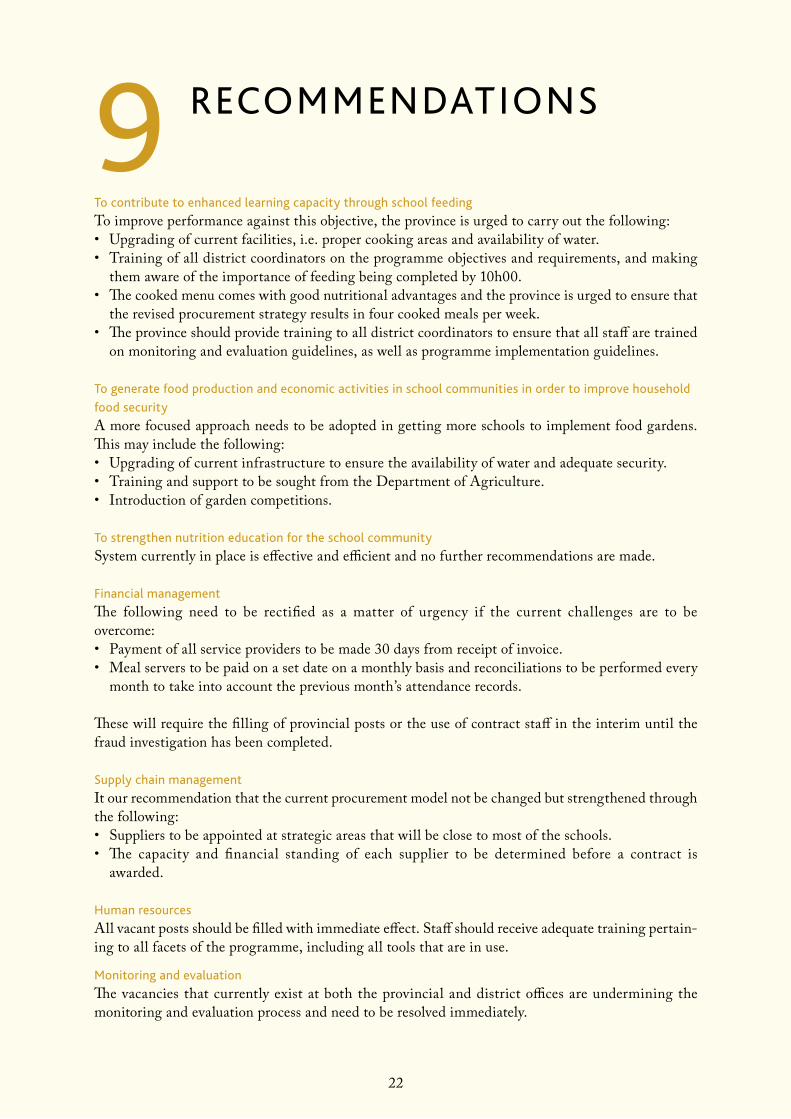
to contribute to enhanced learning capacity through school feeding
To improve performance against this objective, the province is urged to carry out the following:• Upgrading of current facilities, i.e. proper cooking areas and availability of water.• Training of all district coordinators on the programme objectives and requirements, and making
them aware of the importance of feeding being completed by 10h00.• The cooked menu comes with good nutritional advantages and the province is urged to ensure that
the revised procurement strategy results in four cooked meals per week.• The province should provide training to all district coordinators to ensure that all staff are trained
on monitoring and evaluation guidelines, as well as programme implementation guidelines.
to generate food production and economic activities in school communities in order to improve household
food security
A more focused approach needs to be adopted in getting more schools to implement food gardens. This may include the following:• Upgrading of current infrastructure to ensure the availability of water and adequate security.• Training and support to be sought from the Department of Agriculture.• Introduction of garden competitions.
to strengthen nutrition education for the school community
System currently in place is effective and efficient and no further recommendations are made.
financial management
The following need to be rectified as a matter of urgency if the current challenges are to be overcome:• Payment of all service providers to be made 30 days from receipt of invoice.• Meal servers to be paid on a set date on a monthly basis and reconciliations to be performed every
month to take into account the previous month’s attendance records.
These will require the filling of provincial posts or the use of contract staff in the interim until the fraud investigation has been completed.
supply chain management
It our recommendation that the current procurement model not be changed but strengthened through the following:• Suppliers to be appointed at strategic areas that will be close to most of the schools.• The capacity and financial standing of each supplier to be determined before a contract is
awarded.
human resources
All vacant posts should be filled with immediate effect. Staff should receive adequate training pertain-ing to all facets of the programme, including all tools that are in use.
Monitoring and evaluation
The vacancies that currently exist at both the provincial and district offices are undermining the monitoring and evaluation process and need to be resolved immediately.
23
Planning
The province needs to empower districts through training on compiling work plans that address all monitoring and evaluation issues. The work plans need to include all stated key performance indicators and prioritise visits and support to non-compliant schools. This will ensure that overall monitoring and evaluation of the programme is sustained whilst specific attention is paid to schools that are experiencing particular difficulties.
Districts should also be trained on report writing which will ensure that adequate information is collected, which will also aid in the development of a “good” business plan.
targeting
The province is encouraged to feed all learners in both primary as well as combined schools.
Communication
System functioning well and no further recommendations are made.
institutional arrangements
System functioning well and no further recommendations are made.