Embed Size (px)
Citation preview

Providing Public Workforce Services to Job Seekers: 30-month Impact Findings on the WIA Adult and Dislocated Worker Programs

ACKNOWLEDGMENTS
The authors would like to thank the many people who made this evaluation possible and who contributed to this report. Most importantly, this study would not have been possible without the support and invaluable time provided by staff of the workforce system, particularly the staff members at the participating Local Workforce Investment Areas (local areas) and American Job Centers. These staff members helped us understand their programs, took time from their responsibilities to participate in interviews and trainings, and worked with us to enroll more than 35,000 customers into the evaluation. We appreciate the careful work of these many local area staff members to make the evaluation’s implementation successful. We also thank the staff at the states with participating local areas that provided important support to and administrative data for the evaluation. In addition, we are grateful to the workforce system’s regional administrators and staff for their ongoing support. We also want to thank the many workforce system customers who participated in the study.
We received valuable input and guidance throughout the project from Eileen Pederson, our project officer from the U.S. Department of Labor (DOL), Employment and Training Administration (ETA). Others currently or previously at DOL who provided important advice and support include Demetra Nightingale, Jonathan Simonetta, and Jean Grossman of DOL’s Chief Evaluation Office, and Jane Oates, Gerri Fiala, Mike Jones, Heidi Casta, Adele Gagliardi, Wayne Gordon, and Dan Ryan of ETA.
The design of the impact study and other aspects of the evaluation benefited from the input of the evaluation’s peer review board. We thank the following board members for their valuable guidance: Burt Barnow, Gary Burtless, Scott Cheney, Virginia Hamilton, Richard Hobbie, Robert Moffitt, Peter Mueser, Demetra Nightingale, and Robert Rector. Two consultants on the study, Rob Hollister and Jeff Smith, also provided valuable insights.
Mathematica Policy Research is indebted to its research partners for making the study’s implementation enjoyable and successful. Special thanks go to staff at Social Policy Research Associates (SPR) for their input into the study design, designing the training manuals, developing and overseeing the training and monitoring procedures, collecting the administrative data, and leading the implementation study. Frieda Molina led MDRC’s teams of local area recruiters, monitors, and site visitors and the Corporation for a Skilled Workforce, led by Ed Strong, provided valuable insights throughout the study’s implementation. We would also like to thank QUESTAR Data Systems, Inc., for designing, printing, data processing, and creating data and image files of the three intake forms.
The evaluation would not have been possible without the diligence and expertise of staff from Mathematica, SPR, and MDRC. Site recruiters introduced the study to their assigned local areas. The recruiters were Andrew Burwick, Paul Decker, Gretchen Kirby, Sheena McConnell, Karen Needels, Linda Rosenberg, and Peter Schochet of Mathematica; Ron D’Amico and Andrew Wiegand of SPR; Vanessa Martin, Frieda Molina, and Donna Wharton-Fields of MDRC; and Scott Zucker, an independent consultant. We also would like to thank the site liaisons from Mathematica, SPR, and MDRC, who worked closely with the local areas to ensure that the study was implemented properly: Andrew Clarkwest, Brittany English, Annalisa Mastri, Katie Mosher, Natalya Verbitsky-Savitz, and Jessica Ziegler from Mathematica;
iii

Nadine Dechausay, David Navarro, and Betsy Tessler from MDRC; and Kate Dunham, Christian Geckeler, Deanna Khemani, Debbie Kogan, Jill Leufgen, Melissa Mack, Mike Midling, Tyler Moazed, Marian Negoita, Laura Paulen, Jeff Salzman, Dae Son, Andrew Wiegand, and Kristin Wolff from SPR.
At Mathematica, our survey team led by Patricia Nemeth and Ryan Callahan designed and oversaw the administration of the study’s intake forms and 15- and 30-month survey instruments. Barbara Kolln and her team developed the random assignment system. Bryce Onaran and Claire Smither Wulsin tracked and processed the program financial data. Mary Grider spearheaded a topnotch data management and programming team that included Emma Kopa, Linda Molinari, Xiaofan Sun, Elias Sanchez-Eppler, Lindsay Cattell, and Kai Filipczak. Katie Bodenlos, AnnaMaria McCutcheon, Jessica Morton, and Reed Thompson provided critical logistical and project management support.
This report benefited from Melissa Clark’s and Elias Sanchez-Eppler’s careful reviews of an earlier draft as well as input from Melissa Clark and Barbara Carlson on analytical decisions. John Kennedy and Patricia Ciaccio provided editorial assistance, and Jennifer Baskwell, Laura Sarnoski, Jessica Hegedus, Dorothy Bellow, and Sheena Flowers provided production support.
We thank all these people for their valuable input and support.
iv
CONTENTS
EXECUTIVE SUMMARY ............................................................................................................................ xv
I. INTRODUCTION .............................................................................................................................. 1
A. The Adult and Dislocated Worker programs ............................................................................. 1
B. Changes to the programs under WIOA ..................................................................................... 4
C. Overview of the WIA Gold Standard Evaluation........................................................................ 5
D. What we learned from the implementation study ...................................................................... 7
E. What we learned from the 15-month impact study .................................................................... 9
F. Evidence from prior studies ..................................................................................................... 10
G. Organization of this report ....................................................................................................... 12
II. THE DESIGN OF THE IMPACT STUDY ....................................................................................... 13
A. Randomly selecting local areas for the study .......................................................................... 13
B. Experimental design ................................................................................................................ 15
C. Data sources............................................................................................................................ 19
D. Impact analysis approach ........................................................................................................ 21
III. CONTEXT ...................................................................................................................................... 25
A. Variation in local areas in which the programs operated ........................................................ 25
B. Labor market conditions .......................................................................................................... 27
C. Funding availability .................................................................................................................. 28
D. Customer characteristics ......................................................................................................... 30
IV. RECEIPT OF CORE, INTENSIVE, AND SUPPORTIVE SERVICES ............................................ 33
A. Summary of the services available to and received by members of each group .................... 34
B. Use of resource rooms ............................................................................................................ 36
C. Workshops attended ................................................................................................................ 38
D. Job clubs attended .................................................................................................................. 39
E. Assessments taken ................................................................................................................. 40
F. Receipt of one-on-one staff assistance ................................................................................... 42
G. Receipt of supportive services................................................................................................. 44
H. Differences in satisfaction with the American Job Center experience .................................... 46
I. Differences in service receipt by adults and dislocated workers ............................................. 47
v

V. RECEIPT OF TRAINING SERVICES ............................................................................................ 49
A. Enrollment in training ............................................................................................................... 50
B. Amount of training received ..................................................................................................... 54
C. Characteristics of training programs ........................................................................................ 56
D. Completion of training and receipt of credentials .................................................................... 59
E. Funding of training programs ................................................................................................... 62
F. Differences in receipt of training by adults and dislocated workers ........................................ 65
VI. IMPACTS ON EARNINGS AND EMPLOYMENT .......................................................................... 67
A. Impacts of WIA-funded training ............................................................................................... 68
1. Earnings ............................................................................................................................ 70
2. Employment ...................................................................................................................... 72
3. Hours worked .................................................................................................................... 74
4. Earnings and employment for adults and dislocated workers .......................................... 74
5. Characteristics of jobs among those who were employed................................................ 78
6. Occupations of employed customers ................................................................................ 79
B. Impacts of WIA-funded intensive services .............................................................................. 80
1. Earnings ............................................................................................................................ 80
2. Employment ...................................................................................................................... 82
3. Hours worked .................................................................................................................... 84
4. Earnings and employment for adults and dislocated workers .......................................... 84
5. Characteristics of jobs among those who were employed................................................ 87
6. Occupations of employed customers ................................................................................ 88
C. Impacts of both WIA-funded training and WIA-funded intensive services .............................. 89
1. Earnings ............................................................................................................................ 90
2. Employment ...................................................................................................................... 92
3. Hours worked .................................................................................................................... 94
4. Earnings and employment for adults and dislocated workers .......................................... 95
5. Characteristics of jobs among those who were employed.............................................. 100
6. Occupations of employed customers .............................................................................. 101
D. Relevance of training to subsequent occupation................................................................... 101
VII. IMPACTS ON HOUSEHOLD INCOME, RECEIPT OF PUBLIC ASSISTANCE, AND OTHER OUTCOMES ................................................................................................................... 105
A. Impacts of WIA-funded training ............................................................................................. 105
B. Impacts of WIA-funded intensive services ............................................................................ 109
vi
C. Impacts of both WIA-funded training and WIA-funded intensive services ............................ 111
D. Impacts for adults and dislocated workers ............................................................................ 115
VIII. BENEFIT-COST ANALYSIS ........................................................................................................ 117
A. Approach to estimating net benefits ...................................................................................... 117
1. Benefits and costs from different perspectives ............................................................... 118
2. Accounting for benefits accruing later than costs ........................................................... 118
3. Measures of benefits and costs ...................................................................................... 119
4. Estimating the net benefits of providing each type of service ......................................... 122
5. Sensitivity analyses ......................................................................................................... 122
B. Benefits, costs, and net benefits of WIA-funded training ...................................................... 123
C. Benefits, costs, and net benefits of WIA-funded intensive services ...................................... 125
D. Benefits, costs, and net benefits of WIA-funded training and intensive services .................. 126
E. Benefits and costs for adults and dislocated workers ........................................................... 128
1. Benefits, costs, and net benefits of WIA-funded training, by adult and dislocated worker status ................................................................................................................... 128
2. Benefits, costs, and net benefits of WIA-funded intensive services, by adult and dislocated worker status ................................................................................................. 129
3. Benefits, costs, and net benefits of WIA-funded intensive and training services, by adult and dislocated worker status ............................................................................. 131
F. Results of the sensitivity analyses ......................................................................................... 132
IX. DISCUSSION ............................................................................................................................... 135
REFERENCES .......................................................................................................................................... 141
vii

This page has been left blank for double-sided copying.

TABLES
1 Differences in receipt of core, intensive, and supportive services ................................................ xxii
I.1 Summary of findings from multistate non-experimental studies of the Adult and Dislocated Worker programs ......................................................................................................... 11
III.1 Features of the study local areas ................................................................................................... 26
III.2 Characteristics of all customers, dislocated workers, and adults in the 30-month survey analysis sample at baseline ........................................................................................................... 30
IV.1 Core, intensive, and supportive services for which we have survey data on customer service receipt ................................................................................................................................ 35
IV.2 Summary of differences in receipt of core, intensive, and supportive services (all customers) ..................................................................................................................................... 36
IV.3 Length of time spent receiving one-on-one staff assistance from an American Job Center or elsewhere ................................................................................................................................... 44
IV.4 Total financial assistance received since random assignment (all customers) ............................. 46
IV.5 Summary of differences in receipt of core, intensive, and supportive services, separately for adults and dislocated workers (all customers) .......................................................................... 48
V.1 Number of training programs and length of training (all customers) .............................................. 55
V.2 Number of training programs and length of training (trainees) ...................................................... 55
V.3 Completion of training programs and receipt of a credential for vocational and educational programs (all customers) ............................................................................................................... 61
V.4 Characteristics of funding received from the Adult and Dislocated Worker programs, 15 months after random assignment .................................................................................................. 63
VI.1 Characteristics of most recent job for full-WIA and core-and-intensive groups (employed customers) ..................................................................................................................................... 78
VI.2 Most frequently reported occupations of current or most recent job reported for full-WIA and core-and-intensive groups (customers employed in follow-up period) ................................... 79
VI.3 Characteristics of most recent job for core-and-intensive and core groups from survey data (employed customers) ........................................................................................................... 88
VI.4 Most frequently reported occupations of current or most recent job reported for core-and-intensive and core groups (employed customers) ......................................................................... 89
VI.5 Impact estimates by data source (all customers) and quarter ....................................................... 92
VI.6 Characteristics of most recent job for each study group (employed customers) ......................... 100
VI.7 Most frequently reported occupations of current or most recent job reported for each study group (customers employed in follow-up period) ............................................................... 101
VI.8 Whether jobs before and after random assignment differed (all customers) ............................... 104
VIII.1 Per-person total cost of services to society as a whole (all customers) ...................................... 121
ix
VIII.2 Net benefits associated with WIA-funded training (all customers)............................................... 124
VIII.3 Net benefits associated with WIA-funded intensive services (all customers) .............................. 125
VIII.4 Net benefits associated with WIA-funded intensive and training services (all customers) .......... 127
VIII.5 Net benefits associated with WIA-funded training, separately for adults and dislocated workers (all customers) ................................................................................................................ 129
VIII.6 Net benefits associated with WIA-funded intensive services, separately for adults and dislocated workers (all customers) ............................................................................................... 130
VIII.7 Net benefits associated with WIA-funded intensive and training services, separately for adults and dislocated workers (all customers) ............................................................................. 131
VIII.8 Net benefits associated with WIA-funded services, sensitivity analysis (all customers) ............. 133
x
FIGURES
1 Three tiers of services .................................................................................................................... xvi
2 Locations of the 28 randomly selected local areas participating in the study ............................... xvii
3 The three study groups ................................................................................................................ xviii
4 Comparing outcomes between the study groups .......................................................................... xix
5 Timeline for a typical full-WIA customer who enrolled in training ................................................... xx
6 Enrollment in training funded by any source in the 30 months after random assignment (all customers) ............................................................................................................................... xxii
7 Enrollment in training (all customers), by quarter ........................................................................ xxiii
8 Completion of a training program and receipt of a credential for completing a training program (all customers) ............................................................................................................... xxiv
9 Completion of a training program and receipt of a credential for completing a training program (trainees) ......................................................................................................................... xxv
10 Satisfaction with American Job Center experience (all customers) ............................................. xxvi
11 Earnings for full-WIA and core-and-intensive groups from survey data (all customers), by quarter ......................................................................................................................................... xxvii
12 Earnings for full-WIA and core-and-intensive groups from NDNH (all customers), by quarter ........................................................................................................................................ xxviii
13 Earnings for core-and-intensive and core groups from survey data (all customers), by quarter .......................................................................................................................................... xxix
14 Earnings for core-and-intensive and core groups from NDNH (all customers), by quarter ......... xxix
15 Earnings for full-WIA and core groups from survey data (all customers), by quarter .................. xxxi
16 Earnings for full-WIA and core groups from NDNH data (all customers), by quarter .................. xxxi
I.1 The three groups to which customers in the study were assigned .................................................. 7
I.2 Types of services offered by local areas in the study ...................................................................... 8
II.1 Locations of the 28 local areas participating in the study .............................................................. 14
II.2 Number of customers at each stage of study intake ...................................................................... 17
II.3 Attrition of customers from the study ............................................................................................. 18
II.4 Comparing outcomes between the groups .................................................................................... 22
II.5 How providing services might improve outcomes .......................................................................... 23
III.1 National unemployment rate during the follow-up period .............................................................. 27
III.2 Annual unemployment rates in the 28 study local areas in 2012 .................................................. 28
III.3 Trend in national funding for the Adult and Dislocated Worker programs, 2000–2015 ................. 29
xi
IV.1 Used a resource room at an American Job Center or elsewhere (all customers) ......................... 37
IV.2 Attended a workshop at an American Job Center or elsewhere (all customers) ........................... 39
IV.3 Participated in a job club at an American Job Center or elsewhere (all customers) ..................... 40
IV.4 Took an assessment at an American Job Center or elsewhere (all customers) ........................... 41
IV.5 Receipt of one-on-one staff assistance at an American Job Center or elsewhere (all customers) ..................................................................................................................................... 43
IV.6 Receipt of supportive services from an American Job Center or elsewhere (all customers) ........ 45
IV.7 Satisfaction with American Job Center experience (all customers) ............................................... 47
V.1 Enrollment in training funded by any source (all customers), by quarter ....................................... 51
V.2 Enrollment in training funded by any source (all customers) ......................................................... 51
V.3 Receipt of training, WIA-funded training, and ITAs, by full-WIA customers, first 15 months after random assignment ............................................................................................................... 53
V.4 Enrollment in training (trainees), by quarter ................................................................................... 56
V.5 Enrollment in different types of training programs (trainees) ......................................................... 57
V.6 Enrollment in training at common provider types (trainees) .......................................................... 58
V.7 Enrollment in top five training programs (trainees) ........................................................................ 59
V.8 Completion of a training program and receipt of a credential for completing a training program (all customers) ................................................................................................................. 60
V.9 Completion of a training program and receipt of a credential for completing a training program (trainees) .......................................................................................................................... 62
V.10 Receipt of Pell Grants (trainees) .................................................................................................... 64
V.11 Payment for training (trainees) ....................................................................................................... 65
V.12 Enrollment in training funded by any source, separately for adults and dislocated workers (all customers) ................................................................................................................................ 66
VI.1 Timeline for a typical full-WIA training enrollee .............................................................................. 70
VI.2 Earnings for full-WIA and core-and-intensive groups from survey data (all customers), by quarter ............................................................................................................................................ 71
VI.3 Earnings for full-WIA and core-and-intensive groups from NDNH data (all customers), by quarter ............................................................................................................................................ 72
VI.4 Employment rates for full-WIA and core-and-intensive groups from survey data (all customers), by quarter ................................................................................................................... 73
VI.5 Employment rates for full-WIA and core-and-intensive groups from NDNH data (all customers), by quarter ................................................................................................................... 73
VI.6 Hours worked for full-WIA and core-and-intensive groups (all customers), by quarter ................. 74
xii
VI.7 Earnings among adults in full-WIA and core-and-intensive groups from survey data (all adults), by quarter .......................................................................................................................... 75
VI.8 Earnings among dislocated workers in full-WIA and core-and-intensive groups from survey data (all dislocated workers), by quarter ............................................................................ 76
VI.9 Earnings among adults in full-WIA and core-and-intensive groups from NDNH data (all adults), by quarter .......................................................................................................................... 77
VI.10 Earnings among dislocated workers in full-WIA and core-and-intensive groups from NDNH data (all dislocated workers), by quarter ............................................................................ 77
VI.11 Earnings for core-and-intensive and core groups from survey data (all customers), by quarter ............................................................................................................................................ 81
VI.12 Earnings for core-and-intensive and core groups from NDNH data (all customers), by quarter ............................................................................................................................................ 82
VI.13 Employment rates for core-and-intensive and core groups from survey data (all customers), by quarter ................................................................................................................... 83
VI.14 Employment rates for core-and-intensive and core groups from NDNH data (all customers), by quarter ................................................................................................................... 83
VI.15 Hours worked for core-and-intensive and core groups (all customers) ......................................... 84
VI.16 Earnings among adults in core-and-intensive and core groups from survey data (all adults), by quarter .......................................................................................................................... 85
VI.17 Earnings among dislocated workers in core-and-intensive and core groups from survey data (all dislocated workers), by quarter ........................................................................................ 86
VI.18 Earnings among adults in core-and-intensive and core groups from NDNH data (all adults), by quarter .......................................................................................................................... 86
VI.19 Earnings among dislocated workers in core-and-intensive and core groups from NDNH data (all dislocated workers), by quarter ........................................................................................ 87
VI.20 Earnings for each study group from survey data (all customers), by quarter ................................ 90
VI.21 Earnings for each study group from NDNH data (all customers), by quarter ................................ 91
VI.22 Employment rates for each study group from survey data (all customers), by quarter ................. 93
VI.23 Employment for each study group from NDNH data (all customers), by quarter .......................... 94
VI.24 Hours worked for each study group (all customers) ...................................................................... 95
VI.25 Earnings among adults in each study group from survey data (all adults), by quarter .................. 96
VI.26 Earnings among dislocated workers in each study group from survey data (all dislocated workers), by quarter ....................................................................................................................... 97
VI.27 Earnings among adults in each study group from NDNH data (all adults), by quarter .................. 98
VI.28 Earnings among dislocated workers in each study group from NDNH data (all dislocated workers), by quarter ....................................................................................................................... 99
xiii
VI.29 Believe found a job due to training (among customers who enrolled in training at some time during the 30 months after random assignment) ................................................................. 102
VI.30 Employment rate in Quarter 10 among customers who enrolled in training at some time during the 30 months after random assignment .......................................................................... 103
VI.31 Found employment in an occupation related to training (customers who enrolled in occupation-specific training) ........................................................................................................ 104
VII.1 Total annual household income for full-WIA and core-and-intensive groups (all customers) ................................................................................................................................... 106
VII.2 Household receipt of public assistance in calendar year preceding 30-month follow-up survey for full-WIA and core-and-intensive groups (all customers) ............................................. 107
VII.3 Total unemployment compensation over three years after random assignment for full-WIA and core-and-intensive groups (all customers) .................................................................... 108
VII.4 Receipt of unemployment compensation after random assignment for full-WIA and core-and-intensive groups (all customers), by quarter ......................................................................... 109
VII.5 Amount of public assistance received in calendar year preceding 30-month follow-up survey for core-and-intensive and core groups (all customers) ................................................... 110
VII.6 Total unemployment compensation over three years after random assignment for core-and-intensive and core groups (all customers) ............................................................................ 111
VII.7 Total annual household income for each study group (all customers) ........................................ 112
VII.8 Household receipt of public assistance in calendar year preceding 30-month follow-up survey for each study group (all customers) ................................................................................ 113
VII.9 Amount of public assistance received in calendar year preceding 30-month follow-up survey for each study group (all customers) ................................................................................ 114
VII.10 Total unemployment compensation over 12 quarters after random assignment (all customers) ................................................................................................................................... 115
VIII.1 Average per-use costs of key services ........................................................................................ 120
xiv

EXECUTIVE SUMMARY
With a growing need for a more skilled workforce, providing effective and efficient employment and training services is an important national priority. First authorized under the Workforce Investment Act of 1998 (WIA) and then reauthorized in 2014 under the Workforce Innovation and Opportunity Act (WIOA), the Adult and Dislocated Worker programs are two of the nation’s largest publicly funded programs providing employment and training services.
Despite their importance, the Adult and Dislocated Worker programs have not been evalu-ated using the most rigorous methods. Hence, in 2008, the Employment and Training Admin-istration within the U.S. Department of Labor (DOL) launched a national experimental evaluation of the two programs, the WIA Adult and Dislocated Worker Programs Gold Standard Evaluation. The evaluation’s goals are to provide national estimates of the impacts and cost-effectiveness of the Adult and Dislocated Worker programs and to describe their implementation in detail.
This report presents the study’s findings on the effectiveness of WIA-funded, staff-assisted employment services that are classified as intensive services, and WIA-funded training, both sepa-rately and together. The effectiveness of these services are measured relative to “core services” available to everyone at American Job Centers and other services in the community. The report presents estimated impacts of the services based on customers’ experiences during the 30 months after they enrolled in the study. The report builds upon an earlier report (McConnell et al. 2016) that discussed estimated impacts in the first 15 months after customers enrolled in the study, as well as an implementation study conducted alongside the impact evaluation (D’Amico et al. 2015).
Although we studied the Adult and Dislocated Worker programs as they operated under WIA, the findings and lessons learned are still likely to be relevant under WIOA. WIOA made important changes to the workforce system—providing more flexibility in service delivery, requiring industry or sector partnerships to better meet the needs of the business community, increasing cross-agency service integration, strengthening performance accountability, expanding public access to training program performance, increasing services to individuals with barriers to employment, and increasing the emphasis on evaluation and evidence. However, despite these changes, the Adult and Dislocated Worker programs still offer a similar set of services and serve the same general populations. In addition, many of the important changes explicitly introduced by WIOA reflected changes the local areas were already making under WIA. Hence, our estimated impacts for training and intensive services under WIA are relevant for policy decisions under WIOA.
The Adult and Dislocated Worker programs
WIA required that Local Workforce Investment Boards, each responsible for managing services within a Local Workforce Investment Area (local area), establish a coordinated delivery system composed of American Job Centers (also known as One-Stop Career Centers). At these centers, the Adult and Dislocated Worker programs offered services in three tiers that provided progressively greater levels of assistance according to customers’ needs: (1) core services, (2) intensive services, and (3) training services (Figure 1). Under WIOA, core and intensive services were merged into a single career services tier, but local areas can continue to offer the same set of services they offered under WIA. At the discretion of local areas, the Adult and
xv
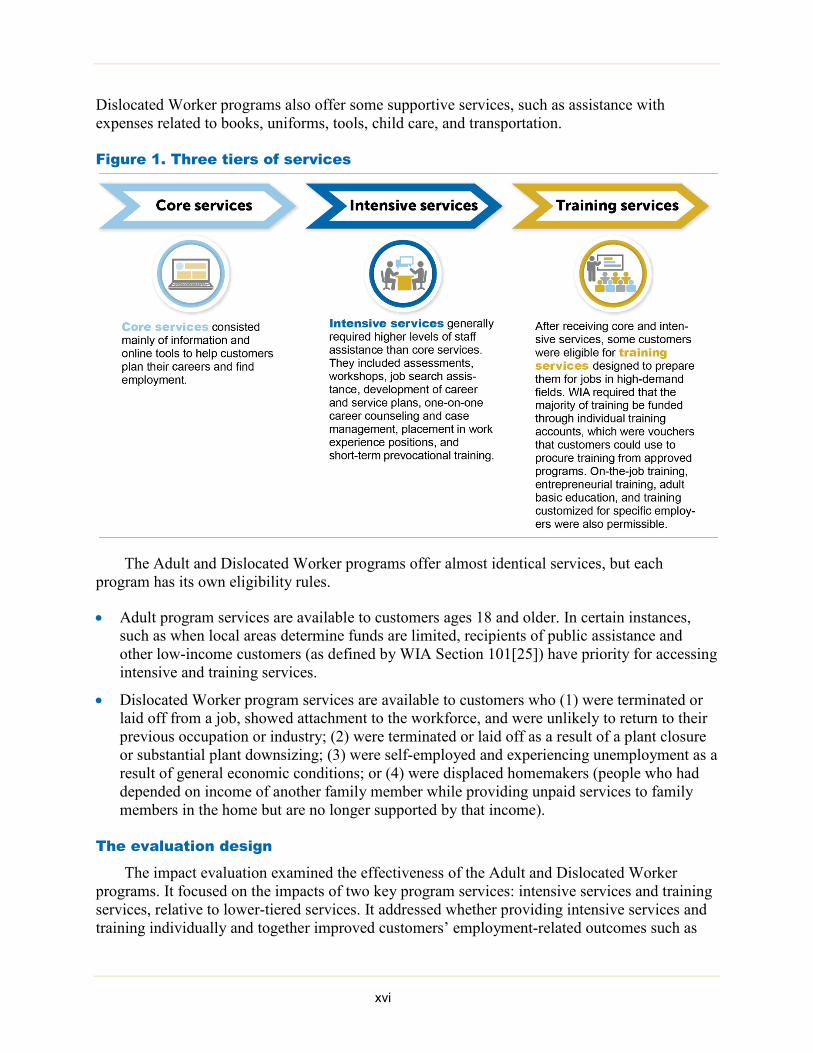
Dislocated Worker programs also offer some supportive services, such as assistance with expenses related to books, uniforms, tools, child care, and transportation.
Figure 1. Three tiers of services
The Adult and Dislocated Worker programs offer almost identical services, but each program has its own eligibility rules.
• Adult program services are available to customers ages 18 and older. In certain instances, such as when local areas determine funds are limited, recipients of public assistance and other low-income customers (as defined by WIA Section 101[25]) have priority for accessing intensive and training services.
• Dislocated Worker program services are available to customers who (1) were terminated or laid off from a job, showed attachment to the workforce, and were unlikely to return to their previous occupation or industry; (2) were terminated or laid off as a result of a plant closure or substantial plant downsizing; (3) were self-employed and experiencing unemployment as a result of general economic conditions; or (4) were displaced homemakers (people who had depended on income of another family member while providing unpaid services to family members in the home but are no longer supported by that income).
The evaluation design
The impact evaluation examined the effectiveness of the Adult and Dislocated Worker programs. It focused on the impacts of two key program services: intensive services and training services, relative to lower-tiered services. It addressed whether providing intensive services and training individually and together improved customers’ employment-related outcomes such as
xvi
earnings, employment, and job quality. In summary, the evaluation addressed three main questions:
1. Did providing the full set of WIA services including core, intensive, and training services improve employment-related outcomes more than providing only core and intensive services?
2. Did providing core and intensive services improve employment-related outcomes more than providing core services only?
3. Did providing core, intensive, and training services improve employment-related outcomes more than only providing core services?
The evaluation focuses on answering these questions for adults and dislocated workers together but considers estimates separately for the two sets of customers as well.
The evaluation also included an implementation study and a benefit-cost analysis. D’Amico et al. (2015) and a series of briefs reported the findings of the implementation study. This report includes the findings from the benefit-cost analysis, which itemizes specific monetary benefits and costs of these services, considers who receives those benefits and pays those costs, and aggregates the specific benefits and costs into a net benefit of providing these services.
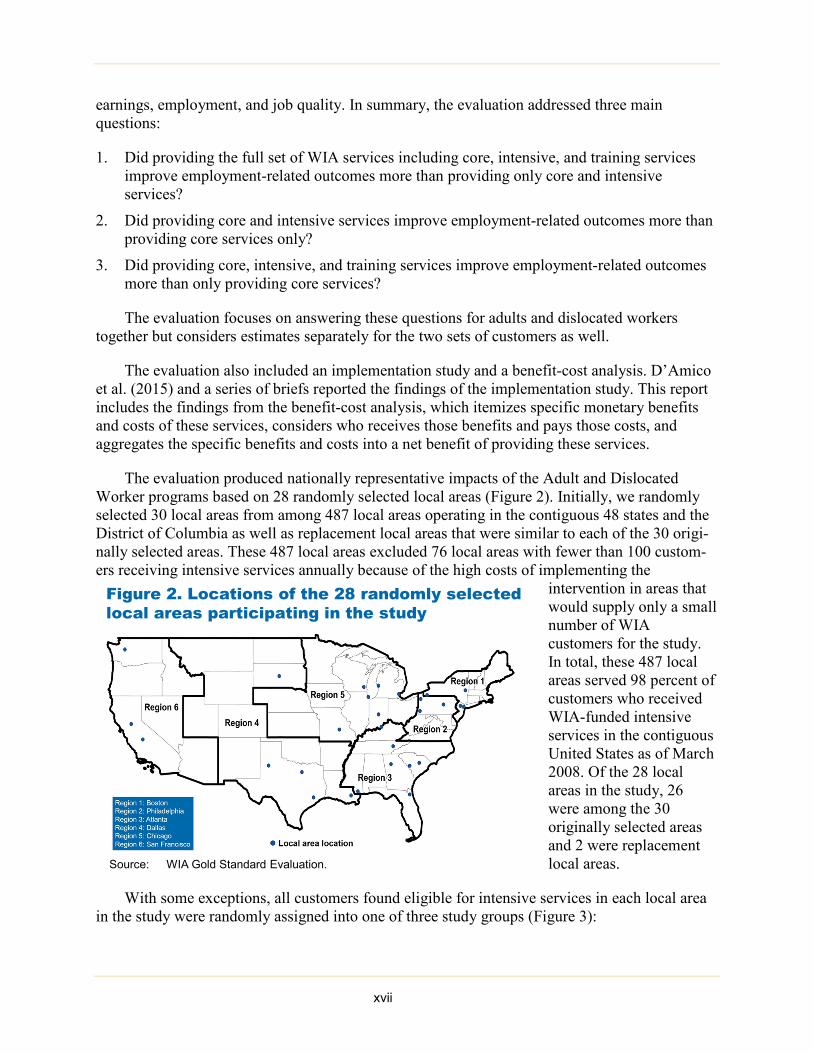
The evaluation produced nationally representative impacts of the Adult and Dislocated Worker programs based on 28 randomly selected local areas (Figure 2). Initially, we randomly selected 30 local areas from among 487 local areas operating in the contiguous 48 states and the District of Columbia as well as replacement local areas that were similar to each of the 30 origi-nally selected areas. These 487 local areas excluded 76 local areas with fewer than 100 custom-ers receiving intensive services annually because of the high costs of implementing the
intervention in areas that would supply only a small number of WIA customers for the study. In total, these 487 local areas served 98 percent of customers who received WIA-funded intensive services in the contiguous United States as of March 2008. Of the 28 local areas in the study, 26 were among the 30 originally selected areas and 2 were replacement local areas.
With some exceptions, all customers found eligible for intensive services in each local area in the study were randomly assigned into one of three study groups (Figure 3):
Figure 2. Locations of the 28 randomly selected local areas participating in the study
Source: WIA Gold Standard Evaluation.
xvii
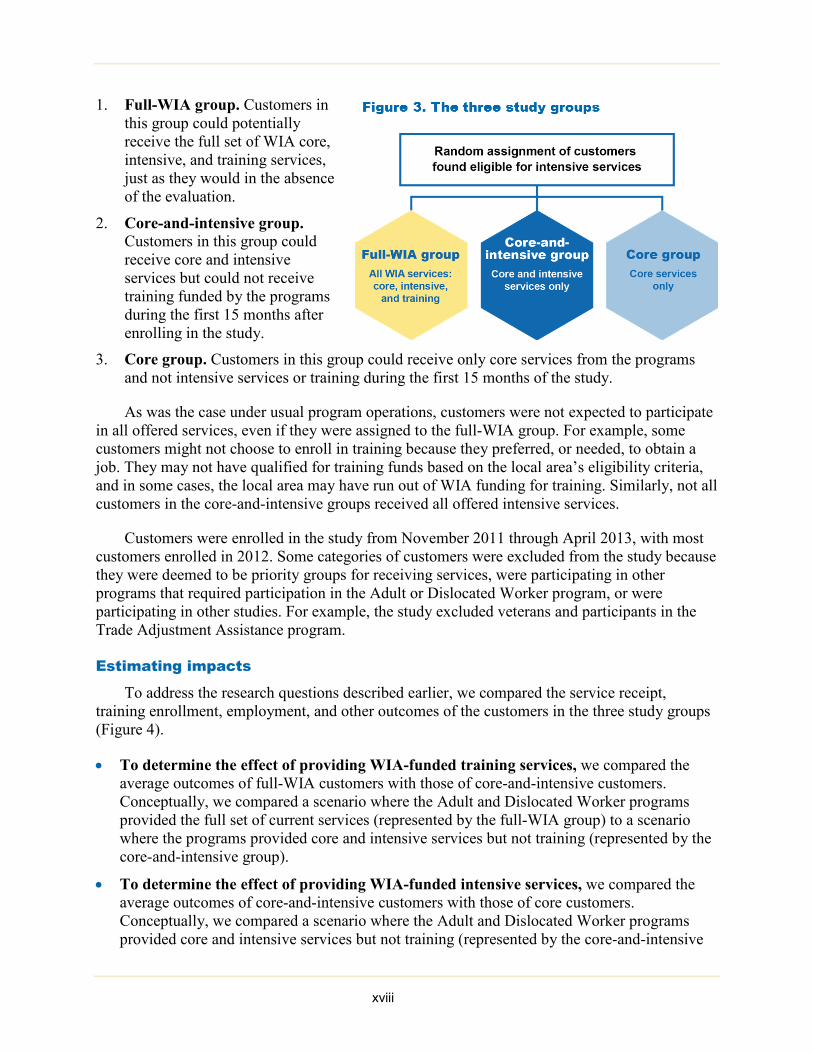
1. Full-WIA group. Customers in this group could potentially receive the full set of WIA core, intensive, and training services, just as they would in the absence of the evaluation.
2. Core-and-intensive group. Customers in this group could receive core and intensive services but could not receive training funded by the programs during the first 15 months after enrolling in the study.
3. Core group. Customers in this group could receive only core services from the programs and not intensive services or training during the first 15 months of the study.
As was the case under usual program operations, customers were not expected to participate in all offered services, even if they were assigned to the full-WIA group. For example, some customers might not choose to enroll in training because they preferred, or needed, to obtain a job. They may not have qualified for training funds based on the local area’s eligibility criteria, and in some cases, the local area may have run out of WIA funding for training. Similarly, not all customers in the core-and-intensive groups received all offered intensive services.
Customers were enrolled in the study from November 2011 through April 2013, with most customers enrolled in 2012. Some categories of customers were excluded from the study because they were deemed to be priority groups for receiving services, were participating in other programs that required participation in the Adult or Dislocated Worker program, or were participating in other studies. For example, the study excluded veterans and participants in the Trade Adjustment Assistance program.
Estimating impacts
To address the research questions described earlier, we compared the service receipt, training enrollment, employment, and other outcomes of the customers in the three study groups (Figure 4).
• To determine the effect of providing WIA-funded training services, we compared the average outcomes of full-WIA customers with those of core-and-intensive customers. Conceptually, we compared a scenario where the Adult and Dislocated Worker programs provided the full set of current services (represented by the full-WIA group) to a scenario where the programs provided core and intensive services but not training (represented by the core-and-intensive group).
• To determine the effect of providing WIA-funded intensive services, we compared the average outcomes of core-and-intensive customers with those of core customers. Conceptually, we compared a scenario where the Adult and Dislocated Worker programs provided core and intensive services but not training (represented by the core-and-intensive
xviii
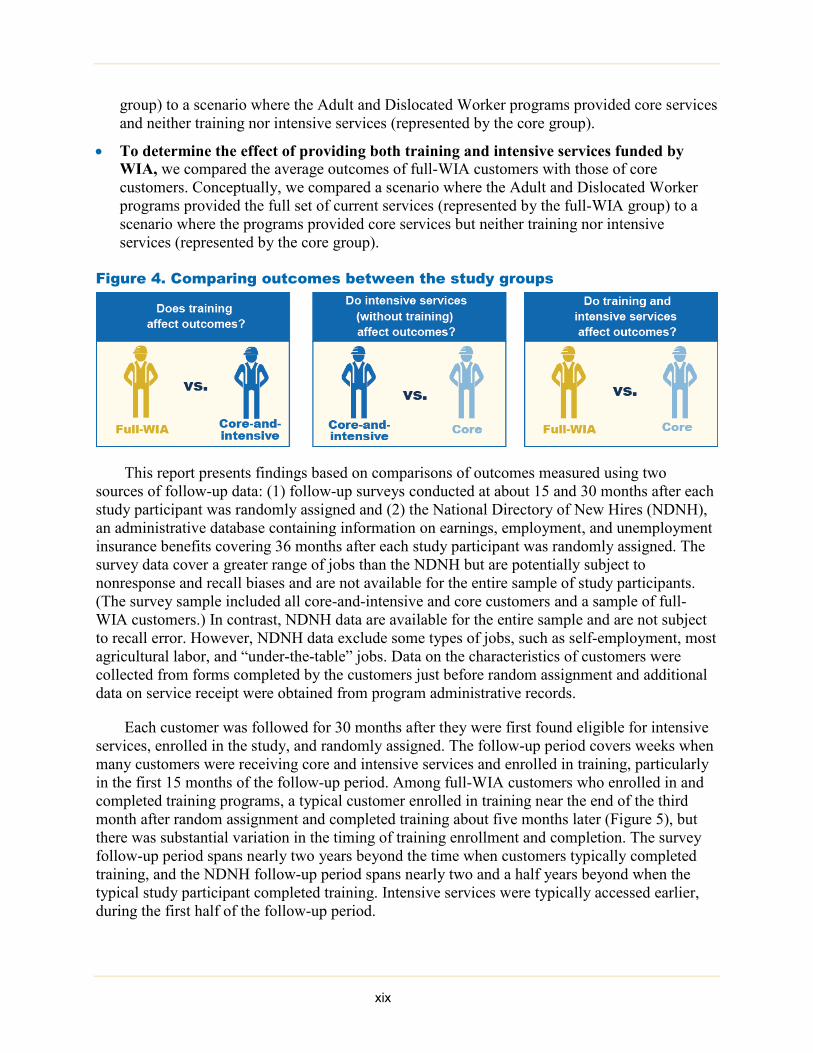
group) to a scenario where the Adult and Dislocated Worker programs provided core services and neither training nor intensive services (represented by the core group).
• To determine the effect of providing both training and intensive services funded by WIA, we compared the average outcomes of full-WIA customers with those of core customers. Conceptually, we compared a scenario where the Adult and Dislocated Worker programs provided the full set of current services (represented by the full-WIA group) to a scenario where the programs provided core services but neither training nor intensive services (represented by the core group).
Figure 4. Comparing outcomes between the study groups
This report presents findings based on comparisons of outcomes measured using two sources of follow-up data: (1) follow-up surveys conducted at about 15 and 30 months after each study participant was randomly assigned and (2) the National Directory of New Hires (NDNH), an administrative database containing information on earnings, employment, and unemployment insurance benefits covering 36 months after each study participant was randomly assigned. The survey data cover a greater range of jobs than the NDNH but are potentially subject to nonresponse and recall biases and are not available for the entire sample of study participants. (The survey sample included all core-and-intensive and core customers and a sample of full-WIA customers.) In contrast, NDNH data are available for the entire sample and are not subject to recall error. However, NDNH data exclude some types of jobs, such as self-employment, most agricultural labor, and “under-the-table” jobs. Data on the characteristics of customers were collected from forms completed by the customers just before random assignment and additional data on service receipt were obtained from program administrative records.
Each customer was followed for 30 months after they were first found eligible for intensive services, enrolled in the study, and randomly assigned. The follow-up period covers weeks when many customers were receiving core and intensive services and enrolled in training, particularly in the first 15 months of the follow-up period. Among full-WIA customers who enrolled in and completed training programs, a typical customer enrolled in training near the end of the third month after random assignment and completed training about five months later (Figure 5), but there was substantial variation in the timing of training enrollment and completion. The survey follow-up period spans nearly two years beyond the time when customers typically completed training, and the NDNH follow-up period spans nearly two and a half years beyond when the typical study participant completed training. Intensive services were typically accessed earlier, during the first half of the follow-up period.
xix

Figure 5. Timeline for a typical full-WIA customer who enrolled in training
Sources: WIA Gold Standard Evaluation 15- and 30-month follow-up surveys. Notes: Typical time of enrollment in training is the median month a study participant first enrolled in training among
full-WIA customers who enrolled in any training program during the follow-up period. Typical end of training was calculated as the median months of enrollment in training plus the median month of first enrolling in training among customers who completed a training program.
Importantly, our analysis reflects that not all customers in the Adult and Dislocated Worker programs received all WIA services under normal program operations and could access similar services elsewhere. For this reason, understanding the services received by the full-WIA, core-and-intensive, and core groups is important for interpreting the earnings impact estimates. The estimates of the effects of receiving the services are likely to be larger than our estimates of the effects of the availability of these services—either more positive or more negative depending on whether the estimated effect is positive or negative.
The study examined whether the benefits of intensive and training services provided through the Adult and Dislocated Worker programs were large enough to justify their costs. We combined the estimated impacts—of which earnings impacts are most prominent—with the costs of the services customers received to estimate the net benefits associated with providing intensive services, training, and the two sets of services together. The net benefit, expressed as a dollar value, conveys the extent to which the benefits of offering WIA-funded intensive and training services exceed the costs of doing so, thus providing an easily interpretable metric for decision makers. Importantly, the benefits and costs take into account the earnings and other benefits and costs for each group. For example, when we compare the full-WIA group to the core group, we calculate the net benefits accounting for the fact that some customers in the core group are also enrolling in training, receiving other services, and finding employment. Likewise, we account for the fact that some full-WIA customers do not enroll in training in the follow-up period.
Context
By design, the 28 randomly selected local areas reflected the variation in local areas nation-wide. Local areas in the study were spread across DOL’s six administrative regions (Figure 2). They varied considerably in their size, funding, and number of customers served, as well as the degree of urbanicity. For example, the smallest local area in the study covered slightly more than
xx
100 square miles and comprised only part of one county. In contrast, the largest local area in the study covered more than 75,000 square miles and included an entire state.
The study occurred at a time of high, but declining, unemployment. When the first person was randomly assigned in November 2011, the recession was officially over, but the national un-employment rate was still nearly 9 percent. The average unemployment rate was about 8 percent in 2012 (Bureau of Labor Statistics 2015), when most customers were randomly assigned.
At the same time, funding for the programs was declining, which led to fewer career counselors and less funding for training. In 2012, funding for the two programs was the lowest it had been in more than a decade. According to local area staff interviewed for the implementation study, these funding cuts led to the closing of some American Job Centers and a reduction in operating hours for others. Many local areas in the study ran out of training funds at some time during the follow-up period, so funds were not always readily available for training customers who were otherwise eligible for and interested in training.
Many customers faced multiple barriers to becoming employed. About 77 percent of customers had no more than a high school diploma or a General Educational Development certificate. About one-quarter of customers had not been employed in the five years before random assignment. More than a third of customers reported receiving assistance from the Supplemental Nutrition Assistance Program (SNAP) or Special Supplemental Nutrition Program for Women, Infants, and Children (WIC) at the time of random assignment, and 30 percent reported receiving unemployment compensation.
Receipt of services and enrollment in training
Understanding differences in receipt of services and enrollment in training—whether these services were funded by the Adult and Dislocated Worker Programs or by other sources―is important for understanding what services customers are likely to receive in the absence of WIA funds for training or intensive services. Although during the first 15 months of the study customers in the core-and-intensive group were unable to receive WIA-funded training and customers in the core group were unable to receive WIA-funded intensive services or training, all customers in the study could receive services from other sources in the community. In turn, understanding the differences in the receipt of services by study group helps clarify the interpretation of the impacts on employment outcomes.
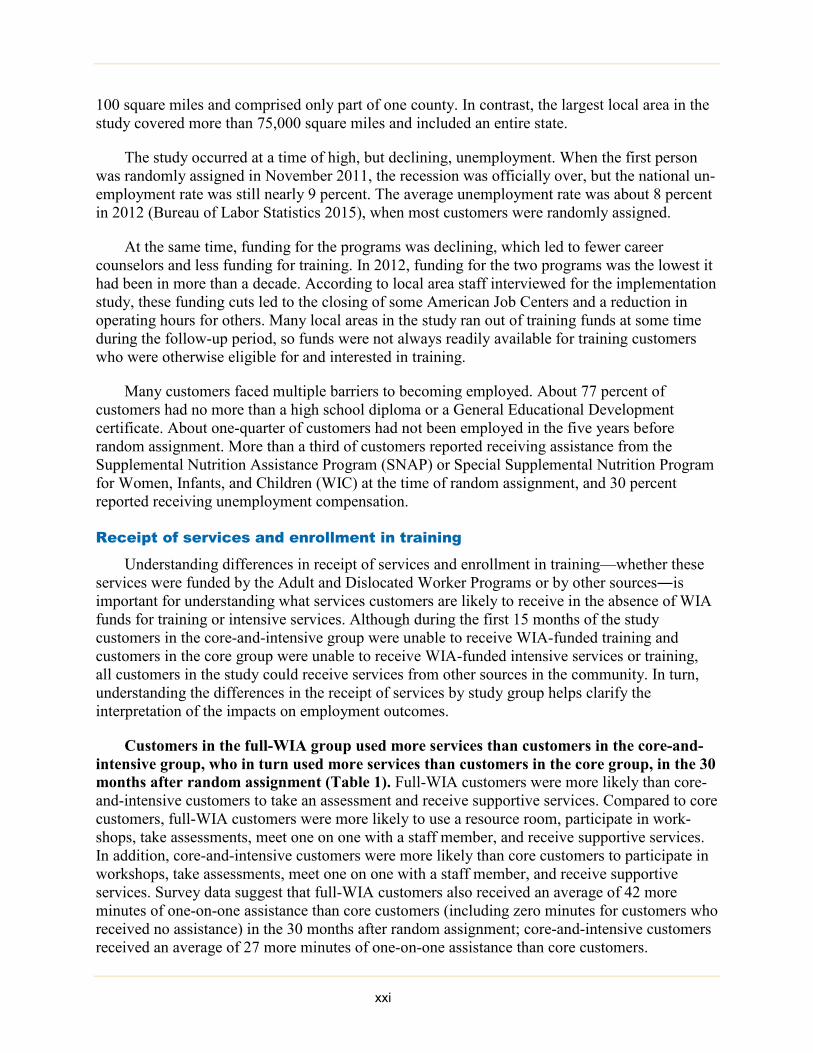
Customers in the full-WIA group used more services than customers in the core-and-intensive group, who in turn used more services than customers in the core group, in the 30 months after random assignment (Table 1). Full-WIA customers were more likely than core-and-intensive customers to take an assessment and receive supportive services. Compared to core customers, full-WIA customers were more likely to use a resource room, participate in work-shops, take assessments, meet one on one with a staff member, and receive supportive services. In addition, core-and-intensive customers were more likely than core customers to participate in workshops, take assessments, meet one on one with a staff member, and receive supportive services. Survey data suggest that full-WIA customers also received an average of 42 more minutes of one-on-one assistance than core customers (including zero minutes for customers who received no assistance) in the 30 months after random assignment; core-and-intensive customers received an average of 27 more minutes of one-on-one assistance than core customers. xxi
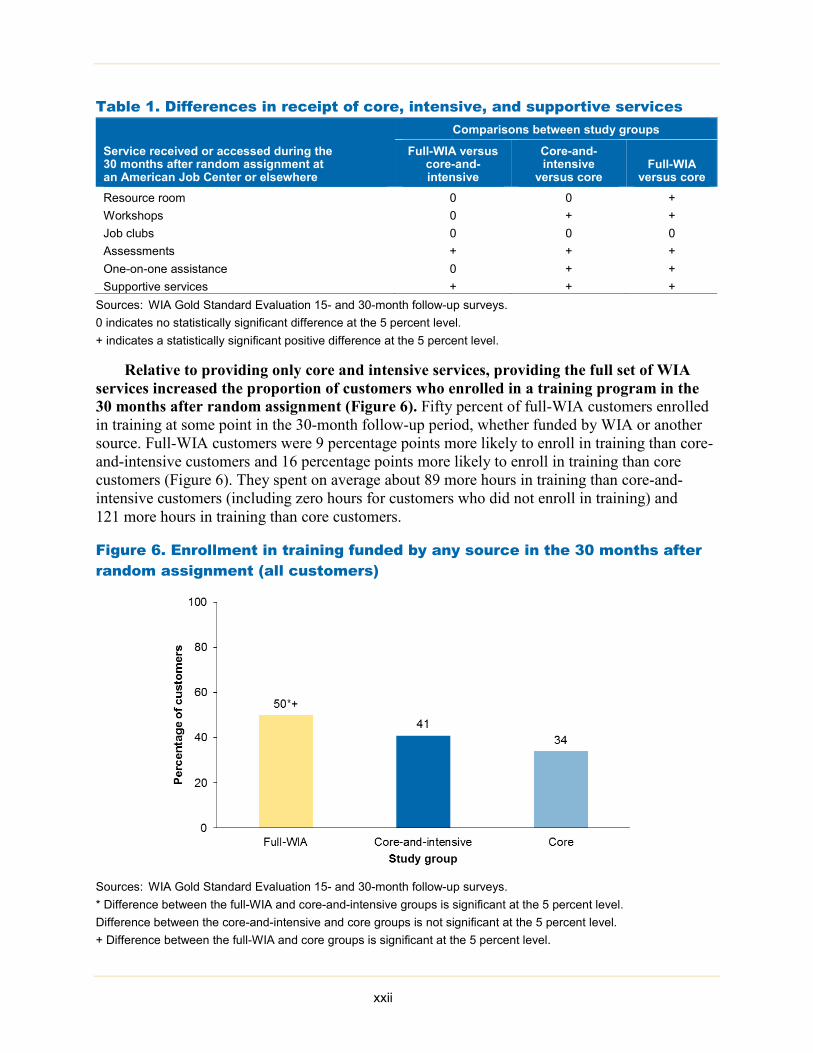
Table 1. Differences in receipt of core, intensive, and supportive services
Service received or accessed during the 30 months after random assignment at an American Job Center or elsewhere
Comparisons between study groups
Full-WIA versus core-and- intensive
Core-and-intensive
versus core Full-WIA
versus core Resource room 0 0 + Workshops 0 + + Job clubs 0 0 0 Assessments + + + One-on-one assistance 0 + + Supportive services + + +
Sources: WIA Gold Standard Evaluation 15- and 30-month follow-up surveys. 0 indicates no statistically significant difference at the 5 percent level. + indicates a statistically significant positive difference at the 5 percent level.
Relative to providing only core and intensive services, providing the full set of WIA services increased the proportion of customers who enrolled in a training program in the 30 months after random assignment (Figure 6). Fifty percent of full-WIA customers enrolled in training at some point in the 30-month follow-up period, whether funded by WIA or another source. Full-WIA customers were 9 percentage points more likely to enroll in training than core-and-intensive customers and 16 percentage points more likely to enroll in training than core customers (Figure 6). They spent on average about 89 more hours in training than core-and-intensive customers (including zero hours for customers who did not enroll in training) and 121 more hours in training than core customers.
Figure 6. Enrollment in training funded by any source in the 30 months after random assignment (all customers)
Sources: WIA Gold Standard Evaluation 15- and 30-month follow-up surveys. * Difference between the full-WIA and core-and-intensive groups is significant at the 5 percent level. Difference between the core-and-intensive and core groups is not significant at the 5 percent level. + Difference between the full-WIA and core groups is significant at the 5 percent level.
xxii

Only about one-third of full-WIA customers enrolled in WIA-funded training. Thirty-one percent of full-WIA customers received training funded by WIA during the first 15 months after random assignment. Some customers assigned to the full-WIA group might not have been eligible for training or did not complete all the activities required to be approved for WIA-funded training; others may have been eligible for training but chose not to enroll in training because of personal preferences or constraints. Finally, some full-WIA customers may have not participated in WIA-funded training because their local area exhausted all training funds. The full-WIA customers who enrolled in training not funded by the Adult or Dislocated Worker programs received funding from other sources or paid for training themselves.
Many customers in the core-and-intensive and core groups still enrolled in training even though they could not access Adult and Dislocated Worker funds for training. Forty-one percent of the core-and-intensive group and 34 percent of the core group enrolled in training, which they paid for themselves or by using sources of funding other than WIA (Figure 6).
Full-WIA customers were more likely to enroll in training than core-and-intensive customers in the first three quarters after random assignment. Rates of training enrollment were highest, and differences across study groups in these rates were largest, in the first quarter after random assignment and then generally declined over time (Figure 7). By the end of the follow-up period, the rates of training enrollment in all three study groups were similar.
Figure 7. Enrollment in training (all customers), by quarter
Sources: WIA Gold Standard Evaluation 15- and 30-month follow-up surveys. * Difference between the full-WIA and core-and-intensive groups is significant at the 5 percent level. No differences between the core-and-intensive and core groups are significant at the 5 percent level. + Difference between the full-WIA and core groups is significant at the 5 percent level. Q = quarter.
xxiii
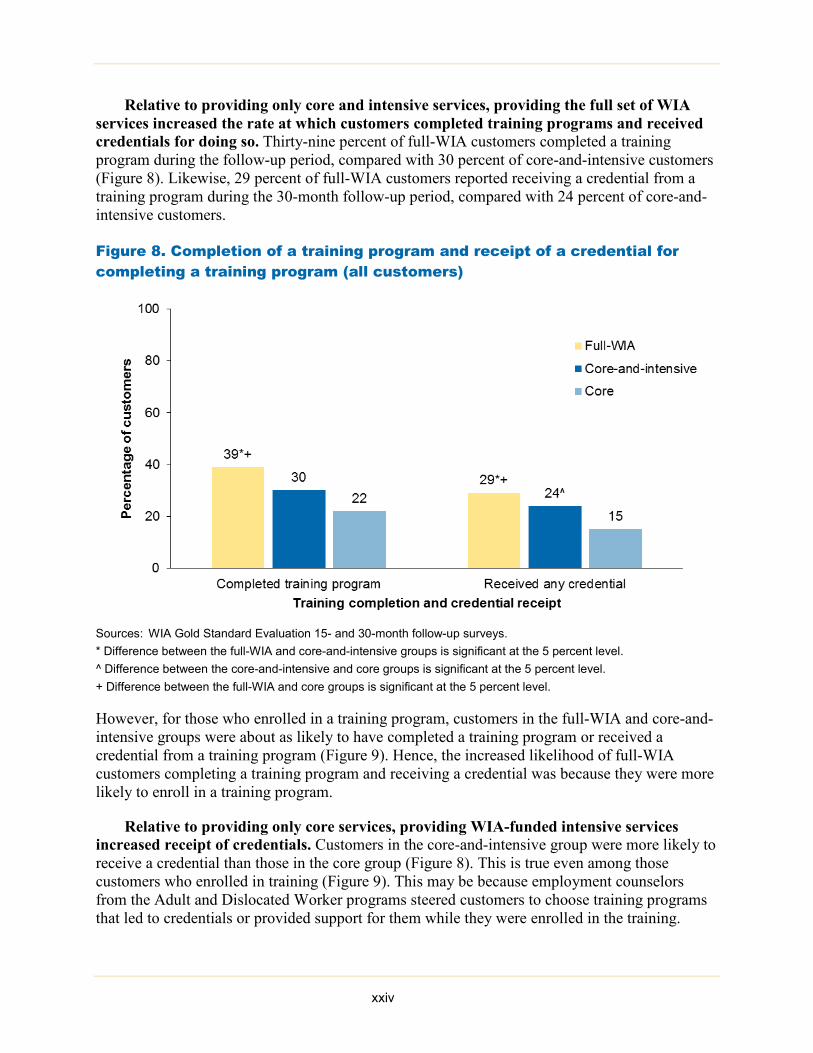
Relative to providing only core and intensive services, providing the full set of WIA services increased the rate at which customers completed training programs and received credentials for doing so. Thirty-nine percent of full-WIA customers completed a training program during the follow-up period, compared with 30 percent of core-and-intensive customers (Figure 8). Likewise, 29 percent of full-WIA customers reported receiving a credential from a training program during the 30-month follow-up period, compared with 24 percent of core-and-intensive customers.
Figure 8. Completion of a training program and receipt of a credential for completing a training program (all customers)
Sources: WIA Gold Standard Evaluation 15- and 30-month follow-up surveys. * Difference between the full-WIA and core-and-intensive groups is significant at the 5 percent level. ^ Difference between the core-and-intensive and core groups is significant at the 5 percent level. + Difference between the full-WIA and core groups is significant at the 5 percent level.
However, for those who enrolled in a training program, customers in the full-WIA and core-and-intensive groups were about as likely to have completed a training program or received a credential from a training program (Figure 9). Hence, the increased likelihood of full-WIA customers completing a training program and receiving a credential was because they were more likely to enroll in a training program.
Relative to providing only core services, providing WIA-funded intensive services increased receipt of credentials. Customers in the core-and-intensive group were more likely to receive a credential than those in the core group (Figure 8). This is true even among those customers who enrolled in training (Figure 9). This may be because employment counselors from the Adult and Dislocated Worker programs steered customers to choose training programs that led to credentials or provided support for them while they were enrolled in the training.
xxiv
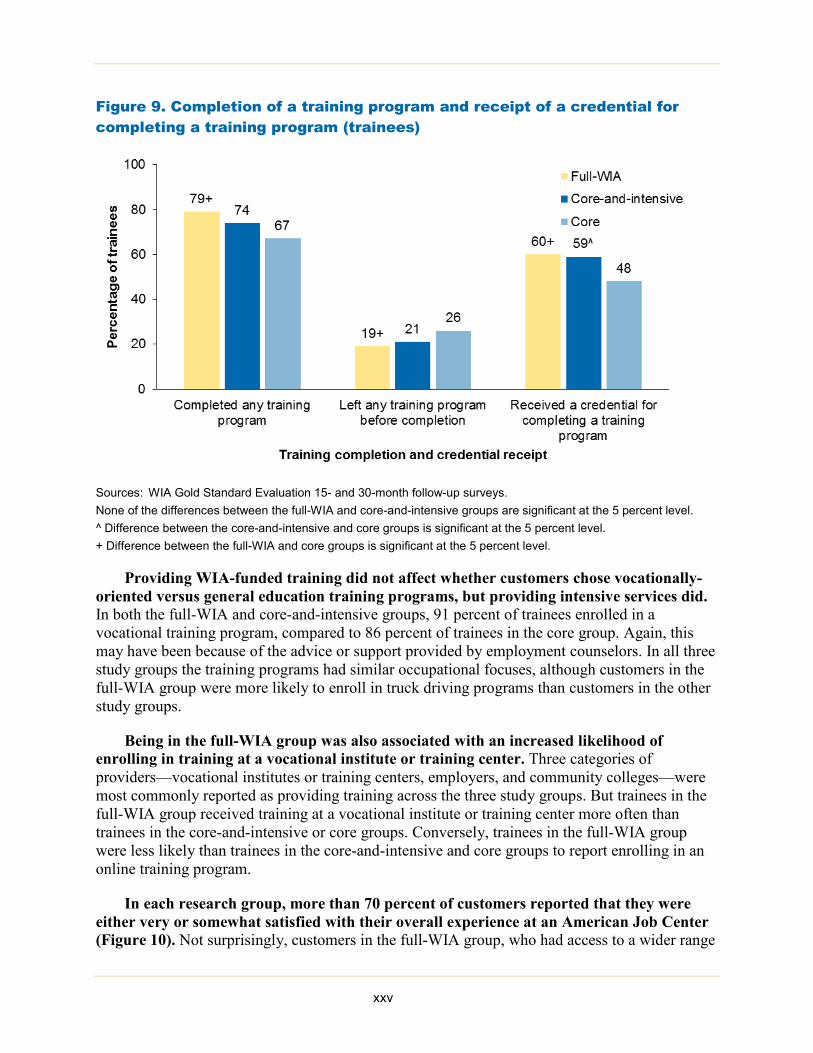
Figure 9. Completion of a training program and receipt of a credential for completing a training program (trainees)
Sources: WIA Gold Standard Evaluation 15- and 30-month follow-up surveys. None of the differences between the full-WIA and core-and-intensive groups are significant at the 5 percent level. ^ Difference between the core-and-intensive and core groups is significant at the 5 percent level. + Difference between the full-WIA and core groups is significant at the 5 percent level.
Providing WIA-funded training did not affect whether customers chose vocationally-oriented versus general education training programs, but providing intensive services did. In both the full-WIA and core-and-intensive groups, 91 percent of trainees enrolled in a vocational training program, compared to 86 percent of trainees in the core group. Again, this may have been because of the advice or support provided by employment counselors. In all three study groups the training programs had similar occupational focuses, although customers in the full-WIA group were more likely to enroll in truck driving programs than customers in the other study groups.
Being in the full-WIA group was also associated with an increased likelihood of enrolling in training at a vocational institute or training center. Three categories of providers—vocational institutes or training centers, employers, and community colleges—were most commonly reported as providing training across the three study groups. But trainees in the full-WIA group received training at a vocational institute or training center more often than trainees in the core-and-intensive or core groups. Conversely, trainees in the full-WIA group were less likely than trainees in the core-and-intensive and core groups to report enrolling in an online training program.
In each research group, more than 70 percent of customers reported that they were either very or somewhat satisfied with their overall experience at an American Job Center (Figure 10). Not surprisingly, customers in the full-WIA group, who had access to a wider range
xxv
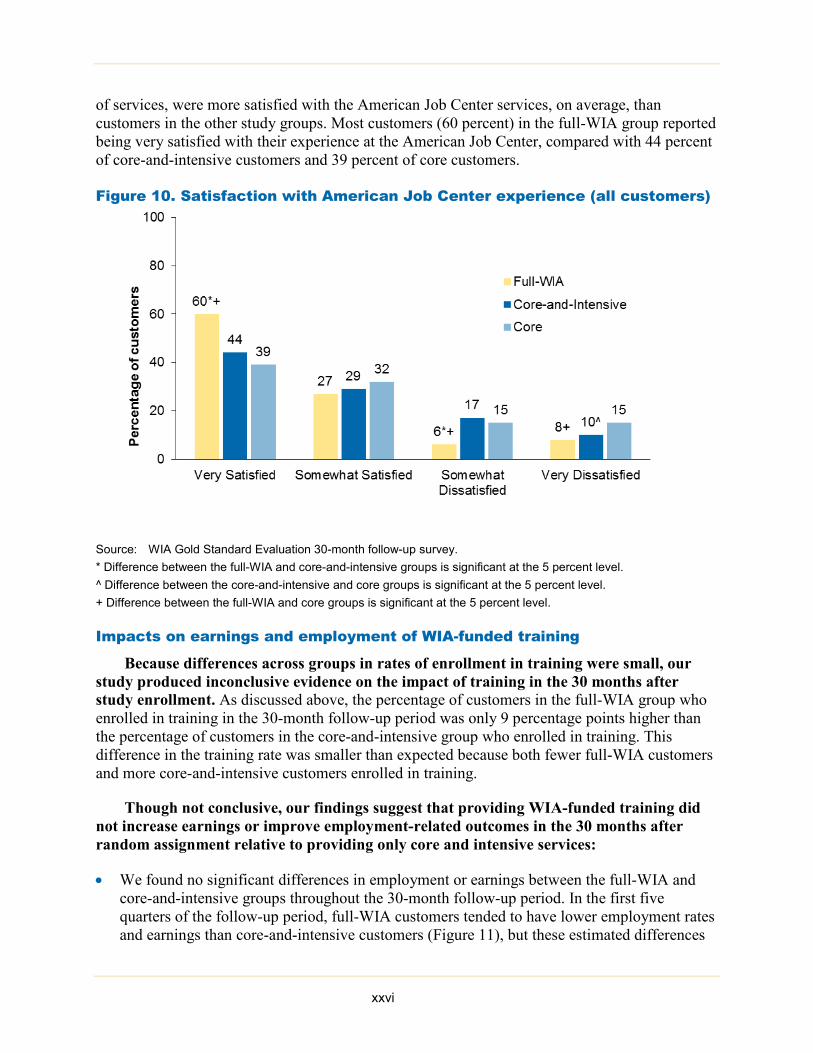
of services, were more satisfied with the American Job Center services, on average, than customers in the other study groups. Most customers (60 percent) in the full-WIA group reported being very satisfied with their experience at the American Job Center, compared with 44 percent of core-and-intensive customers and 39 percent of core customers.
Figure 10. Satisfaction with American Job Center experience (all customers)
Source: WIA Gold Standard Evaluation 30-month follow-up survey. * Difference between the full-WIA and core-and-intensive groups is significant at the 5 percent level. ^ Difference between the core-and-intensive and core groups is significant at the 5 percent level. + Difference between the full-WIA and core groups is significant at the 5 percent level.
Impacts on earnings and employment of WIA-funded training
Because differences across groups in rates of enrollment in training were small, our study produced inconclusive evidence on the impact of training in the 30 months after study enrollment. As discussed above, the percentage of customers in the full-WIA group who enrolled in training in the 30-month follow-up period was only 9 percentage points higher than the percentage of customers in the core-and-intensive group who enrolled in training. This difference in the training rate was smaller than expected because both fewer full-WIA customers and more core-and-intensive customers enrolled in training.
Though not conclusive, our findings suggest that providing WIA-funded training did not increase earnings or improve employment-related outcomes in the 30 months after random assignment relative to providing only core and intensive services:
• We found no significant differences in employment or earnings between the full-WIA and core-and-intensive groups throughout the 30-month follow-up period. In the first five quarters of the follow-up period, full-WIA customers tended to have lower employment rates and earnings than core-and-intensive customers (Figure 11), but these estimated differences
xxvi
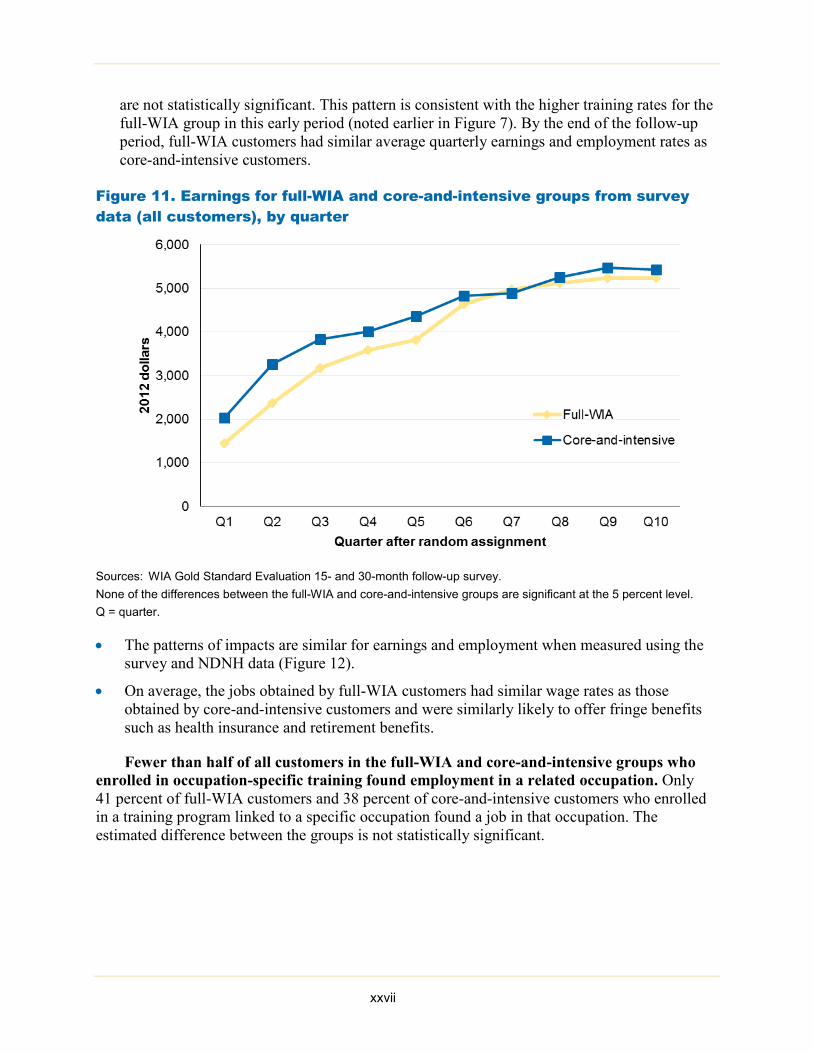
are not statistically significant. This pattern is consistent with the higher training rates for the full-WIA group in this early period (noted earlier in Figure 7). By the end of the follow-up period, full-WIA customers had similar average quarterly earnings and employment rates as core-and-intensive customers.
Figure 11. Earnings for full-WIA and core-and-intensive groups from survey data (all customers), by quarter
Sources: WIA Gold Standard Evaluation 15- and 30-month follow-up survey. None of the differences between the full-WIA and core-and-intensive groups are significant at the 5 percent level. Q = quarter.
• The patterns of impacts are similar for earnings and employment when measured using the survey and NDNH data (Figure 12).
• On average, the jobs obtained by full-WIA customers had similar wage rates as those obtained by core-and-intensive customers and were similarly likely to offer fringe benefits such as health insurance and retirement benefits.
Fewer than half of all customers in the full-WIA and core-and-intensive groups who enrolled in occupation-specific training found employment in a related occupation. Only 41 percent of full-WIA customers and 38 percent of core-and-intensive customers who enrolled in a training program linked to a specific occupation found a job in that occupation. The estimated difference between the groups is not statistically significant.
xxvii
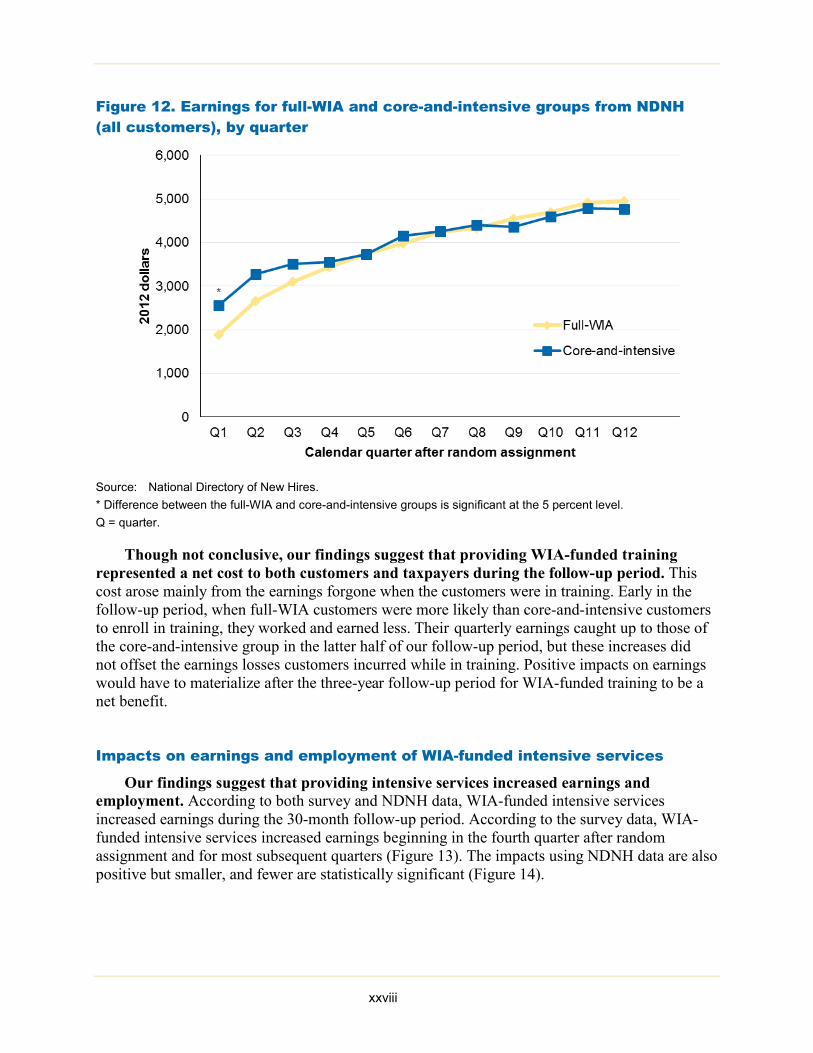
Figure 12. Earnings for full-WIA and core-and-intensive groups from NDNH (all customers), by quarter
Source: National Directory of New Hires. * Difference between the full-WIA and core-and-intensive groups is significant at the 5 percent level.Q = quarter.
Though not conclusive, our findings suggest that providing WIA-funded training represented a net cost to both customers and taxpayers during the follow-up period. This cost arose mainly from the earnings forgone when the customers were in training. Early in the follow-up period, when full-WIA customers were more likely than core-and-intensive customers to enroll in training, they worked and earned less. Their quarterly earnings caught up to those of the core-and-intensive group in the latter half of our follow-up period, but these increases did not offset the earnings losses customers incurred while in training. Positive impacts on earnings would have to materialize after the three-year follow-up period for WIA-funded training to be a net benefit.
Impacts on earnings and employment of WIA-funded intensive services
Our findings suggest that providing intensive services increased earnings and employment. According to both survey and NDNH data, WIA-funded intensive services increased earnings during the 30-month follow-up period. According to the survey data, WIA-funded intensive services increased earnings beginning in the fourth quarter after random assignment and for most subsequent quarters (Figure 13). The impacts using NDNH data are also positive but smaller, and fewer are statistically significant (Figure 14).
xxviii
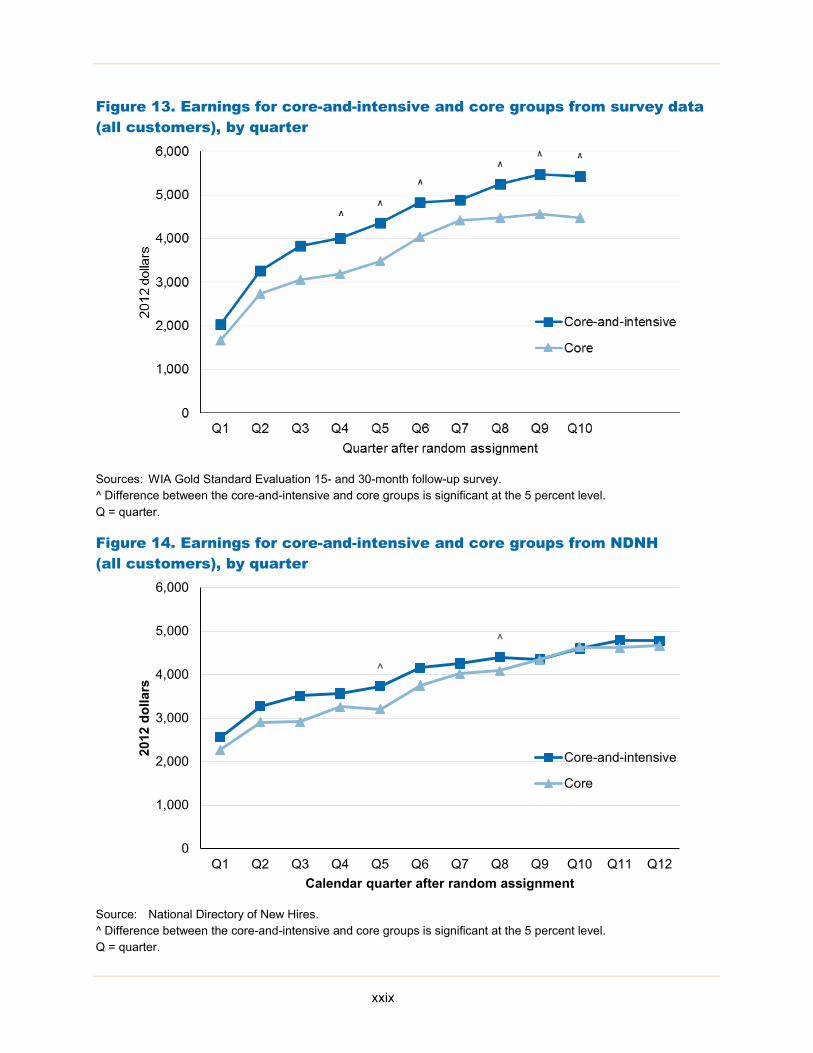
Figure 13. Earnings for core-and-intensive and core groups from survey data (all customers), by quarter
Sources: WIA Gold Standard Evaluation 15- and 30-month follow-up survey. ^ Difference between the core-and-intensive and core groups is significant at the 5 percent level. Q = quarter.
Figure 14. Earnings for core-and-intensive and core groups from NDNH (all customers), by quarter
Source: National Directory of New Hires. ^ Difference between the core-and-intensive and core groups is significant at the 5 percent level. Q = quarter.
^
^
0
1,000
2,000
3,000
4,000
5,000
6,000
Q1 Q2 Q3 Q4 Q5 Q6 Q7 Q8 Q9 Q10 Q11 Q12
2012
dol
lars
Calendar quarter after random assignment
Core-and-intensive
Core
xxix
• The survey data indicate that core-and-intensive customers earned about $7,100, or20 percent, more than core customers over the entire 30-month follow-up period (Figure 13).This impact is partly explained by core-and-intensive customers having higher employmentrates, and partly by them having higher wage rates.
• The impact on earnings estimated using the NDNH data is smaller—about $3,300, or7 percent, over 36 months—but still statistically significant (Figure 14).
• Core-and-intensive customers were more likely to have jobs that offered fringe benefits suchas health insurance and paid holidays than were core customers.
The results of the benefit-cost analysis indicate that providing intensive services is a good investment from the standpoint of both customers and taxpayers. This conclusion holds whether using survey or NDNH data, and is robust to other sensitivity tests. Customers and society benefit from intensive services because of the increased earnings that result from these services. Taxpayers benefit because the increased taxes paid on the increased earnings are larger than the cost of the services.
Impacts on earnings and employment of WIA-funded intensive services and training together
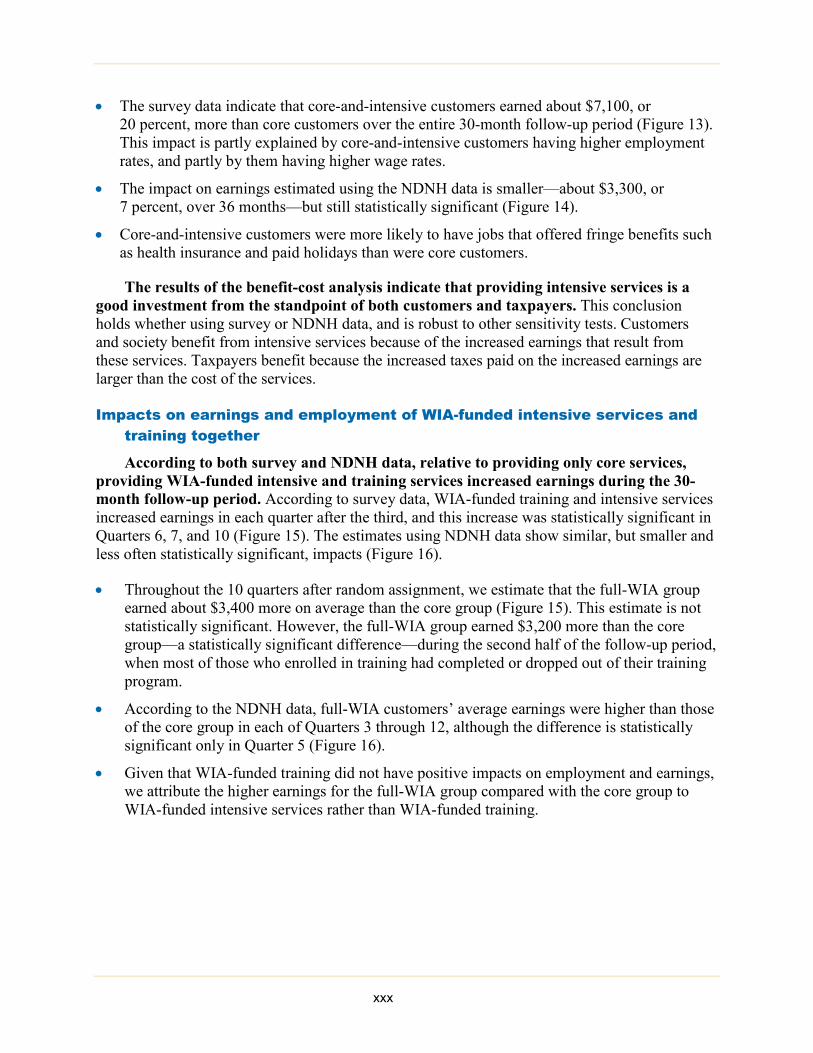
According to both survey and NDNH data, relative to providing only core services, providing WIA-funded intensive and training services increased earnings during the 30-month follow-up period. According to survey data, WIA-funded training and intensive services increased earnings in each quarter after the third, and this increase was statistically significant in Quarters 6, 7, and 10 (Figure 15). The estimates using NDNH data show similar, but smaller and less often statistically significant, impacts (Figure 16).
• Throughout the 10 quarters after random assignment, we estimate that the full-WIA groupearned about $3,400 more on average than the core group (Figure 15). This estimate is notstatistically significant. However, the full-WIA group earned $3,200 more than the coregroup—a statistically significant difference—during the second half of the follow-up period,when most of those who enrolled in training had completed or dropped out of their trainingprogram.
• According to the NDNH data, full-WIA customers’ average earnings were higher than thoseof the core group in each of Quarters 3 through 12, although the difference is statisticallysignificant only in Quarter 5 (Figure 16).
• Given that WIA-funded training did not have positive impacts on employment and earnings,we attribute the higher earnings for the full-WIA group compared with the core group toWIA-funded intensive services rather than WIA-funded training.
xxx
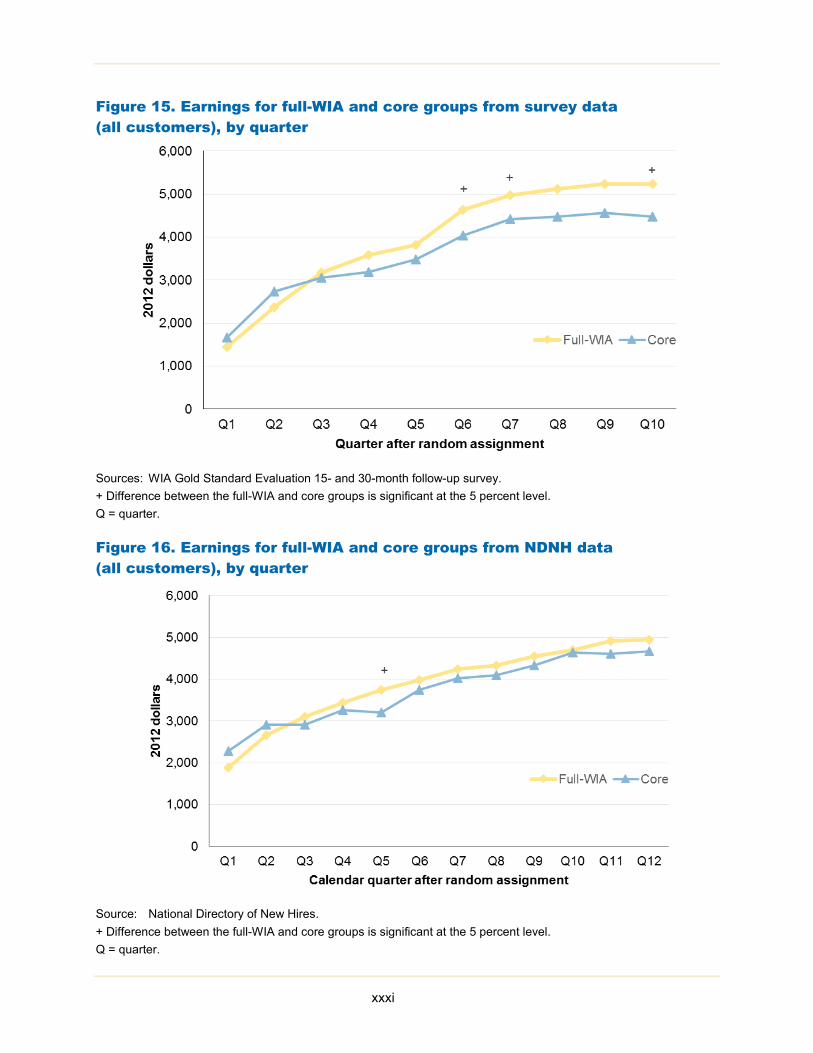
Figure 15. Earnings for full-WIA and core groups from survey data (all customers), by quarter
Sources: WIA Gold Standard Evaluation 15- and 30-month follow-up survey. + Difference between the full-WIA and core groups is significant at the 5 percent level. Q = quarter.
Figure 16. Earnings for full-WIA and core groups from NDNH data (all customers), by quarter
Source: National Directory of New Hires. + Difference between the full-WIA and core groups is significant at the 5 percent level. Q = quarter.
xxxi
As with intensive services alone, relative to providing only core services, the results of the benefit-cost analysis indicate that providing training and intensive services together is a good investment from the standpoint of customers and taxpayers.
Discussion
This study was designed to test the effectiveness of intensive services and training funded through the Adult and Dislocated Worker programs compared to all other services available to customers. Importantly, the Adult and Dislocated Worker programs’ provision of intensive services and training does not mean that all customers will receive all of those services. Additionally, in the absence of funding for intensive services and training through the Adult and Dislocated Worker programs, customers could access similar services elsewhere. Hence, understanding the services received by the full-WIA, core-and-intensive, and core groups is crucial for interpreting the earnings impact estimates and is thus an integral part of the study. Of particular importance are the findings that about half of the full-WIA group enrolled in training, and that many customers in the core-and-intensive and core groups, who were not eligible for WIA-funded training, still enrolled in training which they paid for themselves or from other sources.
WIA-funded intensive services were effective. Providing intensive services increased earnings over the follow-up period by $3,300 to $7,100 (7 to 20 percent) per customer depending on the data source. The positive impacts of intensive services on earnings stem from a combination of factors. Core-and-intensive customers were more likely to be employed in most quarters, worked more hours, and had higher average hourly wages than core customers—though not all of these estimated differences were statistically significant. In addition, the jobs held by core-and-intensive customers were more likely than the jobs held by core customers to offer fringe benefits. Core-and-intensive customers were also more likely than core customers to choose vocational training programs and obtain a credential for training, even though the training was not funded by WIA. This suggests that employment counselors may have affected customers’ choice of training program or provided support while they were in training.
These effects are consistent with the past literature on intensive services, and job-search assistance more broadly. In particular, in a nonexperimental study, Heinrich et al. (2013) found that intensive services funded by the Adult and Dislocated Worker programs increased employment and earnings. Moreover, studies have shown that job-search assistance can increase employment and earnings and decrease unemployment insurance receipt in the short run (Meyer 1995; O’Leary 2004; Katz 2014).
The benefit-cost analyses demonstrate that providing intensive services is cost-effective from the perspectives of customers, taxpayers, and society as a whole. This is true under a wide range of assumptions including if impacts decreased to zero after the end of the follow-up period. Because intensive services are relatively inexpensive, society as a whole benefits from these services by about $8,500 per customer according to the survey data, and by about $3,000 according to the NDNH data.
xxxii
Because differences across groups in rates of enrollment in training were small, our study produced inconclusive evidence on the impact of training in the 30 months after study enrollment. The difference in the training rates between the full-WIA and core-and-intensive groups was only 9 percentage points. This finding that so many core-and-intensive customers enrolled in training is important and suggests the value customers believe training has, but does limit what we can say about the effectiveness of training.
Though not conclusive, the evidence suggests that WIA-funded training does not have positive impacts in the 30 months after study enrollment. On average, training funded through the Adult and Dislocated Worker programs, above and beyond core and intensive services, did not improve customers’ employment outcomes within the 30-month follow-up period. In the final quarters of the study, the estimated impacts on earnings were negative but not statistically significant according to the survey data and positive but close to zero according to the NDNH data. The estimated impacts on earnings over the whole follow-up period were negative (but again not statistically significant) according to both data sources. We did not find training to be cost effective from the perspective of customers, taxpayers, or society as a whole.
Following the study participants for more than three years could possibly result in later posi-tive impacts on earnings that offset the forgone earnings and the cost of the training programs. However, the evidence suggests that it is not likely that the impacts will increase because the difference across groups in enrollment in training disappeared by the beginning of the second year after random assignment. Furthermore, a typical full-WIA customer completed training about eight months into the follow-up period, so most training participants were out of training well before the end of the follow-up period. Finally, most previous studies that found training had positive impacts on earnings for populations similar to those served by the Adult and Dislo-cated Worker programs found that this typically occurs within three years of enrollment (Card et al. 2015). This did not occur in our study according to the survey or NDNH data.
This study only examined the effectiveness of the types of training programs funded by the Adult and Dislocated Worker programs during the follow-up period and not all training. Our study suggests factors that might have diminished the effectiveness of the WIA-funded training that could help guide future improvements:
• The evidence suggests that training funded by the Adult and Dislocated Worker programs under WIA did not always closely align with the needs of local employers. Only half of customers who enrolled in training reported that they found employment because of their training, and only about two of every five full-WIA customers who enrolled in training for a specific occupation found a job in that same occupation. WIOA’s greater focus on sector initiatives, employer-recognized credentials, and work-based training could result in more effective training. Recent studies indicate that job training in targeted sectors developed in close collaboration with employers was effective (Hendra et al. 2016; Maguire et al. 2010).
• About one in five full-WIA customers who enrolled in a training left a program before completing it. Training programs are not likely to be effective for customers who do not complete them. Customers did not complete programs for a range of reasons including finding jobs, becoming ill or pregnant, and facing financial or logistical issues. Some customers might be more likely to complete training if they received more supportive
xxxiii
services. Only about 20 percent of full-WIA customers received any supportive services from the Adult or Dislocated Worker programs, and the amounts they received were relatively low.
• Training dollars were limited during the follow-up period. In 2012, funding for the two programs was the lowest it had been in more than a decade. Funding cuts also led to fewer career counselors, less funding for training, and reductions in supportive services (D’Amico et al. 2015). Thus, funds might not have been readily available for training customers who were otherwise eligible for and interested in training. Those who received training funds might not have been able to afford their preferred programs or receive the requisite program counseling to fully support their training choices and experiences.
The study findings suggest that policymakers should continue to invest in staff assis-tance, but look for effective training approaches. Our study found that staff assistance and other intensive services are effective. However, intensive services alone are unlikely to help all customers achieve satisfactory longer-term employment outcomes and economic self-sufficiency. At the end of our follow-up period, 20 percent of core-and-intensive customers were not em-ployed, their annual household incomes were only about $30,000, and many still relied on public assistance. Thus, employment services that improve job skills are still needed in addition to staff assistance to help customers obtain self-sufficiency. The changes made to the Adult and Dislo-cated Worker programs under WIOA, particularly loosening previous restrictions on employer-based training, may improve the effectiveness of training provided by the Adult and Dislocated Worker programs. Policymakers should continue to fund, and evaluate, innovative approaches to training to identify effective approaches and meet the needs of America’s job seekers and employers.
xxxiv
I. INTRODUCTION
With a growing need for a more skilled workforce, providing effective and efficient employment and training services is an important national priority. First authorized under the Workforce Investment Act of 1998 (WIA) and then reauthorized in 2014 under the Workforce Innovation and Opportunity Act (WIOA), the Adult and Dislocated Worker programs are two of the nation’s largest publicly funded programs providing employment and training services. In program year 2015—July 1, 2015, through June 30, 2016—the Adult and Dislocated Worker programs together received about $2 billion in funding and served about 6.6 million customers.
Despite their importance, the Adult and Dislocated Worker programs have not been evaluated using the most rigorous methods. In 2008, the Employment and Training Administration (ETA) within the U.S. Department of Labor (DOL) launched a national experimental evaluation of the two programs, the WIA Adult and Dislocated Worker Programs Gold Standard Evaluation (WIA Gold Standard Evaluation). The evaluation’s goals are to provide national estimates of the impact and cost-effectiveness of the Adult and Dislocated Worker programs and to provide a detailed description of their implementation.
This report presents the study’s findings on the effectiveness of the Adult and Dislocated Worker programs’ intensive services—primarily staff assistance—and training, both separately and together. The effectiveness of these services are measured relative to “core services” available to everyone at American Job Centers and other services in the community. It presents estimated impacts of the services based on customers’ experiences during the 30 months after they enrolled in the study. The report builds upon an earlier report (McConnell et al. 2016) that discussed the estimated impacts measured 15 months after customers were found eligible for intensive services.
In the rest of this chapter, we present an overview of the Adult and Dislocated Worker programs (Section A); discuss how the programs have changed under WIOA (Section B); present an overview of the WIA Gold Standard Evaluation (Section C); and summarize the findings from the implementation study (Section D), the 15-month impact study (Section E), and prior studies of the programs (Section F). We conclude the chapter by presenting a road map to the subsequent chapters of this report (Section G).
A. The Adult and Dislocated Worker programs
Although a wide variety of workforce investment programs were implemented during the Great Depression, the U.S. federal government began to provide these services via large-scale programs only in the 1960s. In 1962, Congress enacted the Manpower Development and Training Act, which provided training to 1.9 million workers (Mangum 1968). In 1964 and 1965, these services were further augmented by several Great Society programs, which provided workforce development services for disadvantage populations and at-risk youth. The Comprehensive Employment and Training Act began to consolidate these different programs in 1973 and was followed by The Job Training Partnership Act (JTPA) in 1982.
JTPA provided workforce development services through separate funding streams for disadvantaged workers, youth, and dislocated workers, which were distributed by formula to
1
states (Barnow and Smith 2016). Local areas administered JTPA services and states played a large role in overseeing the performance of local areas. In addition, JTPA focused strongly on serving economically disadvantaged workers and hard-to-serve populations, and it encouraged an increased role for the private sector in the workforce system. Continuing a trend within the workforce system, many different programs operated independently to provide workforce services throughout the JTPA period. In 1994, the public workforce system included 14 govern-ment agencies administering 150 programs (U.S. Government Accountability Office 1994).
WIA took effect in 1998 (U.S. Congress 1998) in response to concern that the public workforce system was excessively fragmented and lacked effective coordination and collaboration. This fragmentation resulted in redundancies, inefficiencies, and a confusing maze of programs that customers found difficult to navigate (U.S. Government Accountability Office 1994). Congress enacted WIA with the goals of reducing this fragmentation and making the public workforce system more customer-focused and demand-driven, ultimately helping job seekers to find and prepare for high quality jobs and employers to recruit productive workers. Six underlying principles that apply to the Adult and Dislocated Worker programs (U.S. Department of Labor 2000) formed the basis of WIA:
1. Streamlining service delivery through program integration. WIA mandated the establishment of a coordinated service delivery system composed of American Job Centers (originally called One-Stop Career Centers). It designated more than a dozen separately funded programs as mandatory partners in this system. Partners included the Adult, Dislocated Worker, and Youth programs; Unemployment Insurance (UI); Wagner-Peyser Employment Service (providing job search assistance, job referrals, and placement assistance to jobseekers; reemployment services to UI recipients; and assistance in identifying candidates for job openings to employers); Job Corps (providing residential education and vocational training to at-risk youth); Veterans Employment and Training Services (providing employment services to veterans with significant barriers to employment and reaching out to employers on behalf of veterans); Trade Adjustment Assistance (TAA, providing training and re-employment services to workers negatively impacted by international trade); Vocational Rehabilitation (for individuals with disabilities); adult education and literacy activities authorized by Title II of WIA; postsecondary vocational education programs authorized under the Carl D. Perkins Career and Technical Education Act; and others. WIA section 121(b)(1)(B) provides a list of all mandatory partners.
2. Providing universal access to basic services. WIA gave everyone access to basic or core services offered at American Job Centers. These core services included resources that customers might use with minimal or no staff assistance to find and apply for jobs and plan careers.
3. Empowering individuals through a customer-focused approach to services. WIA encouraged customers to take charge of their own career planning by first accessing self-directed core services. Further, customers approved for training could access services using individual training accounts (ITAs), which operate like vouchers that customers use to choose training programs from approved providers.
2
4. Promoting state and local flexibility. Operating on the premise that states and localities know best what service designs and delivery strategies are optimal for their communities, WIA further devolved decision-making authority away from the federal level. State governors designated Local Workforce Investment Areas (local areas) and oversaw the work of these areas’ Local Workforce Investment Boards (LWIBs). Each LWIB was responsible for designing its local area’s service system, within the framework established by WIA. For example, it had the discretion to determine the emphasis on various services (such as training versus core services), the contracted service providers, the location of American Job Centers, and the customers targeted for services. Each of ETA’s six regional offices oversaw the implementation of the WIA programs in a specific set of states.
5. Promoting system accountability. While devolving authority downward, WIA enhanced the focus on accountability and continuous improvement by mandating that local areas meet minimum standards on performance measures relating to customers’ success in obtaining and retaining employment. It also required training providers to meet performance criteria to be eligible to serve ITA holders.
6. Engaging businesses as important customers. WIA emphasized the importance of meeting the needs of businesses and job seekers. Accordingly, the legislation required businesses to have majority representation on each state workforce board and each LWIB. Further, the act required American Job Centers to offer services to businesses and to provide job seekers with funding to train only for skills deemed to be in high demand by local businesses.
Depending on their needs and eligibility, customers of the Adult and Dislocated Worker programs could receive services through three tiers: (1) core services, which either were self-directed (accessed from resource rooms located at the American Job Centers or via the Internet) or required a modest amount of staff assistance; (2) intensive services, which generally required more staff assistance than core services; and (3) training. Adult and Dislocated Worker program funding for training is viewed as “funding of last resort” and can cover only training costs not funded from other sources. Customers are not offered funding for training if, for example, it could be covered by a private scholarship or a federal Pell grant. WIA provided for a tiered system of services: intensive services were provided to customers unable to obtain employment through core services alone and training services to customers who were not able to obtain employment after receiving intensive services.
The act required that all recipients of WIA-funded intensive services or training be legally able to work in the United States and that men be registered with the Selective Service System, if appropriate. Otherwise, it allowed each local area to develop its own eligibility criteria for these services, within the parameters noted below. The Adult and Dislocated Worker programs offer almost identical services, but each program has its own eligibility rules.
• Adult program services are available to customers ages 18 and older. In certain instances, such as when local areas determined funds were limited, recipients of public assistance and other low-income customers (as defined by WIA Section 101(25)) have priority for accessing intensive and training services.
3
• Dislocated Worker program services are available to customers who (1) were terminated or laid off from a job, show attachment to the workforce, and are unlikely to return to their previous occupation or industry; (2) were terminated or laid off as a result of a plant closure or substantial plant downsizing; (3) were self-employed and experiencing unemployment as a result of general economic conditions; or (4) are displaced homemakers, individuals who had provided unpaid services to family members in the home while depending on income of another family member but are no longer supported by that income.
B. Changes to the programs under WIOA
WIOA represented the first significant reform of the public workforce system since WIA’s enactment in 1998 (U.S. Congress 2014). It has undergone a phased implementation, with major programmatic changes effective on July 1, 2015, and performance accountability changes effective on July 1, 2016.
Much of what we learn from studying the Adult and Dislocated Worker programs under WIA will likely apply to these programs as they are implemented under WIOA. WIOA left in place most of WIA’s key principles, retained the American Job Centers, and reauthorized the Adult and Dislocated Worker programs. The two programs include the same basic set of services offered under WIA and retain similar eligibility rules. Customers continue to choose their training programs under some restrictions and with guidance from program staff. Moreover, some of the important changes introduced by WIOA add flexibility for local areas to continue in directions they were already heading:1
• Merging core and intensive services into one tier. WIOA combines core and intensive services into a single career services tier. Local areas can continue to offer the core and in-tensive services they offered under WIA as career services. The implementation study con-ducted alongside this impact evaluation concluded that the distinction between core and in-tensive services was not always clear cut even under WIA (D’Amico et al. 2015). For exam-ple, assistance with developing a résumé from a staff member in the resource room was con-sidered a core service; yet, the same assistance given outside the resource room from an em-ployment counselor in the same American Job Center was considered an intensive service.
• Eliminating the expectation that customers would typically access service tiers sequentially. WIOA allows customers to receive training before intensive services; in addition, by merging core and intensive services, it allows customers to receive what had been an intensive service without receiving a core service. Under WIA, many local areas already moved customers through core and intensive services quickly. For example, some local areas counted the interactions with the center greeter as the core service required for intensive service eligibility and the determination of training eligibility as the intensive service receipt required for training eligibility.
• Promoting improved workforce system partnerships. WIOA requires that states and workforce system partners in each local area develop unified strategic plans and report on common measures of performance. It adds Temporary Assistance for Needy Families (TANF) as a mandatory American Job Center partner unless a state opts not to require it. It
1 See the study’s implementation study report (D’Amico et al. 2015) for more information.
4
also requires the collocation of WIOA programs and the Wagner-Peyser Employment Service, which already occurred in most local areas.
• Emphasizing credentials. WIOA emphasizes the importance of customers obtaining industry-recognized credentials. However, even under WIA, some local areas either made training approval contingent on the possibility of attaining a credential or provided a higher ITA amount for programs that led to credentials.
Other changes made by WIOA include:
• Aligning workforce and economic development goals. WIOA requires local areas within an economic region to coordinate with one another and emphasizes sector-based strategies to promote employment in high-demand industries and occupations.
• Promoting work-based training. WIOA relaxes restrictions on the use of training for employed workers and increases the maximum allowable reimbursements to employers for on-the-job and customized training. It also authorizes transitional job placements.
• Increasing the flexibility to transfer funds between the Adult and Dislocated Worker programs. Under WIA, local areas’ ability to transfer funds between the two programs varied based on state-obtained waivers. WIOA allows the transfer of 100 percent of funds between the two programs without a waiver.
• Enhancing the performance accountability system. WIOA adds new performance measures to promote accountability within the public workforce system. In addition to the employment-related measures under WIA, WIOA requires local areas to measure their effectiveness in serving employers and customers’ credential attainment and skills gain.
C. Overview of the WIA Gold Standard Evaluation
The evaluation’s objectives are to estimate the impacts and cost-effectiveness of intensive and training services relative to lower-tiered services provided through the Adult and Dislocated Worker programs and to examine how the programs were implemented nationwide. The evaluation was not designed to estimate the impact of core services even though these were important services used by millions of customers. Evaluating core services experimentally would have required denying some customers any service from an American Job Center, which was not acceptable to the local areas. Furthermore, the evaluation focuses on the services offered by the Adult and Dislocated Worker programs using the formula funds or program funds provided directly to local areas and not held in reserve at the national or state levels. Hence, it does not include specific federal grants, such as the National Emergency Grants, or state funds used for rapid-response activities; those activities aim to meet the needs of workers resulting from specific plant or company closings.
The evaluation addresses three main sets of research questions:
1. Did providing services in the Adult and Dislocated Worker programs improve employment-related outcomes (such as employment, earnings, and use of public assistance)?
- Did providing core and intensive services improve employment-related outcomes more than providing core services only?
5
- Did providing the full set of WIA services, including core, intensive, and training services, improve employment-related outcomes more than providing core and intensive services only?
- Did providing the full set of WIA services improve employment-related outcomes more than providing core services only?
2. Did the benefits from intensive and training services exceed their costs?
3. How were the Adult and Dislocated Worker programs implemented?
To answer these research questions, the study design included three mutually reinforcing components: (1) an impact study that focuses on the first set of research questions, (2) a benefit-cost study that focuses on the second question, and (3) an implementation study that focused on the third question.
This report presents the findings from the impact and benefit-cost studies, using data collected about 30 months after customers enrolled in the study. A previous report presented findings from the impact study based on data collected 15 months after random assignment of customers (McConnell et al. 2016). D’Amico et al. (2015) and a series of 11 issue briefs discuss the implementation of the programs. Rosenberg et al. (2015) presents findings from a study of workforce services provided to veterans. Mathematica’s project webpage, https://www.mathematica-mpr.com/our-publications-and-findings/projects/wia-gold-standard-evaluation and the DOL ETA publication database, https://wdr.doleta.gov/research/keyword.cfm?fuseaction=dsp_pub_list each list the currently published issue briefs and reports from this study.
The study team designed the evaluation to produce nationally representative and experimental estimates of the impacts of the Adult and Dislocated Worker programs. The study occurred in 28 randomly selected local areas that were representative of all but the smallest programs operating in the contiguous 48 states and the District of Columbia. With some exceptions, such as TAA program participants and veterans,2 all customers found eligible for intensive services were randomly assigned into one of three study groups: (1) the full-WIA group, which could receive all services—core, intensive, and training—that the group members would be eligible for in the absence of the study; (2) the core-and-intensive group, which could receive core and intensive services but not training; and (3) the core group, which could receive only core services (Figure I.1). Importantly, the study estimates impacts for providing these services, reflecting the fact that most customers do not receive every service because they chose not to receive them or they may not be eligible for them according to criteria that varied by local area. The study enrolled customers from November 2011 through April 2013, with most customers enrolled in 2012. The 15- and 30-month surveys were timed such that each respondent was interviewed about 15 and 30 months after their individual study enrollment dates.
2 Chapter II describes the exceptions in detail. 6

Figure I.1. The three groups to which customers in the study were assigned
The study uses data about participants collected from self-administered forms completed at the time they enrolled in the study, the National Directory of New Hires (NDNH), the Workforce Investment Act Standardized Record Data (WIASRD), and two follow-up surveys conducted at about 15 and 30 months after random assignment. We use these data to compare the service receipt, training enrollment, and labor market and other outcomes of the customers in the study over a 30-month period. These data also enable us to calculate and compare the benefits and costs of making WIA-funded services available to customers. Chapter II provides more information about the design of the impact study.
D. What we learned from the implementation study
Through the WIA Gold Standard Evaluation’s implementation study (D’Amico et al. 2015), we found that most local areas offered the same basic set of services—a resource room, workshops, assessments, career and service planning, and training—but local areas varied in the exact services they provided and to whom they offered the services. The resource room typically provided information about available community services, job matching systems, labor market information, and job search and career exploration tools. Individualized assistance by a career counselor was the key feature of intensive services and included career and service receipt planning and case management. Customers generally received occupational training through an ITA, but some could receive entrepreneurial training, on-the-job training (training provided by an employer while the customer is employed and the customer’s wage is subsidized by the local area), or customized training developed for a particular employer and provided to current or prospective employees. Figure I.2 provides a list of the services that the local areas in the study provided. Because we selected local areas for the study to be nationally representative, it represents the services that were offered in local areas across the United States as well.
7
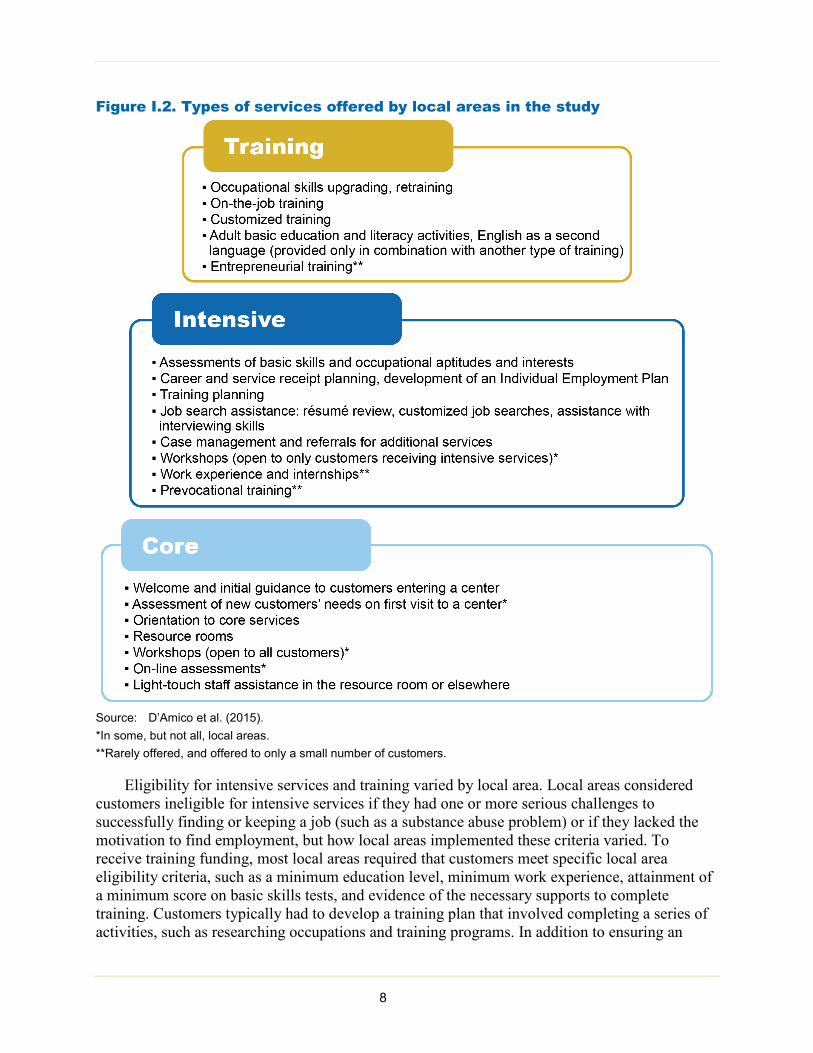
Figure I.2. Types of services offered by local areas in the study
Source: D’Amico et al. (2015). *In some, but not all, local areas. **Rarely offered, and offered to only a small number of customers.
Eligibility for intensive services and training varied by local area. Local areas considered customers ineligible for intensive services if they had one or more serious challenges to successfully finding or keeping a job (such as a substance abuse problem) or if they lacked the motivation to find employment, but how local areas implemented these criteria varied. To receive training funding, most local areas required that customers meet specific local area eligibility criteria, such as a minimum education level, minimum work experience, attainment of a minimum score on basic skills tests, and evidence of the necessary supports to complete training. Customers typically had to develop a training plan that involved completing a series of activities, such as researching occupations and training programs. In addition to ensuring an
8
informed choice, some local areas used these activities to test customers’ motivation and hence their likelihood of completing the training program and becoming employed.
Local areas could also offer supportive and follow-up services to Adult and Dislocated Worker program customers. Supportive services refers to assistance to help customers succeed in their job search and training activities and to address barriers to employment. Examples of supportive services include bus passes or help paying for gas, tools, uniforms, and child care. The Adult and Dislocated Worker programs fund some of these services; more frequently, program staff refer customers to other programs for these services. Follow-up services typically involve phone calls to customers to provide support to the customers and document their labor market experiences after they had left the program (to gather data for performance measures).
Study local areas implemented one of three general approaches to serving customers new to the American Job Centers. Eighteen study local areas offered a customer-initiated approach, in which staff directed these new customers first to use the resource room, typically after receiving an orientation to center services. These customers could receive additional staff assistance if they were unsuccessful in searching independently for a job. However, to address a concern that some new customers might not have the skills to conduct an effective job search independently, staff in eight study local areas conducted an enhanced intake on all new customers when they first visited the center. This enhanced intake involved an initial assessment of the customers’ needs. Staff then directed customers deemed capable of finding a job without more staff assistance to use the resource room; they provided other customers with more intensive staff assistance (either a staff-assisted core service or an intensive service). In the remaining two study local areas, the Adult and Dislocated Worker programs almost exclusively served customers interested in training; greeters directed new customers interested in job search to resource rooms overseen by Wagner-Peyser Employment Service staff, and new customers interested in training met with a WIA career counselor to determine their eligibility for training.
E. What we learned from the 15-month impact study
The evaluation’s earlier 15-month impact report (McConnell et al. 2016) provided an initial assessment of the impacts of providing services funded by the Adult and Dislocated Worker programs. Key findings include:
• There were meaningful differences across study groups in the receipt of core, intensive, and supportive services. In the 15 months following random assignment, customers in the full-WIA group received more services than core-and-intensive group customers, who in turn received more services than core group customers.
• Training funded by the Adult and Dislocated Worker programs increased the likelihood that customers would enroll in any training program (funded by WIA or another source).
• Many customers were still enrolled in training in the fifth quarter after random assignment. This suggests that the 15-month time horizon discussed in the earlier report was too short to judge the effectiveness of WIA-funded training, in isolation or combined with WIA-funded intensive services.
9
• Intensive services, when offered without training, increased customers’ earnings. However, there was little evidence of the efficacy of WIA-funded training, when available with or without WIA-funded intensive services, after 15 months.
F. Evidence from prior studies
Although the WIA Gold Standard Evaluation is the only experimental study of the Adult and Dislocated Worker programs, well-implemented non-experimental studies have been conducted (Hollenbeck et al. 2005; Heinrich et al. 2008, 2013; Hollenbeck and Huang 2008; Hollenbeck 2009; Andersson et al. 2013; Heinrich and Mueser 2014; Hollenbeck and Huang 2014; Bendewald et al. 2016). Heinrich et al. (2008, 2013) and Andersson et al. (2013) addressed the research questions most comparable to those addressed by the WIA Gold Standard Evaluation. The other non-experimental studies generally estimated the impact of the receipt of services from any of the eight or nine programs funded by WIA compared with receiving no services from any WIA program, rather than the impact of only the Adult and Dislocated Worker programs compared to lower-tiered services.
Although the Heinrich et al. (2008) study did not select a sample to be representative of the programs nationally, it did include customers from 12 states that vary in region of the country and economic conditions: Connecticut, Indiana, Kentucky, Maryland, Missouri, Minnesota, Mississippi, Montana, New Mexico, Tennessee, Utah, and Wisconsin. It examined the impact of the programs on customers who began receiving services from July 2003 to June 2005, which was about eight years before customers in this study began receiving services. Andersson et al. (2013) conducted a similar analysis with 1999–2005 data from two unnamed states.
Both studies found the effects of receiving training were mixed (Table I.1). Enrollment in WIA-funded training generally led to negative impacts on earnings in the first quarter after receiving the first program services. This would be expected if enrollment in training limited the time available for paid work. Training resulted in increases in earnings in later quarters for those served under the Adult program. Training did not boost earnings for dislocated workers in the four years of follow-up in the Heinrich et al. (2008) study, but did slightly after about two-and-a-half years in one of the states examined in Andersson et al. (2013). These mixed effects are consistent with the null effects reported in the WIA Gold Standard Evaluation 15-month impact report, given that the WIA Gold Standard Evaluation uses a broader, nationally representative sample that includes both adults and dislocated workers.
Heinrich et al. (2008) also estimated the impact of receiving core and intensive services. The authors compared the outcomes of customers who received these WIA-funded services with those of customers who did not receive these WIA-funded services but received either UI or services from the Wagner-Peyser Employment Service, depending on the state. Heinrich et al. (2008) studied only those core services for which there were administrative data on their receipt. As local areas are required to report only the receipt of core services that involve staff assistance, core services that customers accessed with little to no staff assistance were not studied.
10
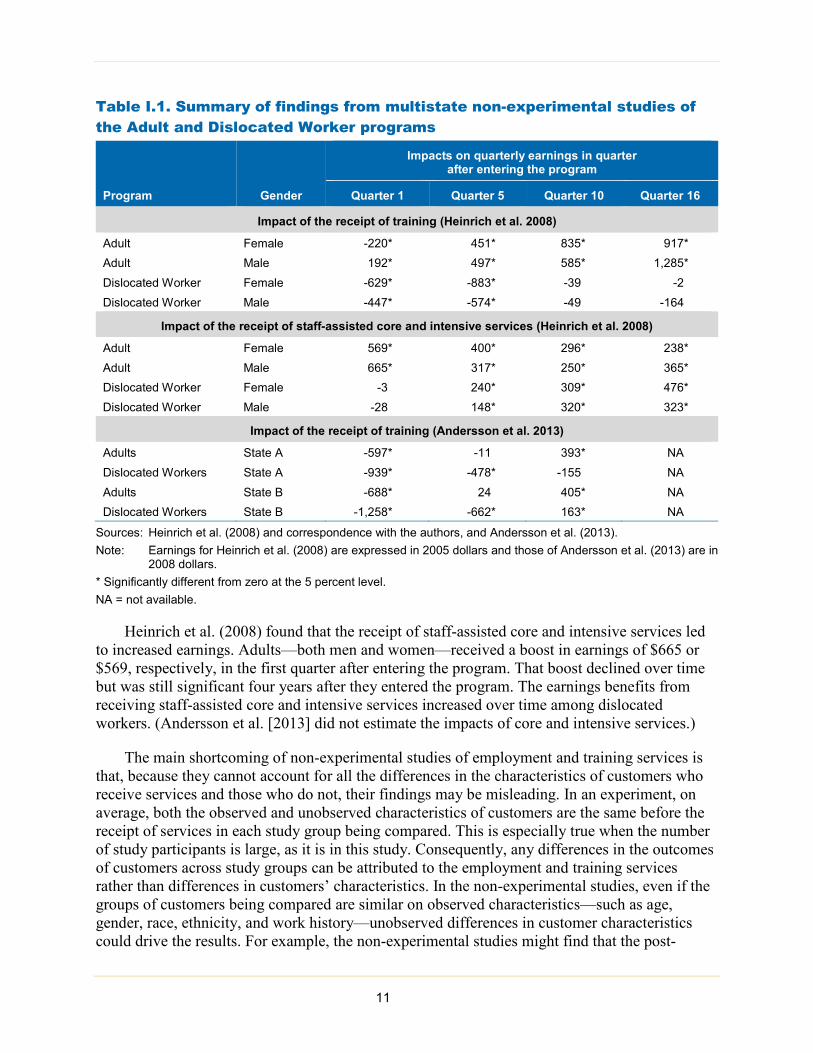
Table I.1. Summary of findings from multistate non-experimental studies of the Adult and Dislocated Worker programs
Program Gender
Impacts on quarterly earnings in quarter after entering the program
Quarter 1 Quarter 5 Quarter 10 Quarter 16
Impact of the receipt of training (Heinrich et al. 2008)
Adult Female -220* 451* 835* 917* Adult Male 192* 497* 585* 1,285* Dislocated Worker Female -629* -883* -39 -2 Dislocated Worker Male -447* -574* -49 -164
Impact of the receipt of staff-assisted core and intensive services (Heinrich et al. 2008)
Adult Female 569* 400* 296* 238* Adult Male 665* 317* 250* 365* Dislocated Worker Female -3 240* 309* 476* Dislocated Worker Male -28 148* 320* 323*
Impact of the receipt of training (Andersson et al. 2013)
Adults State A -597* -11 393* NA Dislocated Workers State A -939* -478* -155 NA Adults State B -688* 24 405* NA Dislocated Workers State B -1,258* -662* 163* NA
Sources: Heinrich et al. (2008) and correspondence with the authors, and Andersson et al. (2013). Note: Earnings for Heinrich et al. (2008) are expressed in 2005 dollars and those of Andersson et al. (2013) are in
2008 dollars. * Significantly different from zero at the 5 percent level. NA = not available.
Heinrich et al. (2008) found that the receipt of staff-assisted core and intensive services led to increased earnings. Adults—both men and women—received a boost in earnings of $665 or $569, respectively, in the first quarter after entering the program. That boost declined over time but was still significant four years after they entered the program. The earnings benefits from receiving staff-assisted core and intensive services increased over time among dislocated workers. (Andersson et al. [2013] did not estimate the impacts of core and intensive services.)
The main shortcoming of non-experimental studies of employment and training services is that, because they cannot account for all the differences in the characteristics of customers who receive services and those who do not, their findings may be misleading. In an experiment, on average, both the observed and unobserved characteristics of customers are the same before the receipt of services in each study group being compared. This is especially true when the number of study participants is large, as it is in this study. Consequently, any differences in the outcomes of customers across study groups can be attributed to the employment and training services rather than differences in customers’ characteristics. In the non-experimental studies, even if the groups of customers being compared are similar on observed characteristics—such as age, gender, race, ethnicity, and work history—unobserved differences in customer characteristics could drive the results. For example, the non-experimental studies might find that the post-
11
program earnings of those who enrolled in training were higher than those who did not even if the training was ineffective because those who trained were more motivated than those who did not pursue training. Hence, results from non-experimental studies could be misleading. The present study was designed to overcome these limitations.
G. Organization of this report
The rest of this report is organized as follows:
• In Chapter II, we describe the design of the impact study.
• In Chapter III, we provide context for the study findings by describing the characteristics of the local areas, the labor markets in which they provided services, and the characteristics of the customers in the study.
• In Chapter IV, we describe the differences across study groups in the receipt of core, intensive, and supportive services.
• In Chapter V, we describe the differences across study groups in training enrollment.
• In Chapter VI, we present the impacts of the programs’ intensive and training services on employment outcomes.
• In Chapter VII, we present the impacts of the programs’ intensive and training services on household income, receipt of public assistance, and some other measures of customer well-being.
• In Chapter VIII, we describe our approach to estimating the net benefits of the programs and present the results of our benefit-cost analysis.
• In Chapter IX, we discuss the key study findings.
A technical supplement in an accompanying volume to this report includes appendices that describe our analyses in more detail, present an analysis of the sensitivity of the estimates to different assumptions and analytical approaches, and provide detailed estimates that include p-values and sample sizes.
12

II. THE DESIGN OF THE IMPACT STUDY
The WIA Gold Standard Evaluation was ambitious in its design in two ways. First, it aimed to be nationally representative—to estimate impacts that would be representative of the Adult and Dislocated Worker programs nationwide rather than only in a subset of local areas. This required that the evaluation include randomly selected local areas, rather than those that volunteered to participate. Second, it used an experimental design that required random assignment of tens of thousands of customers. Because the programs were ongoing, the evaluation had to be designed in a way that minimized disruptions to their operations.
In this chapter, we provide an overview of the evaluation’s impact study, which is the focus of this report. We begin by describing the random selection of local areas for the study (Section A). We then describe the experimental design (Section B) and data sources (Section C). We end the chapter by presenting the analytic methods used in the impact analysis (Section D). Mastri et al. (2015) provides further details about the design and implementation of the evaluation. Appendix A of the technical supplement to this report provides more detail about the analysis approach.
A. Randomly selecting local areas for the study
We randomly selected 30 local areas nationwide for the study from a list of 487 local areas. We started with a list of all 585 local areas in the United States and its territories as of March 2008. Primarily to reduce the evaluation costs involved in recruiting and monitoring local areas in the study, we excluded the 22 local areas outside the 48 contiguous states and 76 very small local areas (those with fewer than 100 customers annually who were reported in WIASRD as having received intensive services). This left 487 local areas, representing 83 percent of all local areas and more than 98 percent of customers who received WIA-funded intensive services in the contiguous United States in 2008. In selecting the 30 local areas, we ensured that there would be variation in DOL region, states, the size of the local area, and the rate at which customers received training. We measured the training rate based on the proportion of customers reported as having received intensive services who also received training funds from April 2006 through March 2008, according to WIASRD.
We anticipated that not all of the selected local areas would agree to participate, and we had a backup plan for those that did not. For each of the 30 randomly selected local areas, we identified potential replacement local areas to help maintain the representativeness of the study sample if the originally selected local area declined to participate. We chose the replacement local areas to have similar key characteristics as the originally selected local area, prioritizing in the following order: being in the same region, of similar size, in the same state, and with similar training rates.
The study included 28 local areas (see the text box for a list of these areas). Twenty-six of the 30 randomly selected local areas—87 percent—agreed to participate. We successfully replaced 2 of the 4 local areas that declined to participate. The LWIBs of 2 other local areas declined to participate, but the decisions were made too late to allow sufficient time to recruit and set up study procedures in their replacement local areas within the study’s timeline. No local areas dropped out of the evaluation after recruitment was complete. As expected given the random selection, the characteristics of the 28 participating local areas were similar to those of local areas nationwide (Mastri et al. 2015). The statistical power of the study was viewed as sufficient with 28 participat-ing local areas. Figure II.1 shows the locations of the local areas participating in the study.
13

Local areas participating in the WIA Gold Standard Evaluation Atlanta Regional Workforce Board (Georgia) Capital Regional Workforce Board (New York) Central Region Workforce Investment Board (Missouri) Chautauqua County Workforce Investment Board (New York) Chicago Workforce Investment Council (Illinois)a East Tennessee Human Resource Agency (Tennessee) EmployIndy Workforce Investment Board (Indiana) Essex County Workforce Investment Board (New Jersey) First Coast Workforce Investment Board (Florida) Fresno Regional Workforce Investment Board (California) Greater Louisville Workforce Investment Board (Kentucky) Gulf Coast Workforce Board (Texas) Lower Savannah Workforce Investment Area (South Carolina) Muskegon/Oceana Michigan Works! Workforce Development Board (Michigan) New Orleans Workforce Investment Board (Louisiana)
New York City Workforce Investment Board (New York) North Central Texas Workforce Development Board-Workforce Solutions (Texas) Northwest Workforce Investment Board (Pennsylvania) Sacramento Works Workforce Investment Board (California) Santee-Lynches Workforce Investment Board (South Carolina) South Dakota Workforce Development Council (South Dakota) South Plains Workforce Development Board (Texas) Southeast Michigan Community Alliance Workforce Investment Board (Michigan) Southwest Corner Workforce Investment Board (Pennsylvania) Twin Districts Workforce Area (Mississippi) Waukesha-Ozaukee-Washington Counties (Wisconsin) Workforce Development Council of Seattle-King County (Washington) Workforce Investment Board of Central Pennsylvania (Pennsylvania)
a In July 2012 the Chicago Workforce Investment Council merged with the Workforce Board of Northern Cook County and Cook County Workforce Investment Board to form a single workforce investment area. Only those American Job Centers located within the boundaries of the City of Chicago participated in the study, both before and after the merger.
Figure II.1. Locations of the 28 local areas participating in the study
Source: WIA Gold Standard Evaluation. Note: The map shows the location of the six ETA regions. 14
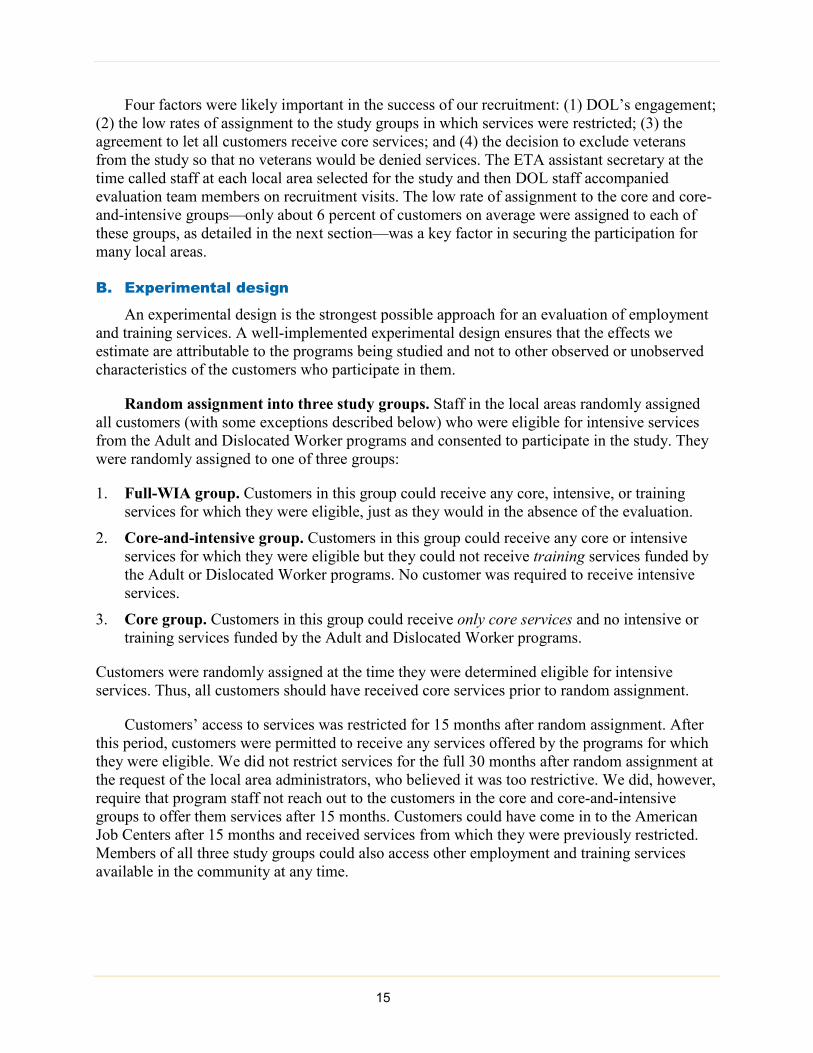
Four factors were likely important in the success of our recruitment: (1) DOL’s engagement; (2) the low rates of assignment to the study groups in which services were restricted; (3) the agreement to let all customers receive core services; and (4) the decision to exclude veterans from the study so that no veterans would be denied services. The ETA assistant secretary at the time called staff at each local area selected for the study and then DOL staff accompanied evaluation team members on recruitment visits. The low rate of assignment to the core and core-and-intensive groups—only about 6 percent of customers on average were assigned to each of these groups, as detailed in the next section—was a key factor in securing the participation for many local areas.
B. Experimental design
An experimental design is the strongest possible approach for an evaluation of employment and training services. A well-implemented experimental design ensures that the effects we estimate are attributable to the programs being studied and not to other observed or unobserved characteristics of the customers who participate in them.
Random assignment into three study groups. Staff in the local areas randomly assigned all customers (with some exceptions described below) who were eligible for intensive services from the Adult and Dislocated Worker programs and consented to participate in the study. They were randomly assigned to one of three groups:
1. Full-WIA group. Customers in this group could receive any core, intensive, or training services for which they were eligible, just as they would in the absence of the evaluation.
2. Core-and-intensive group. Customers in this group could receive any core or intensive services for which they were eligible but they could not receive training services funded by the Adult or Dislocated Worker programs. No customer was required to receive intensive services.
3. Core group. Customers in this group could receive only core services and no intensive or training services funded by the Adult and Dislocated Worker programs.
Customers were randomly assigned at the time they were determined eligible for intensive services. Thus, all customers should have received core services prior to random assignment.
Customers’ access to services was restricted for 15 months after random assignment. After this period, customers were permitted to receive any services offered by the programs for which they were eligible. We did not restrict services for the full 30 months after random assignment at the request of the local area administrators, who believed it was too restrictive. We did, however, require that program staff not reach out to the customers in the core and core-and-intensive groups to offer them services after 15 months. Customers could have come in to the American Job Centers after 15 months and received services from which they were previously restricted. Members of all three study groups could also access other employment and training services available in the community at any time.
15
For the most part, local areas defined core, intensive, and training services similarly. However, a few services were defined as core services in some local areas and intensive in others. For example, some local areas considered the Test of Adult Basic Education (TABE) a core service offered to all customers, but others viewed it as an intensive service. (All local areas considered a staff person discussing the results of the TABE with the customer an intensive service.) Similarly, some local areas offered workshops with similar content, such as how to write a résumé, as core services, but others offered the workshops as intensive services. In most cases, we used the local area’s definition of core and intensive services during the study. Mastri et al. (2015) discusses the few exceptions.
Local areas varied in the services they offered and to whom they offered the services. We did not ask any local areas to change the services they offered or to relax any restrictions they placed on whom they offered services to during the study. Because the local areas were randomly selected, this variation in service provision in the local areas in the study reflects the variation in service provision in all the local areas and the estimates of the impacts of access to services can be generalized to the services nationwide.
The study team conducted random assignment in all American Job Centers and online intake points in the local areas participating in the study from November 2011 through April 2013. After customers were randomly assigned, they could receive only the services allowed for their study group; these restrictions lasted for 15 months after each customer’s random assignment. For example, a member of the core group could not receive intensive or training services through the Adult or Dislocated Worker programs for 15 months after assignment. After 15 months, customers could receive any Adult or Dislocated Worker program services for which they were eligible, as noted above. Customers who did not consent to participate in the study could receive only core services for the duration of the study intake period in their local area.
Customers who were not included in the study. Some groups of customers found eligible for intensive services were not included in the study (Mastri et al. 2015). Although not randomly assigned, these customers could receive the same services they would have received in the absence of the study. These customers included:
1. Participants in the TAA program. TAA is an entitlement program—those eligible for TAA cannot be denied TAA services. Many states and local areas require that TAA participants be enrolled in the Dislocated Worker program to receive case management and other services. Consequently, TAA participants could not be randomly assigned to the core or core-and-intensive group, since this would preclude them from accessing intensive and other WIA services.
2. Veterans and covered spouses. Veterans and some spouses of veterans receive priority of service. ETA decided that denying intensive or training services to veterans or covered spouses would go against the spirit of the priority-of-service provision. Moreover, some local areas agreed to participate in the study only on the condition that veterans be exempted. To learn about the experiences of veterans accessing public workforce services, DOL funded a supplemental study that examined how the randomly selected local areas participating in the evaluation provided services to veterans and analyzed the characteristics, services, and outcomes of veteran customers in the local areas, with a particular focus in two states (Rosenberg et al. 2015).
16
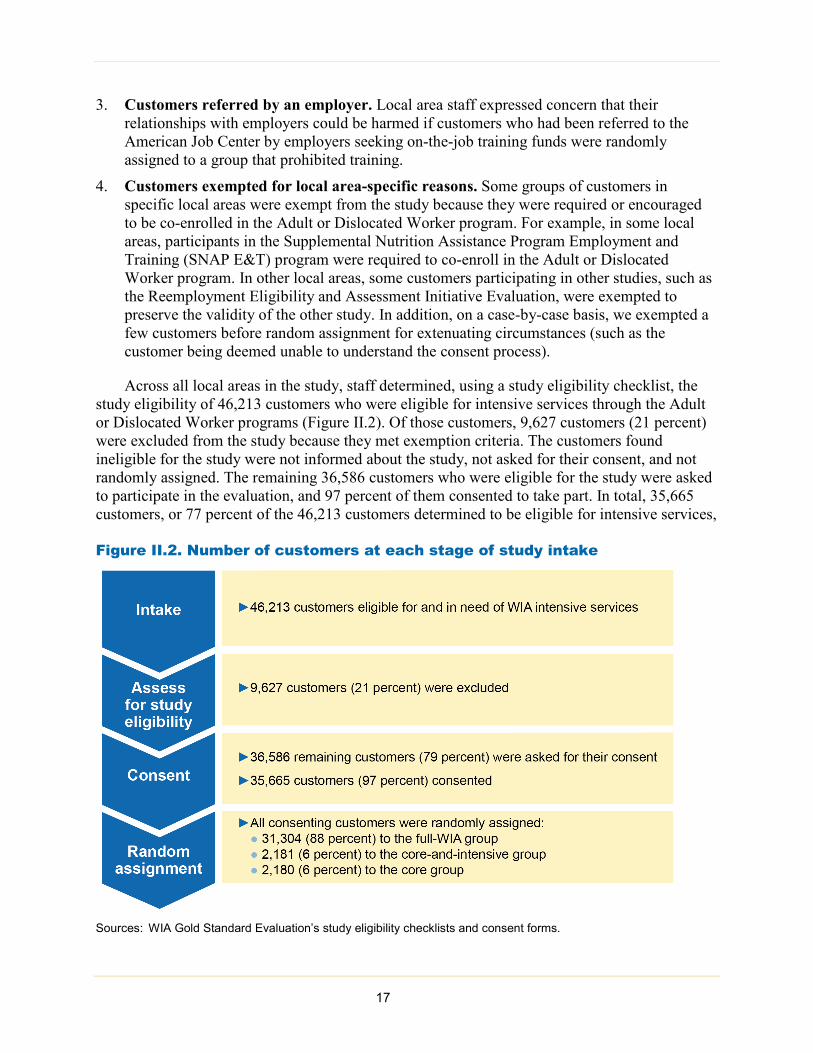
3. Customers referred by an employer. Local area staff expressed concern that their relationships with employers could be harmed if customers who had been referred to the American Job Center by employers seeking on-the-job training funds were randomly assigned to a group that prohibited training.
4. Customers exempted for local area-specific reasons. Some groups of customers in specific local areas were exempt from the study because they were required or encouraged to be co-enrolled in the Adult or Dislocated Worker program. For example, in some local areas, participants in the Supplemental Nutrition Assistance Program Employment and Training (SNAP E&T) program were required to co-enroll in the Adult or Dislocated Worker program. In other local areas, some customers participating in other studies, such as the Reemployment Eligibility and Assessment Initiative Evaluation, were exempted to preserve the validity of the other study. In addition, on a case-by-case basis, we exempted a few customers before random assignment for extenuating circumstances (such as the customer being deemed unable to understand the consent process).
Across all local areas in the study, staff determined, using a study eligibility checklist, the study eligibility of 46,213 customers who were eligible for intensive services through the Adult or Dislocated Worker programs (Figure II.2). Of those customers, 9,627 customers (21 percent) were excluded from the study because they met exemption criteria. The customers found ineligible for the study were not informed about the study, not asked for their consent, and not randomly assigned. The remaining 36,586 customers who were eligible for the study were asked to participate in the evaluation, and 97 percent of them consented to take part. In total, 35,665 customers, or 77 percent of the 46,213 customers determined to be eligible for intensive services,
Figure II.2. Number of customers at each stage of study intake
Sources: WIA Gold Standard Evaluation’s study eligibility checklists and consent forms.
17
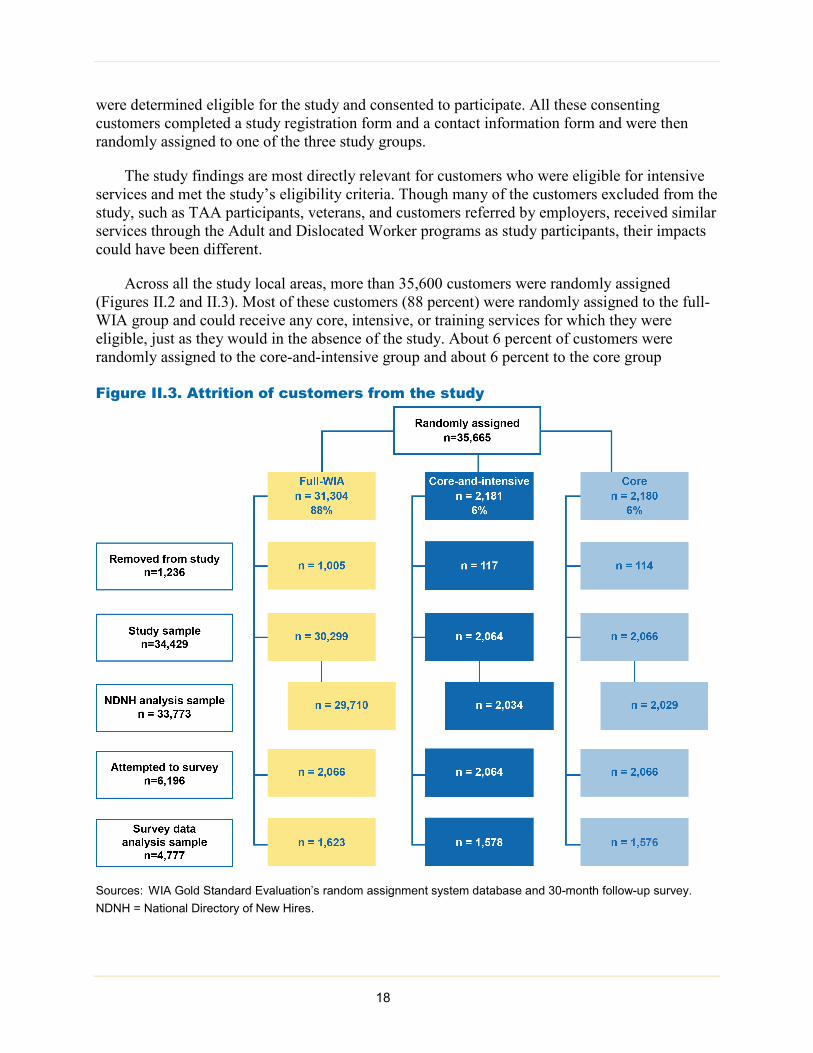
were determined eligible for the study and consented to participate. All these consenting customers completed a study registration form and a contact information form and were then randomly assigned to one of the three study groups.
The study findings are most directly relevant for customers who were eligible for intensive services and met the study’s eligibility criteria. Though many of the customers excluded from the study, such as TAA participants, veterans, and customers referred by employers, received similar services through the Adult and Dislocated Worker programs as study participants, their impacts could have been different.
Across all the study local areas, more than 35,600 customers were randomly assigned (Figures II.2 and II.3). Most of these customers (88 percent) were randomly assigned to the full-WIA group and could receive any core, intensive, or training services for which they were eligible, just as they would in the absence of the study. About 6 percent of customers were randomly assigned to the core-and-intensive group and about 6 percent to the core group
Figure II.3. Attrition of customers from the study
Sources: WIA Gold Standard Evaluation’s random assignment system database and 30-month follow-up survey. NDNH = National Directory of New Hires.
18
(Figure II.3). The study team set random assignment rates to the core-and-intensive and core groups low for two main reasons. First, denying services to a large proportion of the customers would likely change program operations and we would no longer be estimating the impact of the programs as they were usually operated. Second, low rates of assignment to the core-and-intensive and core groups made the study more acceptable to the local area staff and hence increased the likelihood that they would agree to participate in the study. The rates were set lower in larger local areas than in smaller ones to ensure that the core-and-intensive and core groups would not consist mainly of customers from the largest local areas.
Customers who left the study after random assignment. As is typical with experimental studies, we did not obtain follow-up data for all the randomly assigned customers (Figure II.3). Some customers were removed from the study entirely—because they withdrew consent, found out later they were ineligible for the study (because, for example, they later qualified for TAA), or the local area did not send us a customer’s consent form and we could not verify consent to the study. Others remained in the study but did not respond to the follow-up survey. Among the 35,665 randomly assigned customers, 1,236 (3.5 percent) either became ineligible after random assignment (2.1 percent), withdrew their consent after random assignment (0.1 percent), or were removed from the study because we did not receive their consent forms (1.2 percent). Study attrition was low in all three groups: only 3.2 percent of full-WIA customers, 5.4 percent of core-and-intensive customers, and 5.2 percent of core customers were removed from the study (Figure II.3). We did not try to survey or collect administrative data on any of these customers (beyond baseline data collected at random assignment). The remaining sample of 34,429 customers served as our study sample.
C. Data sources
The findings in this report are based on data from five main sources: the study registration form, 15- and 30-month follow-up surveys, the NDNH, the WIASRD, and financial data from local areas.
Study registration form. Local area staff asked customers who consented to participate in the study to complete a hard-copy study registration form. That form collected data on customers’ demographic characteristics, employment histories, receipt of public benefits or unemployment compensation, and history of seeking services at an American Job Center. The form also asked staff members to indicate whether the customer was likely to enroll in WIA as an adult, a dislocated worker, or both.
15- and 30-month follow-up surveys. The 15- and 30-month follow-up surveys are the primary sources of service receipt and outcomes data examined in this report. We conducted follow-up telephone surveys with a subset of study participants about 15 and 30 months after each was randomly assigned. The surveys targeted all members of the core and core-and-intensive groups, along with a similar number (2,066) of randomly selected members of the full-WIA group (Figure II.3). We attempted 30-month interviews with customers regardless of whether they completed a 15-month interview. The 15-month survey asked for information about customers’ service receipt, participation in training, and employment and earnings since random assignment. For customers who responded to the 15-month survey, the 30-month survey asked for information on these same outcomes starting on the date of their last interview. For customers
19
who did not respond to the 15-month survey, the 30-month survey asked for information covering the entire period after random assignment.
Our final sample for analyses using the survey data in this report included all customers who responded to the 30-month survey. We have survey responses from 4,777 customers in total, yielding a survey response rate of 77 percent. Rates did not differ significantly across the three study groups, with response rates of 79 percent for the full-WIA group and 76 percent for both the core-and-intensive and core groups (Figure II.3).
The analysis sample of 30-month survey respondents differs slightly from that used for our 15-month analysis. It includes 424 customers who responded to the 30-month survey but not the 15-month survey and excludes 547 customers who responded to the 15-month survey but not the 30-month survey. As a result, the estimates of impacts for Quarters 1 to 5 after random assignment produced in this report will not exactly match those from McConnell et al. (2016). However, both samples are weighted to be representative of the same group of customers served by the Adult and Dislocated Worker programs. Thus, we can directly compare the estimates for the 15 months after random assignment from McConnell et al. (2016) to those produced in this report for the entire 30-month follow-up period.
National Directory of New Hires. The NDNH, an administrative database, contains information collected by state unemployment agencies and submitted to the Office of Child Support Enforcement of the U.S. Department of Health and Human Services (Solomon-Fears 2014). Our analysis uses NDNH data on quarterly earnings and UI benefits, covering the 12 quarters (36 months) after random assignment of customers. These data are available for almost all study participants, including survey nonrespondents and participants who we did not select for the survey. We can therefore use the administrative data to validate estimates based on survey data during overlapping periods using a larger sample of customers, as well as to estimate longer-term earnings impacts and impacts on additional outcome measures. Besides spanning two quarters more than the survey data, the exact timing of the NDNH quarters also differs slightly in that each quarter is tied to quarters within a year rather than quarters that begin the day after a customer is randomly assigned.
We included 33,773 of these customers in our analysis of administrative data from the NDNH. We excluded 577 members of the study sample (1.7 percent) because the customers provided invalid combinations of name and Social Security number. We also excluded 79 members of the study sample (0.2 percent) who were randomly assigned very late in the random assignment period because the NDNH did not include information on these individuals for the full 36-month period used in the NDNH analysis. Rates of exclusion did not differ significantly across study groups.
Workforce Investment Act Standardized Record Data. ETA requires states to submit individual-level data for every customer who receives Adult and Dislocated Worker program-funded services, describing the customer’s characteristics, service receipt, and outcomes. Together, these data form the WIASRD. We collected these data for those enrolled in the study for two reasons. First, we used WIASRD to examine service receipt by study participants. Second, we monitored compliance with random assignment by collecting data on all customers in the local area to ensure that no customers who were eligible for the study received services
20
before they were randomly assigned and that no randomly assigned participants received WIA-funded services that were not allowed by their study group. We obtained these data for only the first 15 months after random assignment because we expected most of the differences in receipt of services to happen in the first 15 months and to minimize burden on local area staff.
Financial data from local areas. Local areas provided us data on the value of the ITAs and (in most cases) supportive services provided to study participants. To facilitate the benefit-cost analysis, they also provided information on the costs of providing customers core and intensive services. We obtained this data for only the first 15 months after random assignment, to minimize burden on local area staff.
We use both follow-up survey data and NDNH data as separate measures of employment and earnings. Each has advantages and disadvantages. NDNH data have the advantages that they are available for the entire sample and are not subject to the recall error that is a potential problem in surveys. However, the NDNH data do not cover all jobs, contain less detailed information on jobs, and are subject to other reporting errors. In particular, NDNH data do not cover self-employed workers, railroad employees, workers in service for relatives, most agricultural labor, some domestic service workers, and part-time employees of nonprofit organizations (U.S. Department of Labor 2014). Workers in these sectors comprise about 10 percent of workers in the U.S. economy (Kornfeld and Bloom 1999; Hotz and Scholz 2002). NDNH data do not cover workers who are casually employed, such as day laborers or part-time helpers, either.
NDNH data also exclude workers whose employers do not report their earnings to the UI agency, even in the formal sector, because of the prevalence of flexible staffing arrangements or illegally neglecting to report. An audit study of Illinois employers’ UI reports suggests that illegal failure to report wages affects about one in seven workers because of the prevalence of flexible staffing arrangements such as independent contractors (Blakemore et al. 1996). There is reason to believe that type of undercoverage may be increasing because flexible staffing arrangements have become much more common in recent years (Houseman 1999; Hotz and Scholz 2002; Katz and Krueger 2016). Finally, the UI records on which NDNH earnings and employment measures are based rely on the accuracy of reported Social Security numbers; earnings will be excluded if there is a discrepancy in the Social Security number reported at program intake and the Social Security number reported to or by employers. Previous studies have suggested that inconsistently reported Social Security numbers are an important problem when using wage records from state UI agencies (Schochet et al. 2003).
D. Impact analysis approach
At its heart, our approach to estimating how access to program services affect customers’ outcomes was simple: we compared the average outcomes across the three study groups. The analysis approach can be summarized as follows (and is depicted in Figure II.4):
• To determine the effect of WIA-funded training services, we compared the average outcomes of full-WIA customers with those of core-and-intensive customers. Conceptually, we compared a scenario with the full set of WIA services provided through the Adult and Dislocated Worker programs (represented by the full-WIA group) to a scenario where the
21
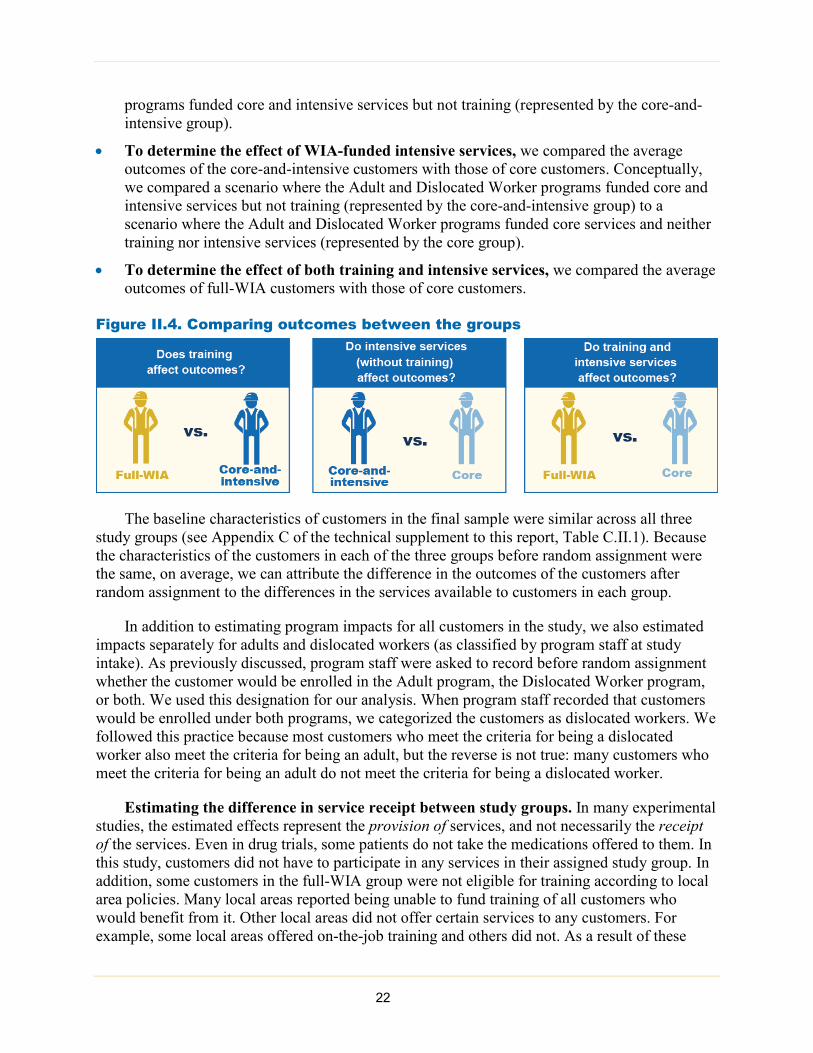
programs funded core and intensive services but not training (represented by the core-and-intensive group).
• To determine the effect of WIA-funded intensive services, we compared the average outcomes of the core-and-intensive customers with those of core customers. Conceptually, we compared a scenario where the Adult and Dislocated Worker programs funded core and intensive services but not training (represented by the core-and-intensive group) to a scenario where the Adult and Dislocated Worker programs funded core services and neither training nor intensive services (represented by the core group).
• To determine the effect of both training and intensive services, we compared the average outcomes of full-WIA customers with those of core customers.
Figure II.4. Comparing outcomes between the groups
The baseline characteristics of customers in the final sample were similar across all three study groups (see Appendix C of the technical supplement to this report, Table C.II.1). Because the characteristics of the customers in each of the three groups before random assignment were the same, on average, we can attribute the difference in the outcomes of the customers after random assignment to the differences in the services available to customers in each group.
In addition to estimating program impacts for all customers in the study, we also estimated impacts separately for adults and dislocated workers (as classified by program staff at study intake). As previously discussed, program staff were asked to record before random assignment whether the customer would be enrolled in the Adult program, the Dislocated Worker program, or both. We used this designation for our analysis. When program staff recorded that customers would be enrolled under both programs, we categorized the customers as dislocated workers. We followed this practice because most customers who meet the criteria for being a dislocated worker also meet the criteria for being an adult, but the reverse is not true: many customers who meet the criteria for being an adult do not meet the criteria for being a dislocated worker.
Estimating the difference in service receipt between study groups. In many experimental studies, the estimated effects represent the provision of services, and not necessarily the receipt of the services. Even in drug trials, some patients do not take the medications offered to them. In this study, customers did not have to participate in any services in their assigned study group. In addition, some customers in the full-WIA group were not eligible for training according to local area policies. Many local areas reported being unable to fund training of all customers who would benefit from it. Other local areas did not offer certain services to any customers. For example, some local areas offered on-the-job training and others did not. As a result of these
22
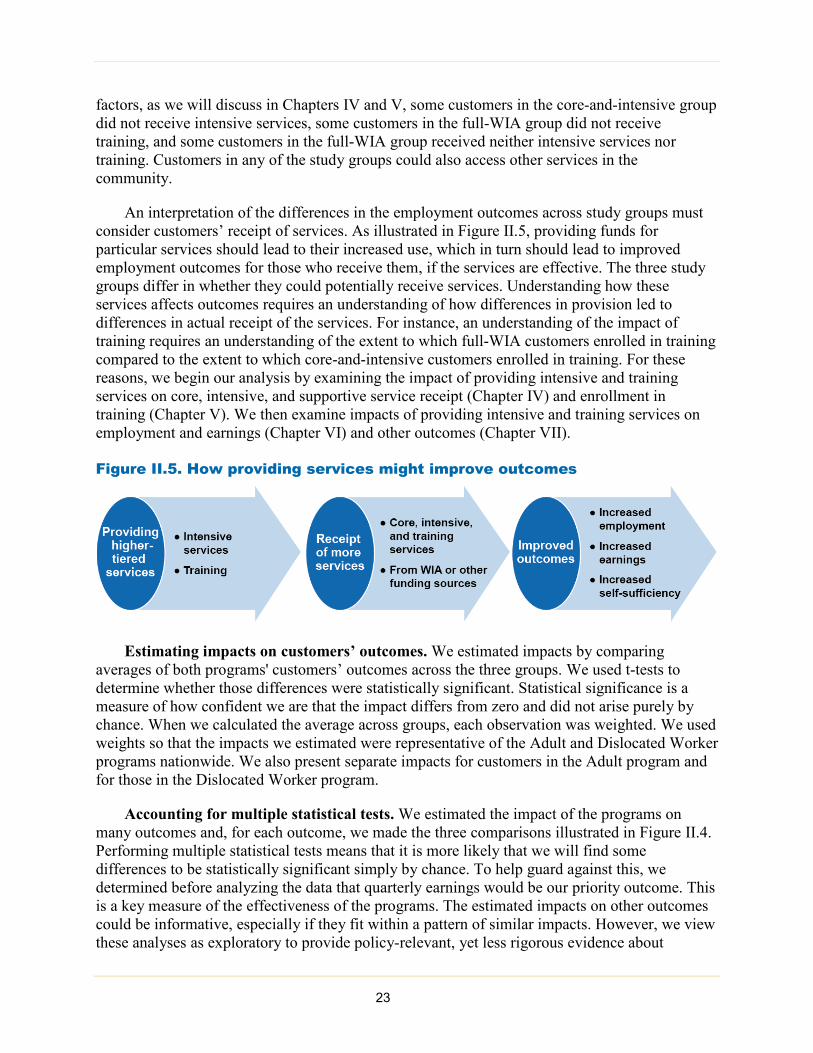
factors, as we will discuss in Chapters IV and V, some customers in the core-and-intensive group did not receive intensive services, some customers in the full-WIA group did not receive training, and some customers in the full-WIA group received neither intensive services nor training. Customers in any of the study groups could also access other services in the community.
An interpretation of the differences in the employment outcomes across study groups must consider customers’ receipt of services. As illustrated in Figure II.5, providing funds for particular services should lead to their increased use, which in turn should lead to improved employment outcomes for those who receive them, if the services are effective. The three study groups differ in whether they could potentially receive services. Understanding how these services affects outcomes requires an understanding of how differences in provision led to differences in actual receipt of the services. For instance, an understanding of the impact of training requires an understanding of the extent to which full-WIA customers enrolled in training compared to the extent to which core-and-intensive customers enrolled in training. For these reasons, we begin our analysis by examining the impact of providing intensive and training services on core, intensive, and supportive service receipt (Chapter IV) and enrollment in training (Chapter V). We then examine impacts of providing intensive and training services on employment and earnings (Chapter VI) and other outcomes (Chapter VII).
Figure II.5. How providing services might improve outcomes
Estimating impacts on customers’ outcomes. We estimated impacts by comparing averages of both programs' customers’ outcomes across the three groups. We used t-tests to determine whether those differences were statistically significant. Statistical significance is a measure of how confident we are that the impact differs from zero and did not arise purely by chance. When we calculated the average across groups, each observation was weighted. We used weights so that the impacts we estimated were representative of the Adult and Dislocated Worker programs nationwide. We also present separate impacts for customers in the Adult program and for those in the Dislocated Worker program.
Accounting for multiple statistical tests. We estimated the impact of the programs on many outcomes and, for each outcome, we made the three comparisons illustrated in Figure II.4. Performing multiple statistical tests means that it is more likely that we will find some differences to be statistically significant simply by chance. To help guard against this, we determined before analyzing the data that quarterly earnings would be our priority outcome. This is a key measure of the effectiveness of the programs. The estimated impacts on other outcomes could be informative, especially if they fit within a pattern of similar impacts. However, we view these analyses as exploratory to provide policy-relevant, yet less rigorous evidence about 23
program effects for continuous program improvement and to identify hypotheses that could be subject to more rigorous future examination.
The problem with multiple statistical tests also arises when focusing on individual outcomes, because our analysis involves making three pairwise comparisons across the three research groups. To adjust for this, we used a standard established approach from available literature. Specifically, we compared our estimated p-values for quarterly earnings against both a critical value of 5 percent and a lower critical value of 1.85 percent.3
Additional information. In detailed technical appendices of the technical supplement to this report, we provide additional information about the analysis approach and detailed tables of the findings. In Appendix A of the technical supplement, we describe our analytical approach, including additional details on the study design, weights, approach to addressing missing data due to survey-item nonresponse, impact estimation approach, adjustment for multiple statistical tests, and minimum detectable impacts for key outcomes. In Appendix B, we analyze the sensitivity of our results to different statistical approaches and assumptions. In the remaining appendices, we provide detailed tables of the results that include sample sizes, p-values, and additional tests of statistical significance for all customers as well as separate estimates for key outcomes for adults and dislocated workers.
3 The tables and figures in this report and the accompanying technical supplement use symbols to denote significance using the 5 percent critical value. Appendix A of the technical supplement to this report discusses the rationale for the alternative 1.85 percent significance level.
24
III. CONTEXT
Documenting the context in which the Adult and Dislocated Worker programs operated and the characteristics of the customers served by the programs is important for understanding the impact study findings. The geographic and political contexts for the local areas, program funding, the needs of the customers, and economic conditions during the study could all influence the effectiveness of the programs. To provide this context, in this chapter we describe the local areas in the study (Section A), their labor market and funding conditions at the time of the study (Sections B and C), and the characteristics of the study participants (Section D).
A. Variation in local areas in which the programs operated
By design, the 28 randomly selected local areas reflected the variation in local areas nationwide. The local areas in the study varied considerably in the size of the geographic area, number of customers served, and amount of funding provided (Table III.1). In physical size, the smallest local area in the study was Essex County in New Jersey, which did not include even a whole county because the local area excluded the city of Newark, which is located in Essex County. In contrast, the entire state of South Dakota formed another local area. In New York City, more than 200,000 customers “exited”4 the programs in calendar year 2012, whereas fewer than 200 customers exited the programs in the South Plains (Texas) local area. The local areas that received the most funding for the Adult and Dislocated Worker programs in calendar year 2012 were New York City and Gulf Coast (Texas) at about $36 million and $23 million, respectively; Chautauqua County (New York) received the least funding (about $500,000) of the local areas in the study. On average, the local areas received about $6.25 million in funding.
The local areas in the study also varied considerably in the extent to which they served customers in urban areas. All but three local areas served both rural and urban populations. However, because most local areas include at least one city, local areas were typically more urban than not. In slightly more than one-third of the local areas, more than 90 percent of the population lived in urban areas (Table III.1). The percentage of the urban population was less than 50 percent in only three local areas.
4 "Exited" is a program operations term that means a participant has not received a service funded by the program or a partner program for 90 consecutive calendar days and is not scheduled for future services. Performance measures are based on program exiters.
Key findings • Reflecting the variation in the characteristics of local areas across the nation, the local areas in the study
varied considerably in their degree of urbanicity, size, funding, and number of customers served.
• The study occurred at a time of high, but declining, unemployment and declining funding for the programs.
• Many customers—especially adults—faced multiple barriers to becoming successfully employed. Few customers were employed when they entered the study, and many had been without a job for more than five years.
• Those participating in the Adult program were typically more disadvantaged and faced more barriers to employment than those participating in the Dislocated Worker program.
25
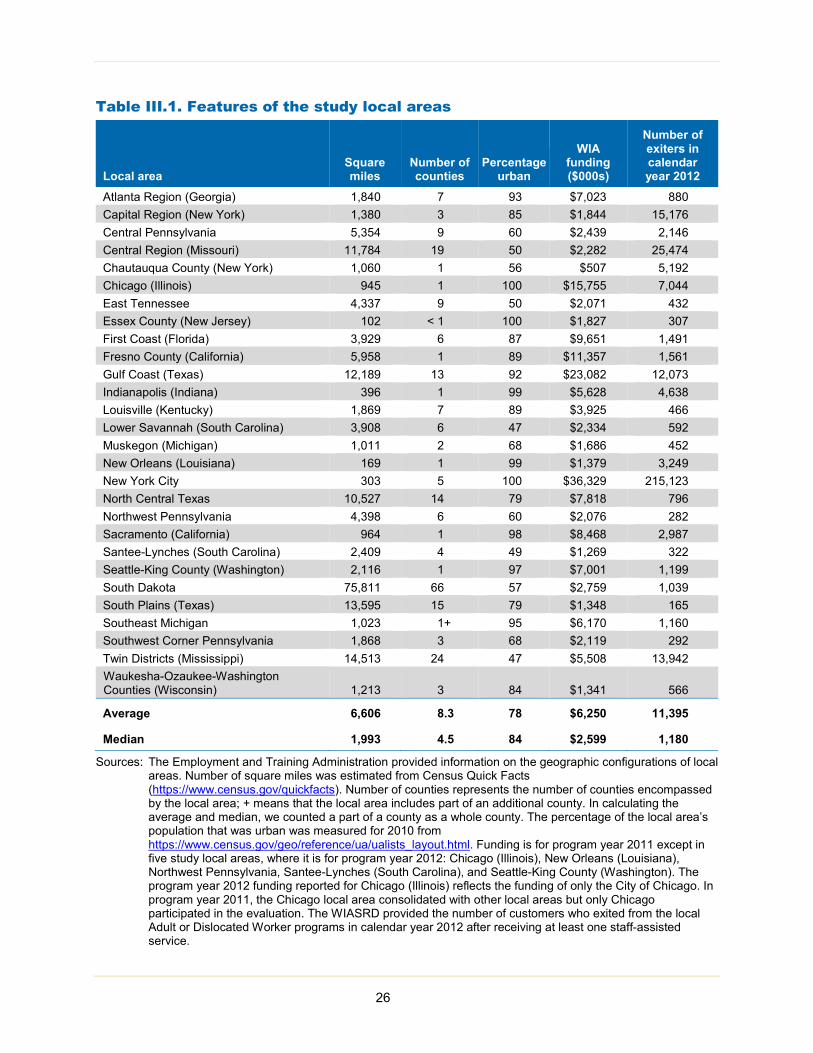
Table III.1. Features of the study local areas
Local area Square miles
Number of counties
Percentage urban
WIA funding ($000s)
Number of exiters in calendar year 2012
Atlanta Region (Georgia) 1,840 7 93 $7,023 880 Capital Region (New York) 1,380 3 85 $1,844 15,176 Central Pennsylvania 5,354 9 60 $2,439 2,146 Central Region (Missouri) 11,784 19 50 $2,282 25,474 Chautauqua County (New York) 1,060 1 56 $507 5,192 Chicago (Illinois) 945 1 100 $15,755 7,044 East Tennessee 4,337 9 50 $2,071 432 Essex County (New Jersey) 102 < 1 100 $1,827 307 First Coast (Florida) 3,929 6 87 $9,651 1,491 Fresno County (California) 5,958 1 89 $11,357 1,561 Gulf Coast (Texas) 12,189 13 92 $23,082 12,073 Indianapolis (Indiana) 396 1 99 $5,628 4,638 Louisville (Kentucky) 1,869 7 89 $3,925 466 Lower Savannah (South Carolina) 3,908 6 47 $2,334 592 Muskegon (Michigan) 1,011 2 68 $1,686 452 New Orleans (Louisiana) 169 1 99 $1,379 3,249 New York City 303 5 100 $36,329 215,123 North Central Texas 10,527 14 79 $7,818 796 Northwest Pennsylvania 4,398 6 60 $2,076 282 Sacramento (California) 964 1 98 $8,468 2,987 Santee-Lynches (South Carolina) 2,409 4 49 $1,269 322 Seattle-King County (Washington) 2,116 1 97 $7,001 1,199 South Dakota 75,811 66 57 $2,759 1,039 South Plains (Texas) 13,595 15 79 $1,348 165 Southeast Michigan 1,023 1+ 95 $6,170 1,160 Southwest Corner Pennsylvania 1,868 3 68 $2,119 292 Twin Districts (Mississippi) 14,513 24 47 $5,508 13,942 Waukesha-Ozaukee-Washington Counties (Wisconsin) 1,213 3 84 $1,341 566
Average 6,606 8.3 78 $6,250 11,395
Median 1,993 4.5 84 $2,599 1,180
Sources: The Employment and Training Administration provided information on the geographic configurations of local areas. Number of square miles was estimated from Census Quick Facts (https://www.census.gov/quickfacts). Number of counties represents the number of counties encompassed by the local area; + means that the local area includes part of an additional county. In calculating the average and median, we counted a part of a county as a whole county. The percentage of the local area’s population that was urban was measured for 2010 from https://www.census.gov/geo/reference/ua/ualists_layout.html. Funding is for program year 2011 except in five study local areas, where it is for program year 2012: Chicago (Illinois), New Orleans (Louisiana), Northwest Pennsylvania, Santee-Lynches (South Carolina), and Seattle-King County (Washington). The program year 2012 funding reported for Chicago (Illinois) reflects the funding of only the City of Chicago. In program year 2011, the Chicago local area consolidated with other local areas but only Chicago participated in the evaluation. The WIASRD provided the number of customers who exited from the local Adult or Dislocated Worker programs in calendar year 2012 after receiving at least one staff-assisted service.
26
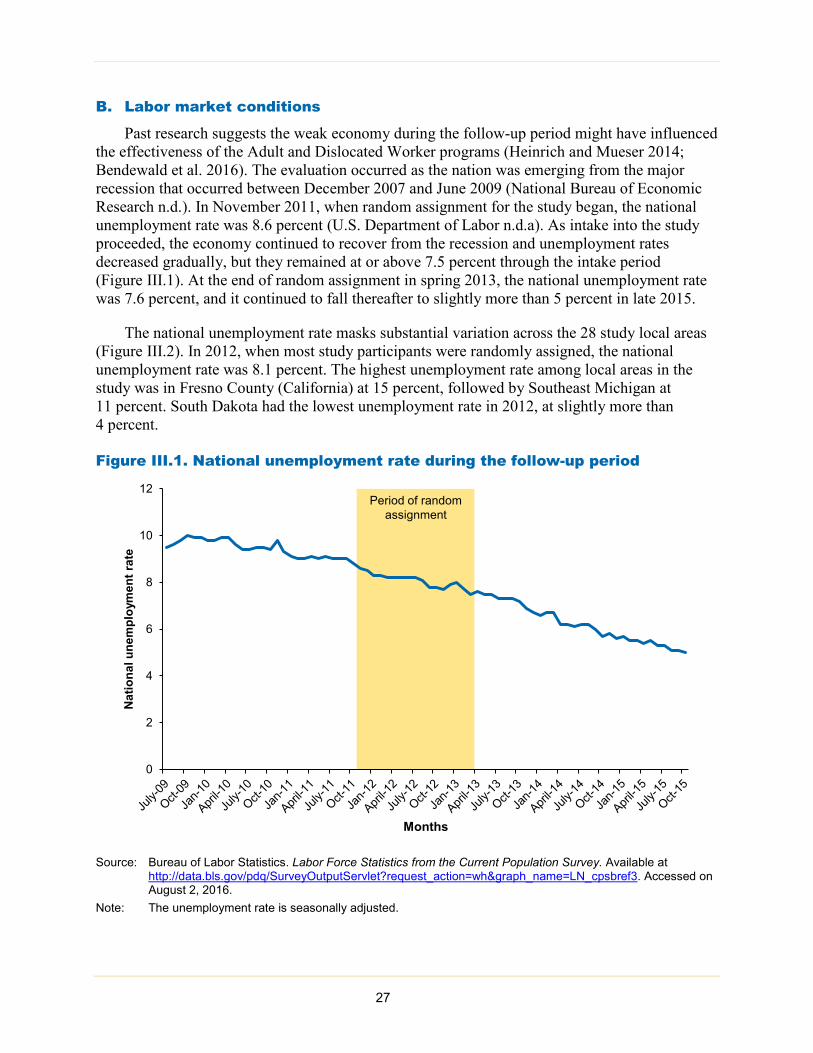
B. Labor market conditions
Past research suggests the weak economy during the follow-up period might have influenced the effectiveness of the Adult and Dislocated Worker programs (Heinrich and Mueser 2014; Bendewald et al. 2016). The evaluation occurred as the nation was emerging from the major recession that occurred between December 2007 and June 2009 (National Bureau of Economic Research n.d.). In November 2011, when random assignment for the study began, the national unemployment rate was 8.6 percent (U.S. Department of Labor n.d.a). As intake into the study proceeded, the economy continued to recover from the recession and unemployment rates decreased gradually, but they remained at or above 7.5 percent through the intake period (Figure III.1). At the end of random assignment in spring 2013, the national unemployment rate was 7.6 percent, and it continued to fall thereafter to slightly more than 5 percent in late 2015.
The national unemployment rate masks substantial variation across the 28 study local areas (Figure III.2). In 2012, when most study participants were randomly assigned, the national unemployment rate was 8.1 percent. The highest unemployment rate among local areas in the study was in Fresno County (California) at 15 percent, followed by Southeast Michigan at 11 percent. South Dakota had the lowest unemployment rate in 2012, at slightly more than 4 percent.
Figure III.1. National unemployment rate during the follow-up period
Source: Bureau of Labor Statistics. Labor Force Statistics from the Current Population Survey. Available at
http://data.bls.gov/pdq/SurveyOutputServlet?request_action=wh&graph_name=LN_cpsbref3. Accessed on August 2, 2016.
Note: The unemployment rate is seasonally adjusted.
0
2
4
6
8
10
12
Nat
iona
l une
mpl
oym
ent r
ate
Months
Period of random assignment
27

Figure III.2. Annual unemployment rates in the 28 study local areas in 2012
Source: Bureau of Labor Statistics, Local Area Unemployment Statistics: Labor Force Data by County, 2012 Annual
Averages. Available at [http://www.bls.gov/lau/laucnty12.txt]. Accessed on January 13, 2015. Note: Rates calculated from annual average unemployment rates for U.S. counties.
A high rate of long-term unemployment accompanied the high national unemployment rate during the study, which affected both the characteristics of customers in the study and the availability of staff at the American Job Centers to provide core services to an increased caseload of study participants. The percentage of the unemployed who had been unemployed for 27 weeks or more was more than 38 percent nationally throughout the study intake period (Kosanovich and Theodossiou 2015). As discussed in the next subsection, a high percentage of study participants had not been employed for a long period. In addition, administrators in the study local areas noted that the staff in the Wagner-Peyser Employment Service were required to provide additional services to the long-term unemployed who were receiving unemployment insurance benefits. As a result, an increase in the number of the long-term unemployed meant that they had less time to provide core services (D’Amico et al. 2015). Therefore, some core services might have been less available to the customers during the study than would have been the case at a time when the rate of long-term unemployment was lower.
C. Funding availability
Funding nationwide for the Adult and Dislocated Worker programs has declined since the programs were enacted. From 2000 to 2012, combined funding for the two programs nationwide declined by 22 percent (U.S. Department of Labor 2015 n.d.b). The drop in funding was particularly pronounced after 2010 (Figure III.3). The American Recovery and Reinvestment Act of 2009 (ARRA) added funds to the programs (not included in Figure III.3), but this infusion had
0 2 4 6 8 10 12 14 16
Waukesha-Ozaukee-Washington Counties (Wisconsin)Twin Districts (Mississippi)
Southwest Corner PennsylvaniaSouth Plains (Texas)Southeast Michigan
South DakotaSeattle-King County (Washington)Santee-Lynches (South Carolina)
Sacramento (California)Northwest Pennsylvania
North Central TexasNew York City
New Orleans (Louisiana)Muskegon (Michigan)
Lower Savannah (South Carolina)Louisville (Kentucky)
Indianapolis (Indiana)Gulf Coast (Texas)
Fresno County (California)First Coast (Florida)
Essex County (New Jersey)East TennesseeChicago (Illinois)
Chautauqua County (New York)Central Region (Missouri)
Central PennsylvaniaCapital Region (New York)
Atlanta Region (Georgia)National unemployment rate
Stud
y lo
cal a
rea
2012 annual average unemployment rate
28

ended before the study began. Funding for the Wagner-Peyser Employment Service also declined over the same time period.
Figure III.3. Trend in national funding for the Adult and Dislocated Worker programs, 2000–2015
Sources: U.S. Department of Labor, Employment and Training Administration. “Training and Employment Programs, Summary of
Budget Authority, FY 1984 to 2012, by Year of Appropriation.” Washington, DC: U.S. Department of Labor, 2014. Available at http://www.doleta.gov/budget/bahist.cfm. Accessed on August 2, 2016. U.S. Department of Labor. “FY 2016 Department of Labor Budget in Brief.” Washington, DC: U.S. Department of Labor, n.d). Available at https://www.dol.gov/sites/default/files/documents/general/budget/2016/FY2016BIB.pdf. Accessed on August 2, 2016.
Note: Dollars are in nominal terms. Fiscal year refers to a federal fiscal year, which runs from October 1 to September 30, and is identified by the year it ends (fiscal year 2014 runs from October 1, 2013, to September 30, 2014). The data exclude special appropriations as part of the American Recovery and Reinvestment Act.
The reduction in funding led study local areas to cut back on the services they offered (D’Amico et al. 2015). About one-third of the study local areas had closed one or more American Job Centers between our visits in 2012 and subsequent follow-up telephone calls in late 2013 or early 2014. These closings resulted in an overall decline of nearly 12 percent in the number of centers in the study local areas. Funding cuts also led to some study local areas reducing centers’ hours of operation and relocating centers to facilities with lower rents. According to administrators at study local areas, funding cuts also led to fewer career counselors, fewer customers enrolling in WIA-funded training, and reductions in supportive services (such as assistance with transportation expenses).
This study presents estimates of the effectiveness of the Adult and Dislocated Worker programs during a period when funding declined despite greater needs due to high unemployment and, specifically, high long-term unemployment. It might be that the programs would have been able to offer more services to customers in the study had there been more funding or the demands on the staff that resulted from high unemployment had been fewer.
1.6
1.7
1.8
1.9
2
2.1
2.2
2.3
2.4
2.5
2.6
Adu
lt an
d D
islo
cate
d W
orke
r pro
gram
s (b
illio
ns o
f dol
lars
)
Fiscal year
29

D. Customer characteristics
The Adult and Dislocated Worker programs serve a range of customers, many of whom have multiple barriers to employment, such as limited work histories or lower education levels. The characteristics of members of the 30-month survey sample (Table III.2) reflect the diversity among intensive service customers and the barriers to employment they faced. Characteristics of the 15-month survey sample and the sample used in the analysis of administrative data are similar. But, because the study included only customers who had been found eligible for intensive services, many of whom were unsuccessful in finding a job with core services alone, the customers in the study were likely more disadvantaged than those who did not move beyond the core service tier and thus, not included in random assignment into the study.
Table III.2. Characteristics of all customers, dislocated workers, and adults in the 30-month survey analysis sample at baseline
All
customers Adults Dislocated
workers
Difference between adults and dislocated
workers
Adult only (%) 58 100 0 100* Dislocated worker only (%) 33 0 79 -79* Both adult and dislocated worker (%) 9 0 21 -21* Female (%) 61 61 60 1 Age at random assignment (%)
18–20 3 5 1 4* 21–24 12 16 6 10* 25–32 19 22 13 9* 33–42 27 27 27 0 43–50 22 15 30 -15* 51 or older 17 14 22 -8*
Race/ethnicity (%) Hispanic 12 14 9 4 White, non-Hispanic 37 34 42 -8 Black, non-Hispanic 44 44 44 1 Asian 3 4 2 2 Native Hawaiian, Pacific Islander, or Native
American 2 2 2 0 Other, or multiple races 2 2 1 1
Primary spoken language is English (%) 95 93 97 -3* Primary spoken language is Spanish (%) 2 3 2 1 Primary spoken language is neither English nor Spanish (%) 3 4 1 3* Marital status (%)
Currently married 28 25 32 -7* Separated, divorced, or widowed 26 24 28 -4* Never married 46 51 40 11*
Working at time of random assignment (%) 2 3 1 2 Employed in past five years (%) 77 67 91 -24* Last real hourly wagea ($) 14.06 12.56 15.65 -3.09*
Last real hourly wage was (%) Less than minimum wage 5 6 3 3 Minimum wage exactly 1 2 0 1 1.01 to 1.29 times the minimum 17 20 12 8* 1.30 to 1.69 times the minimum 20 18 23 -5*
30
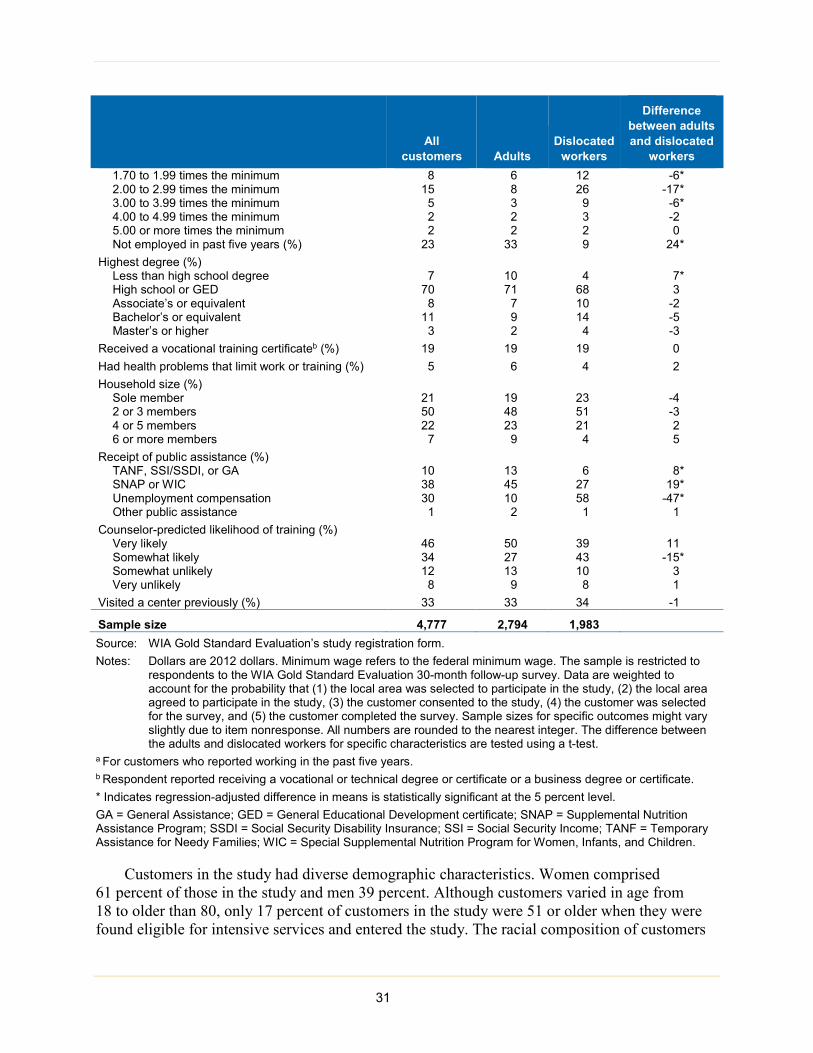
All
customers Adults Dislocated
workers
Difference between adults and dislocated
workers 1.70 to 1.99 times the minimum 8 6 12 -6* 2.00 to 2.99 times the minimum 15 8 26 -17* 3.00 to 3.99 times the minimum 5 3 9 -6* 4.00 to 4.99 times the minimum 2 2 3 -2 5.00 or more times the minimum 2 2 2 0 Not employed in past five years (%) 23 33 9 24*
Highest degree (%) Less than high school degree 7 10 4 7* High school or GED 70 71 68 3 Associate’s or equivalent 8 7 10 -2 Bachelor’s or equivalent 11 9 14 -5 Master’s or higher 3 2 4 -3
Received a vocational training certificateb (%) 19 19 19 0 Had health problems that limit work or training (%) 5 6 4 2 Household size (%)
Sole member 21 19 23 -4 2 or 3 members 50 48 51 -3 4 or 5 members 22 23 21 2 6 or more members 7 9 4 5
Receipt of public assistance (%) TANF, SSI/SSDI, or GA 10 13 6 8* SNAP or WIC 38 45 27 19* Unemployment compensation 30 10 58 -47* Other public assistance 1 2 1 1
Counselor-predicted likelihood of training (%) Very likely 46 50 39 11 Somewhat likely 34 27 43 -15* Somewhat unlikely 12 13 10 3 Very unlikely 8 9 8 1
Visited a center previously (%) 33 33 34 -1
Sample size 4,777 2,794 1,983
Source: WIA Gold Standard Evaluation’s study registration form. Notes: Dollars are 2012 dollars. Minimum wage refers to the federal minimum wage. The sample is restricted to
respondents to the WIA Gold Standard Evaluation 30-month follow-up survey. Data are weighted to account for the probability that (1) the local area was selected to participate in the study, (2) the local area agreed to participate in the study, (3) the customer consented to the study, (4) the customer was selected for the survey, and (5) the customer completed the survey. Sample sizes for specific outcomes might vary slightly due to item nonresponse. All numbers are rounded to the nearest integer. The difference between the adults and dislocated workers for specific characteristics are tested using a t-test.
a For customers who reported working in the past five years. b Respondent reported receiving a vocational or technical degree or certificate or a business degree or certificate. * Indicates regression-adjusted difference in means is statistically significant at the 5 percent level. GA = General Assistance; GED = General Educational Development certificate; SNAP = Supplemental Nutrition Assistance Program; SSDI = Social Security Disability Insurance; SSI = Social Security Income; TANF = Temporary Assistance for Needy Families; WIC = Special Supplemental Nutrition Program for Women, Infants, and Children.
Customers in the study had diverse demographic characteristics. Women comprised 61 percent of those in the study and men 39 percent. Although customers varied in age from 18 to older than 80, only 17 percent of customers in the study were 51 or older when they were found eligible for intensive services and entered the study. The racial composition of customers
31
was also quite diverse, and most customers were racial or ethnic minorities. Only a small proportion (5 percent) of customers in the study did not speak English as a primary language.
Nearly all customers in the study were not working at the time they were randomly assigned, and many faced barriers to employment:
• More than three-fourths (77 percent) of customers had no postsecondary degree. • About one-quarter (23 percent) of customers had not been employed in the five years before
random assignment. • Among those customers who were employed in the five years before they were randomly
assigned, the average wage in the most recent job was about $14 per hour in 2012 dollars. • More than a third of customers (38 percent) reported receiving SNAP or Special
Supplemental Nutrition Program for Women, Infants, and Children (WIC) benefits at the time of random assignment, and 30 percent reported receiving unemployment compensation. Ten percent received TANF, Supplemental Security Income, Social Security Disability Insurance, or General Assistance at that time.
• About 5 percent of customers in the study reported a health problem severe enough to limit their ability to work or enroll in training.
Moreover, many customers had not previously used an American Job Center. About two-thirds (67 percent) of the customers in the study reported that they had not visited an American Job Center previously.
Many customers met the definition of both an adult and dislocated worker (see Chapter I for these definitions), and a local area’s decision of whether to designate them to receive services from the Adult or Dislocated Worker program might have depended on available funding. Just before random assignment of each customer into the study, we asked the intake staff to record whether the customer was considered an adult, a dislocated worker, or both. More than half (58 percent) of all customers were considered adults and 33 percent were considered dislocated workers. The remaining 9 percent of the customers were considered by intake staff as both adults and dislocated workers. Because most dislocated workers also meet the definition of an adult but many adults do not meet the definition of a dislocated worker, we counted a customer whom the intake staff considered to be both an adult and a dislocated worker as a dislocated worker in Table III.2 and the analysis presented in this report.
Compared with adults, dislocated workers were less disadvantaged (Table III.2). On aver-age, dislocated workers were more educated than adults. Only 4 percent of dislocated workers had less than a high school degree, compared with 10 percent of adults. Not surprisingly, given the definition of a dislocated worker, dislocated workers were more likely to have been employed in the five years preceding random assignment (91 percent) than adults (67 percent). The most recent hourly wage earned by dislocated workers (among those who were employed in the five years before random assignment) was about $16 (measured in 2012 dollars); in contrast, the most recent hourly wage of adults was only about $13 (measured in 2012 dollars). Dislocated workers were also, on average, older than adults. For instance, 22 percent of dislocated workers in the study were age 51 or older, compared with 14 percent of adults. Only 7 percent of dislocated workers were ages 18 to 24, whereas 21 percent of adults fell into that range.
32

IV. RECEIPT OF CORE, INTENSIVE, AND SUPPORTIVE SERVICES
During the study, customers were randomly assigned to three different study groups that could potentially receive different sets of services. The restrictions applied for the first 15 months after random assignment, and after that the study did not restrict customers’ access to services. For the first 15 months after random assignment, members of the full-WIA group could potentially receive the full set of WIA services—core, intensive, training, and supportive—as they would have in the absence of the study; members of the core-and-intensive group were offered core and intensive services but not WIA-funded training; and members of the core group were offered core services but not WIA-funded intensive or training services. The study did not change the criteria for who could be offered supportive services (such as assistance with trans-portation expenses), but because half of the local areas tied supportive services to the receipt of intensive or training services, the study did affect whether customers were offered these services.
To understand the impacts of providing WIA-funded intensive services and training on employment outcomes, we examined differences across study groups in their receipt of core, intensive, supportive, and training services. No customer in the study was required to receive any service. In addition, all customers could seek services that were similar to those provided by the Adult and Dislocated Worker programs, but offered elsewhere in the community. These alterna-tive providers of employment services may include other government agencies, community-based organizations, or education facilities. Hence, the difference across study groups in the receipt of services is not the same as the difference in access to the services across study group.
In this chapter, we focus on differences across study groups in the receipt of core, intensive, and supportive services in the 30 months after random assignment. It begins with a summary of the services available to and received by members of each group, including resource rooms, workshops, job clubs, assessments, and one-on-one assistance (Section A). It then examines the differences across study groups in the use of the resource room (Section B), workshops attended (Section C), job clubs attended (Section D), assessments taken (Section E), one-on-one staff assistance received (Section F), supportive services received (Section G), and satisfaction with
Key findings • When WIA-funded services were not available because of the study, many participants instead accessed
other employment services that were available in the community. However, the availability of WIA-funded services increased the receipt of core, intensive, and supportive services.
- Customers in the full-WIA group were more likely than customers in the core-and-intensive group to take assessments. They also spent more time receiving one-on-one assistance than customers in the core-and-intensive group.
- Customers in the core-and-intensive and full-WIA groups were more likely to receive core and intensive services—workshops, assessments, and one-on-one assistance—than customers in the core group.
- Customers in the full-WIA group were also more likely to use a resource room than customers in the core group.
- Customers in the full-WIA group were more likely to receive supportive services than customers in the core-and-intensive group, who in turn were more likely than customers in the core group to receive supportive services.
• More than 70 percent of customers in the full-WIA group were either very or somewhat satisfied with their experience at an American Job Center.
33
the American Job Center (Section H). In Section I, we discuss the findings separately for adults and dislocated workers. We discuss customers’ receipt of training services in the following chapter (Chapter V).
A. Summary of the services available to and received by members of each group
Although most local areas in the study offered a similar set of services—use of a resource room, workshops, job clubs, assessments, one-on-one assistance, and supportive services—the exact set of services offered to members of each study group varied by local area (Table IV.1). For example, some local areas provided WIA-funded supportive services and job clubs, whereas others did not, and one local area did not offer any core or intensive workshops. Whether the service received by the customer was an intensive or core service sometimes also varied slightly by local area. A service classified by some local areas as an intensive service could be classified by other local areas as a core service. For example, 8 local areas offered basic skills assessments, such as the TABE, in the resource room as a core service, whereas the other 20 offered it only as an intensive service. Reflecting differences across local areas in how they classify services, we focus on measuring specific services received without distinguishing whether the service was classified as core or intensive. However, every local area in the study offered customers in the core-and-intensive group more services than they offered to customers in the core group.
We examined the services customers in the study received in the period starting from the time they were randomly assigned, which occurred after a customer requested and was determined to be eligible for intensive services, through 30 months after random assignment. Before random assignment, customers would have received at least one core service from an American Job Center. In fact, many local areas required customers to use the American Job Center’s resource room to look for jobs before they could pursue intensive services.
The study’s 15- and 30-month follow-up surveys provide a rich description of the services received by customers. The surveys asked customers about their use of six types of core and intensive services—a resource room, workshops, job clubs, assessments, one-on-one staff assis-tance, and supportive services (Table IV.1)—as well as enrollment in training. The 15-month survey asked respondents about receipt of services in the 15 months after random assignment. The 30-month survey asked those who had responded to the 15-month survey about receipt of services since that survey, at which time all study participants could potentially receive any WIA-funded service they would have been eligible for in the absence of the study. The 30-month survey asked those who did not respond to the 15-month survey about receipt of services received since random assignment. Because the study restricted access to services only in the first 15 months after random assignment, responses to the 30-month survey are important for determining whether customers in the core-and-intensive and core groups later pursued WIA-funded services they were denied in the first 15 months. Both surveys asked about the receipt of these services at an American Job Center and elsewhere in the community.
Mirroring findings from the analysis of intensive and core service receipt 15 months after random assignment (McConnell et al. 2016), in general, random assignment to a group with access to higher tiers of WIA-funded services increased customers’ receipt of core, intensive, and supportive services, either at an American Job Center or elsewhere in the 30 months after
34
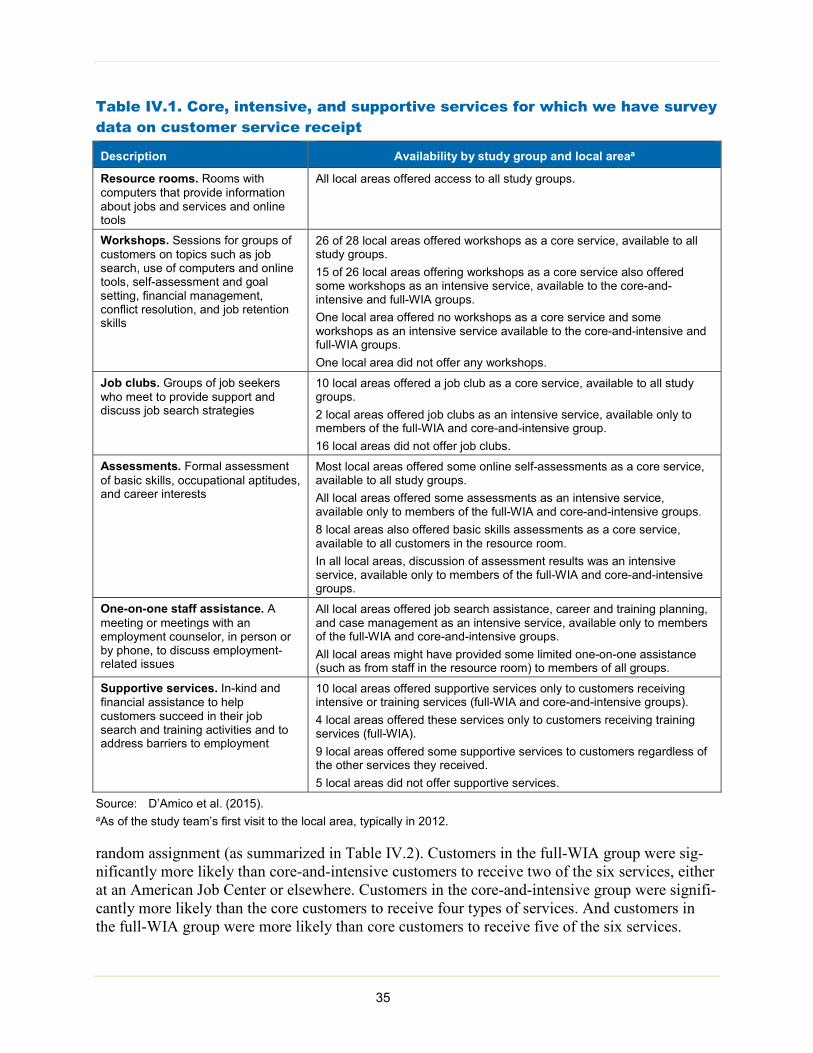
Table IV.1. Core, intensive, and supportive services for which we have survey data on customer service receipt
Description Availability by study group and local areaa
Resource rooms. Rooms with computers that provide information about jobs and services and online tools
All local areas offered access to all study groups.
Workshops. Sessions for groups of customers on topics such as job search, use of computers and online tools, self-assessment and goal setting, financial management, conflict resolution, and job retention skills
26 of 28 local areas offered workshops as a core service, available to all study groups. 15 of 26 local areas offering workshops as a core service also offered some workshops as an intensive service, available to the core-and-intensive and full-WIA groups. One local area offered no workshops as a core service and some workshops as an intensive service available to the core-and-intensive and full-WIA groups. One local area did not offer any workshops.
Job clubs. Groups of job seekers who meet to provide support and discuss job search strategies
10 local areas offered a job club as a core service, available to all study groups. 2 local areas offered job clubs as an intensive service, available only to members of the full-WIA and core-and-intensive group. 16 local areas did not offer job clubs.
Assessments. Formal assessment of basic skills, occupational aptitudes, and career interests
Most local areas offered some online self-assessments as a core service, available to all study groups. All local areas offered some assessments as an intensive service, available only to members of the full-WIA and core-and-intensive groups. 8 local areas also offered basic skills assessments as a core service, available to all customers in the resource room. In all local areas, discussion of assessment results was an intensive service, available only to members of the full-WIA and core-and-intensive groups.
One-on-one staff assistance. A meeting or meetings with an employment counselor, in person or by phone, to discuss employment-related issues
All local areas offered job search assistance, career and training planning, and case management as an intensive service, available only to members of the full-WIA and core-and-intensive groups. All local areas might have provided some limited one-on-one assistance (such as from staff in the resource room) to members of all groups.
Supportive services. In-kind and financial assistance to help customers succeed in their job search and training activities and to address barriers to employment
10 local areas offered supportive services only to customers receiving intensive or training services (full-WIA and core-and-intensive groups). 4 local areas offered these services only to customers receiving training services (full-WIA). 9 local areas offered some supportive services to customers regardless of the other services they received. 5 local areas did not offer supportive services.
Source: D’Amico et al. (2015). aAs of the study team’s first visit to the local area, typically in 2012.
random assignment (as summarized in Table IV.2). Customers in the full-WIA group were sig-nificantly more likely than core-and-intensive customers to receive two of the six services, either at an American Job Center or elsewhere. Customers in the core-and-intensive group were signifi-cantly more likely than the core customers to receive four types of services. And customers in the full-WIA group were more likely than core customers to receive five of the six services.
35
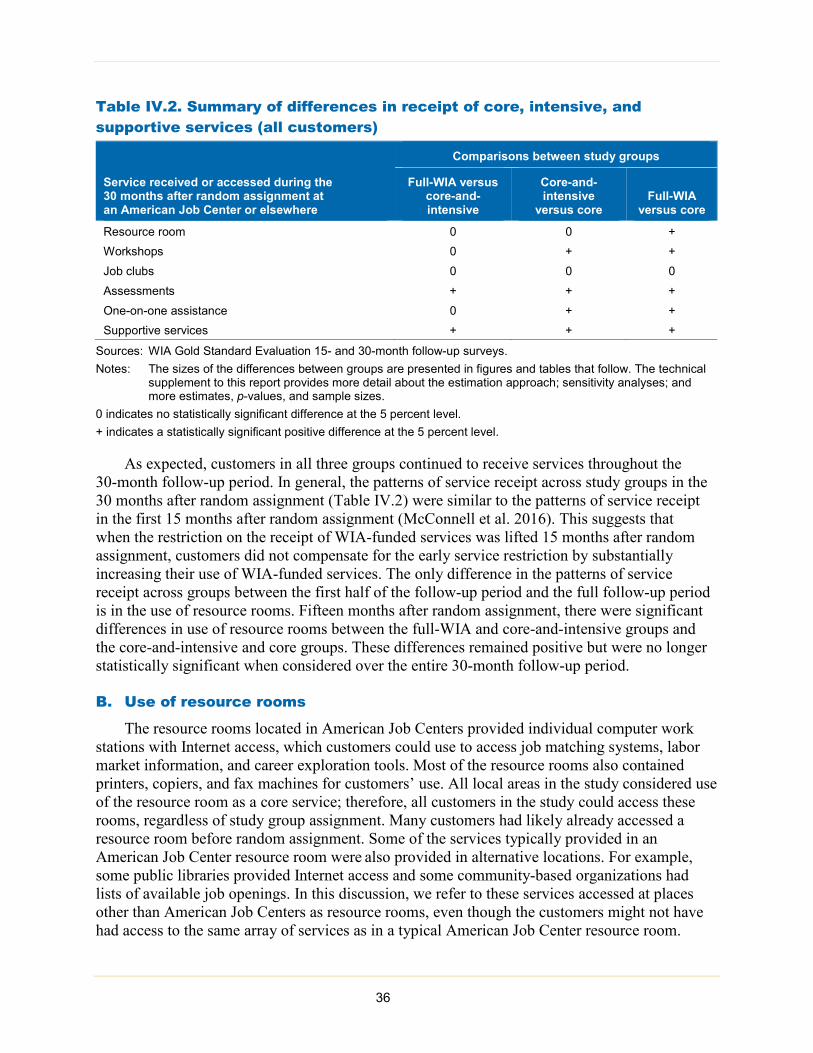
Table IV.2. Summary of differences in receipt of core, intensive, and supportive services (all customers)
Service received or accessed during the 30 months after random assignment at an American Job Center or elsewhere
Comparisons between study groups
Full-WIA versus core-and- intensive
Core-and-intensive
versus core Full-WIA
versus core
Resource room 0 0 + Workshops 0 + + Job clubs 0 0 0 Assessments + + + One-on-one assistance 0 + + Supportive services + + +
Sources: WIA Gold Standard Evaluation 15- and 30-month follow-up surveys. Notes: The sizes of the differences between groups are presented in figures and tables that follow. The technical
supplement to this report provides more detail about the estimation approach; sensitivity analyses; and more estimates, p-values, and sample sizes.
0 indicates no statistically significant difference at the 5 percent level. + indicates a statistically significant positive difference at the 5 percent level.
As expected, customers in all three groups continued to receive services throughout the 30-month follow-up period. In general, the patterns of service receipt across study groups in the 30 months after random assignment (Table IV.2) were similar to the patterns of service receipt in the first 15 months after random assignment (McConnell et al. 2016). This suggests that when the restriction on the receipt of WIA-funded services was lifted 15 months after random assignment, customers did not compensate for the early service restriction by substantially increasing their use of WIA-funded services. The only difference in the patterns of service receipt across groups between the first half of the follow-up period and the full follow-up period is in the use of resource rooms. Fifteen months after random assignment, there were significant differences in use of resource rooms between the full-WIA and core-and-intensive groups and the core-and-intensive and core groups. These differences remained positive but were no longer statistically significant when considered over the entire 30-month follow-up period.
B. Use of resource rooms
The resource rooms located in American Job Centers provided individual computer work stations with Internet access, which customers could use to access job matching systems, labor market information, and career exploration tools. Most of the resource rooms also contained printers, copiers, and fax machines for customers’ use. All local areas in the study considered use of the resource room as a core service; therefore, all customers in the study could access these rooms, regardless of study group assignment. Many customers had likely already accessed a resource room before random assignment. Some of the services typically provided in an American Job Center resource room were also provided in alternative locations. For example, some public libraries provided Internet access and some community-based organizations had lists of available job openings. In this discussion, we refer to these services accessed at places other than American Job Centers as resource rooms, even though the customers might not have had access to the same array of services as in a typical American Job Center resource room.
36
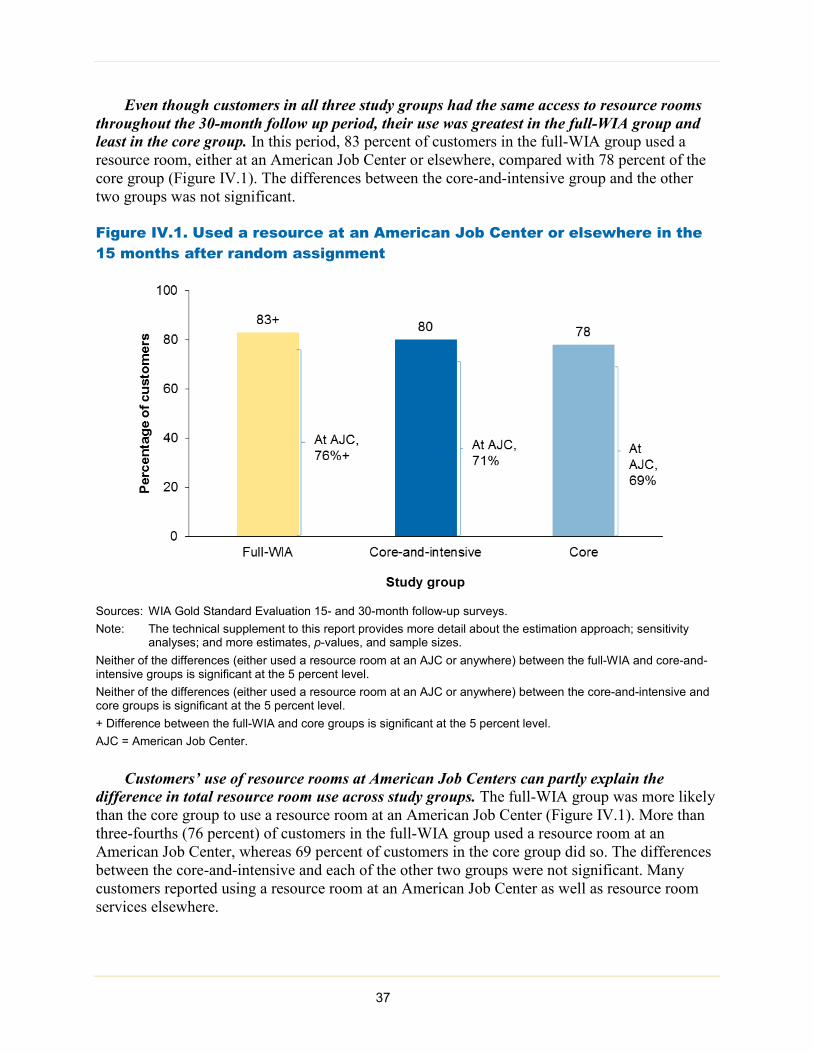
Even though customers in all three study groups had the same access to resource rooms throughout the 30-month follow up period, their use was greatest in the full-WIA group and least in the core group. In this period, 83 percent of customers in the full-WIA group used a resource room, either at an American Job Center or elsewhere, compared with 78 percent of the core group (Figure IV.1). The differences between the core-and-intensive group and the other two groups was not significant.
Figure IV.1. Used a resource at an American Job Center or elsewhere in the 15 months after random assignment
Sources: WIA Gold Standard Evaluation 15- and 30-month follow-up surveys. Note: The technical supplement to this report provides more detail about the estimation approach; sensitivity
analyses; and more estimates, p-values, and sample sizes. Neither of the differences (either used a resource room at an AJC or anywhere) between the full-WIA and core-and-intensive groups is significant at the 5 percent level. Neither of the differences (either used a resource room at an AJC or anywhere) between the core-and-intensive and core groups is significant at the 5 percent level. + Difference between the full-WIA and core groups is significant at the 5 percent level. AJC = American Job Center.
Customers’ use of resource rooms at American Job Centers can partly explain the difference in total resource room use across study groups. The full-WIA group was more likely than the core group to use a resource room at an American Job Center (Figure IV.1). More than three-fourths (76 percent) of customers in the full-WIA group used a resource room at an American Job Center, whereas 69 percent of customers in the core group did so. The differences between the core-and-intensive and each of the other two groups were not significant. Many customers reported using a resource room at an American Job Center as well as resource room services elsewhere.
37

Full-WIA customers were less likely than core-and-intensive customers to use resource rooms at alternative locations. Among full-WIA customers, 46 percent used a resource room at an alternative location, compared with 50 percent of core-and-intensive customers (Appendix C of the technical supplement, Table C.IV.1). The differences between the core group and each of the other two groups were not significant.
C. Workshops attended
Workshops offered at American Job Centers provided instruction on job search and employment-related skills, such as how to apply for a job, develop a résumé, manage stress, and maintain employment. Depending on the local area, workshops could be categorized as either core or intensive services. The content and even duration of workshops categorized as core and intensive were fairly similar (D’Amico et al. 2015). Fifteen local areas provided both core and intensive workshops, 11 provided only core workshops, and one provided only intensive workshops. One local area provided no workshops.
In the 30-month period after random assignment, members of the full-WIA and core-and-intensive groups were about equally likely to attend a workshop at any location, but both of these groups were more likely than core group members to attend workshops. About 55 percent of full-WIA and 52 percent of core-and-intensive customers attended at least one workshop, whereas only 46 percent of the core group attended at least one workshop (Figure IV.2). This pattern of workshop attendance was partially driven by full-WIA and core-and-intensive customers being more likely than core customers to attend workshops at an American Job Center. About 47 percent of full-WIA customers and 44 percent of core-and-intensive customers attended a workshop at an American Job Center, compared with 38 percent of customers in the core group (Figure IV.2). Rates of attending workshops elsewhere were similar across groups, ranging from 18 to 20 percent (Appendix C of the technical supplement, Table C.IV.2a).
38

Figure IV.2. Attended a workshop at an American Job Center or elsewhere (all customers)
Sources: WIA Gold Standard Evaluation 15- and 30-month follow-up surveys. Note: The technical supplement to this report provides more detail about the estimation approach; sensitivity
analyses; and more estimates, p-values, and sample sizes. Neither of the differences (either attended a workshop at an AJC or attended a workshop anywhere) between the full-WIA and core-and-intensive groups is significant at the 5 percent level. ^ Difference between the core-and-intensive and core groups is significant at the 5 percent level. + Difference between the full-WIA and core groups is significant at the 5 percent level. AJC = American Job Center.
Customers who attended at least one workshop after random assignment attended about four workshops, on average (Appendix C of the technical supplement, Table C.IV.2b); this did not differ significantly across study groups. Among those customers who attended a workshop during the 30 months after random assignment, customers in the full-WIA and core-and-intensive groups were more likely than customers in the core group to attend workshops on preparing for assessments and starting a business, and full-WIA customers were more likely than core customers to attend a workshop on computer skills and appropriate job behavior (Appendix C of the technical supplement, Table C.IV.3).
D. Job clubs attended
Job clubs provide an opportunity for customers to meet with other job seekers to discuss job leads and search strategies. They are sometimes facilitated by an employment counselor. Ten local areas considered job clubs a core service, though 2 offered them as intensive services, and the other 16 local areas did not offer job clubs (D’Amico et al. 2015).
39

Figure IV.3. Participated in a job club at an American Job Center or elsewhere (all customers)
Sources: WIA Gold Standard Evaluation 15- and 30-month follow-up surveys. Note: The technical supplement to this report provides more detail about the estimation approach; sensitivity
analyses; and more estimates, p-values, and sample sizes. Neither of the differences (either participated in a job club at an AJC or participated in a job club anywhere) between any two groups is significant at the 5 percent level. AJC = American Job Center.
E. Assessments taken
Local areas offered formal assessments of skills, abilities, and aptitudes. The most frequently offered tests were the TABE and WorkKeys; others included Prove It!, Aztec, and Comprehensive Adult Student Assessment Systems (D’Amico et al. 2015). Eight local areas provided access to online basic skills assessments to all customers as a core service, but the other local areas considered assessments to be an intensive service.
In the 30 months following random assignment, full-WIA customers were more likely than core-and-intensive and core customers to take an assessment at any location, and core-and-intensive customers were more likely than core customers to take an assessment at any location (Figure IV.4). Among the full-WIA group, 75 percent of customers took an assessment at an American Job Center or elsewhere, compared with 67 percent of core-and-intensive customers and 60 percent of core customers.
40
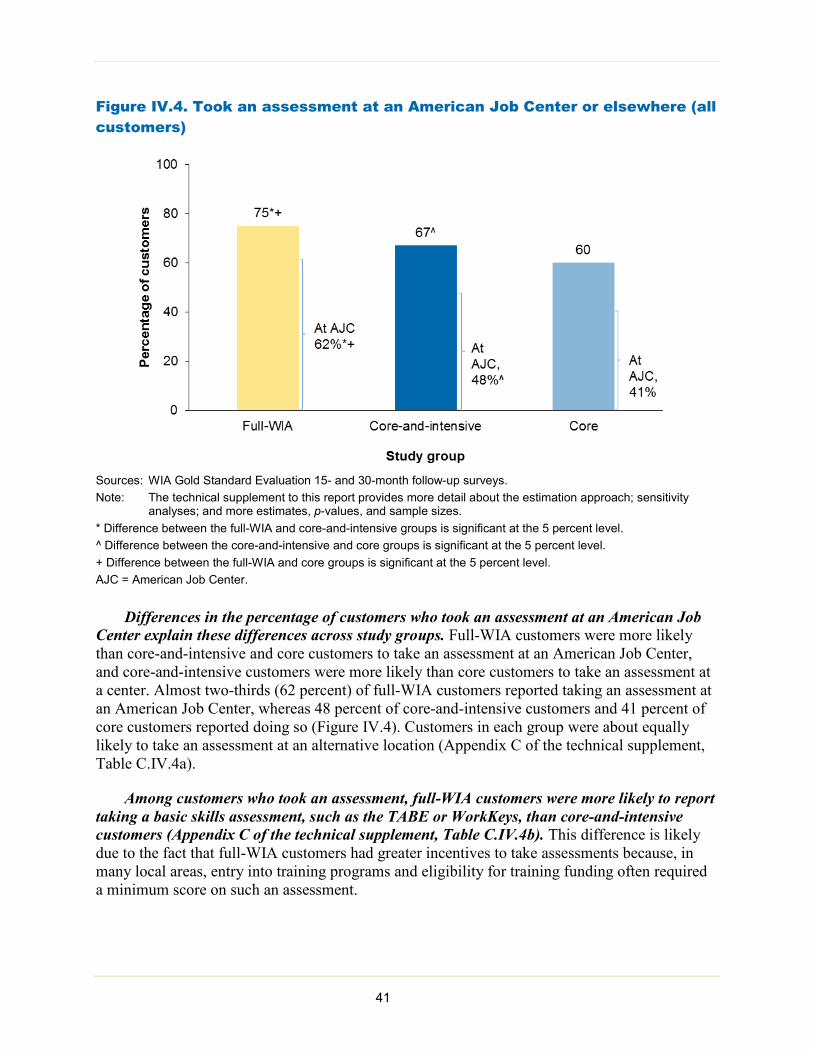
Figure IV.4. Took an assessment at an American Job Center or elsewhere (all customers)
Sources: WIA Gold Standard Evaluation 15- and 30-month follow-up surveys. Note: The technical supplement to this report provides more detail about the estimation approach; sensitivity
analyses; and more estimates, p-values, and sample sizes. * Difference between the full-WIA and core-and-intensive groups is significant at the 5 percent level. ^ Difference between the core-and-intensive and core groups is significant at the 5 percent level. + Difference between the full-WIA and core groups is significant at the 5 percent level. AJC = American Job Center.
Differences in the percentage of customers who took an assessment at an American Job Center explain these differences across study groups. Full-WIA customers were more likely than core-and-intensive and core customers to take an assessment at an American Job Center, and core-and-intensive customers were more likely than core customers to take an assessment at a center. Almost two-thirds (62 percent) of full-WIA customers reported taking an assessment at an American Job Center, whereas 48 percent of core-and-intensive customers and 41 percent of core customers reported doing so (Figure IV.4). Customers in each group were about equally likely to take an assessment at an alternative location (Appendix C of the technical supplement, Table C.IV.4a).
Among customers who took an assessment, full-WIA customers were more likely to report taking a basic skills assessment, such as the TABE or WorkKeys, than core-and-intensive customers (Appendix C of the technical supplement, Table C.IV.4b). This difference is likely due to the fact that full-WIA customers had greater incentives to take assessments because, in many local areas, entry into training programs and eligibility for training funding often required a minimum score on such an assessment.
41
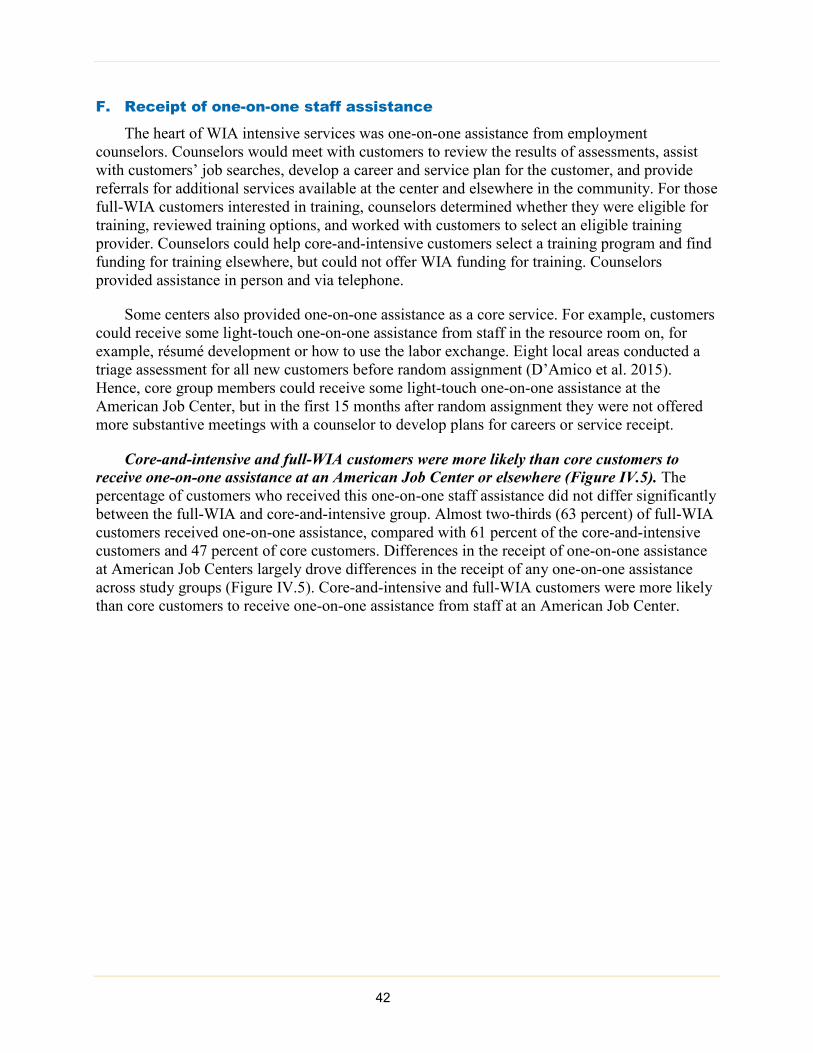
F. Receipt of one-on-one staff assistance
The heart of WIA intensive services was one-on-one assistance from employment counselors. Counselors would meet with customers to review the results of assessments, assist with customers’ job searches, develop a career and service plan for the customer, and provide referrals for additional services available at the center and elsewhere in the community. For those full-WIA customers interested in training, counselors determined whether they were eligible for training, reviewed training options, and worked with customers to select an eligible training provider. Counselors could help core-and-intensive customers select a training program and find funding for training elsewhere, but could not offer WIA funding for training. Counselors provided assistance in person and via telephone.
Some centers also provided one-on-one assistance as a core service. For example, customers could receive some light-touch one-on-one assistance from staff in the resource room on, for example, résumé development or how to use the labor exchange. Eight local areas conducted a triage assessment for all new customers before random assignment (D’Amico et al. 2015). Hence, core group members could receive some light-touch one-on-one assistance at the American Job Center, but in the first 15 months after random assignment they were not offered more substantive meetings with a counselor to develop plans for careers or service receipt.
Core-and-intensive and full-WIA customers were more likely than core customers to receive one-on-one assistance at an American Job Center or elsewhere (Figure IV.5). The percentage of customers who received this one-on-one staff assistance did not differ significantly between the full-WIA and core-and-intensive group. Almost two-thirds (63 percent) of full-WIA customers received one-on-one assistance, compared with 61 percent of the core-and-intensive customers and 47 percent of core customers. Differences in the receipt of one-on-one assistance at American Job Centers largely drove differences in the receipt of any one-on-one assistance across study groups (Figure IV.5). Core-and-intensive and full-WIA customers were more likely than core customers to receive one-on-one assistance from staff at an American Job Center.
42
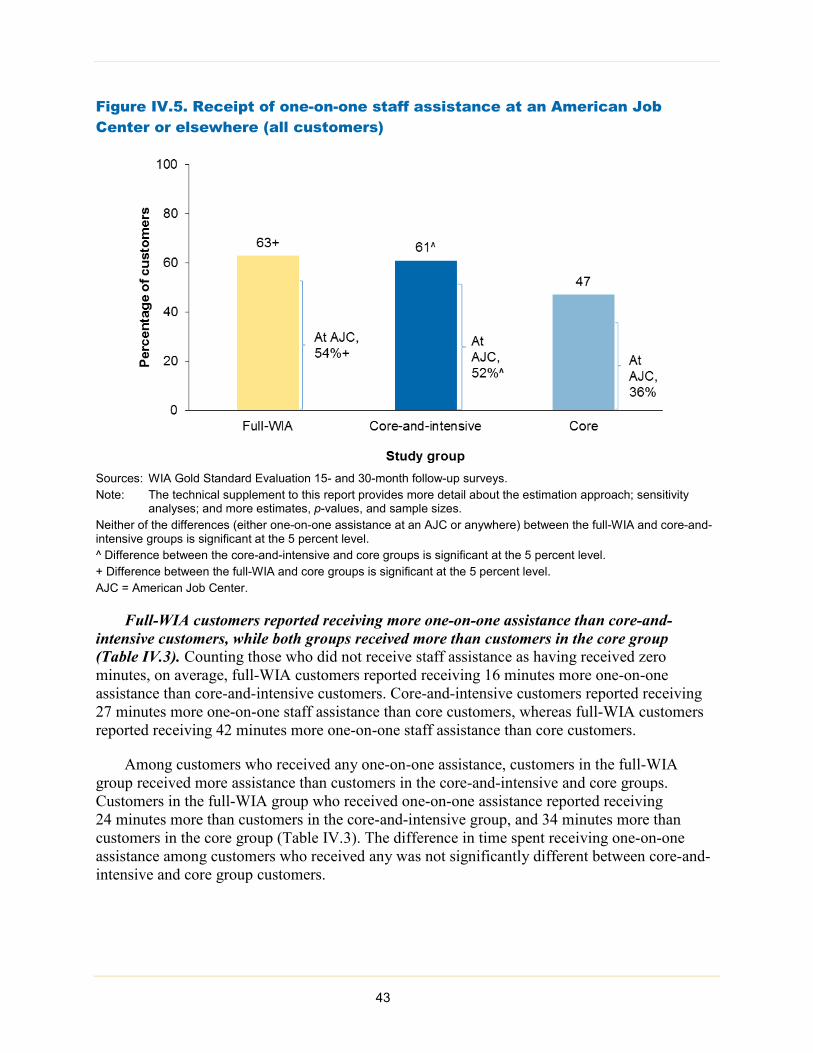
Figure IV.5. Receipt of one-on-one staff assistance at an American Job Center or elsewhere (all customers)
Sources: WIA Gold Standard Evaluation 15- and 30-month follow-up surveys. Note: The technical supplement to this report provides more detail about the estimation approach; sensitivity
analyses; and more estimates, p-values, and sample sizes. Neither of the differences (either one-on-one assistance at an AJC or anywhere) between the full-WIA and core-and-intensive groups is significant at the 5 percent level. ^ Difference between the core-and-intensive and core groups is significant at the 5 percent level. + Difference between the full-WIA and core groups is significant at the 5 percent level. AJC = American Job Center.
Full-WIA customers reported receiving more one-on-one assistance than core-and-intensive customers, while both groups received more than customers in the core group (Table IV.3). Counting those who did not receive staff assistance as having received zero minutes, on average, full-WIA customers reported receiving 16 minutes more one-on-one assistance than core-and-intensive customers. Core-and-intensive customers reported receiving 27 minutes more one-on-one staff assistance than core customers, whereas full-WIA customers reported receiving 42 minutes more one-on-one staff assistance than core customers.
Among customers who received any one-on-one assistance, customers in the full-WIA group received more assistance than customers in the core-and-intensive and core groups. Customers in the full-WIA group who received one-on-one assistance reported receiving 24 minutes more than customers in the core-and-intensive group, and 34 minutes more than customers in the core group (Table IV.3). The difference in time spent receiving one-on-one assistance among customers who received any was not significantly different between core-and-intensive and core group customers.
43
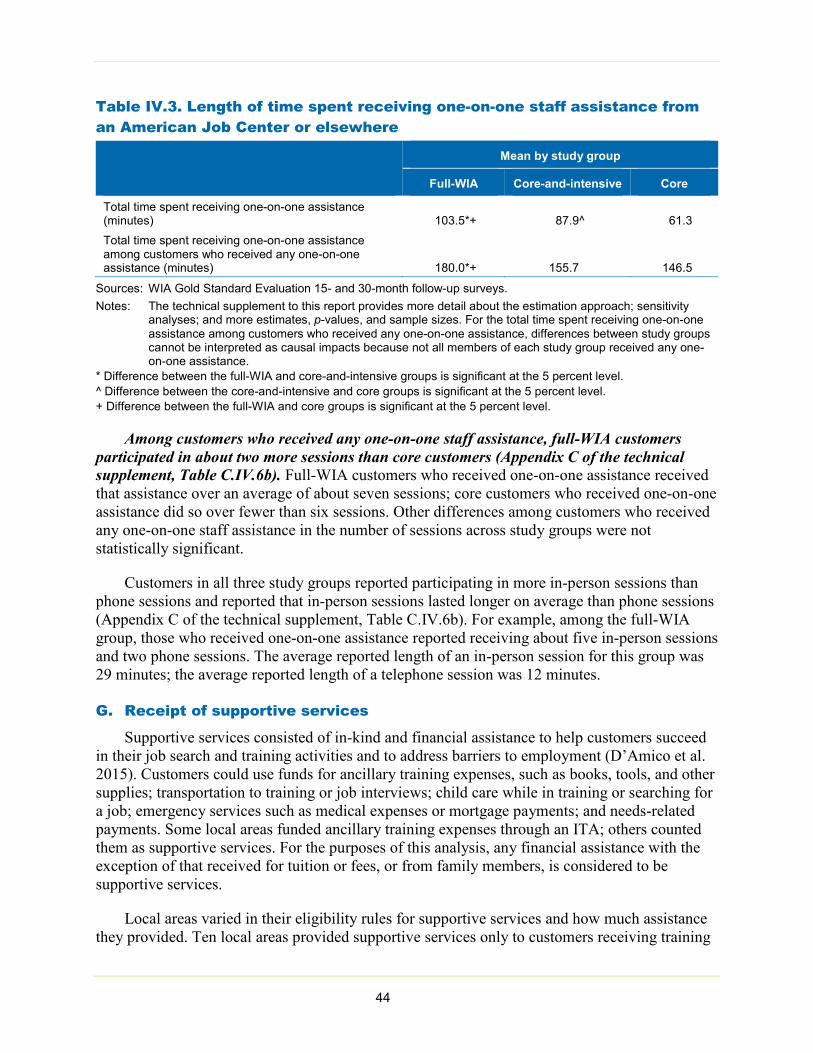
Table IV.3. Length of time spent receiving one-on-one staff assistance from an American Job Center or elsewhere
Mean by study group
Full-WIA Core-and-intensive Core
Total time spent receiving one-on-one assistance (minutes) 103.5*+ 87.9^ 61.3 Total time spent receiving one-on-one assistance among customers who received any one-on-one assistance (minutes) 180.0*+ 155.7 146.5
Sources: WIA Gold Standard Evaluation 15- and 30-month follow-up surveys. Notes: The technical supplement to this report provides more detail about the estimation approach; sensitivity
analyses; and more estimates, p-values, and sample sizes. For the total time spent receiving one-on-one assistance among customers who received any one-on-one assistance, differences between study groups cannot be interpreted as causal impacts because not all members of each study group received any one-on-one assistance.
* Difference between the full-WIA and core-and-intensive groups is significant at the 5 percent level. ^ Difference between the core-and-intensive and core groups is significant at the 5 percent level. + Difference between the full-WIA and core groups is significant at the 5 percent level.
Among customers who received any one-on-one staff assistance, full-WIA customers participated in about two more sessions than core customers (Appendix C of the technical supplement, Table C.IV.6b). Full-WIA customers who received one-on-one assistance received that assistance over an average of about seven sessions; core customers who received one-on-one assistance did so over fewer than six sessions. Other differences among customers who received any one-on-one staff assistance in the number of sessions across study groups were not statistically significant.
Customers in all three study groups reported participating in more in-person sessions than phone sessions and reported that in-person sessions lasted longer on average than phone sessions (Appendix C of the technical supplement, Table C.IV.6b). For example, among the full-WIA group, those who received one-on-one assistance reported receiving about five in-person sessions and two phone sessions. The average reported length of an in-person session for this group was 29 minutes; the average reported length of a telephone session was 12 minutes.
G. Receipt of supportive services
Supportive services consisted of in-kind and financial assistance to help customers succeed in their job search and training activities and to address barriers to employment (D’Amico et al. 2015). Customers could use funds for ancillary training expenses, such as books, tools, and other supplies; transportation to training or job interviews; child care while in training or searching for a job; emergency services such as medical expenses or mortgage payments; and needs-related payments. Some local areas funded ancillary training expenses through an ITA; others counted them as supportive services. For the purposes of this analysis, any financial assistance with the exception of that received for tuition or fees, or from family members, is considered to be supportive services.
Local areas varied in their eligibility rules for supportive services and how much assistance they provided. Ten local areas provided supportive services only to customers receiving training
44

or intensive services, and four provided supportive services only to customers receiving training. Nine local areas provided assistance to customers even if they did not receive intensive or training services, although this assistance was typically not more than a few hundred dollars. In all local areas, staff would refer customers to other community providers of supportive services. Five local areas relied solely on these referrals and did not offer any WIA-funded supportive services (D’Amico et al. 2015).
Reflecting the fact that supportive services were often tied to training, full-WIA customers were more likely than the core-and-intensive customers to receive supportive services, who in turn were more likely to receive them than core customers (Figure IV.6). About 25 percent of customers in the full-WIA group received supportive services from either the American Job Center or elsewhere, whereas 14 percent of core-and-intensive and 8 percent of core customers did so.
Figure IV.6. Receipt of supportive services from an American Job Center or elsewhere (all customers)
Sources: WIA Gold Standard Evaluation 15- and 30-month follow-up surveys. Note: The technical supplement to this report provides more detail about the estimation approach; sensitivity
analyses; and more estimates, p-values, and sample sizes. * Difference between the full-WIA and core-and-intensive groups is significant at the 5 percent level. ^ Difference between the core-and-intensive and core groups is significant at the 5 percent level. + Difference between the full-WIA and core groups is significant at the 5 percent level. AJC = American Job Center.
45

These differences were driven by full-WIA customers being more likely to receive supportive services from an American Job Center than core-and-intensive customers, who were in turn more likely to receive supportive services from an American Job Center than were core customers. Center partners, such as community health networks and local public assistance offices, might have funded some of the supportive services that customers reported as receiving from an American Job Center. There were no differences in supportive service receipt from sources beyond those provided by American Job Centers (Appendix C of the technical supplement, Table C.IV.7).
Full-WIA customers received more supportive services than customers in either the core-and-intensive or the core group. Customers in the full-WIA group reported receiving $264 in the 30 months since random assignment, compared with the $126 reported by core-and-intensive customers, and the $99 reported by core customers (Table IV.4). Full-WIA customers received $186 from an American Job Center on average, whereas core-and-intensive customers received $81 and core customers received $17. Of the differences in supportive services received at an American Job Center, only that between the core customers and each of the other groups are significant.
Table IV.4. Total financial assistance received since random assignment (all customers)
Mean by study group
Full-WIA Core-and-intensive Core
Total financial assistance received, other than for training ($) 264*+ 126 99 Amount of financial assistance received from an AJC ($) 186+ 81^ 17
Sources: WIA Gold Standard Evaluation 15- and 30-month follow-up surveys. Note: The technical supplement to this report provides more detail about the estimation approach; sensitivity
analyses; and more estimates, p-values, and sample sizes. * Difference between the full-WIA and core-and-intensive groups is significant at the 5 percent level. ^ Difference between the core-and-intensive and core groups is significant at the 5 percent level. + Difference between the full-WIA and core groups is significant at the 5 percent level. AJC = American Job Center.
The most common type of supportive services received from any source among each group, as reported on the survey, was transportation, followed by clothes and uniforms, tools and supplies, and books (Appendix C of the technical supplement, Table C.IV.7). Among the full-WIA group, 19 percent reported receiving funds to assist with transportation (such as bus passes or gas cards), 9 percent reported receiving funds to assist with clothing or uniforms, 10 percent reported receiving funds to help purchase books, and 10 percent reported receiving funds to help purchase tools or supplies. Among the core-and-intensive and core customers, use of funds for clothes and uniforms was more common than for books, tools, and supplies.
H. Differences in satisfaction with the American Job Center experience
In addition to asking about service receipt at an American Job Center or elsewhere, the 15- and 30- month surveys also asked customers if they were very satisfied, somewhat satisfied, some-what dissatisfied, or very dissatisfied with their overall experience at the American Job Center.
46
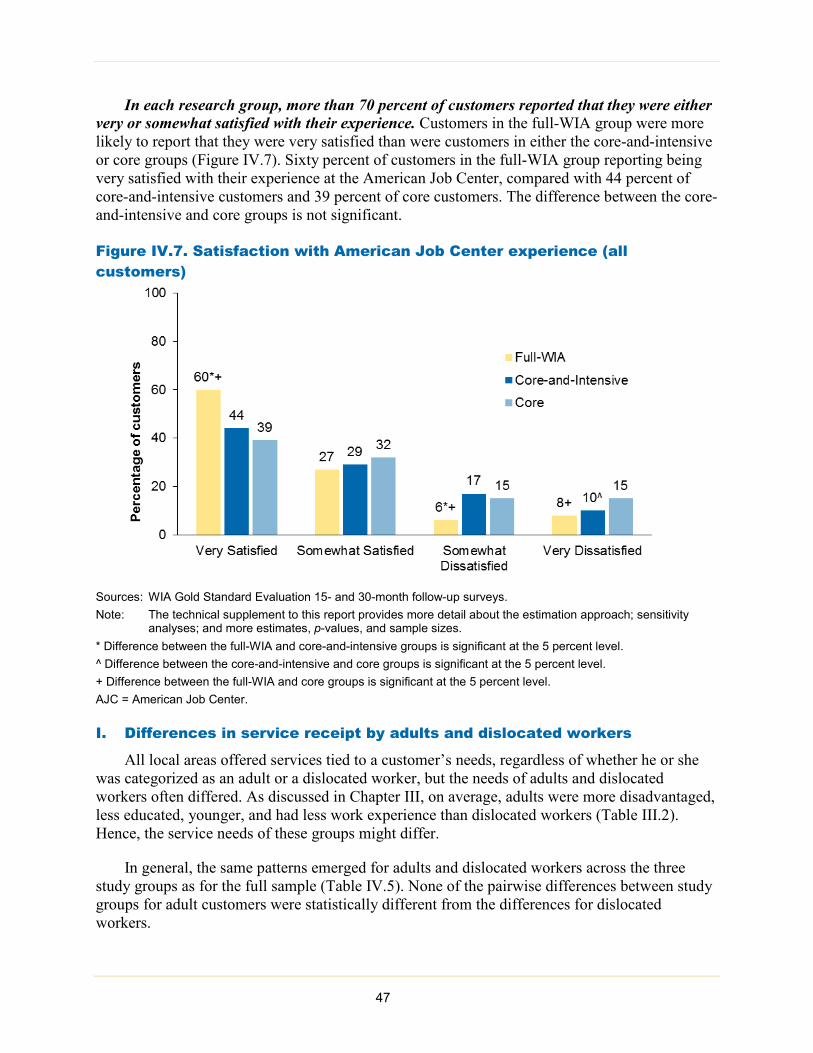
In each research group, more than 70 percent of customers reported that they were either very or somewhat satisfied with their experience. Customers in the full-WIA group were more likely to report that they were very satisfied than were customers in either the core-and-intensive or core groups (Figure IV.7). Sixty percent of customers in the full-WIA group reporting being very satisfied with their experience at the American Job Center, compared with 44 percent of core-and-intensive customers and 39 percent of core customers. The difference between the core-and-intensive and core groups is not significant.
Figure IV.7. Satisfaction with American Job Center experience (all customers)
Sources: WIA Gold Standard Evaluation 15- and 30-month follow-up surveys. Note: The technical supplement to this report provides more detail about the estimation approach; sensitivity
analyses; and more estimates, p-values, and sample sizes. * Difference between the full-WIA and core-and-intensive groups is significant at the 5 percent level. ^ Difference between the core-and-intensive and core groups is significant at the 5 percent level. + Difference between the full-WIA and core groups is significant at the 5 percent level. AJC = American Job Center.
I. Differences in service receipt by adults and dislocated workers
All local areas offered services tied to a customer’s needs, regardless of whether he or she was categorized as an adult or a dislocated worker, but the needs of adults and dislocated workers often differed. As discussed in Chapter III, on average, adults were more disadvantaged, less educated, younger, and had less work experience than dislocated workers (Table III.2). Hence, the service needs of these groups might differ.
In general, the same patterns emerged for adults and dislocated workers across the three study groups as for the full sample (Table IV.5). None of the pairwise differences between study groups for adult customers were statistically different from the differences for dislocated workers.
47
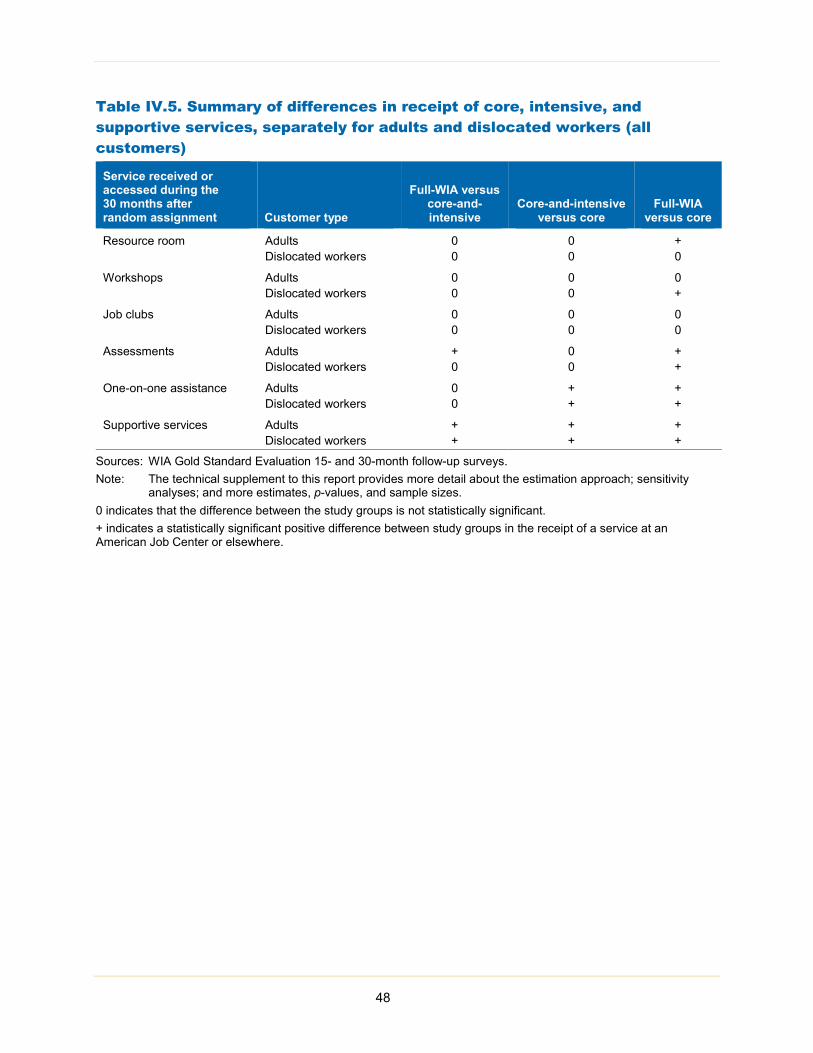
Table IV.5. Summary of differences in receipt of core, intensive, and supportive services, separately for adults and dislocated workers (all customers)
Service received or accessed during the 30 months after random assignment Customer type
Full-WIA versus core-and- intensive
Core-and-intensive versus core
Full-WIA versus core
Resource room Adults 0 0 + Dislocated workers 0 0 0
Workshops Adults 0 0 0 Dislocated workers 0 0 +
Job clubs Adults 0 0 0 Dislocated workers 0 0 0
Assessments Adults + 0 + Dislocated workers 0 0 +
One-on-one assistance Adults 0 + + Dislocated workers 0 + +
Supportive services Adults + + + Dislocated workers + + +
Sources: WIA Gold Standard Evaluation 15- and 30-month follow-up surveys. Note: The technical supplement to this report provides more detail about the estimation approach; sensitivity
analyses; and more estimates, p-values, and sample sizes. 0 indicates that the difference between the study groups is not statistically significant. + indicates a statistically significant positive difference between study groups in the receipt of a service at an American Job Center or elsewhere.
48
V. RECEIPT OF TRAINING SERVICES
Training services were the last of the three tiers of services offered by the Adult and Dislocated Worker programs. Training funded by the Adult and Dislocated Worker programs was offered only to customers who met local area-specific eligibility requirements, had received services from both the core and intensive services tiers, and were unable to find a job that led to self-sufficiency. Local areas offered occupational skills training, upgrading, or retraining and could offer adult basic education if combined with other training services. A few local areas also offered entrepreneurial training.
To maximize customers’ choices, WIA required most training services to be funded through ITAs, vouchers that customers could use to procure training from a variety of approved provid-ers. Some local areas allowed customers to enroll in a wide range of training programs using an ITA, whereas others narrowed customers’ training options to those geared toward particularly high-growth occupations, such as health care occupations or truck driving. Most local areas also offered on-the-job training, in which a portion of customers’ wages were subsidized as they learned skills while working (to compensate employers for lower productivity while workers obtained skills); on-the-job training relied on contracts with employers rather than ITAs. In addition, local areas could customize training for current or prospective employees at a specific business.
Program staff were permitted to offer training services funded by the Adult and Dislocated Worker programs to customers randomly assigned to the full-WIA group throughout the 30-month follow-up period, subject to any usual local area policies. They offered training to full-WIA customers who were interested in training, met the local area criteria for training eligibility, and completed a set of required activities before their training plan was approved, just as they would have in the absence of the study. However, program staff could not offer WIA-funded training to members of the core-and-intensive and core groups during the first 15 months after random assignment. After this initial period, the restrictions on providing WIA-funded training
Key findings • About half of the customers in the full-WIA group enrolled in a training program during the 30 months after
random assignment. Among full-WIA customers who enrolled in training, 79 percent completed at least one program, and 60 percent received a credential. On average, full-WIA group members who enrolled in training spent nearly 800 hours in training over just less than 9 months.
• Providing WIA-funded training significantly increased the proportion of customers who enrolled in a training program during the 30 months after random assignment by 9 to 16 percentage points. It increased the average number of hours in training by 89 to 121 hours.
• The evidence suggests that providing WIA-funded training accelerated the speed at which trainees enrolled in and completed training programs.
• Trainees in the full-WIA and core-and-intensive groups were significantly more likely to enroll in a vocationally oriented training program than trainees in the core group.
• Trainees in the full-WIA and core-and-intensive groups were more likely to receive a credential from a training program than trainees in the core group. Trainees in the full-WIA group were also more likely than trainees in the core group to have completed a training program and less likely to have left a training program before completing it.
• Patterns of training receipt were similar for adults and dislocated workers.
49
to members of the core-and-intensive and core groups were lifted. But no effort was made to reach out to the customers at that point in time.
Customers in all three study groups could access training funded by other sources at any time as they normally would, including Federal Pell Grants, other government grants or programs, or the customers’ own funds. In fact, WIA required that customers use other publicly available funds, such as Pell Grants, before using WIA funds for training. During the study, employment counselors also could offer one-on-one guidance to customers in the full-WIA and core-and-intensive groups on how to apply for other sources of funds to finance training. Such guidance was not available to core customers in the first half of the follow-up period.
In this study, training programs are any courses designed to teach a customer occupational or basic skills to help the customer succeed in the labor market. This definition includes vocational training, which teaches a customer skills for a specific job or prepares him or her for an occupation, and educational programs, which include any adult basic education or literacy activities, General Educational Development (GED) test preparation, English as a second language programs, and postsecondary general education courses. We classified programs as vocational if a customer said the primary purpose of the program was to help them learn job skills or prepare for an occupation, and educational otherwise.
In this chapter, we discuss differences across the three study groups in the receipt of training and the characteristics of training received. We first discuss how enrollment in training varied across study groups (Section A) and various ways to quantify differences in the amount of training received (Section B). We then delve deeper into the characteristics of training programs chosen by study participants (Section C). Next, we analyze the rates at which customers completed training programs and received credentials (Section D) and how customers paid for training (Section E). We conclude with a discussion of differences in training outcomes for adults and dislocated workers (Section F).
A. Enrollment in training
Fifty percent of customers in the full-WIA group enrolled in some training program during the 30-month follow-up period, funded by either the Adult and Dislocated Worker programs or another source. In the first quarter after random assignment, 32 percent of the full-WIA group enrolled in a training program (Figure V.1). These rates decreased throughout the early portion of the follow-up period. Twenty-five percent of full-WIA customers enrolled in training during Quarter 3; 15 percent of full-WIA customers enrolled in training in Quarter 6. In each of the final three quarters of the follow-up period, about 10 percent of full-WIA customers were enrolled in training. Aggregating across the 30-month follow-up period, about half of all full-WIA customers enrolled in a training program at some point in time (Figure V.2).
50
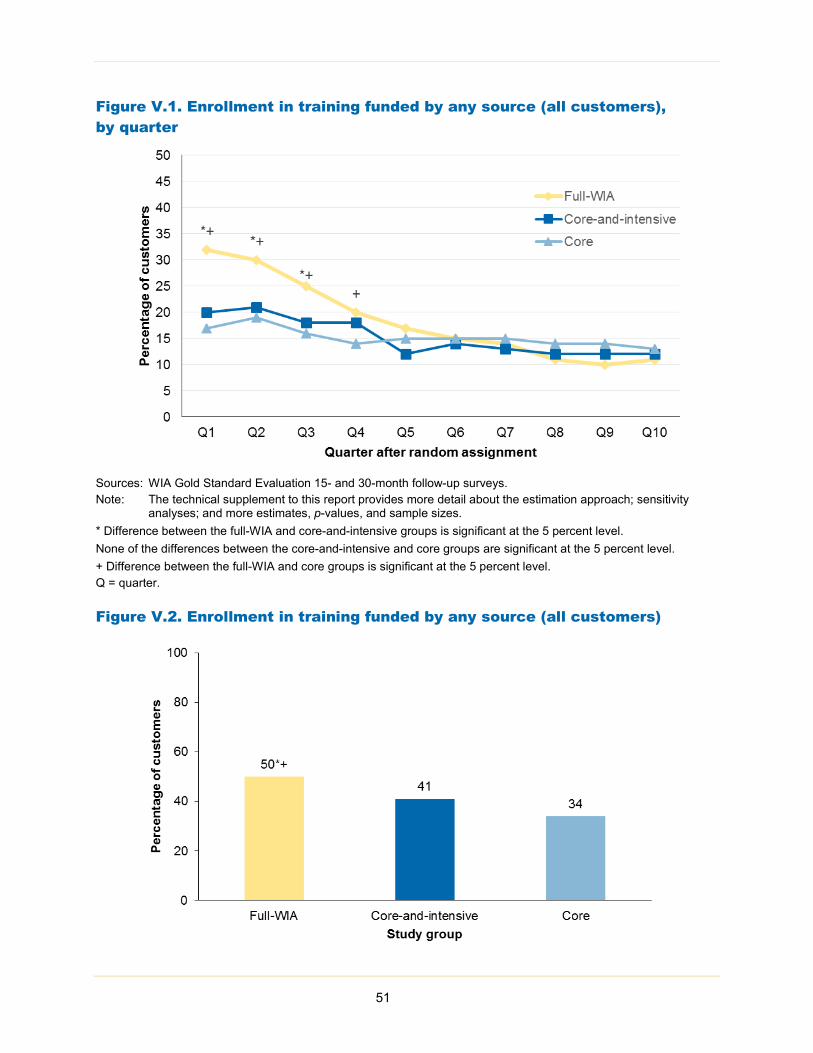
Figure V.1. Enrollment in training funded by any source (all customers), by quarter
Sources: WIA Gold Standard Evaluation 15- and 30-month follow-up surveys. Note: The technical supplement to this report provides more detail about the estimation approach; sensitivity
analyses; and more estimates, p-values, and sample sizes. * Difference between the full-WIA and core-and-intensive groups is significant at the 5 percent level. None of the differences between the core-and-intensive and core groups are significant at the 5 percent level. + Difference between the full-WIA and core groups is significant at the 5 percent level. Q = quarter.
Figure V.2. Enrollment in training funded by any source (all customers)
51
Sources: WIA Gold Standard Evaluation 15- and 30-month follow-up surveys. Note: The technical supplement to this report provides more detail about the estimation approach; sensitivity
analyses; and more estimates, p-values, and sample sizes. * Difference between the full-WIA and core-and-intensive groups is significant at the 5 percent level. The difference between the core-and-intensive and core groups is not significant at the 5 percent level. + Difference between the full-WIA and core groups is significant at the 5 percent level.
Fewer customers in the core-and-intensive and core groups enrolled in training compared to the full-WIA group (Figure V.1). Across the 30-month follow-up period, 41 percent of core-and-intensive customers and 34 percent of core customers enrolled in any training program (Figure V.2). In the first quarter after random assignment, only 20 percent of the core-and-intensive group and 17 percent of the core group had started training (Figure V.1). The training enrollment rate increased slightly for both groups in Quarter 2 but then fell in Quarters 3 and 4. By Quarter 6, the rate of training enrollment had fallen to 14 and 15 percent for customers in the core-and-intensive and core groups, respectively. Rates for both groups remained between 12 and 15 percent for the remaining quarters of the follow-up period, similar to the rates of the full-WIA group, which ranged from 10 to 15 percent in these final quarters.
Although customers in the core-and-intensive and core groups could have received WIA-funded training in the second half of the follow-up period if they were otherwise eligible, there was little change in training enrollment rates between Quarters 5 and 6 (Figure V.1). In the core group, the training enrollment rate was 15 percent in both quarters. In the core-and-intensive group, the training rate rose from 12 to 14 percent from Quarter 5 to Quarter 6; this small uptick in training rates could have been because the restriction on WIA-funded training was removed.
Comparing rates of training across groups, customers in the full-WIA group were 9 percentage points more likely than customers in the core-and-intensive group, and 16 percentage points more likely than customers in the core group, to enroll in training at any point in the 30-month follow-up period (Figure V.2). Differences in training enrollment were largest in the first quarters after random assignment and faded by the second half of the follow-up period (Figure V.1). In Quarter 1, full-WIA customers were 11 percentage points more likely to be enrolled in training than core-and-intensive customers and 15 percentage points more likely to be enrolled in training than core customers. But by Quarter 6, estimated differences across groups in enrollment rates were 1 percentage point or less and not statistically significant. These findings suggest that although customers served by the Adult and Dislocated Worker programs had access to outside sources of training throughout the follow-up period, these alternatives did not fully replace WIA-funded training. Furthermore, because training enrollment rates were low and similar across groups in the second half of the follow-up period, the length of the follow-up period is likely sufficient to measure the long-term impacts of access to training funded by the Adult and Dislocated Worker programs on outcomes such as earnings and employment.
In addition, core-and-intensive customers were 7 percentage points more likely to enroll in training during the 30-month follow-up period than were core customers; however, this difference is not statistically significant (Figure V.2). Employment counselors discussed training options with slightly more than half of the customers in the core-and-intensive group (Appendix C of the technical supplement, Table C.IV.6a) and might have helped them enroll in and find funding for training as part of providing intensive services. But our findings suggest that such assistance did not have large effects on the share of customers that enrolled in any training 52
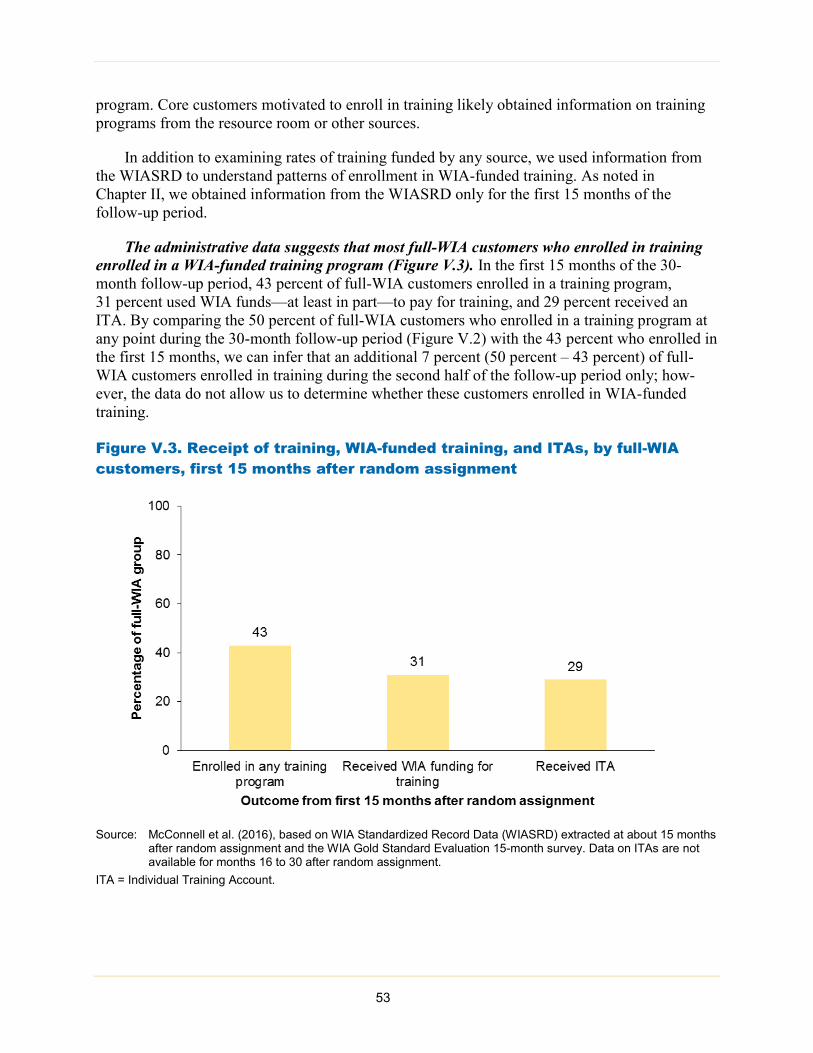
program. Core customers motivated to enroll in training likely obtained information on training programs from the resource room or other sources.
In addition to examining rates of training funded by any source, we used information from the WIASRD to understand patterns of enrollment in WIA-funded training. As noted in Chapter II, we obtained information from the WIASRD only for the first 15 months of the follow-up period.
The administrative data suggests that most full-WIA customers who enrolled in training enrolled in a WIA-funded training program (Figure V.3). In the first 15 months of the 30-month follow-up period, 43 percent of full-WIA customers enrolled in a training program, 31 percent used WIA funds—at least in part—to pay for training, and 29 percent received an ITA. By comparing the 50 percent of full-WIA customers who enrolled in a training program at any point during the 30-month follow-up period (Figure V.2) with the 43 percent who enrolled in the first 15 months, we can infer that an additional 7 percent (50 percent – 43 percent) of full-WIA customers enrolled in training during the second half of the follow-up period only; how-ever, the data do not allow us to determine whether these customers enrolled in WIA-funded training.
Figure V.3. Receipt of training, WIA-funded training, and ITAs, by full-WIA customers, first 15 months after random assignment
Source: McConnell et al. (2016), based on WIA Standardized Record Data (WIASRD) extracted at about 15 months after random assignment and the WIA Gold Standard Evaluation 15-month survey. Data on ITAs are not available for months 16 to 30 after random assignment.
ITA = Individual Training Account.
53

Many customers in the full-WIA group did not enroll in training and other full-WIA customers enrolled in training but did not enroll in WIA-funded training. Half of all customers in the full-WIA group enrolled in training during the 30-month follow-up period, implying half did not do so (Figure V.2). Moreover, comparing the rate of enrollment in a WIA-funded training program during the first 15 months after random assignment for the full-WIA group (31 percent) with the rate of enrollment in any training program for that group during the first 15 months after random assignment (43 percent) or the entire follow-up period (50 percent) implies that between 12 (43 percent – 31 percent) and 19 percent (50 percent – 31 percent) of the full-WIA group enrolled in training but did not use WIA funding to do so. Some customers assigned to the full-WIA group might not have been interested in training or might not have been interested enough to complete all the activities required to be approved for an ITA or other WIA-funded training, such as researching occupations and training programs (D’Amico et al. 2015). Some customers might not choose to enroll in training because they preferred, or needed, to obtain a job. Other full-WIA customers might have not received WIA-funded training because they did not meet their local area’s training eligibility criteria. For example, in nearly all local areas, customers who did not achieve a minimum TABE score or have a high school diploma or GED certificate could not receive funding through the Adult and Dislocated Worker programs for training (D’Amico et al. 2015). Finally, some full-WIA customers may have not received WIA-funded training because their local area exhausted all training funds (D’Amico et al. 2015). Local areas often run out of money to fund training. When this occurs, they cannot approve training for eligible customers until they received additional funds.
B. Amount of training received
Consistent with their higher enrollment in training, customers in the full-WIA group enrolled in more training programs and spent more time in training than customers in the core-and-intensive or core groups (Table V.1). The average customer in the full-WIA group enrolled in 0.8 training programs during the follow-up period and received 392 hours of training (using zero for customers who did not enroll in training in the averages). In contrast, the average core-and-intensive customer enrolled in 0.6 training programs during the follow-up period and received 302 hours of training and the average core customer enrolled in 0.5 training programs and received 271 hours of training. Despite the significant differences in hours and number of programs, none of the differences across groups in weeks of training are statistically significant.
There is also some evidence that the customers in the core-and-intensive group received slightly more training than those in the core group (Table V.1). Customers in the core-and-intensive group enrolled in 0.1 more training programs, on average, than core customers. Despite this difference, customers in the core-and-intensive group did not spend appreciably more time in training than did the core group, on average.
54
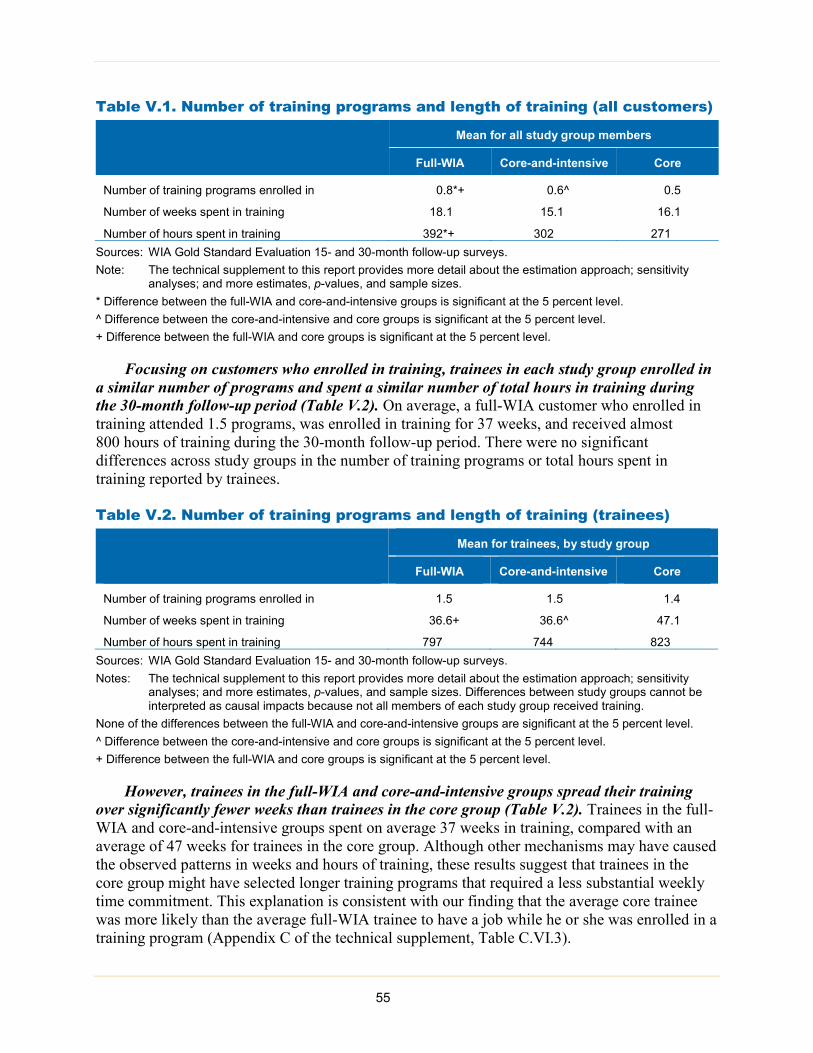
Table V.1. Number of training programs and length of training (all customers)
Mean for all study group members
Full-WIA Core-and-intensive Core
Number of training programs enrolled in 0.8*+ 0.6^ 0.5
Number of weeks spent in training 18.1 15.1 16.1
Number of hours spent in training 392*+ 302 271 Sources: WIA Gold Standard Evaluation 15- and 30-month follow-up surveys. Note: The technical supplement to this report provides more detail about the estimation approach; sensitivity
analyses; and more estimates, p-values, and sample sizes. * Difference between the full-WIA and core-and-intensive groups is significant at the 5 percent level. ^ Difference between the core-and-intensive and core groups is significant at the 5 percent level. + Difference between the full-WIA and core groups is significant at the 5 percent level.
Focusing on customers who enrolled in training, trainees in each study group enrolled in a similar number of programs and spent a similar number of total hours in training during the 30-month follow-up period (Table V.2). On average, a full-WIA customer who enrolled in training attended 1.5 programs, was enrolled in training for 37 weeks, and received almost 800 hours of training during the 30-month follow-up period. There were no significant differences across study groups in the number of training programs or total hours spent in training reported by trainees.
Table V.2. Number of training programs and length of training (trainees)
Mean for trainees, by study group
Full-WIA Core-and-intensive Core
Number of training programs enrolled in 1.5 1.5 1.4
Number of weeks spent in training 36.6+ 36.6^ 47.1
Number of hours spent in training 797 744 823 Sources: WIA Gold Standard Evaluation 15- and 30-month follow-up surveys. Notes: The technical supplement to this report provides more detail about the estimation approach; sensitivity
analyses; and more estimates, p-values, and sample sizes. Differences between study groups cannot be interpreted as causal impacts because not all members of each study group received training.
None of the differences between the full-WIA and core-and-intensive groups are significant at the 5 percent level. ^ Difference between the core-and-intensive and core groups is significant at the 5 percent level. + Difference between the full-WIA and core groups is significant at the 5 percent level.
However, trainees in the full-WIA and core-and-intensive groups spread their training over significantly fewer weeks than trainees in the core group (Table V.2). Trainees in the full-WIA and core-and-intensive groups spent on average 37 weeks in training, compared with an average of 47 weeks for trainees in the core group. Although other mechanisms may have caused the observed patterns in weeks and hours of training, these results suggest that trainees in the core group might have selected longer training programs that required a less substantial weekly time commitment. This explanation is consistent with our finding that the average core trainee was more likely than the average full-WIA trainee to have a job while he or she was enrolled in a training program (Appendix C of the technical supplement, Table C.VI.3).
55
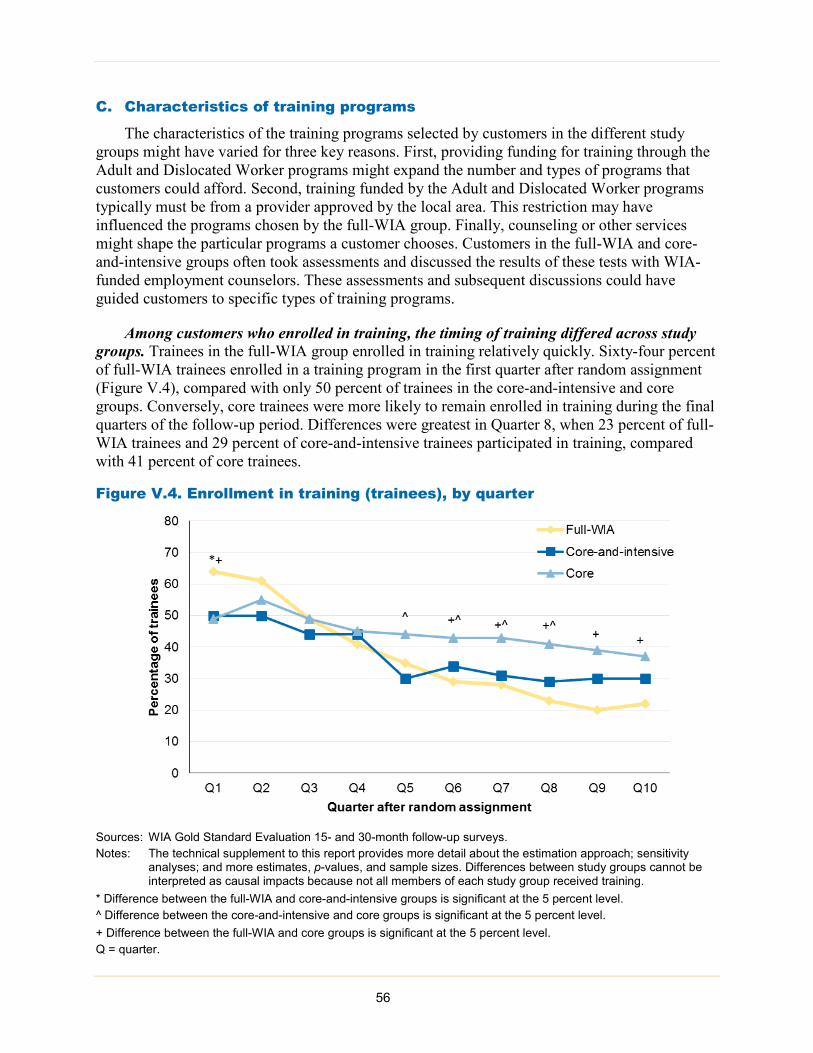
C. Characteristics of training programs
The characteristics of the training programs selected by customers in the different study groups might have varied for three key reasons. First, providing funding for training through the Adult and Dislocated Worker programs might expand the number and types of programs that customers could afford. Second, training funded by the Adult and Dislocated Worker programs typically must be from a provider approved by the local area. This restriction may have influenced the programs chosen by the full-WIA group. Finally, counseling or other services might shape the particular programs a customer chooses. Customers in the full-WIA and core-and-intensive groups often took assessments and discussed the results of these tests with WIA-funded employment counselors. These assessments and subsequent discussions could have guided customers to specific types of training programs.
Among customers who enrolled in training, the timing of training differed across study groups. Trainees in the full-WIA group enrolled in training relatively quickly. Sixty-four percent of full-WIA trainees enrolled in a training program in the first quarter after random assignment (Figure V.4), compared with only 50 percent of trainees in the core-and-intensive and core groups. Conversely, core trainees were more likely to remain enrolled in training during the final quarters of the follow-up period. Differences were greatest in Quarter 8, when 23 percent of full-WIA trainees and 29 percent of core-and-intensive trainees participated in training, compared with 41 percent of core trainees.
Figure V.4. Enrollment in training (trainees), by quarter
Sources: WIA Gold Standard Evaluation 15- and 30-month follow-up surveys. Notes: The technical supplement to this report provides more detail about the estimation approach; sensitivity
analyses; and more estimates, p-values, and sample sizes. Differences between study groups cannot be interpreted as causal impacts because not all members of each study group received training.
* Difference between the full-WIA and core-and-intensive groups is significant at the 5 percent level. ^ Difference between the core-and-intensive and core groups is significant at the 5 percent level. + Difference between the full-WIA and core groups is significant at the 5 percent level. Q = quarter.
56

Although customers who enrolled in training were more likely to choose vocationally oriented training programs over educational programs in all study groups, trainees in the full-WIA and core-and-intensive groups were more likely than trainees in the core group to enroll in vocational programs (Figure V.5). Ninety-one percent of full-WIA and core-and-intensive trainees enrolled in a vocationally oriented training program, compared with only 86 percent of core trainees. Conversely, core trainees were more likely than both core-and-intensive and full-WIA trainees to enroll in an educational program, though the estimated differences are not statistically significant. Further, 86 to 92 percent of trainees in each study group enrolled in at least one program designed to lead to a credential (such as a certificate or diploma). Differences across groups in this measure were also not statistically significant.
Figure V.5. Enrollment in different types of training programs (trainees)
Sources: WIA Gold Standard Evaluation 15- and 30-month follow-up surveys. Notes: The technical supplement to this report provides more detail about the estimation approach; sensitivity
analyses; and more estimates, p-values, and sample sizes. Trainees could enroll in multiple programs of different or similar types. Differences between study groups cannot be interpreted as causal impacts because not all members of each study group received training.
None of the differences between the full-WIA and core-and-intensive groups are significant at the 5 percent level. ^ Difference between the core-and-intensive and core groups is significant at the 5 percent level. + Difference between the full-WIA and core groups is significant at the 5 percent level.
Some differences also occurred across study groups in the types of organizations that provided training to customers (Figure V.6). Three categories of providers—vocational institutes or training centers, employers, and community colleges—were most commonly reported as providing training across the three study groups. But trainees in the full-WIA group received training at a vocational institute or training center more often than trainees in the core-and-intensive or core groups. Conversely, trainees in the full-WIA group were less likely than trainees in the core-and-intensive and core groups to report enrolling in an online training program. Five percent of trainees in the full-WIA group, 9 percent of trainees in the core-and- 57

intensive group, and 12 percent of trainees in the core group enrolled in an online training program (Appendix C of the technical supplement, Table C.V.6). Trainees in the full-WIA and core-and-intensive groups also reported receiving training at a community-based organization, senior center, or other nonprofit less often than trainees in the core group. Conversely, trainees in the full-WIA group reported receiving training at an American Job Center more often than trainees in the core group (Appendix C of the technical supplement, Table C.V.6). Other differences across groups are not statistically significant.
Figure V.6. Enrollment in training at common provider types (trainees)
Sources: WIA Gold Standard Evaluation 15- and 30-month follow-up surveys. Notes: The technical supplement to this report provides more detail about the estimation approach; sensitivity
analyses; and more estimates, p-values, and sample sizes. Percentages do not sum to 100 because (1) some customers enrolled in multiple training programs; and (2) customers also enrolled in programs provided by community-based organizations, online providers, and other providers (not shown in figure). Differences between study groups cannot be interpreted as causal impacts because not all members of each study group received training.
* Difference between the full-WIA and core-and-intensive groups is significant at the 5 percent level. None of the differences between the core-and-intensive and core groups are significant at the 5 percent level. + Difference between the full-WIA and core groups is significant at the 5 percent level.
Although program locations differed, focusing on the most common training programs, customers in the full-WIA group enrolled in a similar set of programs as customers in the other study groups (Figure V.7). The most popular vocation-specific programs related to truck driving (commercial driving license) and health care (certified nursing assistant, medical coding, licensed practical nurse, and other nursing programs). Welding and business (business manage-ment and accounting or bookkeeping) were two other more popular vocations (Appendix C of the technical supplement, Table C.V.7). Only one notable difference emerged across groups in the programs chosen by customers who enrolled in training. Trainees in the full-WIA group were more likely to enroll in a truck driving or commercial driving license program, compared with trainees in the other study groups. Other estimated differences are not statistically significant. 58
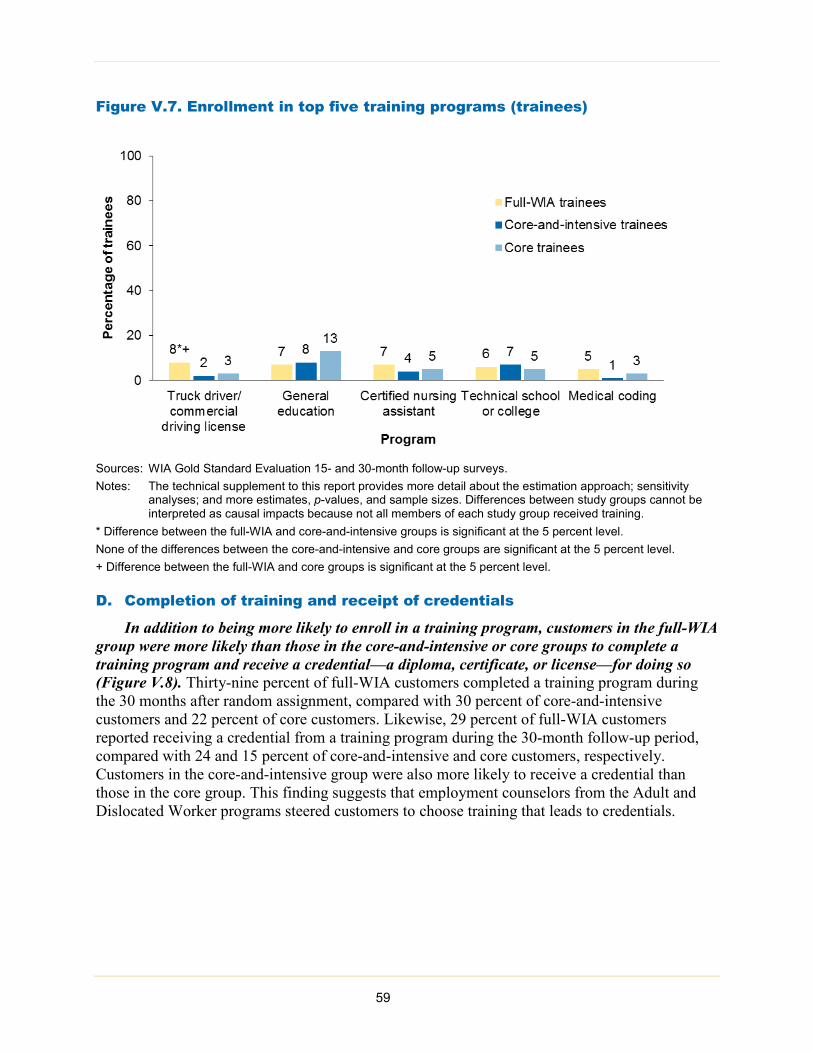
Figure V.7. Enrollment in top five training programs (trainees)
Sources: WIA Gold Standard Evaluation 15- and 30-month follow-up surveys. Notes: The technical supplement to this report provides more detail about the estimation approach; sensitivity
analyses; and more estimates, p-values, and sample sizes. Differences between study groups cannot be interpreted as causal impacts because not all members of each study group received training.
* Difference between the full-WIA and core-and-intensive groups is significant at the 5 percent level. None of the differences between the core-and-intensive and core groups are significant at the 5 percent level. + Difference between the full-WIA and core groups is significant at the 5 percent level.
D. Completion of training and receipt of credentials
In addition to being more likely to enroll in a training program, customers in the full-WIA group were more likely than those in the core-and-intensive or core groups to complete a training program and receive a credential—a diploma, certificate, or license—for doing so (Figure V.8). Thirty-nine percent of full-WIA customers completed a training program during the 30 months after random assignment, compared with 30 percent of core-and-intensive customers and 22 percent of core customers. Likewise, 29 percent of full-WIA customers reported receiving a credential from a training program during the 30-month follow-up period, compared with 24 and 15 percent of core-and-intensive and core customers, respectively. Customers in the core-and-intensive group were also more likely to receive a credential than those in the core group. This finding suggests that employment counselors from the Adult and Dislocated Worker programs steered customers to choose training that leads to credentials.
59
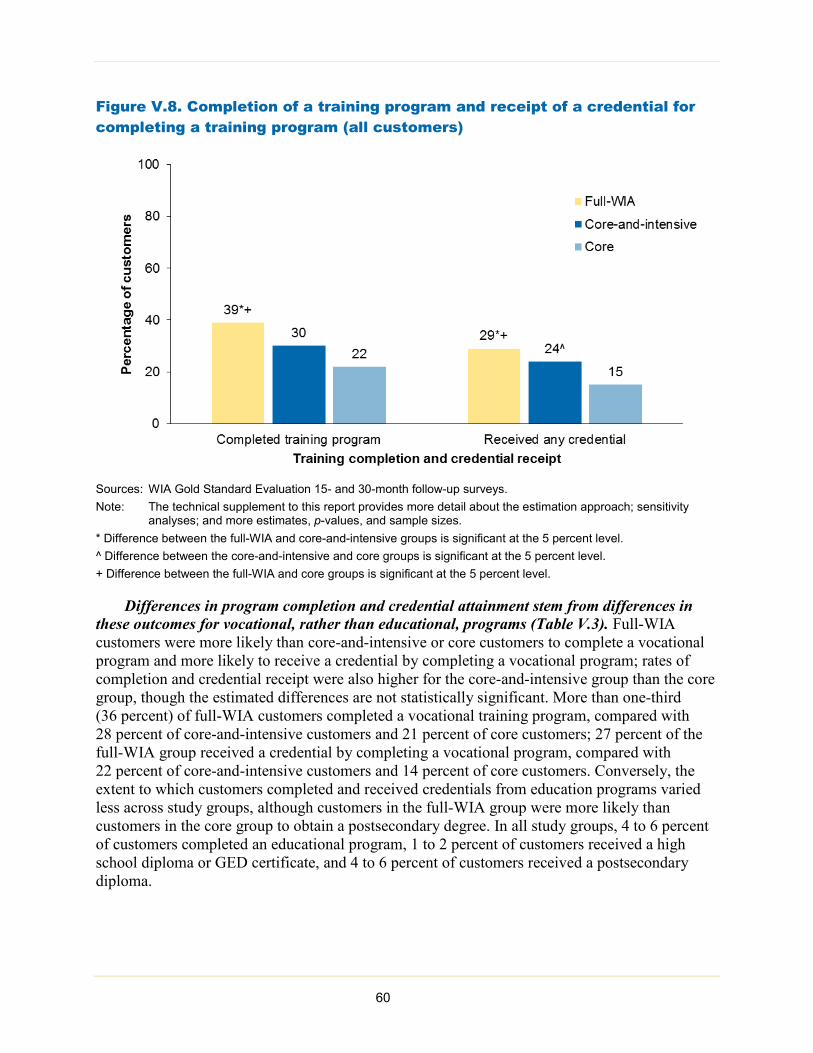
Figure V.8. Completion of a training program and receipt of a credential for completing a training program (all customers)
Sources: WIA Gold Standard Evaluation 15- and 30-month follow-up surveys. Note: The technical supplement to this report provides more detail about the estimation approach; sensitivity
analyses; and more estimates, p-values, and sample sizes. * Difference between the full-WIA and core-and-intensive groups is significant at the 5 percent level. ^ Difference between the core-and-intensive and core groups is significant at the 5 percent level. + Difference between the full-WIA and core groups is significant at the 5 percent level.
Differences in program completion and credential attainment stem from differences in these outcomes for vocational, rather than educational, programs (Table V.3). Full-WIA customers were more likely than core-and-intensive or core customers to complete a vocational program and more likely to receive a credential by completing a vocational program; rates of completion and credential receipt were also higher for the core-and-intensive group than the core group, though the estimated differences are not statistically significant. More than one-third (36 percent) of full-WIA customers completed a vocational training program, compared with 28 percent of core-and-intensive customers and 21 percent of core customers; 27 percent of the full-WIA group received a credential by completing a vocational program, compared with 22 percent of core-and-intensive customers and 14 percent of core customers. Conversely, the extent to which customers completed and received credentials from education programs varied less across study groups, although customers in the full-WIA group were more likely than customers in the core group to obtain a postsecondary degree. In all study groups, 4 to 6 percent of customers completed an educational program, 1 to 2 percent of customers received a high school diploma or GED certificate, and 4 to 6 percent of customers received a postsecondary diploma.
60
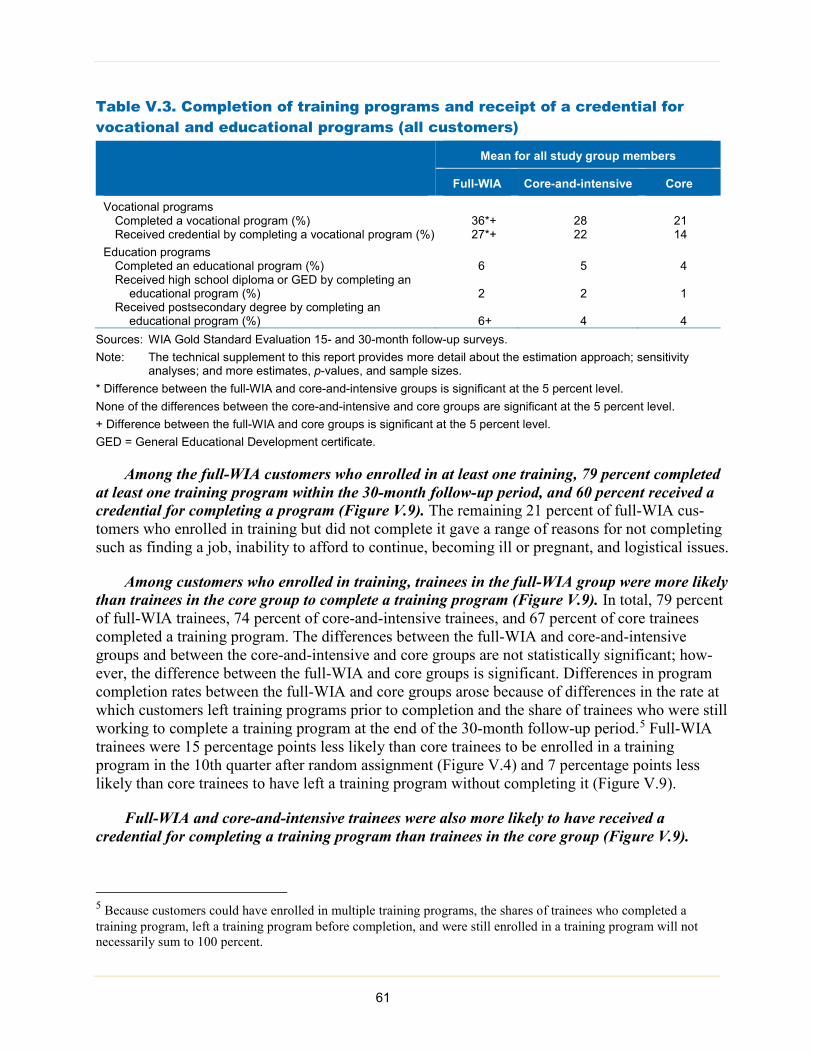
Table V.3. Completion of training programs and receipt of a credential for vocational and educational programs (all customers)
Mean for all study group members
Full-WIA Core-and-intensive Core
Vocational programs Completed a vocational program (%) 36*+ 28 21 Received credential by completing a vocational program (%) 27*+ 22 14
Education programs Completed an educational program (%) 6 5 4 Received high school diploma or GED by completing an
educational program (%) 2 2 1 Received postsecondary degree by completing an
educational program (%) 6+ 4 4 Sources: WIA Gold Standard Evaluation 15- and 30-month follow-up surveys. Note: The technical supplement to this report provides more detail about the estimation approach; sensitivity
analyses; and more estimates, p-values, and sample sizes. * Difference between the full-WIA and core-and-intensive groups is significant at the 5 percent level. None of the differences between the core-and-intensive and core groups are significant at the 5 percent level. + Difference between the full-WIA and core groups is significant at the 5 percent level. GED = General Educational Development certificate.
Among the full-WIA customers who enrolled in at least one training, 79 percent completed at least one training program within the 30-month follow-up period, and 60 percent received a credential for completing a program (Figure V.9). The remaining 21 percent of full-WIA cus-tomers who enrolled in training but did not complete it gave a range of reasons for not completing such as finding a job, inability to afford to continue, becoming ill or pregnant, and logistical issues.
Among customers who enrolled in training, trainees in the full-WIA group were more likely than trainees in the core group to complete a training program (Figure V.9). In total, 79 percent of full-WIA trainees, 74 percent of core-and-intensive trainees, and 67 percent of core trainees completed a training program. The differences between the full-WIA and core-and-intensive groups and between the core-and-intensive and core groups are not statistically significant; how-ever, the difference between the full-WIA and core groups is significant. Differences in program completion rates between the full-WIA and core groups arose because of differences in the rate at which customers left training programs prior to completion and the share of trainees who were still working to complete a training program at the end of the 30-month follow-up period.5 Full-WIA trainees were 15 percentage points less likely than core trainees to be enrolled in a training program in the 10th quarter after random assignment (Figure V.4) and 7 percentage points less likely than core trainees to have left a training program without completing it (Figure V.9).
Full-WIA and core-and-intensive trainees were also more likely to have received a credential for completing a training program than trainees in the core group (Figure V.9).
5 Because customers could have enrolled in multiple training programs, the shares of trainees who completed a training program, left a training program before completion, and were still enrolled in a training program will not necessarily sum to 100 percent.
61
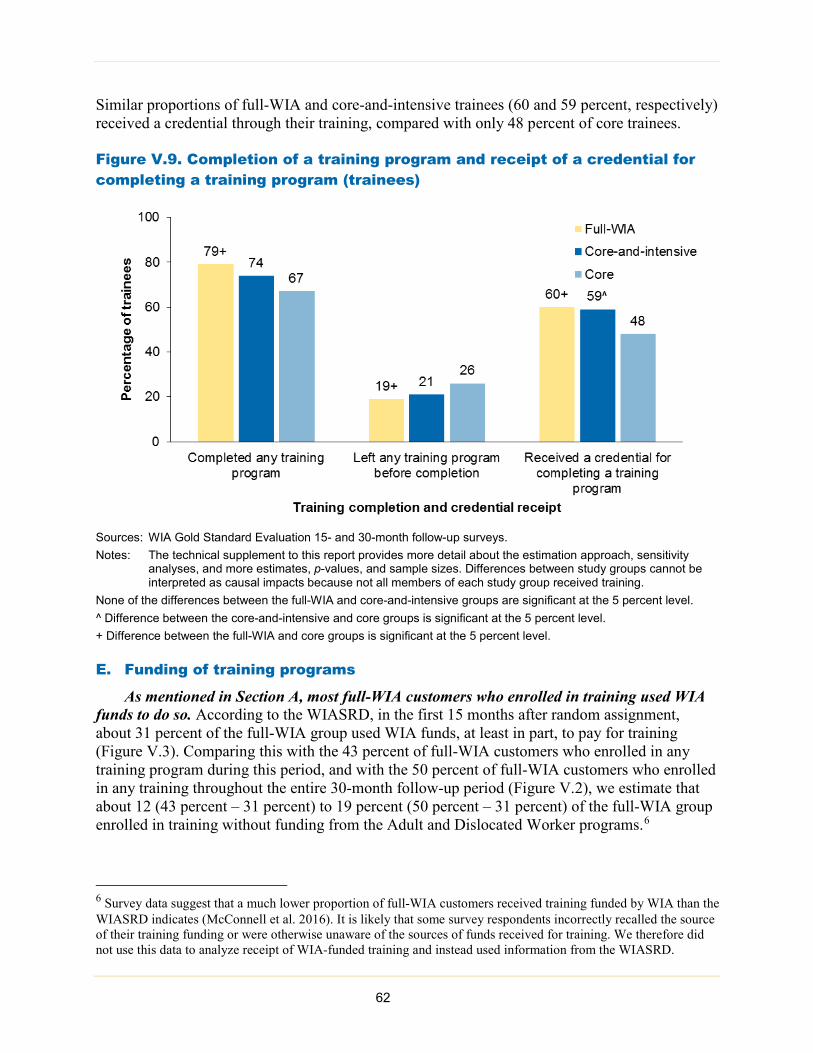
Similar proportions of full-WIA and core-and-intensive trainees (60 and 59 percent, respectively) received a credential through their training, compared with only 48 percent of core trainees.
Figure V.9. Completion of a training program and receipt of a credential for completing a training program (trainees)
Sources: WIA Gold Standard Evaluation 15- and 30-month follow-up surveys. Notes: The technical supplement to this report provides more detail about the estimation approach, sensitivity
analyses, and more estimates, p-values, and sample sizes. Differences between study groups cannot be interpreted as causal impacts because not all members of each study group received training.
None of the differences between the full-WIA and core-and-intensive groups are significant at the 5 percent level. ^ Difference between the core-and-intensive and core groups is significant at the 5 percent level. + Difference between the full-WIA and core groups is significant at the 5 percent level.
E. Funding of training programs
As mentioned in Section A, most full-WIA customers who enrolled in training used WIA funds to do so. According to the WIASRD, in the first 15 months after random assignment, about 31 percent of the full-WIA group used WIA funds, at least in part, to pay for training (Figure V.3). Comparing this with the 43 percent of full-WIA customers who enrolled in any training program during this period, and with the 50 percent of full-WIA customers who enrolled in any training throughout the entire 30-month follow-up period (Figure V.2), we estimate that about 12 (43 percent – 31 percent) to 19 percent (50 percent – 31 percent) of the full-WIA group enrolled in training without funding from the Adult and Dislocated Worker programs.6
6 Survey data suggest that a much lower proportion of full-WIA customers received training funded by WIA than the WIASRD indicates (McConnell et al. 2016). It is likely that some survey respondents incorrectly recalled the source of their training funding or were otherwise unaware of the sources of funds received for training. We therefore did not use this data to analyze receipt of WIA-funded training and instead used information from the WIASRD. 62
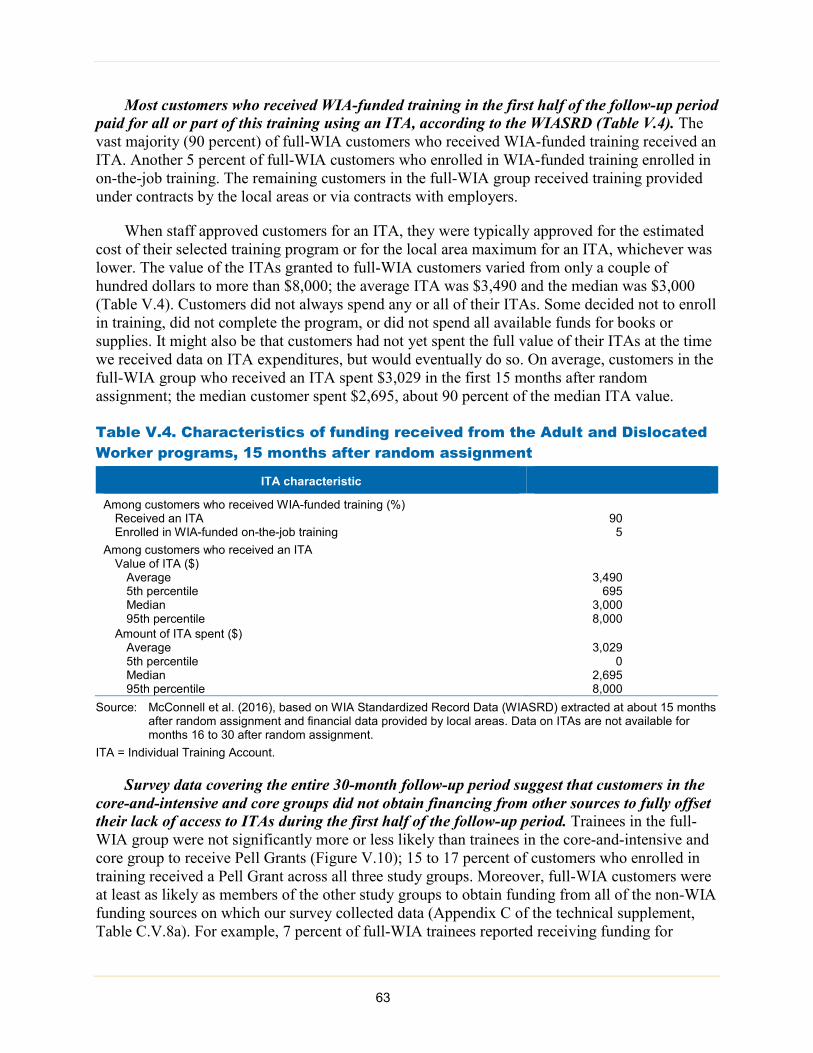
Most customers who received WIA-funded training in the first half of the follow-up period paid for all or part of this training using an ITA, according to the WIASRD (Table V.4). The vast majority (90 percent) of full-WIA customers who received WIA-funded training received an ITA. Another 5 percent of full-WIA customers who enrolled in WIA-funded training enrolled in on-the-job training. The remaining customers in the full-WIA group received training provided under contracts by the local areas or via contracts with employers.
When staff approved customers for an ITA, they were typically approved for the estimated cost of their selected training program or for the local area maximum for an ITA, whichever was lower. The value of the ITAs granted to full-WIA customers varied from only a couple of hundred dollars to more than $8,000; the average ITA was $3,490 and the median was $3,000 (Table V.4). Customers did not always spend any or all of their ITAs. Some decided not to enroll in training, did not complete the program, or did not spend all available funds for books or supplies. It might also be that customers had not yet spent the full value of their ITAs at the time we received data on ITA expenditures, but would eventually do so. On average, customers in the full-WIA group who received an ITA spent $3,029 in the first 15 months after random assignment; the median customer spent $2,695, about 90 percent of the median ITA value.
Table V.4. Characteristics of funding received from the Adult and Dislocated Worker programs, 15 months after random assignment
ITA characteristic
Among customers who received WIA-funded training (%) Received an ITA 90 Enrolled in WIA-funded on-the-job training 5
Among customers who received an ITA Value of ITA ($)
Average 3,490 5th percentile 695 Median 3,000 95th percentile 8,000
Amount of ITA spent ($) Average 3,029 5th percentile 0 Median 2,695 95th percentile 8,000
Source: McConnell et al. (2016), based on WIA Standardized Record Data (WIASRD) extracted at about 15 months after random assignment and financial data provided by local areas. Data on ITAs are not available for months 16 to 30 after random assignment.
ITA = Individual Training Account.
Survey data covering the entire 30-month follow-up period suggest that customers in the core-and-intensive and core groups did not obtain financing from other sources to fully offset their lack of access to ITAs during the first half of the follow-up period. Trainees in the full-WIA group were not significantly more or less likely than trainees in the core-and-intensive and core group to receive Pell Grants (Figure V.10); 15 to 17 percent of customers who enrolled in training received a Pell Grant across all three study groups. Moreover, full-WIA customers were at least as likely as members of the other study groups to obtain funding from all of the non-WIA funding sources on which our survey collected data (Appendix C of the technical supplement, Table C.V.8a). For example, 7 percent of full-WIA trainees reported receiving funding for
63
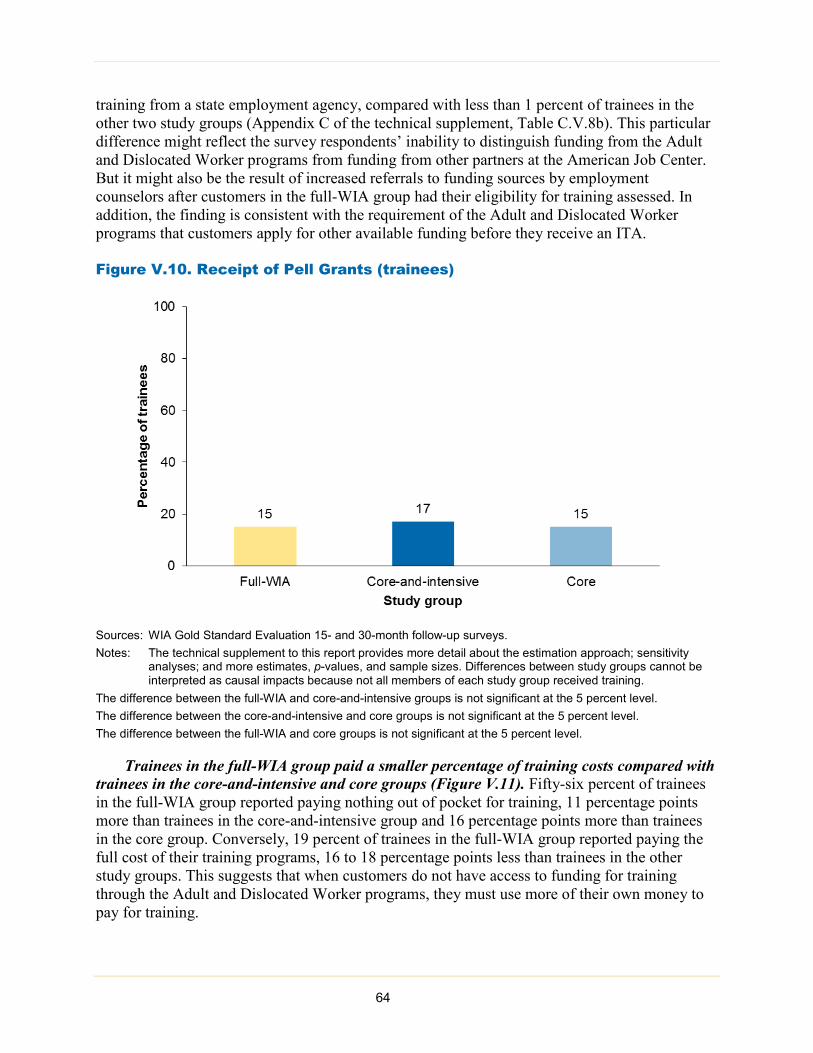
training from a state employment agency, compared with less than 1 percent of trainees in the other two study groups (Appendix C of the technical supplement, Table C.V.8b). This particular difference might reflect the survey respondents’ inability to distinguish funding from the Adult and Dislocated Worker programs from funding from other partners at the American Job Center. But it might also be the result of increased referrals to funding sources by employment counselors after customers in the full-WIA group had their eligibility for training assessed. In addition, the finding is consistent with the requirement of the Adult and Dislocated Worker programs that customers apply for other available funding before they receive an ITA.
Figure V.10. Receipt of Pell Grants (trainees)
Sources: WIA Gold Standard Evaluation 15- and 30-month follow-up surveys. Notes: The technical supplement to this report provides more detail about the estimation approach; sensitivity
analyses; and more estimates, p-values, and sample sizes. Differences between study groups cannot be interpreted as causal impacts because not all members of each study group received training.
The difference between the full-WIA and core-and-intensive groups is not significant at the 5 percent level. The difference between the core-and-intensive and core groups is not significant at the 5 percent level. The difference between the full-WIA and core groups is not significant at the 5 percent level.
Trainees in the full-WIA group paid a smaller percentage of training costs compared with trainees in the core-and-intensive and core groups (Figure V.11). Fifty-six percent of trainees in the full-WIA group reported paying nothing out of pocket for training, 11 percentage points more than trainees in the core-and-intensive group and 16 percentage points more than trainees in the core group. Conversely, 19 percent of trainees in the full-WIA group reported paying the full cost of their training programs, 16 to 18 percentage points less than trainees in the other study groups. This suggests that when customers do not have access to funding for training through the Adult and Dislocated Worker programs, they must use more of their own money to pay for training.
64
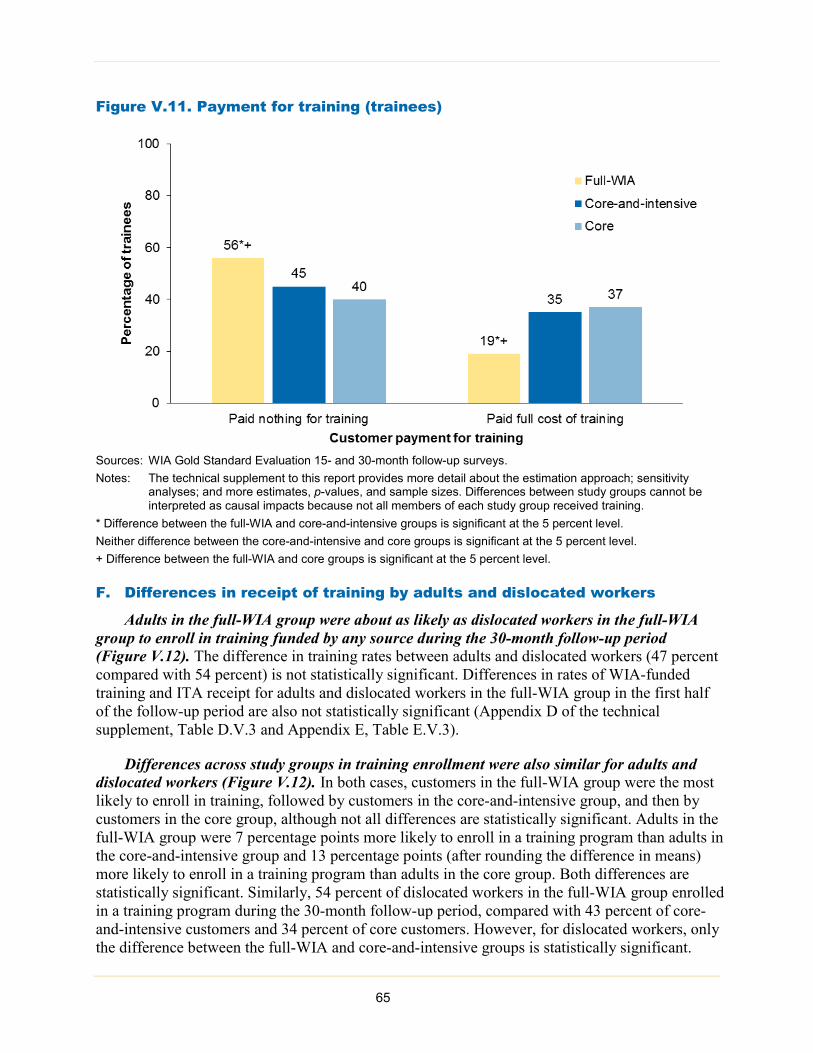
Figure V.11. Payment for training (trainees)
Sources: WIA Gold Standard Evaluation 15- and 30-month follow-up surveys. Notes: The technical supplement to this report provides more detail about the estimation approach; sensitivity
analyses; and more estimates, p-values, and sample sizes. Differences between study groups cannot be interpreted as causal impacts because not all members of each study group received training.
* Difference between the full-WIA and core-and-intensive groups is significant at the 5 percent level. Neither difference between the core-and-intensive and core groups is significant at the 5 percent level. + Difference between the full-WIA and core groups is significant at the 5 percent level.
F. Differences in receipt of training by adults and dislocated workers
Adults in the full-WIA group were about as likely as dislocated workers in the full-WIA group to enroll in training funded by any source during the 30-month follow-up period (Figure V.12). The difference in training rates between adults and dislocated workers (47 percent compared with 54 percent) is not statistically significant. Differences in rates of WIA-funded training and ITA receipt for adults and dislocated workers in the full-WIA group in the first half of the follow-up period are also not statistically significant (Appendix D of the technical supplement, Table D.V.3 and Appendix E, Table E.V.3).
Differences across study groups in training enrollment were also similar for adults and dislocated workers (Figure V.12). In both cases, customers in the full-WIA group were the most likely to enroll in training, followed by customers in the core-and-intensive group, and then by customers in the core group, although not all differences are statistically significant. Adults in the full-WIA group were 7 percentage points more likely to enroll in a training program than adults in the core-and-intensive group and 13 percentage points (after rounding the difference in means) more likely to enroll in a training program than adults in the core group. Both differences are statistically significant. Similarly, 54 percent of dislocated workers in the full-WIA group enrolled in a training program during the 30-month follow-up period, compared with 43 percent of core-and-intensive customers and 34 percent of core customers. However, for dislocated workers, only the difference between the full-WIA and core-and-intensive groups is statistically significant. 65
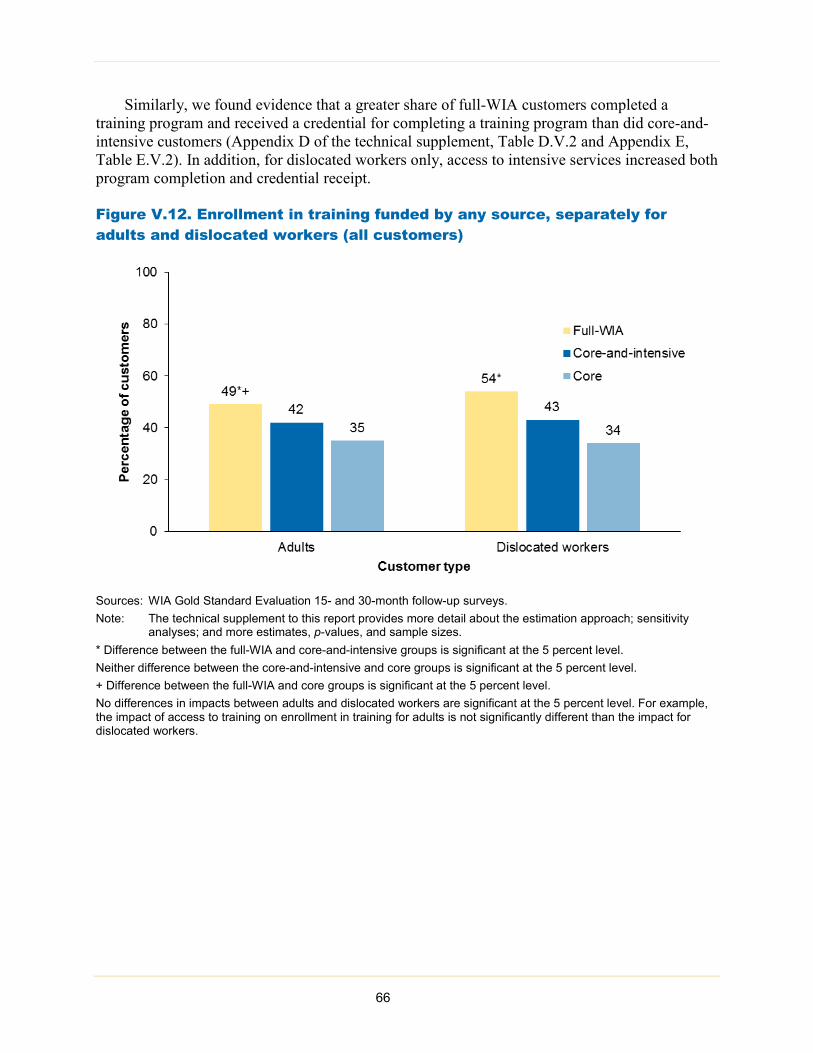
Similarly, we found evidence that a greater share of full-WIA customers completed a training program and received a credential for completing a training program than did core-and-intensive customers (Appendix D of the technical supplement, Table D.V.2 and Appendix E, Table E.V.2). In addition, for dislocated workers only, access to intensive services increased both program completion and credential receipt.
Figure V.12. Enrollment in training funded by any source, separately for adults and dislocated workers (all customers)
Sources: WIA Gold Standard Evaluation 15- and 30-month follow-up surveys. Note: The technical supplement to this report provides more detail about the estimation approach; sensitivity
analyses; and more estimates, p-values, and sample sizes. * Difference between the full-WIA and core-and-intensive groups is significant at the 5 percent level. Neither difference between the core-and-intensive and core groups is significant at the 5 percent level. + Difference between the full-WIA and core groups is significant at the 5 percent level. No differences in impacts between adults and dislocated workers are significant at the 5 percent level. For example, the impact of access to training on enrollment in training for adults is not significantly different than the impact for dislocated workers.
66

VI. IMPACTS ON EARNINGS AND EMPLOYMENT
The central goal of the Adult and Dislocated Worker programs is to help customers succeed in the labor market. In this chapter, we examine whether the training and intensive services funded by these programs during the evaluation period met that goal successfully. We focus on the impacts of the services on employment, earnings, and the quality of the jobs customers obtained.
As in the rest of this report, we describe the impacts on customers over the first 30 months (or first 10 quarters) after random assignment. The first half of this follow-up period, reported on in McConnell et al. (2016), might have been too short to assess the full effectiveness of these services. This is especially true of training, because at the end of the 15-month period, many customers were either still enrolled in training or had just finished training. This chapter presents findings from a longer follow-up period: 30 months (10 quarters) for analysis based on survey data and 36 months (12 quarters) for analysis based on NDNH data. As summarized in Chapter II, the advantages of the survey data are that they provide more detailed information on employment and cover all jobs. The advantages of the NDNH data are that they are available for all study participants (not just those who responded to the survey) and are not subject to recall error.
We begin this chapter by comparing the employment-related outcomes of the full-WIA group with those for the core-and-intensive group; this comparison provides the estimated impact of WIA-funded training (Section A). We then compare the outcomes of the core-and-intensive group with those for the core group, which provides the estimated impacts of WIA-funded intensive services (Section B). Next we present the comparison of the full-WIA group with the
Key findings • Providing WIA-funded training did not increase earnings or employment rates in the 30 months after random
assignment.
- At the end of the study period, full-WIA customers had similar average earnings and employment ratesas core-and-intensive customers.
- The jobs obtained by full-WIA customers had similar wage rates and fringe benefits as those obtained by core-and-intensive customers.
• Providing WIA-funded intensive services increased earnings beginning in the fourth quarter after randomassignment and for most subsequent quarters.
- Core-and-intensive customers earned about $7,000, or 20 percent, more than core customers in the30-month study period based on the survey data. This impact is partly explained by higher employment rates and partly by higher wage rates.
- The impact using administrative earnings records is smaller—about $3,000, or 7 percent, over 36 months—but still statistically significant.
- Core-and-intensive customers were more likely to have jobs that offered fringe benefits than were core customers.
• Based on survey data, providing both WIA-funded training and intensive services increased earnings in Quarters 6 through 10. The impact on total earnings for full-WIA customers relative to core customers over those five quarters is statistically significant at the 5 percent level. The estimates using administrative earnings data show a similar but smaller impact.
• The pattern of earnings impacts was broadly similar for adults and dislocated workers.
67

core group to obtain the estimated impacts of both training and intensive services (Section C). Within each of Sections A, B, and C, we first describe whether the services increased earnings, a summary measure of the key ways in which the Adult and Dislocated Worker programs can affect customers’ labor market experiences. We then separately examine the extent to which any observed impacts on earnings come from differences in the proportion of customers who were employed or from differences in wage rates and then examine other job characteristics among those who found employment. We report estimated impacts on earnings and employment based on customers’ responses to the 30-month survey as well as 12 quarters (36 months) of administrative records from NDNH. (As described in Chapter II, the first quarter for the survey outcomes begins the day after a given customer is randomly assigned, whereas for the NDNH outcomes the first quarter begins the first calendar quarter after a given customer is randomly assigned.) In addition to the combined impacts for adults and dislocated workers, we present impact estimates for each group separately. We then describe how customers’ training during the follow-up period related to their subsequent employment (Section D).
As described in Chapter II, performing multiple statistical tests means that it is more likely that we will find some differences to be statistically significant simply by chance. To help guard against this, we determined before analyzing the data that quarterly earnings would be our priority outcome. This is a key measure of the effectiveness of the programs. In all tables and figures that present earnings impact estimates, we report statistical significance based on conventional tests with 5 percent significance. However, when reporting significant impact estimates for earnings, we also discuss the significance of these estimates using a more stringent test that accounts for the fact that we are making three comparisons for each earnings outcome measure, and that the comparisons are correlated with each other—comparing p-values to a critical value of 1.85 instead of 5 percent.
A. Impacts of WIA-funded training
The impacts of WIA-funded training are estimated by comparing outcomes for the full-WIA group, who could potentially enroll in WIA-funded training, and those of the core-and-intensive group, who could not. Three key findings about customers’ use of services (reported in Chapters IV and V) are important for interpreting the impacts of access to WIA-funded training.
First, even though customers in the full-WIA group could potentially enroll in WIA-funded training, only about one in three full-WIA customers did enroll in WIA-funded training. In some cases customers were not eligible for training, were eligible but not willing to do the paperwork and other activities necessary, or chose not to enroll in training either because they could not afford to be out of the workforce while in training or for other reasons, and were thus not eligible for WIA-funded training. As described in Chapter III, funding for the Adult and Dislocated Worker Programs also declined over the follow-up period, and in some cases customers who were otherwise eligible for training had to wait for more training funds to become available.
The impacts on employment and earnings of those who enrolled in WIA-funded training would likely be larger in magnitude (whether positive or negative) than the impacts on all full-WIA customers (including those who did not enroll in training) reported in this section. The study’s experimental design does not allow us to definitively estimate the impacts of enrolling in WIA-funded training. However, Appendix A of the technical supplement discusses a plausible
68
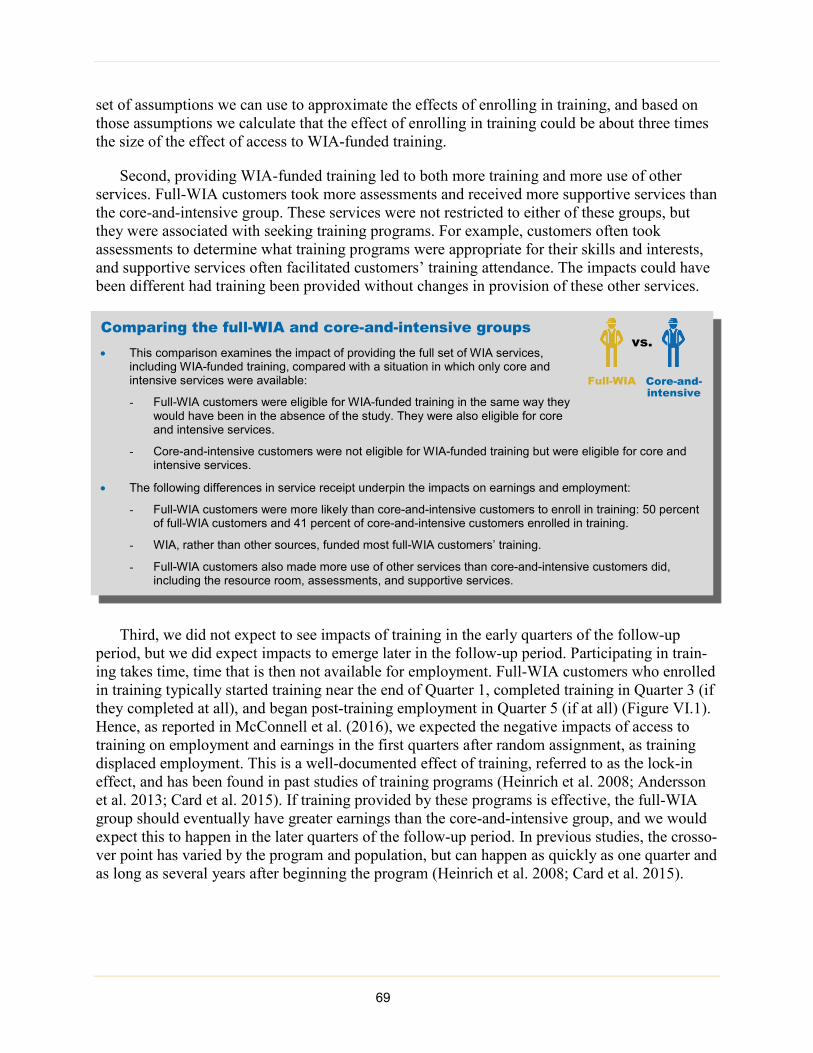
set of assumptions we can use to approximate the effects of enrolling in training, and based on those assumptions we calculate that the effect of enrolling in training could be about three times the size of the effect of access to WIA-funded training.
Second, providing WIA-funded training led to both more training and more use of other services. Full-WIA customers took more assessments and received more supportive services than the core-and-intensive group. These services were not restricted to either of these groups, but they were associated with seeking training programs. For example, customers often took assessments to determine what training programs were appropriate for their skills and interests, and supportive services often facilitated customers’ training attendance. The impacts could have been different had training been provided without changes in provision of these other services.
Third, we did not expect to see impacts of training in the early quarters of the follow-up period, but we did expect impacts to emerge later in the follow-up period. Participating in train-ing takes time, time that is then not available for employment. Full-WIA customers who enrolled in training typically started training near the end of Quarter 1, completed training in Quarter 3 (if they completed at all), and began post-training employment in Quarter 5 (if at all) (Figure VI.1). Hence, as reported in McConnell et al. (2016), we expected the negative impacts of access to training on employment and earnings in the first quarters after random assignment, as training displaced employment. This is a well-documented effect of training, referred to as the lock-in effect, and has been found in past studies of training programs (Heinrich et al. 2008; Andersson et al. 2013; Card et al. 2015). If training provided by these programs is effective, the full-WIA group should eventually have greater earnings than the core-and-intensive group, and we would expect this to happen in the later quarters of the follow-up period. In previous studies, the crosso-ver point has varied by the program and population, but can happen as quickly as one quarter and as long as several years after beginning the program (Heinrich et al. 2008; Card et al. 2015).
Comparing the full-WIA and core-and-intensive groups • This comparison examines the impact of providing the full set of WIA services,
including WIA-funded training, compared with a situation in which only core and intensive services were available:
- Full-WIA customers were eligible for WIA-funded training in the same way they would have been in the absence of the study. They were also eligible for core and intensive services.
- Core-and-intensive customers were not eligible for WIA-funded training but were eligible for core and intensive services.
• The following differences in service receipt underpin the impacts on earnings and employment:
- Full-WIA customers were more likely than core-and-intensive customers to enroll in training: 50 percent of full-WIA customers and 41 percent of core-and-intensive customers enrolled in training.
- WIA, rather than other sources, funded most full-WIA customers’ training.
- Full-WIA customers also made more use of other services than core-and-intensive customers did, including the resource room, assessments, and supportive services.
vs.
Full-WIA Core-and-intensive
69
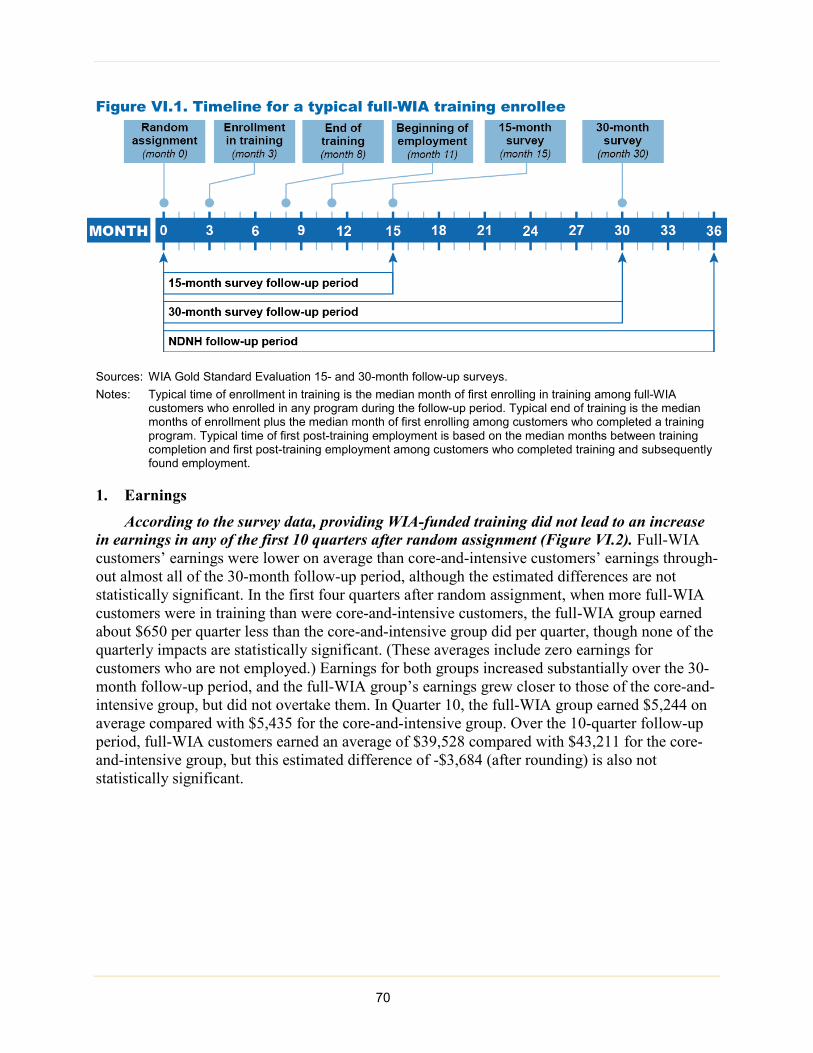
Figure VI.1. Timeline for a typical full-WIA training enrollee
Sources: WIA Gold Standard Evaluation 15- and 30-month follow-up surveys. Notes: Typical time of enrollment in training is the median month of first enrolling in training among full-WIA
customers who enrolled in any program during the follow-up period. Typical end of training is the median months of enrollment plus the median month of first enrolling among customers who completed a training program. Typical time of first post-training employment is based on the median months between training completion and first post-training employment among customers who completed training and subsequently found employment.
1. Earnings According to the survey data, providing WIA-funded training did not lead to an increase
in earnings in any of the first 10 quarters after random assignment (Figure VI.2). Full-WIA customers’ earnings were lower on average than core-and-intensive customers’ earnings through-out almost all of the 30-month follow-up period, although the estimated differences are not statistically significant. In the first four quarters after random assignment, when more full-WIA customers were in training than were core-and-intensive customers, the full-WIA group earned about $650 per quarter less than the core-and-intensive group did per quarter, though none of the quarterly impacts are statistically significant. (These averages include zero earnings for customers who are not employed.) Earnings for both groups increased substantially over the 30-month follow-up period, and the full-WIA group’s earnings grew closer to those of the core-and-intensive group, but did not overtake them. In Quarter 10, the full-WIA group earned $5,244 on average compared with $5,435 for the core-and-intensive group. Over the 10-quarter follow-up period, full-WIA customers earned an average of $39,528 compared with $43,211 for the core-and-intensive group, but this estimated difference of -$3,684 (after rounding) is also not statistically significant.
70
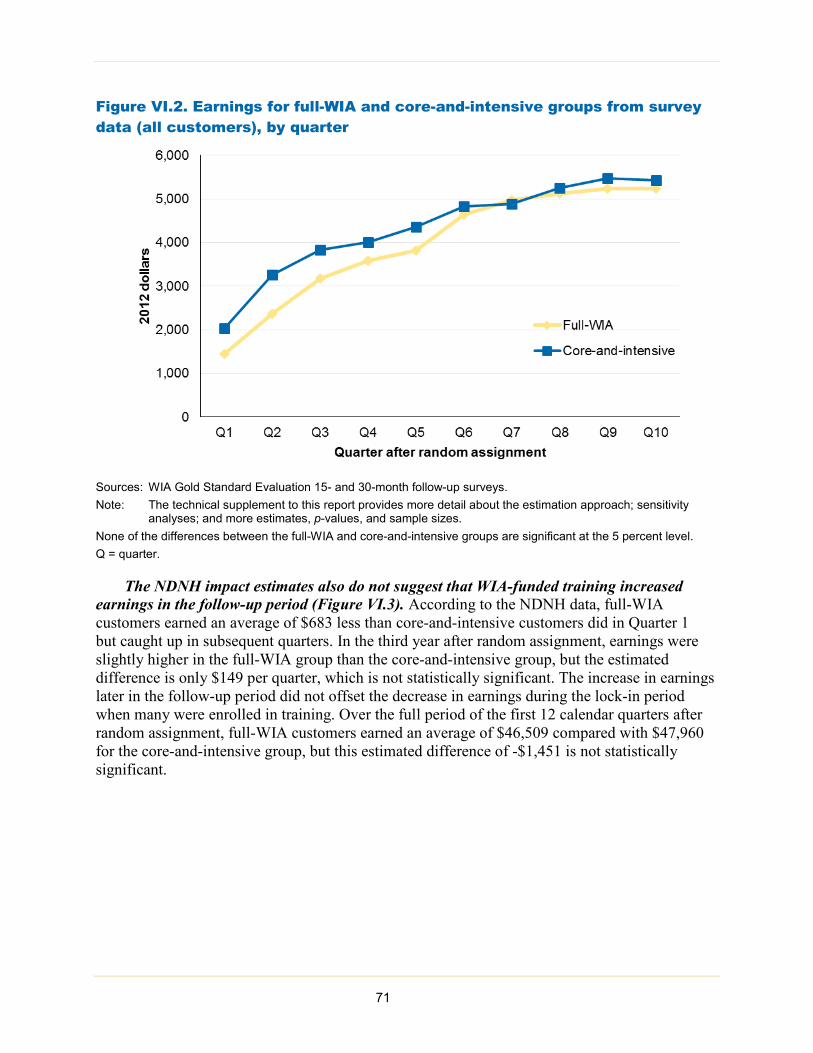
Figure VI.2. Earnings for full-WIA and core-and-intensive groups from survey data (all customers), by quarter
Sources: WIA Gold Standard Evaluation 15- and 30-month follow-up surveys. Note: The technical supplement to this report provides more detail about the estimation approach; sensitivity
analyses; and more estimates, p-values, and sample sizes. None of the differences between the full-WIA and core-and-intensive groups are significant at the 5 percent level. Q = quarter.
The NDNH impact estimates also do not suggest that WIA-funded training increased earnings in the follow-up period (Figure VI.3). According to the NDNH data, full-WIA customers earned an average of $683 less than core-and-intensive customers did in Quarter 1 but caught up in subsequent quarters. In the third year after random assignment, earnings were slightly higher in the full-WIA group than the core-and-intensive group, but the estimated difference is only $149 per quarter, which is not statistically significant. The increase in earnings later in the follow-up period did not offset the decrease in earnings during the lock-in period when many were enrolled in training. Over the full period of the first 12 calendar quarters after random assignment, full-WIA customers earned an average of $46,509 compared with $47,960 for the core-and-intensive group, but this estimated difference of -$1,451 is not statistically significant.
71
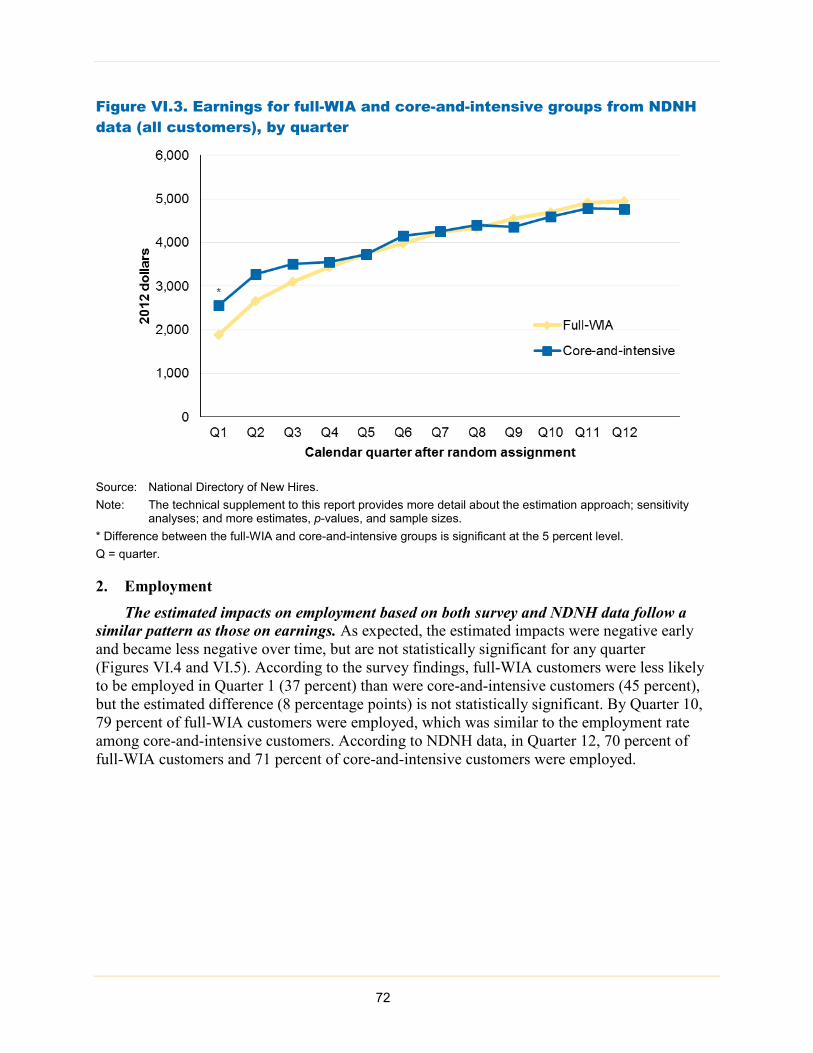
Figure VI.3. Earnings for full-WIA and core-and-intensive groups from NDNH data (all customers), by quarter
Source: National Directory of New Hires. Note: The technical supplement to this report provides more detail about the estimation approach; sensitivity
analyses; and more estimates, p-values, and sample sizes. * Difference between the full-WIA and core-and-intensive groups is significant at the 5 percent level. Q = quarter.
2. Employment The estimated impacts on employment based on both survey and NDNH data follow a
similar pattern as those on earnings. As expected, the estimated impacts were negative early and became less negative over time, but are not statistically significant for any quarter (Figures VI.4 and VI.5). According to the survey findings, full-WIA customers were less likely to be employed in Quarter 1 (37 percent) than were core-and-intensive customers (45 percent), but the estimated difference (8 percentage points) is not statistically significant. By Quarter 10, 79 percent of full-WIA customers were employed, which was similar to the employment rate among core-and-intensive customers. According to NDNH data, in Quarter 12, 70 percent of full-WIA customers and 71 percent of core-and-intensive customers were employed.
72
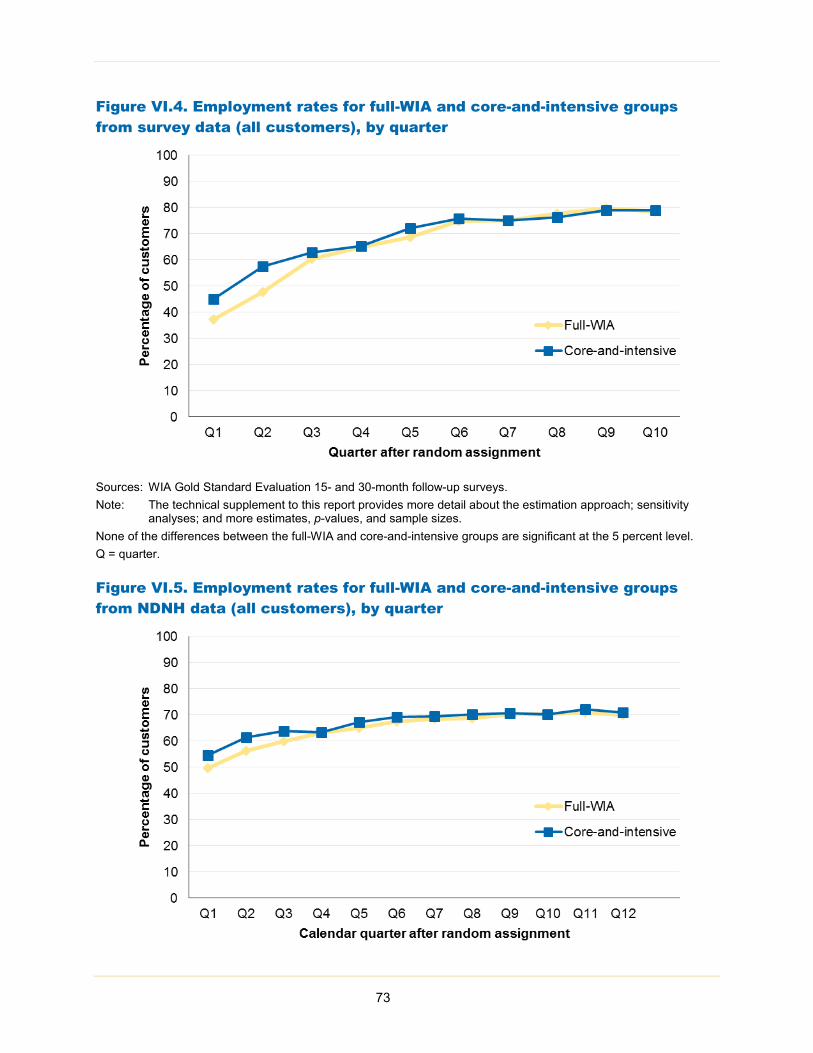
Figure VI.4. Employment rates for full-WIA and core-and-intensive groups from survey data (all customers), by quarter
Sources: WIA Gold Standard Evaluation 15- and 30-month follow-up surveys. Note: The technical supplement to this report provides more detail about the estimation approach; sensitivity
analyses; and more estimates, p-values, and sample sizes. None of the differences between the full-WIA and core-and-intensive groups are significant at the 5 percent level. Q = quarter.
Figure VI.5. Employment rates for full-WIA and core-and-intensive groups from NDNH data (all customers), by quarter
73
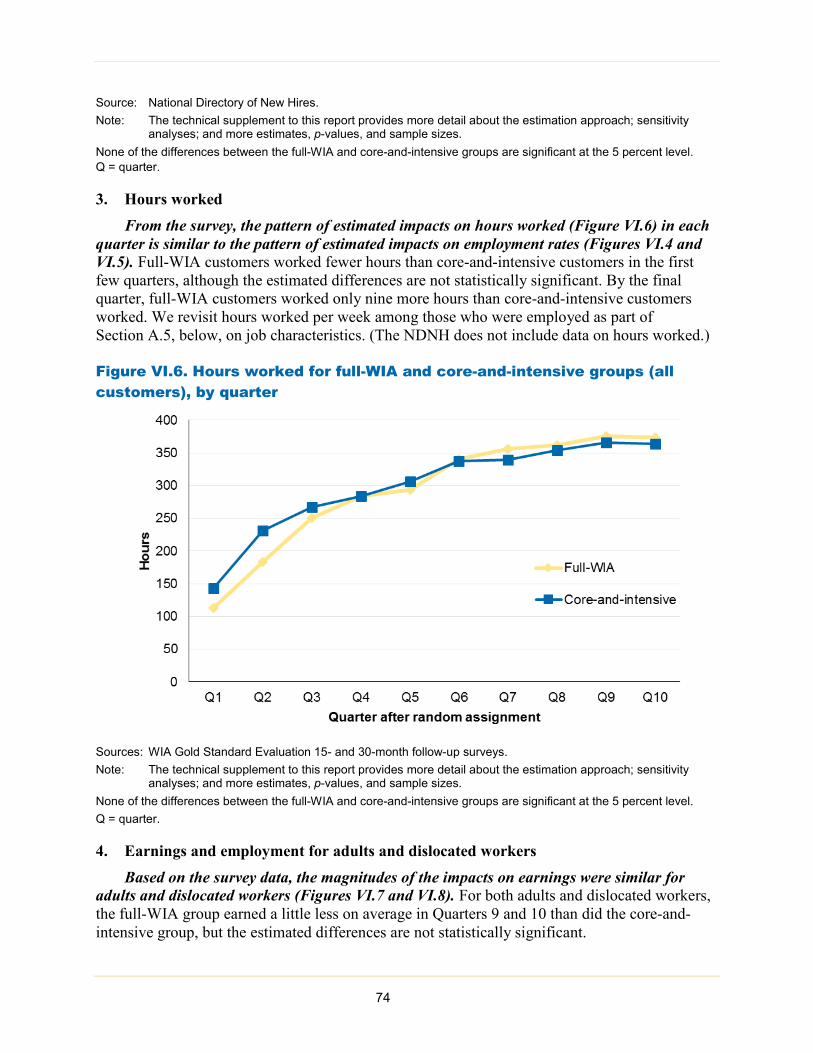
Source: National Directory of New Hires. Note: The technical supplement to this report provides more detail about the estimation approach; sensitivity
analyses; and more estimates, p-values, and sample sizes. None of the differences between the full-WIA and core-and-intensive groups are significant at the 5 percent level. Q = quarter.
3. Hours worked From the survey, the pattern of estimated impacts on hours worked (Figure VI.6) in each
quarter is similar to the pattern of estimated impacts on employment rates (Figures VI.4 and VI.5). Full-WIA customers worked fewer hours than core-and-intensive customers in the first few quarters, although the estimated differences are not statistically significant. By the final quarter, full-WIA customers worked only nine more hours than core-and-intensive customers worked. We revisit hours worked per week among those who were employed as part of Section A.5, below, on job characteristics. (The NDNH does not include data on hours worked.)
Figure VI.6. Hours worked for full-WIA and core-and-intensive groups (all customers), by quarter
Sources: WIA Gold Standard Evaluation 15- and 30-month follow-up surveys. Note: The technical supplement to this report provides more detail about the estimation approach; sensitivity
analyses; and more estimates, p-values, and sample sizes. None of the differences between the full-WIA and core-and-intensive groups are significant at the 5 percent level. Q = quarter.
4. Earnings and employment for adults and dislocated workers Based on the survey data, the magnitudes of the impacts on earnings were similar for
adults and dislocated workers (Figures VI.7 and VI.8). For both adults and dislocated workers, the full-WIA group earned a little less on average in Quarters 9 and 10 than did the core-and-intensive group, but the estimated differences are not statistically significant.
74
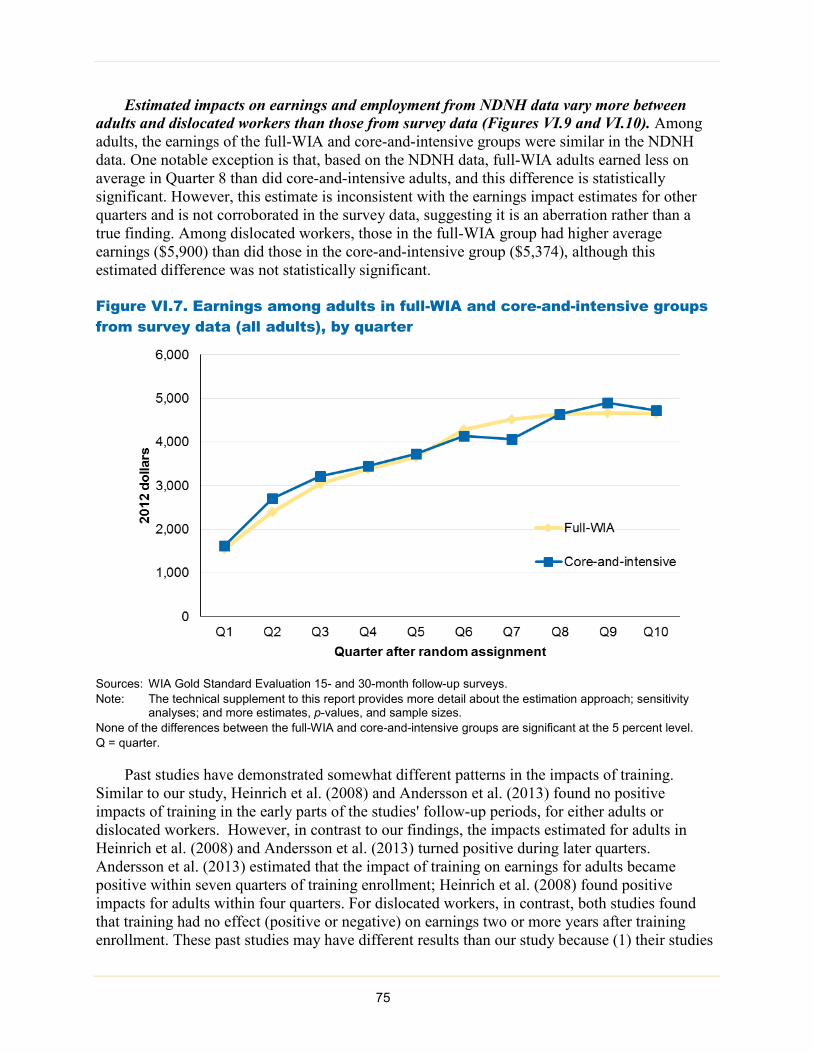
Estimated impacts on earnings and employment from NDNH data vary more between adults and dislocated workers than those from survey data (Figures VI.9 and VI.10). Among adults, the earnings of the full-WIA and core-and-intensive groups were similar in the NDNH data. One notable exception is that, based on the NDNH data, full-WIA adults earned less on average in Quarter 8 than did core-and-intensive adults, and this difference is statistically significant. However, this estimate is inconsistent with the earnings impact estimates for other quarters and is not corroborated in the survey data, suggesting it is an aberration rather than a true finding. Among dislocated workers, those in the full-WIA group had higher average earnings ($5,900) than did those in the core-and-intensive group ($5,374), although this estimated difference was not statistically significant.
Figure VI.7. Earnings among adults in full-WIA and core-and-intensive groups from survey data (all adults), by quarter
Sources: WIA Gold Standard Evaluation 15- and 30-month follow-up surveys. Note: The technical supplement to this report provides more detail about the estimation approach; sensitivity
analyses; and more estimates, p-values, and sample sizes. None of the differences between the full-WIA and core-and-intensive groups are significant at the 5 percent level. Q = quarter.
Past studies have demonstrated somewhat different patterns in the impacts of training. Similar to our study, Heinrich et al. (2008) and Andersson et al. (2013) found no positive impacts of training in the early parts of the studies' follow-up periods, for either adults or dislocated workers. However, in contrast to our findings, the impacts estimated for adults in Heinrich et al. (2008) and Andersson et al. (2013) turned positive during later quarters. Andersson et al. (2013) estimated that the impact of training on earnings for adults became positive within seven quarters of training enrollment; Heinrich et al. (2008) found positive impacts for adults within four quarters. For dislocated workers, in contrast, both studies found that training had no effect (positive or negative) on earnings two or more years after training enrollment. These past studies may have different results than our study because (1) their studies
75
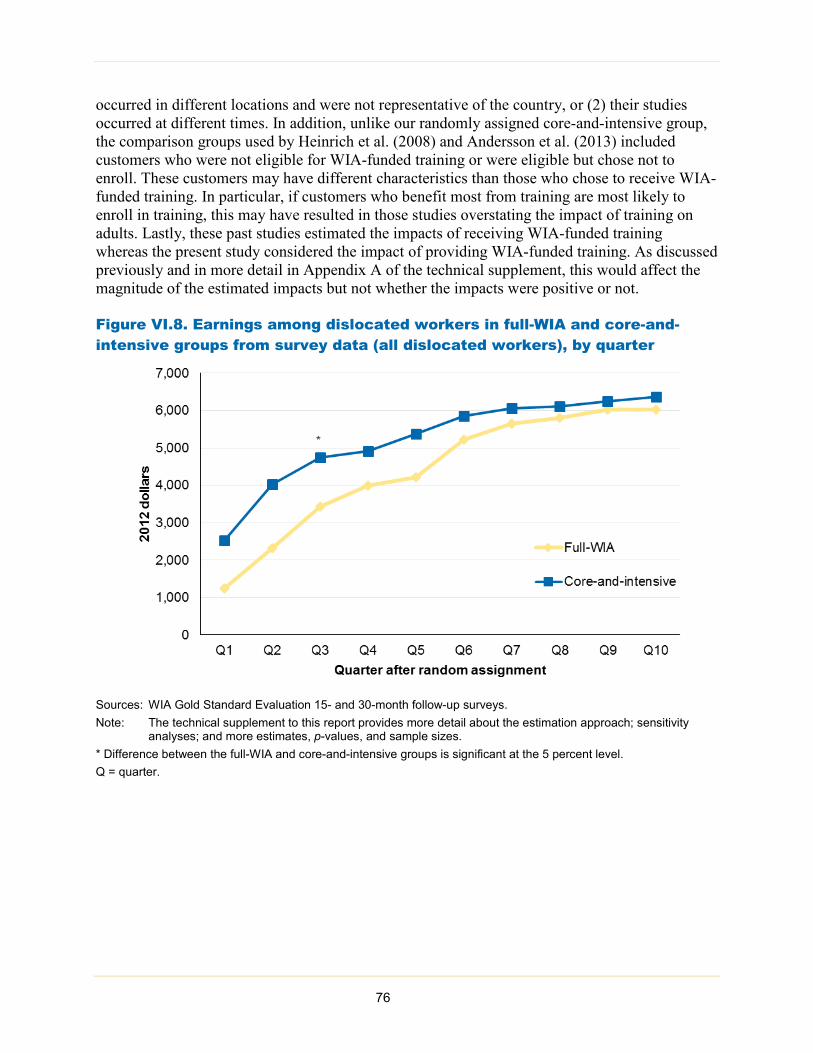
occurred in different locations and were not representative of the country, or (2) their studies occurred at different times. In addition, unlike our randomly assigned core-and-intensive group, the comparison groups used by Heinrich et al. (2008) and Andersson et al. (2013) included customers who were not eligible for WIA-funded training or were eligible but chose not to enroll. These customers may have different characteristics than those who chose to receive WIA-funded training. In particular, if customers who benefit most from training are most likely to enroll in training, this may have resulted in those studies overstating the impact of training on adults. Lastly, these past studies estimated the impacts of receiving WIA-funded training whereas the present study considered the impact of providing WIA-funded training. As discussed previously and in more detail in Appendix A of the technical supplement, this would affect the magnitude of the estimated impacts but not whether the impacts were positive or not.
Figure VI.8. Earnings among dislocated workers in full-WIA and core-and-intensive groups from survey data (all dislocated workers), by quarter
Sources: WIA Gold Standard Evaluation 15- and 30-month follow-up surveys. Note: The technical supplement to this report provides more detail about the estimation approach; sensitivity
analyses; and more estimates, p-values, and sample sizes. * Difference between the full-WIA and core-and-intensive groups is significant at the 5 percent level. Q = quarter.
76

Figure VI.9. Earnings among adults in full-WIA and core-and-intensive groups from NDNH data (all adults), by quarter
Source: National Directory of New Hires. Note: The technical supplement to this report provides more detail about the estimation approach; sensitivity
analyses; and more estimates, p-values, and sample sizes. * Difference between the full-WIA and core-and-intensive groups is significant at the 5 percent level. Q = quarter.
Figure VI.10. Earnings among dislocated workers in full-WIA and core-and-intensive groups from NDNH data (all dislocated workers), by quarter
77
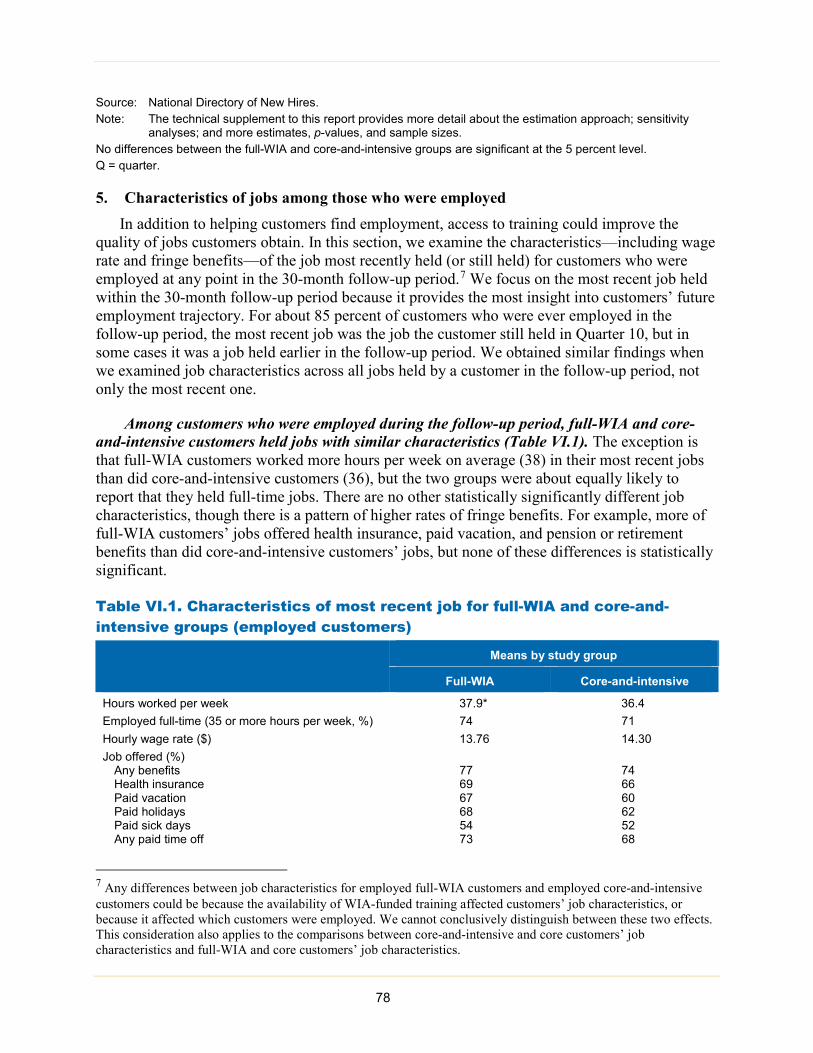
Source: National Directory of New Hires. Note: The technical supplement to this report provides more detail about the estimation approach; sensitivity
analyses; and more estimates, p-values, and sample sizes. No differences between the full-WIA and core-and-intensive groups are significant at the 5 percent level. Q = quarter.
5. Characteristics of jobs among those who were employed In addition to helping customers find employment, access to training could improve the
quality of jobs customers obtain. In this section, we examine the characteristics—including wage rate and fringe benefits—of the job most recently held (or still held) for customers who were employed at any point in the 30-month follow-up period.7 We focus on the most recent job held within the 30-month follow-up period because it provides the most insight into customers’ future employment trajectory. For about 85 percent of customers who were ever employed in the follow-up period, the most recent job was the job the customer still held in Quarter 10, but in some cases it was a job held earlier in the follow-up period. We obtained similar findings when we examined job characteristics across all jobs held by a customer in the follow-up period, not only the most recent one.
Among customers who were employed during the follow-up period, full-WIA and core-and-intensive customers held jobs with similar characteristics (Table VI.1). The exception is that full-WIA customers worked more hours per week on average (38) in their most recent jobs than did core-and-intensive customers (36), but the two groups were about equally likely to report that they held full-time jobs. There are no other statistically significantly different job characteristics, though there is a pattern of higher rates of fringe benefits. For example, more of full-WIA customers’ jobs offered health insurance, paid vacation, and pension or retirement benefits than did core-and-intensive customers’ jobs, but none of these differences is statistically significant.
Table VI.1. Characteristics of most recent job for full-WIA and core-and-intensive groups (employed customers)
Means by study group
Full-WIA Core-and-intensive
Hours worked per week 37.9* 36.4 Employed full-time (35 or more hours per week, %) 74 71 Hourly wage rate ($) 13.76 14.30 Job offered (%)
Any benefits 77 74 Health insurance 69 66 Paid vacation 67 60 Paid holidays 68 62 Paid sick days 54 52 Any paid time off 73 68
7 Any differences between job characteristics for employed full-WIA customers and employed core-and-intensive customers could be because the availability of WIA-funded training affected customers’ job characteristics, or because it affected which customers were employed. We cannot conclusively distinguish between these two effects. This consideration also applies to the comparisons between core-and-intensive and core customers’ job characteristics and full-WIA and core customers’ job characteristics. 78

Means by study group
Full-WIA Core-and-intensive Pension or retirement benefits 61 54 Tuition assistance or reimbursement 33 31
Job classified as (%) Regular full- or part-time 83 81 Self-employed or independent contractor 5 6 Temporary or day labor 8 6 On-call 4 5 Job at contractor 2 3
Unionized job (%) 8 8 Sources: WIA Gold Standard Evaluation 15- and 30-month follow-up surveys. Notes: Dollars are 2012 dollars. The technical supplement to this report provides more detail about the estimation
approach; sensitivity analyses; and more estimates, p-values, and sample sizes. Differences between study groups cannot be interpreted as causal impacts because not all members of each study group became employed.
* Difference between the full-WIA and core-and-intensive groups is significant at the 5 percent level.
Only about 8 percent of customers’ most recent jobs were unionized, with no differences between the study groups in rates of unionization. The average hourly wage rate for full-WIA customers’ jobs ($13.76) was lower than for core-and-intensive customers’ jobs ($14.30), but also not a statistically significant difference. These hourly wage rates were also similar to customers’ average hourly wage rate ($14.06) in the last job they held before random assignment (Table III.2).
6. Occupations of employed customers Customers found employment in many different occupations, but there were no
meaningful or statistically significant differences in occupations between the full-WIA and core-and-intensive groups (Table VI.2). Full-WIA customers who were employed most commonly held jobs as nursing, psychiatric, or home health aides; retail sales workers; information and record clerks; motor vehicle operators; or material-moving workers. These five occupations accounted for about half of the jobs.
Table VI.2. Most frequently reported occupations of current or most recent job reported for full-WIA and core-and-intensive groups (customers employed in follow-up period)
Mean for study group members
Full-WIA Core-and-intensive
Occupation of current or most recent job (%) Nursing, psychiatric, or home health aide 13 10 Retail sales worker 12 10 Information and record clerk 11 11 Motor vehicle operator 11 8 Material-moving worker 9 10 Material-recording, -scheduling, -dispatching, and
-distributing worker 8 10 Building cleaning and pest control worker 7 6 Other personal care and service worker 7 4 Health technologist and technician 5 6 Other office and administrative support worker 5 6
79
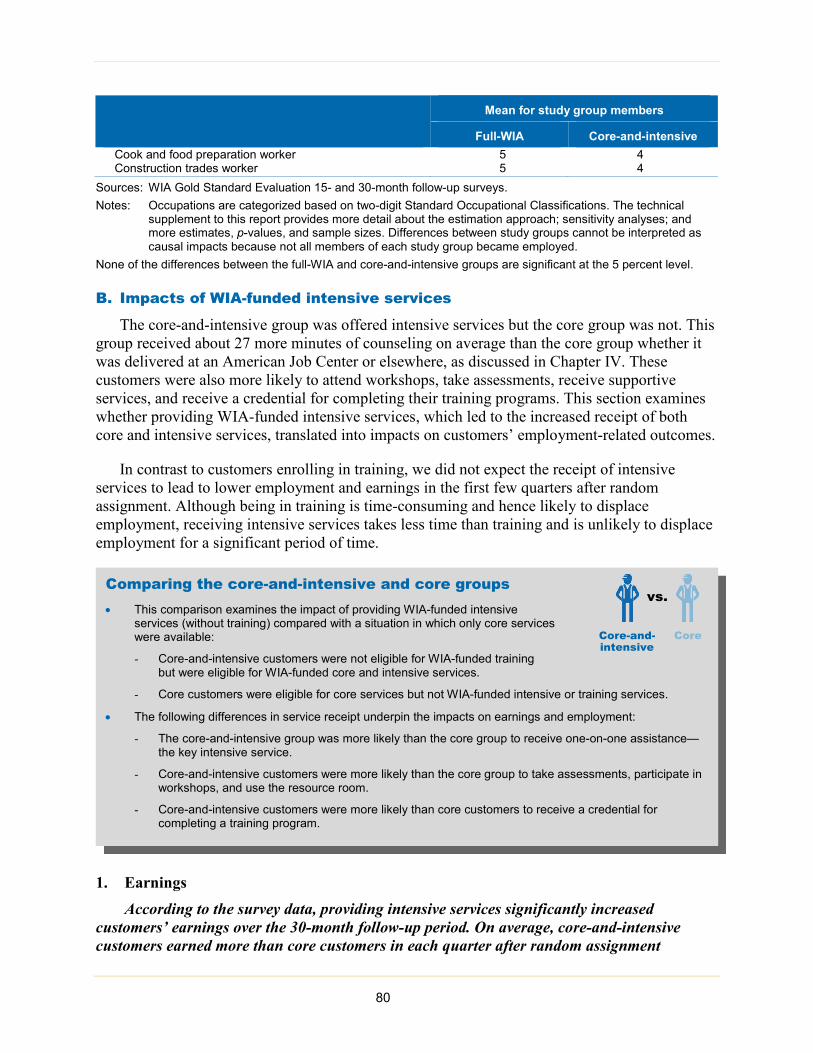
Mean for study group members
Full-WIA Core-and-intensive Cook and food preparation worker 5 4 Construction trades worker 5 4
Sources: WIA Gold Standard Evaluation 15- and 30-month follow-up surveys. Notes: Occupations are categorized based on two-digit Standard Occupational Classifications. The technical
supplement to this report provides more detail about the estimation approach; sensitivity analyses; and more estimates, p-values, and sample sizes. Differences between study groups cannot be interpreted as causal impacts because not all members of each study group became employed.
None of the differences between the full-WIA and core-and-intensive groups are significant at the 5 percent level.
B. Impacts of WIA-funded intensive services
The core-and-intensive group was offered intensive services but the core group was not. This group received about 27 more minutes of counseling on average than the core group whether it was delivered at an American Job Center or elsewhere, as discussed in Chapter IV. These customers were also more likely to attend workshops, take assessments, receive supportive services, and receive a credential for completing their training programs. This section examines whether providing WIA-funded intensive services, which led to the increased receipt of both core and intensive services, translated into impacts on customers’ employment-related outcomes.
In contrast to customers enrolling in training, we did not expect the receipt of intensive services to lead to lower employment and earnings in the first few quarters after random assignment. Although being in training is time-consuming and hence likely to displace employment, receiving intensive services takes less time than training and is unlikely to displace employment for a significant period of time.
Comparing the core-and-intensive and core groups
• This comparison examines the impact of providing WIA-funded intensive services (without training) compared with a situation in which only core services were available:
- Core-and-intensive customers were not eligible for WIA-funded training but were eligible for WIA-funded core and intensive services.
- Core customers were eligible for core services but not WIA-funded intensive or training services.
• The following differences in service receipt underpin the impacts on earnings and employment:
- The core-and-intensive group was more likely than the core group to receive one-on-one assistance—the key intensive service.
- Core-and-intensive customers were more likely than the core group to take assessments, participate in workshops, and use the resource room.
- Core-and-intensive customers were more likely than core customers to receive a credential for completing a training program.
vs.
Core-and-intensive
Core
1. Earnings According to the survey data, providing intensive services significantly increased
customers’ earnings over the 30-month follow-up period. On average, core-and-intensive customers earned more than core customers in each quarter after random assignment 80

(Figure VI.11). The significant positive impacts materialize beginning in Quarter 4 and persist through Quarter 10 except for Quarter 7, which is slightly higher than the threshold for statistical significance with a p-value of .051. As of Quarter 10, the average quarterly earnings of core-and-intensive customers ($5,435) are nearly $1,000 more than the average quarterly earnings of core customers ($4,472). The impact estimates for each of Quarters 5, 6, 8, 9, and 10 remain statisti-cally significant even using the more stringent significance test that accounts for the fact that we made three comparisons on the same outcome, as described in Chapter II. Over the full 30-month follow-up period, the core-and-intensive group earned $43,211, on average, compared with $36,079 for the core group, a difference of $7,133 (after rounding), which is also statistically significant using the more stringent criteria.
The NDNH data also support the conclusion that providing intensive services increased earnings, but the estimated impacts are smaller. Average earnings among core-and-intensive customers were higher than those of core customers in all but one of the first 12 calendar quarters after random assignment and statistically significant in Quarters 5 and 8 (Figure VI.12); the impact estimate for Quarter 5 also meets the more stringent statistical criteria. In contrast to the estimates with survey data, according to the NDNH data the impacts are negligible from Quarter 9 onward, but the total impact across the follow-up period is still positive. Core-and-intensive customers earned an average of $47,960 over the first 12 calendar quarters after random assignment, compared with $44,664 for core customers. This difference of $3,296 was statistically significant by traditional measures, but not by the more stringent significance test.
Figure VI.11. Earnings for core-and-intensive and core groups from survey data (all customers), by quarter
Sources: WIA Gold Standard Evaluation 15- and 30-month follow-up surveys. Note: The technical supplement to this report provides more detail about the estimation approach; sensitivity
analyses; and more estimates, p-values, and sample sizes. ^ Difference between the core-and-intensive and core groups is significant at the 5 percent level. Q = quarter.
81
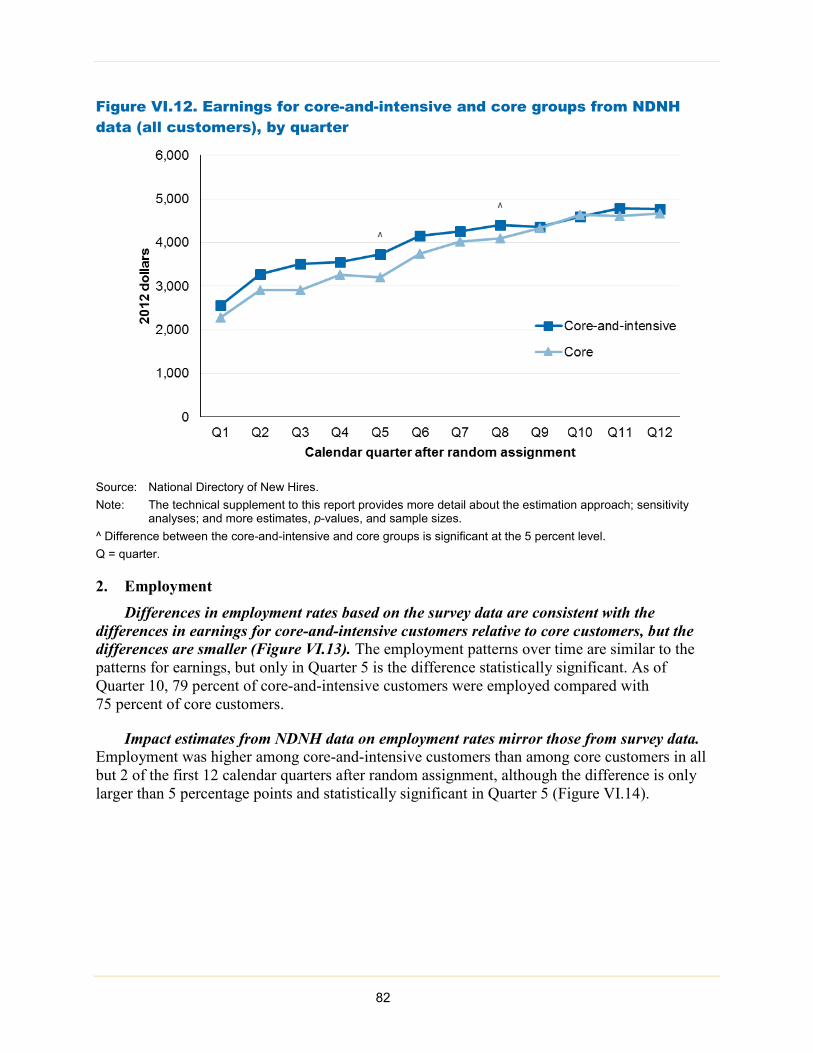
Figure VI.12. Earnings for core-and-intensive and core groups from NDNH data (all customers), by quarter
Source: National Directory of New Hires. Note: The technical supplement to this report provides more detail about the estimation approach; sensitivity
analyses; and more estimates, p-values, and sample sizes. ^ Difference between the core-and-intensive and core groups is significant at the 5 percent level. Q = quarter.
2. Employment Differences in employment rates based on the survey data are consistent with the
differences in earnings for core-and-intensive customers relative to core customers, but the differences are smaller (Figure VI.13). The employment patterns over time are similar to the patterns for earnings, but only in Quarter 5 is the difference statistically significant. As of Quarter 10, 79 percent of core-and-intensive customers were employed compared with 75 percent of core customers.
Impact estimates from NDNH data on employment rates mirror those from survey data. Employment was higher among core-and-intensive customers than among core customers in all but 2 of the first 12 calendar quarters after random assignment, although the difference is only larger than 5 percentage points and statistically significant in Quarter 5 (Figure VI.14).
82

Figure VI.13. Employment rates for core-and-intensive and core groups from survey data (all customers), by quarter
Sources: WIA Gold Standard Evaluation 15- and 30-month follow-up surveys. Note: The technical supplement to this report provides more detail about the estimation approach; sensitivity
analyses; and more estimates, p-values, and sample sizes. ^ Difference between the core-and-intensive and core groups is significant at the 5 percent level. Q = quarter.
Figure VI.14. Employment rates for core-and-intensive and core groups from NDNH data (all customers), by quarter
83
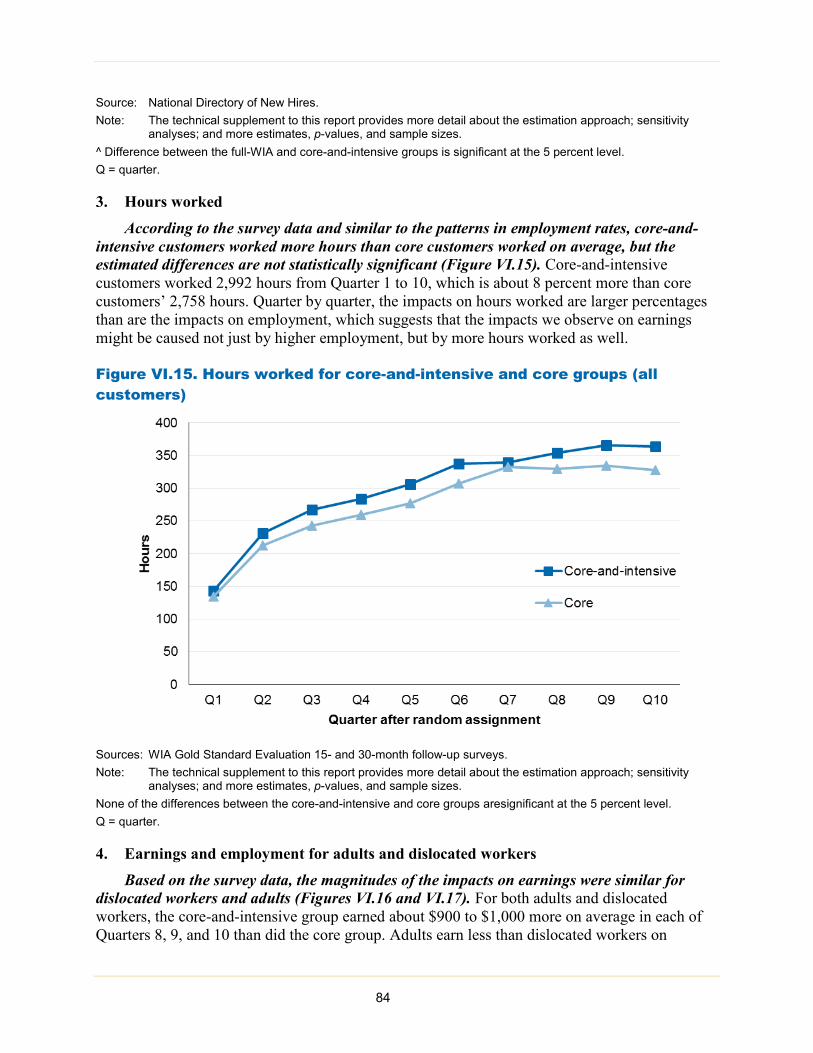
Source: National Directory of New Hires. Note: The technical supplement to this report provides more detail about the estimation approach; sensitivity
analyses; and more estimates, p-values, and sample sizes. ^ Difference between the full-WIA and core-and-intensive groups is significant at the 5 percent level. Q = quarter.
3. Hours worked According to the survey data and similar to the patterns in employment rates, core-and-
intensive customers worked more hours than core customers worked on average, but the estimated differences are not statistically significant (Figure VI.15). Core-and-intensive customers worked 2,992 hours from Quarter 1 to 10, which is about 8 percent more than core customers’ 2,758 hours. Quarter by quarter, the impacts on hours worked are larger percentages than are the impacts on employment, which suggests that the impacts we observe on earnings might be caused not just by higher employment, but by more hours worked as well.
Figure VI.15. Hours worked for core-and-intensive and core groups (all customers)
Sources: WIA Gold Standard Evaluation 15- and 30-month follow-up surveys. Note: The technical supplement to this report provides more detail about the estimation approach; sensitivity
analyses; and more estimates, p-values, and sample sizes. None of the differences between the core-and-intensive and core groups aresignificant at the 5 percent level. Q = quarter.
4. Earnings and employment for adults and dislocated workers Based on the survey data, the magnitudes of the impacts on earnings were similar for
dislocated workers and adults (Figures VI.16 and VI.17). For both adults and dislocated workers, the core-and-intensive group earned about $900 to $1,000 more on average in each of Quarters 8, 9, and 10 than did the core group. Adults earn less than dislocated workers on
84
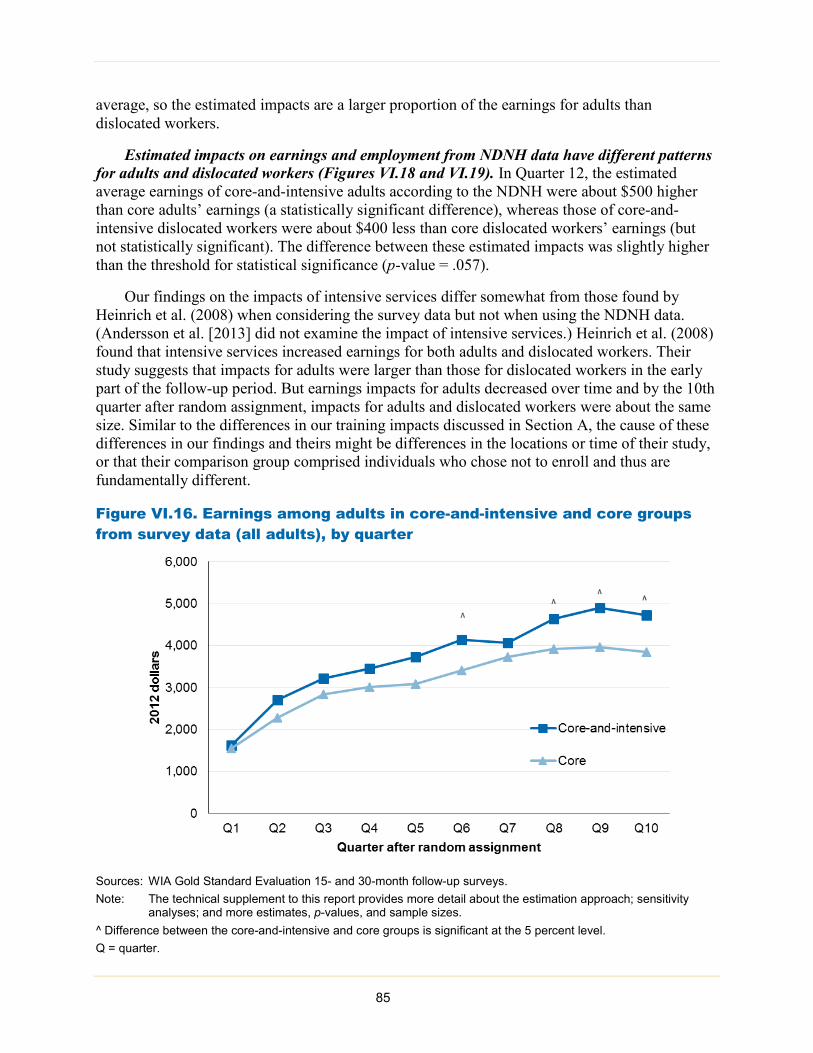
average, so the estimated impacts are a larger proportion of the earnings for adults than dislocated workers.
Estimated impacts on earnings and employment from NDNH data have different patterns for adults and dislocated workers (Figures VI.18 and VI.19). In Quarter 12, the estimated average earnings of core-and-intensive adults according to the NDNH were about $500 higher than core adults’ earnings (a statistically significant difference), whereas those of core-and-intensive dislocated workers were about $400 less than core dislocated workers’ earnings (but not statistically significant). The difference between these estimated impacts was slightly higher than the threshold for statistical significance (p-value = .057).
Our findings on the impacts of intensive services differ somewhat from those found by Heinrich et al. (2008) when considering the survey data but not when using the NDNH data. (Andersson et al. [2013] did not examine the impact of intensive services.) Heinrich et al. (2008) found that intensive services increased earnings for both adults and dislocated workers. Their study suggests that impacts for adults were larger than those for dislocated workers in the early part of the follow-up period. But earnings impacts for adults decreased over time and by the 10th quarter after random assignment, impacts for adults and dislocated workers were about the same size. Similar to the differences in our training impacts discussed in Section A, the cause of these differences in our findings and theirs might be differences in the locations or time of their study, or that their comparison group comprised individuals who chose not to enroll and thus are fundamentally different.
Figure VI.16. Earnings among adults in core-and-intensive and core groups from survey data (all adults), by quarter
Sources: WIA Gold Standard Evaluation 15- and 30-month follow-up surveys. Note: The technical supplement to this report provides more detail about the estimation approach; sensitivity
analyses; and more estimates, p-values, and sample sizes. ^ Difference between the core-and-intensive and core groups is significant at the 5 percent level. Q = quarter.
85
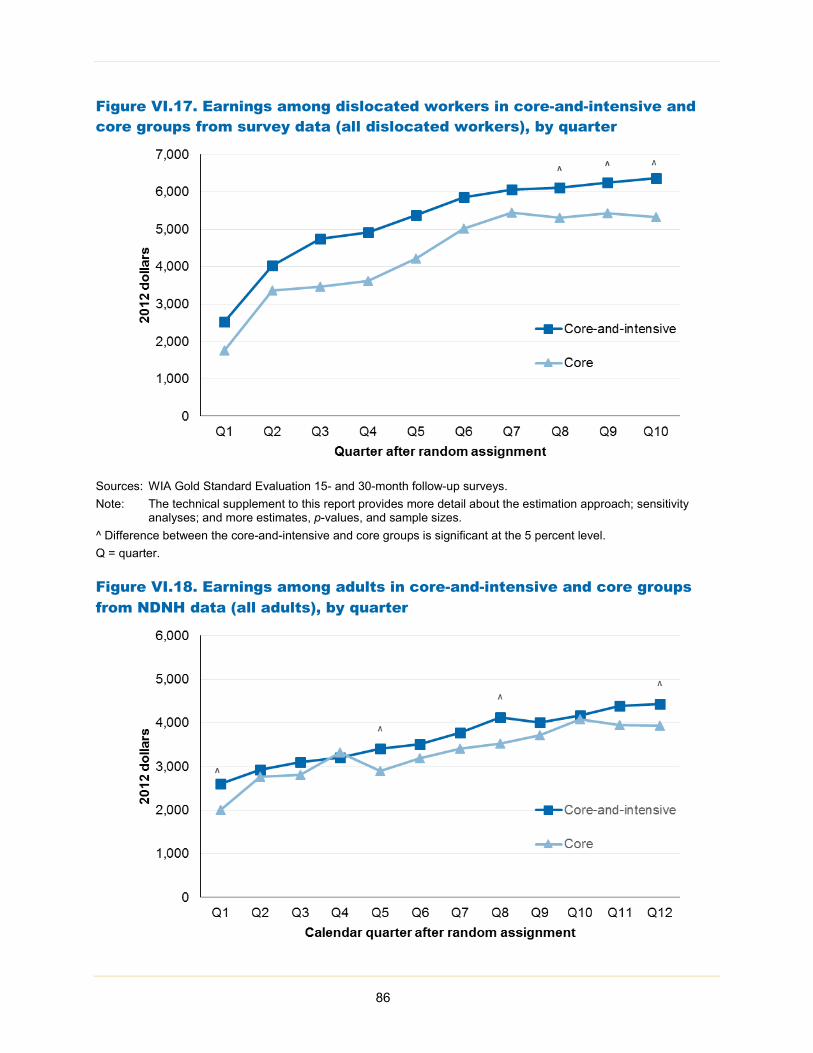
Figure VI.17. Earnings among dislocated workers in core-and-intensive and core groups from survey data (all dislocated workers), by quarter
Sources: WIA Gold Standard Evaluation 15- and 30-month follow-up surveys. Note: The technical supplement to this report provides more detail about the estimation approach; sensitivity
analyses; and more estimates, p-values, and sample sizes. ^ Difference between the core-and-intensive and core groups is significant at the 5 percent level. Q = quarter.
Figure VI.18. Earnings among adults in core-and-intensive and core groups from NDNH data (all adults), by quarter
86
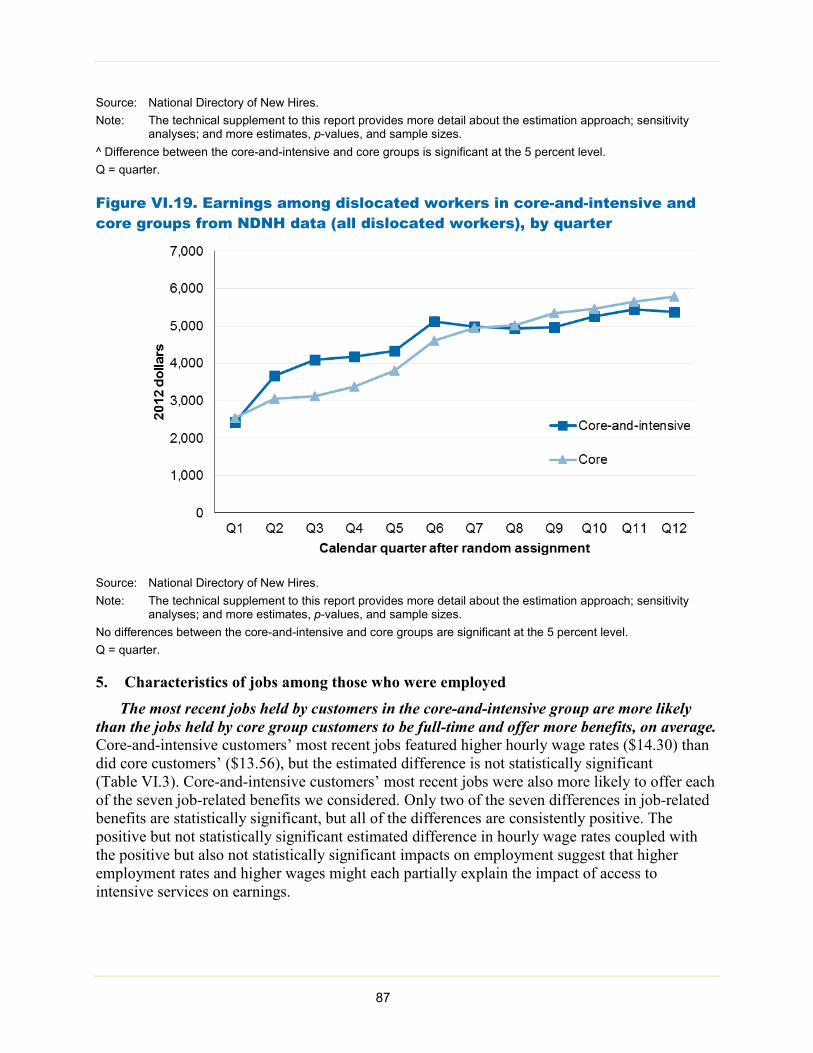
Source: National Directory of New Hires. Note: The technical supplement to this report provides more detail about the estimation approach; sensitivity
analyses; and more estimates, p-values, and sample sizes. ^ Difference between the core-and-intensive and core groups is significant at the 5 percent level. Q = quarter.
Figure VI.19. Earnings among dislocated workers in core-and-intensive and core groups from NDNH data (all dislocated workers), by quarter
Source: National Directory of New Hires. Note: The technical supplement to this report provides more detail about the estimation approach; sensitivity
analyses; and more estimates, p-values, and sample sizes. No differences between the core-and-intensive and core groups are significant at the 5 percent level. Q = quarter.
5. Characteristics of jobs among those who were employed The most recent jobs held by customers in the core-and-intensive group are more likely
than the jobs held by core group customers to be full-time and offer more benefits, on average. Core-and-intensive customers’ most recent jobs featured higher hourly wage rates ($14.30) than did core customers’ ($13.56), but the estimated difference is not statistically significant (Table VI.3). Core-and-intensive customers’ most recent jobs were also more likely to offer each of the seven job-related benefits we considered. Only two of the seven differences in job-related benefits are statistically significant, but all of the differences are consistently positive. The positive but not statistically significant estimated difference in hourly wage rates coupled with the positive but also not statistically significant impacts on employment suggest that higher employment rates and higher wages might each partially explain the impact of access to intensive services on earnings.
87

Table VI.3. Characteristics of most recent job for core-and-intensive and core groups from survey data (employed customers)
Mean by study group
Core-and-intensive Core
Hours worked per week 36.4 36.0 Employed full-time (35 or more hours per week, %) 71^ 66 Hourly wage rate ($) 14.30 13.56 Job offered (%)
Any benefits 74 72 Health insurance 66 60 Paid vacation (other than holidays) 60 57 Paid holidays 62^ 55 Paid sick days 52^ 42 Any paid time off 68 64 Pension or retirement benefits 54 51 Tuition assistance or reimbursement 31 26
Job classified as (%) Regular full- or part-time 81 79 Self-employed or independent contractor 6 8 Temporary or day labor 6 9 On-call 5 3 Job at contractor 3^ 2
Unionized job (%) 8 6 Sources: WIA Gold Standard Evaluation 15- and 30-month follow-up surveys. Notes: Dollars are 2012 dollars. The technical supplement to this report provides more detail about the estimation
approach; sensitivity analyses; and more estimates, p-values, and sample sizes. Differences between study groups cannot be interpreted as causal impacts because not all members of each study group became employed.
^ Difference between the core-and-intensive and core groups is significant at the 5 percent level.
6. Occupations of employed customers Core-and-intensive and core customers who were employed had broadly similar
occupations except core-and-intensive customers were less likely to be employed in retail sales (Table VI.4). Core-and-intensive customers were about 6 percentage points (after rounding) less likely to have been employed in retail sales in their most recent jobs than were core customers, but there are few other notable differences. Retail sales jobs are lower paying on average than are other common occupations for study group members, and the fact that core customers are more likely to be employed in retail sales may be associated with their lower (but not statistically different) wage rates as discussed in Section B.5.
88
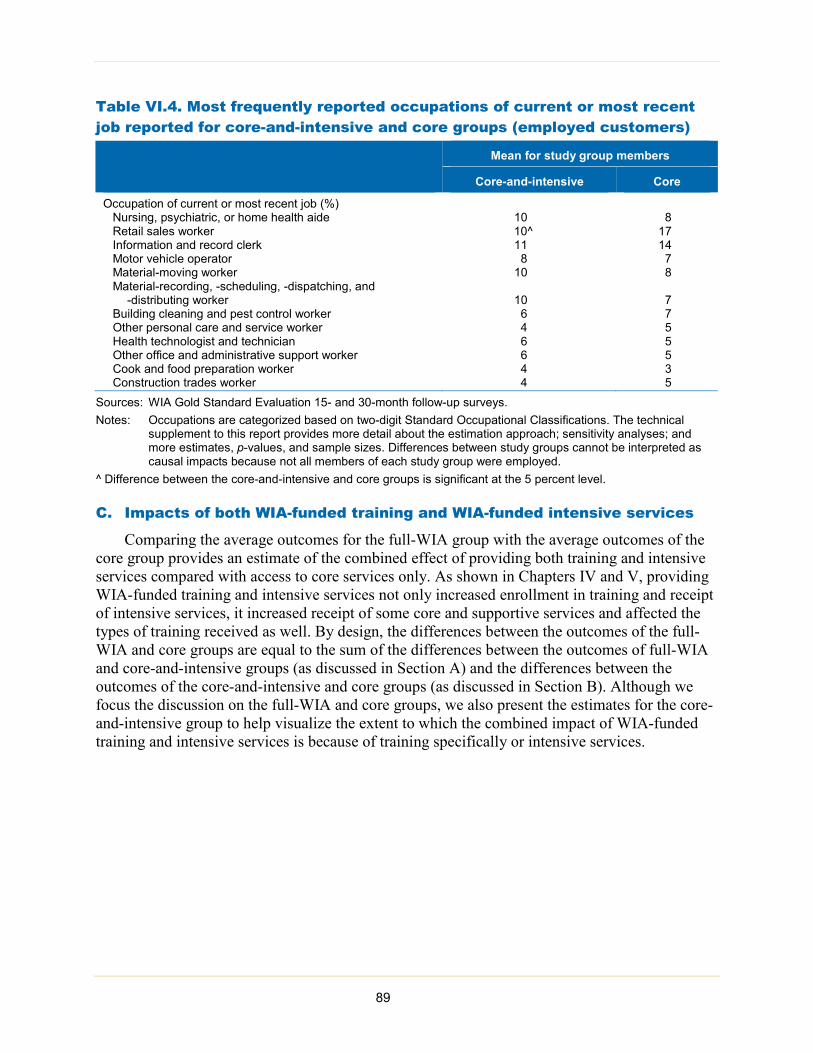
Table VI.4. Most frequently reported occupations of current or most recent job reported for core-and-intensive and core groups (employed customers)
Mean for study group members
Core-and-intensive Core
Occupation of current or most recent job (%) Nursing, psychiatric, or home health aide 10 8 Retail sales worker 10^ 17 Information and record clerk 11 14 Motor vehicle operator 8 7 Material-moving worker 10 8 Material-recording, -scheduling, -dispatching, and
-distributing worker 10 7 Building cleaning and pest control worker 6 7 Other personal care and service worker 4 5 Health technologist and technician 6 5 Other office and administrative support worker 6 5 Cook and food preparation worker 4 3 Construction trades worker 4 5
Sources: WIA Gold Standard Evaluation 15- and 30-month follow-up surveys. Notes: Occupations are categorized based on two-digit Standard Occupational Classifications. The technical
supplement to this report provides more detail about the estimation approach; sensitivity analyses; and more estimates, p-values, and sample sizes. Differences between study groups cannot be interpreted as causal impacts because not all members of each study group were employed.
^ Difference between the core-and-intensive and core groups is significant at the 5 percent level.
C. Impacts of both WIA-funded training and WIA-funded intensive services
Comparing the average outcomes for the full-WIA group with the average outcomes of the core group provides an estimate of the combined effect of providing both training and intensive services compared with access to core services only. As shown in Chapters IV and V, providing WIA-funded training and intensive services not only increased enrollment in training and receipt of intensive services, it increased receipt of some core and supportive services and affected the types of training received as well. By design, the differences between the outcomes of the full-WIA and core groups are equal to the sum of the differences between the outcomes of full-WIA and core-and-intensive groups (as discussed in Section A) and the differences between the outcomes of the core-and-intensive and core groups (as discussed in Section B). Although we focus the discussion on the full-WIA and core groups, we also present the estimates for the core-and-intensive group to help visualize the extent to which the combined impact of WIA-funded training and intensive services is because of training specifically or intensive services.
89

1. Earnings According to the survey data, providing both WIA-funded training and intensive services
increased average earnings in the second half of the follow-up period (Figure VI.20). The full-WIA group earned about $3,245 more in total than the core group from Quarters 6 through 10, and $3,449 more in total from Quarters 1 through 10. The quarterly impact estimates of about $600 per quarter are significant in Quarters 6, 7, and 10, and close to significant in Quarters 5, 8, and 9. However, none of these impact estimates are statistically significant using the more stringent statistical test that accounts for the fact that we made three comparisons across groups for each outcome.
Figure VI.20. Earnings for each study group from survey data (all customers), by quarter
Comparing the full-WIA and core groups
• This comparison examines the impact of providing the full set of WIA services, including WIA-funded training and intensive services, compared with a situation in which only core services are available:
- Full-WIA customers were eligible for WIA-funded training in the same way they would have been in the absence of the study. They were also eligible for WIA-funded core and intensive services.
- Core customers were eligible for core services but not WIA-funded intensive or training services.
• The following differences in service receipt underpin the impacts on earnings and employment:
- Full-WIA customers were more likely than core customers to enroll in training and to receive credentials.
- WIA, rather than other sources, funded most full-WIA customers’ training.
- Full-WIA customers were more likely than core customers to receive one-on-one assistance, take assessments, participate in workshops, use a resource room, and receive supportive services.
vs.
Full-WIA Core
90
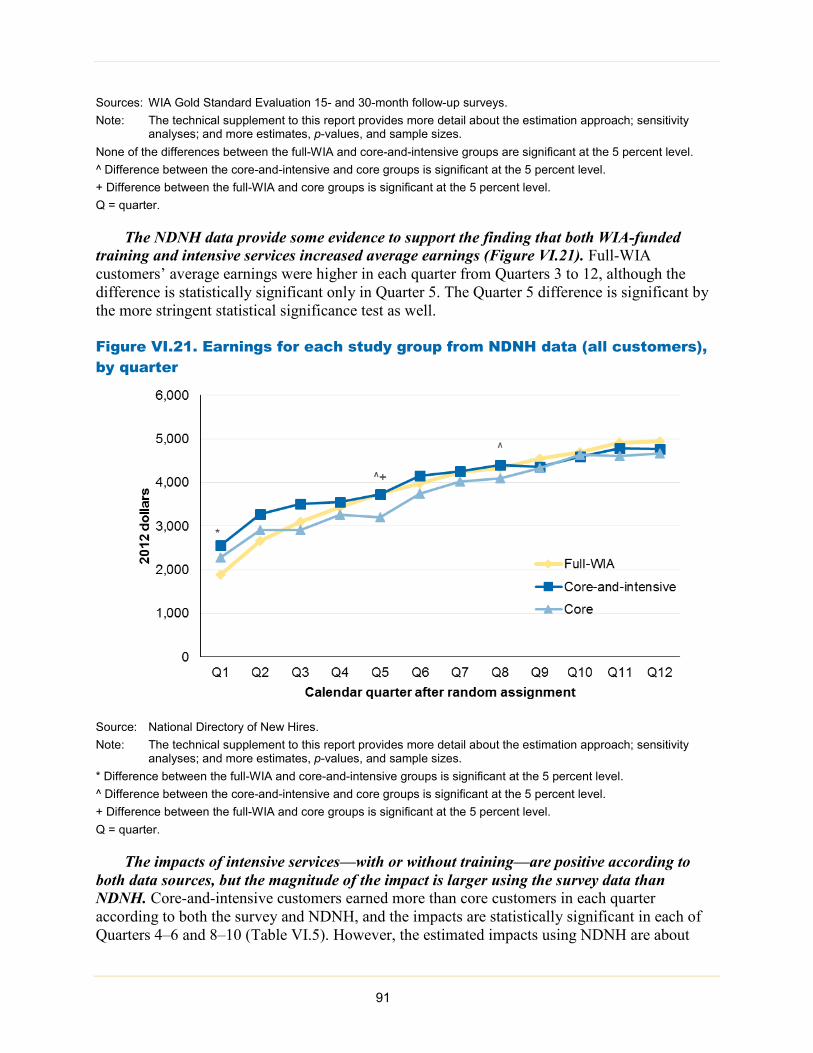
Sources: WIA Gold Standard Evaluation 15- and 30-month follow-up surveys. Note: The technical supplement to this report provides more detail about the estimation approach; sensitivity
analyses; and more estimates, p-values, and sample sizes. None of the differences between the full-WIA and core-and-intensive groups are significant at the 5 percent level. ^ Difference between the core-and-intensive and core groups is significant at the 5 percent level. + Difference between the full-WIA and core groups is significant at the 5 percent level. Q = quarter.
The NDNH data provide some evidence to support the finding that both WIA-funded training and intensive services increased average earnings (Figure VI.21). Full-WIA customers’ average earnings were higher in each quarter from Quarters 3 to 12, although the difference is statistically significant only in Quarter 5. The Quarter 5 difference is significant by the more stringent statistical significance test as well.
Figure VI.21. Earnings for each study group from NDNH data (all customers), by quarter
Source: National Directory of New Hires. Note: The technical supplement to this report provides more detail about the estimation approach; sensitivity
analyses; and more estimates, p-values, and sample sizes. * Difference between the full-WIA and core-and-intensive groups is significant at the 5 percent level. ^ Difference between the core-and-intensive and core groups is significant at the 5 percent level. + Difference between the full-WIA and core groups is significant at the 5 percent level. Q = quarter.
The impacts of intensive services—with or without training—are positive according to both data sources, but the magnitude of the impact is larger using the survey data than NDNH. Core-and-intensive customers earned more than core customers in each quarter according to both the survey and NDNH, and the impacts are statistically significant in each of Quarters 4–6 and 8–10 (Table VI.5). However, the estimated impacts using NDNH are about
91

half as large in each quarter, and only statistically significant in Quarters 5 and 8. Additionally, the survey impact estimates showed large positive effects in Quarters 9 and 10 of over $900, whereas the NDNH impact estimates indicate there is no persistent impact in the later quarters. A similar pattern of differences in impacts according to the two data sources is evident for the comparison of full-WIA and core customers.
Table VI.5. Impact estimates by data source (all customers) and quarter
F – C&I impact C&I – C impact F – C impact
Survey NDNH Survey NDNH Survey NDNH
Quarter 1 earnings -589 -683* 376 287 -213 -396 Quarter 2 earnings -896 -600 531 363 -365 -238 Quarter 3 earnings -663 -402 780 592 117 190 Quarter 4 earnings -434 -128 821^ 297 387 168 Quarter 5 earnings -541 17 881^ 526^ 340 543+ Quarter 6 earnings -186 -177 794^ 410 608+ 233 Quarter 7 earnings 82 -8 475 237 557+ 229 Quarter 8 earnings -129 -65 765^ 310^ 636 245 Quarter 9 earnings -231 199 903^ 20 672 219 Quarter 10 earnings -191 105 963^ -33 773+ 72 Quarter 11 earnings -- 127 -- 175 -- 302 Quarter 12 earnings -- 163 -- 112 -- 276
Sources: WIA Gold Standard Evaluation 15- and 30-month follow-up surveys and National Directory of New Hires. Note: All estimates are in 2012 dollars. * Difference between the full-WIA and core-and-intensive groups is significant at the 5 percent level. ^ Difference between the core-and-intensive and core groups is significant at the 5 percent level. + Difference between the full-WIA and core groups is significant at the 5 percent level. F = full-WIA group; C&I = core-and-intensive group; C = core group.
We mostly attribute the higher earnings for the full-WIA group compared with the core group to intensive services rather than WIA-funded training. This conclusion draws on the findings in Sections A and B, which found that WIA-funded training did not affect earnings but providing intensive services had a positive impact on earnings.
2. Employment According to the survey data, customers in the full-WIA group were significantly more
likely to be employed in Quarter 5 than were core customers but not in any subsequent quarter (Figure VI.22). As of Quarter 10, 79 percent of the full-WIA group was employed, compared with 75 percent of the core group. We found a similar pattern in the NDNH data (Figure VI.23). In most quarters, employment rates were similar between the full-WIA and core groups. In fact, by Quarter 12, 70 percent of full-WIA customers and 70 percent of core customers were employed. These findings suggest that impacts on employment alone do not explain the impacts we observe for earnings. We explore other explanations when we discuss effects on hours worked and wage rates.
92
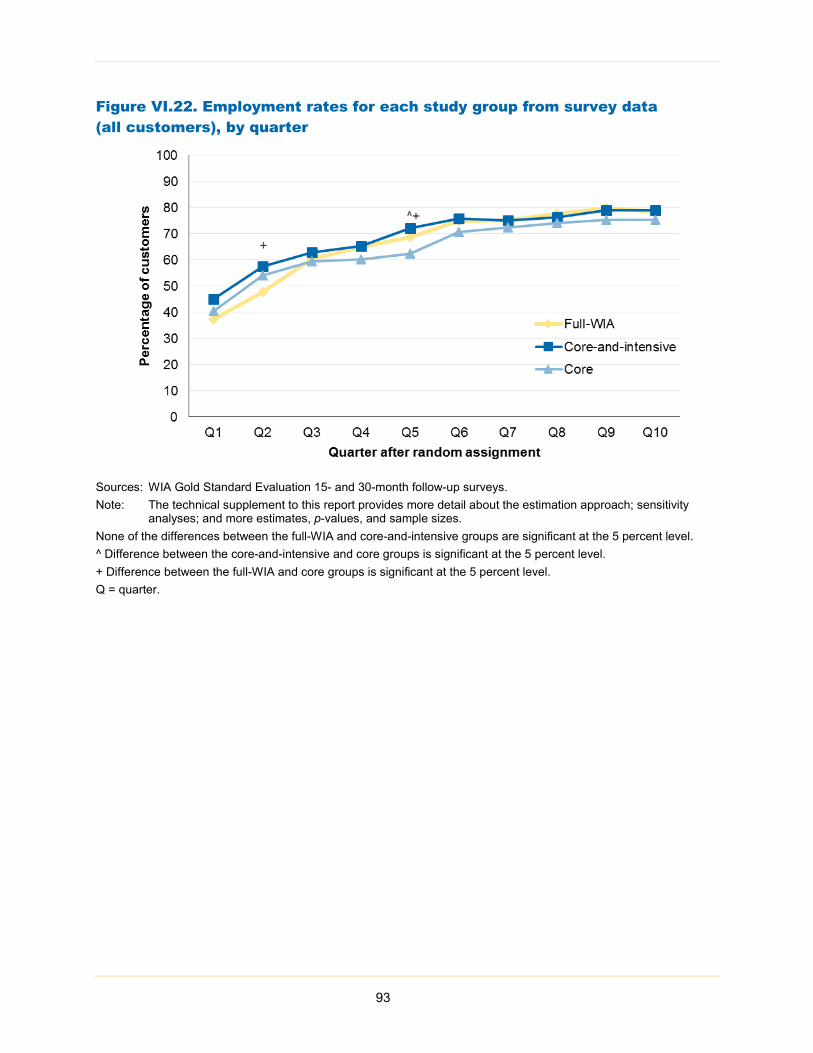
Figure VI.22. Employment rates for each study group from survey data (all customers), by quarter
Sources: WIA Gold Standard Evaluation 15- and 30-month follow-up surveys. Note: The technical supplement to this report provides more detail about the estimation approach; sensitivity
analyses; and more estimates, p-values, and sample sizes. None of the differences between the full-WIA and core-and-intensive groups are significant at the 5 percent level. ^ Difference between the core-and-intensive and core groups is significant at the 5 percent level. + Difference between the full-WIA and core groups is significant at the 5 percent level. Q = quarter.
93
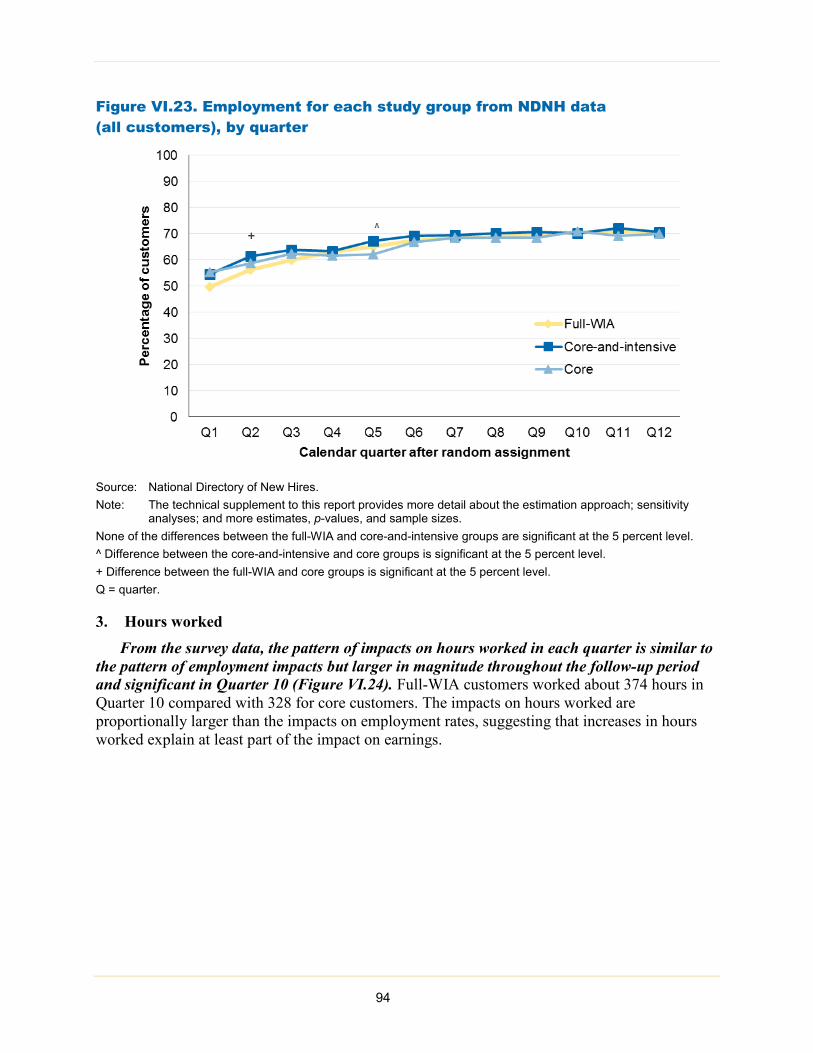
Figure VI.23. Employment for each study group from NDNH data (all customers), by quarter
Source: National Directory of New Hires. Note: The technical supplement to this report provides more detail about the estimation approach; sensitivity
analyses; and more estimates, p-values, and sample sizes. None of the differences between the full-WIA and core-and-intensive groups are significant at the 5 percent level. ^ Difference between the core-and-intensive and core groups is significant at the 5 percent level. + Difference between the full-WIA and core groups is significant at the 5 percent level. Q = quarter.
3. Hours worked From the survey data, the pattern of impacts on hours worked in each quarter is similar to
the pattern of employment impacts but larger in magnitude throughout the follow-up period and significant in Quarter 10 (Figure VI.24). Full-WIA customers worked about 374 hours in Quarter 10 compared with 328 for core customers. The impacts on hours worked are proportionally larger than the impacts on employment rates, suggesting that increases in hours worked explain at least part of the impact on earnings.
94

Figure VI.24. Hours worked for each study group (all customers)
Sources: WIA Gold Standard Evaluation 15- and 30-month follow-up surveys. Note: The technical supplement to this report provides more detail about the estimation approach; sensitivity
analyses; and more estimates, p-values, and sample sizes. None of the differences between the full-WIA and core-and-intensive groups are significant at the 5 percent level. None of the differences between the core-and-intensive and core groups are significant at the 5 percent level. + Difference between the full-WIA and core groups is significant at the 5 percent level. Q = quarter.
4. Earnings and employment for adults and dislocated workers The magnitudes of the impacts on earnings were similar for dislocated workers and adults
with both the survey and NDNH data (Figures VI.25–VI.28). Using the survey data, the full-WIA group earned about $600 to $800 more, on average, in Quarters 9 and 10 than did the core group, which was true for both adults and dislocated workers. These estimated differences are not statistically significant, although the difference for adults is close to the threshold for statistical significance (p-value = .070). For adults, the differences were similar and statistically significant in Quarters 6–8 as well. As was the case when we pooled adults and dislocated workers, estimated impacts on earnings from NDNH data for adults and dislocated workers separately are smaller than those from survey data. For example, in Quarter 12, full-WIA adults’ average earnings were $353 higher than core adults', whereas those of full-WIA dislocated workers were $110 more than core dislocated workers, neither of which is statistically significant.
95
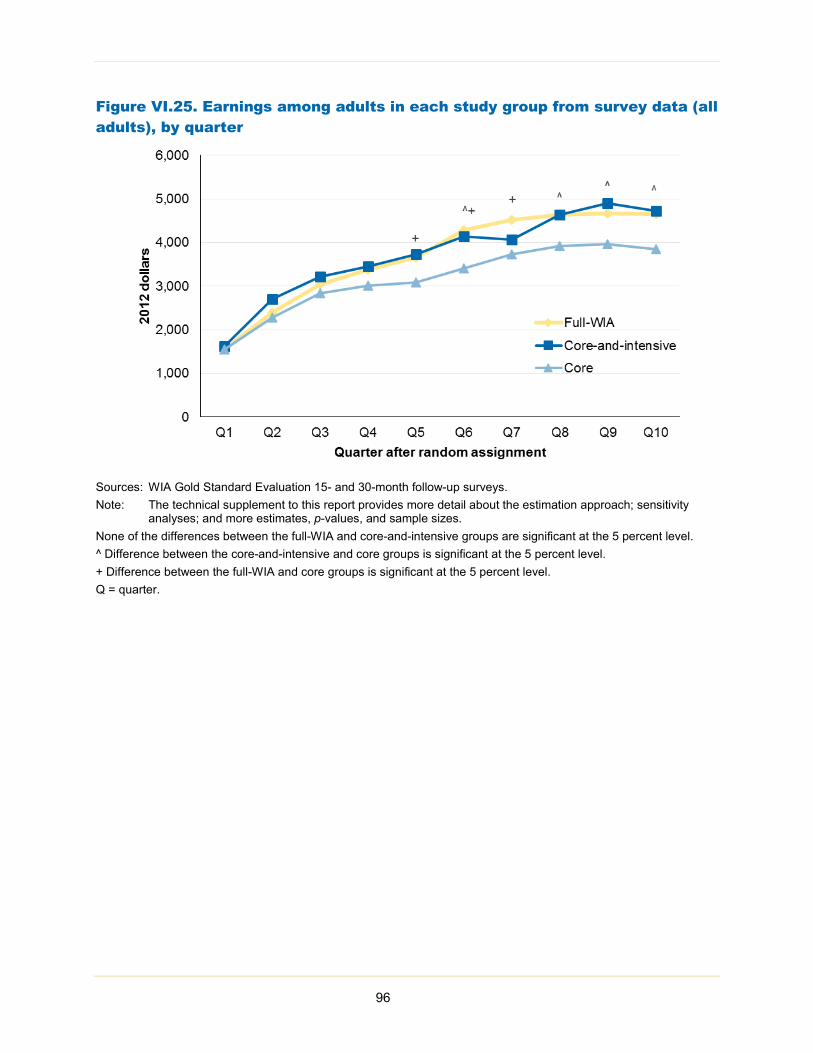
Figure VI.25. Earnings among adults in each study group from survey data (all adults), by quarter
Sources: WIA Gold Standard Evaluation 15- and 30-month follow-up surveys. Note: The technical supplement to this report provides more detail about the estimation approach; sensitivity
analyses; and more estimates, p-values, and sample sizes. None of the differences between the full-WIA and core-and-intensive groups are significant at the 5 percent level. ^ Difference between the core-and-intensive and core groups is significant at the 5 percent level. + Difference between the full-WIA and core groups is significant at the 5 percent level. Q = quarter.
96
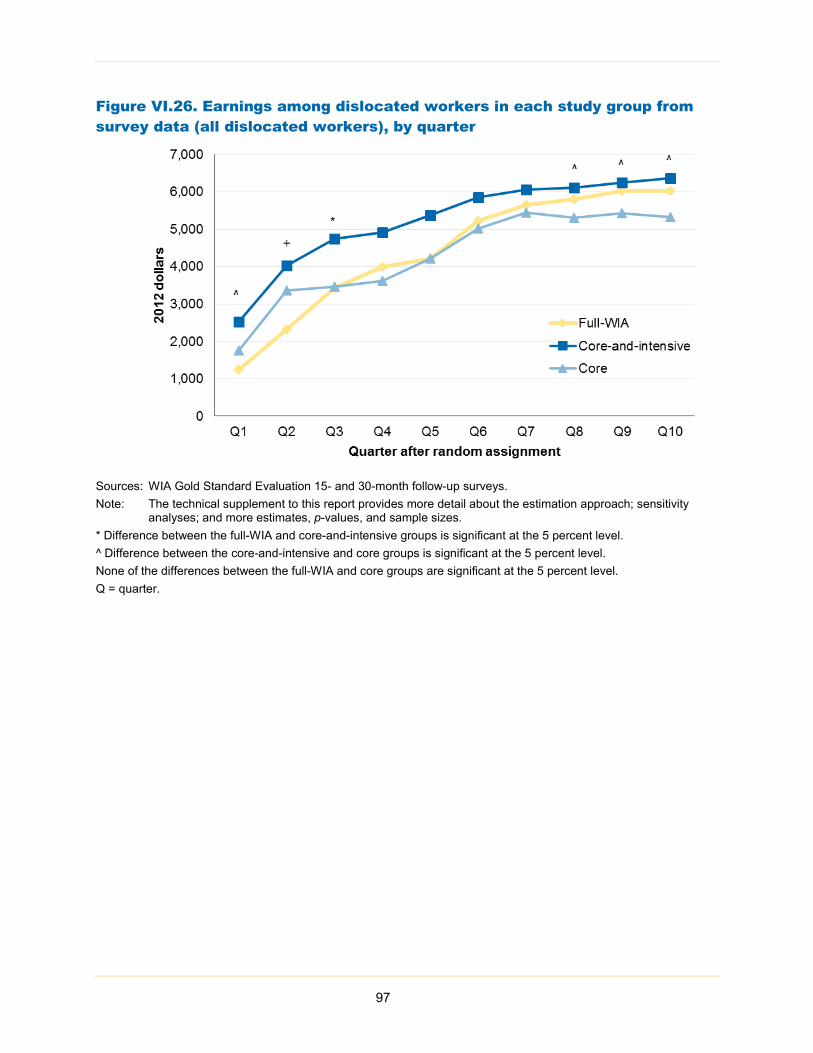
Figure VI.26. Earnings among dislocated workers in each study group from survey data (all dislocated workers), by quarter
Sources: WIA Gold Standard Evaluation 15- and 30-month follow-up surveys. Note: The technical supplement to this report provides more detail about the estimation approach; sensitivity
analyses; and more estimates, p-values, and sample sizes. * Difference between the full-WIA and core-and-intensive groups is significant at the 5 percent level. ^ Difference between the core-and-intensive and core groups is significant at the 5 percent level. None of the differences between the full-WIA and core groups are significant at the 5 percent level. Q = quarter.
97
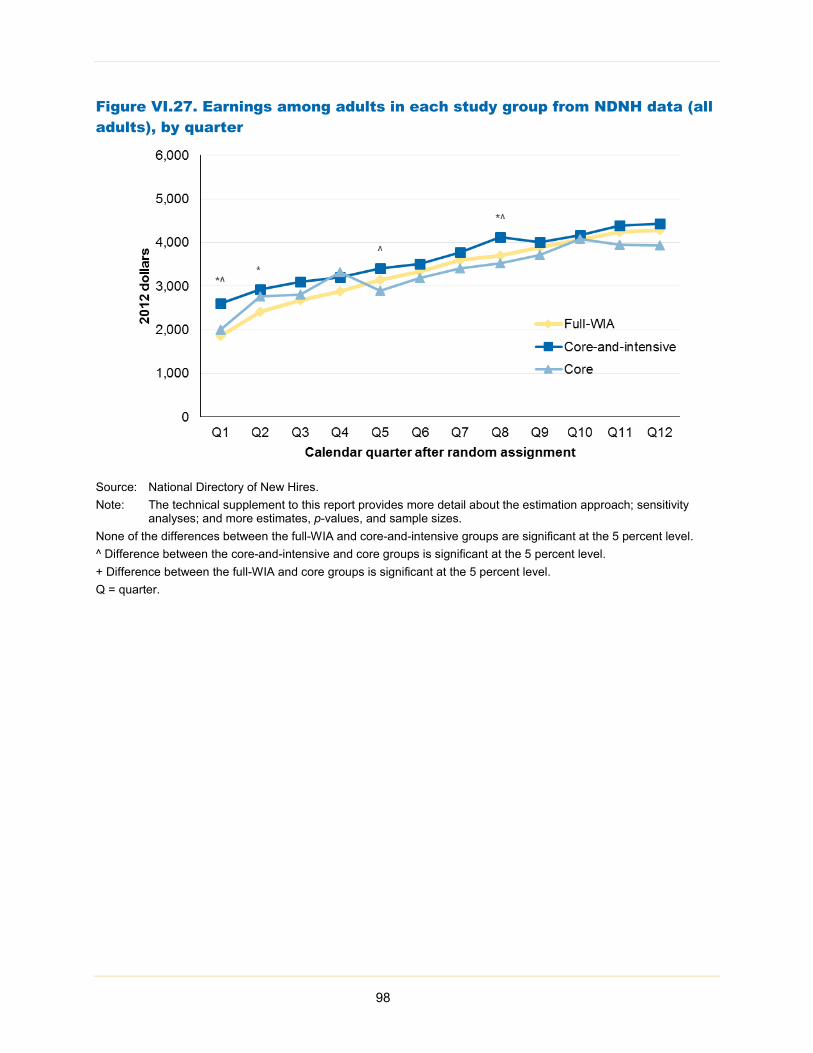
Figure VI.27. Earnings among adults in each study group from NDNH data (all adults), by quarter
Source: National Directory of New Hires. Note: The technical supplement to this report provides more detail about the estimation approach; sensitivity
analyses; and more estimates, p-values, and sample sizes. None of the differences between the full-WIA and core-and-intensive groups are significant at the 5 percent level. ^ Difference between the core-and-intensive and core groups is significant at the 5 percent level. + Difference between the full-WIA and core groups is significant at the 5 percent level. Q = quarter.
98
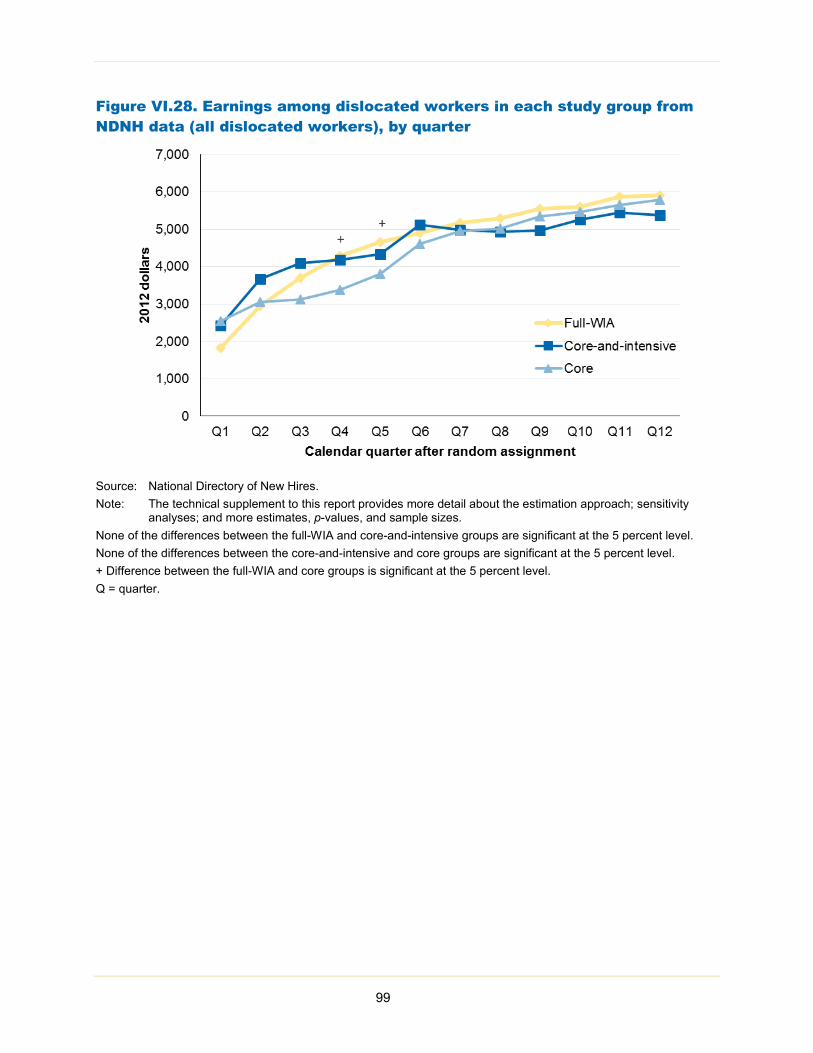
Figure VI.28. Earnings among dislocated workers in each study group from NDNH data (all dislocated workers), by quarter
Source: National Directory of New Hires. Note: The technical supplement to this report provides more detail about the estimation approach; sensitivity
analyses; and more estimates, p-values, and sample sizes. None of the differences between the full-WIA and core-and-intensive groups are significant at the 5 percent level. None of the differences between the core-and-intensive and core groups are significant at the 5 percent level. + Difference between the full-WIA and core groups is significant at the 5 percent level. Q = quarter.
99

5. Characteristics of jobs among those who were employed Full-WIA customers who were employed at any point in the follow-up period held jobs
that could be considered better on many of the dimensions we examined compared with the jobs held by core customers (Table VI.6). Although wage rates did not differ significantly between the groups ($13.76 per hour for full-WIA and $13.56 for core customers), full-WIA customers worked more hours per week (38 versus 36), were more likely to be employed full-time (74 versus 66 percent), and were more likely to hold regular full- or part-time jobs than were core customers. These findings are consistent with the positive impact on total hours worked despite the small impacts on employment rates. A higher percentage of full-WIA customers than core customers were also offered each type of benefit we examined through their most recent jobs. The differences are statistically significant only for paid holidays, paid sick days, and pension or retirement benefits, but the differences are close to significant for health insurance, paid vacation, and paid time off as well.
Table VI.6. Characteristics of most recent job for each study group (employed customers)
Means by study group
Full-WIA Core-and-intensive Core
Hours worked per week 37.9*+ 36.4 36.0 Employed full time (35 or more hours per week, %) 74+ 71^ 66 Hourly wage rate ($) 13.76 14.30 13.56 Job offered (%)
Any benefits 77 74 72 Health insurance 69 66 60 Paid vacation (not holidays) 67 60 57 Paid holidays 68+ 62^ 55 Paid sick days 54+ 52^ 42 Any paid time off 73 68 64 Pension or retirement benefits 61+ 54 51 Tuition assistance or reimbursement 33 31 26
Job classified as (%) Regular full- or part-time 83+ 81 79 Self-employed or independent contractor 5 6 8 Temporary or day labor 8 6 9 On-call 4 5 3 Job at contractor 2 3^ 2
Unionized job (%) 8 8 6 Sources: WIA Gold Standard Evaluation 15- and 30-month follow-up surveys. Notes: The technical supplement to this report provides more detail about the estimation approach; sensitivity
analyses; and more estimates, p-values, and sample sizes. Differences between study groups cannot be interpreted as causal impacts because not all members of each study group became employed.
* Difference between the full-WIA and core-and-intensive groups is significant at the 5 percent level. ^ Difference between the core-and-intensive and core groups is significant at the 5 percent level. + Difference between the full-WIA and core groups is significant at the 5 percent level.
100
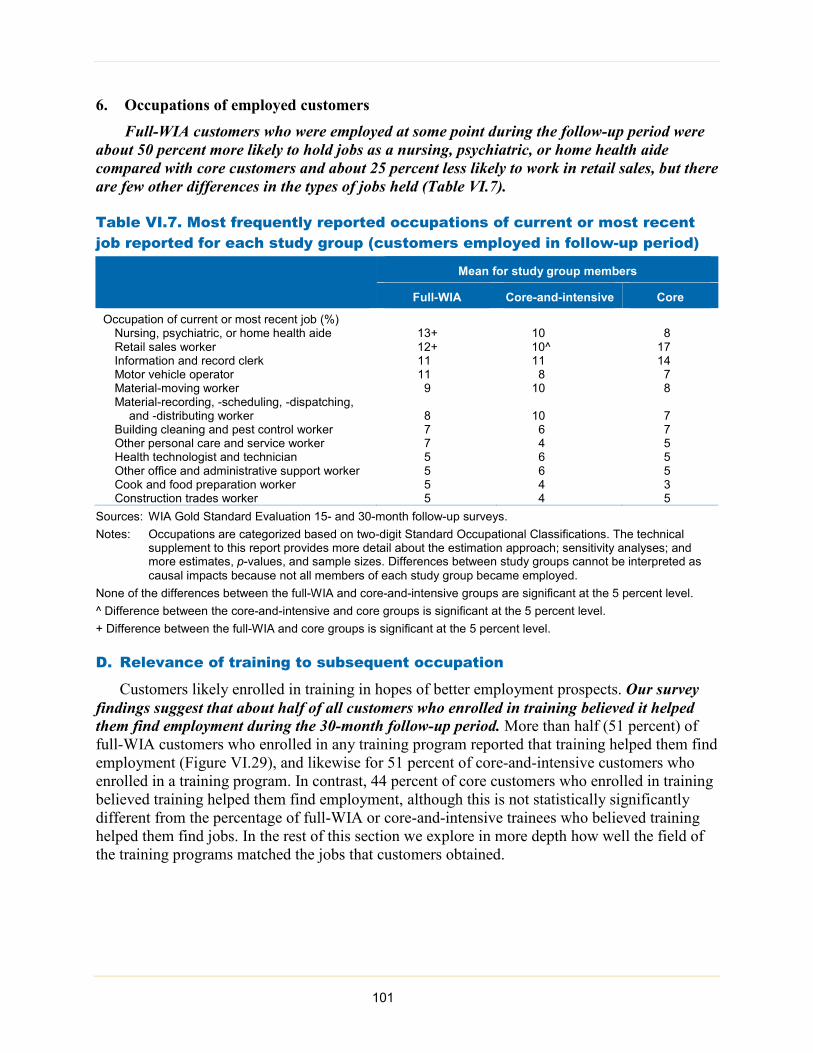
6. Occupations of employed customers Full-WIA customers who were employed at some point during the follow-up period were
about 50 percent more likely to hold jobs as a nursing, psychiatric, or home health aide compared with core customers and about 25 percent less likely to work in retail sales, but there are few other differences in the types of jobs held (Table VI.7).
Table VI.7. Most frequently reported occupations of current or most recent job reported for each study group (customers employed in follow-up period)
Mean for study group members
Full-WIA Core-and-intensive Core
Occupation of current or most recent job (%) Nursing, psychiatric, or home health aide 13+ 10 8 Retail sales worker 12+ 10^ 17 Information and record clerk 11 11 14 Motor vehicle operator 11 8 7 Material-moving worker 9 10 8 Material-recording, -scheduling, -dispatching,
and -distributing worker 8 10 7 Building cleaning and pest control worker 7 6 7 Other personal care and service worker 7 4 5 Health technologist and technician 5 6 5 Other office and administrative support worker 5 6 5 Cook and food preparation worker 5 4 3 Construction trades worker 5 4 5
Sources: WIA Gold Standard Evaluation 15- and 30-month follow-up surveys. Notes: Occupations are categorized based on two-digit Standard Occupational Classifications. The technical
supplement to this report provides more detail about the estimation approach; sensitivity analyses; and more estimates, p-values, and sample sizes. Differences between study groups cannot be interpreted as causal impacts because not all members of each study group became employed.
None of the differences between the full-WIA and core-and-intensive groups are significant at the 5 percent level. ^ Difference between the core-and-intensive and core groups is significant at the 5 percent level. + Difference between the full-WIA and core groups is significant at the 5 percent level.
D. Relevance of training to subsequent occupation
Customers likely enrolled in training in hopes of better employment prospects. Our survey findings suggest that about half of all customers who enrolled in training believed it helped them find employment during the 30-month follow-up period. More than half (51 percent) of full-WIA customers who enrolled in any training program reported that training helped them find employment (Figure VI.29), and likewise for 51 percent of core-and-intensive customers who enrolled in a training program. In contrast, 44 percent of core customers who enrolled in training believed training helped them find employment, although this is not statistically significantly different from the percentage of full-WIA or core-and-intensive trainees who believed training helped them find jobs. In the rest of this section we explore in more depth how well the field of the training programs matched the jobs that customers obtained.
101
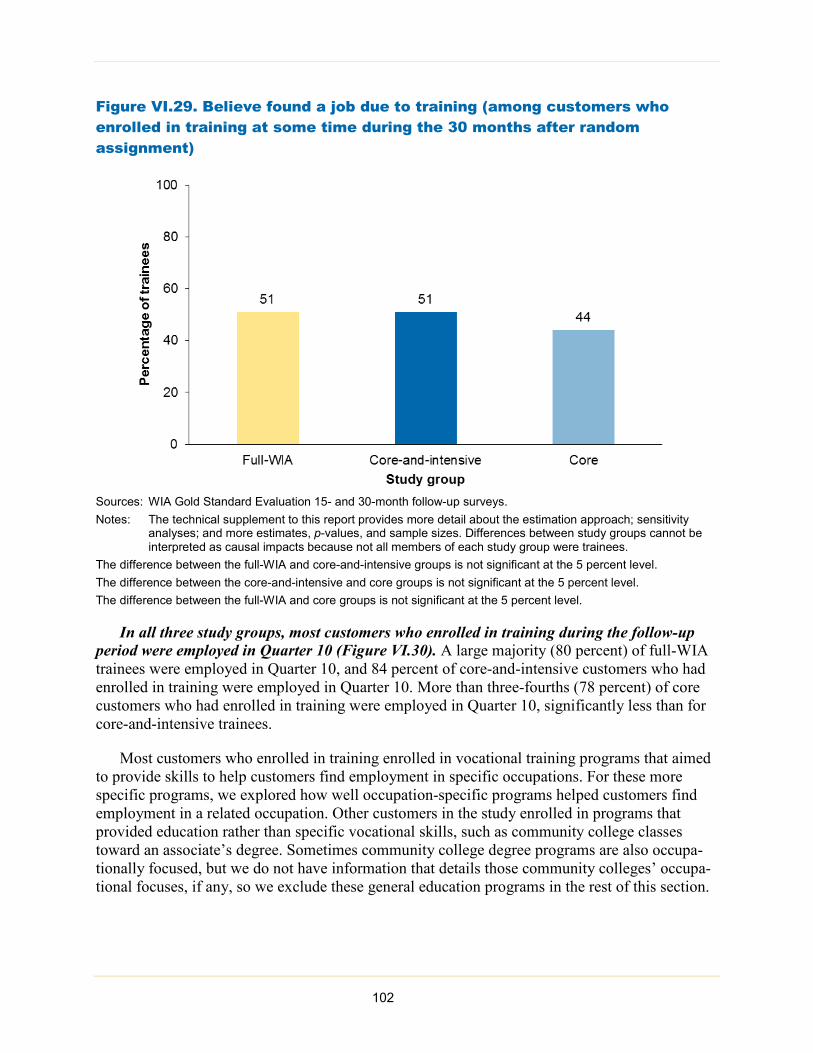
Figure VI.29. Believe found a job due to training (among customers who enrolled in training at some time during the 30 months after random assignment)
Sources: WIA Gold Standard Evaluation 15- and 30-month follow-up surveys. Notes: The technical supplement to this report provides more detail about the estimation approach; sensitivity
analyses; and more estimates, p-values, and sample sizes. Differences between study groups cannot be interpreted as causal impacts because not all members of each study group were trainees.
The difference between the full-WIA and core-and-intensive groups is not significant at the 5 percent level. The difference between the core-and-intensive and core groups is not significant at the 5 percent level. The difference between the full-WIA and core groups is not significant at the 5 percent level.
In all three study groups, most customers who enrolled in training during the follow-up period were employed in Quarter 10 (Figure VI.30). A large majority (80 percent) of full-WIA trainees were employed in Quarter 10, and 84 percent of core-and-intensive customers who had enrolled in training were employed in Quarter 10. More than three-fourths (78 percent) of core customers who had enrolled in training were employed in Quarter 10, significantly less than for core-and-intensive trainees.
Most customers who enrolled in training enrolled in vocational training programs that aimed to provide skills to help customers find employment in specific occupations. For these more specific programs, we explored how well occupation-specific programs helped customers find employment in a related occupation. Other customers in the study enrolled in programs that provided education rather than specific vocational skills, such as community college classes toward an associate’s degree. Sometimes community college degree programs are also occupa-tionally focused, but we do not have information that details those community colleges’ occupa-tional focuses, if any, so we exclude these general education programs in the rest of this section.
102
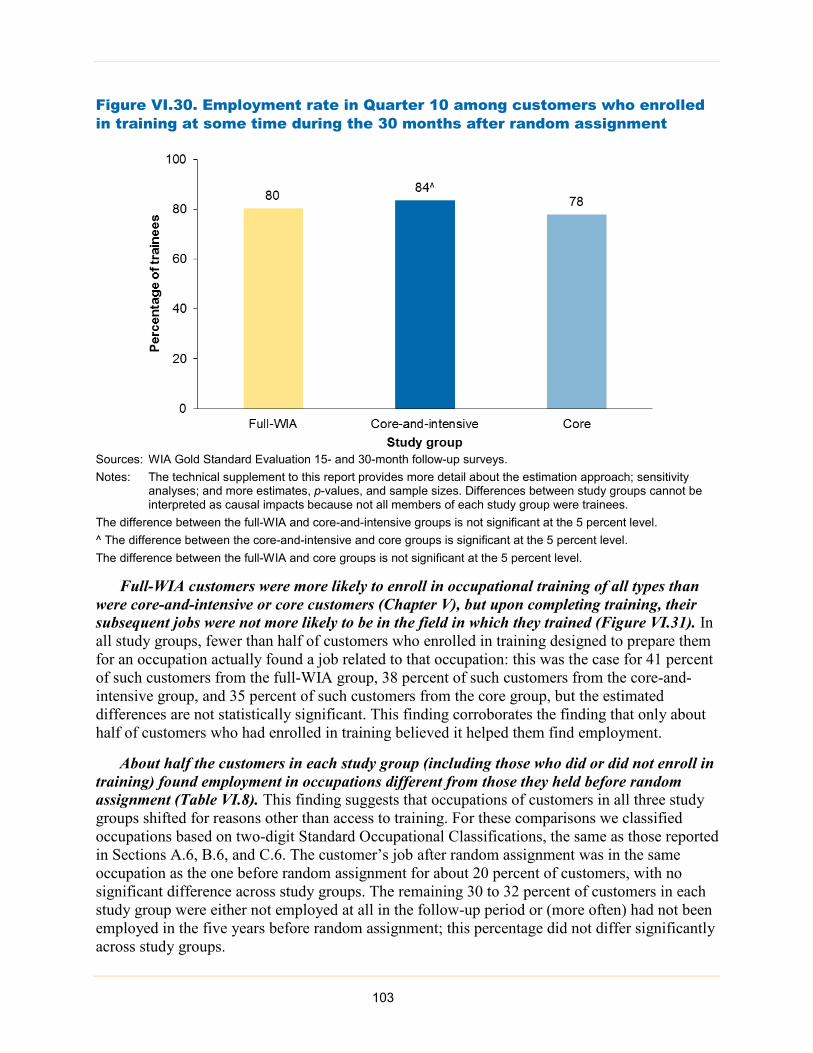
Figure VI.30. Employment rate in Quarter 10 among customers who enrolled in training at some time during the 30 months after random assignment
Sources: WIA Gold Standard Evaluation 15- and 30-month follow-up surveys. Notes: The technical supplement to this report provides more detail about the estimation approach; sensitivity
analyses; and more estimates, p-values, and sample sizes. Differences between study groups cannot be interpreted as causal impacts because not all members of each study group were trainees.
The difference between the full-WIA and core-and-intensive groups is not significant at the 5 percent level. ^ The difference between the core-and-intensive and core groups is significant at the 5 percent level. The difference between the full-WIA and core groups is not significant at the 5 percent level.
Full-WIA customers were more likely to enroll in occupational training of all types than were core-and-intensive or core customers (Chapter V), but upon completing training, their subsequent jobs were not more likely to be in the field in which they trained (Figure VI.31). In all study groups, fewer than half of customers who enrolled in training designed to prepare them for an occupation actually found a job related to that occupation: this was the case for 41 percent of such customers from the full-WIA group, 38 percent of such customers from the core-and-intensive group, and 35 percent of such customers from the core group, but the estimated differences are not statistically significant. This finding corroborates the finding that only about half of customers who had enrolled in training believed it helped them find employment.
About half the customers in each study group (including those who did or did not enroll in training) found employment in occupations different from those they held before random assignment (Table VI.8). This finding suggests that occupations of customers in all three study groups shifted for reasons other than access to training. For these comparisons we classified occupations based on two-digit Standard Occupational Classifications, the same as those reported in Sections A.6, B.6, and C.6. The customer’s job after random assignment was in the same occupation as the one before random assignment for about 20 percent of customers, with no significant difference across study groups. The remaining 30 to 32 percent of customers in each study group were either not employed at all in the follow-up period or (more often) had not been employed in the five years before random assignment; this percentage did not differ significantly across study groups. 103

Figure VI.31. Found employment in an occupation related to training (customers who enrolled in occupation-specific training)
Sources: WIA Gold Standard Evaluation 15- and 30-month follow-up surveys. Notes: Occupations are categorized based on two-digit Standard Occupational Classifications. The technical
supplement to this report provides more detail about the estimation approach; sensitivity analyses; and more estimates, p-values, and sample sizes. Differences between study groups cannot be interpreted as causal impacts because not all members of each study group were enrolled in occupation-specific training.
The difference between the full-WIA and core-and-intensive groups is not significant at the 5 percent level. The difference between the core-and-intensive and core groups is not significant at the 5 percent level. The difference between the full-WIA and core groups is not significant at the 5 percent level.
Table VI.8. Whether jobs before and after random assignment differed (all customers)
Mean for study group members
Full-WIA Core-and-intensive Core
Employed and most recent job differs from occupation before random assignment (%) 50 49 47 Employed and most recent job is in same occupation as before random assignment (%) 20 21 21 Not employed in follow-up period or not employed in five years before random assignment (%) 30 30 32
Sources: WIA Gold Standard Evaluation 15- and 30-month follow-up surveys and WIA Gold Standard Evaluation study registration form.
Notes: Occupations are categorized based on two-digit Standard Occupational Classifications. The technical supplement to this report provides more detail about the estimation approach; sensitivity analyses; and more estimates, p-values, and sample sizes.
None of the differences between the full-WIA and core-and-intensive groups are significant at the 5 percent level. None of the differences between the core-and-intensive and core groups are significant at the 5 percent level. None of the differences between the full-WIA and core groups are significant at the 5 percent level.
104
VII. IMPACTS ON HOUSEHOLD INCOME, RECEIPT OF PUBLIC ASSISTANCE, AND OTHER OUTCOMES
By helping customers improve their employment outcomes, the Adult and Dislocated Worker programs aim ultimately to help customers become more self-sufficient. These programs could conceivably increase annual household income and reduce household reliance on public assistance and unemployment compensation. Since success in the labor market can also conceivably affect outcomes beyond economic self-sufficiency, these programs may affect customers’ health insurance coverage and criminal activity as well. In this chapter, we present findings on the impacts on these outcomes using data from the 15- and 30-month surveys, and from the NDNH data.
Unlike the employment and earnings outcomes reported in Chapter VI, several of the outcomes reported in this chapter, including annual household income and receipt of public assistance, are measured with respect to only the most recent calendar year preceding the 30-month follow-up survey rather than over the full follow-up period.
We begin this chapter by comparing outcomes for the full-WIA group with those for the core-and-intensive group, which provides estimates of the impact of training funded by the Adult and Dislocated Worker programs (Section A). Next, we compare the outcomes of the core-and-intensive and core groups, which provides an estimate of the impact of intensive services (Section B). We then compare the outcomes of the full-WIA and core groups, which provides an estimate of the combined effect of both training and intensive services (Section C). Finally, we conclude the chapter with a discussion of differences in impacts for adults and dislocated workers (Section D).
A. Impacts of WIA-funded training
Providing WIA-funded training did not significantly affect customers’ total annual household income (all money received by all household members from employment, UI, or public assistance programs) in the calendar year preceding the 30-month survey. Full-WIA customers reported an average household income of $27,442 in the calendar year preceding the
Key findings • Providing WIA-funded training led to a smaller proportion of customers receiving unemployment
compensation in the fourth and twelfth calendar quarters after random assignment, though over the full 12 calendar quarters after random assignment the difference was not significant. WIA-funded training also led to a reduction in the total amount of unemployment compensation received in the 12 calendar quarters after random assignment.
• Providing WIA-funded intensive services (without training) did not impact receipt of unemployment compensation or public assistance.
• Providing both training and intensive services led to a decrease in the proportion of customers living in a household that received cash assistance and in the proportion of customers in households that received benefits through the Special Supplemental Nutrition Program for Women, Infants, and Children (WIC).
• Neither WIA-funded training nor WIA-funded intensive services affected annual household income.
• Impacts between adults and dislocated workers were generally not significantly different.
105
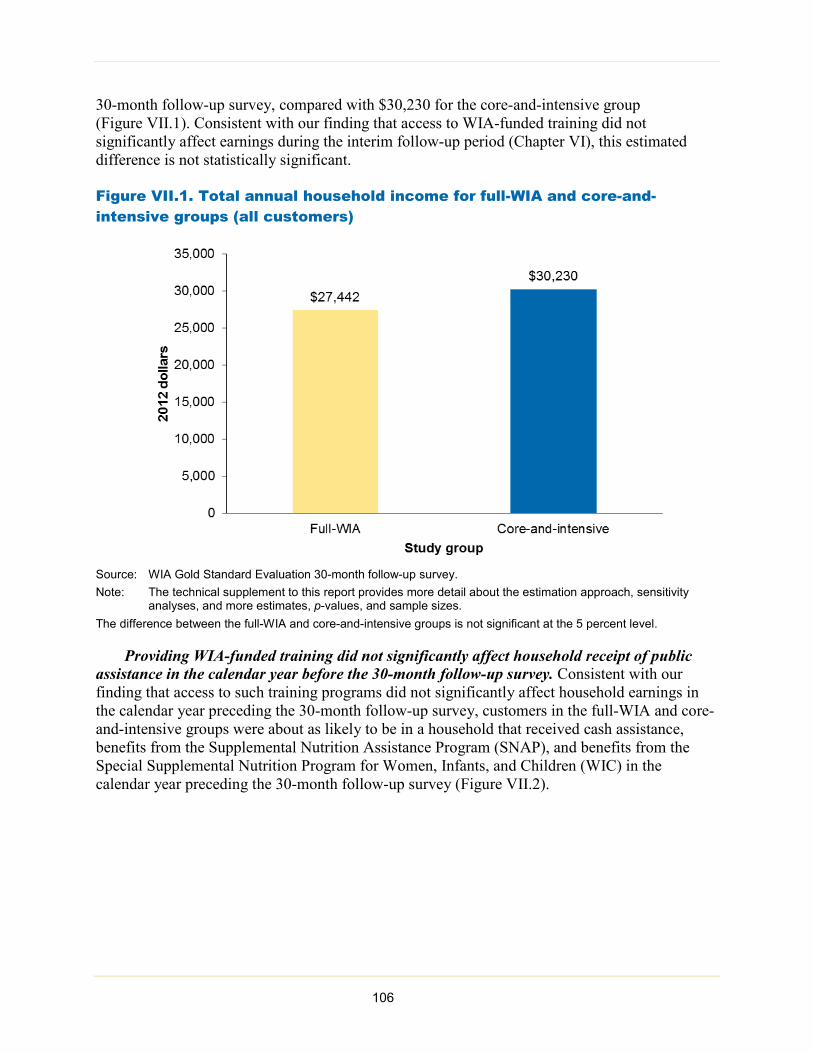
30-month follow-up survey, compared with $30,230 for the core-and-intensive group (Figure VII.1). Consistent with our finding that access to WIA-funded training did not significantly affect earnings during the interim follow-up period (Chapter VI), this estimated difference is not statistically significant.
Figure VII.1. Total annual household income for full-WIA and core-and-intensive groups (all customers)
Source: WIA Gold Standard Evaluation 30-month follow-up survey. Note: The technical supplement to this report provides more detail about the estimation approach, sensitivity
analyses, and more estimates, p-values, and sample sizes. The difference between the full-WIA and core-and-intensive groups is not significant at the 5 percent level.
Providing WIA-funded training did not significantly affect household receipt of public assistance in the calendar year before the 30-month follow-up survey. Consistent with our finding that access to such training programs did not significantly affect household earnings in the calendar year preceding the 30-month follow-up survey, customers in the full-WIA and core-and-intensive groups were about as likely to be in a household that received cash assistance, benefits from the Supplemental Nutrition Assistance Program (SNAP), and benefits from the Special Supplemental Nutrition Program for Women, Infants, and Children (WIC) in the calendar year preceding the 30-month follow-up survey (Figure VII.2).
106
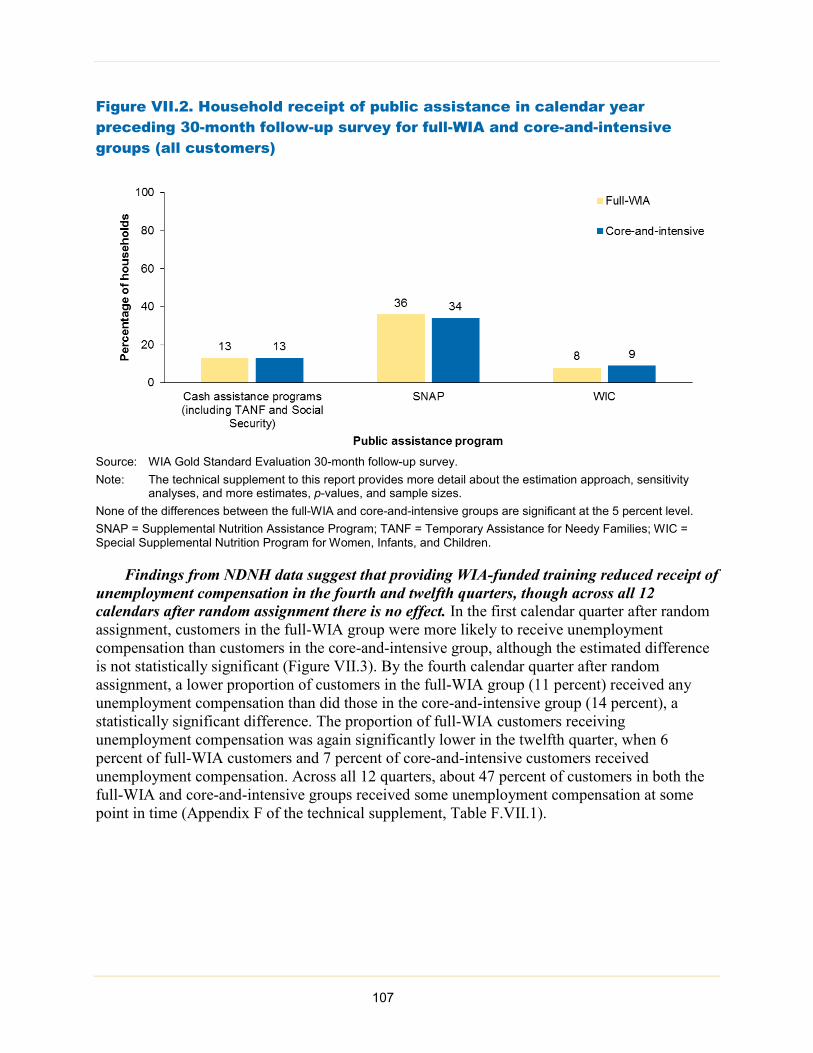
Figure VII.2. Household receipt of public assistance in calendar year preceding 30-month follow-up survey for full-WIA and core-and-intensive groups (all customers)
Source: WIA Gold Standard Evaluation 30-month follow-up survey. Note: The technical supplement to this report provides more detail about the estimation approach, sensitivity
analyses, and more estimates, p-values, and sample sizes. None of the differences between the full-WIA and core-and-intensive groups are significant at the 5 percent level. SNAP = Supplemental Nutrition Assistance Program; TANF = Temporary Assistance for Needy Families; WIC = Special Supplemental Nutrition Program for Women, Infants, and Children.
Findings from NDNH data suggest that providing WIA-funded training reduced receipt of unemployment compensation in the fourth and twelfth quarters, though across all 12 calendars after random assignment there is no effect. In the first calendar quarter after random assignment, customers in the full-WIA group were more likely to receive unemployment compensation than customers in the core-and-intensive group, although the estimated difference is not statistically significant (Figure VII.3). By the fourth calendar quarter after random assignment, a lower proportion of customers in the full-WIA group (11 percent) received any unemployment compensation than did those in the core-and-intensive group (14 percent), a statistically significant difference. The proportion of full-WIA customers receiving unemployment compensation was again significantly lower in the twelfth quarter, when 6 percent of full-WIA customers and 7 percent of core-and-intensive customers received unemployment compensation. Across all 12 quarters, about 47 percent of customers in both the full-WIA and core-and-intensive groups received some unemployment compensation at some point in time (Appendix F of the technical supplement, Table F.VII.1).
107
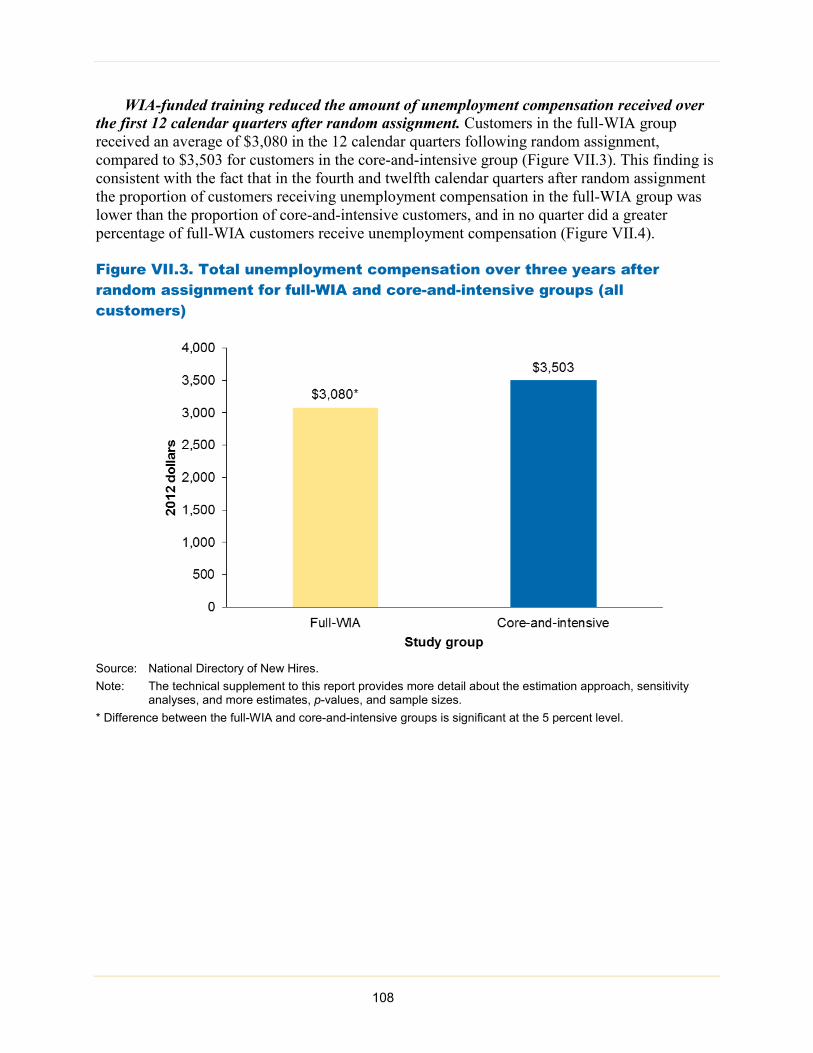
WIA-funded training reduced the amount of unemployment compensation received over the first 12 calendar quarters after random assignment. Customers in the full-WIA group received an average of $3,080 in the 12 calendar quarters following random assignment, compared to $3,503 for customers in the core-and-intensive group (Figure VII.3). This finding is consistent with the fact that in the fourth and twelfth calendar quarters after random assignment the proportion of customers receiving unemployment compensation in the full-WIA group was lower than the proportion of core-and-intensive customers, and in no quarter did a greater percentage of full-WIA customers receive unemployment compensation (Figure VII.4).
Figure VII.3. Total unemployment compensation over three years after random assignment for full-WIA and core-and-intensive groups (all customers)
Source: National Directory of New Hires. Note: The technical supplement to this report provides more detail about the estimation approach, sensitivity
analyses, and more estimates, p-values, and sample sizes. * Difference between the full-WIA and core-and-intensive groups is significant at the 5 percent level.
108

Figure VII.4. Receipt of unemployment compensation after random assignment for full-WIA and core-and-intensive groups (all customers), by quarter
Source: National Directory of New Hires. Note: The technical supplement to this report provides more detail about the estimation approach, sensitivity
analyses, and more estimates, p-values, and sample sizes. * Difference between the full-WIA and core-and-intensive groups is significant at the 5 percent level. Q = quarter.
WIA-funded training had no significant effect on health insurance. About 84 percent of customers in both the full-WIA group and the core-and-intensive group reported being covered by health insurance at any time between random assignment and the 30-month follow-up survey (Appendix C of the technical supplement, Table C.VII.2). This is consistent with the finding that customers in the full-WIA and core-and-intensive groups were equally likely to have had health insurance in their most recent job (Chapter VI).
WIA-funded training had no effect on criminal activity. In both the full-WIA and core-and-intensive groups, about 6 percent of customers reported being arrested over this period, and 1 percent reported having been convicted of a felony (Appendix C of the technical supplement, Table C.VII.3).
B. Impacts of WIA-funded intensive services
Providing WIA-funded intensive services did not affect household income in the calendar year preceding the 30-month follow-up survey. Despite our finding that access to WIA-funded intensive services increased earnings (Chapter VI), customers in the core-and-intensive and core groups reported similar household incomes of about $30,000 in the calendar year preceding the 30-month follow-up survey (Appendix C of the technical supplement, Table C.VII.1).
109
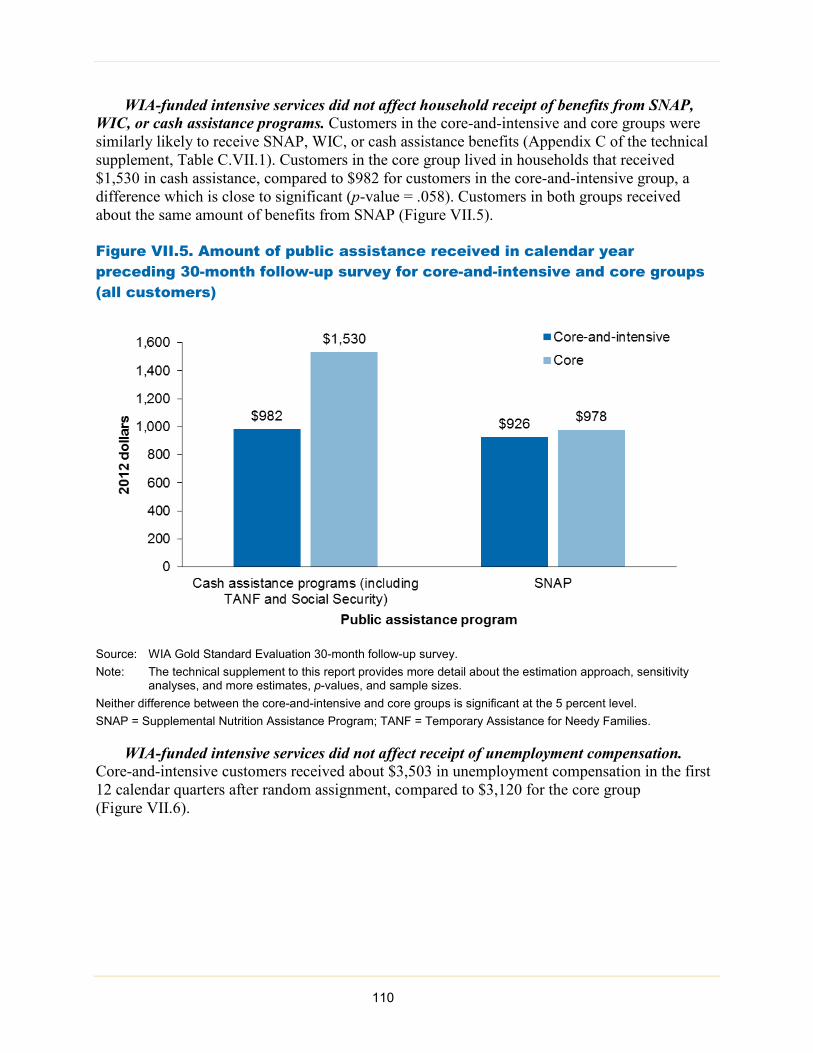
WIA-funded intensive services did not affect household receipt of benefits from SNAP, WIC, or cash assistance programs. Customers in the core-and-intensive and core groups were similarly likely to receive SNAP, WIC, or cash assistance benefits (Appendix C of the technical supplement, Table C.VII.1). Customers in the core group lived in households that received $1,530 in cash assistance, compared to $982 for customers in the core-and-intensive group, a difference which is close to significant (p-value = .058). Customers in both groups received about the same amount of benefits from SNAP (Figure VII.5).
Figure VII.5. Amount of public assistance received in calendar year preceding 30-month follow-up survey for core-and-intensive and core groups (all customers)
Source: WIA Gold Standard Evaluation 30-month follow-up survey. Note: The technical supplement to this report provides more detail about the estimation approach, sensitivity
analyses, and more estimates, p-values, and sample sizes. Neither difference between the core-and-intensive and core groups is significant at the 5 percent level. SNAP = Supplemental Nutrition Assistance Program; TANF = Temporary Assistance for Needy Families.
WIA-funded intensive services did not affect receipt of unemployment compensation. Core-and-intensive customers received about $3,503 in unemployment compensation in the first 12 calendar quarters after random assignment, compared to $3,120 for the core group (Figure VII.6).
110

Figure VII.6. Total unemployment compensation over three years after random assignment for core-and-intensive and core groups (all customers)
Source: National Directory of New Hires. Note: The technical supplement to this report provides more detail about the estimation approach, sensitivity
analyses, and more estimates, p-values, and sample sizes. Difference between the full-WIA and core-and-intensive groups is not significant at the 5 percent level.
WIA-funded intensive services did not affect health insurance coverage between random assignment and the 30-month survey. Over this period, about 85 percent of core-and-intensive and core customers reported having been covered by health insurance at some point since random assignment (Appendix C of the technical supplement, Table C.VII.2).
WIA-funded intensive services did not affect criminal activity between random assignment and the 30-month survey. Few customers in either group reported having been arrested since random assignment, and even fewer reported having been convicted of a felony since random assignment (Appendix C of the technical supplement, Table C.VII.3).
C. Impacts of both WIA-funded training and WIA-funded intensive services
By design, the impact of providing both WIA-funded training and WIA-funded intensive services will equal the sum of the impact of WIA-funded training (as discussed in Section A) and the impact of WIA-funded intensive services (as discussed in Section B). In this section, we present estimates for all three study groups in the figures to help illustrate the extent to which the impacts of WIA-funded training and WIA-funded intensive services are driven by training or intensive service individually, but we focus our discussion on comparisons between the full-WIA and core groups.
111
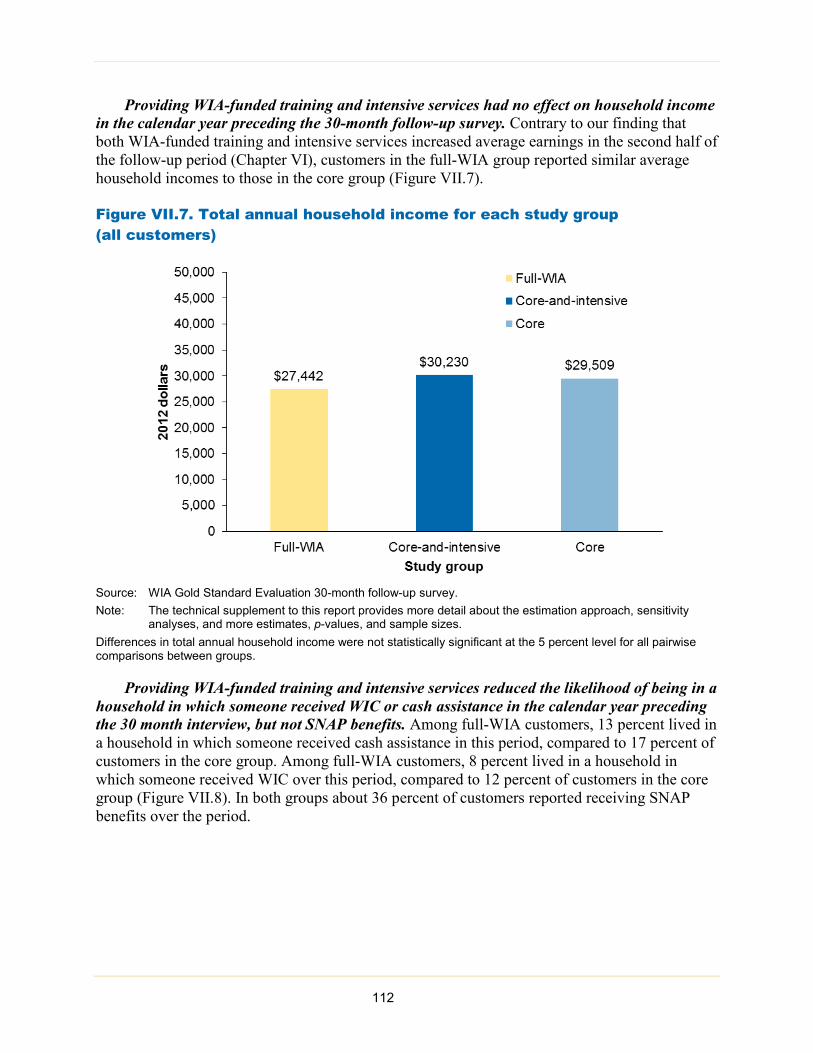
Providing WIA-funded training and intensive services had no effect on household income in the calendar year preceding the 30-month follow-up survey. Contrary to our finding that both WIA-funded training and intensive services increased average earnings in the second half of the follow-up period (Chapter VI), customers in the full-WIA group reported similar average household incomes to those in the core group (Figure VII.7).
Figure VII.7. Total annual household income for each study group (all customers)
Source: WIA Gold Standard Evaluation 30-month follow-up survey. Note: The technical supplement to this report provides more detail about the estimation approach, sensitivity
analyses, and more estimates, p-values, and sample sizes. Differences in total annual household income were not statistically significant at the 5 percent level for all pairwise comparisons between groups.
Providing WIA-funded training and intensive services reduced the likelihood of being in a household in which someone received WIC or cash assistance in the calendar year preceding the 30 month interview, but not SNAP benefits. Among full-WIA customers, 13 percent lived in a household in which someone received cash assistance in this period, compared to 17 percent of customers in the core group. Among full-WIA customers, 8 percent lived in a household in which someone received WIC over this period, compared to 12 percent of customers in the core group (Figure VII.8). In both groups about 36 percent of customers reported receiving SNAP benefits over the period.
112

Figure VII.8. Household receipt of public assistance in calendar year preceding 30-month follow-up survey for each study group (all customers)
Source: WIA Gold Standard Evaluation 30-month follow-up survey. Note: The technical supplement to this report provides more detail about the estimation approach, sensitivity
analyses, and more estimates, p-values, and sample sizes. Differences between the core-and-intensive group and each of the other two groups are not significant at the 5 percent level. + Difference between the full-WIA and core groups is significant at the 5 percent level. SNAP = Supplemental Nutrition Assistance Program; TANF = Temporary Assistance for Needy Families; WIC = Special Supplemental Nutrition Program for Women, Infants, and Children.
Providing WIA-funded training and intensive services did not affect the amount of benefits received from SNAP or cash assistance programs in the calendar year preceding the 30-month follow-up survey. Customers in both groups reported receiving about $977 in benefits from SNAP over this period (Figure VII.9). Customers in the full-WIA group reported receiving $1,088 in cash assistance programs on average, and customers in the core group reported receiving $1,530. This difference is close to significant, with a p-value of .052.
113
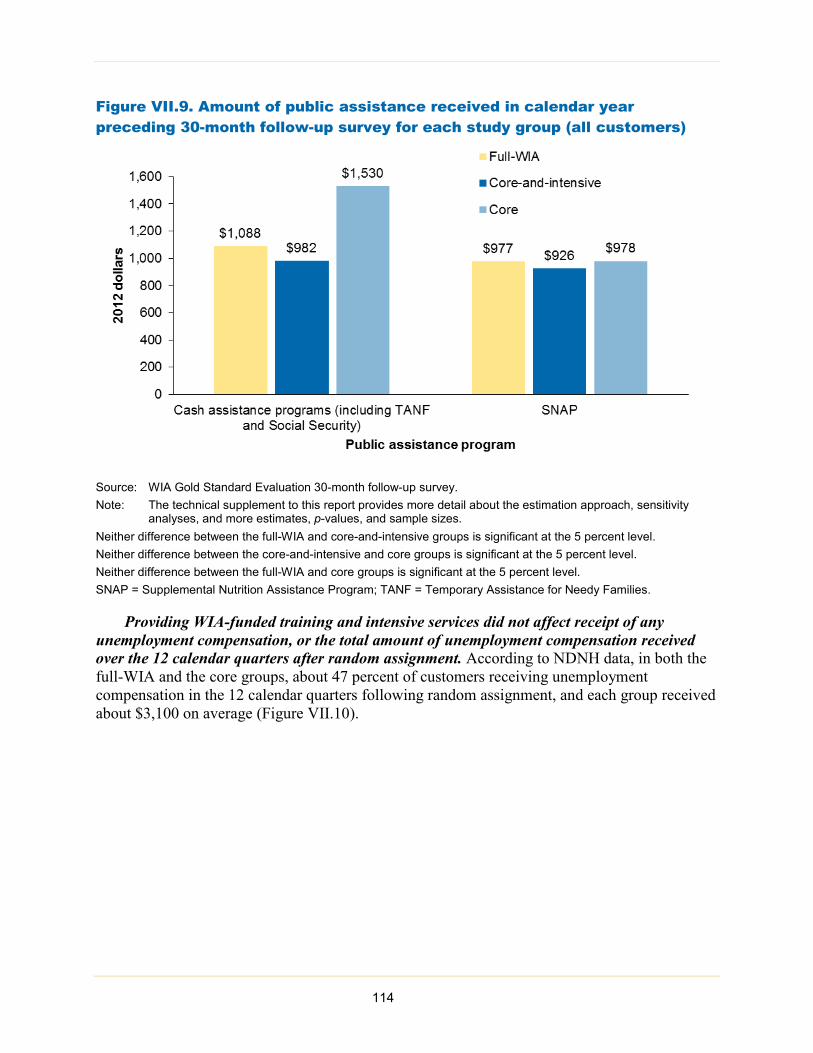
Figure VII.9. Amount of public assistance received in calendar year preceding 30-month follow-up survey for each study group (all customers)
Source: WIA Gold Standard Evaluation 30-month follow-up survey. Note: The technical supplement to this report provides more detail about the estimation approach, sensitivity
analyses, and more estimates, p-values, and sample sizes. Neither difference between the full-WIA and core-and-intensive groups is significant at the 5 percent level. Neither difference between the core-and-intensive and core groups is significant at the 5 percent level. Neither difference between the full-WIA and core groups is significant at the 5 percent level. SNAP = Supplemental Nutrition Assistance Program; TANF = Temporary Assistance for Needy Families.
Providing WIA-funded training and intensive services did not affect receipt of any unemployment compensation, or the total amount of unemployment compensation received over the 12 calendar quarters after random assignment. According to NDNH data, in both the full-WIA and the core groups, about 47 percent of customers receiving unemployment compensation in the 12 calendar quarters following random assignment, and each group received about $3,100 on average (Figure VII.10).
114
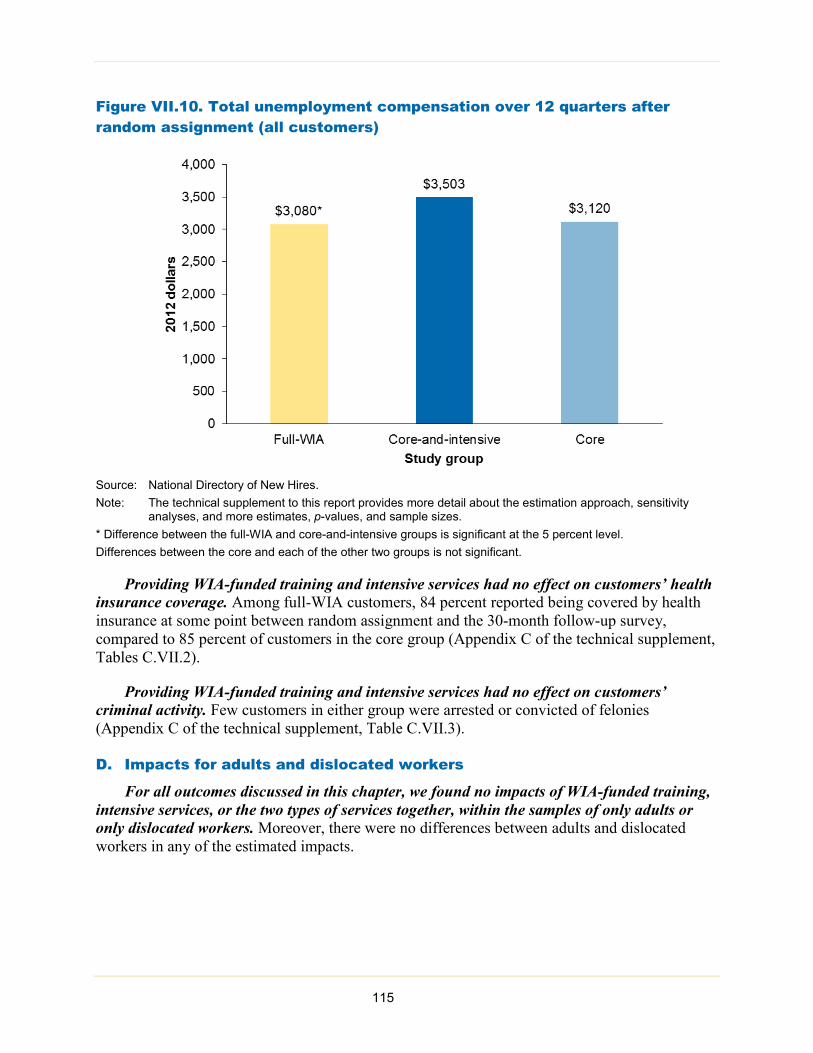
Figure VII.10. Total unemployment compensation over 12 quarters after random assignment (all customers)
Source: National Directory of New Hires. Note: The technical supplement to this report provides more detail about the estimation approach, sensitivity
analyses, and more estimates, p-values, and sample sizes. * Difference between the full-WIA and core-and-intensive groups is significant at the 5 percent level. Differences between the core and each of the other two groups is not significant.
Providing WIA-funded training and intensive services had no effect on customers’ health insurance coverage. Among full-WIA customers, 84 percent reported being covered by health insurance at some point between random assignment and the 30-month follow-up survey, compared to 85 percent of customers in the core group (Appendix C of the technical supplement, Tables C.VII.2).
Providing WIA-funded training and intensive services had no effect on customers’ criminal activity. Few customers in either group were arrested or convicted of felonies (Appendix C of the technical supplement, Table C.VII.3).
D. Impacts for adults and dislocated workers
For all outcomes discussed in this chapter, we found no impacts of WIA-funded training, intensive services, or the two types of services together, within the samples of only adults or only dislocated workers. Moreover, there were no differences between adults and dislocated workers in any of the estimated impacts.
115

This page has been left blank for double-sided copying.
116
VIII. BENEFIT-COST ANALYSIS
One important criterion for determining whether it is worthwhile to provide intensive and training services through the Adult and Dislocated Worker programs is whether the services are effective enough to justify their costs. In this chapter, we combine the impacts estimated in previous chapters with the costs of the services customers received to estimate the net benefits associated with intensive services, training, and the two sets of services together. The net benefit, which is expressed as a dollar value, conveys the extent to which the benefits of providing WIA-funded intensive and training services exceed the costs of doing so, thus providing an easily interpretable metric for decision makers.
The estimates in this chapter represent our best guesses as to the aggregated benefits and costs of services funded by the Adult and Dislocated Worker programs. However, most of the key inputs into this analysis are estimates themselves, so the total estimated net benefits are measured with uncertainty as well. The benefit-cost analysis is useful to assess whether the net benefits of intensive and training services funded through the Adult and Dislocated Worker programs are positive, but the exact amounts of the net benefits could be bigger or smaller than the best-guess estimates we provide.
This chapter begins with a brief overview of our approach to estimating net benefits (Section A). Next, we estimate the net benefits of WIA-funded training (Section B), WIA-funded intensive services (Section C), and both WIA-funded intensive and training services (Section D). We then provide estimates of net benefits specific to the Adult program and the Dislocated Worker program (Section E). The chapter concludes with a summary of several sensitivity analyses (Section F).
A. Approach to estimating net benefits
The benefit-cost analysis uses a framework conceptually similar to an accounting ledger to estimate the average net benefits of access to intensive and training services funded through the Adult and Dislocated Worker programs. In this framework, the benefits of providing the services could occur because of any increases in earnings and other compensation and reductions in the receipt of public assistance. Costs include those associated with providing the intensive and training services, such as staffing, materials, overhead, and administrative costs. This section
Key findings • Providing training funded by the Adult and Dislocated Worker programs does not produce positive net
benefits for customers, taxpayers, or society as a whole over the 30-month study period.
• Providing intensive services funded by the Adult and Dislocated Worker programs produces positive net benefits for customers, taxpayers, and society as a whole over the 30-month study period. This suggests that intensive services are a good investment from all the perspectives considered.
- This conclusion is robust to sensitivity tests.
- Extrapolating the impacts beyond the study period results in even larger net benefits of the availability of intensive services.
• Providing both intensive and training services funded by the Adult and Dislocated Worker programs leads to positive net benefits for customers, taxpayers, and society as a whole over the 30-month study period. These benefits are driven by the positive benefits of intensive services.
117

provides an overview of how we estimated benefits and costs. Appendix A in the technical supplement to this report provides further details of the approach.
1. Benefits and costs from different perspectives The findings from any benefit-cost analysis depend on the perspective from which benefits
and costs are considered. A positive benefit from one perspective could be a cost, or a negative benefit, from another. For example, an increase in tax payments by customers is a cost to customers but a benefit to taxpayers. We examined benefits and costs from three perspectives.
1. Society as a whole. The net benefit to society represents the overall net benefit of the program. Because this perspective considers benefits and costs for everyone in society, it is the most relevant perspective for policymakers. Computing net benefits from this perspective enables us to determine whether, in total, the benefits of services exceed the resources used to provide them.
2. Customers. Customers reap the benefits of intensive and training services through increased earnings and associated fringe benefits. However, they may also pay more in taxes associated with those higher earnings and claim fewer public assistance benefits as a result. Customers in training forgo earnings that they could have obtained from working rather than enrolling in training. Additionally, many customers or their families pay for some portion of the training they receive. Computing the net benefit from the perspective of customers enables us to determine whether participating in the Adult or Dislocated Worker programs is a good investment for the customers themselves.
3. Taxpayers. Although customers reap the benefits of the services, taxpayers (by way of federal, state, and local governments) pay much of the costs. Customers’ reductions in receipt of public assistance and increases in tax payments can partially or fully offset these costs. Computing the net benefits from the perspective of taxpayers enables us to determine whether offering services through the Adult and Dislocated Worker programs is a good investment for the government.
We express all benefits and costs in dollar terms. Benefits to society are the sum of the benefits from the perspectives of customers and taxpayers. Similarly, costs to society are the sum of the costs to customers and taxpayers. To estimate net benefits, we take the difference between total benefits and total costs. (Note that costs are treated the same as negative benefits).
2. Accounting for benefits accruing later than costs While the costs of services were incurred mainly at the time of the receipt of services, the
benefits may accrue later. We accounted for differences in the timing of the accrual of benefits and costs; a current dollar is worth more than a future dollar, both because of any inflation and because the dollar could be invested to earn more later on. To account for inflation, we converted all benefits and costs into 2012 dollars using the gross domestic product deflator. We chose 2012 because it was the first full year of the follow-up period. To account for potential gains from investment, we also discounted any costs and benefits that accrued after the first year of the follow-up period to reflect their value during that first year using the U.S. Treasury’s daily real long-term interest rate (1.5 percent, U.S. Department of Treasury 2016).
118

3. Measures of benefits and costs We estimated the net benefits of providing each type of service funded by the Adult and
Dislocated Worker programs by estimating the dollar values of (1) changes in customers’ productivity, (2) changes in customers’ use of public assistance, and (3) differences in the cost of the services customers received. We discuss each of these in more detail later in the chapter. We included impacts as benefits or costs even if they were not statistically significantly different from zero, because even if the estimates are imprecise, they are our best estimates.
We did not capture other potential benefits and costs of intensive and training services. Examples of excluded costs and benefits include potential increases in payments for child care and transportation while at work or in training, decreases in leisure time, changes in job satisfaction, changes in physical or mental health, and increases in quality of life.
We also restricted all benefits and costs to those accruing during the 30-month follow-up period for our main, benchmark analysis. Providing intensive and training services might have changed customers’ productivity, use of public assistance, or receipt of services after the end of the follow-up period. However, we do not know to what extent this occurs, as our data cover only the 30 months after random assignment. We therefore restrict our estimates of benefits and costs to the follow-up period. Nonetheless, our estimates of net benefits are likely to be smaller than estimates which include impacts after the 30-month follow-up period. This will occur because although the costs of providing WIA-funded services are largely restricted to the follow-up period, the benefits of these services may persist after the follow-up period. In our sensitivity analyses, we explore how considering the period after the 30-month follow-up period would affect our estimates of net benefits.
a. Productivity A goal of the Adult and Dislocated Worker programs is to help make customers more
productive workers by increasing their skills and/or helping them find jobs that will best use their talents and abilities. Thus, if services funded by the Adult and Dislocated Worker programs are effective, customers—and society as a whole—should benefit from increases in this productivity. We measured these changes using the compensation customers received for working: earnings and fringe benefits. We also accounted for the taxes paid on this compensation. For our benchmark estimates, we estimated the impacts on earnings, taxes, and fringe benefits by quarter for 10 quarters after random assignment using data from the 15- and 30-month follow-up surveys. We conducted a sensitivity analysis (Section F) using earnings from the NDNH. An increase in earnings and fringe benefits is a benefit for customers and society as a whole. An increase in taxes is a cost for customers (who pay them) but a benefit to taxpayers; the cost and the benefit exactly offset each other, so that the benefit of taxes to society as a whole is zero.
b. Use of public assistance We expected that if intensive and training services improved customers’ earnings,
customers’ use of public assistance would also decrease. This would be a cost to the customers who no longer receive the public assistance but a benefit to taxpayers, who no longer have to pay for it. From the perspective of society as a whole, the benefits and costs of the payments cancel each other out. However, it is costly to administer public assistance programs, and any administrative costs saved are benefits to taxpayers and society as a whole. Using data from the 119
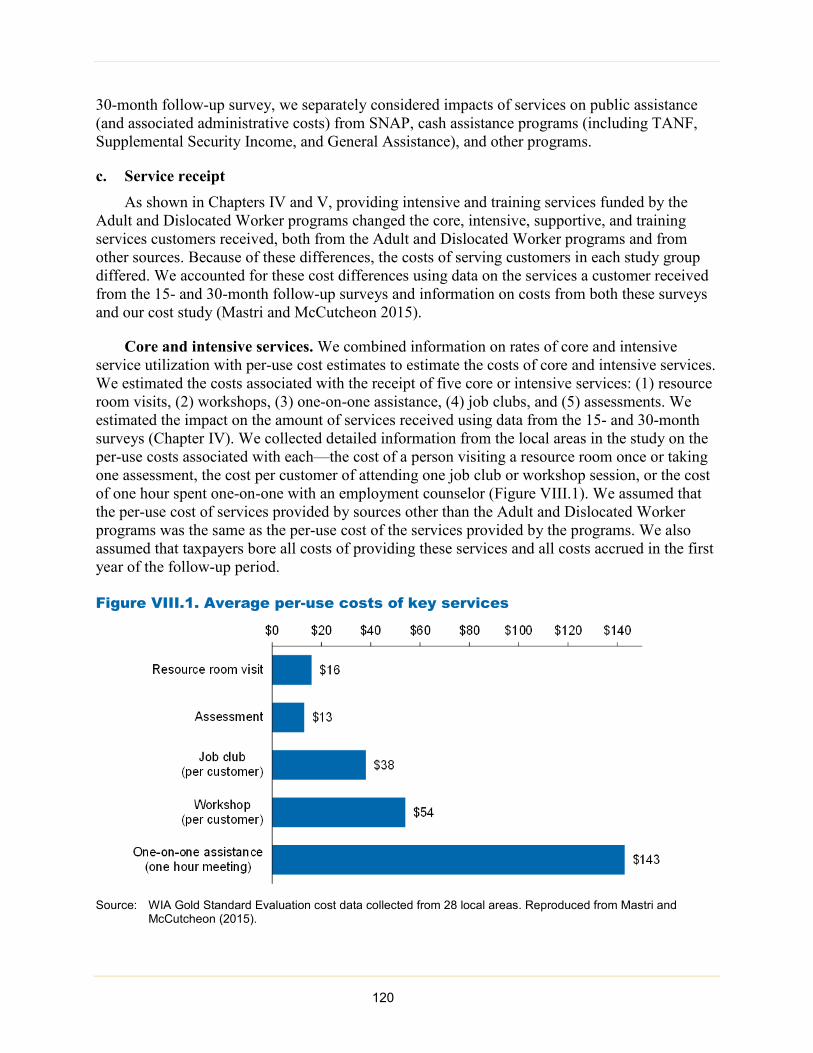
30-month follow-up survey, we separately considered impacts of services on public assistance (and associated administrative costs) from SNAP, cash assistance programs (including TANF, Supplemental Security Income, and General Assistance), and other programs.
c. Service receipt As shown in Chapters IV and V, providing intensive and training services funded by the
Adult and Dislocated Worker programs changed the core, intensive, supportive, and training services customers received, both from the Adult and Dislocated Worker programs and from other sources. Because of these differences, the costs of serving customers in each study group differed. We accounted for these cost differences using data on the services a customer received from the 15- and 30-month follow-up surveys and information on costs from both these surveys and our cost study (Mastri and McCutcheon 2015).
Core and intensive services. We combined information on rates of core and intensive service utilization with per-use cost estimates to estimate the costs of core and intensive services. We estimated the costs associated with the receipt of five core or intensive services: (1) resource room visits, (2) workshops, (3) one-on-one assistance, (4) job clubs, and (5) assessments. We estimated the impact on the amount of services received using data from the 15- and 30-month surveys (Chapter IV). We collected detailed information from the local areas in the study on the per-use costs associated with each—the cost of a person visiting a resource room once or taking one assessment, the cost per customer of attending one job club or workshop session, or the cost of one hour spent one-on-one with an employment counselor (Figure VIII.1). We assumed that the per-use cost of services provided by sources other than the Adult and Dislocated Worker programs was the same as the per-use cost of the services provided by the programs. We also assumed that taxpayers bore all costs of providing these services and all costs accrued in the first year of the follow-up period.
Figure VIII.1. Average per-use costs of key services
Source: WIA Gold Standard Evaluation cost data collected from 28 local areas. Reproduced from Mastri and
McCutcheon (2015).
120
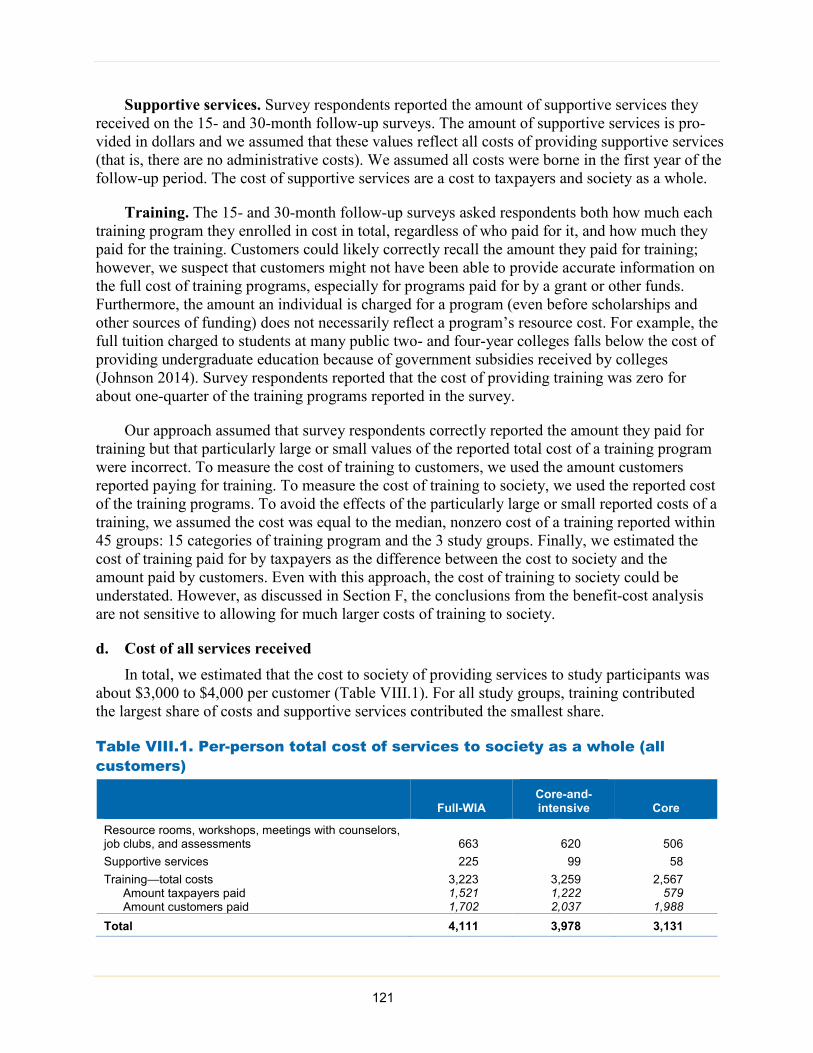
Supportive services. Survey respondents reported the amount of supportive services they received on the 15- and 30-month follow-up surveys. The amount of supportive services is pro-vided in dollars and we assumed that these values reflect all costs of providing supportive services (that is, there are no administrative costs). We assumed all costs were borne in the first year of the follow-up period. The cost of supportive services are a cost to taxpayers and society as a whole.
Training. The 15- and 30-month follow-up surveys asked respondents both how much each training program they enrolled in cost in total, regardless of who paid for it, and how much they paid for the training. Customers could likely correctly recall the amount they paid for training; however, we suspect that customers might not have been able to provide accurate information on the full cost of training programs, especially for programs paid for by a grant or other funds. Furthermore, the amount an individual is charged for a program (even before scholarships and other sources of funding) does not necessarily reflect a program’s resource cost. For example, the full tuition charged to students at many public two- and four-year colleges falls below the cost of providing undergraduate education because of government subsidies received by colleges (Johnson 2014). Survey respondents reported that the cost of providing training was zero for about one-quarter of the training programs reported in the survey.
Our approach assumed that survey respondents correctly reported the amount they paid for training but that particularly large or small values of the reported total cost of a training program were incorrect. To measure the cost of training to customers, we used the amount customers reported paying for training. To measure the cost of training to society, we used the reported cost of the training programs. To avoid the effects of the particularly large or small reported costs of a training, we assumed the cost was equal to the median, nonzero cost of a training reported within 45 groups: 15 categories of training program and the 3 study groups. Finally, we estimated the cost of training paid for by taxpayers as the difference between the cost to society and the amount paid by customers. Even with this approach, the cost of training to society could be understated. However, as discussed in Section F, the conclusions from the benefit-cost analysis are not sensitive to allowing for much larger costs of training to society.
d. Cost of all services received In total, we estimated that the cost to society of providing services to study participants was
about $3,000 to $4,000 per customer (Table VIII.1). For all study groups, training contributed the largest share of costs and supportive services contributed the smallest share.
Table VIII.1. Per-person total cost of services to society as a whole (all customers)
Full-WIA Core-and-intensive Core
Resource rooms, workshops, meetings with counselors, job clubs, and assessments 663 620 506 Supportive services 225 99 58 Training—total costs 3,223 3,259 2,567
Amount taxpayers paid 1,521 1,222 579 Amount customers paid 1,702 2,037 1,988
Total 4,111 3,978 3,131
121
Sources: WIA Gold Standard Evaluation 15- and 30-month follow-up surveys and cost data provided by the 28 study local areas.
Note: All estimates are in 2012 dollars. Costs reflect the average costs of services for all customers. Customers who did not receive a specific service are included with a cost of zero.
Aggregating across all services received, the average customers in the full-WIA and core-and-intensive groups received services with about the same dollar value (Table VIII.1). In total, the costs of all services received by customers in both groups were about $4,000 per person. Overall costs of training were also fairly similar for customers in these two study groups. The average total costs of training for both full-WIA and core-and-intensive customers were between $3,000 and $3,500. However, customers in the full-WIA group paid less for training than customers in the core-and-intensive group, both in absolute terms and as a fraction of the total costs of training. Thus, although total costs of services were similar, the full-WIA group received more services paid for by taxpayers than the core-and-intensive group.
Customers in the core group received services with a lower dollar value than customers in the other study groups (Table VIII.1). On average, services for customers in the core group cost about $3,000 in total, about three quarters of the amount of the cost of the services received by customers in the other two study groups. The core customers themselves paid much of that cost.
4. Estimating the net benefits of providing each type of service To estimate the net benefits of providing each type of service, we used the same basic
approach as we used to estimate impacts on individual outcomes. We estimated the benefits and costs accruing to each customer and then estimated the net benefits of those services funded by the Adult and Dislocated Worker programs by comparing the average net benefits across our study groups.
• To estimate the net benefits of WIA-funded training, we calculated the differences in the estimated benefits and costs between the full-WIA and core-and-intensive groups.
• To estimate the net benefits of WIA-funded intensive services, we calculated the differences in the estimated benefits and costs between the core-and-intensive and core groups.
• To estimate the net benefits of WIA-funded intensive and training services, we calculated the differences in the estimated benefits and costs between the full-WIA and core groups.
5. Sensitivity analyses Like most benefit-cost analyses, our estimates of benefits and costs required many
assumptions. We thus examined the sensitivity of our results to changes in these assumptions to ensure that none were crucial to our findings. We explored how our results differed if we did each of the following:
1. Used earnings impacts from the NDNH data (instead of those from survey data)
2. Used a discount rate of 2 or 4 percent (instead of 1.5 percent)
3. Increased or decreased the assumed value of fringe benefits by 5 percent of earnings
4. Increased or decreased the assumed tax rate by 5 percentage points
122
5. Estimated net benefits associated with fringe benefits accounting for differences in the types of jobs held by customers in the different study groups
6. Extrapolated productivity benefits past the 30-month follow-up period (assuming the impacts of access to services on earnings, fringe benefits, and taxes in the last year of the follow-up period persisted until customers’ retirements)
7. Doubled the estimated costs of training to society
B. Benefits, costs, and net benefits of WIA-funded training
The net benefits of WIA-funded training for society as a whole, customers, and taxpayers were all negative during the 30-month follow-up period (Table VIII.2). These costs were driven by the lower productivity of the full-WIA group, as measured by their earnings and fringe benefits, relative to the core-and-intensive group. As detailed in Chapter VI, earnings for customers in the full-WIA group were lower than earnings for customers in the core-and-intensive group, especially during the initial quarters of the follow-up period when customers in the full-WIA group were more likely to be enrolled in training than customers in the other study groups. These lower earnings in the early quarters were not offset by higher earnings in later quarters within the 30-month follow-up period. Reflecting the earnings differences, the full-WIA group also received fewer fringe benefits and paid less in taxes.
• Society as a whole. On average, it costs society as a whole about $5,000 per customer to provide the full set of WIA services available relative to only the services available to the core-and-intensive group. This estimate accounts for the fact that many full-WIA customers did not enroll in training. The lower earnings among the full-WIA group compared with the core-and-intensive group largely drove this cost.
• Customers. On average, customers did not benefit from training funded by the Adult and Dislocated Worker programs. On average, training cost customers about $3,500 each during the 30-month follow-up period. This cost arose because customers who were in training, rather than working, had lower earnings. The decrease in earnings (and corresponding decrease in fringe benefits) was partially offset for customers by decreases in taxes and increases in public assistance. Full-WIA customers also paid less out-of-pocket for training than core-and-intensive customers, despite being more likely to enroll in training (Table VIII.2). But these benefits did not offset the large costs associated with reduced productivity.
• Taxpayers. Taxpayers also faced a net cost, on average, of WIA-funded training during the follow-up period. This was almost entirely driven by the lower taxes paid by the full-WIA group, relative to the core-and-intensive group, as a result of their lower earnings. The net cost to taxpayers increased by a small amount because of increases in public assistance associated with access to training funded by the Adult and Dislocated Worker programs. Furthermore, taxpayers paid more for the services received by the full-WIA group than those received by the core-and-intensive group, particularly training.
These results are generally robust to changes in our methods of estimating benefits and costs. As described in more detail in Section F, a number of sensitivity analyses produce negative estimates of the net benefit of access to WIA-funded training from all perspectives. These analyses also tend to produce estimates of a similar magnitude to those produced by our
123
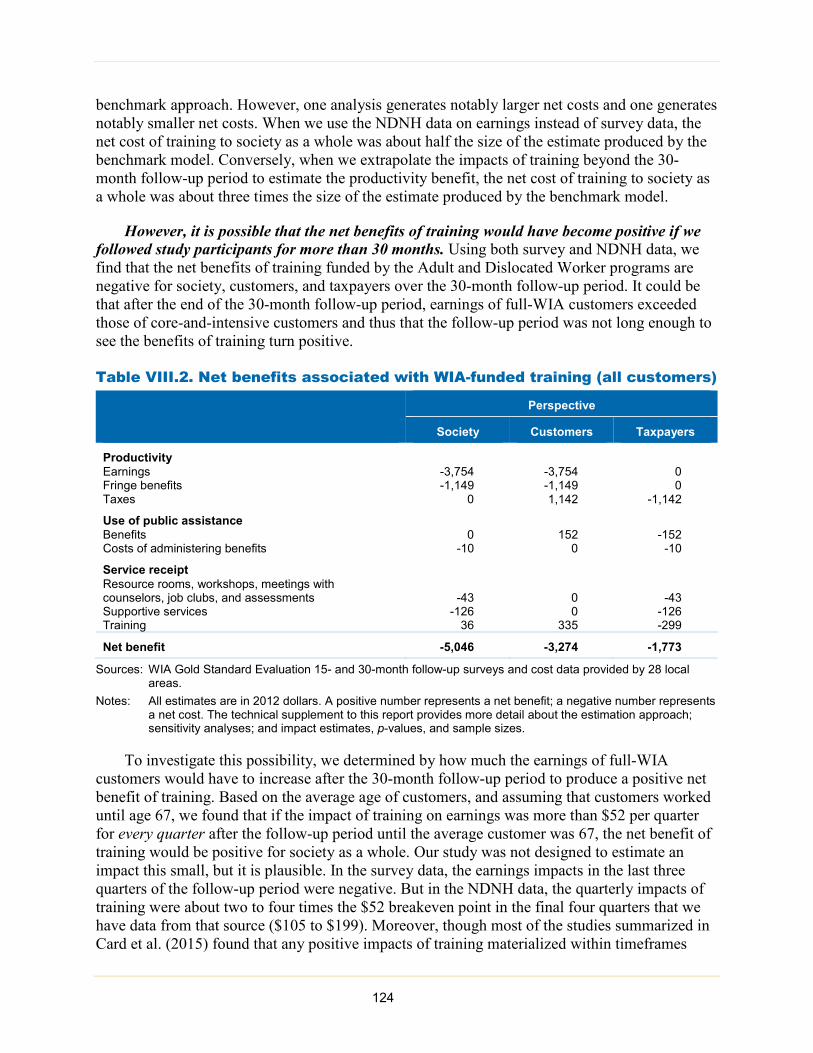
benchmark approach. However, one analysis generates notably larger net costs and one generates notably smaller net costs. When we use the NDNH data on earnings instead of survey data, the net cost of training to society as a whole was about half the size of the estimate produced by the benchmark model. Conversely, when we extrapolate the impacts of training beyond the 30-month follow-up period to estimate the productivity benefit, the net cost of training to society as a whole was about three times the size of the estimate produced by the benchmark model.
However, it is possible that the net benefits of training would have become positive if we followed study participants for more than 30 months. Using both survey and NDNH data, we find that the net benefits of training funded by the Adult and Dislocated Worker programs are negative for society, customers, and taxpayers over the 30-month follow-up period. It could be that after the end of the 30-month follow-up period, earnings of full-WIA customers exceeded those of core-and-intensive customers and thus that the follow-up period was not long enough to see the benefits of training turn positive.
Table VIII.2. Net benefits associated with WIA-funded training (all customers)
Perspective
Society Customers Taxpayers
Productivity Earnings -3,754 -3,754 0 Fringe benefits -1,149 -1,149 0 Taxes 0 1,142 -1,142
Use of public assistance Benefits 0 152 -152 Costs of administering benefits -10 0 -10
Service receipt Resource rooms, workshops, meetings with counselors, job clubs, and assessments -43 0 -43 Supportive services -126 0 -126 Training 36 335 -299
Net benefit -5,046 -3,274 -1,773
Sources: WIA Gold Standard Evaluation 15- and 30-month follow-up surveys and cost data provided by 28 local areas.
Notes: All estimates are in 2012 dollars. A positive number represents a net benefit; a negative number represents a net cost. The technical supplement to this report provides more detail about the estimation approach; sensitivity analyses; and impact estimates, p-values, and sample sizes.
To investigate this possibility, we determined by how much the earnings of full-WIA customers would have to increase after the 30-month follow-up period to produce a positive net benefit of training. Based on the average age of customers, and assuming that customers worked until age 67, we found that if the impact of training on earnings was more than $52 per quarter for every quarter after the follow-up period until the average customer was 67, the net benefit of training would be positive for society as a whole. Our study was not designed to estimate an impact this small, but it is plausible. In the survey data, the earnings impacts in the last three quarters of the follow-up period were negative. But in the NDNH data, the quarterly impacts of training were about two to four times the $52 breakeven point in the final four quarters that we have data from that source ($105 to $199). Moreover, though most of the studies summarized in Card et al. (2015) found that any positive impacts of training materialized within timeframes 124
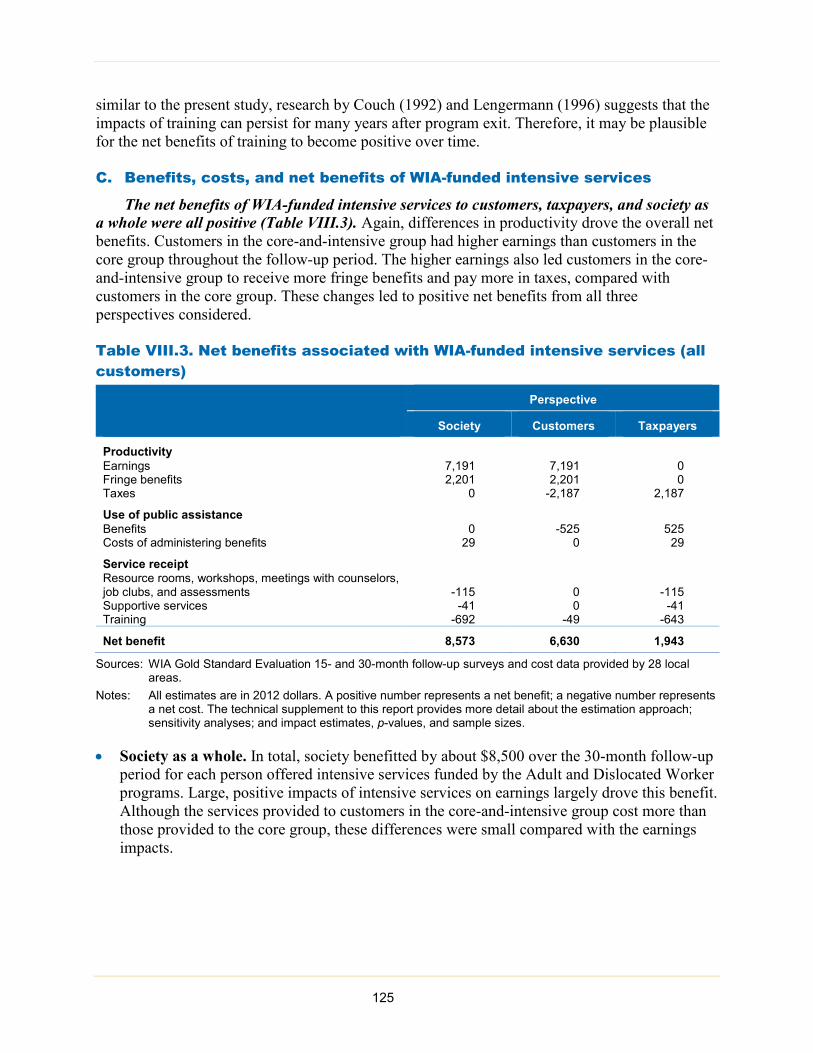
similar to the present study, research by Couch (1992) and Lengermann (1996) suggests that the impacts of training can persist for many years after program exit. Therefore, it may be plausible for the net benefits of training to become positive over time.
C. Benefits, costs, and net benefits of WIA-funded intensive services
The net benefits of WIA-funded intensive services to customers, taxpayers, and society as a whole were all positive (Table VIII.3). Again, differences in productivity drove the overall net benefits. Customers in the core-and-intensive group had higher earnings than customers in the core group throughout the follow-up period. The higher earnings also led customers in the core-and-intensive group to receive more fringe benefits and pay more in taxes, compared with customers in the core group. These changes led to positive net benefits from all three perspectives considered.
Table VIII.3. Net benefits associated with WIA-funded intensive services (all customers)
Perspective
Society Customers Taxpayers
Productivity Earnings 7,191 7,191 0 Fringe benefits 2,201 2,201 0 Taxes 0 -2,187 2,187
Use of public assistance Benefits 0 -525 525 Costs of administering benefits 29 0 29
Service receipt Resource rooms, workshops, meetings with counselors, job clubs, and assessments -115 0 -115 Supportive services -41 0 -41 Training -692 -49 -643
Net benefit 8,573 6,630 1,943
Sources: WIA Gold Standard Evaluation 15- and 30-month follow-up surveys and cost data provided by 28 local areas.
Notes: All estimates are in 2012 dollars. A positive number represents a net benefit; a negative number represents a net cost. The technical supplement to this report provides more detail about the estimation approach; sensitivity analyses; and impact estimates, p-values, and sample sizes.
• Society as a whole. In total, society benefitted by about $8,500 over the 30-month follow-up period for each person offered intensive services funded by the Adult and Dislocated Worker programs. Large, positive impacts of intensive services on earnings largely drove this benefit. Although the services provided to customers in the core-and-intensive group cost more than those provided to the core group, these differences were small compared with the earnings impacts.
125
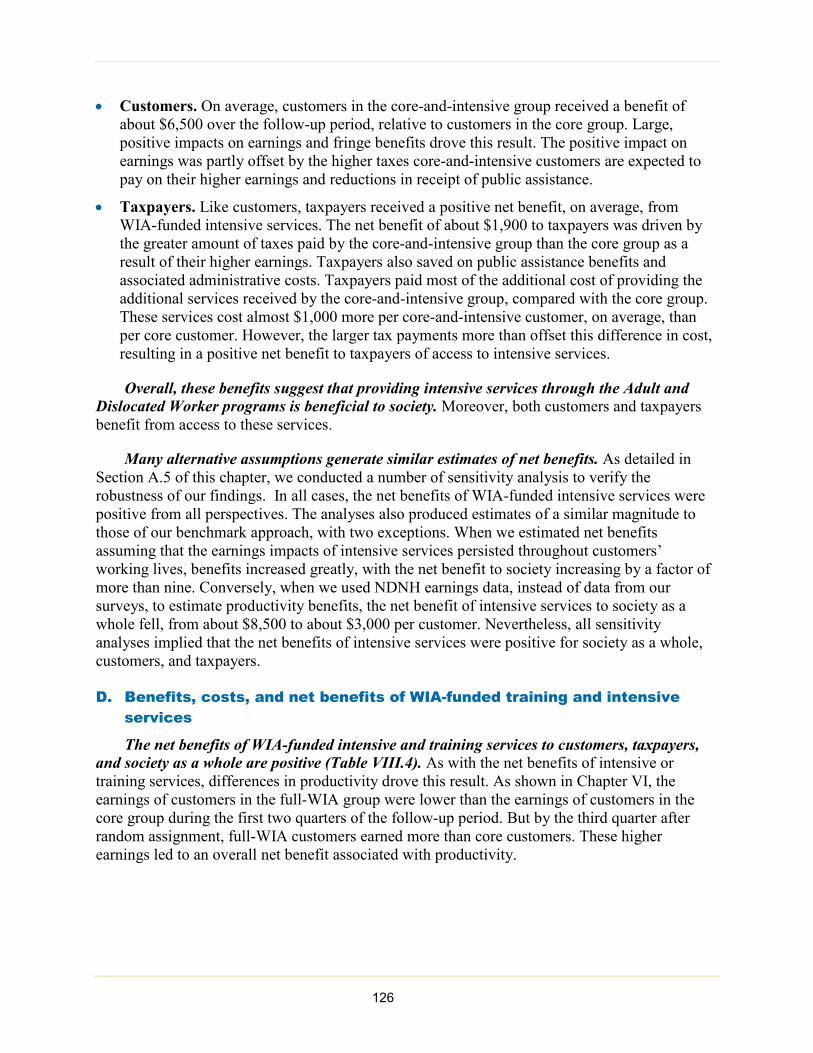
• Customers. On average, customers in the core-and-intensive group received a benefit of about $6,500 over the follow-up period, relative to customers in the core group. Large, positive impacts on earnings and fringe benefits drove this result. The positive impact on earnings was partly offset by the higher taxes core-and-intensive customers are expected to pay on their higher earnings and reductions in receipt of public assistance.
• Taxpayers. Like customers, taxpayers received a positive net benefit, on average, from WIA-funded intensive services. The net benefit of about $1,900 to taxpayers was driven by the greater amount of taxes paid by the core-and-intensive group than the core group as a result of their higher earnings. Taxpayers also saved on public assistance benefits and associated administrative costs. Taxpayers paid most of the additional cost of providing the additional services received by the core-and-intensive group, compared with the core group. These services cost almost $1,000 more per core-and-intensive customer, on average, than per core customer. However, the larger tax payments more than offset this difference in cost, resulting in a positive net benefit to taxpayers of access to intensive services.
Overall, these benefits suggest that providing intensive services through the Adult and Dislocated Worker programs is beneficial to society. Moreover, both customers and taxpayers benefit from access to these services.
Many alternative assumptions generate similar estimates of net benefits. As detailed in Section A.5 of this chapter, we conducted a number of sensitivity analysis to verify the robustness of our findings. In all cases, the net benefits of WIA-funded intensive services were positive from all perspectives. The analyses also produced estimates of a similar magnitude to those of our benchmark approach, with two exceptions. When we estimated net benefits assuming that the earnings impacts of intensive services persisted throughout customers’ working lives, benefits increased greatly, with the net benefit to society increasing by a factor of more than nine. Conversely, when we used NDNH earnings data, instead of data from our surveys, to estimate productivity benefits, the net benefit of intensive services to society as a whole fell, from about $8,500 to about $3,000 per customer. Nevertheless, all sensitivity analyses implied that the net benefits of intensive services were positive for society as a whole, customers, and taxpayers.
D. Benefits, costs, and net benefits of WIA-funded training and intensive services
The net benefits of WIA-funded intensive and training services to customers, taxpayers, and society as a whole are positive (Table VIII.4). As with the net benefits of intensive or training services, differences in productivity drove this result. As shown in Chapter VI, the earnings of customers in the full-WIA group were lower than the earnings of customers in the core group during the first two quarters of the follow-up period. But by the third quarter after random assignment, full-WIA customers earned more than core customers. These higher earnings led to an overall net benefit associated with productivity.
126
Table VIII.4. Net benefits associated with WIA-funded intensive and training services (all customers)
Perspective
Society Customers Taxpayers
Productivity Earnings 3,437 3,437 0 Fringe benefits 1,052 1,052 0 Taxes 0 -1,046 1,046
Use of public assistance Benefits 0 -373 373 Costs of administering benefits 18 0 18
Service receipt Resource rooms, workshops, meetings with counselors, job clubs, and assessments -158 0 -158 Supportive services -168 0 -168 Training -656 286 -942
Net benefit 3,526 3,356 170
Sources: WIA Gold Standard Evaluation 15- and 30-month follow-up surveys and cost data provided by 28 local areas.
Notes: All estimates are in 2012 dollars. A positive number represents a net benefit; a negative number represents a net cost. The technical supplement to this report provides more detail about the estimation approach; sensitivity analyses; and impact estimates, p-values, and sample sizes.
• Society as a whole. The estimates suggest that from the perspective of society as a whole, WIA-funded training and intensive services can be expected to produce a benefit of about $3,500 over the 30-month follow-up period. This is driven by increases in productivity but offset by higher costs of providing services to the full-WIA group compared with the core group.
• Customers. On average, customers in the full-WIA group received a net benefit of about $3,500 over the follow-up period, relative to customers in the core group. Positive impacts on earnings and fringe benefits drove this result. These benefits were partially offset by the taxes full-WIA customers would be expected to pay on their higher earnings. Reflecting their higher earnings, full-WIA customers also received less in public assistance than core customers, which is a cost to customers. In addition, customers in the full-WIA group spent less on training expenses than core customers, despite being more likely to enroll in training (Chapter V). This is a benefit to customers, further reinforcing the benefits from increased productivity.
• Taxpayers. Taxpayers received a positive net benefit of less than $200, on average, from WIA-funded intensive and training services over the course of the 30-month follow-up period. On the positive side of the ledger, full-WIA customers would be expected to pay slightly more than $1,000 more in taxes as a result of their higher earnings. Taxpayers also save on public assistance benefits and associated administrative costs. However, taxpayers bear much of the cost of providing services to customers. The total costs borne by taxpayers were more than $1,000 more per full-WIA customer, on average, than per core customer. These costs were less than the benefits to taxpayers associated with productivity and public assistance, resulting in a positive, albeit small, net benefit to taxpayers.
127
Overall, the results suggest that providing both intensive and training services through the Adult and Dislocated Worker programs provides value to program customers, taxpayers, and society as a whole; however, the positive benefit is driven by the benefits associated with intensive services.
Our sensitivity analyses demonstrate that the net benefits of WIA-funded intensive and training services remain positive under a variety of different assumptions. In all sensitivity analyses, the net benefit of intensive and training services is positive from the perspectives of society as a whole and customers. The estimated net benefits are also similar across all analyses, except for that which extrapolates productivity benefits into the future and that which uses NDNH data in place of survey data. As with the net benefits of intensive or training services alone, extrapolating benefits into the future implies net benefits that are larger in magnitude, and using NDNH data on earnings implies net benefits that are smaller in magnitude. Additionally, although the benchmark model produces a net benefit of intensive and training services to taxpayers of just under $200, some of the sensitivity analyses imply net costs to customers. These costs range from close to zero to about $500.
E. Benefits and costs for adults and dislocated workers
As adults and dislocated workers have different average characteristics, we might expect differences in the net benefits of providing services to the two populations. Chapter VI shows that the magnitudes of impacts often differed for adults and dislocated workers, even though impacts tended to be the same sign and there were few statistically significant differences in impacts for the two groups. For example, the impact of training on Quarter 1 earnings was negative and not statistically significant for both adults and dislocated workers. But the magnitude of the effect was more than $1,000 for dislocated workers but less than $100 for adults. As a result of such differences in magnitude, we find in the benefit-cost analyses that net benefits differed for adults and dislocated workers.
1. Benefits, costs, and net benefits of WIA-funded training, by adult and dislocated worker status Analyzing adults and dislocated workers separately indicates that costs for dislocated
workers drove the $5,000 per-person net cost of providing training during the follow-up period (Table VIII.5). From the perspective of society as a whole, the net cost of providing training was less than $500 per adult but more than $11,000 per dislocated worker. From the perspective of taxpayers, net costs were also larger for dislocated workers than for adults. Moreover, dislocated workers lost, on average, about $8,500 each from training, whereas adults benefited by a small amount.
The differences in net benefits for dislocated workers and adults were driven by differences in the impacts of training on earnings, especially early in the follow-up period. Dislocated workers in the full-WIA group earned less than dislocated workers in the core-and-intensive group. Most differences were not statistically significant, though many were more than $1,000 (Appendix E, Table E.VI.1). The negative earnings impacts led to large productivity costs of training. Differences between adults in the full-WIA and core-and-intensive groups were much smaller, implying much smaller productivity costs. Although there were some additional differences between the benefits and costs associated with use of public assistance and service
128
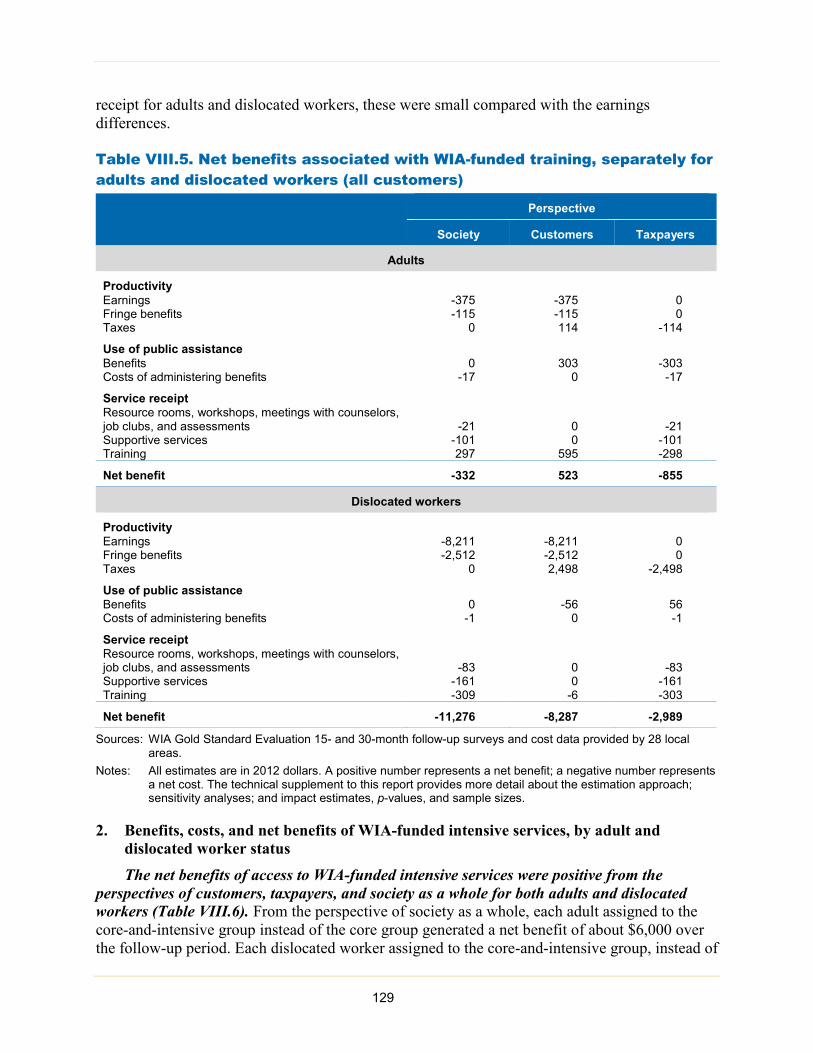
receipt for adults and dislocated workers, these were small compared with the earnings differences.
Table VIII.5. Net benefits associated with WIA-funded training, separately for adults and dislocated workers (all customers)
Perspective
Society Customers Taxpayers
Adults
Productivity Earnings -375 -375 0 Fringe benefits -115 -115 0 Taxes 0 114 -114
Use of public assistance Benefits 0 303 -303 Costs of administering benefits -17 0 -17
Service receipt Resource rooms, workshops, meetings with counselors, job clubs, and assessments -21 0 -21 Supportive services -101 0 -101 Training 297 595 -298
Net benefit -332 523 -855
Dislocated workers
Productivity Earnings -8,211 -8,211 0 Fringe benefits -2,512 -2,512 0 Taxes 0 2,498 -2,498
Use of public assistance Benefits 0 -56 56 Costs of administering benefits -1 0 -1
Service receipt Resource rooms, workshops, meetings with counselors, job clubs, and assessments -83 0 -83 Supportive services -161 0 -161 Training -309 -6 -303
Net benefit -11,276 -8,287 -2,989
Sources: WIA Gold Standard Evaluation 15- and 30-month follow-up surveys and cost data provided by 28 local areas.
Notes: All estimates are in 2012 dollars. A positive number represents a net benefit; a negative number represents a net cost. The technical supplement to this report provides more detail about the estimation approach; sensitivity analyses; and impact estimates, p-values, and sample sizes.
2. Benefits, costs, and net benefits of WIA-funded intensive services, by adult and dislocated worker status The net benefits of access to WIA-funded intensive services were positive from the
perspectives of customers, taxpayers, and society as a whole for both adults and dislocated workers (Table VIII.6). From the perspective of society as a whole, each adult assigned to the core-and-intensive group instead of the core group generated a net benefit of about $6,000 over the follow-up period. Each dislocated worker assigned to the core-and-intensive group, instead of 129
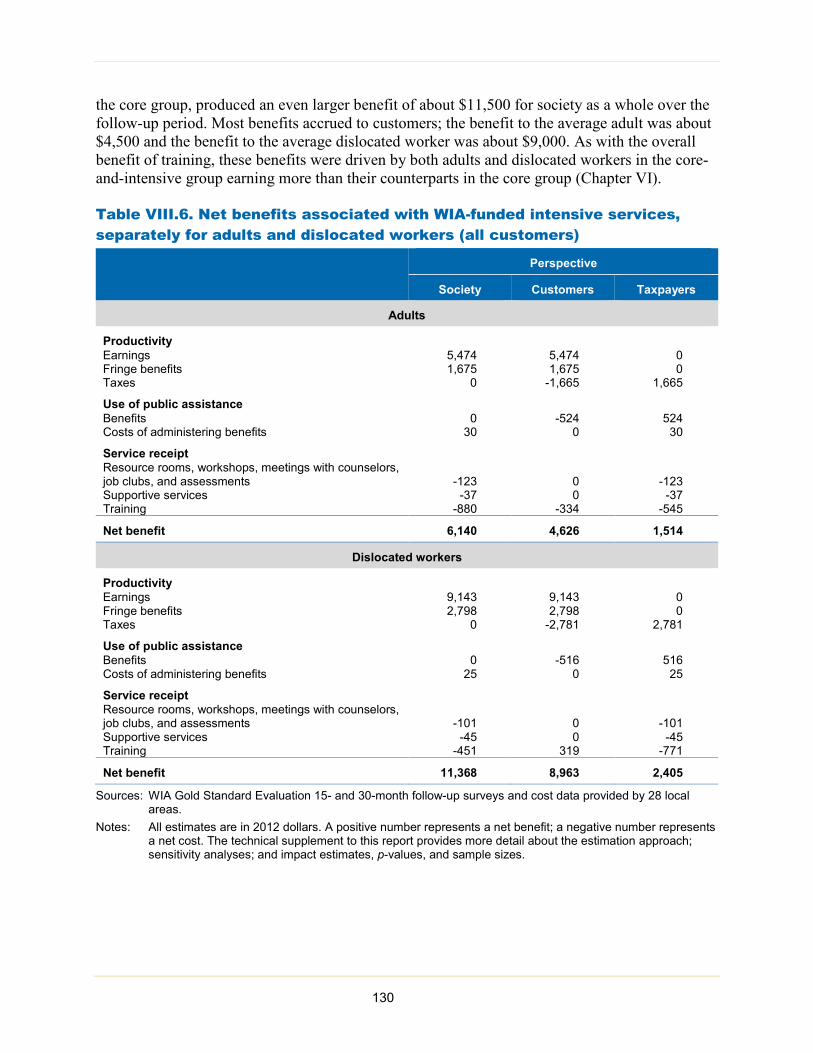
the core group, produced an even larger benefit of about $11,500 for society as a whole over the follow-up period. Most benefits accrued to customers; the benefit to the average adult was about $4,500 and the benefit to the average dislocated worker was about $9,000. As with the overall benefit of training, these benefits were driven by both adults and dislocated workers in the core-and-intensive group earning more than their counterparts in the core group (Chapter VI).
Table VIII.6. Net benefits associated with WIA-funded intensive services, separately for adults and dislocated workers (all customers)
Perspective
Society Customers Taxpayers
Adults
Productivity Earnings 5,474 5,474 0 Fringe benefits 1,675 1,675 0 Taxes 0 -1,665 1,665
Use of public assistance Benefits 0 -524 524 Costs of administering benefits 30 0 30
Service receipt Resource rooms, workshops, meetings with counselors, job clubs, and assessments -123 0 -123 Supportive services -37 0 -37 Training -880 -334 -545
Net benefit 6,140 4,626 1,514
Dislocated workers
Productivity Earnings 9,143 9,143 0 Fringe benefits 2,798 2,798 0 Taxes 0 -2,781 2,781
Use of public assistance Benefits 0 -516 516 Costs of administering benefits 25 0 25
Service receipt Resource rooms, workshops, meetings with counselors, job clubs, and assessments -101 0 -101 Supportive services -45 0 -45 Training -451 319 -771
Net benefit 11,368 8,963 2,405
Sources: WIA Gold Standard Evaluation 15- and 30-month follow-up surveys and cost data provided by 28 local areas.
Notes: All estimates are in 2012 dollars. A positive number represents a net benefit; a negative number represents a net cost. The technical supplement to this report provides more detail about the estimation approach; sensitivity analyses; and impact estimates, p-values, and sample sizes.
130
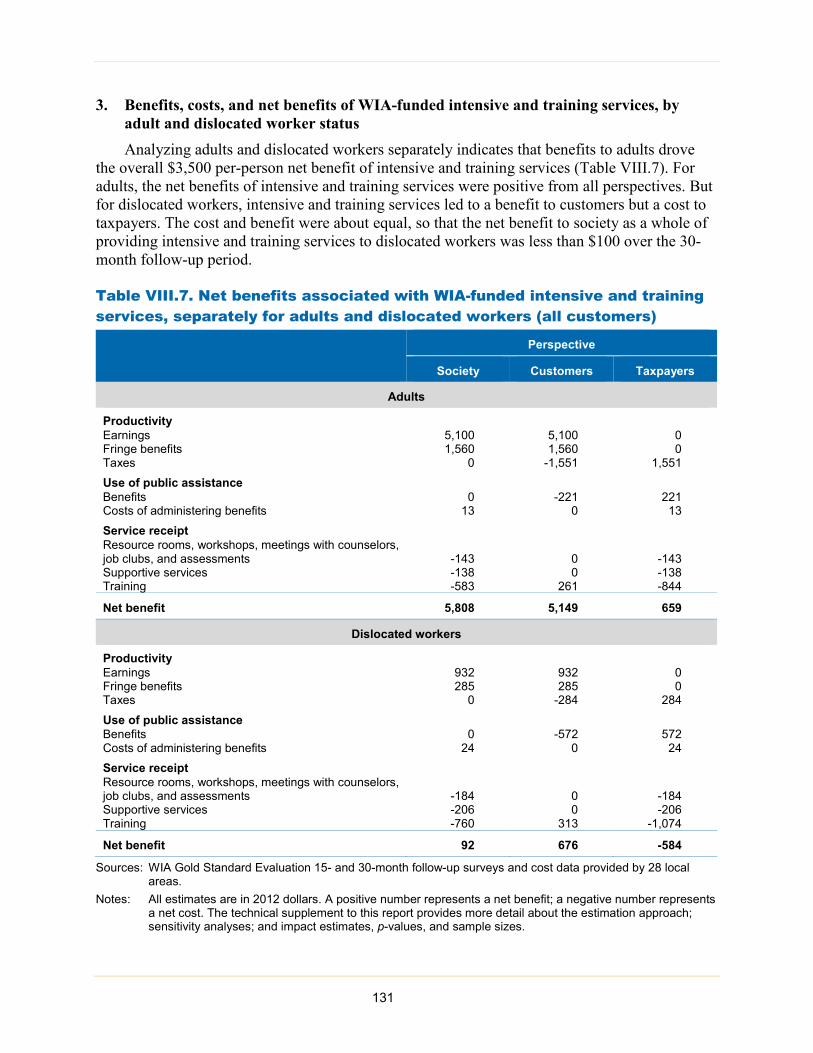
3. Benefits, costs, and net benefits of WIA-funded intensive and training services, by adult and dislocated worker status Analyzing adults and dislocated workers separately indicates that benefits to adults drove
the overall $3,500 per-person net benefit of intensive and training services (Table VIII.7). For adults, the net benefits of intensive and training services were positive from all perspectives. But for dislocated workers, intensive and training services led to a benefit to customers but a cost to taxpayers. The cost and benefit were about equal, so that the net benefit to society as a whole of providing intensive and training services to dislocated workers was less than $100 over the 30-month follow-up period.
Table VIII.7. Net benefits associated with WIA-funded intensive and training services, separately for adults and dislocated workers (all customers)
Perspective
Society Customers Taxpayers
Adults
Productivity Earnings 5,100 5,100 0 Fringe benefits 1,560 1,560 0 Taxes 0 -1,551 1,551
Use of public assistance Benefits 0 -221 221 Costs of administering benefits 13 0 13
Service receipt Resource rooms, workshops, meetings with counselors, job clubs, and assessments -143 0 -143 Supportive services -138 0 -138 Training -583 261 -844
Net benefit 5,808 5,149 659
Dislocated workers
Productivity Earnings 932 932 0 Fringe benefits 285 285 0 Taxes 0 -284 284
Use of public assistance Benefits 0 -572 572 Costs of administering benefits 24 0 24
Service receipt Resource rooms, workshops, meetings with counselors, job clubs, and assessments -184 0 -184 Supportive services -206 0 -206 Training -760 313 -1,074
Net benefit 92 676 -584
Sources: WIA Gold Standard Evaluation 15- and 30-month follow-up surveys and cost data provided by 28 local areas.
Notes: All estimates are in 2012 dollars. A positive number represents a net benefit; a negative number represents a net cost. The technical supplement to this report provides more detail about the estimation approach; sensitivity analyses; and impact estimates, p-values, and sample sizes.
131
The benefits of providing services to adults and dislocated workers differed mainly because of differences in earnings impacts. Although both adults and dislocated workers in the full-WIA group earned more than their counterparts in the core group, differences were larger in magnitude and more consistently positive across quarters for adults (Chapter VI). As a result, the magnitudes of the productivity impacts for adults were about five times as large as those for dislocated workers. Differences in the benefits and costs associated with the use of public assistance and service receipt were somewhat smaller.
F. Results of the sensitivity analyses
We conducted a number of sensitivity analyses but none changed the implications of the benefit-cost analysis for policymakers (Table VIII.8). To determine whether our results were robust, we estimated the benefits and costs of providing intensive and training services using nine alternative sets of assumptions. Each analysis implies that training led to net costs for society as a whole and intensive services, with or without training, led to net benefits. However, as mentioned in Section B, a small, positive earnings impact of training after the end of the follow-up period will imply that training generates net benefits.
Most of the analyses also led to only small differences in the magnitudes of estimates of benefits and costs. The exceptions are the analysis that uses impacts on earnings estimated from the NDNH and the analysis that extrapolates productivity benefits into the future.
Just as differences in earnings are muted when one uses the NDNH to analyze impacts (Chapter VI), benefits and costs are muted when one uses the NDNH in the benefit-cost analysis. From the perspective of society as a whole, using the NDNH data on earnings implies that the net cost of providing WIA-funded training was about $2,500, about half the size of the estimate from the benchmark model; the net benefit of providing WIA-funded intensive services was about $3,000, about one-third the size of the estimate from the benchmark model; and the net benefit of intensive and training services was about $500, less than one-fifth the size of the estimate from the benchmark model. In addition, the benchmark model implies that providing both intensive and training services led to a small net benefit to taxpayers. Using the NDNH data on earnings instead implies a loss of about $500 per customer to taxpayers. This occurs because the NDNH implies a much smaller increase in tax payments associated with intensive and training services, compared with the survey data.
Conversely, net benefits to society increase by a factor of at least three when one extrapolates productivity benefits beyond the 30-month follow-up period. For this sensitivity analysis, we assumed that the impacts of providing WIA-funded services on earnings in the final year of the follow-up period persisted until a customer’s retirement. That is, if earnings in Quarters 7 to 10 were $100 higher in one study group than another, we calculated net benefits assuming that earnings would be $100 higher for members of that study group until the average customer retired. This resulted in benefits and costs that were much larger in magnitude. For society as a whole, the analysis implied that the net cost of providing WIA-funded training was about $16,000, the net benefit of intensive services was about $83,000, and the net benefit of providing both intensive and training services was about $67,500.
132
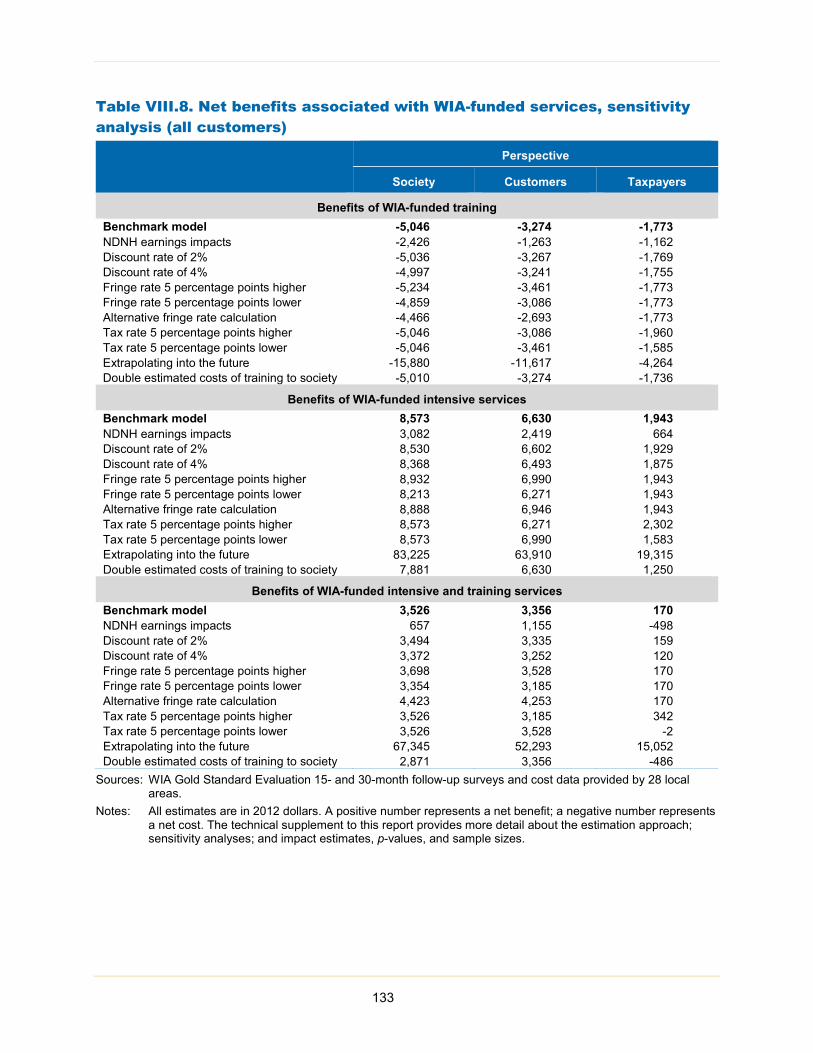
Table VIII.8. Net benefits associated with WIA-funded services, sensitivity analysis (all customers)
Perspective
Society Customers Taxpayers
Benefits of WIA-funded training Benchmark model -5,046 -3,274 -1,773 NDNH earnings impacts -2,426 -1,263 -1,162 Discount rate of 2% -5,036 -3,267 -1,769 Discount rate of 4% -4,997 -3,241 -1,755 Fringe rate 5 percentage points higher -5,234 -3,461 -1,773 Fringe rate 5 percentage points lower -4,859 -3,086 -1,773 Alternative fringe rate calculation -4,466 -2,693 -1,773 Tax rate 5 percentage points higher -5,046 -3,086 -1,960 Tax rate 5 percentage points lower -5,046 -3,461 -1,585 Extrapolating into the future -15,880 -11,617 -4,264 Double estimated costs of training to society -5,010 -3,274 -1,736
Benefits of WIA-funded intensive services Benchmark model 8,573 6,630 1,943 NDNH earnings impacts 3,082 2,419 664 Discount rate of 2% 8,530 6,602 1,929 Discount rate of 4% 8,368 6,493 1,875 Fringe rate 5 percentage points higher 8,932 6,990 1,943 Fringe rate 5 percentage points lower 8,213 6,271 1,943 Alternative fringe rate calculation 8,888 6,946 1,943 Tax rate 5 percentage points higher 8,573 6,271 2,302 Tax rate 5 percentage points lower 8,573 6,990 1,583 Extrapolating into the future 83,225 63,910 19,315 Double estimated costs of training to society 7,881 6,630 1,250
Benefits of WIA-funded intensive and training services Benchmark model 3,526 3,356 170 NDNH earnings impacts 657 1,155 -498 Discount rate of 2% 3,494 3,335 159 Discount rate of 4% 3,372 3,252 120 Fringe rate 5 percentage points higher 3,698 3,528 170 Fringe rate 5 percentage points lower 3,354 3,185 170 Alternative fringe rate calculation 4,423 4,253 170 Tax rate 5 percentage points higher 3,526 3,185 342 Tax rate 5 percentage points lower 3,526 3,528 -2 Extrapolating into the future 67,345 52,293 15,052 Double estimated costs of training to society 2,871 3,356 -486
Sources: WIA Gold Standard Evaluation 15- and 30-month follow-up surveys and cost data provided by 28 local areas.
Notes: All estimates are in 2012 dollars. A positive number represents a net benefit; a negative number represents a net cost. The technical supplement to this report provides more detail about the estimation approach; sensitivity analyses; and impact estimates, p-values, and sample sizes.
133

This page has been left blank for double-sided copying.
IX. DISCUSSION
The Adult and Dislocated Worker programs are two of the largest public workforce invest-ment programs in the United States, so it is important to determine the effectiveness of the services they offer. This report presents the estimates of the effectiveness of intensive and training services provided by these programs. It uses survey data from the first 30 months—or 10 quar-ters—after random assignment of customers (just after they became eligible for intensive services) and administrative data from the NDNH from the first 36 months—or 12 quarters—after customers were randomly assigned. We designed the study such that these findings are representa-tive of local areas nationally. This final chapter discusses the main conclusions from this report.
This study tested the effectiveness of intensive services and training funded through the Adult and Dislocated Worker programs compared to all other services available to customers.
Importantly, that the Adult and Dislocated Worker programs fund intensive services and training does not mean that each customer will receive all of those services, which is reflected in our analyses. Additionally, in the absence of funding for intensive services and training through the Adult and Dislocated Worker programs, customers could access similar services elsewhere. We account for both of these factors in our analyses. In particular:
• To estimate the impact of training funded by WIA, we compared a scenario with the full set of WIA services provided through the Adult and Dislocated Worker programs (represented by the full-WIA group) to a scenario where the programs fund core and intensive services but not training (represented by the core-and-intensive group). When the full set of Adult and Dislocated Worker services are available, including training, some customers are not eligible for training, some choose not to enroll in training because of personal preferences or constraints, and funds are not always available for all customers interested in and eligible for training. Likewise, customers in the core-and-intensive group could fund training in other ways, as they could if there were no WIA funds for training.
• To estimate the impact of intensive services funded by WIA, we compared the core-and-intensive group described above to a scenario where the Adult and Dislocated Worker programs fund core services but not training or intensive services (represented by the core group). Once again, core-and-intensive customers might not receive all types of intensive services, and some core customers might have accessed similar services through other sources, as they would if there were no WIA-funded intensive services.
WIA-funded intensive services were effective.
Our findings suggest that intensive services, when provided as a stand-alone service without training, increased earnings and employment. On average, core-and-intensive customers received about 30 minutes more one-on-one assistance than did core customers and they were more likely to attend workshops and take assessments as well. According to the survey data, providing these intensive services increased earnings over the follow-up period by about $7,000, or 20 percent. According to the NDNH data, intensive services also increased earnings but by a smaller amount of about $3,000, or 7 percent, over the 36-month period for which NDNH data are available, but it remains statistically significant. According to the survey data, intensive services have a
135
persistent positive impact on earnings even in the final quarters of the follow-up period. In contrast, according to the NDNH data, intensive services cease to affect earnings after about two years.
These effects are consistent with the past literature on intensive services, and job-search assistance more broadly. In particular, in a nonexperimental study, Heinrich et al. (2013) found that intensive services funded by the Adult and Dislocated Worker programs increased employment and earnings. Moreover, studies have shown that job-search assistance can increase employment and earnings and decrease unemployment insurance receipt in the short run (Meyer 1995; O’Leary 2004; Katz 2014).
The positive impacts of intensive services on earnings stem from a combination of factors. Core-and-intensive customers were more likely to be employed in most quarters, worked more hours, and had higher average wages than core customers—though not all of these estimated differences were statistically significant. In addition, the jobs held by core-and-intensive customers were more likely than the jobs held by core customers to offer fringe benefits, suggesting they may have higher-quality jobs. Core-and-intensive customers were also more likely than core customers to choose vocational training programs and obtain a credential for training, even though the training was not funded by WIA. This suggests that employment counselors may have affected customers’ choice of training program or provided support while they were in training.
The findings suggest that policymakers should continue to invest in staff assistance. The benefit-cost analyses demonstrate that providing intensive services is cost-effective from the perspectives of customers, taxpayers, and society as a whole even if impacts disappeared at the end of the follow-up period. Based on the survey data, customers benefited by nearly $7,000 on average over the 30-month follow-up period from having access to WIA-funded intensive services. And because these services are relatively inexpensive, society as a whole benefits from offering these services by about $8,500 per customer, and by about $3,000 according to the NDNH data.
Because differences across groups in rates of enrollment in training were small, our study produced inconclusive evidence on the impact of training in the 30 months after study enrollment.
Only about half of the full-WIA customers, who had access to the same services as under regular program operations, enrolled in training. About four in ten core-and-intensive customers—who could not access WIA training funds—still enrolled in training, paying for programs themselves or with funding from other sources. The difference in the training rates between the two groups was only 9 percentage points. That so many core-and-intensive customers enrolled in training is an important finding and suggests the value customers believe training has, but does limit what we can say about the effectiveness of training. Because the difference in training rates was small, even if training had large impacts on earnings among training participants, the difference in earnings for full-WIA and core-and-intensive customers would still be small because it is driven by the 9 percent of customers induced to enroll in training when the full set of WIA services is available.
136
Though not conclusive, the evidence suggests that WIA-funded training does not have positive impacts in the 30 months after study enrollment.
In the final quarters of the study, the estimated impacts on earnings were negative (but not statistically significant) according to the survey data and positive but close to zero according to the NDNH data. The estimated impacts on earnings over the whole follow-up period were negative (but again not statistically significant) according to both data sources. We similarly found no evidence of positive impacts when we estimated separate impacts for adults and dislocated workers.
Unless positive impacts on earnings materialize after the three-year follow-up period, WIA-funded training represented a net cost to society, taxpayers, and the customers themselves. From the perspective of society, providing WIA-funded training had a net cost of about $5,000 per person over the 30-month follow-up period, which arose mainly from the earnings forgone when the customers were in training. Early in the follow-up period, when full-WIA customers were more likely than core-and-intensive customers to enroll in training, they worked and earned less. Their quarterly earnings caught up to those of the core-and-intensive group in the latter half of our follow-up period, but these increases did not offset the earnings losses they incurred while enrolled in training.
Following the study participants for more than three years could possibly result in later positive impacts on earnings that offset the forgone earnings and the cost of the training programs. However, the evidence suggests that it is not likely that the impacts will increase because the difference across groups in enrollment in training disappeared by the beginning of the second year after random assignment. Furthermore, a typical full-WIA customer completed training about eight months into the follow-up period so most training participants were out of training well before the end of the follow-up period. Finally, most previous studies that found training had positive impacts on earnings for populations similar to those served by the Adult and Dislocated Worker programs found that this typically occurs within three years of enroll-ment (Card et al. 2015), which did not occur in our study according to the survey or NDNH data.
Nevertheless, we cannot rule out the possibility that training has positive (or negative) impacts on customers’ earnings, nor can we extrapolate our findings to all types of job training. As noted above, because the differences in training rates are small, the expected differences in earnings between the full-WIA and core-and-intensive groups are also small, and we cannot reliably detect small earnings impacts. Moreover, this study only examines the types of training programs funded by the Adult and Dislocated Worker programs during the follow-up period. It could be that providing training would have been more effective if training funds were more readily available or if customers enrolled in different types of training, such as the more employer focused training advocated under WIOA.
Our findings are consistent with past studies for dislocated workers but not for adults. Although we found that WIA-funded training did not increase earnings for either adults or dislocated workers, Heinrich et al. (2008) and Andersson et al. (2013) found that training increased earnings for adults but not for dislocated workers. One possible explanation for the difference in findings for adults is that unlike our study, these previous studies were not experimental, and thus, may not have fully captured differences between those who chose to
137
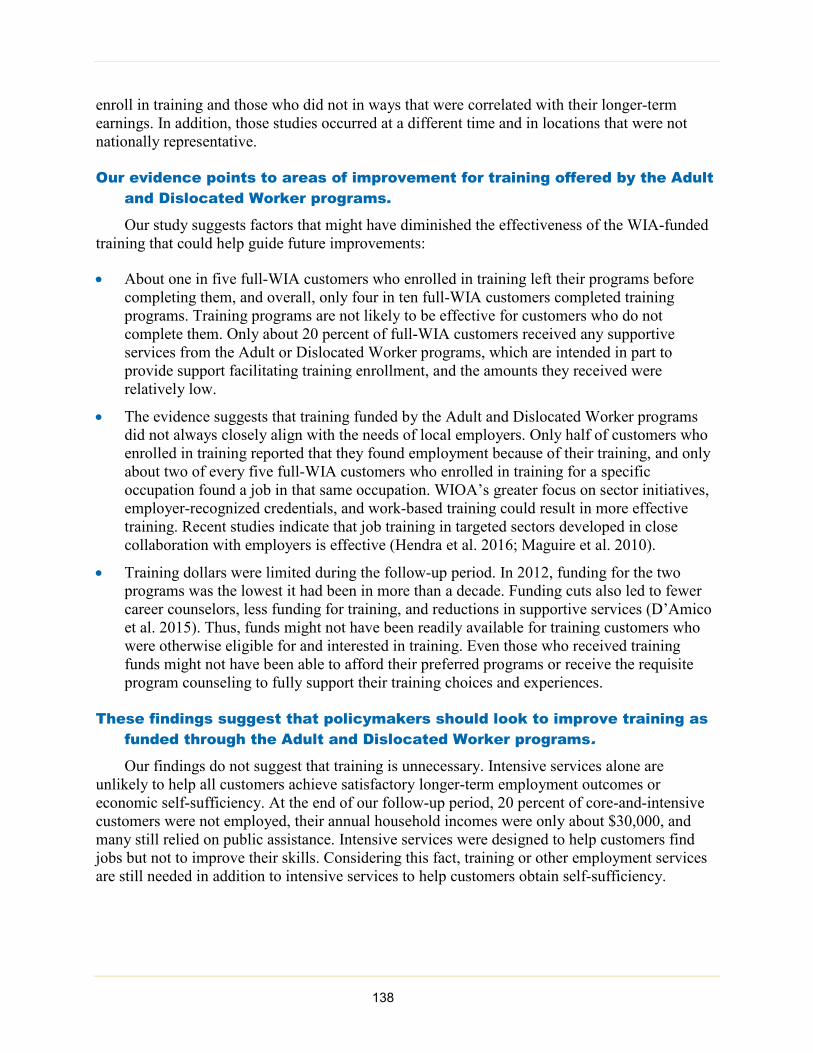
enroll in training and those who did not in ways that were correlated with their longer-term earnings. In addition, those studies occurred at a different time and in locations that were not nationally representative.
Our evidence points to areas of improvement for training offered by the Adult and Dislocated Worker programs.
Our study suggests factors that might have diminished the effectiveness of the WIA-funded training that could help guide future improvements:
• About one in five full-WIA customers who enrolled in training left their programs before completing them, and overall, only four in ten full-WIA customers completed training programs. Training programs are not likely to be effective for customers who do not complete them. Only about 20 percent of full-WIA customers received any supportive services from the Adult or Dislocated Worker programs, which are intended in part to provide support facilitating training enrollment, and the amounts they received were relatively low.
• The evidence suggests that training funded by the Adult and Dislocated Worker programs did not always closely align with the needs of local employers. Only half of customers who enrolled in training reported that they found employment because of their training, and only about two of every five full-WIA customers who enrolled in training for a specific occupation found a job in that same occupation. WIOA’s greater focus on sector initiatives, employer-recognized credentials, and work-based training could result in more effective training. Recent studies indicate that job training in targeted sectors developed in close collaboration with employers is effective (Hendra et al. 2016; Maguire et al. 2010).
• Training dollars were limited during the follow-up period. In 2012, funding for the two programs was the lowest it had been in more than a decade. Funding cuts also led to fewer career counselors, less funding for training, and reductions in supportive services (D’Amico et al. 2015). Thus, funds might not have been readily available for training customers who were otherwise eligible for and interested in training. Even those who received training funds might not have been able to afford their preferred programs or receive the requisite program counseling to fully support their training choices and experiences.
These findings suggest that policymakers should look to improve training as funded through the Adult and Dislocated Worker programs. Our findings do not suggest that training is unnecessary. Intensive services alone are
unlikely to help all customers achieve satisfactory longer-term employment outcomes or economic self-sufficiency. At the end of our follow-up period, 20 percent of core-and-intensive customers were not employed, their annual household incomes were only about $30,000, and many still relied on public assistance. Intensive services were designed to help customers find jobs but not to improve their skills. Considering this fact, training or other employment services are still needed in addition to intensive services to help customers obtain self-sufficiency.
138
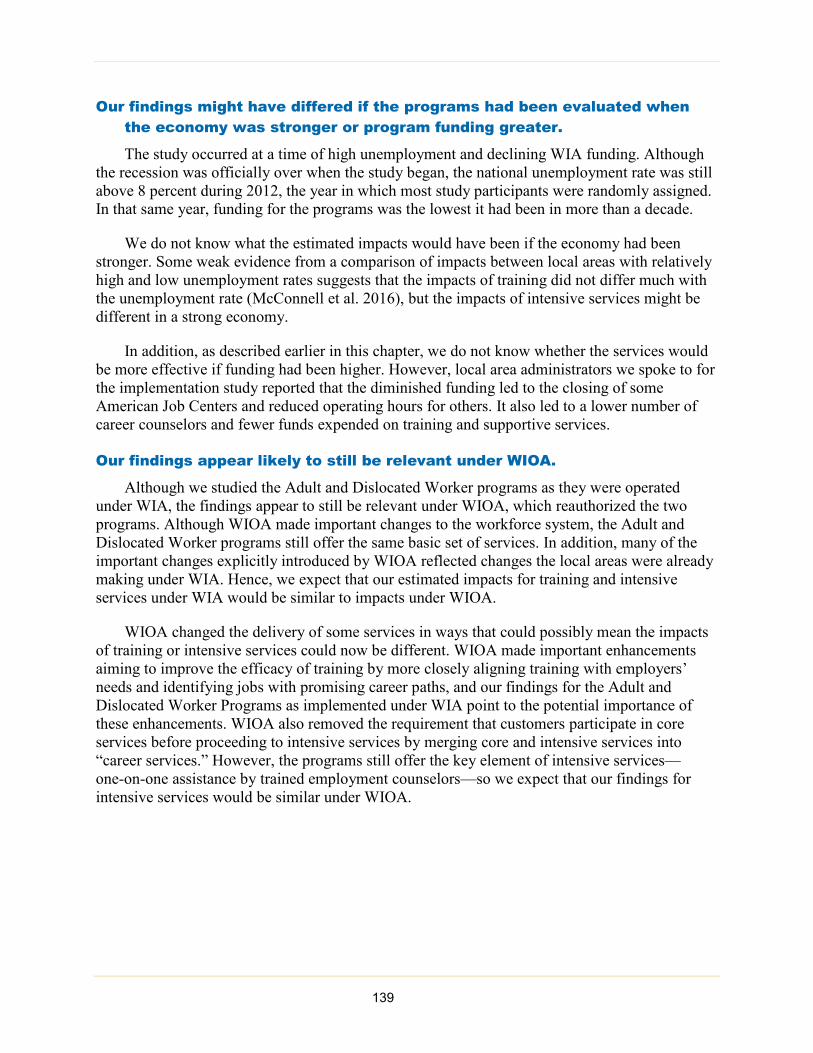
Our findings might have differed if the programs had been evaluated when the economy was stronger or program funding greater.
The study occurred at a time of high unemployment and declining WIA funding. Although the recession was officially over when the study began, the national unemployment rate was still above 8 percent during 2012, the year in which most study participants were randomly assigned. In that same year, funding for the programs was the lowest it had been in more than a decade.
We do not know what the estimated impacts would have been if the economy had been stronger. Some weak evidence from a comparison of impacts between local areas with relatively high and low unemployment rates suggests that the impacts of training did not differ much with the unemployment rate (McConnell et al. 2016), but the impacts of intensive services might be different in a strong economy.
In addition, as described earlier in this chapter, we do not know whether the services would be more effective if funding had been higher. However, local area administrators we spoke to for the implementation study reported that the diminished funding led to the closing of some American Job Centers and reduced operating hours for others. It also led to a lower number of career counselors and fewer funds expended on training and supportive services.
Our findings appear likely to still be relevant under WIOA.
Although we studied the Adult and Dislocated Worker programs as they were operated under WIA, the findings appear to still be relevant under WIOA, which reauthorized the two programs. Although WIOA made important changes to the workforce system, the Adult and Dislocated Worker programs still offer the same basic set of services. In addition, many of the important changes explicitly introduced by WIOA reflected changes the local areas were already making under WIA. Hence, we expect that our estimated impacts for training and intensive services under WIA would be similar to impacts under WIOA.
WIOA changed the delivery of some services in ways that could possibly mean the impacts of training or intensive services could now be different. WIOA made important enhancements aiming to improve the efficacy of training by more closely aligning training with employers’ needs and identifying jobs with promising career paths, and our findings for the Adult and Dislocated Worker Programs as implemented under WIA point to the potential importance of these enhancements. WIOA also removed the requirement that customers participate in core services before proceeding to intensive services by merging core and intensive services into “career services.” However, the programs still offer the key element of intensive services— one-on-one assistance by trained employment counselors—so we expect that our findings for intensive services would be similar under WIOA.
139

This page has been left blank for double-sided copying.
REFERENCES
Andersson, Fredrik, Harry Holzer, Julia Lane, David Rosenblum, and Jeffrey Smith. “Does Federally-Funded Job Training Work? Nonexperimental Estimates of WIA Training Impacts Using Longitudinal Data on Workers and Firms.” NBER Working Paper No. 19446. Cambridge, MA: National Bureau of Economic Research, 2013.
Barnow, Burt S. and Jeffrey Smith. “Employment and training programs.” In Economics of Means-Tested Transfer Programs in the United States, Volume II, edited by R.A. Moffit. Chicago, IL: University of Chicago Press, 2016.
Bendewald, E., Maryns, N., & Robertson, R. (2016). An Evaluation of the Workforce Investment Act Adult Program in Minnesota: Lessons from the Financial Crisis. IZA Discussion Paper No. 10107.
Blakemore, Arthur E., Paul L. Burgess, Stuart A. Low, and Robert D. St. Louis. "Employer tax evasion in the unemployment insurance program." Journal of Labor Economics, vol. 14, no. 2, 1996, pp. 210-230.
Card, David, Jochen Kluve, and Andrea Weber. “What Works? A Meta Analysis of Recent Active Labor Market Program Evaluations.” NBER Working Paper No. 21431. Cambridge, MA: National Bureau of Economic Research, 2015.
Couch, Kenneth A. “New Evidence on the Long-term Effects of Employment Training Programs.” Journal of Labor Economics, vol. 10, no. 4, 1992, pp. 380-388.
D’Amico, Ronald, Kate Dunham, Verenice Chavoya-Perez, Deborah Kogan, Melissa Mack, Marian Negoita, Anne Paprocki, Sheena McConnell, and Linda Rosenberg. “Providing Public Workforce Services to Job Seekers: Implementation Findings on the WIA Adult and Dislocated Worker Programs.” Washington, DC: Mathematica Policy Research, 2015.
Heinrich, Carolyn J., and Peter Mueser. "Training Program Impacts and the Onset of the Great Recession." Unpublished manuscript, University of Missouri (2014).
Heinrich, Carolyn J., Peter Mueser, and Kenneth Troske. “Workforce Investment Act Non-Experimental Net Impact Evaluation: Final Report.” Washington, DC: IMPAQ International, 2008.
Heinrich, C.J., P.R. Mueser, R.K. Troske, K.S. Jeon, and D.C. Kahvecioglu. “Do Public Employment and Training Programs Work?” IZA Journal of Labor Economics, vol. 2, no. 1, 2013, pp. 1–23.
Hendra, Richard, David Greenberg, Gayle Hamilton, Ari Oppenheim, Alexandra Pennington, Kelsey Schaberg, and Betsy Tessler. “Encouraging Evidence on a Sector-Focused Advancement Strategy: Two-Year Impacts from the WorkAdvance Demonstration.” New York, NY: MDRC, 2016.
141

Hollenbeck, Kevin. “Return on Investment Analysis of a Selected Set of Workforce System Programs in Indiana.” Report submitted to Indiana Chamber of Commerce Foundation, Indianapolis, IN: 2009. Available at http://research.upjohn.org/reports/15. Accessed July 3, 2015.
Hollenbeck, Kevin M., and Wei-Jang Huang. “Workforce Program Performance Indicators for the Commonwealth of Virginia.” Upjohn Institute Technical Report No. 08-024. Kalamazoo, MI: W.E. Upjohn Institute for Employment Research, 2008.
Hollenbeck, Kevin M., and Wei-Jang Huang. “Net Impact and Benefit-Cost Estimates of the Workforce Development System in Washington State.” Upjohn Institute Technical Report No. 13-029. Kalamazoo, MI: W.E. Upjohn Institute for Employment Research, 2014. Available at http://research.upjohn.org/up_technicalreports/29. Accessed July 3, 2015.
Hollenbeck, Kevin, Daniel Schroeder, Christopher T. King, and Wei-Jang Huang. “Net Impact Estimates for Services Provided through the Workforce Investment Act.” Report prepared for the Division of Research and Demonstration, Office of Policy and Research, Employment and Training Administration, U.S. Department of Labor. Kalamazoo, MI: W.E. Upjohn Institute for Employment Research, 2005.
Hotz, V. Joseph, and John Karl Scholz. “Measuring Employment and Income Outcomes for Low Income Populations with Administrative and Survey Data.” In Studies of Welfare Populations: Data Collection and Research Issues. Washington, DC: National Academy Press, 2002.
Houseman, Susan N. “Flexible Staffing Arrangements: A Report on Temporary Help, OnCall, Direct-Hire Temporary, Leased, Contract Company, and Independent Contractors Employment in the United States.” Washington, DC: U.S. Department of Labor, 1999.
Johnson, Nate. “College Costs and Prices: Some Key Facts for Policymakers. Lumina Issue Papers.” Lumina Foundation for Education, 2014. Available at https://www.luminafoundation.org/files/publications/issue_papers/College_Costs_and_Prices.pdf. Accessed December 21, 2016.
Katz, Lawrence F. and Alan B. Krueger. “The Rise and Nature of Alternative Work Arrangements in the United States, 1995-2015.” NBER Working Paper No. 22667. Cambridge, MA: National Bureau of Economic Research, 2016.
Kornfeld, Robert, and Howard S. Bloom. "Measuring Program Impacts on Earnings and Employment: Do Unemployment Insurance Wage Reports from Employers Agree with Surveys of Individuals?" Journal of Labor Economics, vol. 17, no. 1, 1999, pp. 168-197.
Kosanovich, Karen, and Eleni Sherman Theodossiou. “Trends in Long-term Unemployment.” Washington, DC: U.S. Bureau of Labor Statistics, March 2015. Available at http://www.bls.gov/spotlight/2015/long-term-unemployment/pdf/long-term-unemployment.pdf. Accessed July 3, 2015.
142
Lengermann, Paul A. “How Long Do the Benefits of Training Last? Evidence of Long Term Effects Across Current and Previous Employers, Education Levels, Test Scores, and Occupations.” Center for Advanced Human Resource Studies Working Paper. Ithaca, NY: Cornell University, 1996.
Maguire, Sheila, Joshua Freely, Carol Clymer, Maureen Conway, and Deena Schwartz. “Tuning in to Local Labor Markets. Evidence from the Sectoral Employment Impact Study.” Philadelphia, PA: Public/Private Ventures, 2010.
Mangum, Garth L. MDTA: Foundation of federal manpower policy. Baltimore, MD: Johns Hopkins University Press, 1968.
Mastri, Annalisa, Sheena McConnell, Linda Rosenberg, Peter Schochet, Dana Rotz, Andrew Clarkwest, Ken Fortson, AnnaMaria McCutcheon, Katie Bodenlos, Jessica Ziegler, and Paul Burkander. “Evaluating National Ongoing Programs: Implementing the WIA Adult and Dislocated Worker Programs Gold Standard Evaluation.” Washington, DC: Mathematica Policy Research, 2015.
Mastri, Annalisa and AnnaMaria McCutcheon. Costs of Services Provided by the WIA Adult and Dislocated Worker Programs. Issue Brief. Oakland, CA: Mathematica Policy Research and Social Policy Research Associates, 2016.
McConnell, Sheena, Kenneth Fortson, Dana Rotz, Peter Schochet, Paul Burkander, Linda Rosenberg, Annalisa Mastri, and Ronald D’Amico. “Do Job Seekers Benefit from Services Provided by the WIA Adult and Dislocated Worker Programs? Impacts at 15 Months.” Washington, DC: Mathematica Policy Research, 2016.
National Bureau of Economic Research. “U.S. Business Cycle Expansions and Contractions.” Cambridge, MA: NBER, n.d. Available at http://www.nber.org/cycles.html. Accessed May 1, 2015.
Rosenberg, Linda, Mark Strayer, Stephanie Boraas, Brittany English, and Deanna Khemani. “Providing Services to Veterans through the Public Workforce System: Descriptive Findings from the WIA Gold Standard Evaluation: Volume 1.” Washington, DC: Mathematica Policy Research, 2015.
Santillano, Robert, Irma Perez-Johnson, and Quinn Moore. “Experimenting with Counseling Requirements and Voucher Amounts: Evidence from Job-Training through WIA” Working paper. Princeton, NJ: Mathematica Policy Research, 2016.
Schochet, Peter Z., Sheena McConnell and John Burghardt. “National Job Corps Study: Findings using administrative earnings records data.” Princeton, NJ: Mathematica Policy Research, 2003.
Solomon-Fears, Carmen. The National Directory of New Hires. Washington, DC: Congressional Research Service, 2014.
143
U.S. Congress. “Workforce Investment Act of 1998.” Pub. Law No. 105-220. August 7, 1998. Washington, DC: U.S. Government Printing Office, 1998. Available at http://www.gpo.gov/fdsys/pkg/PLAW-105publ220/html/PLAW-105publ220.htm. Accessed May 1, 2015.
U.S. Congress. “Workforce Innovation and Opportunity of 2014.” Pub. Law No. 113-128. July 22, 2014. Washington, DC: U.S. Government Printing Office, 2014. Available at http://www.gpo.gov/fdsys/pkg/PLAW-113publ128/pdf/PLAW-113publ128.pdf. Accessed May 1, 2015.
U.S. Department of Labor. “Final Rule. Workforce Investment Act.” 20 CFR Part 652; Part 660 et al. Washington, DC: U.S. Department of Labor, Employment and Training Administration, 2000. Available at https://www.doleta.gov/regs/statutes/finalrule.htm. Accessed March 3, 2016.
U.S. Department of Labor, Bureau of Labor Statistics. “Databases, Tables, and Calculators by Subject: Labor Force Statistics from the Current Population Survey.” Washington, DC: Bureau of Labor Statistics, n.d.a. Available at http://data.bls.gov/timeseries/LNS14000000. Accessed May 1, 2015.
U.S. Department of Labor, Employment and Training Administration. “Comparison of State Unemployment Insurance Laws.” Washington, DC: Employment and Training Administration, 2014. Available at http://unemploymentinsurance.doleta.gov/unemploy/comparison2014.asp. Accessed November 1, 2016.
U.S. Department of Labor, Employment and Training Administration. “Summary of Budget Authority, FY 1984 to 2013, by Year of Appropriation.” Washington, DC: Employment and Training Administration, n.d.b. Available at http://www.doleta.gov/budget/docs/tepbah.pdf. Accessed May 1, 2015.
U.S. Department of Treasury. Daily Treasury Real Long-Term Rates, Resource Center. Rates were accessed online at https://www.treasury.gov/resource-center/data-chart-center/interest-rates/Pages/TextView.aspx?data=reallongtermrateAll on August 4, 2016.
U.S. Government Accountability Office. “Multiple Employment Training Programs: Major Overhaul Is Needed.” Washington, DC: U.S. Government Accountability Office, 1994.
144

This page has been left blank for double-sided copying.