Embed Size (px)
Citation preview

Providing Geography for Topology;A Schematic View of the National
Watershed Boundary Dataset (WBD)
James E. Mitchell, Ph.D.
IT GIS Manager
Kurt L. JohnsonIT GIS Technical Specialist
2012 ESRI International User’s ConferenceSan Diego, California – July, 2012 (Revised January, 2013)

The Watershed Boundary Database
• A national database defining hydrologic boundaries– Based on the USGS Hydrologic Unit Codes
• Hierarchical organization that aggregates basins into– Regions – “HUC 2”– Subregions – “HUC 4”– Basins – “HUC 6”– Subbasins – “HUC 8”– Watersheds – “HUC 10”– Subwatersheds – “HUC 12”
• An areal depiction of the organization of watersheds and the flow of water across the landscape

Lake Pontchartrain Basinfrom the WBD Database
Lake Pontchartrain Basinfrom the
Watershed Boundary Dataset (WBD)
“Out of the box,” it is easy to see basin delineations. However, flow direction is less evident. As complexity increases and topography decreases relationships are unclear.

Lake Pontchartrain BasinSymbolized by HUC 10 Basins
Lake Pontchartrain Basinshaded by WBD HUC 10
Watersheds
HUC 12 Subwatersheds
HUC 10 Watershed0317000914
0807010001
0807020104
0807020201
0807020202
0807020203
0807020204
0807020205
0807020206
0807020207
0807020208
0807020209
0807020301
0807020302
0807020303
0807020304
0807020401
0807020402
0807020403
0807020404
0807020405
0807020501
0807020502
0807020503
0807020504
0809010001
0809010002
0809010003
0809020101
0809020102
0809020103
0809020200
0809020301
0809020302
0809020303
0809020304
0809020305
0809020306
0809020307
0809020308
0809020309
Open Water
Drainage patterns are more evident, using symbology. However detail is still lacking and relationships in complex areas are not clearly revealed.
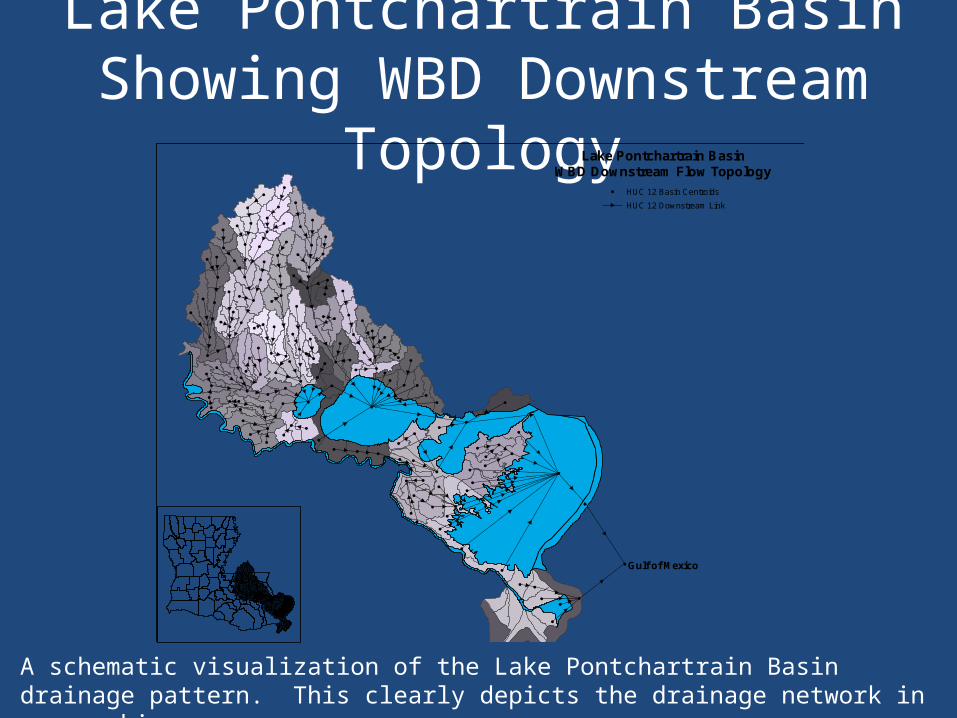
Lake Pontchartrain BasinShowing WBD Downstream Topology
Lake Pontchartrain BasinWBD Downstream Flow Topology
HUC 12 Basin Centroids
HUC 12 Downstream Link
Gulf of Mexico
A schematic visualization of the Lake Pontchartrain Basin drainage pattern. This clearly depicts the drainage network in geographic space.

Creating a Schematic Diagram to Using Schematics to Represent the
Hierarchical Topology of Adjacent WBD Polygons
• Use the downstream HUC 12 attribute (ToHUC) to define the flow relationship between WBD Basins
• Create a centroid point to represent each WBD basin polygon (Feature to Point Tool, in ArcToolBox)– Force the centroid to lie within the polygon
• Create a schematic diagram – Use the basin centroids to define the schematic nodes– Use the ToHUC field to develop the link to the next
downstream node• Examine diagram for topology errors and “loose ends”

Step 1 – Create Basin CentroidsLake Pontchartrain Basin
WBD HUC 12 Basin Centroids
Centroids placed within each HUC 12 basin polygon contain the attribute information form their originating polygon. This is used to create links between up and down stream.
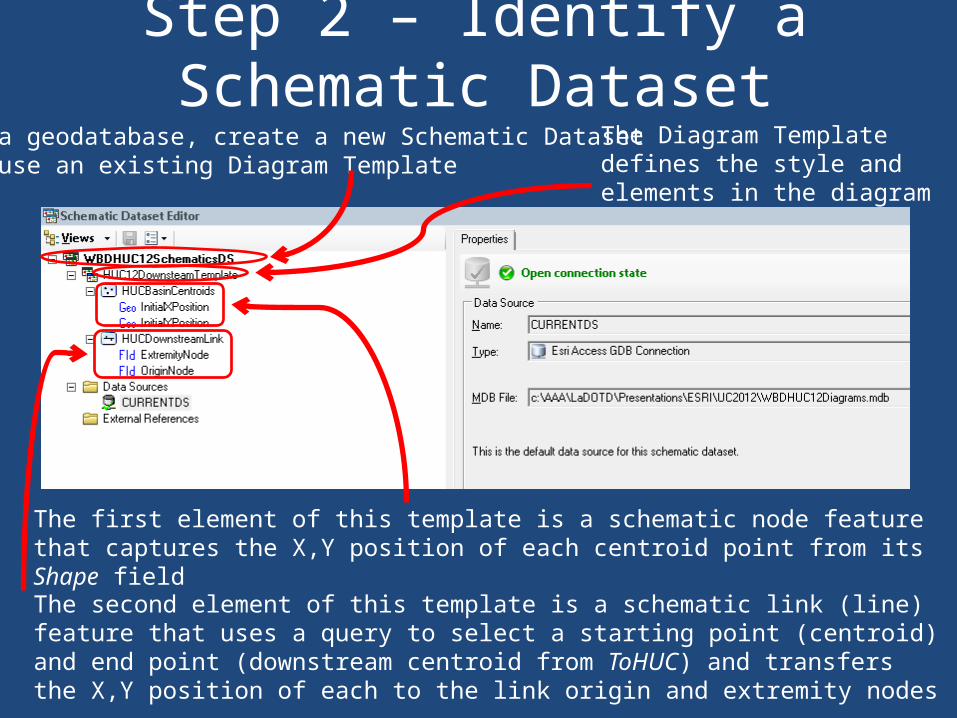
Step 2 – Identify a Schematic DatasetIn a geodatabase, create a new Schematic Datasetor use an existing Diagram Template
The Diagram Template defines the style and elements in the diagram
The first element of this template is a schematic node feature that captures the X,Y position of each centroid point from its Shape field
The second element of this template is a schematic link (line) feature that uses a query to select a starting point (centroid) and end point (downstream centroid from ToHUC) and transfers the X,Y position of each to the link origin and extremity nodes

Step 3 – Schematic Node Featureclass Created from Basin Centroids
The new features will be a “Node” type schematic feature
The geometry of the schematic features will be “Point” type
Properties of the schematic nodes
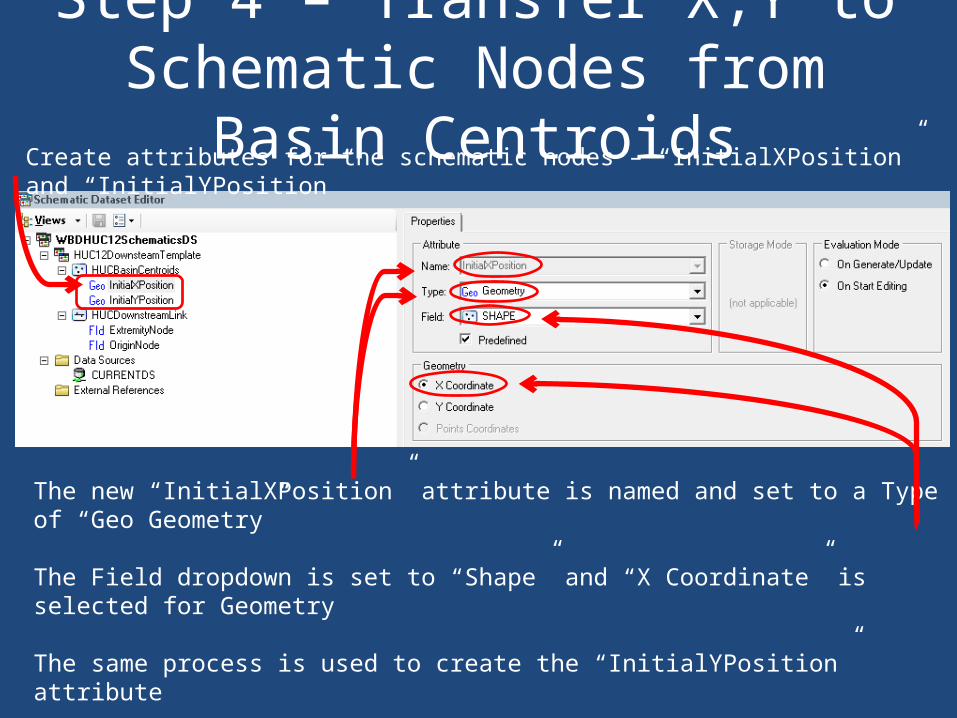
Step 4 – Transfer X,Y to Schematic Nodes from Basin Centroids
The new “InitialXPosition” attribute is named and set to a Type of “Geo Geometry”
The Field dropdown is set to “Shape” and “X Coordinate” is selected for Geometry
The same process is used to create the “InitialYPosition” attribute
Create attributes for the schematic nodes – “InitialXPosition” and “InitialYPosition”
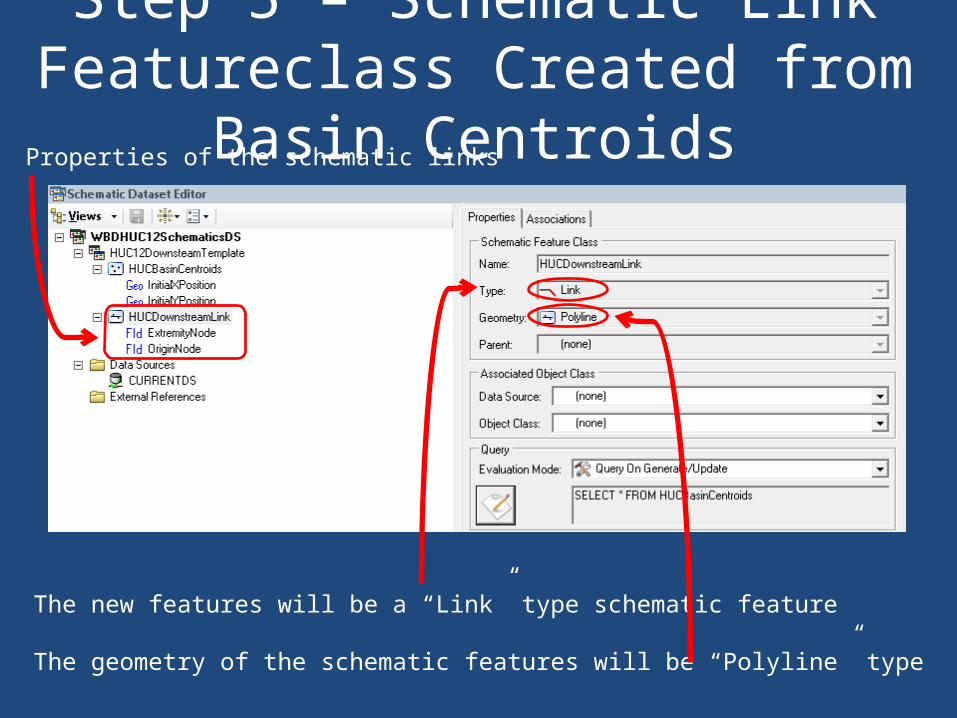
Step 5 – Schematic Link Featureclass Created from Basin Centroids
The new features will be a “Link” type schematic feature
The geometry of the schematic features will be “Polyline” type
Properties of the schematic links

Step 6 – Create Schematic Links by Defining Origin and Extremity Nodes
The new “OriginNode” attribute is named and set to a Type of “Field”
The Field is used to define a query to erect the centroid node at the beginning of the link (HUC12)
The same process is used to create the “ExtremityNode” attribute, specifying the ToHUC field, to select the node (centroid) at the end of the link
Create attributes for the schematic links – “OriginNode” and “ExtremityNode”

Lake Pontchartrain BasinInitial Schematic Diagram
Lake Pontchartrain BasinInitial Flow Schematic
Based onWBD HUC 12 Downstream Attribute
Detail of Initial DiagramFull Extent of Initial Diagram
Terminal nodes have no downstream element with which to link. This can be used as a means to examine, diagnose, and correct topological errors and anomalies.

Lake Pontchartrain BasinExamining and Correcting Topology
Lake Pontchartrain BasinCorrecting WBD HUC 12 Topology
PROBLEM This centroid is froma polygon outside ofthe Pontchartrain Basinand drains directly into the the Mississippi Riv er
SOLUTION Delete the centroidfrom the input datasetand regenerate thediagram
OR
Edit the diagram anddelete this link
PROBLEM : These are terminal nodesand have no downsteamnode with whigh to createa connection link
PROBLEM These are terminal nodesand have no downsteamnode with whigh to createa connection link
SOLUTION Delete the links and createa new point in the centroidsdata representing a locationfor the Gulf of Mexico
PROBLEM This is the centroid forLake Borgne and hasa downstream HUC 12designted as "OCEAN"
The correct downstreamHUC 12 is actually"Chandeleur Sound"
SOLUTION Edit the centroids attributetable to reflect:
HU_12_DS = "080902030900"
Then regenerate the diagram
Four topology errors become immediately apparent. One is a basin outside of Lake Pontchartrain. The others relate to missing or incorrect downstream links.

Lake Pontchartrain BasinAfter Correcting Topology
Lake Pontchartrain BasinDiagram After Topology Corrections
HUC 12 Basin Centroids
HUC 12 Downstream Link
Path from terminal node (Gulfof Mexico) to an arbitrary point(0,0) at end of diagram
Point added to centroids torepresent the topological position of the Gulf of Mexico
Corrected flow path from Lake Borgne toChandaleur Sound
Created by editing the HU_12_DS field inthe WBD
This ling has been edited to route it aroundHUC 12 basins that lie between the LakeBorgne node and the Chandaleur Sound node
After correcting the topology errors, the new diagram is complete and only requires the removal of the arbitrary terminal node.

What Can Be Done with this Schematic Diagram?
• WBD QA/QC
• Identify flow relationships– Upstream/downstream (including multiple pourpoints– Flow accumulation– Diversions and interbasin transfers
• Visualize the flow network in different formats (styles)
• Trace flow paths– Connect pollution sources to water quality impacts

Flow Topology ApplicationsConnecting Upstream and Downstream
Applications from the Lake Pontchartrain Basin Flow Topology Diagram
Jones Creek
Clay Cut Bayou
King George Bayou
Bayou Barbary
Lake Maurepas
North Pass-Manchac Pass
Lake Pontchartrain
What drainage systems connectJones Creek to Lake Pontchartrain?
Which basins are downstreamfrom downtown Baton Rouge?
What drainage systems connectto Lake Pontchartrain?
Which watersheds are locatedupstream from Lake Maurepas?
HU_12_NAME
Skulls Creek-Tangipahoa River
Ponchitalaw a Creek-Tchefuncta River
Bayou Chinchuba
Liberty Bayou-Bayou Bonfouca
Big Branch Bayou-Lacombe Bayou
Bayou Castine-Cane Bayou
North Pass-Manchac Pass
Bayou Vincent-Bayou Bonfouca
Illinois Central Gulf
Lake Pontchartrain
Salt Bayou
Schematic diagrams can be “traced” and selections propagated into the data frame

Lake Pontchartrain BasinGeographic and Schematic Diagrams
Lake Pontchartrain BasinGeographic and Schematic Diagrams
Maps and diagrams are linked allowing selections to be propagated between them. The schematic depiction of these basins provides a clear view of their topology

Lake Pontchartrain BasinHierarchical Smart Tree Diagram
Lake Pontchartrain BasinPure Schematic Diagram
Lake Maurepas
Lake Pontchartrain
Lake Borgne
The diagram provides a simplified depiction of the topology of the Lake Pontchartrain Basin. Up and downstream traces can be executed and transferred to the map.

Lake Pontchartrain BasinHierarchical Diagram/Orthogonal Corners
Lake Pontchartrain BasinPure Schematic Diagram wih Orthogonal Connections
Lake Maurepas
Lake Pontchartrain
Lake Borgne
Diagrams can be edited and reformatted using varies options. Using this capability, diagrams can be designed to satisfy essential operational and functional requirements.

Interbasin TransferThe Bonnet Carré Spillway
The Bonnet Carré Spillway is opened to relieve pressure on New Orleans’ levees from the Mississippi River and moves water into the Lake Pontchartrain Basin.
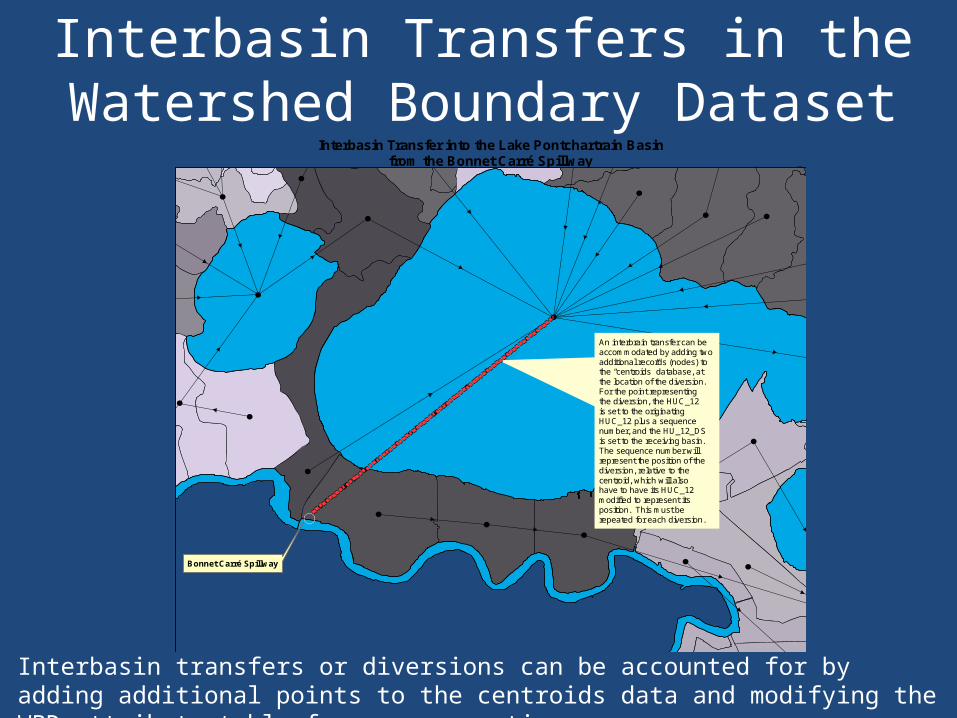
Interbasin Transfers in theWatershed Boundary Dataset
Interbasin Transfer into the Lake Pontchartrain Basinfrom the Bonnet Carré Spillway
Bonnet Carré Spillway
An interbrain transfer can be accommodated by adding two additional records (nodes) to the “centroids” database, at the location of the diversion. For the point representing the diversion, the HUC_12 is set to the originating HUC_12 plus a sequence number, and the HU_12_DS is set to the receiving basin. The sequence number will represent the position of the diversion, relative to the centroid, which will also have to have its HUC_12 modified to represent its position. This must be repeated for each diversion.
Interbasin transfers or diversions can be accounted for by adding additional points to the centroids data and modifying the WBD attribute table for proper routing.

Conclusions• Schematics provide a powerful tool for visualizing
topological relationships– “Geographic” space– “Logical” space
• Schematics can be used to investigate, reconcile, and ensure topological integrity (QA/QC)
• Schematics can be used to extend the capabilities of geospatial data, such as the Watershed Boundary Dataset by:
– Creating a logical network representing the flow through geographic elements– Augmenting simple topology with complex networks
– Extending the capabilities of the data with tools that can navigate through the network

![Wimm-Bill-Dann Foods OJSC [NYSE: WBD] · PDF fileWimm-Bill-Dann Foods OJSC [NYSE: WBD] ... are based on many factors and assumptions. ... 33 production sites in Russia and the Commonwealth](https://img.pdfslide.us/doc/110x75/5a94bc447f8b9adb5c8c1e85/wimm-bill-dann-foods-ojsc-nyse-wbd-foods-ojsc-nyse-wbd-are-based-on-many.jpg)