Embed Size (px)
Citation preview
0,0%
2,0%
4,0%
6,0%
8,0%
10,0%
12,0%
14-May 21-May 28-May 4-Jun 11-Jun 18-Jun 25-Jun 2-Jul 9-Jul 16-Jul 23-Jul 30-Jul 6-Aug
Pe
rce
nta
ge o
f p
olli
nat
ors
am
on
g co
llect
ed
sp
eci
me
ns
Dates
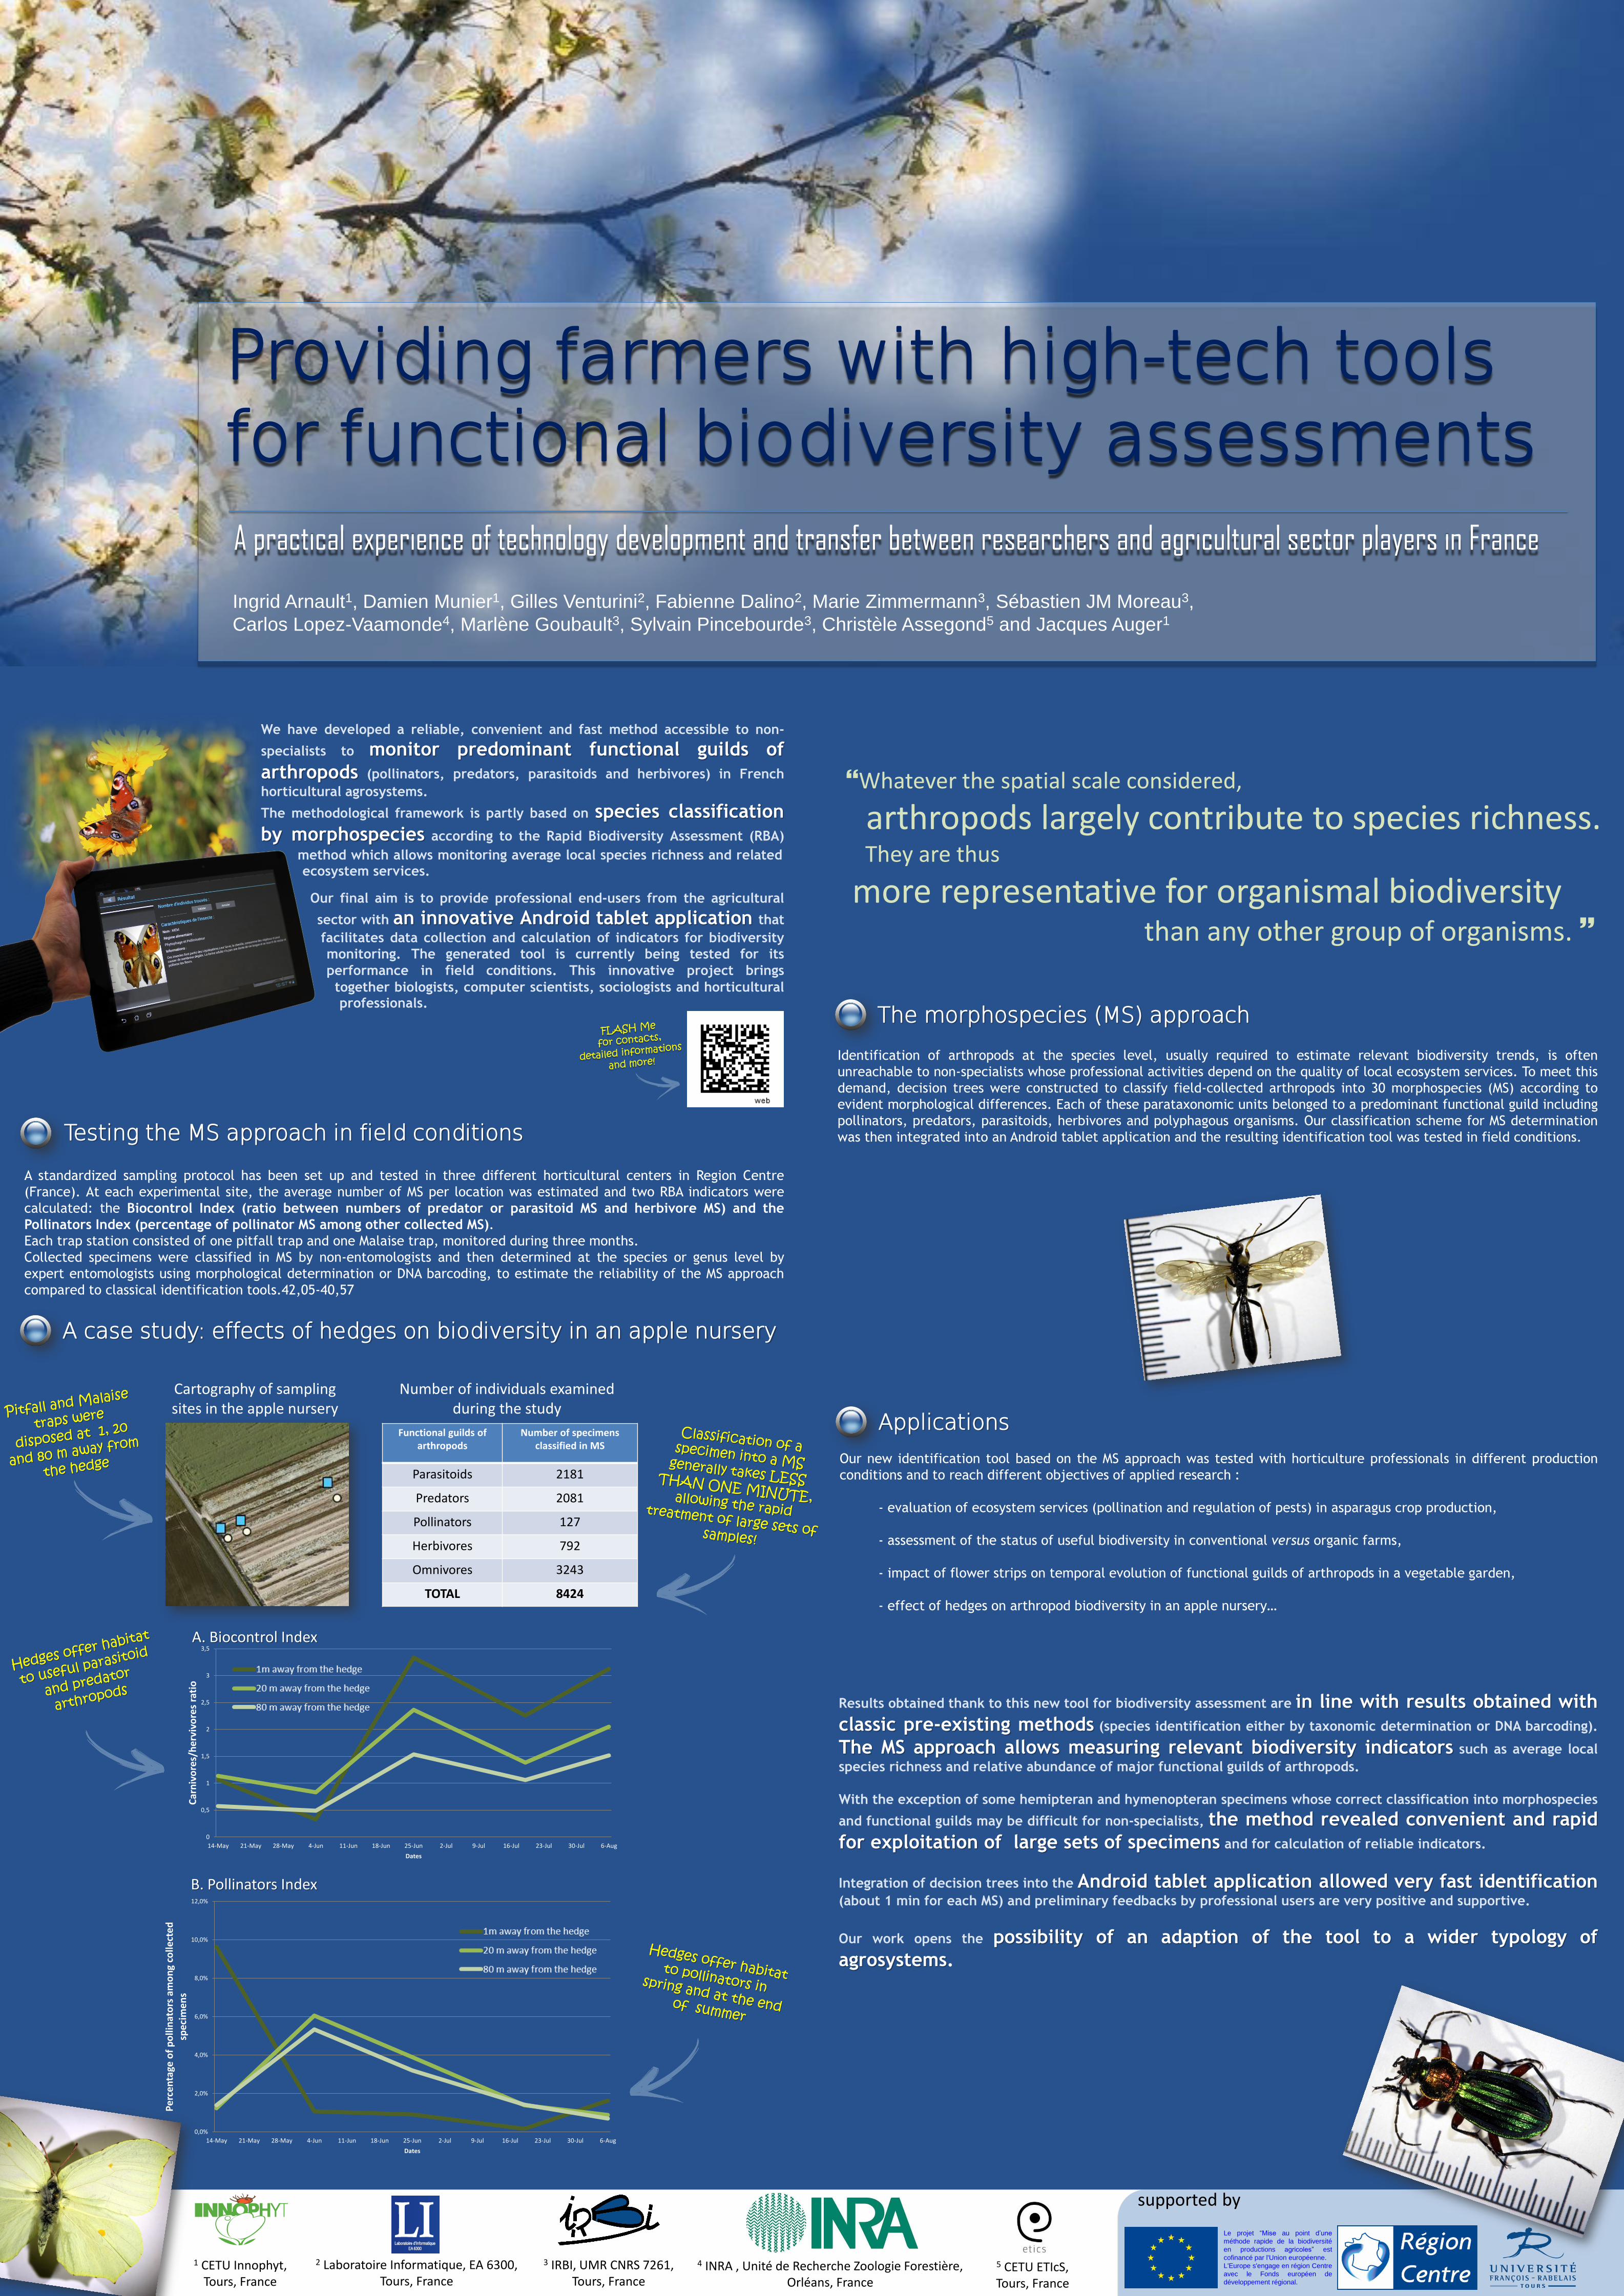
Providing farmers with high-tech tools for functional biodiversity assessments
A practical experience of technology development and transfer between researchers and agricultural sector players in France
Ingrid Arnault1, Damien Munier1, Gilles Venturini2, Fabienne Dalino2, Marie Zimmermann3, Sébastien JM Moreau3,
Carlos Lopez-Vaamonde4, Marlène Goubault3, Sylvain Pincebourde3, Christèle Assegond5 and Jacques Auger1
1 CETU Innophyt, Tours, France
2 Laboratoire Informatique, EA 6300, Tours, France
3 IRBI, UMR CNRS 7261, Tours, France
4 INRA , Unité de Recherche Zoologie Forestière, Orléans, France
5 CETU ETIcS, Tours, France
Results obtained thank to this new tool for biodiversity assessment are in line with results obtained with
classic pre-existing methods (species identification either by taxonomic determination or DNA barcoding).
The MS approach allows measuring relevant biodiversity indicators such as average local
species richness and relative abundance of major functional guilds of arthropods.
With the exception of some hemipteran and hymenopteran specimens whose correct classification into morphospecies
and functional guilds may be difficult for non-specialists, the method revealed convenient and rapid
for exploitation of large sets of specimens and for calculation of reliable indicators.
Integration of decision trees into the Android tablet application allowed very fast identification (about 1 min for each MS) and preliminary feedbacks by professional users are very positive and supportive.
Our work opens the possibility of an adaption of the tool to a wider typology of
agrosystems.
We have developed a reliable, convenient and fast method accessible to non-
specialists to monitor predominant functional guilds of
arthropods (pollinators, predators, parasitoids and herbivores) in French
horticultural agrosystems.
The methodological framework is partly based on species classification
by morphospecies according to the Rapid Biodiversity Assessment (RBA)
.
Our final aim is to provide professional end-users from the agricultural
. sector with an innovative Android tablet application that . facilitates data collection and calculation of indicators for biodiversity
. monitoring. The generated tool is currently being tested for its . performance in field conditions. This innovative project brings . together biologists, computer scientists, sociologists and horticultural
professionals.
method which allows monitoring average local species richness and related . ecosystem services.
Whatever the spatial scale considered,
arthropods largely contribute to species richness. They are thus
more representative for organismal biodiversity than any other group of organisms.
A case study: effects of hedges on biodiversity in an apple nursery
Functional guilds of arthropods
Number of specimens classified in MS
Parasitoids 2181
Predators 2081
Pollinators 127
Herbivores 792
Omnivores 3243
TOTAL 8424
Number of individuals examined during the study
A. Biocontrol Index
B. Pollinators Index
Cartography of sampling sites in the apple nursery
Identification of arthropods at the species level, usually required to estimate relevant biodiversity trends, is often
unreachable to non-specialists whose professional activities depend on the quality of local ecosystem services. To meet this
demand, decision trees were constructed to classify field-collected arthropods into 30 morphospecies (MS) according to
evident morphological differences. Each of these parataxonomic units belonged to a predominant functional guild including
pollinators, predators, parasitoids, herbivores and polyphagous organisms. Our classification scheme for MS determination
was then integrated into an Android tablet application and the resulting identification tool was tested in field conditions.
The morphospecies (MS) approach
A standardized sampling protocol has been set up and tested in three different horticultural centers in Region Centre
(France). At each experimental site, the average number of MS per location was estimated and two RBA indicators were
calculated: the Biocontrol Index (ratio between numbers of predator or parasitoid MS and herbivore MS) and the
Pollinators Index (percentage of pollinator MS among other collected MS).
Each trap station consisted of one pitfall trap and one Malaise trap, monitored during three months.
Collected specimens were classified in MS by non-entomologists and then determined at the species or genus level by
expert entomologists using morphological determination or DNA barcoding, to estimate the reliability of the MS approach
compared to classical identification tools.42,05-40,57
Testing the MS approach in field conditions
Our new identification tool based on the MS approach was tested with horticulture professionals in different production
conditions and to reach different objectives of applied research :
- evaluation of ecosystem services (pollination and regulation of pests) in asparagus crop production,
- assessment of the status of useful biodiversity in conventional versus organic farms,
- impact of flower strips on temporal evolution of functional guilds of arthropods in a vegetable garden,
- effect of hedges on arthropod biodiversity in an apple nursery…
Applications
supported by
0
0,5
1
1,5
2
2,5
3
3,5
14-May 21-May 28-May 4-Jun 11-Jun 18-Jun 25-Jun 2-Jul 9-Jul 16-Jul 23-Jul 30-Jul 6-Aug
Car
niv
ore
s/h
erv
ivo
res
rati
o
Dates
Le projet “Mise au point d’une
méthode rapide de la biodiversité
en productions agricoles” est
cofinancé par l'Union européenne.
L'Europe s'engage en région Centre
avec le Fonds européen de
développement régional.