Embed Size (px)
Citation preview
Provider Scheduling at the Worcester
VA Community Based Outpatient Clinic
A Major Qualifying Report
Submitted to the faculty of
WORCESTER POLYTECHNIC INSTITUTE
In partial fulfillment of the requirements for
The Degree of Bachelor of Science by
Sarah Albrecht
Catherine Danko
Rachel Wallace
March 4, 2011
Advisors:
Renata Konrad, Ph.D.
Isa Bar-On, Ph.D.
Sponsored by the Department of Veterans Affairs, Worcester VA CBOC

i
Abstract The implementation of a Patient-Centered Medical Home (PCMH) concept, known as the Patient
Aligned Care Team (PACT) model at the Worcester Community Based Outpatient Clinic
(CBOC), revealed provider scheduling and utilization challenges. A linear programming based
planning tool described in this report identifies optimal provider schedules The planning tool,
named ProSkedge, is able to be modified to fit the varying operating constraints the CBOC faces.
Also included is a simulation model to validate the linear program and to perform scenario
analysis. Additional recommendations for improved facility operations are provided based on
observation and a review of the literature.
ii
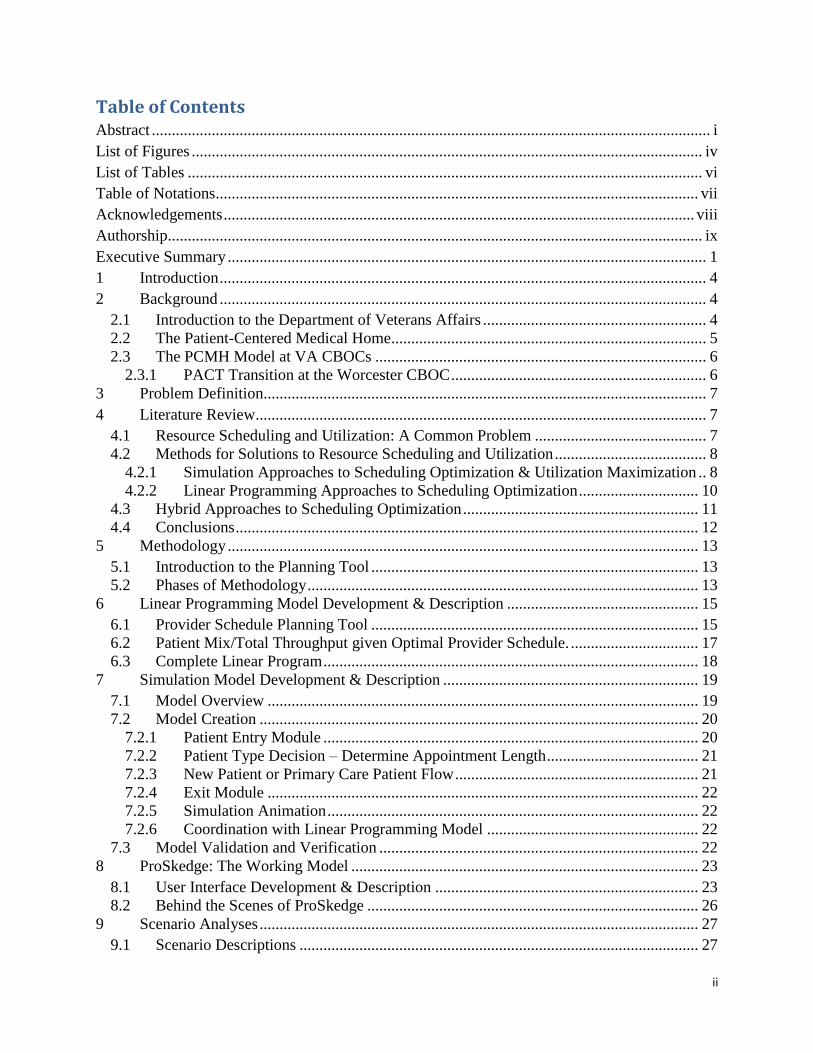
Table of Contents Abstract ............................................................................................................................................ i
List of Figures ................................................................................................................................ iv
List of Tables ................................................................................................................................. vi
Table of Notations......................................................................................................................... vii
Acknowledgements ...................................................................................................................... viii
Authorship...................................................................................................................................... ix
Executive Summary ........................................................................................................................ 1
1 Introduction .......................................................................................................................... 4
2 Background .......................................................................................................................... 4
2.1 Introduction to the Department of Veterans Affairs ........................................................ 4
2.2 The Patient-Centered Medical Home............................................................................... 5
2.3 The PCMH Model at VA CBOCs ................................................................................... 6
2.3.1 PACT Transition at the Worcester CBOC ................................................................ 6
3 Problem Definition............................................................................................................... 7
4 Literature Review................................................................................................................. 7
4.1 Resource Scheduling and Utilization: A Common Problem ........................................... 7
4.2 Methods for Solutions to Resource Scheduling and Utilization ...................................... 8
4.2.1 Simulation Approaches to Scheduling Optimization & Utilization Maximization .. 8
4.2.2 Linear Programming Approaches to Scheduling Optimization .............................. 10
4.3 Hybrid Approaches to Scheduling Optimization ........................................................... 11
4.4 Conclusions .................................................................................................................... 12
5 Methodology ...................................................................................................................... 13
5.1 Introduction to the Planning Tool .................................................................................. 13
5.2 Phases of Methodology .................................................................................................. 13
6 Linear Programming Model Development & Description ................................................ 15
6.1 Provider Schedule Planning Tool .................................................................................. 15
6.2 Patient Mix/Total Throughput given Optimal Provider Schedule. ................................ 17
6.3 Complete Linear Program .............................................................................................. 18
7 Simulation Model Development & Description ................................................................ 19
7.1 Model Overview ............................................................................................................ 19
7.2 Model Creation .............................................................................................................. 20
7.2.1 Patient Entry Module .............................................................................................. 20
7.2.2 Patient Type Decision – Determine Appointment Length ...................................... 21
7.2.3 New Patient or Primary Care Patient Flow ............................................................. 21
7.2.4 Exit Module ............................................................................................................ 22
7.2.5 Simulation Animation ............................................................................................. 22
7.2.6 Coordination with Linear Programming Model ..................................................... 22
7.3 Model Validation and Verification ................................................................................ 22
8 ProSkedge: The Working Model ....................................................................................... 23
8.1 User Interface Development & Description .................................................................. 23
8.2 Behind the Scenes of ProSkedge ................................................................................... 26
9 Scenario Analyses .............................................................................................................. 27
9.1 Scenario Descriptions .................................................................................................... 27

iii
9.2 Simulation Scenario Analysis Results ........................................................................... 31
9.2.1 Utilization ............................................................................................................... 31
9.2.2 Total Throughput .................................................................................................... 32
9.3 Statistical Significance of Results .................................................................................. 34
10 Additional Recommendations ............................................................................................ 38
10.1 Room Sharing: The Human Factors Perspective ........................................................... 38
10.2 Synchronization ............................................................................................................. 39
10.3 Templates & Check Lists ............................................................................................... 41
11 Industrial Engineering Design Capstone Requirement ...................................................... 42
12 Conclusions & Future Recommendations ......................................................................... 43
13 Future Model Improvements.............................................................................................. 44
Glossary ........................................................................................................................................ 46
Works Cited .................................................................................................................................. 47
A Methods Matrix .................................................................................................................. 50
B Methods Matrix with VA Project Requirements ................................................................ 52
C Gantt Chart - Schedule for Methodology ........................................................................... 53
D Simulation Model Screenshots ........................................................................................... 54
E Scenario Analysis Results .................................................................................................. 67
F User Interface Screenshots ............................................................................................... 132
G How to Use ProSkedge ..................................................................................................... 138

iv
List of Figures Figure 5-1. Schematic of Planning Tool, ProSkedge .................................................................... 13
Figure 5-3. Methodology Flow Chart ........................................................................................... 14
Figure 7-1. Simulation Model Flow Chart .................................................................................... 20
Figure 8-1. ProSkedge Welcome Screen ...................................................................................... 23
Figure 8-2. ProSkedge Main Input Menu ..................................................................................... 24
Figure 9-1. Scenario Analysis Process.......................................................................................... 28
Figure 9-2. Simulation Throughput Results.................................................................................. 32
Figure 9-3. Throughput Comparison Results................................................................................ 35
Figure 10-1. Minutes Behind Graph (Mark Murray & Associates, 2011).................................... 40
Figure D-1. Simulation Module .................................................................................................... 54
Figure D-2. Create Module for Patients to Enter .......................................................................... 54
Figure D-3. Decide Module to Determine Patient Type ............................................................... 55
Figure D-4. Phone Consult Patient Assignment ........................................................................... 55
Figure D-5. New Patient Assignment ........................................................................................... 55
Figure D-6. Established Patient Assignment ................................................................................ 56
Figure D-7. Pick Up for Phone Consult Station ........................................................................... 56
Figure D-8. Pick Up for New Patient Station ............................................................................... 57
Figure D-9. Pick Up for Established Patient ................................................................................. 57
Figure D-10. Route for Phone Consult Patient ............................................................................. 58
Figure D-11. Route for New Patient ............................................................................................. 58
Figure D-12. Route for Established Patient .................................................................................. 58
Figure D-13. Location of Phone Consult ...................................................................................... 59
Figure D-14. Location of Exam Room for New Patient ............................................................... 59
Figure D-15. Location of Exam Room for Established Patient .................................................... 60
Figure D-16. Process Module for Phone Consult ......................................................................... 60
Figure D-17. Process Module for New Patient Visit .................................................................... 61
Figure D-18. Process Module for Established Patient Visit ......................................................... 62
Figure D-19. Route from Location of Phone Consult to Exit ....................................................... 62
Figure D-20. Route Location of New Visit to Exit ....................................................................... 63
Figure D-21. Route from Location of Established Visit to Exit ................................................... 63
Figure D-22. Exit Station .............................................................................................................. 63
Figure D-23. Exit Module ............................................................................................................. 64
Figure D-24. CBOC Facility Layout Created in Visio ................................................................. 64
Figure D-25. Overall Simulation Model Screenshot .................................................................... 65
Figure D- 26. Primary Care Provider Schedule ............................................................................ 66
Figure F-1. Provider Preferences Input Page .............................................................................. 132
Figure F-2. Time Away Input Page ............................................................................................ 133
Figure F-3. Specialist Schedules Input Page............................................................................... 134
Figure F-4. Room Requirements Input Page .............................................................................. 134

v
Figure F-5. Number of Rooms Input Page.................................................................................. 135
Figure F-6. Nurse Use of Rooms ................................................................................................ 135
Figure F-7. Output, Model 1 All Weeks ..................................................................................... 136
Figure F-8. Output, Model 1 All Weeks ..................................................................................... 137
Figure F-9. Output, Model 2 ....................................................................................................... 137

vi
List of Tables Table 8-1. Model 1 Solver Settings .............................................................................................. 27
Table 9-1. Baseline Model Settings .............................................................................................. 30
Table 9-2. Scenario Analysis Descriptions ................................................................................... 31
Table 9-3. Scenario Analysis Results ........................................................................................... 34
Table 9-4. Hypothesis Test Results for Total Number of New Patient Visits .............................. 37
Table 9-5. Hypothesis Test Results for Total Number of Established Patient Visits ................... 37
Table 9-6. Hypothesis Test Results for Total Number of Phone Consults ................................... 37
vii
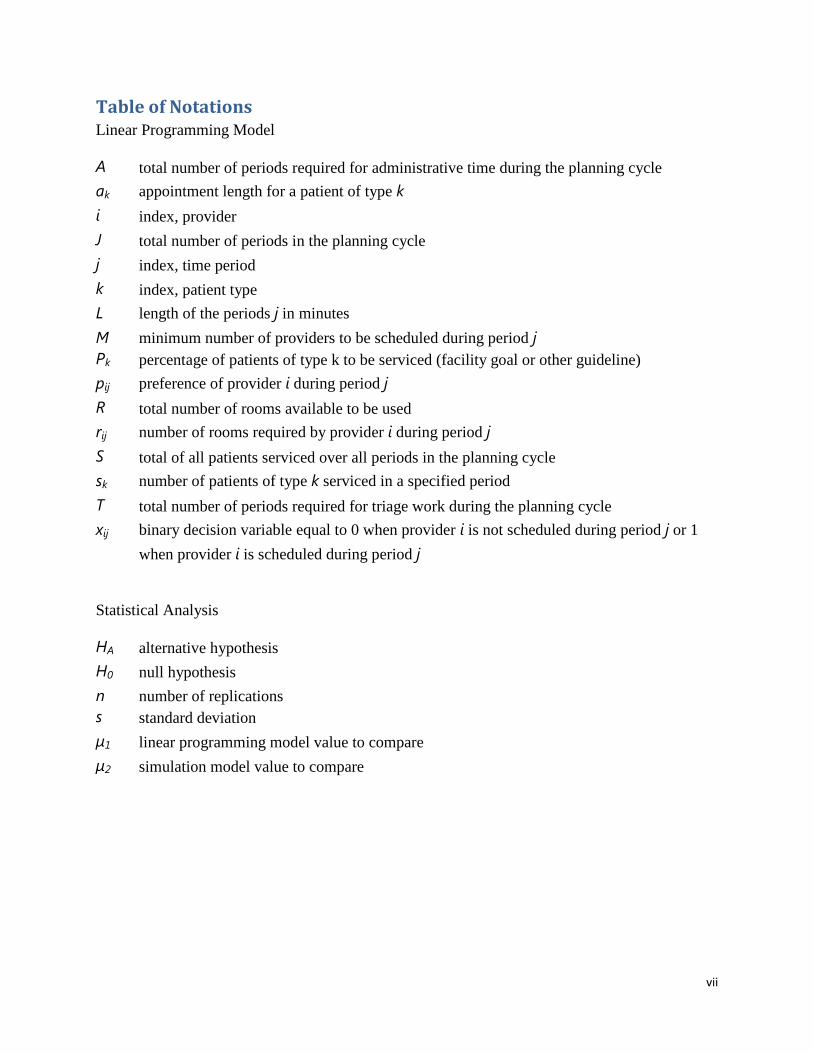
Table of Notations Linear Programming Model
A total number of periods required for administrative time during the planning cycle
ak appointment length for a patient of type k
i index, provider
J total number of periods in the planning cycle
j index, time period
k index, patient type
L length of the periods j in minutes
M minimum number of providers to be scheduled during period j
Pk percentage of patients of type k to be serviced (facility goal or other guideline)
pij preference of provider i during period j
R total number of rooms available to be used
rij number of rooms required by provider i during period j
S total of all patients serviced over all periods in the planning cycle
sk number of patients of type k serviced in a specified period
T total number of periods required for triage work during the planning cycle
xij binary decision variable equal to 0 when provider i is not scheduled during period j or 1
when provider i is scheduled during period j
Statistical Analysis
HA alternative hypothesis
H0 null hypothesis
n number of replications
s standard deviation
µ1 linear programming model value to compare
µ2 simulation model value to compare

viii
Acknowledgements A sincere thank you is given to CBOC liaison, Cliona Archambeault, for her help coordinating
on-site meetings and collecting data as the team requested it.
The authors also thank the entire staff at the Worcester CBOC for allowing us to observe CBOC
operations and ask questions pertaining to this research. In particular, the authors acknowledge
Steve Cohen, Donna Scavone, and Dr. Susan Krantz, for their direct interactions with the team
and assistance with model validation. The team also recognizes Dr. Michael Christakis and Dr.
Marc Goldstein for their input and direction as well as Elizabeth Verdolino, Leanne Mastalerz,
and Traci O’Brien.
Finally, the authors would like to recognize the project advisors, Professors Renata Konrad and
Isa Bar-On, for their continued support over the duration of the project.

ix
Authorship All authors of this report have contributed equally to ensure the success of the project; all aspects
of the project and the written work from the background research to the model development and
the generation of conclusions and recommendations were joint efforts. We therefore accept
equal responsibility for the project and the content found within this report.

1
Executive Summary The United States Department of Veterans Affairs (VA) is a government-run, military benefit
system. The Veterans Health Administration (VHA) consists of numerous hospitals, veteran
centers, regional offices, national cemeteries, and Community Based Outpatient Centers
(CBOCs). A CBOC is medical facility that enables patient access by providing care closer to
where veterans reside separate from the parent VHA hospital in the area.
Patient-centered medical home (PCMH) is a managed care model developed to foster patient-
provider relationships in an effort to improve health care delivery. Because of the national 2009-
2010 health care reform debates, there is some urgency to determine the feasibility of the PCMH
model (Nutting, 2009). Furthermore, the complexities and risks associated with the transition to
such a managed care model must be thoroughly investigated and mitigated.
The VHA requires all CBOCs to implement a Patient Aligned Care Team (PACT) model, the
VA’s version of the PCMH model, by October 2011. The transition is expected to allow CBOCs
to better meet the needs of the growing veteran population, as well as changes in veteran needs.
The Worcester CBOC in particular faces many challenges as it works to meet this deadline.
The challenges faced by the CBOC during its transition to a PACT model include: (1) providers
are unable to coordinate group visits and/or telephone calls to patients because of schedule
uncertainties (e.g. varying vacation time) and lack of time to facilitate the visits; (2) visiting
specialists’ schedules can disrupt schedules of on-site providers; (3) providers are using personal
time to complete required visit documentation for established patients; and (4) approximately
100 new patients per month are being added into the Worcester CBOC alone, and this number is
expected to grow as more veterans return from Iraq and Afghanistan.
This report addresses how the Worcester CBOC can improve scheduling practices of providers
in order to enable the transition to a PACT care model while still allowing for optimal patient
throughput. Given the constraints that limit the CBOC’s flexibility in scheduling providers, a
planning tool called ProSkedge is built to aid the clinic in provider scheduling.
To achieve a usable planning tool, six steps are taken. First, the problem and specific user needs
are identified. This also allows for a better understanding of patient flow logic and clinic

2
operations. Data collection is performed to identify the model inputs, facility constraints, and
patient flow logic. The next three steps involve model creation. Development begins with a
linear programming model built in Microsoft Excel 2007 to maximize scheduling preferences of
providers. A simulation model using Arena software is created to verify the linear program,
measure resource utilization, and perform scenario analysis. The following step is validation and
verification of both models. Lastly, a user interface built within Excel provides the end-user with
the ability to both modify and run ProSkedge, and allows for implementation at the CBOC.
Ultimately, the model and user interface create an easily accessible and interpretable system to
aid clinics in implementing a patient-centered care model and making future decisions on care
management.
Linear programming is a mathematical optimization technique that can provide robust solutions
to complex problems and is the foundation of ProSkedge. The model, comprised of two linear
programs, is built into a Microsoft Excel 2007 spreadsheet and solved using the Excel Solver
add-in. The first linear program generates a feasible provider schedule by maximizing individual
provider scheduling preferences, subject to numerous constraints which include room
availability, administrative and triage period requirements, and minimum numbers of providers
in clinical duty. The second model calculates patient throughput given the recommended
schedule output by the first linear program. This model is constrained by available provider time
(calculated using the first model’s schedule output) and the patient mix percentages required by
the PACT initiative.
A simulation model mimics system behavior in accelerated time so that experiments can be
conducted to provide a better understanding of system behavior under a given set of conditions.
A simulation model developed in Arena is used in this project to verify the linear programming
models and to perform scenario analysis. The schedule generated by the first linear programming
model is input to the simulation via Arena’s “schedule” tool.
Scenario analyses are performed using the simulation model to better understand the impact of
extended operating hours, additional examination rooms, additional providers, and patient mix
on potential patient throughput. Each scenario is first run in ProSkedge, and then though 100
replications in the Arena simulation model. Patient throughput values from ProSkedge and Arena
are compared statistically with hypothesis tests to observe the differences between the model and

3
the actual clinic. Resource utilization is captured by the simulation to understand how well the
schedule generated by ProSkedge allows for best provider utilization.
The scenario analyses resulted in four major findings when compared to a base model. First, the
greatest throughput increase occurs when the number of providers was increased by two (a 22%
increase). Second, with the addition of one exam room, a 12% throughput increase was observed,
but a room increase to two did not improve throughput further. Thus, there is a benefit in patient
throughput with the transition of one room to an exam room, but adding additional rooms does
not impact throughput. Third, increasing the operating hours each day by one hour increased
throughput by 12%. Similarly, a fully-staffed Saturday clinic resulted in a 20% increase in
patient throughput. Last, an increase in the percentage of new patients significantly negatively
impacted patient throughput, resulting in a 10% overall decrease due to the longer appointment
times required.
In addition to the project’s main objective of developing a provider scheduling tool, additional
factors may improve other operational issues faced by the CBOC. Through observations and
discussions with CBOC staff, one opportunity for improvement is to decrease the need for
physical room readjustment. This can be done by limiting the number of rooms to which a
provider may be assigned and also standardizing the layouts of exam rooms. Also, patient flow
may be improved after time studies are performed and appointment preparation time is better
understood. This will aid in scheduling patients more efficiently and improving the flow of
patients over the course of the day. Lastly, checklists and templates would aid the providers in
ensuring that all steps are completed, reducing the time necessary to write up encounter notes,
and making notes written by other providers more easily transferable.
ProSkedge provides the Worcester CBOC with a tool to identify potential provider schedules
conducive to maximum throughput and also the ability to benchmark potential throughput with
actual patient throughput. Adjustments to ProSkedge inputs can be easily made as the CBOC
grows and new operating constraints surface. The conclusions and recommendations
summarized here are detailed in the full report.
4
1 Introduction In an effort to incorporate the Patient-Aligned Care Team (PACT) model, the Worcester
Community-Based Outpatient Clinic (CBOC) is experiencing resource scheduling and utilization
challenges. These challenges are a result of uncertainties in specialist schedules and patient
demand as well as physical space availability. This project provides a planning tool to the CBOC
staff to improve resource scheduling by integrating a linear programming (LP) approach with a
discrete-event simulation model. The ultimate goal of this report is to apply successful
techniques to the resource scheduling and utilization problems experienced by the Worcester
CBOC in such a way that they will prove useful in practice.
This report first contextualizes the specific problems being faced by the Worcester CBOC. A
literature review follows providing findings on resource scheduling and utilization problems
facing healthcare. The review then compares the benefits and functions of existing solution
methods including simulation, linear programming, and combination models. A methodology
section outlines the steps of data collection, modeling building, and model verification and
validation leading up to implementation. Following this section, a description of each model and
the scenario analyses using these models is provided. Additional suggestions based on team
observations of the CBOC are outlined prior to conclusions and future recommendations.
2 Background An understanding of the Department of Veterans Affairs and the Patient-Centered Medical Home
model is necessary to provide a backdrop for discussion of the specific situation at the Worcester
CBOC requiring the resource utilization and scheduling tool. Organized into three sections, this
section will introduce the reader to the Department of Veterans Affairs (2.1), the Patient-
Centered Medical Home concept (2.2), the implementation of this concept at Community Based
Outpatient Centers (2.3). A subsection of 2.3 describes the specific situation in the Worcester,
Massachusetts facility (2.3.1).
2.1 Introduction to the Department of Veterans Affairs The United States Department of Veterans Affairs (VA), a comprehensive veteran assistance
program, is a government-run, military benefit system. A 2010 study of the VA performed by the
National Center for Veterans Analysis and Statistics confirmed that the organization consists of

5
153 hospitals, 260 veteran centers, 57 regional offices, 131 national cemeteries, and 773
Community Based Outpatient Centers (CBOCs). A CBOC is medical facility that enables patient
access by providing care closer to where veterans reside separate from the parent VA hospital in
the area. The department employs slightly over 300,000 workers nationwide. Additionally, there
are over eight million enrollees in the VA health care system out of 23 million current projected
U.S. veterans, of which 8% are female. (“VA Benefits & Health Care Utilization”, 2010)
2.2 The Patient-Centered Medical Home Patient-centered medical home (PCMH), a concept first introduced in 1967 by the American
Academy of Pediatrics (AAP), is a model of managed care which fosters patient-provider
partnerships to improve care delivery. The implementation of such a model should
fundamentally focus on access to continuous, comprehensive care by a dedicated personal
physician. (American Academy of Family Physicians, 2007) It has been implemented in some
capacity in almost every state of the United States, and because of the 2009-2010 health care
reform debates, there is some urgency to determine the feasibility of the PCMH model (Nutting,
2009). The concept was studied in 2006 in the National Demographic Project, launched by the
American Academy of Family Physicians. Six lessons concluded from the study are as follows:
(1) change requires a transformation of the organization instead of small changes within it; (2)
patient-centered medical homes are distinct yet interdependent and require new scheduling and
access arrangements; (3) the information technology required to make the transition is quite
complicated; (4) the transition requires all doctors and staff to be willing and able to alter current
work methods into a more team-based atmosphere; (5) organizations must have a stable structure
to maintain operations, but also an ability to be adaptive to thrive upon change; and (6) the
change is a local process (Nutting, 2009).
These conclusions led to guidelines and suggestions for success with the PCMH transition. The
guidelines include ensuring adequate financial sources for the changes, implementing PCMH in
such a way that suits the organization, and providing assistance to each physician to improve
their methods of delivering primary care. To achieve success, clinics are encouraged to set
realistic goals and timelines for implementation and create a change plan that is responsive and
flexible to allow for the transformation to take place in the unique practice atmosphere. (Nutting,
2009)
6
The transition to PCMH has been rather rushed in an effort to quickly improve health care
delivery. There are several cultural and organizational challenges associated with such a
transition. Some physician interviews suggested that smaller organizations have more difficulty
than larger organizations in assuring that patients receive the systematic assessments, education,
and group support that the PCMH concept encourages. Another potential barrier is the
development and maintenance of new operational processes and information systems to improve
access and communication, patient care coordination, and data to provide for future evidence-
based decisions. (Berenson et al., 2008)
2.3 The PCMH Model at VA CBOCs The VA is in the process of implementing a PCMH environment within its CBOCs, denoting the
model as a Patient Aligned Care Team (PACT) model, by October 2011. As a result of this
transition, the expectation is that clinics will be better able to meet the needs of a growing
veteran population and changes in veteran needs.
2.3.1 PACT Transition at the Worcester CBOC
The Worcester CBOC is made up of eight primary care providers, including two nurse
practitioners and six physicians. In addition to these providers, there is also other support staff on
site and various specialists that visit the clinic on a scheduled basis to provide additional care
services to patients. The CBOC, with the support of this staff, began discussions about the
concept and started progressing toward the achievement of PACT goals in early 2010.
The facility faces a number of challenges as it transitions to a PACT. Some of these include: (1)
providers are unable to coordinate group visits and/or telephone calls to patients because of
uncertainties such as others’ vacation time in their schedule as well as finding provider time to
facilitate the visits; (2) visiting specialists’ schedules can disrupt work and administrative
schedules of on-site providers; (3) providers are using personal time to complete required visit
documentation for established patients; and (4) approximately 100 new patients per month are
being added into the Worcester CBOC alone, and this number is expected to grow as more
veterans return from Iraq and Afghanistan. These intricacies have somewhat stagnated the
transition process at the Worcester CBOC.

7
3 Problem Definition The Worcester CBOC seeks to improve scheduling practices of care providers to enable the
transition to a managed care model and allow for enhanced patient access. Patient access is
challenged by physical space constraints, growing patient demand and predictable yet variable
specialists’ schedules. A planning tool, named ProSkedge in this report, is built to aid in provider
scheduling. An Arena-based simulation model incorporates ProSkedge’s results to determine
utilization of resources considering the various complexities at an outpatient clinic and the
transition to a PACT environment. Following this literature review, the planning tool is
discussed in detail.
4 Literature Review There is much pressure for health care providers at all facilities to provide high-quality and
efficient care because of the high cost associated with medical care. Cayirli and Veral (2003)
explained that outpatient services are becoming more essential as medicine practices require
shorter lengths of stay and preventative medicine begins to play a larger role in society. Thus,
researchers are searching for new techniques to improve scheduling and efficiency in outpatient
clinics. This literature review is organized as follows: in Section 4.1 we broadly examine the
problem of resource scheduling and utilization, identifying the applications of solutions at
different facilities under different conditions; Section 4.2, organized in subsections, is a
discussion of the techniques used to develop the aforementioned solutions, specifically
simulation only (4.2.1) and linear programming/optimization only (4.2.2) solutions (see
Appendices A and B for a justification of the reasons simulation and optimization techniques are
reviewed here). These reviews are then followed by hybrid approaches (4.3). Finally, Section 4.4
presents our conclusions based on the review.
4.1 Resource Scheduling and Utilization: A Common Problem Resource scheduling and utilization is not a unique problem to the Worcester CBOC. One of the
earliest research studies on this topic examined staffing policy changes and their effect on current
bottlenecks in an outpatient family planning clinic (Alessandra et al. 1978). The clinic operated
in such a way that patients had to move through four major work stations and two main waiting
areas to where employees were located. Patient flow and staff management was improved

8
through decisions justified by scenario analyses. This study was one of the first to showcase the
use of sophisticated analytical techniques in health care delivery planning.
Kumar and Kapur (1989) addressed similar scheduling problems within the setting of
Georgetown University Hospital’s emergency room (ER) with an emphasis on scheduling
nursing staff. This particular ER “[was] a complex probabilistic system treating both trauma
(15%) and non-trauma patients (85%) twenty four hours a day” (Kumar & Kapur, 1989).
Because workload and system behavior within such an ER is very dynamic in nature, nursing
staff scheduling became very difficult and attaining optimal resource utilization was nearly
impossible without the correctly applied solution and numerous scheduling alternatives
examined. As a result of various types of experiments performed on the scheduling of the
nursing staff, a feasible cost effective schedule was produced and implemented
Wijewickrama and Takakuwa (2005) addressed the problem in an outpatient department of
internal medicine. This facility was experiencing long treatment waiting times and rushed
consultations with the providers. The outpatient department operates from 8:30am to 5:30pm on
weekdays and treats four patient types including appointed patients, walk-ins, exam patients, and
new patients. Appointed patients made up the largest percentage of these. One issue that added to
the complexity of the resource scheduling and utilization problem at this particular facility was
identifying the effects of no-shows, consultation time variance, and walk-ins. The study outcome
was efficient appointment schedules which reduced patient waiting time and kept provider idle
times as low as possible without additional resources.
4.2 Methods for Solutions to Resource Scheduling and Utilization
4.2.1 Simulation Approaches to Scheduling Optimization & Utilization Maximization
Simulation models mimic system behavior in accelerated time. It is the process of designing and
creating a model of a real or proposed system for the purpose of conducting numerical
experiments to provide a better understanding of the behavior of that system for a given set of
conditions. (Law & Kelton, 1999; Kelton, Sadowski, & Sturrock, 2007) In terms of this project,
discrete-event simulation, a simulation in which a system’s state or a variable within the system
changes at discrete points in time, is examined. For further information on simulation or discrete-
event simulation in particular, the authors refer the reader to Law and Kelton’s Simulation
Modeling and Analysis (1999), Ross’s Simulation (2006), Pooch and Wall’s Discrete Event

9
Simulation: A Practical Approach (1993), and Fishman’s Discrete-Event Simulation: Modeling,
Programming, and Analysis (2001). For additional reviews of discrete-event simulation
approaches to health care problems, the authors refer the reader to Jacobson, Hall, and Swisher’s
article “Discrete-Event Simulation of Health Care Systems” (2006).
Simulation is well suited for modeling complex systems and is commonly used to approach
utilization problems. This is particularly true in the health care industry because of its ability to
model interactions between care provider and patient and to allow for in-depth scenario analysis.
Côté (1999) studied a family practice clinic providing various outpatient services. Patient load
oftentimes extended beyond the operating hours of the clinic. Côté developed a discrete-event
simulation model written in SIMAN IV to determine the steady state condition of the clinic’s
operations. The author concluded that taking advantage of known patient flow paths and
estimating service distributions allowed a discrete-event simulation model for even a small
outpatient clinic to provide valuable analysis. For this reason, simulation is an appropriate
quantitative tool to offer sound insight into decisions related to operations.
Guo, Wagner, and West (2004) similarly explored the benefits of simulation but in terms of
determining triage prioritization rules to better utilize providers at a children’s hospital. A staff
of only six physicians, despite growth in patient demand, successfully decreased appointment
backlog with a new scheduling system. In order to better understand the operational variables
that affect patient flow and waiting times as they relate to resource schedule utilization, a model
was created. It incorporated external appointment demand, available provider time, patient flow
paths, and scheduling algorithms. The added intricacy of nine appointment types and provider
preferences of individual patients was evidence that provider availability was highly variable
with weekly appointment slot availability. To optimize the scheduling algorithm currently based
on the level of urgency of an appointment, a simulation model using Arena software was
developed. A Visual Basic module accessed and modified a Microsoft Access database housing
provider schedules. This research corroborates Côté’s conclusion that simulation models are well
suited to represent complexities and interactions and can be used as a support tool to make
evidence-based decisions.
More recently, Santibanez, Chow, and French (2009) provided a framework to address
significant challenges regarding space constraints and resources within a cancer care outpatient

10
ambulatory care unit (ACU). Overcrowding and appointment delays had caused the ACU to
experience office and examination room shortages. Patient volume was also expected to increase.
The authors examined the simultaneous impact of patient and resource scheduling changes on
the operational system by constructing a realistic discrete-event simulation model with Arena
simulation software. The model incorporated various distributions for processes within the
system, a first-in, first-out (FIFO) queuing rule, and sudden changes in operating hours to ensure
all scheduled patients for a day would be seen. Operational, appointment scheduling, and
resource allocation factors investigated during scenario analysis led to the conclusion that the
discrete-event simulation model provided valuable insight into which of these factors would lead
to more favorable operational states.
4.2.2 Linear Programming Approaches to Scheduling Optimization
Mathematical optimization techniques used to model hospital scheduling policies can be seen in
many studies. Compared to simulation models, these techniques provide robust mathematical
solutions. Lau and Lau (1999) built an outpatient and medical operating room optimization
model using linear programming methods off of previous research that had been done using
stochastic appointment length. Their model defines total cost given a known schedule. With the
objective to minimize total system cost per time unit, the investigators had to consider the
following parameters: the number of scheduled appointments, visit length, and arrival rate.
Arrival and service distributions were estimated using a four-parameter Beta distribution. This
knowledge was used to output an optimal schedule based on arrival sequence resulting in a
model that defines appointment schedules to minimize total system cost.
Robinson and Chen (2002) also make use of linear programming to solve resource scheduling
and utilization problems. A model was created to aid in optimal scheduling of doctor time with
the underlying complexity of random service time. By dividing the working day into equal
sections and assigning patients to the beginning of each block, service time rates could be
assumed to be identically distributed and therefore able to obtain a more realistic model for
scheduling. A heuristic, created to compare different numeric instances, allowed for defining
“job allowances” based on optimizing patient time given the realistic assumption that service
times were not uniform. For this reason, the authors believe the approach of using linear
programming could be used in different facets of hospital planning.

11
Methods of sole reliance on mathematical optimization techniques can be further examined in
the work of Denton, Viapiano, and Vogl (2006). Stochastic optimization was used to determine
scheduling and optimization of time and resources in the operating room because of its ability to
incorporate visit length uncertainty. Upon the definition of a sequencing rule of given surgery
duration variance that can be used in optimizing staff wait times and overtime costs, a two-stage
stochastic recourse model was created so that the modelers could input a known surgery
sequence to output schedule times. The model optimized scheduling based on waiting time, idle
time, and tardiness. The best resultant schedule came from sequencing surgeries within surgeon
blocks in order of increasing duration variance.
The complexity of considering various critical factors, such as appointment length, the number
of beds, and nursing staff availability, is investigated and solved through a mixed integer linear
programming model by Adan, Bekkers, Dellaert, Vissers, and Yu (2009). The case study
indicates that master appointment schedules could be generated while also more closely
matching target utilization levels set for the numerous resources by considering length of stay
either stochastic or random. A master schedule satisfying specified performance criteria is the
goal of the study. Based at a tactical level, the researchers are most interested in number of
scheduled appointments per day; therefore, patient waiting times and appointment lengths
beyond the scheduled block are able to be ignored because the schedule will not be an
operational one. Mathematically, the model minimized over- and under-utilization of resources
while determining the optimal number of patients of different types to be serviced in a set period.
4.3 Hybrid Approaches to Scheduling Optimization Some researchers integrate the results of linear programming solutions with simulation to
substantiate results and to investigate the effect of varying scenarios on the linear programming
output. Centeno et al. (2003) developed a hybrid model by coupling simulation with an integer
linear programming model to decrease hospital costs by optimizing staff utilization in an
emergency department. A hybrid model was used because the authors found that strictly
mathematical approaches to modeling lacked the holistic output of values for use in real-world
problems while simulation approaches did not always handle the true complexity of the system
effectively. The integer linear programming model, developed in LINGO, generated the
optimized staff schedule that was input into the simulation model, created in Arena, which

12
defined staff requirements per period. The modelers integrated the two models in a Visual Basic
interface because it allowed for a simple, yet powerful tool to dictate an optimal schedule and
staff level based on set visit lengths given demand and service times.
Patrick and Puterman (2006) conducted a comparable study on optimizing resources and
minimizing wait time in a hospital CT scanning department given uncertain demand and priority
levels. However, unlike the models presented previously, Patrick and Puterman first created a
linear programming model to optimize resource overtime and then used Arena simulation to
validate the model and perform scenario analysis to study the impact of increased capacity and
service time length change on the system.
A recent hybrid approach to optimization in hospitals was used by Takakuwa and Wijewickrama
(2008) to decrease waiting time in hospital outpatient centers while at the same time optimize
staff time to eliminate the need for additional resources. Like Centeno et al. (2003), Takakuwa
and Wijewickrama believed simulation would best be able to handle complex hospital
interactions than a mathematical model alone. Simulation models offer the ability to compare
objective functions against different scenarios, which enabled Takakuwa and Wijewickrama to
analyze such relationships as average patient waiting time to different staffing levels.
4.4 Conclusions This review leads to two important conclusions. First, resource scheduling and utilization
problem at the Worcester CBOC is not unique. The review revealed that various types of
facilities, specifically and outpatient clinics, face uncertain scheduling challenges due to the
implementation of more patient-centered models of care. Second, linear programming and
simulation are both sound techniques used to analyze scheduling practices in an outpatient health
care environment (see Appendices A and B). However, hybrid models have proven to be more
applicable to the problem addressed in this report as they are able to handle more complexity
than either individual solution. Hybrid models are also able to allow for more accurate and in-
depth scenario analyses as they incorporate the benefits of each individual solution.

13
5 Methodology
5.1 Introduction to the Planning Tool
The planning tool will be developed following the framework outlined in Figure 5-1 and will be
called ProSkedge, an abbreviation of Provider Schedule. The Arena simulation model (see
Section 7) will represent operational reality at the Worcester CBOC. The linear program (see
Section 6) will be verified to generate optimal or feasible solutions based on CBOC constraints
and will become the foundation of the tool. Note that the simulation model, while an important
part of testing the output of the linear program, is not a part of the planning tool itself. A user
interface (see Section 8) is built using Visual Basic macros to create functionality and to allow
user modifications to linear program settings. These pieces create the planning tool, ProSkedge,
which is the ultimate deliverable of this project and is developed by the methods described
below.
Figure 5-1. Schematic of Planning Tool, ProSkedge
5.2 Phases of Methodology The method of developing and implementing ProSkedge to be used for scheduling and resource
optimization at the Worcester CBOC includes six phases as depicted in Figure 5-2. The ultimate
goal is to implement a fully working resource planning tool based on a combination model
integrated with Microsoft Excel and accessed through a user-friendly interface for Worcester
CBOC staff use in Winter 2011.
Linear Program
• Modifiable constraints • Validate by Simulation
Interface
• Visual Basic • Microsoft Excel
Planning Tool
• ProSkedge

14
Figure 5-2. Methodology Flow Chart
The initial phase is data collection, which serves two purposes. The first is to define user needs
and model parameters; the second is to provide the modelers with a significant understanding of
patient flow logic and clinic operations. Physician and specialist schedules will be gathered with
the assistance of CBOC staff to aid in the modelers’ understanding of staff availability per
period. Basic data, such as the number of providers, nurses, and exam rooms, will be collected
through discussions and interviews with the CBOC staff.
Steps two through four of the project will involve the physical model creation. The first will be a
linear programming model to maximize the scheduling preferences of providers. Known
constraints include working hours per period, specialist schedules, and number of exam rooms.
This model will output a feasible schedule for providers based on known constraints. A
simulation model will be designed simultaneously to further analyze the impact of the optimal
provider schedule generated by the linear programming model. This simulation model will also
be used for scenario analyses such as varying operating hours, adding Saturday clinics, and
increasing the number of providers. A user interface will be created during the final step of
model development for ease of use by CBOC staff.
The linear program and simulation model will be validated. This entails collaboration with the
CBOC staff, particularly those who will be using the tool. If the presented model does not meet
the requirements and expectations originally set by the CBOC staff, modifications will be made
and validation meetings will continue until discrepancies are corrected. As validation occurs,
verification will also take place to ensure the model is accurately representing the true
Definition of Users’ Needs & Data Collection
Linear Programming Modeling: Mathematical Approach
Simulation Modeling: Visual Approach
User Interface Development
Model Validation & Verification
Final Model Implementation

15
operational characteristics at the Worcester CBOC. Verification will take place using statistical
hypotheses testing to compare the linear program and simulation model results. Section 9.3
details these tests. Again, if any problems are found within the model, alterations will be made to
correct them until the model satisfactorily represents operational reality. Once the verification
and validation process have ended, ProSkedge will be implemented for use at the Worcester
CBOC.
A Gantt chart (see Appendix C) serves as a reference for the implementation of this
methodology.
6 Linear Programming Model Development & Description
6.1 Provider Schedule Planning Tool A linear programming model is constructed as the basis of ProSkedge, the planning tool to be
used by the Worcester CBOC. The model is built into a Microsoft Excel spreadsheet and solved
using the Excel Solver add-in. The linear program is the foundation of the planning tool because,
not only are the results fed into the simulation model for verification and analysis purposes, it is
also the final tool that will be used at the CBOC to schedule providers in such a way that
adherence to the guidelines of the PACT model will be possible.
The objective of the linear programming model is to determine which providers to schedule for
clinical time given various constraints. A binary decision variable represents whether a specific
physician is scheduled in a particular time slot. Representing the provider is the index i.
Providers are scheduled into morning and afternoon blocks. The CBOC operates in this way,
scheduling appointments into morning and afternoon shifts for the five work days of the week.
This creates ten scheduling blocks or periods per week. Time is represented in the mathematical
model by the index j. In this model, j is equal to an odd integer to represent the morning shifts
(i.e. Monday morning = 1, Tuesday morning = 3, etc.) and j is equal to an even integer to
represent the afternoons (i.e. Monday afternoon = 2, Tuesday afternoon = 4, etc.).
{

16
Maximizing provider preference is the most relevant objective for this model due to the nature of
the problem. The benefit of including a preference score into the linear programming model is
two-fold: first, specialist availability can be considered directly in the objective function; and
second, the preference score allows providers to select when he/she would prefer to be working
in triage or completing administrative work. The provider preference matrix for this linear
programming model includes values of 0, 1, or 2 for each time block where 0 = provider strongly
prefers to not be scheduled, 1 = provider has no preference, and 2 = provider strong prefers to be
scheduled. These values can be altered by the decision-maker. Where pij is the preference of
provider i to be scheduled during period j, the objective function can be expressed as shown in
Equation 1.
∑∑
Constraints are then identified through communication and collaboration with CBOC staff. A
common, although not exclusive, feeling throughout the CBOC is that a major constraint in
provider scheduling is room management. With a finite number of rooms, only a specific number
of providers can be scheduled for clinical time during the same period which is then complicated
by the fact that some providers and specialists require more than one room. Simply put, the
number of rooms utilized in any given period must be less than total rooms fit for use (R). The
number of rooms required by provider i during period j is represented by rij. See Equation 2.
∑
An additional constraint is managerial in nature – providers are required to be “off,” or not
scheduled for clinical duty, for a number of periods per week specified by the clinic so that
providers are given time for administrative work. The number of periods off from clinical duty
for administrative time varies between clinics. At the Worcester CBOC, providers are also
expected to work one period in triage every other week.
At this point, it is necessary to note that the linear program will be run in one week intervals
which are ten blocks long. The planning horizon requested by the CBOC is one month.
Therefore, the program runs four consecutive times and the administrative and triage time

17
constraint is modified based on which replication the model is running. Assume J is the number
of periods in the week, A is the number of periods off required for administrative time, and T is
the number of periods off required for triage every other week. This constraint is expressed in
Equation 3.
∑ {
The final constraint, shown in Equation 4, ensures the model does not generate a feasible
schedule in which there are periods where no providers are assigned to clinical duty (where Σxij
= 0). Assume M is the minimum number of providers that should be scheduled during each
period j. Because of the precision and convergence settings in Excel Solver, some decision
variables are represented by values such as 0.9999995 or 0.99999975. These values are rounded
up to 1 for the purposes of this constraint.
∑
The above model generates a master provider schedule that satisfies the constraints of the
available number of rooms for appointments and of required work outside of regular clinical
duty.
6.2 Patient Mix/Total Throughput given Optimal Provider Schedule. Delivering quality care to a large amount of people is one objective of the PACT managed care
program. For this reason, a second model is developed to determine, based on the PACT
recommended patient mix, the number of patients that could be expected to leave the system
given the optimal provider schedule generated in the first model. The objective function is set to
a value of 1 (see Equation 5) as it is unimportant to our goal to maximize or minimize any
specific variable.
Three patient types are examined in this model: new patients, established/return patients, and
phone visit patients. Each type requires a different scheduled length of appointment. PACT also
strongly recommends certain goals regarding the percentage of each patient type that should be
18
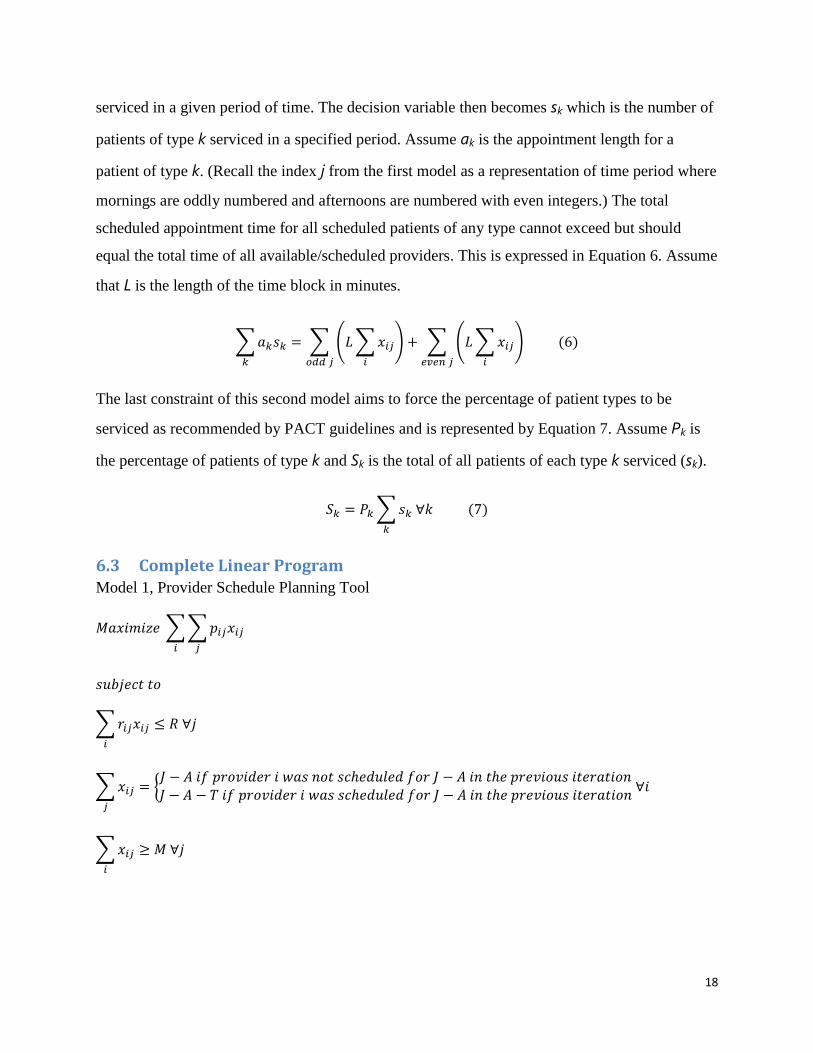
serviced in a given period of time. The decision variable then becomes sk which is the number of
patients of type k serviced in a specified period. Assume ak is the appointment length for a
patient of type k. (Recall the index j from the first model as a representation of time period where
mornings are oddly numbered and afternoons are numbered with even integers.) The total
scheduled appointment time for all scheduled patients of any type cannot exceed but should
equal the total time of all available/scheduled providers. This is expressed in Equation 6. Assume
that L is the length of the time block in minutes.
∑ ∑ ( ∑
)
∑ ( ∑
)
The last constraint of this second model aims to force the percentage of patient types to be
serviced as recommended by PACT guidelines and is represented by Equation 7. Assume Pk is
the percentage of patients of type k and Sk is the total of all patients of each type k serviced (sk).
∑
6.3 Complete Linear Program Model 1, Provider Schedule Planning Tool
∑∑
∑
∑ {
∑
19
Model 2, Patient Mix/Total Throughput
∑ ∑ ( ∑
)
∑ ( ∑
)
∑
7 Simulation Model Development & Description
7.1 Model Overview A model of the Worcester CBOC patient and provider interaction flow was created using Arena
Software by Rockwell Automation Technologies, Inc. (Version 12.00.00 – CPR 9, 2007). This
model serves two major purposes: linear programming model verification and scenario analysis.
Screenshots of the individual process modules described in this section can be found in
Appendix D. The overall model can be seen in the following screenshot.

20
Figure 7-1. Simulation Model Flow Chart
7.2 Model Creation The Arena model captures patient flow for each major type of provider visit – phone consult
patients, new patients, and established patients – to match the variables in the linear
programming model. It was created using “create,” “process,” “decide,” “record,” “dispose,”
“station,” and “route” modules. The following describes the major flow in the model and
describes how process modules support the model at hand. The overall flow of the model can be
seen in Figure 7-1.
7.2.1 Patient Entry Module
Patients enter the model using “create” modules for each visit type. Given that the ultimate goal
of the linear programming model is to maximize patient throughput based on a recommended
provider schedule, patient arrivals do not need to follow a specific arrivals distribution. A
distribution based on historical data will limit the number of patients flowing through the model,
and may “starve” providers. For this reason, each patient type is based on a constant time
between arrival distributions of one minute between arrivals, with an infinite maximum arrival,
starting at time 0. A screenshot of the process window for patient entry is provided in Appendix
D Figure 2.
21
7.2.2 Patient Type Decision – Determine Appointment Length
Next, patients enter a “decide” module to separate incoming patients (entities) into the three
patient types considered in the linear programming model by the visit percentages set as a
constraint in the linear programming model. This is performed by N-way chance separation,
separating five percent of patients to be phone patients, 35 percent to be new patients, and the
remainder to be established patients. These percentages were set to match the percentages set in
the linear programming model to meet PACT standards. The decision window for “Determine
Patient Type” is shown in Appendix D Figure 3.
7.2.3 New Patient or Primary Care Patient Flow
Patients are next assigned to their patient type (phone, new, established) through an “assign”
module. This module changes the entity type to the patient type as well as the image associated
with the entity. Figures 4, 5, and 6 in Appendix D represent the assignment of patient type to
each patient entity.
Next, patients enter a “station” module to place them in the simulation model. Each patient type
has a distinct station with which to begin. See Appendix D Figures 7, 8, and 9.
Patients then enter a “route” module to move them in the simulation to a new station to “meet”
the provider. The route transfers the patient from the designated “pick up” station to the
examination room in this step. Note the route time is set for two minutes to reflect the time it
takes on average to move within the facility; this also allows for patient visibility along route
tracks in the simulation. Appendix D Figures 10, 11, and 12 show the windows for the three
different routes and Figures 13, 14, and 15 represent the second set of stations.
At this point, patients considered a phone consult patient continue to a “process” module that
“seize, delay, and releases” a provider for a constant time of 5 minutes. New patients move on to
a process module that “seize, delay, and releases” a provider for a constant time of 60 minutes,
representing the 60 minute block for a new patient appointment. Established patients move on to
a similar process module that “seize, delay, and releases” a provider for a constant time of 30
minutes, representing the half hour appointment for established patients. Process module
screenshots can be found in Appendix D Figures 16, 17, and 18 for phone consult, new, and
established patients respectively.

22
After being consulted by the provider through the process modules, patients then follow another
route module to take them to the exit of the CBOC. The windows for the three different routes
and then station for the exit can be found in Appendix D Figures 19, 20, 21, and 22.
7.2.4 Exit Module
All patients leave the model through a “dispose” module. The dispose window for “Patient Exit”
can be seen in Appendix D Figure 23.
7.2.5 Simulation Animation
To reflect the outcome of the process flowchart in a simulation, an image of the facility layout is
created in Microsoft Office Visio 2007 based off of the exam room map provided by the
Worcester CBOC and can be seen in Appendix D Figure 24.
The drawing was placed in the Arena simulation window to allow for the addition of stations and
queues. Stations were added from the process flow modules and connected by routes. When
simulated, patients flow through the facility layout as they would in real operations. Appendix D
Figure 25 displays the simulation above the process flow modules.
7.2.6 Coordination with Linear Programming Model
The output of the linear programming model will be to determine whether or not a provider will
be scheduled for given blocks of time. This will be input to the simulation model via the
“schedule” tool. Each type of provider has a unique schedule, demonstrating availability per
given day of the week. Appendix D Figure 26 provides a screenshot of the process window for
“Primary Care Physician Schedule”.
7.3 Model Validation and Verification The team will maintain constant communication with the CBOC staff to ensure the linear
programming model meets the reality of the clinic. This will be accomplished by validating
model inputs and constraints with CBOC staff to ensure the correct values and components are
added to the model. Validation will also include comparing throughput results of the model to
current CBOC practices. After the model is validated, it will be verified through use of the
simulation model. This will be performed by running a set of scenarios through both models to
compare throughput results. Hypothesis testing will be performed to determine if any
differences in results between the models are statistically significant. If they are not statistically
significantly different, it can be said that the results reflect reality similarly, thus validating the

23
model. Any discrepancies that may arise in the model will lead to linear programming model
revisions until the model is proven to be in working condition..
8 ProSkedge: The Working Model ProSkedge is a linear program able to be modified by a user to suit varying operating states in the
clinic environment. These modifications are made through a user interface designed in Microsoft
Excel and are linked directly to Visual Basic macros. Schedule generation is performed at the
user’s command. Figure 8-1 is the tool’s welcome screen.
Figure 8-1. ProSkedge Welcome Screen
8.1 User Interface Development & Description
Created in Microsoft Excel 2007, the user is able to modify various parameters of the linear
programming model. The main input page is shown in Figure 8-2.

24
Figure 8-2. ProSkedge Main Input Menu
Provider preferences for working mornings or afternoons for periods of one month is a
requirement for the model and is edited through the user interface. The user will be able to define
preference on a scale of “0”, which means the provider prefers not to be scheduled for clinical
duty to “2” meaning high preference for clinical duty. If “0” is selected, this does not mean the
provider has time off from work. Instead, this means the provider would prefer to be assigned an
administrative or triage period during this time should he or she not be scheduled. See Appendix
E Figure 1 for a screenshot of the Provider Preferences input screen.
In a similar manner, time away, which includes approved vacation time or routine time away
from the facility, is considered. Time away is represented within the user interface by a “0” for
25
approved vacation time or routine time away from the facility or “1” for expected to be at the
clinic. Appendix E Figure 2 is a screenshot of the Time Away input screen.
Specialist schedules may also be modified by the user. The Specialist Schedules input tab (see
Appendix E Figure 3) is similar to the Time Away input screen. The user will set each cell to “0”
or “1” based on whether the specialist is scheduled to be away from the facility or at the facility
respectively.
Providers and specialists may use more than one room for exams in an effort to allow patients to
wait in an examination room instead of the clinic waiting room. The number of rooms requested
by each provider is critical to the success of generating a feasible provider solution. Appendix E
Figure 4 shows the Room Requirements input screen.
The number of rooms available for use by providers and their scheduled patients is also
important. This information is located in two different input screens. First, the total number of
examination rooms is captured in the Number of Rooms input tab. On this screen, the user can
change the number of exam rooms available in the clinic. It is variable on a period by period
basis to account for special cause problems (i.e. the plumbing in one examination room causes a
room to be unusable on one Wednesday afternoon) in addition to long-term concerns (i.e. one
examination has been transformed into a computer room for nurses or a storage room has been
turned into an examination room). Nurses also utilize exam rooms for purposes other than patient
visits. In this case, the total number of rooms available for patient visits is less than the total
number of rooms at the clinic. An expected number of rooms per period anticipated to be in use
by nurses for purposes other than patient visits is captured in the Nurse Use of Rooms tab. The
default value is zero but each cell can be set to any value that is less than the total number of
rooms at the clinic. Appendix E Figure 5 and 6 show the Number of Rooms tab and the Nurse
Use of Rooms tab respectively.
The screens described above are accessible from the Main Input Menu. Also on this screen the
user can add or delete providers and/or specialists from the model, and alter values such as the
number of administrative periods allowed to each provider per week, the length of the morning
and afternoon shifts at the clinic, and the scheduled appointment length for various patient types.
Once the user modifies the settings of the model as necessary, he or she will click the “Generate

26
Optimal Provider Schedule” button found at the bottom of the input page. See Appendix E
Figure 7 for a screenshot of the input page. When this button is clicked, a Visual Basic macro
collects the data that has been edited, modifies the linear programming models, and runs the
models in the background. This Visual Basic aspect of the model is discussed in further detail in
Section 8.2. Once the models have been solved, the user is immediately taken to the output page
that displays the results. Appendix E Figure 8 shows a screenshot of the page on which the
schedule generated by ProSkedge is shown. This screen has a “Back to Input Menu” button
which will take the user back to the Main Input Menu. The “Throughput Results” button will
take the user to the second set of results that provides a benchmark value for the number of
patients that could be expected to be seen given the percentage guidelines set by the PACT
initiative. This screen is shown in Appendix E Figure 9.
8.2 Behind the Scenes of ProSkedge Visual Basic (VB) is the driving force behind the workings of ProSkedge. The VB macros are
used to perform three major actions: 1) add/delete providers from the model; 2) add/delete
specialists from the model; and 3) run the linear program. Dynamically named ranges are used
because the user has the ability to add and delete providers and specialists from the model. This
ability means that every range of values in the sheets containing the linear programs may change
at any time. The addition and deletion of providers and specialists involves adding and deleting
rows to the input screens that list the providers and/or specialists. These screens are Provider
Preferences, Specialist Schedules, Time Away, and Room Requirements.
The linear programming models are run off of five hidden sheets. They are called Model 1 Week
1, Model 1 Week 2, Model 1 Week 3, Model 1 Week 4, and Model 2. Each sheet contains a
separate model that reflects any differences between each week in the planning horizon of one
month. The models are run individually in sequential order beginning with Model 1 Week 1 and
ending with Model 2 through subroutine calls written into the VB macro.
Excel Solver can be run using a VB macro as long as the Solver add-in is installed in Excel and
is referenced by the VB correctly. As noted above, each model has its own subroutine call in VB.
For Model 1, Weeks 1 through 4, the decision variable area is cleared and then the Solver
requirements are set in the following sequence: 1) objective function; 2) binary decision variable
constraint; 3) administrative and triage requirement constraint; 4) room availability constraint; 5)

27
minimum provider constraint; and 6) time away constraint. The time away constraint sets a
specific decision variable to “0” if the respective cell on the Time Away input tab is set to “0”.
This guarantees that the associated provider is not scheduled for that period that week.
The Solver settings for Model 1 Weeks 1 through 4 are shown in the following Table 8-1.
Max Time 100 seconds
Iterations 100
Precision 0.000001
Assume Linear False
Integer Tolerance 15%
Auto-Scaling True
Convergence 0.0001
Assume Non-negative True
Table 8-1. Model 1 Solver Settings
9 Scenario Analyses
9.1 Scenario Descriptions Scenario analysis is used to understand the impact of extended hours, number of rooms, number
of providers, and patient mix on patient throughput. Each scenario is set up in the user interface
to be run through the linear programming model; results will be manually fed into the simulation
model. The results from the simulation model serve two major purposes: first, it enables linear
programming model verification; and second, it allows for better understanding of inputs on
patient throughput and provider utilization. Each scenario is iterated by 100 runs to ensure
precise results. The eleven scenarios considered are summarized in Table 9-2.
The steps taken for the scenario analysis can be defined in the following figure.

28
* Scenarios including Saturday clinics were not run through LP Model
Figure 9-1. Scenario Analysis Process
The first scenario aims to understand the impact of increasing the number of hours providers are
available during the regular work week. In order to accomplish this, the clinic hours are
increased by one hour during the afternoon block, making each day have a 4-hour morning block
and 4-hour afternoon block.
The second set of scenarios analyses to be examined will include those related to the number of
examination rooms to understand the impact of room conversion on patient throughput. This is
explored through the addition of one examination room in scenario 2 and two additional rooms
in scenario 3.
The next set of scenario is aimed at understanding how a change in patient type will impact
throughput and utilization. The CBOC is currently in the process of planning a patient merger
from the North Hampton CBOC facility; providers are currently considering that this merger will
increase the percentage of new patients seen due to additional paperwork requirements per visit.
To understand the impact of this merger, scenario 4 increases the number of new patients to 5%
and accordingly decreases the number of established patients by 5%. Scenario 5 increases the
Output Provider Utilization & Patient Throughput
Run in Arena Simulation Model
Set constraints to match linear programming model; run 100 replications to ensure precision
Run in Linear Programming Model*
Set constraints to meet scenario at hand; output schedule and result statistics
Scenarios Defined through:
Observation & CBOC Suggestions

29
number of new patients by 10% and decreases established by 10% to consider a greater
percentage increase for comparison
Scenarios 6 through 9 look at the impact of creating a Saturday clinic. Scenario 6 and 7 analyze
the addition of a half day, or morning block of four hours, for a full staff of eight providers and
then a half staff of four providers respectively. Because of the way the scenario run controls are
set to reflect full eight hour days to enable provider utilization calculations, it was not possible to
set half Saturday clinics automatically in the runs for these two scenarios. Instead, replications of
the half Saturday were run for one month for each scenario to reflect the addition of the
additional period. These results were added to the base model throughput results for analysis and
comparison. Scenarios 8 and 9 examine a full day (four hour morning shift and three hour
afternoon shift) for a full staff of eight providers and then a half staff of four providers
respectively. Given current constraints on adding periods in the linear programming model, these
scenarios were not run through the linear programming model; the schedules were set based on
the base model and additional full-day periods and providers set in the scenario description were
manually added.
The final set of scenarios investigates the addition of providers to the CBOC. Scenario 10 looks
at the addition of one provider, and scenario 11 examines the addition of two.
A base model was also constructed in the linear programming model and run through the
simulation model to set a basis for scenario analysis. The settings defined for this base model are
defined in Table 9-1.

30
Base Model Setting
Provider Preferences 1
Specialist Schedules 1 or 0 (*)
Provider Room Requirements 1 (base line estimation)
# Rooms Required for Nurse Use 0
Approved Time Away 1
# Examination Rooms Available 21*
Minimum Providers Assigned to Clinical Duty 4
# Administrative Periods per Week 2*
# Triage periods 1 triage period every other week*
# Providers starting with Triage 4
Length of Morning (AM) Period 4 hours*
Length of Afternoon (PM) Period 3 hours*
New Patient Length 60 minutes*
Established Patient Length 30 minutes*
Phone Patient Length 15 minutes*
Percentage Established Patients 60% per PACT requirements (estimated)
Percentage New Patients 35% per PACT requirements (estimated)
Percentage Phone Consult Patients 5% per PACT requirements (estimated)
*Current state/operations at Worcester CBOC
Table 9-1. Baseline Model Settings
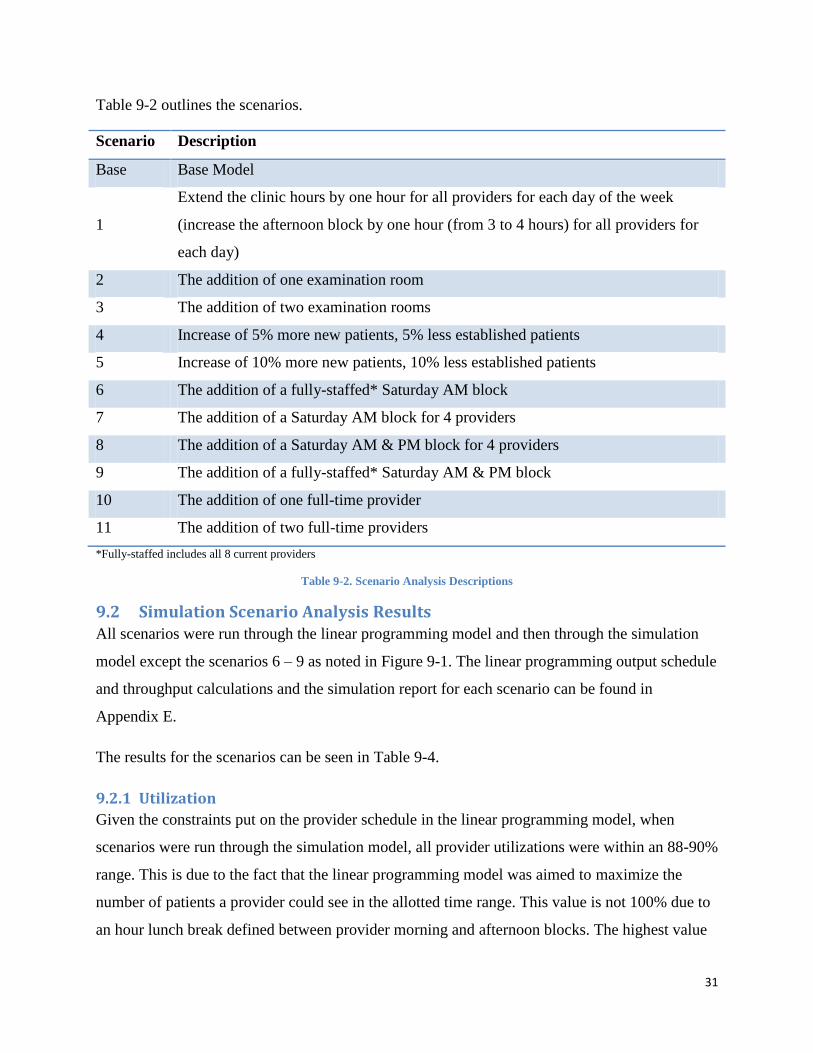
31
Table 9-2 outlines the scenarios.
Scenario Description
Base Base Model
1
Extend the clinic hours by one hour for all providers for each day of the week
(increase the afternoon block by one hour (from 3 to 4 hours) for all providers for
each day)
2 The addition of one examination room
3 The addition of two examination rooms
4 Increase of 5% more new patients, 5% less established patients
5 Increase of 10% more new patients, 10% less established patients
6 The addition of a fully-staffed* Saturday AM block
7 The addition of a Saturday AM block for 4 providers
8 The addition of a Saturday AM & PM block for 4 providers
9 The addition of a fully-staffed* Saturday AM & PM block
10 The addition of one full-time provider
11 The addition of two full-time providers
*Fully-staffed includes all 8 current providers
Table 9-2. Scenario Analysis Descriptions
9.2 Simulation Scenario Analysis Results All scenarios were run through the linear programming model and then through the simulation
model except the scenarios 6 – 9 as noted in Figure 9-1. The linear programming output schedule
and throughput calculations and the simulation report for each scenario can be found in
Appendix E.
The results for the scenarios can be seen in Table 9-4.
9.2.1 Utilization
Given the constraints put on the provider schedule in the linear programming model, when
scenarios were run through the simulation model, all provider utilizations were within an 88-90%
range. This is due to the fact that the linear programming model was aimed to maximize the
number of patients a provider could see in the allotted time range. This value is not 100% due to
an hour lunch break defined between provider morning and afternoon blocks. The highest value

32
of provider utilization occurred in Scenario 8, in which four providers worked a half Saturday
clinic.
9.2.2 Total Throughput
Figure 9-3 demonstrates the patient throughput results, including total throughput as well as new,
established, and phone consult patient visit values per scenario, to highlight the impact of each
scenario on throughput.
Figure 9-2. Simulation Throughput Results
This scenario analysis demonstrates four major findings related to patient throughput. First, as
theorized by CBOC staff, an increase in number of examination rooms, number of physicians
available, and Saturday clinics, all increase patient throughput in comparison to the base model.
The most significant throughput increases occurred in Scenario 11, in which there was an
addition of two physicians to the base model. This resulted in a throughput of 1491 patients
versus the 1223 patients seen in the base model (a 22% increase).
The second major finding on throughput is the impact of increasing the number of rooms
available. Scenario 2, an increase of one examination room, demonstrated increased patient
throughput from 1223 to 1372 (a 12% increase). It should be noted, however, that Scenario 3, an

33
additional two examination rooms, output an identical optimized schedule as Scenario 2 in the
linear programming model. That is, increasing the number of available rooms at the CBOC by
more than one given will not impact throughput any more than an increase of one room. This is
due to constraints on the current number of providers available, triage, and administrative
requirements. This finding shows there is a benefit in patient throughput in transitioning a room
currently unused for patients to an examination room. However, increasing the number of rooms
available for exam rooms beyond that without increasing the number of available providers (or
time current providers are available) or incorporating nurse use of rooms will not have a
significant further impact on throughput.
The third major finding is the impact of increasing the time providers are available for patient
visits. Increasing the workday by one hour demonstrated an increase in throughput from the base
of 1223 to 1371 (a 12% increase). The addition of Saturday clinics also poses a beneficial patient
throughput increase, with the most significant increase resulting from Scenario 9, a full day, fully
staffed Saturday clinic. This increased the number of patients to 1472 (a 20% increase). These
changes may be implemented at the Worcester CBOC, however, careful consideration of
provider availability for extended hours or Saturday clinics should be evaluated, as well as other
administrative and facility constraints (i.e. increased time requirement for security).
The final significant throughput result is on the impact of changing patient mix. Scenario 5,
representing an increase of new patients of 10%, had a significant impact on patient throughput.
That is, the total number of patients through the model decreased from the base of 1223 to 1105
(a 10% decrease) with the patient mix shift. This is a realistic situation in the near future for the
Worcester CBOC as it faces a CBOC merger, which will increase the number of new patients
seen. This finding demonstrates that action needs to be taken to allow for maximized throughput
in the case of a merger, such as increasing the number of rooms, providers, or periods available.

34
Scenario
Linear Programming Model Results* Simulation Model Results*
Throughput Throughput Utilization
Total
Total
New
Patients
Total
Established
Patients
Total
Phone
Patients Total
Total
New
Patients
Total
Established
Patients
Total
Phone
Patients
Provider
Utilization
**
Base 1267 443 760 63 1223 425 737 61 89.15%
1 1449 507 869 72 1371 477 825 69 88.88%
2 1254 439 752 62 1372 478 826 68 88.66%
3 1254 439 752 62 - - - - -
4 1208 483 664 60 1322 527 729 66 88.66%
5 1166 524 583 58 1105 495 555 55 88.71%
6*** - - - - 1317 457 794 66 n/a
7*** - - - - 1413 490 852 71 n/a
8*** - - - - 1342 467 808 67 89.87%
9*** - - - - 1472 512 886 74 89.88%
10 1432 501 859 72 1362 473 821 68 88.71%
11 1592 558 955 79 1491 518 898 75 88.71% *Simulation model results are based on the average of 100 simulation runs
**Utilization value includes 1 hour lunch break between AM and PM shift
***Scenarios for Saturday clinics were run in simulation model only. Results are added to base model to calculate comparable
throughput (see model description)
Table 9-3. Scenario Analysis Results
9.3 Statistical Significance of Results The results from the simulation model can be compared to the results of the linear programming
model to determine if the difference between the two sets of results is statistically significant. If
they are not statistically significantly different, it can be said that the results reflect reality
similarly. By plotting the outputs of each model in terms of throughput, the differences can begin
to be analyzed. The following graph displays the total patient throughput, as well as patient mix
break down, for both the linear programming outputs and the simulation model results.

35
Figure 9-3. Throughput Comparison Results
From the results table (Table 9-4) and this graph (Figure 9-3), it appears that the majority of
linear programming throughput results were greater than the simulation results. Hypothesis
testing can be used to better understand the statistical significance of this graphical observation.
Here, index 1 is equal to values associated with the linear programming model while index 2 is
representative of values from the simulation model. The goal is to prove (or reject) that the two
throughput values calculated for each scenario are statistically the same. For this reason, the null
hypothesis is set to:
Numerically, the linear programming results are typically higher than the simulation results and
so the alternative hypothesis is set to:
This analysis was completed by calculating the standard deviation, s, for each visit type in the
scenarios run through both the linear programming model and the simulation model. This
standard deviation was calculated by using the half width of the average throughput provided in
the Arena reports (see Appendix E) to solve for standard deviation using the following formula:

36
√
Here, the t-statistic was based on a 95% confidence interval (α = 0.05) and 100 replications (n)
used in each trial to be 1.984.
The calculated standard deviation was used with the linear programming output and simulation
results to calculate a critical t-value for the scenario using the following formula:
Corresponding p-values were determined from the critical t-value for each scenario using Excel’s
2-tailed t-distribution function (TDIST), defining “x” as the absolute difference between µ2 and
µ1, degrees of freedom to 99 (n-1).
The results for the hypothesis tests can be found in the Tables 9-4, 9-5, and 9-6 for total new
patient visits, total established patient visits, and total phone consult patients respectively.
For a confidence interval of 95%, a p-value less than 0.05 determines if the null hypothesis
should be rejected in the comparison between the linear programming model and simulation
model results for the scenarios. Several conclusions can be made on the statistical significance of
the difference between the linear programming output and simulation scenario results. Any p-
value greater than 0.05 is shown in red on the results Tables 9-4, 9-5, and 9-6, which means that
the throughput values are statistically significantly the same and the null hypothesis is not to be
rejected. Points above the critical p-value of 0.05 (α) allow the null hypothesis to be accepted;
points below reject the null hypothesis. First, the p-values for the number of established patients
had the highest set of p-values, all above the 0.05 decision value. For this reason, there is
statistical evidence that the null hypothesis is correct. This trend is not followed, however, for the
p-values for new and phone consult patients. The number of new patients had many p-values
significantly below the 0.05 cut off, thus giving evidence that the null hypothesis is rejected in
many scenarios. Such a result may mean that the model is not reflecting reality completely or the
linear programming model has excessive rounding error.

37
Scenario
Total # New Patient Visits
LP Simulation Half Width n alpha s t p-value
Base 443 425 2.44 100 0.05 12.298 -1.464 0.146
1 507 477 2.66 100 0.05 13.407 -2.238 0.027
2 439 478 2.61 100 0.05 13.155 2.965 0.004
4 483 527 2.49 100 0.05 12.550 3.506 0.001
5 524 495 2.3 100 0.05 11.593 -2.502 0.014
10 501 473 2.64 100 0.05 13.306 -2.104 0.038
11 558 518 2.8 100 0.05 14.113 -2.834 0.006 Table 9-4. Hypothesis Test Results for Total Number of New Patient Visits
Scenario
Total # Established Visits
LP Simulation Half Width n alpha s t p-value
Base 760 737 4.99 100 0.05 25.151 -0.914 0.363
1 869 825 5.27 100 0.05 26.563 -1.656 0.101
2 752 826 5.19 100 0.05 26.159 2.829 0.006
4 664 729 4.62 100 0.05 23.286 2.791 0.006
5 583 555 4.27 100 0.05 21.522 -1.301 0.196
10 859 821 5.31 100 0.05 26.764 -1.420 0.159
11 955 898 5.38 100 0.05 27.117 -2.102 0.038 Table 9-5. Hypothesis Test Results for Total Number of Established Patient Visits
Scenario
Total # Phone Consults
LP Simulation Half Width n alpha s t p-value
Base 63 61 1.76 100 0.05 8.871 -0.225 0.822
1 72 69 1.89 100 0.05 9.526 -0.315 0.753
2 62 68 1.87 100 0.05 9.425 0.637 0.526
4 60 66 1.84 100 0.05 9.274 0.647 0.519
5 58 55 1.7 100 0.05 8.569 -0.350 0.727
10 72 68 1.87 100 0.05 9.425 -0.424 0.672
11 79 75 1.88 100 0.05 9.476 -0.422 0.674 Table 9-6. Hypothesis Test Results for Total Number of Phone Consults

38
10 Additional Recommendations While the main objective of this project is to develop a tool to aid provider scheduling, it is also
important to understand additional factors that may improve other operational issues faced by the
CBOC. The following is a variety of approaches with the potential to increase patient flow and
improve care delivery. A review of the methods described below confirm improvement potential
and have the ability to suit the environment at the Worcester CBOC based on observations made
by the authors of this report.
10.1 Room Sharing: The Human Factors Perspective The current practice at the Worcester CBOC requires nurses to assign examination rooms to
providers on a daily basis. Varying specialist and provider schedules requiring the use of
different rooms over the course of a day or during a period of clinical time and require a
significant scheduling time and daily rearranging. Suggestions can be made to the current
practice to lessen the negative impact of any human factors issues that may surface involving
room sharing.
Human factors engineering, as defined by Wickens, Lee, Liu, and Becker (2004), is concerned
with the impact of the environment with which an individual is involved. It should be
incorporated in any workplace redesign to ensure safety and comfort, increase productivity, and
reduce human error. In particular, workplace design should consider the impact of the work
environment on the mental comfort of the worker, which is commonly referred to as working
memory. It is suggested that the working memory load of the worker be minimized. This will
reduce confusion as improve care delivery because full attention on the patient is restored.
During an investigation of the benefits of facility redesign, Wells (2005) afforded that working
memory and room standardization would not only result in increased health care professional
productivity, but would additionally increase patient comfort level.
The Worcester CBOC may be hesitant to fully redesign examination rooms but instead may want
to ensure that the rooms assigned to specific providers are as similar as possible. The main
elements in the room (i.e. computer and desk, sink, patient bed) are in the same approximate
locations and medical devices and tools are kept in similar areas of the room. Having less to
readjust or locate in the examination room at hand will allow providers to better focus on the
needs of the patient. Additionally, CBOC nurses should be aware of these human factors issues
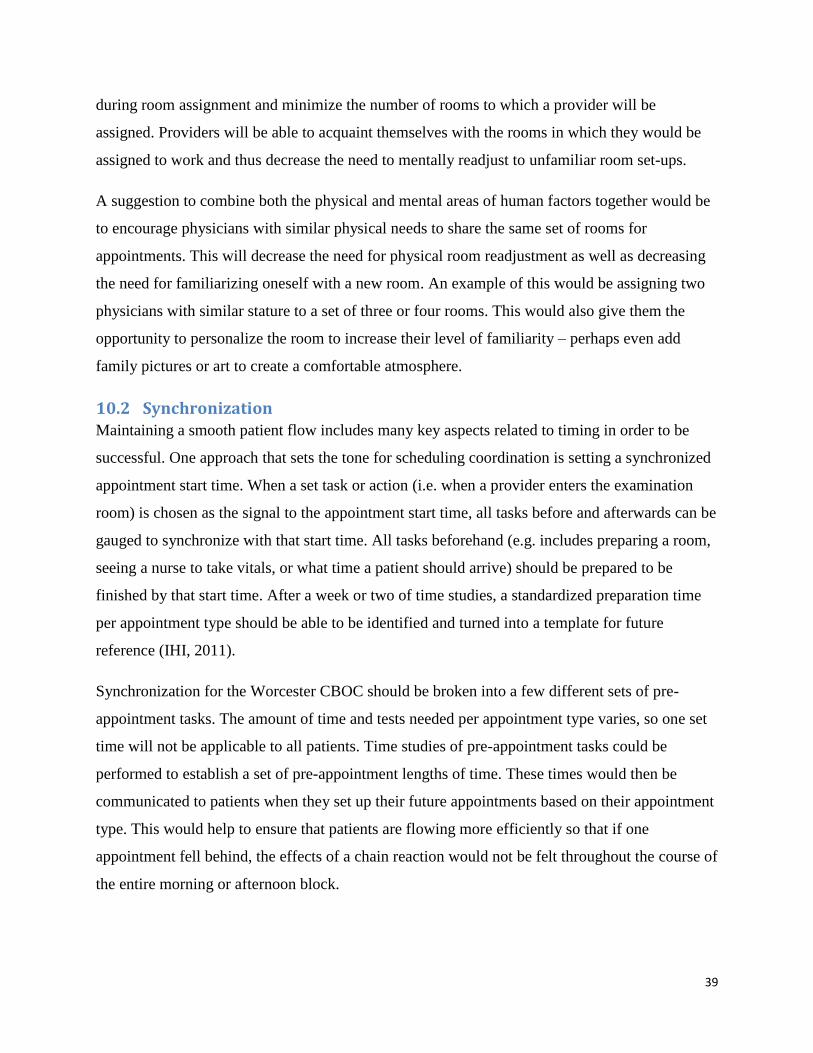
39
during room assignment and minimize the number of rooms to which a provider will be
assigned. Providers will be able to acquaint themselves with the rooms in which they would be
assigned to work and thus decrease the need to mentally readjust to unfamiliar room set-ups.
A suggestion to combine both the physical and mental areas of human factors together would be
to encourage physicians with similar physical needs to share the same set of rooms for
appointments. This will decrease the need for physical room readjustment as well as decreasing
the need for familiarizing oneself with a new room. An example of this would be assigning two
physicians with similar stature to a set of three or four rooms. This would also give them the
opportunity to personalize the room to increase their level of familiarity – perhaps even add
family pictures or art to create a comfortable atmosphere.
10.2 Synchronization Maintaining a smooth patient flow includes many key aspects related to timing in order to be
successful. One approach that sets the tone for scheduling coordination is setting a synchronized
appointment start time. When a set task or action (i.e. when a provider enters the examination
room) is chosen as the signal to the appointment start time, all tasks before and afterwards can be
gauged to synchronize with that start time. All tasks beforehand (e.g. includes preparing a room,
seeing a nurse to take vitals, or what time a patient should arrive) should be prepared to be
finished by that start time. After a week or two of time studies, a standardized preparation time
per appointment type should be able to be identified and turned into a template for future
reference (IHI, 2011).
Synchronization for the Worcester CBOC should be broken into a few different sets of pre-
appointment tasks. The amount of time and tests needed per appointment type varies, so one set
time will not be applicable to all patients. Time studies of pre-appointment tasks could be
performed to establish a set of pre-appointment lengths of time. These times would then be
communicated to patients when they set up their future appointments based on their appointment
type. This would help to ensure that patients are flowing more efficiently so that if one
appointment fell behind, the effects of a chain reaction would not be felt throughout the course of
the entire morning or afternoon block.

40
A patient flow and task analysis could aid in synchronizing patient appointment start times. In an
analysis of diabetic patients with high wait times in a clinic in Jordan, patients originally checked
in with a clerk and then saw a medical officer to perform the tests needed to be passed along to
the laboratory. The patients would then wait for results and revisit with a nurse and medical
officer. After the sequencing of events changed, testing was completed before checking in with
the clerk to reduce waiting time and eliminate multiple visits with medical officers in one
appointment. (Ammari, Abu Zahra, & Dreesch, 1991)
In conjunction with synchronization, a task analysis could be performed before beginning time
studies to determine what time a patient should enter the clinic. This would aid in the creation of
pre-appointment checklists to ensure that routine tasks are not forgotten and also help maintain a
steady pace. Checklists and templates are discussed further in Section 11.3.
A way to gauge timing of appointments is to use a “minutes behind graph” (Mark Murray &
Associates, 2011) See Figure 11-1 for an example of a minutes behind graph. A minutes behind
graph tracks nurse and provider appointment start times throughout the course of a day.
Identifying times of day or other tasks outside of seeing a patient that may cause an appointment
backlog could point out appointment balancing issues. (Mark Murray & Associates, 2011)
Figure 10-1. Minutes Behind Graph (Mark Murray & Associates, 2011)
The same approach can be taken to judge and assign appropriate patient arrival times based on an
average of historical data to ensure patient punctuality. This is critical to synchronizing the start
time of the appointment. Various appointments require varying lengths of pre-appointment tasks
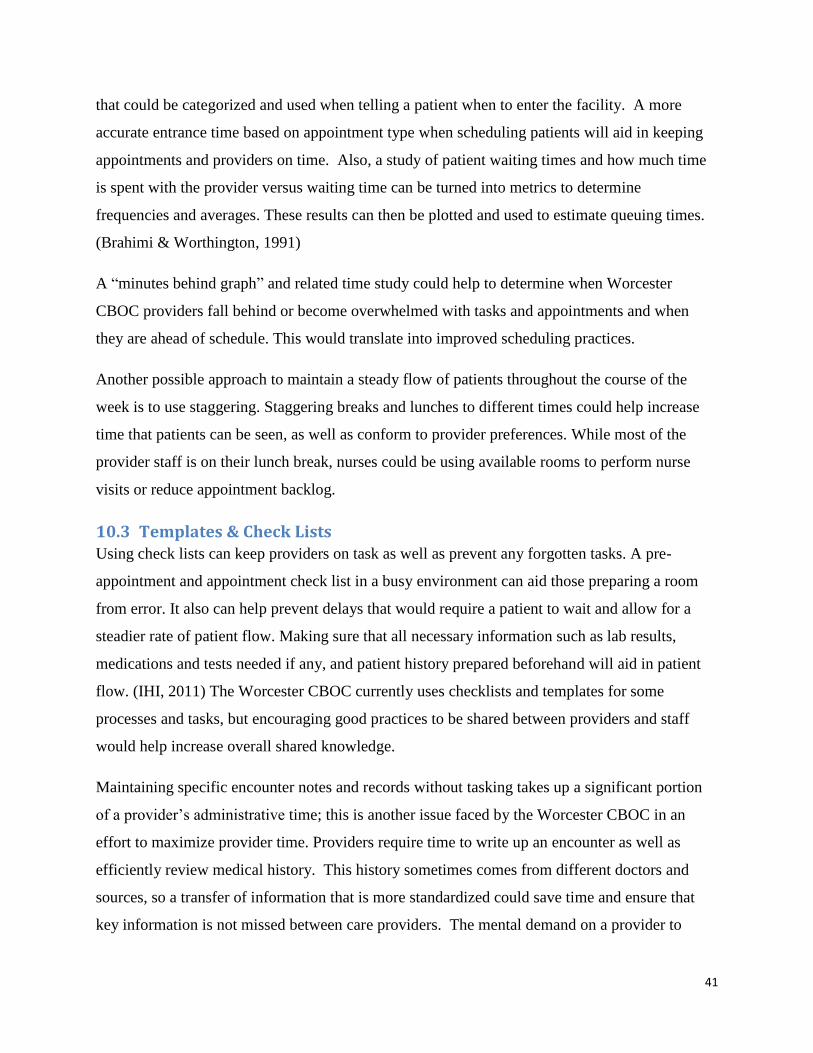
41
that could be categorized and used when telling a patient when to enter the facility. A more
accurate entrance time based on appointment type when scheduling patients will aid in keeping
appointments and providers on time. Also, a study of patient waiting times and how much time
is spent with the provider versus waiting time can be turned into metrics to determine
frequencies and averages. These results can then be plotted and used to estimate queuing times.
(Brahimi & Worthington, 1991)
A “minutes behind graph” and related time study could help to determine when Worcester
CBOC providers fall behind or become overwhelmed with tasks and appointments and when
they are ahead of schedule. This would translate into improved scheduling practices.
Another possible approach to maintain a steady flow of patients throughout the course of the
week is to use staggering. Staggering breaks and lunches to different times could help increase
time that patients can be seen, as well as conform to provider preferences. While most of the
provider staff is on their lunch break, nurses could be using available rooms to perform nurse
visits or reduce appointment backlog.
10.3 Templates & Check Lists Using check lists can keep providers on task as well as prevent any forgotten tasks. A pre-
appointment and appointment check list in a busy environment can aid those preparing a room
from error. It also can help prevent delays that would require a patient to wait and allow for a
steadier rate of patient flow. Making sure that all necessary information such as lab results,
medications and tests needed if any, and patient history prepared beforehand will aid in patient
flow. (IHI, 2011) The Worcester CBOC currently uses checklists and templates for some
processes and tasks, but encouraging good practices to be shared between providers and staff
would help increase overall shared knowledge.
Maintaining specific encounter notes and records without tasking takes up a significant portion
of a provider’s administrative time; this is another issue faced by the Worcester CBOC in an
effort to maximize provider time. Providers require time to write up an encounter as well as
efficiently review medical history. This history sometimes comes from different doctors and
sources, so a transfer of information that is more standardized could save time and ensure that
key information is not missed between care providers. The mental demand on a provider to

42
accurately give individual care to a patient and the increased time required to give a proper
amount of care can hopefully be reduced paired with steady accuracy when note encounter
templates and task checklists are applied.
A technique to aid in standardizing medical tasks and communication methods currently not
performed at the CBOC is the use of document templates. Much of a provider’s administrative
time throughout a day involves writing encounter notes to accompany a patient’s visit. Sharing
ideas and methods, as well as creating standardized templates for note taking could aid in
reducing provider time taking notes and allow for more transparency between different provider
notes.
11 Industrial Engineering Design Capstone Requirement ABET, Inc. (Accreditation Board for Engineering and Technology) is a widely recognized
college and university applied science, computing, engineering, and technology program
accreditor. This accrediting body requires students with a major in one of those four programs of
study to specifically address the engineering design component of the project. The planning tool,
as well as supporting simulation model and additional suggestions for the CBOC inherently
follows the ABET definition of an engineering design project. According to ABET, an
engineering design is the creation of an iterative mathematical and scientific solution to a
specified problem. The design process should include first defining the problem, analyzing the
situation, creating the solution, testing and then evaluating the results. The problem at hand for
this project is described in the background section and specifically defined in the Section 3
Problem Statement. The problem at hand for the VA CBOC situation is to create a planning tool
to aid in resource scheduling; this issue was identified by complexities arising in current
scheduling given specialist schedules, finite numbers of providers and rooms, as well as a
transition to a PACT model. (ABET, 2008)
The methodology section of the report outlines the steps taken in the solution process that meet
the planning criteria for the ABET design process. This demonstrates that the first step in the
solution was to define the problem by determining user needs as well as data collection; this step
not only allows for the problem to be defined, but analyzes the problem to ensure all aspects of
the situation are discovered. In addition, this step included literature reviews to understand

43
similar types of problems and the solutions that were found; this enabled the team to consider
multiple alternative methods of solution including linear programming, simulation, and
combination models, to determine the best model type of the situation at hand. The next three
steps include the three designs created; the linear programming model, the simulation model, and
finally the user interface. Testing is performed in the following step as the model is both
validated and verified which is to ensure that the models are not only working as expected from a
mathematical standpoint, but also match operations at the Worcester CBOC. Verification and
validation provide a loop back to model revisions when discrepancies arise, thus meeting the
testing and evaluation steps in the ABET process. The final step in the model process is the final
implementation, which is a reflection of further evaluating the results to complete the project.
12 Conclusions & Future Recommendations This report outlined the creation, testing, and implementation of an executable planning tool
ProSkedge. ProSkedge, a linear programming-based planning tool, was created to be modifiable
by the user to reflect varying operating states in a health clinic environment. The user is allowed
to adjust provider preferences, provider time away, specialist schedules, room requirements,
number of exam rooms (available), and the number of exam rooms utilized by nurses and health
technicians. Other inputs that can be altered include clinic, administrative, and triage
requirements, length of morning and afternoon periods, appointment length per patient type, and
patient mix percentages. ProSkedge runs linear programming models through Visual Basic
macros using these inputs to output a feasible schedule to the user. This model was verified
through an Arena-based simulation model and validated through interviews and meetings with
CBOC staff.
Scenario analysis, performed by ProSkedge and an Arena-based simulation model, proved that
increasing the number of available providers had the greatest impact on patient throughput. Other
factors that notably contributed to an increase in patient throughput included lengthening the
workday by one hour and adding a partial or full-day Saturday clinic. The addition of new
examination rooms poses a potential opportunity to improve patient throughput. However, it
would also require an increase in number of providers for maximum benefit. An additional
finding of the scenario analysis demonstrated that changing patient mix to include a greater
percentage of new patients had a significant negative impact on throughput. It is therefore

44
suggested that the CBOC experiment with inputs, such as number of providers available, using
ProSkedge to maintain a desired patient throughput in the event of a patient mix change.
Additional recommendations beyond the implementation of ProSkedge to aid in the operational
and human factors related concerns faced by the CBOC can be suggested. These
recommendations include limiting the number of rooms to which providers are assigned,
standardizing exam room layout, providing adjustable office equipment, performing time studies
to identify more efficient patient scheduling policies, and offering templates and checklists so
that providers may ensure all steps are completed and that encounter notes are in a standard
format.
13 Future Model Improvements ProSkedge was originally designed with the Worcester CBOC in mind. Minor alterations were
made to allow the model to be more dynamic and usable in other similar clinics. Still,
improvements can be made to allow for a more dynamic tool and applicability to other clinics of
a much larger size and with other constraints. The improvements detailed below were not
implemented in this version of ProSkedge because they would require computer programming
expertise beyond the levels of the project team.
Ability to add additional periods to the week
Currently, ProSkedge only adds and deletes providers and specialists within a set
planning period of ten periods (five days with two periods each). Adding additional
periods would allow the user to test the impact of changes such as Saturday clinics
without modifying the linear program directly.
Ability to personalize names in lieu of “Provider #” and “Specialist #”
ProSkedge lists providers and specialists by number because the Visual Basic macro must
search the Excel sheets to determine how many providers and specialists are currently
being represented. If another method of counting the number of providers and specialists
shown in the model is determined and implemented, the names of providers and
specialists can be added to eliminate any confusion between which provider is
represented by which number in the model.

45
Ability to schedule/assign providers to specific exam rooms
The Worcester CBOC currently requires nurses to assign providers to exam rooms during
their scheduled periods. While ProSkedge will ensure that no more providers than
available rooms are scheduled, it does not use that information to assign the providers to
exam rooms.
Ability to schedule nurses
ProSkedge currently can schedule up to 15 providers. However, the nurses at the
Worcester CBOC utilize rooms as well and also host nurse visits with patients when a
provider is unnecessary. ProSkedge handles this by allowing the user to assign a number
of the total exam rooms to be used for nurse use for any purpose other than a patient visit
with a provider. It would be beneficial for the model to be able to incorporate nurses as
another decision variable constrained by the issues that surround nurse scheduling.
Implement LP in an optimization programming language to allow for more
variables
Microsoft Excel, and Solver in particular, have limits on the number of decision variables
and other constraints which may prohibit the advancement of ProSkedge. Therefore, it is
suggested that the linear program described in this report be programmed using a true
optimization language (open-source optimization languages exist) and developed as a
standalone application not built within Microsoft Excel. This will bypass the limits set
within Excel.

46
Glossary AAP: American Academy of Pediatrics
ACU: Ambulatory care unit
CBOC: Community Based Outpatient Clinic
FIFO: First-in, first-out
LP: Linear Programming
PACT: Patient Aligned Care Team
PCMH: Patient-Centered Medical Home
ProSkedge: Name of provider schedule planning tool developed during this project meant as an
abbreviation for Provider Schedule
VA: Department of Veterans Affairs
VB: Visual Basic
VHA: Veterans Health Administration

47
Works Cited
ABET, Inc. (2008) ABET Engineering Accreditation Commission. 2009-2010 Criteria for
Accrediting Engineering Programs.
Adan,, I., Bekkers, J., Dellaert, N., Vissers, J., & Yu, X. (2009). Patient mix optimization and
stochastic resource requirements: A case study in cardiothoracic surgery planning. Health
Care Management Science, 12, 129-141.
Alessandra, A. J., Grazman, T. E., Parameswaran, R., & Yauas, U.. (1978). Using simulation in
hospital planning. Simulation, 30, 62-67.
American Academy of Family Physicians, American Academy of Pediatrics, American College
of Physicians, & American Osteopathic Association. (2007). Joint Principles of the
Patient Centered Medical Home. Retrieved October 16, 2010, from Patient-Centered
Primary Care Collaborative: http://www.pcpcc.net/content/joint-principles-patient-
centered-medical-home
Berenson, R. B., Hammons, T., Gans, D. M., Zuckerman, S., Merrell, K., Underwood, W., &
Williams, A. (2008, September/October). A House Is Not A Home: Keeping Patients At
The Center Of Practice Redesign. Health Affairs, 27, 1219-1230.
Cayirili, T. & Emre V. (2003). Outpatient Scheduling in Health Care: A Review of Literature.
Production and Operations Management, 12, 519-549.
Centeno, M. A. & Ismail, A. M. (2003). A Simulation-ILP Based Tool for Scheduling ER Staff.
Proceedings of the 2003 Winter Simulation Conference (S. Chick, P. J. Sánchez, D.
Ferrin, & D. J. Morrice, Eds.), 1930-1938.
Côté, M. J. (1999). Patient Flow and resource utilization in an outpatient clinic. Socio-Economic
Planning Sciences, 33, 231-245.
Denton, B., Viapiano, J., & Vogl, A. (2006, October 12). Optimization of surgery sequencing
and scheduling decisions under uncertainty. Health Care Management Science, 10, 13-
24.
Fishman, George S. (2001). Discrete-Event Simulation: Modeling, Programming, and Analysis.
New York: Springer-Verlag.
Guo, M., Wagner, M., & West, C. (2004). Outpatient clinic scheduling: a simulation approach.
Proceedings of the 2004 Winter Simulation Conference (R. G. Ingalls, M. D. Rossetti, J.
S. Smith, & B. A. Peters, Eds.), 1981-1987.

48
Institute for Healthcare Improvement (IHI). Improve Work Flow: Use Syncronization. Retrieved
January 2011.
http://www.ihi.org/IHI/Topics/Improvement/ImprovementMethods/Changes/IndividualC
hanges/Use+Synchronization.htm
Kelton, W. D., Sadowski, R. P., & Sturrock, D. T. (2007). Simulation with Arena. New York:
McGraw-Hill.
Kumar, A. P., & Kapur, R. (1989). Discrete Simulation Application – Scheduling Staff for the
Emergency Room. Proceedings of the 1989 Winter Simulation Conference (E. A.
MacNair, K. J. Musselman, & P. Heidelberger., Eds.), 1112-1120.
Lau, H., & Lau, A. (1999, May). A fast procedure for computing the total system cost of an
appointment schedule for medical and kindred facilities. IIE Transactions, 32, 833-839.
Law, A. M. & Kelton, W. D. (1999). Simulation Modeling and Analysis. New York: McGraw-
Hill.
M. Brahimi and D. J. Worthington (1991) Queueing Models for Out-Patient Appointment
Systems. The Journal of the Operational Research Society, Vol. 42, No. 9 (Sep., 1991),
pp. 733-746. Accessed: 28/01/2011 http://www.jstor.org/stable/2583656.
Mark Murray & Associates, LLC, Sacramento, California, USA. Minutes Behind Graph.
Institute for Improving Healthcare. Retrieved January 17, 2011.
http://www.ihi.org/IHI/Topics/OfficePractices/Access/Tools/MinutesBehindGraph.htm
N. Ammari, N. Abu Zahra, & N. Dreesch. Streamlining Clinic Management. World Health
Forum Vol. 12. 1991 pg 479-482. Accessed January 28, 2011.
Nutting, P. A., Miller, W. L., Crabtree, B. F., Jaen, C. R., Stewart, E. E., & Stange, K. C. (2009,
May/June). Initial Lessons from the First National Demonstration Project on Practice
Transformation to a Patient-Centered Medical Home. Annals of Family Medicine, 7, 254-
260.
Patrick, J., & Puterman, M. L. (2006, July 5). Improving resource utilizations for diagnostic
services through flexible inpatient scheduling: A method for improving resource
utilization. Journal of the Operational Research Society, 58, 235-245.
Pooch, Udo W. & Wall, James A. (1993). Discrete Event Simulation: A Practical Approach.
Boca Raton, FL: CRC Press.
Rico, L. (2011). Healing the exam room. University of California, Irvine.

49
Robinson, L. W., & Chen, R. R. (2003, February). Scheduling doctors’ appointments: optimal
and empirically-based heuristic policies. IIE Transactions, 35, 295-307.
Ross, Sheldon M. (2006) Simulation (4th
ed.). San Diego, CA: Academic Press.
Santibanez, P., Chow, V., French, J., Puterman, M., & Tyldesley, S. (2009). Reducing patient
wait times and improving resource utilization at British Columbia Cancer Agency’s
ambulatory care unit through simulation. Health Care Management Science 12, 392-407.
Takakuwa, S., & Wijewickrama, A. (2008). Optimizing Staffing Schedule in Light of Patient
Satisfaction for the Whole Outpatient Hospital Ward. Proceedings of the 2008 Winter
Simulation Conference (S. J. Mason, R. R. Hill, L. Monch, O. Rose, T. Jefferson, & J. W.
Fowler, Eds.), 1500-1508.
VA Benefits & Health Care Utilization. (2010, July 30). Retrieved September 9, 2010, from U.S.
Department of Veterans Affairs: http://www1.va.gov/VETDATA/Pocket-
Card/4X6_summer10_sharepoint.pdf
Wells, J. (2005). Efficient Office Design for a Successful Practice. Fam Pract Manag. 14(5):46-
50.
Wijewickrama, A. & Takakuwa, S. (2005). Simulation Analysis of Appointment Scheduling in
an Outpatient Department of Internal Medicine. Proceedings of the 2005 Winter
Simulation Conference (M.E. Kuhl, N.M. Steiger, F.B. Armstrong, & J.A. Joines, Eds.),
2264-2273.
Wickens, C., Lee, J., Liu, Y., & Becker, S. (2004). An Introduction to Human Factors
Engineering. New Jersey: Pearson Education, Inc.

50
A Methods Matrix Method Problem Example Objective1 How Advantages Disadvantages
Op
tim
iza
tio
n
Linear Programming Activity analysis problem –
choose the intensities with
which the various activities are
to be operated to maximize the
value of the output to the
company subject to the given
resources2
Minimizing or
maximizing an
objective function
Quickly determines the
implications of information
and impact of variation
Great computational
power because of its
mathematical base;
accurate approximation
of fundamental
relationships
Difficult to incorporate
probability and to address
business risk; non-linear
effects are not modeled
accurately; unable to deal with
uncertainty without many
assumptions
Decomposition Methods No examples found Break down a
large problem
into a smaller
solvable
problems
Iterative technique Can handle non-
linearities; can integrate
different levels of
planning
Unable to handle uncertainly
well
Dynamic Programming Can be applied to health care in
areas such as cancer screening,
dosing strategies, and hospital
admissions3
Optimize in
stages over one
variable
Recursive relation to solve
optimization
Capacity constraints
make calculations
simpler; can incorporate
uncertainty in demand
and in fixed/variable
costs
Unable to treat uncertain
capacity constraints because
installed/operable capacity
must be fixed; data is not
helpful in assessing the kinds
of decisions under different
conditions in time
Stochastic Programming How to plan operations such
that staff and equipment are
being scheduled most
efficiently4
Maximize or
minimize an
objective function
when parameters
depend on
random states
4 sub-methods:
1) two stage programming
with recourse, 2) change
constrained programming, 3)
stochastic programming via
distributional analysis, 4)
expected value/variance
criterion in quadratic
programming
Can incorporate
uncertainty/variation
into LP problems
Cannot handle too many
constraints because it can
become too large to solve; non-
linear feasible regions and
multivariate probability
distributions may cause
problems
1 Objective, How, Advantages, and Disadvantages from: Ku, Anne. Modelling Uncertainty in Electricity Capacity Planning. Thesis. London Business School, 1995. Risk, 2003.
http://www.analyticalq.com/thesis/ch3.pdf. 2 Thomas S. Ferguson, Linear Programming: A Concise Introduction. http://www.usna.edu/Users/weapsys/avramov/Compressed%20sensing%20tutorial/LP.pdf. 3 Veinott, Jr., Arthur F. Guide to Dynamic Programming. 2008. Stanford Course Notes. Http://www.stanford.edu/class/msande351/handouts/guide.pdf. 4 Jaap, De Rue M. Stochastic Programming in Health Care Planning. Tech. 2007. Web. http://www.math.vu.nl/~sbhulai/theses/werkstuk-rue.pdf.

51
A. Methods Matrix (continued) Method Problem Example Objective How Advantages Disadvantages
Sim
ula
tio
n
System Dynamics Model the interactions between
staff and patients to design
programs5
Analyze the
effect of
something over
time
By analyzing the effect of
feedbacks to describe
interactions
Use to determine
optimal capacity levels
and to hypothesize on
the effect of changing
variables in different
scenarios
Can be very data-intensive
and detailed; output requires
careful validation
Scenario Analysis No stand-alone example Analyze
problems over
time under
different
conditions
Requires judgment to
hypothesize discrete futures
with a different assumptions
Helpful in the
projection of long range
and highly uncertain
environments; most
suitable for situations
where crucial factors
can be identified but not
easily predicted, where
uncertainty is high and
future events are
unlikely to be affected
by historical events
Difficult to predict interacting
future events; too many
factors lead to speculation
Sensitivity Analysis Investigate the possible
improvement of a cancer
screening model6
Examine which
factors affect
performance the
most
Identifies most important
variables
Validates results of
optimization
Looking at variables in
isolation does not consider
probability of relationships;
no attempt to analyze risk
Probabilistic Risk
Analysis
Model risks and identify known
hazards that threaten patient
safety7
Examines
optimization
under subjective
probability
Considers correlations among
uncertainties by assigning
probabilities to critical inputs
Permits a thorough
analysis of alternative
options; possible to
analyze risk and
uncertainty realistically
Time consuming; difficult to
obtain probability
assessments; does not reflect
decision maker’s preferences
Decision Analysis
Program evaluation;
effectiveness analysis8
To make the
best choice
among many
potential options
Uses many decision-theoretic
techniques
Permits a thorough
analysis of alternative
options; incorporates
decision maker’s
judgments
Time consuming; probabilities
and utilities are difficult to
obtain
5 Hirsch, G. B. 1979. System Dynamics modeling in health care. SIGSIM Simul. Dig. 10, 4 (Jul. 1979), 38-42. http://doi.acm.org/10.1145/1102815.1102821 6 Rose, Baker D. "Sensitivity Analysis for Healthcare Models Fitted to Data by Statistical Methods." Health Care Management Science 2 (2002): 275-81. 7 Alemi, F. "Probabilistic Risk Analysis Is Practical." Health Administration and Policy 16.4 (2007): 300-10. 8 Decision Analysis in Healthcare. George Mason University Course Description HAP730. http://gunston.gmu.edu/730/about.asp?E=0.
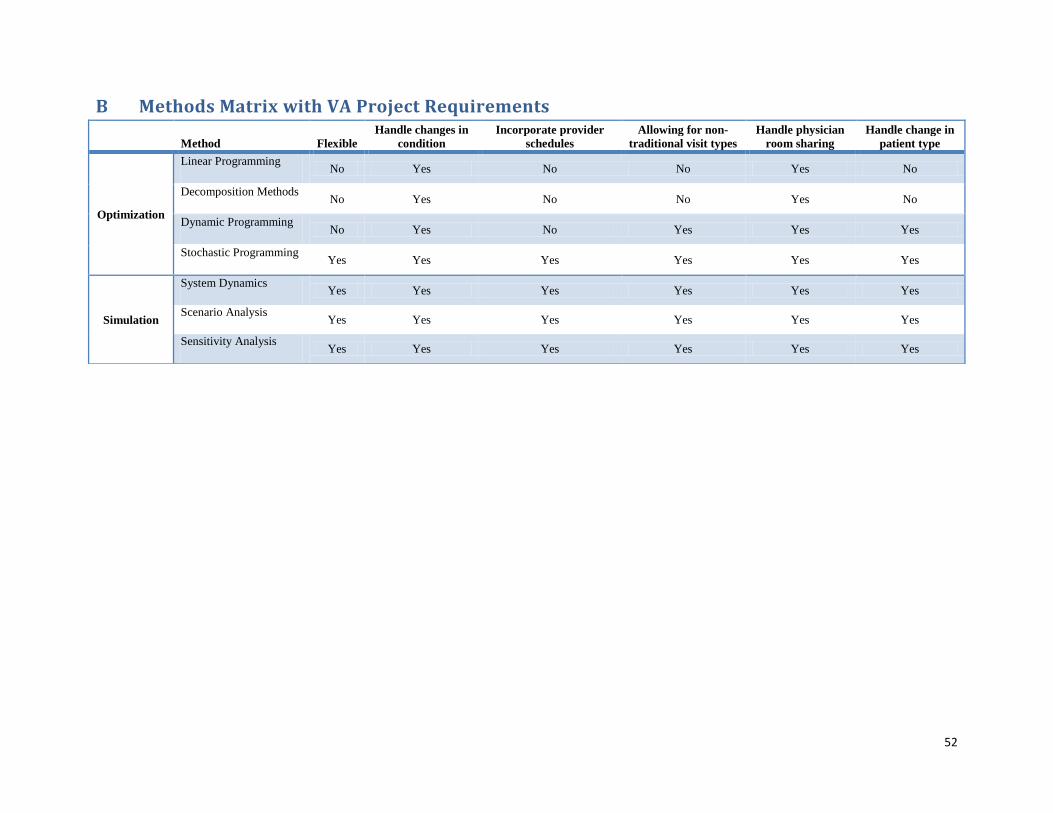
52
B Methods Matrix with VA Project Requirements
Method Flexible
Handle changes in
condition
Incorporate provider
schedules
Allowing for non-
traditional visit types
Handle physician
room sharing
Handle change in
patient type
Optimization
Linear Programming No Yes No No Yes No
Decomposition Methods No Yes No No Yes No
Dynamic Programming No Yes No Yes Yes Yes
Stochastic Programming Yes Yes Yes Yes Yes Yes
Simulation
System Dynamics Yes Yes Yes Yes Yes Yes
Scenario Analysis Yes Yes Yes Yes Yes Yes
Sensitivity Analysis Yes Yes Yes Yes Yes Yes

53
C Gantt Chart - Schedule for Methodology

54
D Simulation Model Screenshots
Figure D-1. Simulation Module
Figure D-2. Create Module for Patients to Enter

55
Figure D-3. Decide Module to Determine Patient Type
Figure D-4. Phone Consult Patient Assignment
Figure D-5. New Patient Assignment
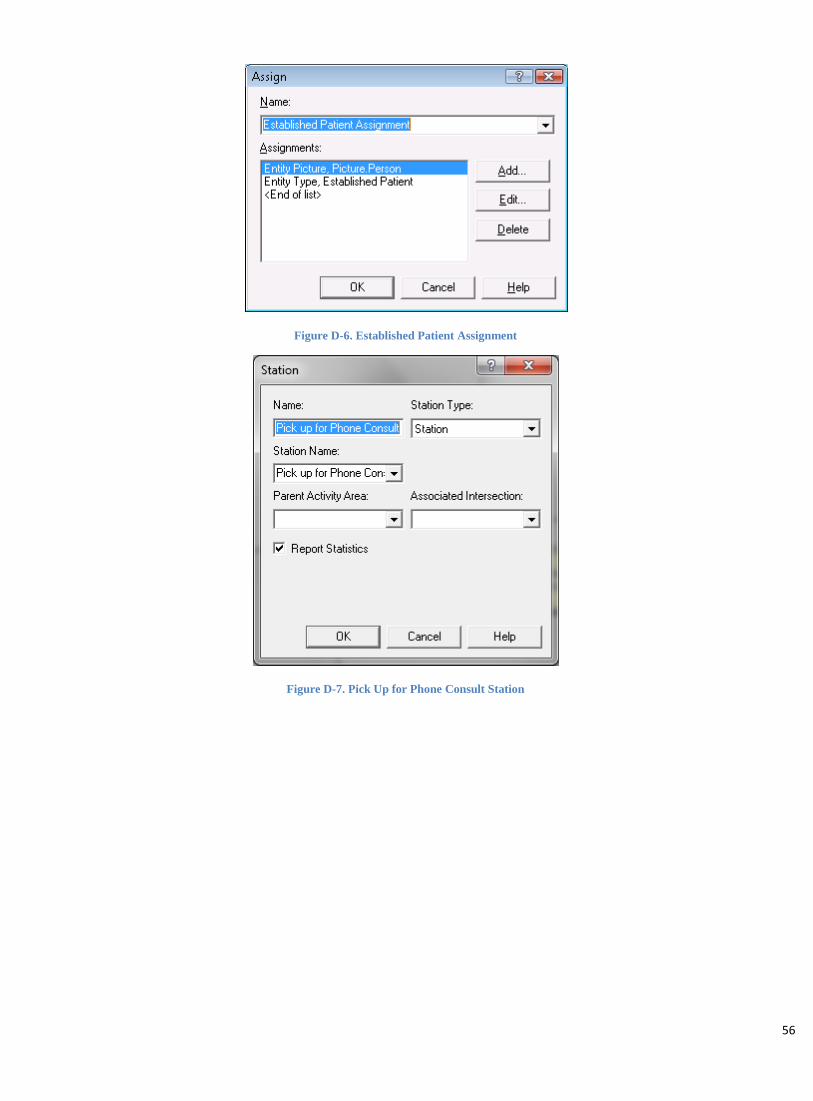
56
Figure D-6. Established Patient Assignment
Figure D-7. Pick Up for Phone Consult Station

57
Figure D-8. Pick Up for New Patient Station
Figure D-9. Pick Up for Established Patient

58
Figure D-10. Route for Phone Consult Patient
Figure D-11. Route for New Patient
Figure D-12. Route for Established Patient

59
Figure D-13. Location of Phone Consult
Figure D-14. Location of Exam Room for New Patient
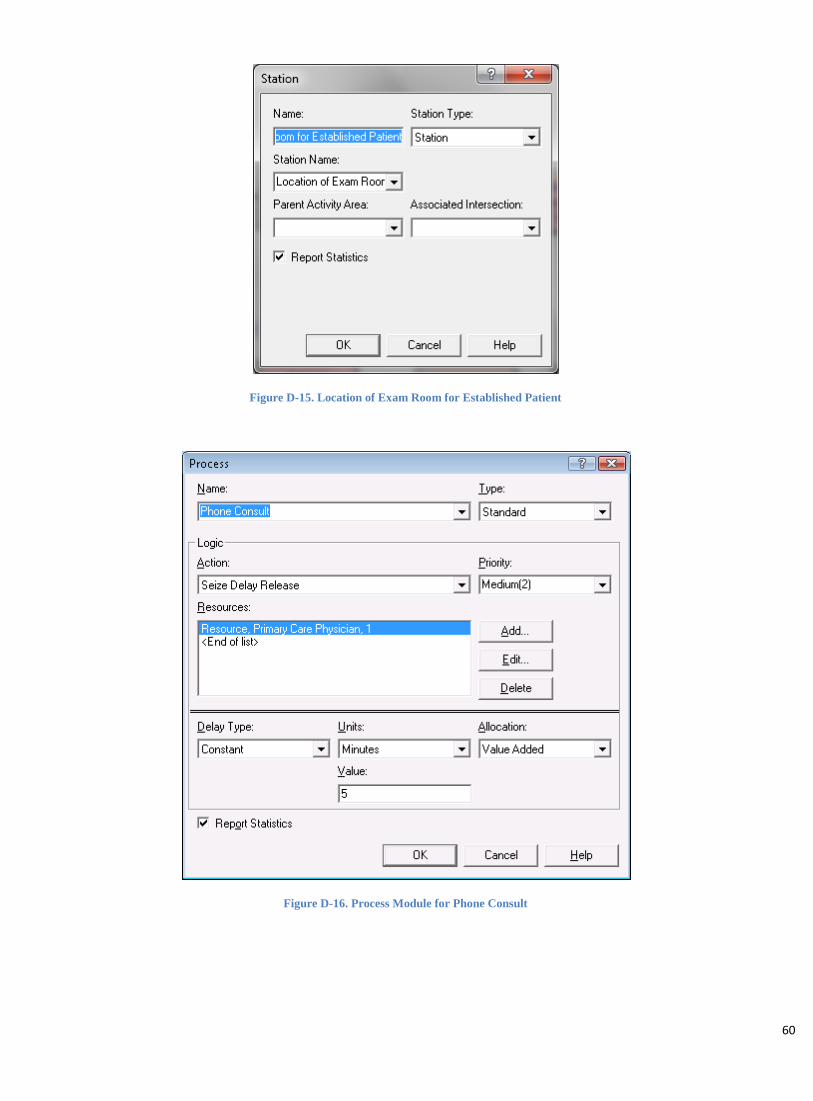
60
Figure D-15. Location of Exam Room for Established Patient
Figure D-16. Process Module for Phone Consult

61
Figure D-17. Process Module for New Patient Visit

62
Figure D-18. Process Module for Established Patient Visit
Figure D-19. Route from Location of Phone Consult to Exit

63
Figure D-20. Route Location of New Visit to Exit
Figure D-21. Route from Location of Established Visit to Exit
Figure D-22. Exit Station

64
Figure D-23. Exit Module
Figure D-24. CBOC Facility Layout Created in Visio

65
Figure D-25. Overall Simulation Model Screenshot

66
Figure D- 26. Primary Care Provider Schedule

67
E Scenario Analysis Results Base Model
1. The linear programming model output (schedule)
2. The linear programming model results (throughput)
3. The Arena simulation model report

68
Base Model - Linear Programming Model Output (Schedule)

69
Base Model - Linear Programming Model Results (Throughput)

70
Category Overview 2:33:31PM February 23, 2011
Base Model
Time Units: Replications: 100 Hours
Values Across All Replications
Key Performance Indicators
Average System
Number Out 1,225
Model Filename: Page of 1 4 C:\Users\cedanko\Documents\Base Model 2

71
Category Overview 2:33:31PM February 23, 2011
Base Model
Time Units: Replications: 100 Hours
Values Across All Replications
Entity
Time
VA Time Maximum Average
Minimum Average Half Width Average
Minimum Value
Maximum Value
0.5000 Established Patient 0.00 0.5000 0.5000 0.5000 0.5000
1.0000 New Patient 0.00 1.0000 1.0000 1.0000 1.0000
0.08333333 Phone Consult Patient 0.00 0.08333333 0.08333333 0.08333333 0.08333333
NVA Time Maximum Average
Minimum Average Half Width Average
Minimum Value
Maximum Value
0.00 Established Patient 0.00 0.00 0.00 0.00 0.00
0.00 New Patient 0.00 0.00 0.00 0.00 0.00
0.00 Phone Consult Patient 0.00 0.00 0.00 0.00 0.00
Wait Time Maximum Average
Minimum Average Half Width Average
Minimum Value
Maximum Value
70.5133 Established Patient 0.28 67.1211 74.1315 0.00 139.50
70.1608 New Patient 0.24 67.1227 72.5229 0.00 139.02
70.0592 Phone Consult Patient 1.14 59.1412 86.5121 0.00 139.72
Transfer Time Maximum Average
Minimum Average Half Width Average
Minimum Value
Maximum Value
0.06666667 Established Patient 0.00 0.06666667 0.06666667 0.06666667 0.06666667
0.06666667 New Patient 0.00 0.06666667 0.06666667 0.06666667 0.06666667
0.06666667 Phone Consult Patient 0.00 0.06666667 0.06666667 0.06666667 0.06666667
Other Time Maximum Average
Minimum Average Half Width Average
Minimum Value
Maximum Value
0.00 Established Patient 0.00 0.00 0.00 0.00 0.00
0.00 New Patient 0.00 0.00 0.00 0.00 0.00
0.00 Phone Consult Patient 0.00 0.00 0.00 0.00 0.00
Total Time Maximum Average
Minimum Average Half Width Average
Minimum Value
Maximum Value
71.0800 Established Patient 0.28 67.6878 74.6982 0.5667 140.07
71.2274 New Patient 0.24 68.1894 73.5896 1.0667 140.08
70.2092 Phone Consult Patient 1.14 59.2912 86.6621 0.1500 139.87
Other
Model Filename: Page of 2 4 C:\Users\cedanko\Documents\Base Model 2

72
Category Overview 2:33:31PM February 23, 2011
Base Model
Time Units: Replications: 100 Hours
Values Across All Replications
Entity
Other
Number In Maximum Average
Minimum Average Half Width Average
Entity 1 0.00 9600.00 9600.00 9600.00
Established Patient 9.32 5767.46 5877.00 5634.00
New Patient 8.67 3354.66 3472.00 3268.00
Phone Consult Patient 3.57 477.88 525.00 429.00
Number Out Maximum Average
Minimum Average Half Width Average
Entity 1 0.00 9600.00 9600.00 9600.00
Established Patient 4.99 737.52 805.00 660.00
New Patient 2.44 425.85 456.00 393.00
Phone Consult Patient 1.76 61.4900 79.0000 42.0000
WIP Maximum Average
Minimum Average Half Width Average
Minimum Value
Maximum Value
0.00 Entity 1 0.00 0.00 0.00 0.00 1.0000
2521.97 Established Patient 4.84 2462.81 2579.10 0.00 5143.00
1467.51 New Patient 4.86 1412.60 1535.66 0.00 3019.00
208.43 Phone Consult Patient 1.86 184.30 235.38 0.00 463.00
Model Filename: Page of 3 4 C:\Users\cedanko\Documents\Base Model 2

73
Category Overview 2:33:31PM February 23, 2011
Base Model
Time Units: Replications: 100 Hours
Values Across All Replications
Queue
Time
Waiting Time Maximum Average
Minimum Average Half Width Average
Minimum Value
Maximum Value
70.7171 Established Patient Visit.Queue 0.28 67.1211 74.4845 0.00 139.88
70.5317 New Patient Visit.Queue 0.23 67.2932 73.0606 0.00 139.80
70.0821 Phone Consult.Queue 1.14 59.1412 86.5121 0.00 139.87
Other
Number Waiting Maximum Average
Minimum Average Half Width Average
Minimum Value
Maximum Value
2518.31 Established Patient Visit.Queue 4.83 2459.43 2575.52 0.00 5136.00
1464.05 New Patient Visit.Queue 4.85 1409.21 1531.99 0.00 3016.00
208.28 Phone Consult.Queue 1.86 184.17 235.23 0.00 463.00
Resource
Usage
Instantaneous Utilization Maximum Average
Minimum Average Half Width Average
Minimum Value
Maximum Value
0.8915 Primary Care Physician 0.00 0.8871 0.8934 0.00 1.0000
Number Busy Maximum Average
Minimum Average Half Width Average
Minimum Value
Maximum Value
5.0099 Primary Care Physician 0.00 4.9365 5.0603 0.00 8.0000
Number Scheduled Maximum Average
Minimum Average Half Width Average
Minimum Value
Maximum Value
4.7973 Primary Care Physician 0.01 4.7063 4.8904 0.00 8.0000
Scheduled Utilization Maximum Average
Minimum Average Half Width Average
Primary Care Physician 0.00 1.0443 1.0542 1.0334
Total Number Seized Maximum Average
Minimum Average Half Width Average
Primary Care Physician 3.25 1229.38 1267.00 1196.00
Model Filename: Page of 4 4 C:\Users\cedanko\Documents\Base Model 2

74
Scenario 1: Extend the clinic hours: increase the afternoon block by one hour (from 3 to 4 hours) for all providers each
day of the week
Scenario 1 - Linear Programming Model Output (Schedule)

75
Scenario 1 - Linear Programming Model Results (Throughput)

76
Category Overview 11:22:11AM February 23, 2011
Scenario One: Extend the clinic hours by one hour for all providers for each day of the week: increase the afternoon block by one hour (from 3 to 4
hours) for all providers for everyday
Time Units: Replications: 100 Hours
Values Across All Replications
Key Performance Indicators
Average System
Number Out 1,372
Model Filename: Page of 1 4 C:\Users\cedanko\AppData\Local\Microsoft\Windows\Temporary Internet Files\Content.IE5\XU2SLP21\Scenario_1[1]

77
Category Overview 11:22:11AM February 23, 2011
Scenario One: Extend the clinic hours by one hour for all providers for each day of the week: increase the afternoon block by one hour (from 3 to 4
hours) for all providers for everyday
Time Units: Replications: 100 Hours
Values Across All Replications
Entity
Time
VA Time Maximum Average
Minimum Average Half Width Average
Minimum Value
Maximum Value
0.5000 Established Patient 0.00 0.5000 0.5000 0.5000 0.5000
1.0000 New Patient 0.00 1.0000 1.0000 1.0000 1.0000
0.08333333 Phone Consult Patient 0.00 0.08333333 0.08333333 0.08333333 0.08333333
NVA Time Maximum Average
Minimum Average Half Width Average
Minimum Value
Maximum Value
0.00 Established Patient 0.00 0.00 0.00 0.00 0.00
0.00 New Patient 0.00 0.00 0.00 0.00 0.00
0.00 Phone Consult Patient 0.00 0.00 0.00 0.00 0.00
Wait Time Maximum Average
Minimum Average Half Width Average
Minimum Value
Maximum Value
80.4606 Established Patient 0.29 76.6394 83.7834 0.00 157.00
80.1788 New Patient 0.22 77.2865 82.7555 0.00 156.55
80.2917 Phone Consult Patient 1.17 68.5589 96.7593 0.00 157.27
Transfer Time Maximum Average
Minimum Average Half Width Average
Minimum Value
Maximum Value
0.06666667 Established Patient 0.00 0.06666667 0.06666667 0.06666667 0.06666667
0.06666667 New Patient 0.00 0.06666667 0.06666667 0.06666667 0.06666667
0.06666667 Phone Consult Patient 0.00 0.06666667 0.06666667 0.06666667 0.06666667
Other Time Maximum Average
Minimum Average Half Width Average
Minimum Value
Maximum Value
0.00 Established Patient 0.00 0.00 0.00 0.00 0.00
0.00 New Patient 0.00 0.00 0.00 0.00 0.00
0.00 Phone Consult Patient 0.00 0.00 0.00 0.00 0.00
Total Time Maximum Average
Minimum Average Half Width Average
Minimum Value
Maximum Value
81.0273 Established Patient 0.29 77.2060 84.3500 0.5667 157.57
81.2455 New Patient 0.22 78.3532 83.8222 1.0667 157.62
80.4417 Phone Consult Patient 1.17 68.7089 96.9093 0.1500 157.42
Other
Model Filename: Page of 2 4 C:\Users\cedanko\AppData\Local\Microsoft\Windows\Temporary Internet Files\Content.IE5\XU2SLP21\Scenario_1[1]

78
Category Overview 11:22:11AM February 23, 2011
Scenario One: Extend the clinic hours by one hour for all providers for each day of the week: increase the afternoon block by one hour (from 3 to 4
hours) for all providers for everyday
Time Units: Replications: 100 Hours
Values Across All Replications
Entity
Other
Number In Maximum Average
Minimum Average Half Width Average
Entity 1 0.00 10800.00 10800.00 10800.00
Established Patient 9.57 6487.91 6585.00 6351.00
New Patient 9.30 3773.19 3903.00 3659.00
Phone Consult Patient 4.18 538.90 599.00 484.00
Number Out Maximum Average
Minimum Average Half Width Average
Entity 1 0.00 10800.00 10800.00 10800.00
Established Patient 5.27 825.75 889.00 759.00
New Patient 2.66 477.38 517.00 442.00
Phone Consult Patient 1.89 69.1000 91.0000 47.0000
WIP Maximum Average
Minimum Average Half Width Average
Minimum Value
Maximum Value
0.00 Entity 1 0.00 0.00 0.00 0.00 1.0000
2843.45 Established Patient 5.24 2778.45 2895.96 0.00 5786.00
1654.86 New Patient 4.99 1602.06 1721.86 0.00 3406.00
235.13 Phone Consult Patient 1.96 208.91 262.07 0.00 520.00
Model Filename: Page of 3 4 C:\Users\cedanko\AppData\Local\Microsoft\Windows\Temporary Internet Files\Content.IE5\XU2SLP21\Scenario_1[1]

79
Category Overview 11:22:11AM February 23, 2011
Scenario One: Extend the clinic hours by one hour for all providers for each day of the week: increase the afternoon block by one hour (from 3 to 4
hours) for all providers for everyday
Time Units: Replications: 100 Hours
Values Across All Replications
Queue
Time
Waiting Time Maximum Average
Minimum Average Half Width Average
Minimum Value
Maximum Value
80.7361 Established Patient Visit.Queue 0.28 77.0147 84.0167 0.00 157.62
80.6261 New Patient Visit.Queue 0.23 77.7835 83.2651 0.00 157.60
80.3545 Phone Consult.Queue 1.18 68.5589 97.0095 0.00 157.32
Other
Number Waiting Maximum Average
Minimum Average Half Width Average
Minimum Value
Maximum Value
2839.79 Established Patient Visit.Queue 5.23 2775.02 2892.17 0.00 5779.00
1651.41 New Patient Visit.Queue 4.99 1598.71 1718.16 0.00 3402.00
234.99 Phone Consult.Queue 1.96 208.78 261.93 0.00 519.00
Resource
Usage
Instantaneous Utilization Maximum Average
Minimum Average Half Width Average
Minimum Value
Maximum Value
0.8888 Primary Care Physician 0.00 0.8886 0.8941 0.00 1.0000
Number Busy Maximum Average
Minimum Average Half Width Average
Minimum Value
Maximum Value
4.9903 Primary Care Physician 0.01 4.9407 5.0583 0.00 8.0000
Number Scheduled Maximum Average
Minimum Average Half Width Average
Minimum Value
Maximum Value
4.7774 Primary Care Physician 0.01 4.7191 4.8630 0.00 8.0000
Scheduled Utilization Maximum Average
Minimum Average Half Width Average
Primary Care Physician 0.00 1.0446 1.0578 1.0350
Total Number Seized Maximum Average
Minimum Average Half Width Average
Primary Care Physician 3.35 1378.09 1422.00 1341.00
Model Filename: Page of 4 4 C:\Users\cedanko\AppData\Local\Microsoft\Windows\Temporary Internet Files\Content.IE5\XU2SLP21\Scenario_1[1]
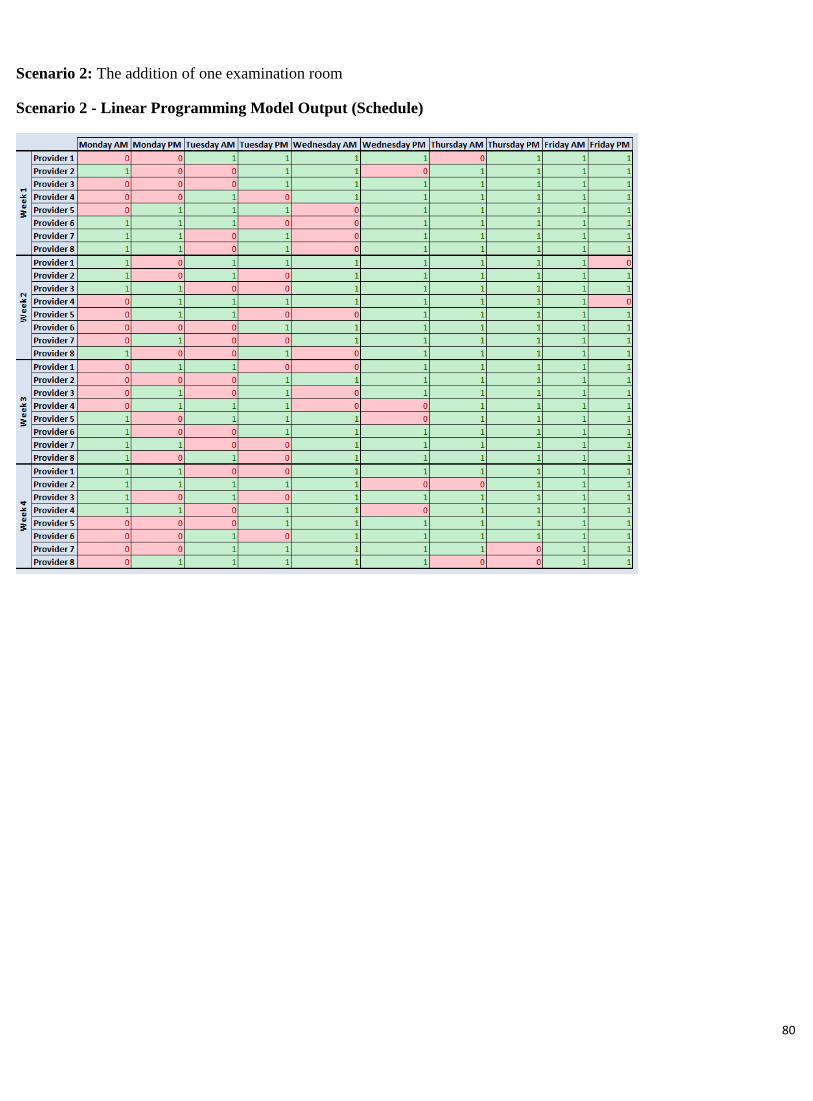
80
Scenario 2: The addition of one examination room
Scenario 2 - Linear Programming Model Output (Schedule)

81
Scenario 2 - Linear Programming Model Results (Throughput)

82
Category Overview 11:50:43AM February 23, 2011
Scenario Two: The addition of one examination room
Time Units: Replications: 100 Hours
Values Across All Replications
Key Performance Indicators
Average System
Number Out 1,373
Model Filename: Page of 1 4 C:\Users\cedanko\Documents\Scenario_2
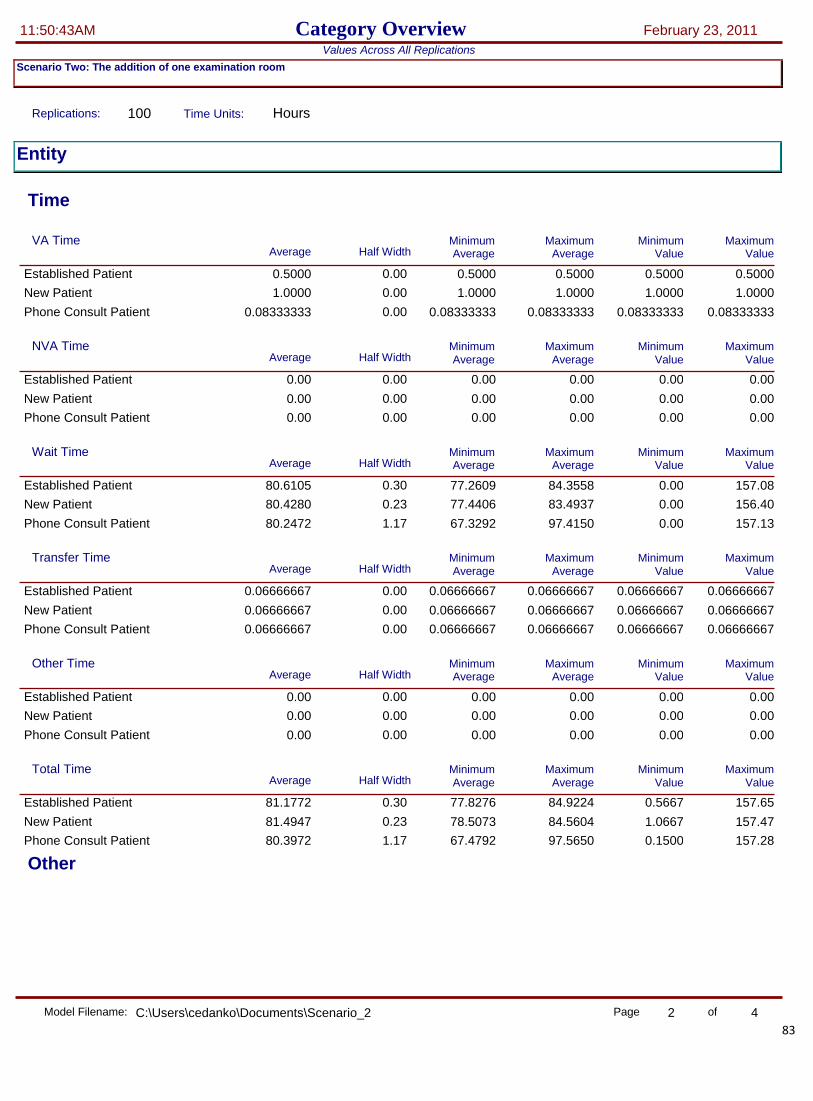
83
Category Overview 11:50:43AM February 23, 2011
Scenario Two: The addition of one examination room
Time Units: Replications: 100 Hours
Values Across All Replications
Entity
Time
VA Time Maximum Average
Minimum Average Half Width Average
Minimum Value
Maximum Value
0.5000 Established Patient 0.00 0.5000 0.5000 0.5000 0.5000
1.0000 New Patient 0.00 1.0000 1.0000 1.0000 1.0000
0.08333333 Phone Consult Patient 0.00 0.08333333 0.08333333 0.08333333 0.08333333
NVA Time Maximum Average
Minimum Average Half Width Average
Minimum Value
Maximum Value
0.00 Established Patient 0.00 0.00 0.00 0.00 0.00
0.00 New Patient 0.00 0.00 0.00 0.00 0.00
0.00 Phone Consult Patient 0.00 0.00 0.00 0.00 0.00
Wait Time Maximum Average
Minimum Average Half Width Average
Minimum Value
Maximum Value
80.6105 Established Patient 0.30 77.2609 84.3558 0.00 157.08
80.4280 New Patient 0.23 77.4406 83.4937 0.00 156.40
80.2472 Phone Consult Patient 1.17 67.3292 97.4150 0.00 157.13
Transfer Time Maximum Average
Minimum Average Half Width Average
Minimum Value
Maximum Value
0.06666667 Established Patient 0.00 0.06666667 0.06666667 0.06666667 0.06666667
0.06666667 New Patient 0.00 0.06666667 0.06666667 0.06666667 0.06666667
0.06666667 Phone Consult Patient 0.00 0.06666667 0.06666667 0.06666667 0.06666667
Other Time Maximum Average
Minimum Average Half Width Average
Minimum Value
Maximum Value
0.00 Established Patient 0.00 0.00 0.00 0.00 0.00
0.00 New Patient 0.00 0.00 0.00 0.00 0.00
0.00 Phone Consult Patient 0.00 0.00 0.00 0.00 0.00
Total Time Maximum Average
Minimum Average Half Width Average
Minimum Value
Maximum Value
81.1772 Established Patient 0.30 77.8276 84.9224 0.5667 157.65
81.4947 New Patient 0.23 78.5073 84.5604 1.0667 157.47
80.3972 Phone Consult Patient 1.17 67.4792 97.5650 0.1500 157.28
Other
Model Filename: Page of 2 4 C:\Users\cedanko\Documents\Scenario_2

84
Category Overview 11:50:43AM February 23, 2011
Scenario Two: The addition of one examination room
Time Units: Replications: 100 Hours
Values Across All Replications
Entity
Other
Number In Maximum Average
Minimum Average Half Width Average
Entity 1 0.00 10800.00 10800.00 10800.00
Established Patient 9.57 6487.91 6585.00 6351.00
New Patient 9.30 3773.19 3903.00 3659.00
Phone Consult Patient 4.18 538.90 599.00 484.00
Number Out Maximum Average
Minimum Average Half Width Average
Entity 1 0.00 10800.00 10800.00 10800.00
Established Patient 5.19 826.30 889.00 742.00
New Patient 2.61 478.21 514.00 445.00
Phone Consult Patient 1.87 68.9600 89.0000 47.0000
WIP Maximum Average
Minimum Average Half Width Average
Minimum Value
Maximum Value
0.00 Entity 1 0.00 0.00 0.00 0.00 1.0000
2843.90 Established Patient 5.21 2782.01 2895.95 0.00 5779.00
1655.17 New Patient 5.02 1601.57 1724.62 0.00 3402.00
235.17 Phone Consult Patient 1.96 208.63 262.13 0.00 520.00
Model Filename: Page of 3 4 C:\Users\cedanko\Documents\Scenario_2
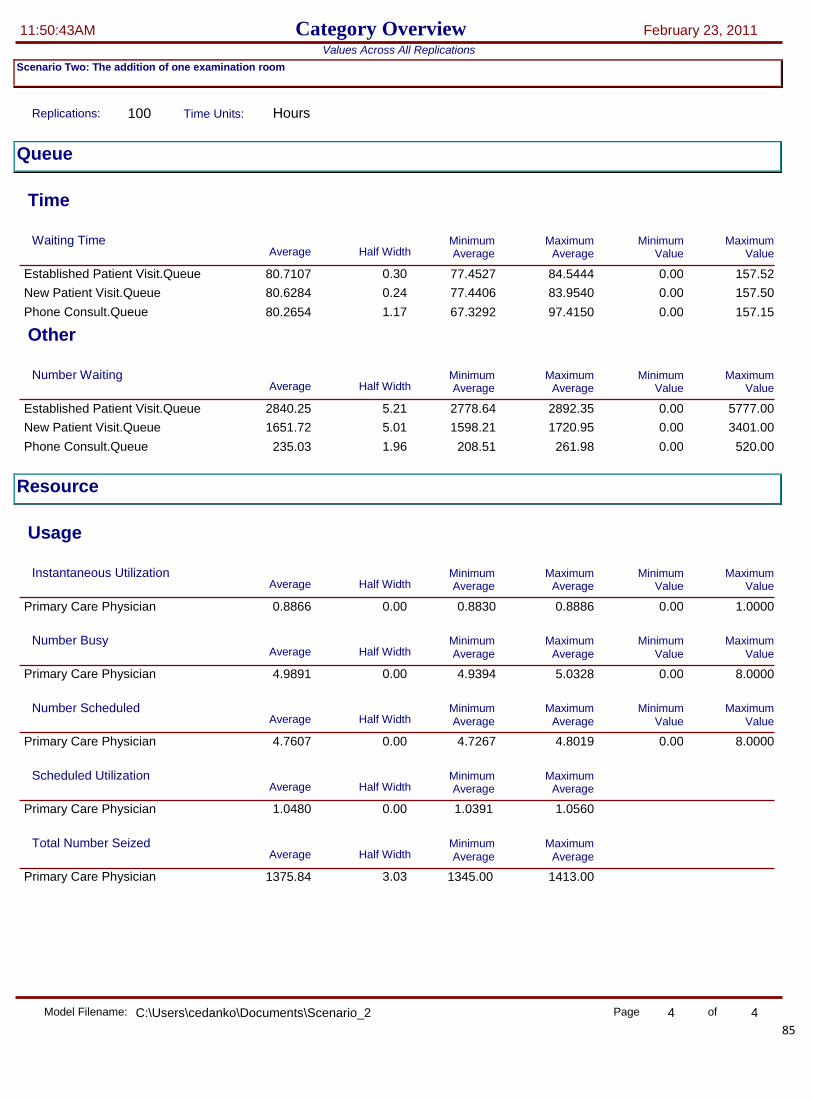
85
Category Overview 11:50:43AM February 23, 2011
Scenario Two: The addition of one examination room
Time Units: Replications: 100 Hours
Values Across All Replications
Queue
Time
Waiting Time Maximum Average
Minimum Average Half Width Average
Minimum Value
Maximum Value
80.7107 Established Patient Visit.Queue 0.30 77.4527 84.5444 0.00 157.52
80.6284 New Patient Visit.Queue 0.24 77.4406 83.9540 0.00 157.50
80.2654 Phone Consult.Queue 1.17 67.3292 97.4150 0.00 157.15
Other
Number Waiting Maximum Average
Minimum Average Half Width Average
Minimum Value
Maximum Value
2840.25 Established Patient Visit.Queue 5.21 2778.64 2892.35 0.00 5777.00
1651.72 New Patient Visit.Queue 5.01 1598.21 1720.95 0.00 3401.00
235.03 Phone Consult.Queue 1.96 208.51 261.98 0.00 520.00
Resource
Usage
Instantaneous Utilization Maximum Average
Minimum Average Half Width Average
Minimum Value
Maximum Value
0.8866 Primary Care Physician 0.00 0.8830 0.8886 0.00 1.0000
Number Busy Maximum Average
Minimum Average Half Width Average
Minimum Value
Maximum Value
4.9891 Primary Care Physician 0.00 4.9394 5.0328 0.00 8.0000
Number Scheduled Maximum Average
Minimum Average Half Width Average
Minimum Value
Maximum Value
4.7607 Primary Care Physician 0.00 4.7267 4.8019 0.00 8.0000
Scheduled Utilization Maximum Average
Minimum Average Half Width Average
Primary Care Physician 0.00 1.0480 1.0560 1.0391
Total Number Seized Maximum Average
Minimum Average Half Width Average
Primary Care Physician 3.03 1375.84 1413.00 1345.00
Model Filename: Page of 4 4 C:\Users\cedanko\Documents\Scenario_2

86
Scenario 3: The addition of two examination rooms
Scenario 3 - Linear Programming Model Output (Schedule)

87
Scenario 3 - Linear Programming Model Results (Throughput)
The linear programming results for Scenario 3 are precisely the same as the results for Scenario 2. For this reason, a
simulation model report was not created. These scenarios output identical provider schedules because of the constraints
placed on each provider for administrative and triage time; that is, the addition of 2 additional exam rooms does not
increase throughput more than the addition of 1 room because there are not sufficient providers available to use the rooms
given other scheduling constraints.

88
Scenario 4: Increase of 5% more new patients, 5% less established patients
Scenario 4 - Linear Programming Model Output (Schedule)

89
Scenario 4 - Linear Programming Model Results (Throughput)

90
Category Overview 2:02:28PM February 23, 2011
Scenario Four: Increase of 5% more new patients, 5% less established patients
Time Units: Replications: 100 Hours
Values Across All Replications
Key Performance Indicators
Average System
Number Out 1,323
Model Filename: Page of 1 4 C:\Users\cedanko\Documents\Scenario 4 old

91
Category Overview 2:02:28PM February 23, 2011
Scenario Four: Increase of 5% more new patients, 5% less established patients
Time Units: Replications: 100 Hours
Values Across All Replications
Entity
Time
VA Time Maximum Average
Minimum Average Half Width Average
Minimum Value
Maximum Value
0.5000 Established Patient 0.00 0.5000 0.5000 0.5000 0.5000
1.0000 New Patient 0.00 1.0000 1.0000 1.0000 1.0000
0.08333333 Phone Consult Patient 0.00 0.08333333 0.08333333 0.08333333 0.08333333
NVA Time Maximum Average
Minimum Average Half Width Average
Minimum Value
Maximum Value
0.00 Established Patient 0.00 0.00 0.00 0.00 0.00
0.00 New Patient 0.00 0.00 0.00 0.00 0.00
0.00 Phone Consult Patient 0.00 0.00 0.00 0.00 0.00
Wait Time Maximum Average
Minimum Average Half Width Average
Minimum Value
Maximum Value
81.0331 Established Patient 0.37 76.0020 84.7835 0.00 157.65
80.9782 New Patient 0.22 78.5819 83.5663 0.00 157.22
81.0060 Phone Consult Patient 1.20 68.2563 95.7207 0.00 157.92
Transfer Time Maximum Average
Minimum Average Half Width Average
Minimum Value
Maximum Value
0.06666667 Established Patient 0.00 0.06666667 0.06666667 0.06666667 0.06666667
0.06666667 New Patient 0.00 0.06666667 0.06666667 0.06666667 0.06666667
0.06666667 Phone Consult Patient 0.00 0.06666667 0.06666667 0.06666667 0.06666667
Other Time Maximum Average
Minimum Average Half Width Average
Minimum Value
Maximum Value
0.00 Established Patient 0.00 0.00 0.00 0.00 0.00
0.00 New Patient 0.00 0.00 0.00 0.00 0.00
0.00 Phone Consult Patient 0.00 0.00 0.00 0.00 0.00
Total Time Maximum Average
Minimum Average Half Width Average
Minimum Value
Maximum Value
81.5998 Established Patient 0.37 76.5687 85.3502 0.5667 158.22
82.0448 New Patient 0.22 79.6486 84.6329 1.0667 158.28
81.1560 Phone Consult Patient 1.20 68.4063 95.8707 0.1500 158.07
Other
Model Filename: Page of 2 4 C:\Users\cedanko\Documents\Scenario 4 old

92
Category Overview 2:02:28PM February 23, 2011
Scenario Four: Increase of 5% more new patients, 5% less established patients
Time Units: Replications: 100 Hours
Values Across All Replications
Entity
Other
Number In Maximum Average
Minimum Average Half Width Average
Entity 1 0.00 10800.00 10800.00 10800.00
Established Patient 9.20 5944.54 6068.00 5814.00
New Patient 9.13 4316.56 4440.00 4211.00
Phone Consult Patient 4.18 538.90 599.00 484.00
Number Out Maximum Average
Minimum Average Half Width Average
Entity 1 0.00 10800.00 10800.00 10800.00
Established Patient 4.62 729.34 791.00 659.00
New Patient 2.49 527.45 558.00 495.00
Phone Consult Patient 1.84 66.7000 87.0000 45.0000
WIP Maximum Average
Minimum Average Half Width Average
Minimum Value
Maximum Value
0.00 Entity 1 0.00 0.00 0.00 0.00 1.0000
2619.16 Established Patient 5.27 2550.44 2682.25 0.00 5324.00
1903.58 New Patient 5.11 1848.34 1971.39 0.00 3885.00
236.42 Phone Consult Patient 1.97 210.06 264.30 0.00 522.00
Model Filename: Page of 3 4 C:\Users\cedanko\Documents\Scenario 4 old

93
Category Overview 2:02:28PM February 23, 2011
Scenario Four: Increase of 5% more new patients, 5% less established patients
Time Units: Replications: 100 Hours
Values Across All Replications
Queue
Time
Waiting Time Maximum Average
Minimum Average Half Width Average
Minimum Value
Maximum Value
81.1507 Established Patient Visit.Queue 0.37 76.1120 84.9854 0.00 158.15
81.2167 New Patient Visit.Queue 0.21 78.5819 83.5663 0.00 158.20
81.0458 Phone Consult.Queue 1.20 68.2563 95.7207 0.00 157.95
Other
Number Waiting Maximum Average
Minimum Average Half Width Average
Minimum Value
Maximum Value
2615.90 Established Patient Visit.Queue 5.27 2547.41 2679.00 0.00 5323.00
1899.74 New Patient Visit.Queue 5.10 1844.64 1967.37 0.00 3883.00
236.28 Phone Consult.Queue 1.97 209.94 264.15 0.00 522.00
Resource
Usage
Instantaneous Utilization Maximum Average
Minimum Average Half Width Average
Minimum Value
Maximum Value
0.8872 Primary Care Physician 0.00 0.8830 0.8886 0.00 1.0000
Number Busy Maximum Average
Minimum Average Half Width Average
Minimum Value
Maximum Value
4.9937 Primary Care Physician 0.00 4.9458 5.0338 0.00 8.0000
Number Scheduled Maximum Average
Minimum Average Half Width Average
Minimum Value
Maximum Value
4.7565 Primary Care Physician 0.00 4.7204 4.7963 0.00 8.0000
Scheduled Utilization Maximum Average
Minimum Average Half Width Average
Primary Care Physician 0.00 1.0499 1.0621 1.0372
Total Number Seized Maximum Average
Minimum Average Half Width Average
Primary Care Physician 2.67 1326.30 1360.00 1300.00
Model Filename: Page of 4 4 C:\Users\cedanko\Documents\Scenario 4 old

94
Scenario 5: Increase of 10% more new patients, 10% less established patients
Scenario 5 - Linear Programming Model Output (Schedule)
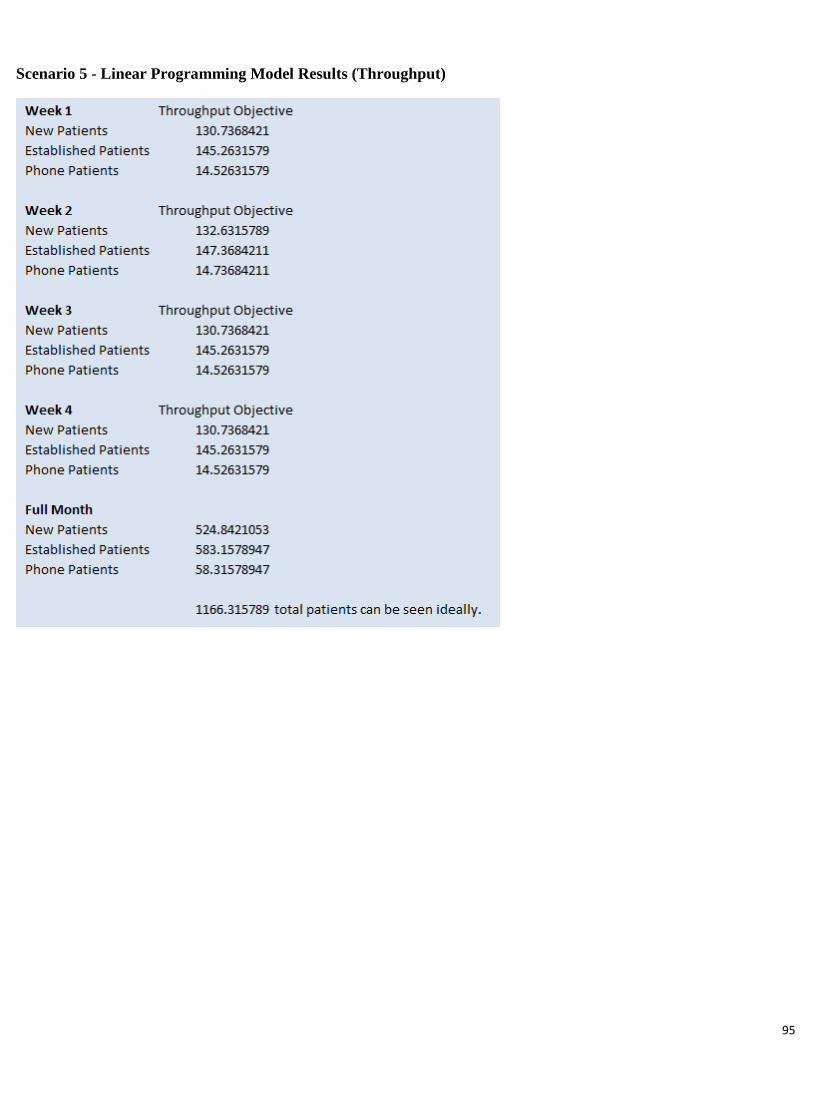
95
Scenario 5 - Linear Programming Model Results (Throughput)

96
Category Overview 12:16:43PM February 23, 2011
Scenario Five: Increase of 10% more new patients, 10% less established patients
Time Units: Replications: 100 Hours
Values Across All Replications
Key Performance Indicators
Average System
Number Out 1,107
Model Filename: Page of 1 4 C:\Users\cedanko\AppData\Local\Microsoft\Windows\Temporary Internet Files\Content.IE5\XU2SLP21\Scenario_5[2]

97
Category Overview 12:16:43PM February 23, 2011
Scenario Five: Increase of 10% more new patients, 10% less established patients
Time Units: Replications: 100 Hours
Values Across All Replications
Entity
Time
VA Time Maximum Average
Minimum Average Half Width Average
Minimum Value
Maximum Value
0.5000 Established Patient 0.00 0.5000 0.5000 0.5000 0.5000
1.0000 New Patient 0.00 1.0000 1.0000 1.0000 1.0000
0.08333333 Phone Consult Patient 0.00 0.08333333 0.08333333 0.08333333 0.08333333
NVA Time Maximum Average
Minimum Average Half Width Average
Minimum Value
Maximum Value
0.00 Established Patient 0.00 0.00 0.00 0.00 0.00
0.00 New Patient 0.00 0.00 0.00 0.00 0.00
0.00 Phone Consult Patient 0.00 0.00 0.00 0.00 0.00
Wait Time Maximum Average
Minimum Average Half Width Average
Minimum Value
Maximum Value
72.4267 Established Patient 0.33 67.4025 75.9062 0.00 141.32
72.1084 New Patient 0.19 69.6586 75.5827 0.00 140.90
72.0981 Phone Consult Patient 1.17 59.0170 87.2524 0.00 141.52
Transfer Time Maximum Average
Minimum Average Half Width Average
Minimum Value
Maximum Value
0.06666667 Established Patient 0.00 0.06666667 0.06666667 0.06666667 0.06666667
0.06666667 New Patient 0.00 0.06666667 0.06666667 0.06666667 0.06666667
0.06666667 Phone Consult Patient 0.00 0.06666667 0.06666667 0.06666667 0.06666667
Other Time Maximum Average
Minimum Average Half Width Average
Minimum Value
Maximum Value
0.00 Established Patient 0.00 0.00 0.00 0.00 0.00
0.00 New Patient 0.00 0.00 0.00 0.00 0.00
0.00 Phone Consult Patient 0.00 0.00 0.00 0.00 0.00
Total Time Maximum Average
Minimum Average Half Width Average
Minimum Value
Maximum Value
72.9934 Established Patient 0.33 67.9692 76.4728 0.5667 141.88
73.1751 New Patient 0.19 70.7252 76.6494 1.0667 141.97
72.2481 Phone Consult Patient 1.17 59.1670 87.4024 0.1500 141.67
Other
Model Filename: Page of 2 4 C:\Users\cedanko\AppData\Local\Microsoft\Windows\Temporary Internet Files\Content.IE5\XU2SLP21\Scenario_5[2]

98
Category Overview 12:16:43PM February 23, 2011
Scenario Five: Increase of 10% more new patients, 10% less established patients
Time Units: Replications: 100 Hours
Values Across All Replications
Entity
Other
Number In Maximum Average
Minimum Average Half Width Average
Entity 1 0.00 9600.00 9600.00 9600.00
Established Patient 9.57 4804.35 4925.00 4662.00
New Patient 9.24 4317.77 4444.00 4219.00
Phone Consult Patient 3.57 477.88 525.00 429.00
Number Out Maximum Average
Minimum Average Half Width Average
Entity 1 0.00 9600.00 9600.00 9600.00
Established Patient 4.27 555.73 604.00 504.00
New Patient 2.30 495.90 520.00 468.00
Phone Consult Patient 1.70 55.7800 73.0000 36.0000
WIP Maximum Average
Minimum Average Half Width Average
Minimum Value
Maximum Value
0.00 Entity 1 0.00 0.00 0.00 0.00 1.0000
2133.19 Established Patient 4.95 2072.36 2195.70 0.00 4359.00
1917.59 New Patient 4.97 1860.52 1974.65 0.00 3936.00
211.66 Phone Consult Patient 1.89 186.85 238.85 0.00 470.00
Model Filename: Page of 3 4 C:\Users\cedanko\AppData\Local\Microsoft\Windows\Temporary Internet Files\Content.IE5\XU2SLP21\Scenario_5[2]

99
Category Overview 12:16:43PM February 23, 2011
Scenario Five: Increase of 10% more new patients, 10% less established patients
Time Units: Replications: 100 Hours
Values Across All Replications
Queue
Time
Waiting Time Maximum Average
Minimum Average Half Width Average
Minimum Value
Maximum Value
72.6964 Established Patient Visit.Queue 0.33 67.6673 76.4342 0.00 141.82
72.6684 New Patient Visit.Queue 0.18 70.3821 76.1079 0.00 141.78
72.1408 Phone Consult.Queue 1.18 59.0170 87.2524 0.00 141.52
Other
Number Waiting Maximum Average
Minimum Average Half Width Average
Minimum Value
Maximum Value
2130.33 Established Patient Visit.Queue 4.95 2069.66 2192.82 0.00 4359.00
1913.47 New Patient Visit.Queue 4.97 1856.45 1970.42 0.00 3930.00
211.52 Phone Consult.Queue 1.89 186.73 238.71 0.00 470.00
Resource
Usage
Instantaneous Utilization Maximum Average
Minimum Average Half Width Average
Minimum Value
Maximum Value
0.8871 Primary Care Physician 0.00 0.8871 0.8871 0.00 1.0000
Number Busy Maximum Average
Minimum Average Half Width Average
Minimum Value
Maximum Value
4.8821 Primary Care Physician 0.01 4.8164 4.9718 0.00 8.0000
Number Scheduled Maximum Average
Minimum Average Half Width Average
Minimum Value
Maximum Value
4.6434 Primary Care Physician 0.01 4.5750 4.7292 0.00 8.0000
Scheduled Utilization Maximum Average
Minimum Average Half Width Average
Primary Care Physician 0.00 1.0514 1.0665 1.0394
Total Number Seized Maximum Average
Minimum Average Half Width Average
Primary Care Physician 2.71 1113.70 1147.00 1086.00
Model Filename: Page of 4 4 C:\Users\cedanko\AppData\Local\Microsoft\Windows\Temporary Internet Files\Content.IE5\XU2SLP21\Scenario_5[2]

100
Scenario 6: The addition of a full-staffed Saturday AM block
This model could not be run in the linear programming model given the addition of the new day period. For this reason,
there are no linear programming results to compare to for model verification. The schedule for this scenario was based off
the “Base Model” schedule – a four hour Saturday block was added for all providers. All providers is defined by the 8
current providers at the Worcester CBOC.
Scenario 6 - Linear Programming Model Output (Schedule) – n/a
Scenario 6 - Linear Programming Model Results (Throughput) – n/a

101
Category Overview 4:43:19PM February 24, 2011
Scenario Six – Addition of an AM clinic for 4 providers
Time Units: Replications: 100 Hours
Values Across All Replications
Key Performance Indicators
Average System
Number Out 96
Model Filename: Page of 1 4 C:\Users\cedanko\Desktop\Scenario_6 v2
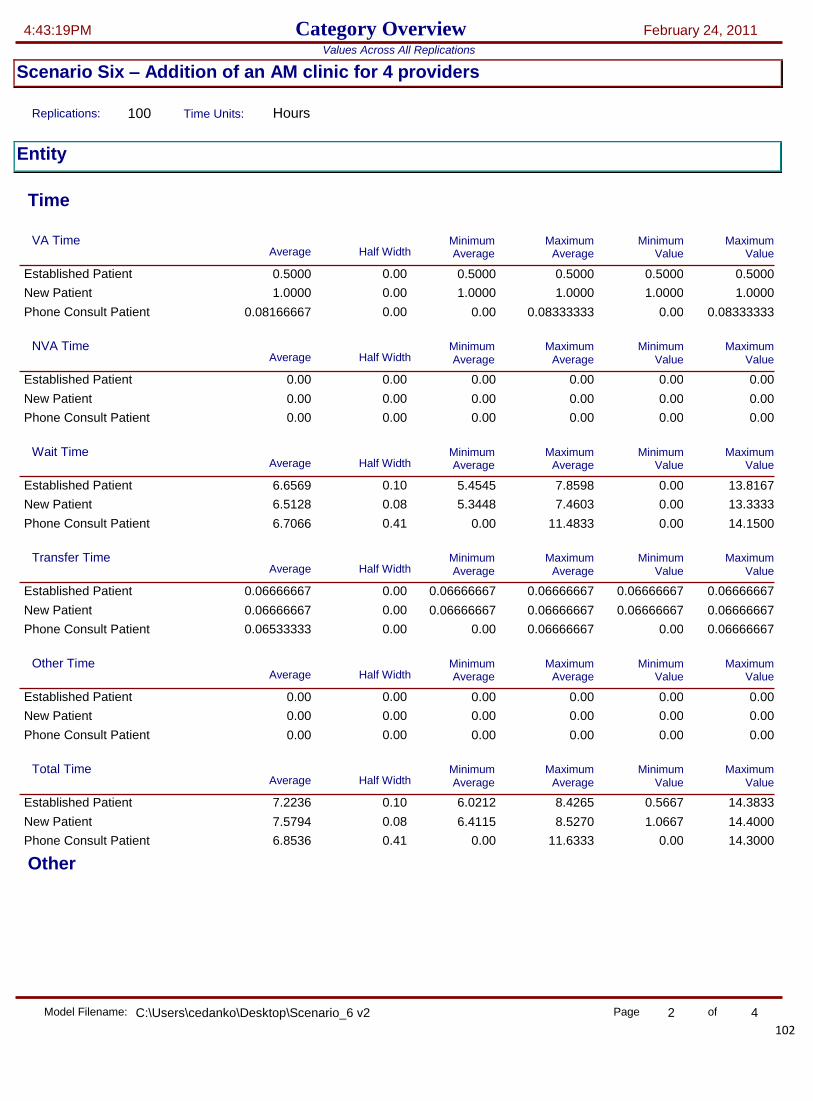
102
Category Overview 4:43:19PM February 24, 2011
Scenario Six – Addition of an AM clinic for 4 providers
Time Units: Replications: 100 Hours
Values Across All Replications
Entity
Time
VA Time Maximum Average
Minimum Average Half Width Average
Minimum Value
Maximum Value
0.5000 Established Patient 0.00 0.5000 0.5000 0.5000 0.5000
1.0000 New Patient 0.00 1.0000 1.0000 1.0000 1.0000
0.08166667 Phone Consult Patient 0.00 0.00 0.08333333 0.00 0.08333333
NVA Time Maximum Average
Minimum Average Half Width Average
Minimum Value
Maximum Value
0.00 Established Patient 0.00 0.00 0.00 0.00 0.00
0.00 New Patient 0.00 0.00 0.00 0.00 0.00
0.00 Phone Consult Patient 0.00 0.00 0.00 0.00 0.00
Wait Time Maximum Average
Minimum Average Half Width Average
Minimum Value
Maximum Value
6.6569 Established Patient 0.10 5.4545 7.8598 0.00 13.8167
6.5128 New Patient 0.08 5.3448 7.4603 0.00 13.3333
6.7066 Phone Consult Patient 0.41 0.00 11.4833 0.00 14.1500
Transfer Time Maximum Average
Minimum Average Half Width Average
Minimum Value
Maximum Value
0.06666667 Established Patient 0.00 0.06666667 0.06666667 0.06666667 0.06666667
0.06666667 New Patient 0.00 0.06666667 0.06666667 0.06666667 0.06666667
0.06533333 Phone Consult Patient 0.00 0.00 0.06666667 0.00 0.06666667
Other Time Maximum Average
Minimum Average Half Width Average
Minimum Value
Maximum Value
0.00 Established Patient 0.00 0.00 0.00 0.00 0.00
0.00 New Patient 0.00 0.00 0.00 0.00 0.00
0.00 Phone Consult Patient 0.00 0.00 0.00 0.00 0.00
Total Time Maximum Average
Minimum Average Half Width Average
Minimum Value
Maximum Value
7.2236 Established Patient 0.10 6.0212 8.4265 0.5667 14.3833
7.5794 New Patient 0.08 6.4115 8.5270 1.0667 14.4000
6.8536 Phone Consult Patient 0.41 0.00 11.6333 0.00 14.3000
Other
Model Filename: Page of 2 4 C:\Users\cedanko\Desktop\Scenario_6 v2

103
Category Overview 4:43:19PM February 24, 2011
Scenario Six – Addition of an AM clinic for 4 providers
Time Units: Replications: 100 Hours
Values Across All Replications
Entity
Other
Number In Maximum Average
Minimum Average Half Width Average
Entity 1 0.00 960.00 960.00 960.00
Established Patient 3.21 577.60 611.00 533.00
New Patient 3.06 334.72 378.00 301.00
Phone Consult Patient 1.41 47.6800 67.0000 33.0000
Number Out Maximum Average
Minimum Average Half Width Average
Entity 1 0.00 960.00 960.00 960.00
Established Patient 1.42 57.5300 75.0000 42.0000
New Patient 0.70 32.6200 40.0000 23.0000
Phone Consult Patient 0.46 5.4400 11.0000 0.00
WIP Maximum Average
Minimum Average Half Width Average
Minimum Value
Maximum Value
0.00 Entity 1 0.00 0.00 0.00 0.00 1.0000
259.76 Established Patient 1.66 238.20 279.20 0.00 555.00
152.15 New Patient 1.66 131.21 174.79 0.00 340.00
21.5877 Phone Consult Patient 0.72 14.2625 31.1208 0.00 57.0000
Model Filename: Page of 3 4 C:\Users\cedanko\Desktop\Scenario_6 v2

104
Category Overview 4:43:19PM February 24, 2011
Scenario Six – Addition of an AM clinic for 4 providers
Time Units: Replications: 100 Hours
Values Across All Replications
Queue
Time
Waiting Time Maximum Average
Minimum Average Half Width Average
Minimum Value
Maximum Value
6.8662 Established Patient Visit.Queue 0.10 5.5241 8.2069 0.00 14.2167
6.9920 New Patient Visit.Queue 0.09 5.3448 8.0083 0.00 14.3167
6.7066 Phone Consult.Queue 0.41 0.00 11.4833 0.00 14.1500
Other
Number Waiting Maximum Average
Minimum Average Half Width Average
Minimum Value
Maximum Value
256.61 Established Patient Visit.Queue 1.65 234.99 275.60 0.00 554.00
149.26 New Patient Visit.Queue 1.64 128.18 171.95 0.00 337.00
21.4487 Phone Consult.Queue 0.72 14.1635 30.9083 0.00 57.0000
Resource
Usage
Instantaneous Utilization Maximum Average
Minimum Average Half Width Average
Minimum Value
Maximum Value
0.9964 Primary Care Physician 0.00 0.9964 0.9964 0.00 1.0000
Number Busy Maximum Average
Minimum Average Half Width Average
Minimum Value
Maximum Value
3.9854 Primary Care Physician 0.00 3.9854 3.9854 0.00 4.0000
Number Scheduled Maximum Average
Minimum Average Half Width Average
Minimum Value
Maximum Value
4.0000 Primary Care Physician 0.00 4.0000 4.0000 4.0000 4.0000
Scheduled Utilization Maximum Average
Minimum Average Half Width Average
Primary Care Physician 0.00 0.9964 0.9964 0.9964
Total Number Seized Maximum Average
Minimum Average Half Width Average
Primary Care Physician 0.85 99.60 108.00 91.0000
Model Filename: Page of 4 4 C:\Users\cedanko\Desktop\Scenario_6 v2

105
Scenario 7: The addition of a Saturday AM block for 4 providers
This model could not be run in the linear programming model given the addition of the new day period. For this reason,
there are no linear programming results to compare to for model verification. The schedule for this scenario was based off
the “Base Model” schedule – a four hour Saturday block was added for 4 providers, or half of the current total providers
available at the Worcester CBOC.
Scenario 7 - Linear Programming Model Output (Schedule) – n/a
Scenario 7 - Linear Programming Model Results (Throughput) – n/a
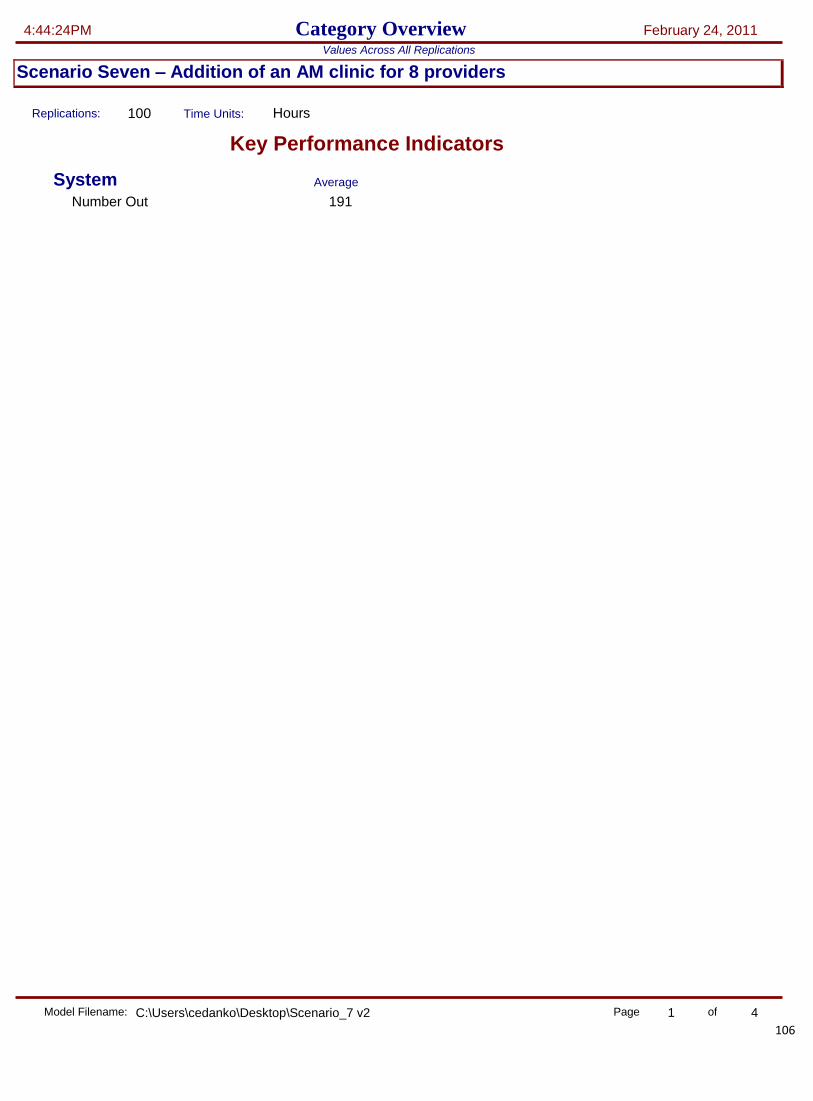
106
Category Overview 4:44:24PM February 24, 2011
Scenario Seven – Addition of an AM clinic for 8 providers
Time Units: Replications: 100 Hours
Values Across All Replications
Key Performance Indicators
Average System
Number Out 191
Model Filename: Page of 1 4 C:\Users\cedanko\Desktop\Scenario_7 v2

107
Category Overview 4:44:24PM February 24, 2011
Scenario Seven – Addition of an AM clinic for 8 providers
Time Units: Replications: 100 Hours
Values Across All Replications
Entity
Time
VA Time Maximum Average
Minimum Average Half Width Average
Minimum Value
Maximum Value
0.5000 Established Patient 0.00 0.5000 0.5000 0.5000 0.5000
1.0000 New Patient 0.00 1.0000 1.0000 1.0000 1.0000
0.08333333 Phone Consult Patient 0.00 0.08333333 0.08333333 0.08333333 0.08333333
NVA Time Maximum Average
Minimum Average Half Width Average
Minimum Value
Maximum Value
0.00 Established Patient 0.00 0.00 0.00 0.00 0.00
0.00 New Patient 0.00 0.00 0.00 0.00 0.00
0.00 Phone Consult Patient 0.00 0.00 0.00 0.00 0.00
Wait Time Maximum Average
Minimum Average Half Width Average
Minimum Value
Maximum Value
5.9655 Established Patient 0.07 5.0218 6.9269 0.00 12.3000
5.7265 New Patient 0.05 5.0068 6.5048 0.00 11.8667
5.9997 Phone Consult Patient 0.26 2.8233 10.8333 0.00 12.5667
Transfer Time Maximum Average
Minimum Average Half Width Average
Minimum Value
Maximum Value
0.06666667 Established Patient 0.00 0.06666667 0.06666667 0.06666667 0.06666667
0.06666667 New Patient 0.00 0.06666667 0.06666667 0.06666667 0.06666667
0.06666667 Phone Consult Patient 0.00 0.06666667 0.06666667 0.06666667 0.06666667
Other Time Maximum Average
Minimum Average Half Width Average
Minimum Value
Maximum Value
0.00 Established Patient 0.00 0.00 0.00 0.00 0.00
0.00 New Patient 0.00 0.00 0.00 0.00 0.00
0.00 Phone Consult Patient 0.00 0.00 0.00 0.00 0.00
Total Time Maximum Average
Minimum Average Half Width Average
Minimum Value
Maximum Value
6.5322 Established Patient 0.07 5.5884 7.4936 0.5667 12.8667
6.7932 New Patient 0.05 6.0735 7.5714 1.0667 12.9333
6.1497 Phone Consult Patient 0.26 2.9733 10.9833 0.1500 12.7167
Other
Model Filename: Page of 2 4 C:\Users\cedanko\Desktop\Scenario_7 v2
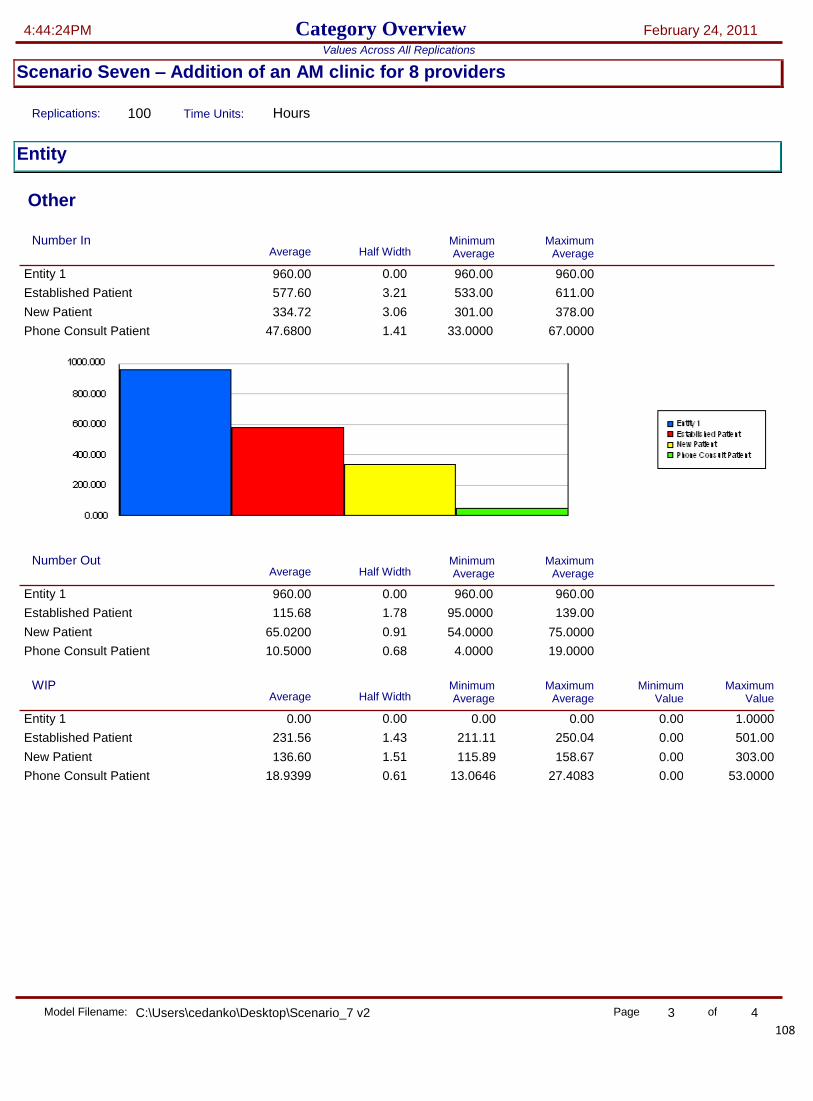
108
Category Overview 4:44:24PM February 24, 2011
Scenario Seven – Addition of an AM clinic for 8 providers
Time Units: Replications: 100 Hours
Values Across All Replications
Entity
Other
Number In Maximum Average
Minimum Average Half Width Average
Entity 1 0.00 960.00 960.00 960.00
Established Patient 3.21 577.60 611.00 533.00
New Patient 3.06 334.72 378.00 301.00
Phone Consult Patient 1.41 47.6800 67.0000 33.0000
Number Out Maximum Average
Minimum Average Half Width Average
Entity 1 0.00 960.00 960.00 960.00
Established Patient 1.78 115.68 139.00 95.0000
New Patient 0.91 65.0200 75.0000 54.0000
Phone Consult Patient 0.68 10.5000 19.0000 4.0000
WIP Maximum Average
Minimum Average Half Width Average
Minimum Value
Maximum Value
0.00 Entity 1 0.00 0.00 0.00 0.00 1.0000
231.56 Established Patient 1.43 211.11 250.04 0.00 501.00
136.60 New Patient 1.51 115.89 158.67 0.00 303.00
18.9399 Phone Consult Patient 0.61 13.0646 27.4083 0.00 53.0000
Model Filename: Page of 3 4 C:\Users\cedanko\Desktop\Scenario_7 v2

109
Category Overview 4:44:24PM February 24, 2011
Scenario Seven – Addition of an AM clinic for 8 providers
Time Units: Replications: 100 Hours
Values Across All Replications
Queue
Time
Waiting Time Maximum Average
Minimum Average Half Width Average
Minimum Value
Maximum Value
6.1615 Established Patient Visit.Queue 0.07 5.2616 7.0175 0.00 12.7000
6.1404 New Patient Visit.Queue 0.05 5.5303 6.7765 0.00 12.7000
5.9997 Phone Consult.Queue 0.26 2.8233 10.8333 0.00 12.5667
Other
Number Waiting Maximum Average
Minimum Average Half Width Average
Minimum Value
Maximum Value
226.43 Established Patient Visit.Queue 1.41 206.13 245.00 0.00 495.00
131.55 New Patient Visit.Queue 1.48 111.26 153.46 0.00 301.00
18.7641 Phone Consult.Queue 0.61 12.9312 27.1521 0.00 53.0000
Resource
Usage
Instantaneous Utilization Maximum Average
Minimum Average Half Width Average
Minimum Value
Maximum Value
0.9942 Primary Care Physician 0.00 0.9936 0.9943 0.00 1.0000
Number Busy Maximum Average
Minimum Average Half Width Average
Minimum Value
Maximum Value
7.9538 Primary Care Physician 0.00 7.9490 7.9542 0.00 8.0000
Number Scheduled Maximum Average
Minimum Average Half Width Average
Minimum Value
Maximum Value
8.0000 Primary Care Physician 0.00 8.0000 8.0000 8.0000 8.0000
Scheduled Utilization Maximum Average
Minimum Average Half Width Average
Primary Care Physician 0.00 0.9942 0.9943 0.9936
Total Number Seized Maximum Average
Minimum Average Half Width Average
Primary Care Physician 1.13 199.24 211.00 187.00
Model Filename: Page of 4 4 C:\Users\cedanko\Desktop\Scenario_7 v2

110
Scenario 8: The addition of a Saturday AM & PM block for 4 providers
This model could not be run in the linear programming model given the addition of the new day period. For this reason,
there are no linear programming results to compare to for model verification. The schedule for this scenario was based off
the “Base Model” schedule – two blocks (4 hour AM and 3 hour PM) blocks were added for 4 providers, or half of the
current total providers available at the Worcester CBOC.
Scenario 8 - Linear Programming Model Output (Schedule) – n/a
Scenario 8 - Linear Programming Model Results (Throughput) – n/a

111
Category Overview 4:36:26PM February 24, 2011
Scenario Eight: The addition of a Saturday AM & PM block for 4 providers
Time Units: Replications: 100 Hours
Values Across All Replications
Key Performance Indicators
Average System
Number Out 1,344
Model Filename: Page of 1 4 C:\Users\cedanko\AppData\Local\Microsoft\Windows\Temporary Internet Files\Content.IE5\UP4HVIB6\Scenario_8[1]

112
Category Overview 4:36:26PM February 24, 2011
Scenario Eight: The addition of a Saturday AM & PM block for 4 providers
Time Units: Replications: 100 Hours
Values Across All Replications
Entity
Time
VA Time Maximum Average
Minimum Average Half Width Average
Minimum Value
Maximum Value
0.5000 Established Patient 0.00 0.5000 0.5000 0.5000 0.5000
1.0000 New Patient 0.00 1.0000 1.0000 1.0000 1.0000
0.08333333 Phone Consult Patient 0.00 0.08333333 0.08333333 0.08333333 0.08333333
NVA Time Maximum Average
Minimum Average Half Width Average
Minimum Value
Maximum Value
0.00 Established Patient 0.00 0.00 0.00 0.00 0.00
0.00 New Patient 0.00 0.00 0.00 0.00 0.00
0.00 Phone Consult Patient 0.00 0.00 0.00 0.00 0.00
Wait Time Maximum Average
Minimum Average Half Width Average
Minimum Value
Maximum Value
86.6829 Established Patient 0.33 82.8414 91.2029 0.00 169.57
86.3567 New Patient 0.26 83.4775 89.8336 0.00 169.18
86.4651 Phone Consult Patient 1.27 72.2342 102.95 0.00 169.97
Transfer Time Maximum Average
Minimum Average Half Width Average
Minimum Value
Maximum Value
0.06666667 Established Patient 0.00 0.06666667 0.06666667 0.06666667 0.06666667
0.06666667 New Patient 0.00 0.06666667 0.06666667 0.06666667 0.06666667
0.06666667 Phone Consult Patient 0.00 0.06666667 0.06666667 0.06666667 0.06666667
Other Time Maximum Average
Minimum Average Half Width Average
Minimum Value
Maximum Value
0.00 Established Patient 0.00 0.00 0.00 0.00 0.00
0.00 New Patient 0.00 0.00 0.00 0.00 0.00
0.00 Phone Consult Patient 0.00 0.00 0.00 0.00 0.00
Total Time Maximum Average
Minimum Average Half Width Average
Minimum Value
Maximum Value
87.2495 Established Patient 0.33 83.4081 91.7696 0.5667 170.13
87.4234 New Patient 0.26 84.5441 90.9002 1.0667 170.25
86.6151 Phone Consult Patient 1.27 72.3842 103.10 0.1500 170.12
Other
Model Filename: Page of 2 4 C:\Users\cedanko\AppData\Local\Microsoft\Windows\Temporary Internet Files\Content.IE5\UP4HVIB6\Scenario_8[1]

113
Category Overview 4:36:26PM February 24, 2011
Scenario Eight: The addition of a Saturday AM & PM block for 4 providers
Time Units: Replications: 100 Hours
Values Across All Replications
Entity
Other
Number In Maximum Average
Minimum Average Half Width Average
Entity 1 0.00 11520.00 11520.00 11520.00
Established Patient 10.04 6920.63 7022.00 6801.00
New Patient 9.72 4025.22 4140.00 3903.00
Phone Consult Patient 4.37 574.15 632.00 522.00
Number Out Maximum Average
Minimum Average Half Width Average
Entity 1 0.00 11520.00 11520.00 11520.00
Established Patient 5.12 808.97 872.00 733.00
New Patient 2.59 467.52 504.00 434.00
Phone Consult Patient 1.88 67.6700 89.0000 46.0000
WIP Maximum Average
Minimum Average Half Width Average
Minimum Value
Maximum Value
0.00 Entity 1 0.00 0.00 0.00 0.00 1.0000
3067.04 Established Patient 5.37 3002.84 3120.74 0.00 6216.00
1784.92 New Patient 5.24 1729.71 1856.38 0.00 3671.00
253.73 Phone Consult Patient 2.06 225.70 281.10 0.00 557.00
Model Filename: Page of 3 4 C:\Users\cedanko\AppData\Local\Microsoft\Windows\Temporary Internet Files\Content.IE5\UP4HVIB6\Scenario_8[1]

114
Category Overview 4:36:26PM February 24, 2011
Scenario Eight: The addition of a Saturday AM & PM block for 4 providers
Time Units: Replications: 100 Hours
Values Across All Replications
Queue
Time
Waiting Time Maximum Average
Minimum Average Half Width Average
Minimum Value
Maximum Value
86.8978 Established Patient Visit.Queue 0.33 82.8414 91.2029 0.00 170.02
86.7788 New Patient Visit.Queue 0.26 84.0066 89.8336 0.00 170.00
86.5016 Phone Consult.Queue 1.27 72.2342 102.95 0.00 169.97
Other
Number Waiting Maximum Average
Minimum Average Half Width Average
Minimum Value
Maximum Value
3063.59 Established Patient Visit.Queue 5.37 2999.62 3117.34 0.00 6212.00
1781.70 New Patient Visit.Queue 5.24 1726.59 1852.95 0.00 3669.00
253.59 Phone Consult.Queue 2.06 225.57 280.96 0.00 557.00
Resource
Usage
Instantaneous Utilization Maximum Average
Minimum Average Half Width Average
Minimum Value
Maximum Value
0.8987 Primary Care Physician 0.00 0.8955 0.9007 0.00 1.0000
Number Busy Maximum Average
Minimum Average Half Width Average
Minimum Value
Maximum Value
4.5799 Primary Care Physician 0.00 4.5217 4.6352 0.00 8.0000
Number Scheduled Maximum Average
Minimum Average Half Width Average
Minimum Value
Maximum Value
4.3933 Primary Care Physician 0.00 4.3086 4.4595 0.00 8.0000
Scheduled Utilization Maximum Average
Minimum Average Half Width Average
Primary Care Physician 0.00 1.0425 1.0521 1.0311
Total Number Seized Maximum Average
Minimum Average Half Width Average
Primary Care Physician 3.16 1348.71 1385.00 1308.00
Model Filename: Page of 4 4 C:\Users\cedanko\AppData\Local\Microsoft\Windows\Temporary Internet Files\Content.IE5\UP4HVIB6\Scenario_8[1]

115
Scenario 9: The addition of a full-staffed*** Saturday AM & PM block
This model could not be run in the linear programming model given the addition of the new day period. For this reason,
there are no linear programming results to compare to for model verification. The schedule for this scenario was based off
the “Base Model” schedule – two blocks (4 hour AM and 3 hour PM) blocks were added for 8 providers, or all of the
current total providers available at the Worcester CBOC.
Scenario 9 - Linear Programming Model Output (Schedule) – n/a
Scenario 9 - Linear Programming Model Results (Throughput) – n/a
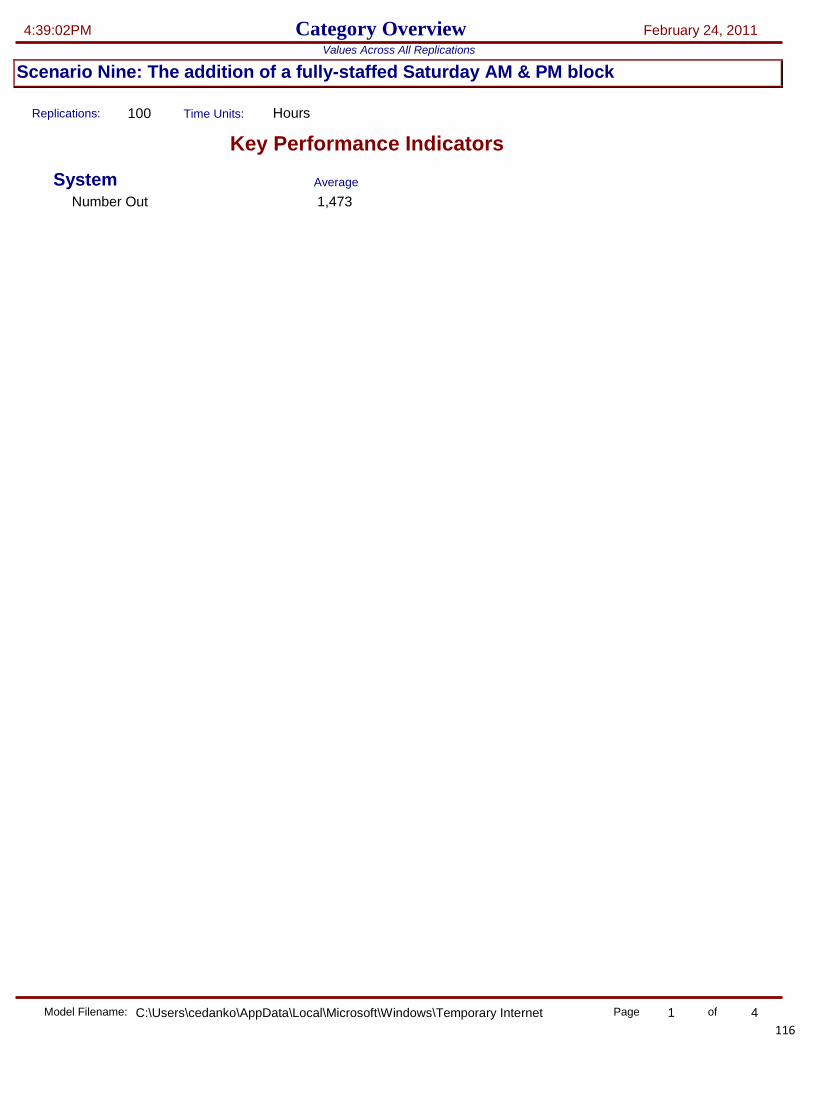
116
Category Overview 4:39:02PM February 24, 2011
Scenario Nine: The addition of a fully-staffed Saturday AM & PM block
Time Units: Replications: 100 Hours
Values Across All Replications
Key Performance Indicators
Average System
Number Out 1,473
Model Filename: Page of 1 4 C:\Users\cedanko\AppData\Local\Microsoft\Windows\Temporary Internet Files\Content.IE5\XU2SLP21\Scenario_9[1]

117
Category Overview 4:39:02PM February 24, 2011
Scenario Nine: The addition of a fully-staffed Saturday AM & PM block
Time Units: Replications: 100 Hours
Values Across All Replications
Entity
Time
VA Time Maximum Average
Minimum Average Half Width Average
Minimum Value
Maximum Value
0.5000 Established Patient 0.00 0.5000 0.5000 0.5000 0.5000
1.0000 New Patient 0.00 1.0000 1.0000 1.0000 1.0000
0.08333333 Phone Consult Patient 0.00 0.08333333 0.08333333 0.08333333 0.08333333
NVA Time Maximum Average
Minimum Average Half Width Average
Minimum Value
Maximum Value
0.00 Established Patient 0.00 0.00 0.00 0.00 0.00
0.00 New Patient 0.00 0.00 0.00 0.00 0.00
0.00 Phone Consult Patient 0.00 0.00 0.00 0.00 0.00
Wait Time Maximum Average
Minimum Average Half Width Average
Minimum Value
Maximum Value
85.6023 Established Patient 0.30 81.5193 90.1551 0.00 167.27
85.2457 New Patient 0.23 82.0465 88.7006 0.00 166.88
85.4815 Phone Consult Patient 1.24 71.2015 101.90 0.00 167.25
Transfer Time Maximum Average
Minimum Average Half Width Average
Minimum Value
Maximum Value
0.06666667 Established Patient 0.00 0.06666667 0.06666667 0.06666667 0.06666667
0.06666667 New Patient 0.00 0.06666667 0.06666667 0.06666667 0.06666667
0.06666667 Phone Consult Patient 0.00 0.06666667 0.06666667 0.06666667 0.06666667
Other Time Maximum Average
Minimum Average Half Width Average
Minimum Value
Maximum Value
0.00 Established Patient 0.00 0.00 0.00 0.00 0.00
0.00 New Patient 0.00 0.00 0.00 0.00 0.00
0.00 Phone Consult Patient 0.00 0.00 0.00 0.00 0.00
Total Time Maximum Average
Minimum Average Half Width Average
Minimum Value
Maximum Value
86.1690 Established Patient 0.30 82.0860 90.7217 0.5667 167.83
86.3124 New Patient 0.23 83.1132 89.7672 1.0667 167.95
85.6315 Phone Consult Patient 1.24 71.3515 102.05 0.1500 167.40
Other
Model Filename: Page of 2 4 C:\Users\cedanko\AppData\Local\Microsoft\Windows\Temporary Internet Files\Content.IE5\XU2SLP21\Scenario_9[1]

118
Category Overview 4:39:02PM February 24, 2011
Scenario Nine: The addition of a fully-staffed Saturday AM & PM block
Time Units: Replications: 100 Hours
Values Across All Replications
Entity
Other
Number In Maximum Average
Minimum Average Half Width Average
Entity 1 0.00 11520.00 11520.00 11520.00
Established Patient 10.04 6920.63 7022.00 6801.00
New Patient 9.72 4025.22 4140.00 3903.00
Phone Consult Patient 4.37 574.15 632.00 522.00
Number Out Maximum Average
Minimum Average Half Width Average
Entity 1 0.00 11520.00 11520.00 11520.00
Established Patient 5.30 886.97 951.00 803.00
New Patient 2.62 512.29 551.00 482.00
Phone Consult Patient 1.87 74.1900 96.0000 51.0000
WIP Maximum Average
Minimum Average Half Width Average
Minimum Value
Maximum Value
0.00 Entity 1 0.00 0.00 0.00 0.00 1.0000
3029.03 Established Patient 5.37 2968.11 3083.09 0.00 6141.00
1763.03 New Patient 5.16 1709.87 1832.11 0.00 3627.00
250.56 Phone Consult Patient 2.02 223.31 277.15 0.00 550.00
Model Filename: Page of 3 4 C:\Users\cedanko\AppData\Local\Microsoft\Windows\Temporary Internet Files\Content.IE5\XU2SLP21\Scenario_9[1]

119
Category Overview 4:39:02PM February 24, 2011
Scenario Nine: The addition of a fully-staffed Saturday AM & PM block
Time Units: Replications: 100 Hours
Values Across All Replications
Queue
Time
Waiting Time Maximum Average
Minimum Average Half Width Average
Minimum Value
Maximum Value
85.7970 Established Patient Visit.Queue 0.30 81.5193 90.5253 0.00 167.75
85.5924 New Patient Visit.Queue 0.24 82.5479 88.7006 0.00 167.70
85.5035 Phone Consult.Queue 1.23 71.2015 101.90 0.00 167.53
Other
Number Waiting Maximum Average
Minimum Average Half Width Average
Minimum Value
Maximum Value
3025.36 Established Patient Visit.Queue 5.36 2964.70 3079.48 0.00 6139.00
1759.57 New Patient Visit.Queue 5.16 1706.51 1828.41 0.00 3625.00
250.42 Phone Consult.Queue 2.02 223.18 277.00 0.00 550.00
Resource
Usage
Instantaneous Utilization Maximum Average
Minimum Average Half Width Average
Minimum Value
Maximum Value
0.8988 Primary Care Physician 0.00 0.8955 0.9007 0.00 1.0000
Number Busy Maximum Average
Minimum Average Half Width Average
Minimum Value
Maximum Value
5.0192 Primary Care Physician 0.00 4.9722 5.0564 0.00 8.0000
Number Scheduled Maximum Average
Minimum Average Half Width Average
Minimum Value
Maximum Value
4.8284 Primary Care Physician 0.00 4.7601 4.8945 0.00 8.0000
Scheduled Utilization Maximum Average
Minimum Average Half Width Average
Primary Care Physician 0.00 1.0395 1.0460 1.0318
Total Number Seized Maximum Average
Minimum Average Half Width Average
Primary Care Physician 3.12 1477.78 1515.00 1442.00
Model Filename: Page of 4 4 C:\Users\cedanko\AppData\Local\Microsoft\Windows\Temporary Internet Files\Content.IE5\XU2SLP21\Scenario_9[1]

120
Scenario 10: Increase the number of providers by 1 to 9 total providers
Scenario 1 - Linear Programming Model Output (Schedule)

121
Scenario 10 - Linear Programming Model Results (Throughput)

122
Category Overview 4:20:36PM February 24, 2011
Scenario Ten: The addition of one full-time provider
Time Units: Replications: 100 Hours
Values Across All Replications
Key Performance Indicators
Average System
Number Out 1,363
Model Filename: Page of 1 4 C:\Users\cedanko\Desktop\Scenario_10

123
Category Overview 4:20:36PM February 24, 2011
Scenario Ten: The addition of one full-time provider
Time Units: Replications: 100 Hours
Values Across All Replications
Entity
Time
VA Time Maximum Average
Minimum Average Half Width Average
Minimum Value
Maximum Value
0.5000 Established Patient 0.00 0.5000 0.5000 0.5000 0.5000
1.0000 New Patient 0.00 1.0000 1.0000 1.0000 1.0000
0.08333333 Phone Consult Patient 0.00 0.08333333 0.08333333 0.08333333 0.08333333
NVA Time Maximum Average
Minimum Average Half Width Average
Minimum Value
Maximum Value
0.00 Established Patient 0.00 0.00 0.00 0.00 0.00
0.00 New Patient 0.00 0.00 0.00 0.00 0.00
0.00 Phone Consult Patient 0.00 0.00 0.00 0.00 0.00
Wait Time Maximum Average
Minimum Average Half Width Average
Minimum Value
Maximum Value
69.5673 Established Patient 0.26 66.8013 72.7540 0.00 137.27
69.1697 New Patient 0.19 66.7741 72.0840 0.00 136.90
69.4263 Phone Consult Patient 1.02 59.0078 84.9589 0.00 137.48
Transfer Time Maximum Average
Minimum Average Half Width Average
Minimum Value
Maximum Value
0.06666667 Established Patient 0.00 0.06666667 0.06666667 0.06666667 0.06666667
0.06666667 New Patient 0.00 0.06666667 0.06666667 0.06666667 0.06666667
0.06666667 Phone Consult Patient 0.00 0.06666667 0.06666667 0.06666667 0.06666667
Other Time Maximum Average
Minimum Average Half Width Average
Minimum Value
Maximum Value
0.00 Established Patient 0.00 0.00 0.00 0.00 0.00
0.00 New Patient 0.00 0.00 0.00 0.00 0.00
0.00 Phone Consult Patient 0.00 0.00 0.00 0.00 0.00
Total Time Maximum Average
Minimum Average Half Width Average
Minimum Value
Maximum Value
70.1339 Established Patient 0.26 67.3680 73.3207 0.5667 137.83
70.2364 New Patient 0.19 67.8407 73.1506 1.0667 137.97
69.5763 Phone Consult Patient 1.02 59.1578 85.1089 0.1500 137.63
Other
Model Filename: Page of 2 4 C:\Users\cedanko\Desktop\Scenario_10

124
Category Overview 4:20:36PM February 24, 2011
Scenario Ten: The addition of one full-time provider
Time Units: Replications: 100 Hours
Values Across All Replications
Entity
Other
Number In Maximum Average
Minimum Average Half Width Average
Entity 1 0.00 9600.00 9600.00 9600.00
Established Patient 9.32 5767.46 5877.00 5634.00
New Patient 8.67 3354.66 3472.00 3268.00
Phone Consult Patient 3.57 477.88 525.00 429.00
Number Out Maximum Average
Minimum Average Half Width Average
Entity 1 0.00 9600.00 9600.00 9600.00
Established Patient 5.31 821.08 893.00 745.00
New Patient 2.64 473.51 513.00 438.00
Phone Consult Patient 1.87 68.7000 89.0000 47.0000
WIP Maximum Average
Minimum Average Half Width Average
Minimum Value
Maximum Value
0.00 Entity 1 0.00 0.00 0.00 0.00 1.0000
2481.97 Established Patient 4.93 2422.68 2538.43 0.00 5062.00
1444.53 New Patient 4.72 1392.11 1507.84 0.00 2973.00
205.07 Phone Consult Patient 1.83 181.79 231.59 0.00 453.00
Model Filename: Page of 3 4 C:\Users\cedanko\Desktop\Scenario_10

125
Category Overview 4:20:36PM February 24, 2011
Scenario Ten: The addition of one full-time provider
Time Units: Replications: 100 Hours
Values Across All Replications
Queue
Time
Waiting Time Maximum Average
Minimum Average Half Width Average
Minimum Value
Maximum Value
69.8830 Established Patient Visit.Queue 0.26 66.8851 73.1699 0.00 137.68
69.7832 New Patient Visit.Queue 0.20 67.5039 72.2186 0.00 137.65
69.4878 Phone Consult.Queue 1.04 59.0078 84.9589 0.00 137.68
Other
Number Waiting Maximum Average
Minimum Average Half Width Average
Minimum Value
Maximum Value
2478.02 Established Patient Visit.Queue 4.93 2419.02 2534.57 0.00 5055.00
1440.76 New Patient Visit.Queue 4.71 1388.45 1503.79 0.00 2968.00
204.93 Phone Consult.Queue 1.82 181.66 231.43 0.00 453.00
Resource
Usage
Instantaneous Utilization Maximum Average
Minimum Average Half Width Average
Minimum Value
Maximum Value
0.8871 Primary Care Physician 0.00 0.8871 0.8871 0.00 1.0000
Number Busy Maximum Average
Minimum Average Half Width Average
Minimum Value
Maximum Value
5.5827 Primary Care Physician 0.01 5.4875 5.6781 0.00 9.0000
Number Scheduled Maximum Average
Minimum Average Half Width Average
Minimum Value
Maximum Value
5.3371 Primary Care Physician 0.01 5.2146 5.4292 0.00 9.0000
Scheduled Utilization Maximum Average
Minimum Average Half Width Average
Primary Care Physician 0.00 1.0460 1.0614 1.0345
Total Number Seized Maximum Average
Minimum Average Half Width Average
Primary Care Physician 3.52 1371.56 1413.00 1337.00
Model Filename: Page of 4 4 C:\Users\cedanko\Desktop\Scenario_10

126
Scenario 11: Increase the number of providers by 2 to 10 total providers
Scenario 11 - Linear Programming Model Output (Schedule)
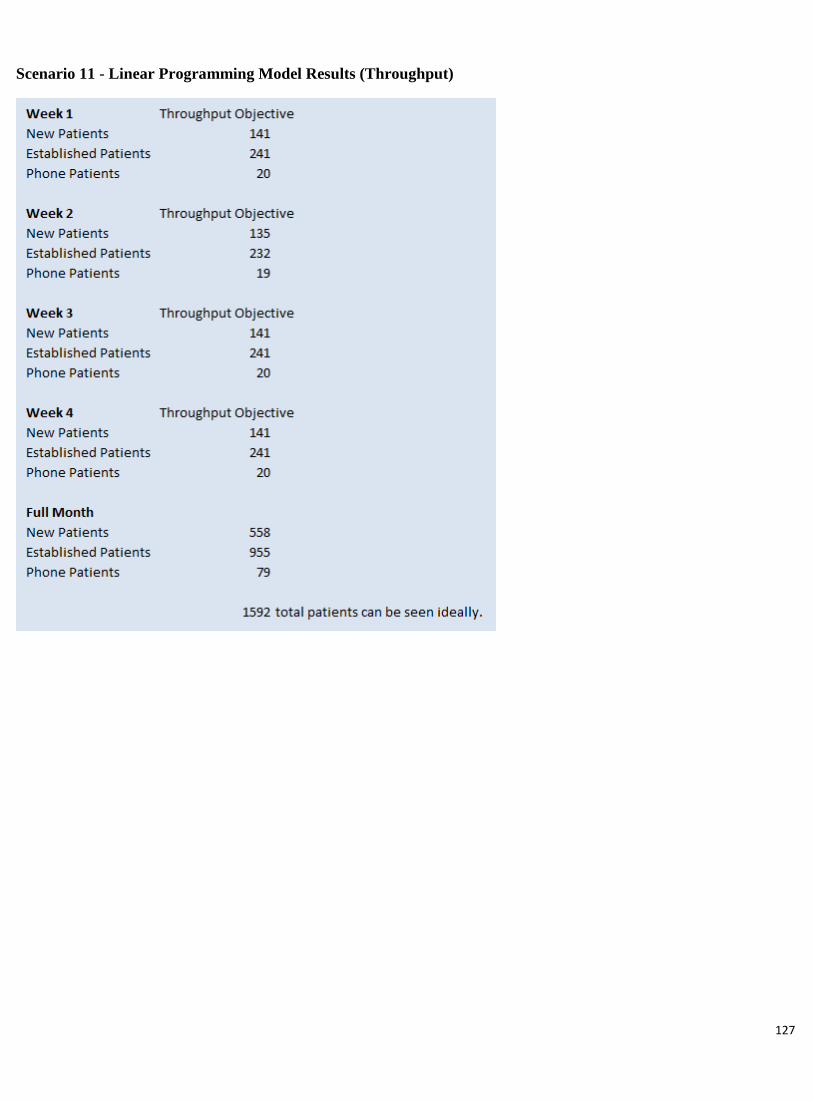
127
Scenario 11 - Linear Programming Model Results (Throughput)

128
Category Overview 4:33:50PM February 24, 2011
Scenario Eleven: The addition of two full-time providers
Time Units: Replications: 100 Hours
Values Across All Replications
Key Performance Indicators
Average System
Number Out 1,493
Model Filename: Page of 1 4 C:\Users\cedanko\Desktop\Scenario_11

129
Category Overview 4:33:50PM February 24, 2011
Scenario Eleven: The addition of two full-time providers
Time Units: Replications: 100 Hours
Values Across All Replications
Entity
Time
VA Time Maximum Average
Minimum Average Half Width Average
Minimum Value
Maximum Value
0.5000 Established Patient 0.00 0.5000 0.5000 0.5000 0.5000
1.0000 New Patient 0.00 1.0000 1.0000 1.0000 1.0000
0.08333333 Phone Consult Patient 0.00 0.08333333 0.08333333 0.08333333 0.08333333
NVA Time Maximum Average
Minimum Average Half Width Average
Minimum Value
Maximum Value
0.00 Established Patient 0.00 0.00 0.00 0.00 0.00
0.00 New Patient 0.00 0.00 0.00 0.00 0.00
0.00 Phone Consult Patient 0.00 0.00 0.00 0.00 0.00
Wait Time Maximum Average
Minimum Average Half Width Average
Minimum Value
Maximum Value
68.1449 Established Patient 0.26 64.1261 71.4266 0.00 135.25
67.7479 New Patient 0.20 65.2195 71.3142 0.00 134.82
68.2083 Phone Consult Patient 0.95 55.4094 80.8236 0.00 135.47
Transfer Time Maximum Average
Minimum Average Half Width Average
Minimum Value
Maximum Value
0.06666667 Established Patient 0.00 0.06666667 0.06666667 0.06666667 0.06666667
0.06666667 New Patient 0.00 0.06666667 0.06666667 0.06666667 0.06666667
0.06666667 Phone Consult Patient 0.00 0.06666667 0.06666667 0.06666667 0.06666667
Other Time Maximum Average
Minimum Average Half Width Average
Minimum Value
Maximum Value
0.00 Established Patient 0.00 0.00 0.00 0.00 0.00
0.00 New Patient 0.00 0.00 0.00 0.00 0.00
0.00 Phone Consult Patient 0.00 0.00 0.00 0.00 0.00
Total Time Maximum Average
Minimum Average Half Width Average
Minimum Value
Maximum Value
68.7115 Established Patient 0.26 64.6928 71.9932 0.5667 135.82
68.8145 New Patient 0.20 66.2862 72.3809 1.0667 135.88
68.3583 Phone Consult Patient 0.95 55.5594 80.9736 0.1500 135.62
Other
Model Filename: Page of 2 4 C:\Users\cedanko\Desktop\Scenario_11

130
Category Overview 4:33:50PM February 24, 2011
Scenario Eleven: The addition of two full-time providers
Time Units: Replications: 100 Hours
Values Across All Replications
Entity
Other
Number In Maximum Average
Minimum Average Half Width Average
Entity 1 0.00 9600.00 9600.00 9600.00
Established Patient 9.32 5767.46 5877.00 5634.00
New Patient 8.67 3354.66 3472.00 3268.00
Phone Consult Patient 3.57 477.88 525.00 429.00
Number Out Maximum Average
Minimum Average Half Width Average
Entity 1 0.00 9600.00 9600.00 9600.00
Established Patient 5.38 898.97 960.00 810.00
New Patient 2.80 518.48 557.00 487.00
Phone Consult Patient 1.88 75.3500 96.0000 51.0000
WIP Maximum Average
Minimum Average Half Width Average
Minimum Value
Maximum Value
0.00 Entity 1 0.00 0.00 0.00 0.00 1.0000
2441.81 Established Patient 4.91 2388.42 2494.31 0.00 4969.00
1421.38 New Patient 4.65 1370.58 1484.32 0.00 2919.00
201.72 Phone Consult Patient 1.78 179.10 226.98 0.00 446.00
Model Filename: Page of 3 4 C:\Users\cedanko\Desktop\Scenario_11

131
Category Overview 4:33:50PM February 24, 2011
Scenario Eleven: The addition of two full-time providers
Time Units: Replications: 100 Hours
Values Across All Replications
Queue
Time
Waiting Time Maximum Average
Minimum Average Half Width Average
Minimum Value
Maximum Value
68.4544 Established Patient Visit.Queue 0.25 64.4355 71.7014 0.00 135.62
68.3673 New Patient Visit.Queue 0.19 65.8934 71.7792 0.00 135.62
68.2544 Phone Consult.Queue 0.94 55.4094 80.8236 0.00 135.47
Other
Number Waiting Maximum Average
Minimum Average Half Width Average
Minimum Value
Maximum Value
2437.60 Established Patient Visit.Queue 4.91 2384.54 2490.14 0.00 4964.00
1417.32 New Patient Visit.Queue 4.64 1366.63 1479.98 0.00 2915.00
201.57 Phone Consult.Queue 1.78 178.96 226.81 0.00 446.00
Resource
Usage
Instantaneous Utilization Maximum Average
Minimum Average Half Width Average
Minimum Value
Maximum Value
0.8871 Primary Care Physician 0.00 0.8822 0.8871 0.00 1.0000
Number Busy Maximum Average
Minimum Average Half Width Average
Minimum Value
Maximum Value
6.1103 Primary Care Physician 0.01 5.9958 6.2176 0.00 10.0000
Number Scheduled Maximum Average
Minimum Average Half Width Average
Minimum Value
Maximum Value
5.8436 Primary Care Physician 0.01 5.7172 5.9609 0.00 10.0000
Scheduled Utilization Maximum Average
Minimum Average Half Width Average
Primary Care Physician 0.00 1.0457 1.0572 1.0324
Total Number Seized Maximum Average
Minimum Average Half Width Average
Primary Care Physician 3.54 1501.88 1549.00 1461.00
Model Filename: Page of 4 4 C:\Users\cedanko\Desktop\Scenario_11
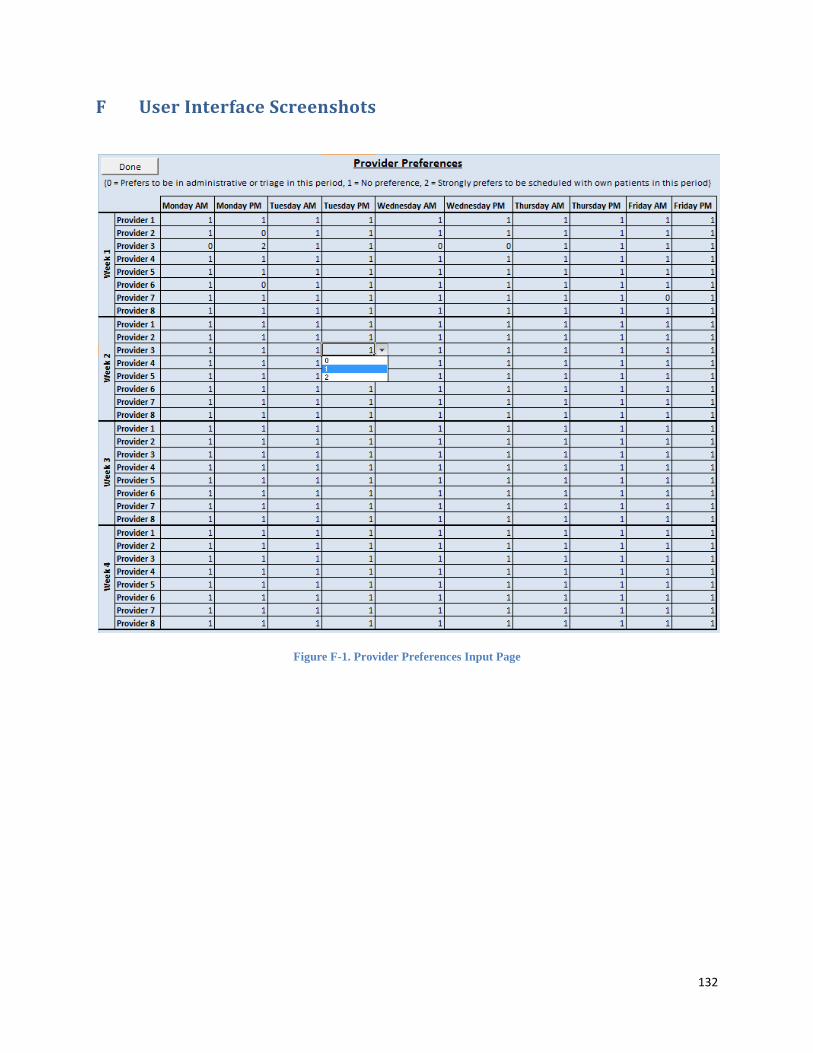
132
F User Interface Screenshots
Figure F-1. Provider Preferences Input Page

133
Figure F-2. Time Away Input Page
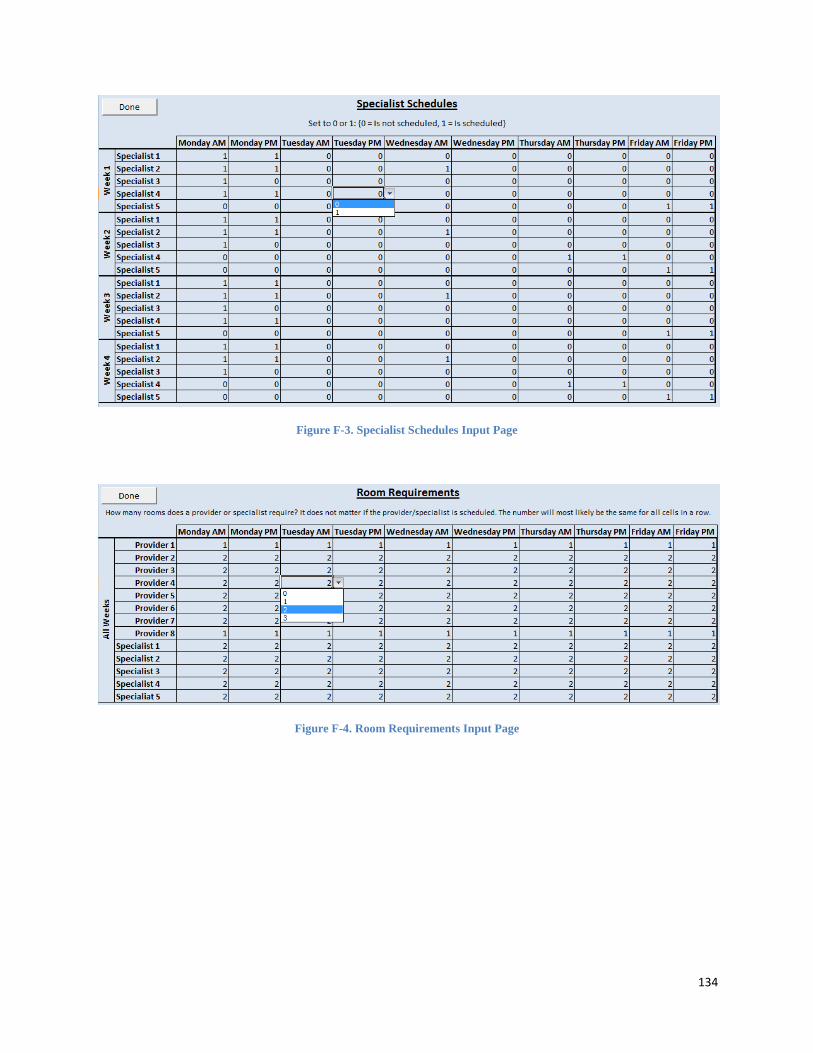
134
Figure F-3. Specialist Schedules Input Page
Figure F-4. Room Requirements Input Page
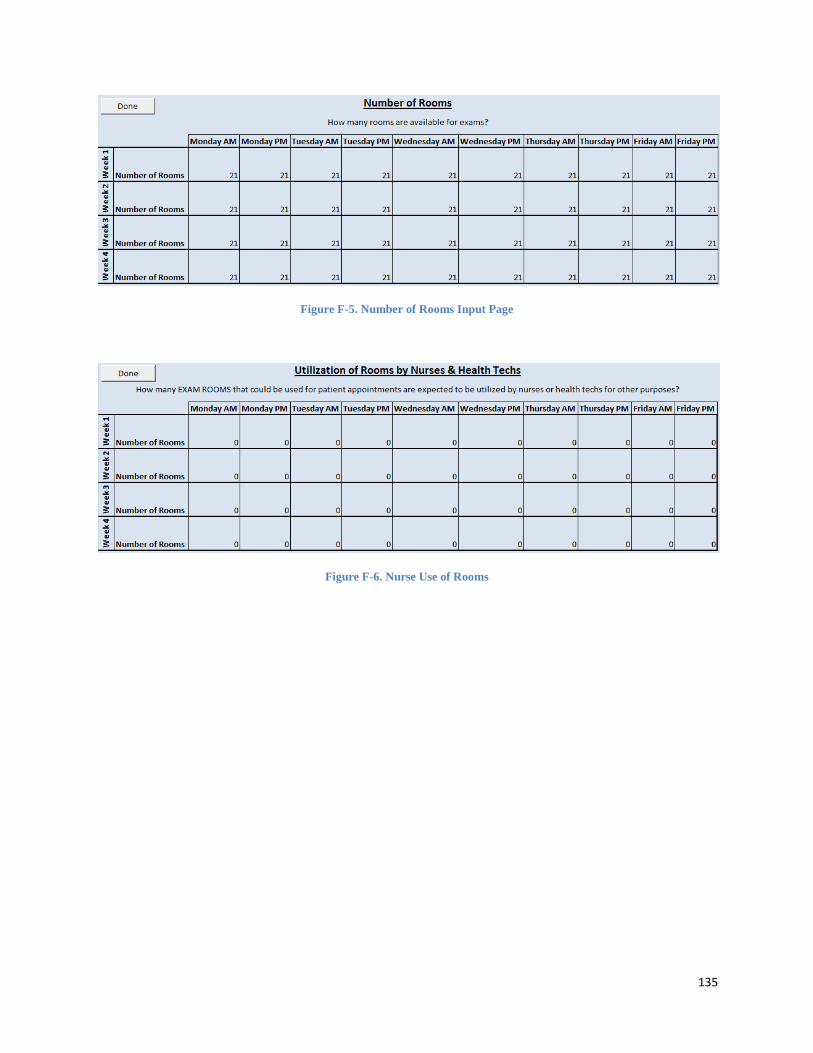
135
Figure F-5. Number of Rooms Input Page
Figure F-6. Nurse Use of Rooms
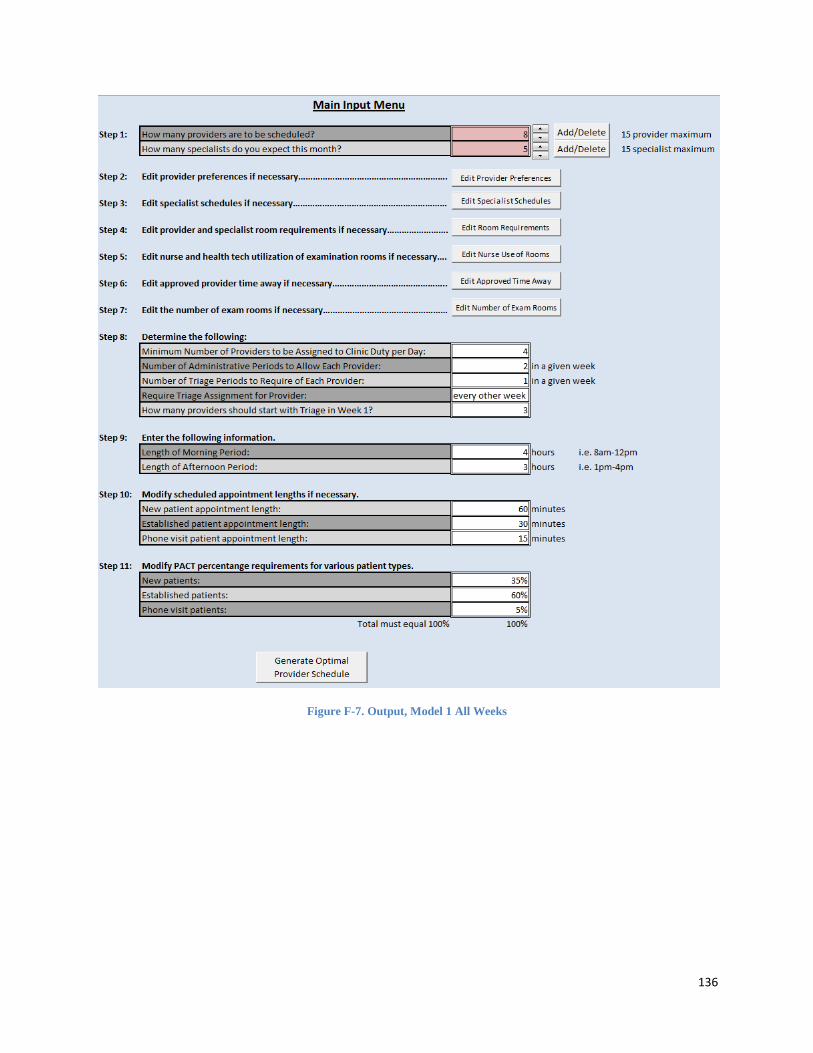
136
Figure F-7. Output, Model 1 All Weeks

137
Figure F-8. Output, Model 1 All Weeks
Figure F-9. Output, Model 2

138
G How to Use ProSkedge These instructions are based on Microsoft Office Excel 2007.
1. Install Excel Solver Add-in
a. Open a new Excel spreadsheet.
b. Click on the Microsoft Office Button and click Excel Options.
c. Click the Add-ins button on the left.
d. In the Manage box, select Excel Add-Ins and then Go.
e. In the Add-Ins Available box, select the checkbox next to the Solver Add-in and
then click OK.
2. Open ProSkedge.
3. Enable Macros
a. If macros are not enabled, enable macros.
4. Modify inputs in ProSkedge using the buttons or input numbers into the WHITE cells.
Use the arrow buttons when provided.
5. Select GENERATE OPTIMAL SCHEDULE and wait for the schedule output to show.