Embed Size (px)
Citation preview

Provider-Perceived Barriers(from least to greatest)
5. Physical Access– Equipment Access
– Building Access
– Restroom Access
4. Appointments
3. Communication– Talking about Needs
– Understanding Provider
2. Insurance Coverage
1. Transportation

Physical Access Barriers
0%
20%
40%
60%
80%
100%
Equipment Restrooms Building
Some saw equipment as more of a barrier

Physical Access Barriers
• Building and Restrooms are very similar
• For the most part, equipment access is a greater barrier
• Exceptions:– Detox
– Hospital
– HVMA
– MH/SA
0%10%20%30%40%50%60%70%80%90%
100%
Assist
ed L
iving
Health
Cen
ters
Detox
Dentis
ts
Hospita
ls
HVMA
I/P B
ehav
iora
l
MH/S
A clini
c
Primar
y car
e
Rehab
Met
hado
ne
Equipment Restrooms Building

Communication Barriers
0%20%40%60%80%
100%
Communication Understanding
Treated the same by providers

Communication Barriers
Communication & Understanding
0%
20%40%
60%80%
100%
Communication Understanding
• Both communication and understanding were treated the same by all providers
• Highest barriers for:– Detox
– I/P Behavioral
– Rehabilitation
• Lowest barriers for:– PC

Insurance Coverage
0%
20%
40%
60%
80%
100%
Good: all medical facilities
Bad: most non-medical services

Insurance Coverage
• Coverage is a low barrier for all basic traditional health services
• Lowest for Detox c/c to methadone
• I/P Behavioral easier to cover than MH/SA
0%10%20%30%40%50%60%70%80%90%
100%
Assist
ed L
ivg
Health
Cnt
rs
Detox
Dentis
ts
Hospit
als
HVMA
I/P B
ehav
iora
l
MH/S
A clin
ic
Primar
y ca
re
Rehab
Met
hado
ne
Coverage

Transporation vs. Appointment
0%10%20%30%40%50%60%70%80%90%
100%
Appointments Transportation
• Transportation is by far perceived highest by all providers
• C/c: appointments easy to get, but transportation difficult
• Coincide, except:– Hospitals/Methadone– Rehabilitation

Major Barriers by Provider
0%
20%
40%
60%
80%
100%
Cover
age
Equip
men
t
Comm
unica
tion
Restro
oms
Appoin
tmen
ts
Under
stan
ding
Build
ing
Tran
spor
tatio
n
Dentists Hospitals
MH/SA clinic Primary care
Health Centers/HVMA

Major Barriers by Provider
• Follow Similar Pattern within each barrier
• PC is lowest overall• Dentist is highest,
followed by HC & HVMA
Major Barriers by Provider
0%10%20%30%40%50%60%70%80%90%
100%
Dentists Hospitals
MH/SA clinic Primary care
Health Centers/HVMA

Notable Differences:
1. Coverage• PC & Hospital are lower than others• Dentist, MH, & HC are higher
2. Understanding• PC is lower than all others
3. Building Access• Dentists are distinctly higher than others

Provider-Perceived Access Barriers
Hypothesis 3:
There are differences between providers and consumers in their
perceptions of access barriers

Overall Barriers: Consumer vs. Provider
0%
20%
40%
60%
80%
100%
TOTAL Providers TOTAL Consumers
•Providers higher than consumers
• Similar pattern!
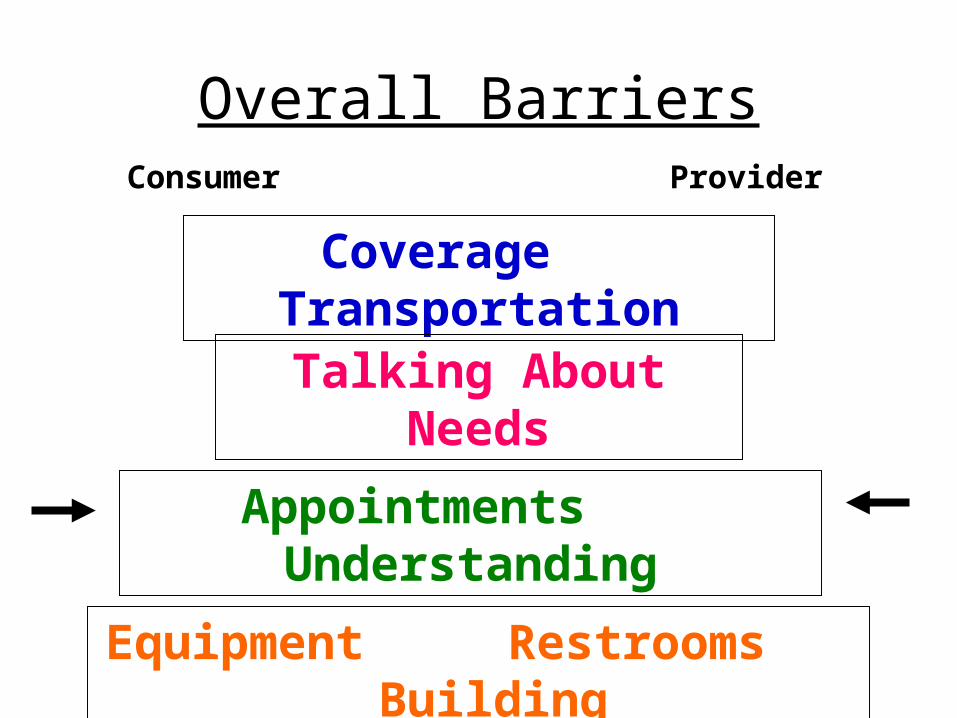
Overall Barriers
Coverage Transportation
Talking About Needs
Appointments Understanding
Equipment Restrooms Building
Consumer Provider

Provider: Appointments vs. Transportation
0%20%40%60%80%
100%
Appointments Transportation
Big Gap!

Consumer: Appointments vs. Transportation
0%10%20%30%40%50%60%
Transportation Appointment
Much Closer!

Consumer: Appointments vs. Talking
0%10%20%30%40%50%60%
Appointment Talking
Overlaps with Talking

Top Barriers:Outpatient MH/SA
Consumer Self-Report
1. Transportation
2. Coverage
2. Talking/Understanding
Provider-Perceived
1. Transportation
2. Coverage
3. Talking/Understanding
REMARKABLY SIMILAR!

Top Barriers:Freestanding Detox
Consumer Self-Report
1. Coverage
2. Transportation
3. Appointments
3. Talking
Provider-Perceived
1. Talking/Understanding
2. Transportation
3. Appointments
•Logistics are bigger barriers for consumers than is Talking about their needs.

Top Barriers:Inpatient Psychiatric
Consumer Self-Report
1. Transportation
2. Talking
3. Appointments
3. Coverage
4. Understanding
Provider-Perceived
1. Transportation
2. Talking/Understanding
3. Appointments
3. Coverage
Very similar; consumers see Talking about needs as more of a barrier than Understanding provider.

Top Barriers:Dentists
Consumer Self-Report
1. Coverage!
2. Appointments
3. Transportation
3. Talking/Understanding
Provider-Perceived
1. Coverage
1. Transportation
2. Talking/Understanding
3. Equipment

Top BarriersOutpatient Medical
Consumer Self-Report
1. Talking
1. Transportation
2. Appointments
2. Understanding
Provider-Perceived
1. Transportation!
2. Coverage
3. Talking
Consumers see Talking about needs as biggest barrier verses Transportation by providers; hospitals are similar.
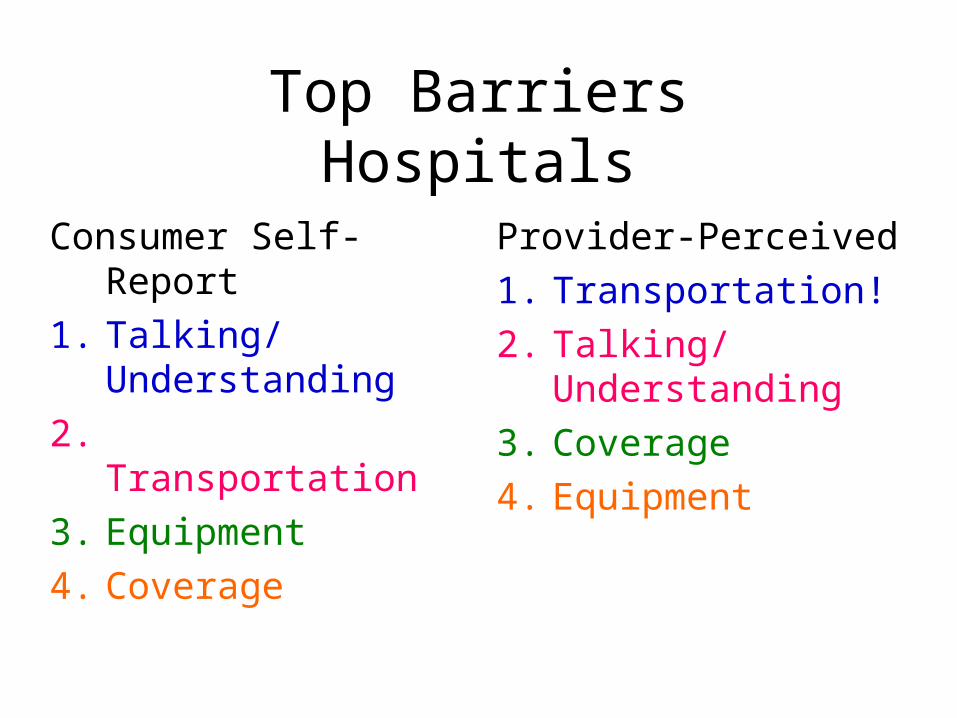
Top BarriersHospitals
Consumer Self-Report
1. Talking/Understanding
2. Transportation
3. Equipment
4. Coverage
Provider-Perceived
1. Transportation!
2. Talking/Understanding
3. Coverage
4. Equipment

Top Barriers:CHC
Consumer
1. Transportation
2. Appointments
2. Talking/Understanding
2. Coverage
Provider
1. Transportation
2. Coverage
3. Talking/Understanding
4. Appointments
4. Equipment

Summary of Findings:Preliminary Results
• Barriers higher for providers vs. consumers• Similar pattern overall• Foremost barrier
– Provider = Transportation– Consumer not as clear
• Differences in perceptions– Importance of Appointments– Talking vs. Understanding