Embed Size (px)
Citation preview
PROTRANSThe Role of Third Party Logistics Service Providers
and their Impact on Transport
Deliverable No 6
Final Public Report
Contract No.: 1999-RD.10795
ProjectCo-ordinator: Buck Consultants International
Partners: Cranfield University (UK)Zentrum für Logistik und Unternehmungsplanung GmbH (GE)Fraunhofer Institut Materialfluss und Logistik (GE)Ecorys Transport (NL)Stratec S.A. (BE)PTV Planung Transport Verkehr A.G. (DE)Linköping Universitet (SE)Technische Universität Berlin (DE)Environment, Transport & Planning (ES)Louis Berger S.A. (FR)
Work Package: 5
Work PackageLeader: Buck Consultants International
Status: Final public report
Date: August 2003
Project funded by the European Commission under the Competitive and SustainableGrowth Programme of the 5th Framework Programme
ContentsPage
Executive Summary 1
1 Introduction 12 Third-party logistics market overview 23 Regional perspective of third-party logistics 54 Market supply and demand for third-party logistics 105 Barriers and opportunities for third-party logistics 126 The potential for a modal shift 157 Conclusions and recommendations for policymakers 21
Chapter 1 Introduction 25
1.1 Background and definitions 251.2 Objectives of PROTRANS 261.3 Methodological approach 271.4 Report structure 29
Chapter 2 Third-party logistics market overview 31
2.1 Introduction and definitions 312.2 Typology of the logistics service provider 342.3 3PLP database development 392.4 Conclusions on the 3PLP market overview 40
Chapter 3 Regional perspective of third-party logistics 45
3.1 Introduction 453.2 Analysis of logistics regions in Europe 473.3 Typology of the logistics regions 543.4 Success and failure factors of logistics regions 563.5 Conclusions on the analysis of logistics regions 58
Page
Chapter 4 Market supply and demand for third-party logistics 61
4.1 Introduction 614.2 Conceptual framework and market conditions 624.3 Supply and demand of logistics services 654.4 Conclusions on supply and demand of logistics services 79
Chapter 5 Barriers and opportunities for third-party logistics 81
5.1 Introduction 815.2 Barriers and opportunities for further outsourcing 815.3 Barriers and opportunities to intermodal transport 895.4 Conclusions 97
Chapter 6 The potential for a modal shift 99
6.1 Introduction 996.2 Value of the services offered by 3PLPs 996.3 Strategies on intermodal transport 1046.4 Future scenario’s 1106.4 Conclusions 114
Chapter 7 Conclusions and recommendations for policymakers 117
7.1 Conclusions on the market position of 3PLP’s 1177.2 Conclusions on the regional perspective of 3PL 1187.3 Conclusions on the barriers and opportunities 1197.4 Conclusions on the intermodal potential 1217.5 Recommendations for policymakers 122
Page
Bibliography 133
Annexe 1 Description per work package 147
Annexe 2 Definitions of 3PL 157
Annexe 3 Type of clients 159
Annexe 4 Overview of sub-activities 161
Annexe 5 Database structure 165
Annexe 6 Score per element of logistics regions 167
Annexe 7 Examples of 3PLP networks in Europe 171
Annexe 8 Typology of logistics regions 177
Annexe 9 Score per benchmark region 179
Annexe 10 Definitions of IMT action variables 181
Annexe 11 Result screens IPI 183
List of figures
PageFigures of Executive Summary
Figure 1 Example input screen 2PLP facilities 4Figure 2 Four main elements of a logistics region 5Figure 3 Perceptions on current 3PLPs behaviour in the logistics system 13Figure 4 Influence of 3PLPs on leading action variables 17Figure 5 Evaluation of the first scenario regarding fast moving, high valued goods 20Figure 6 Evaluation of the second scenario regarding slow moving, low valued
goods 21
Figures of Chapters 1 to 7
Figure 2.1 Decision-making phases 37Figure 2.2 Example input screen 3PLP facilities 40Figure 2.3 Segmentation of possible 3PLP headquarters according to country 41Figure 2.4 Segmentation of type of clients served by 3PLPs 42Figure 2.5 Segmentation of type of activities being offered by 3PLPs 43Figure 2.6 Segmentation of transport services offered by 3PLPs 43Figure 3.1 The four main elements of a logistics region 47Figure 3.2 Infrastructure 48Figure 3.3 Demand of logistics services 49Figure 3.4 Supply of logistics services 51Figure 3.5 External environment 52Figure 3.6 Profile of logistics regions 54Figure 4.1 Conceptual model 65Figure 4.2 Transport Management as part of a logistics systems 65Figure 4.3 Logistics services performed by logistics service providers 66Figure 4.4 3PLPs using IMT 68Figure 4.5 3PLPs level of involvement in different IMT related activities 69Figure 4.6 Proactive behaviour of 3PLPs per identified phase 70Figure 4.7 Proactive behaviour of 3PLPs per identified phase in IMT 71Figure 4.8 Sufficiency of critical resources 72Figure 4.9 Adequacy of skills 73Figure 4.10 3PLPs degree of experience and know-how in IMT 74
Page
Figure 4.11 The perception of the current transport effects caused by the use of3PLPs 76
Figure 4.12 Perceived factors of 3PLPs that effect current and future transportefficiency 77
Figure 4.13 The perception of the current IMT improvements caused by the useof 3PLPs 78
Figure 5.1 Perceptions on current 3PLPs behaviour in the logistics system 83Figure 5.2 Deficiencies in critical design resources and skills - now and in future 84Figure 5.3 Deficiencies in critical implementation resources and skills - now and in
future 85Figure 5.4 Deficiencies in critical operational resources and skills - now and in future 86Figure 5.5 To what degree is intermodal transport inhibited: shippers’ and 3PLPs
perception of barriers 91Figure 5.6 The perception of the capability of and IMT system for different delivery
time windows 91Figure 5.7 The perception of the providers current skills in intermodal transport 92Figure 5.8 The future role of 3PL providers with respect to intermodal transport 95Figure 6.1 Utilities and disutilities associated to variations of the variables in an
example intermodal road-rail transport 102Figure 6.2 Effect of action variables on the market share of intermodal transport for
semi-finished products 103Figure 6.3 Effect of action variables on the market share of intermodal transport for
finished products 104Figure 6.4 Influence of 3PLPs on leading action variables 107Figure 6.5 Evaluation of the first scenario regarding fast moving, high valued goods 113Figure 6.6 Evaluation of the second scenario regarding slow moving, low valued
goods 114
Figures of Annexes
Figure 1 Structure Work Package 2 - Analysis of selected logistics regions inEurope 149
Figure 2 Framework of Work Package 4 152Figure 1 Network of Frans Maas 173Figure 2 Network of Exel 174Figure 3 Network of TNT 175Figure 1 Required notification of delayed shipments according to shippers 181
List of tablesPage
Tables of Executive Summary
Table 1 Scores of studied logistics regions 6Table 2 Classification of the sample regions studied according to the typology 7Table 3 Focus of logistics regions 9Table 4 Changes in logistics performance due to 3PLP influence 11Table 5 Impact of National and European laws on the use of intermodal transport 15Table 6 Required 3PLPs services on action variables 16Table 7 Importance of the leading action variables per industry 19Table 8 Estimated efficiency effects per action variable 20
Tables of Chapters 1 to 7
Table 1.1 Activities per Work Package 27Table 2.1 Examples of relationships between 3PLPs 44Table 3.1 Short list selected regions 46Table 3.2 Scores of the 13 logistics regions studied 53Table 3.3 Classification of the regions studied in the proposed typology 55Table 3.4 Focus of logistics regions 57Table 4.1 Respondents per industry 61Table 4.2 Positive changes in logistics performance since 3 years 75Table 4.3 Changes in logistics performance due to 3PLP influence 76Table 5.1 Economic growth and logistics outsourcing 88Table 5.2 Perceived barriers to use IMT 90Table 5.3 Regulatory measures to foster intermodal transport 96Table 5.4 Impact of National and European laws on the use of intermodal transport 96Table 6.1 Action variables on intermodal transport 105Table 6.2 Required 3PLPs services on action variables 106Table 6.3 Logistics characteristics per industry 108Table 6.4 Intermodal transport related strategies and their impact on the action
variables 110Table 6.5 Importance of the leading action variables per industry 111Table 6.6 Estimated efficiency effects per action variable 112Table 7.1 Recommended measures according to their scope 110
PageTables of Annexes
Table 1 The distribution of the respondents in the 1st survey round 151Table 2 The distribution of the respondents in the 2nd survey round 151Table 1 Infrastructure of the studied regions 167Table 2 Demand of logistics services of the studied regions 168Table 3 Supply of logistics services of the studied regions 168Table 4 External environment of the studied regions 169Table 1 Description of types of 3PLPs 172Table 1 Infrastructure 179Table 2 Supply of logistics services 179Table 3 Demand for logistics services 180Table 4 External environment 180Table 1 Input data screen 183Table 2 Output data screen 184
PROTRANS, The Role of Third party Logistics Services Providers and their Impact on Transport 1
Executive Summary
1 Introduction
The international competitiveness of European industry will increasingly depend on itsability to deliver customer-adapted products all over the world quickly and in time. Such acompetitive image places a number of demands on the logistics system and management'sattitude to how important logistics is as a competitive parameter. In the 1990s, focus haschanged from internal efficiency in the logistics function to external relations between theparties in the total supply chain. The largest potential for improvements is not found insidean individual company, but in the interfaces between independent companies in the supplychain. Outsourcing logistics activities has become a relative common principle forcompanies. Since Third Party Logistics Providers (3PLPs) provide this service for multipleclients, 3PLPs play a significant and increasing role in overall optimised logistics networks.
In order to gain insight in the role of 3PLPs in transport a consortium of 11 companies(consulting firms, research organisations and universities) designed the PROTRANSproject. The companies that participate in the PROTRANS project are:
• Buck Consultants International (BCI, NL)• Cranfield University (CU, UK)• Zentrum für Logistik und Unternehmungsplanung GmbH (ZLU, D)• Fraunhofer Institut Materialfluss und Logistik (IML, D)• Ecorys Transport (NEI, NL)• Stratec S.A. (B)• PTV Planung Transport Verkehr A.G. (PTV, D)• Linköping Universitet (LiU, SE)• Technische Universität Berlin (TU-B, D)• Environment, Transport & Planning (CH2Mhill/ET&P, ES)• Louis Berger S.A. (LB, F)
The project is co-ordinated by Buck Consultants International.
PROTRANS, The Role of Third party Logistics Services Providers and their Impact on Transport2
This project, which is conducted within the Vth Framework Programme of the, EuropeanCommission, started in January 2000 and has been finalised in December 2002. The maingoal of the PROTRANS project is to identify the most important challenges (for whom/what),to determine barriers, success and failure factors and to assess the future importance ofintermodal transport forthis the strategies of 3PLPs on a European level. In the PROTRANSproject Third-party Logistics has been defined as:
”…activities carried out by an external company on behalf of a shipper and consisting of atleast the provision of management of multiple logistics services. These activities are offeredin an integrated way, not on a stand- alone basis. The co-operation between the shipperand the external company is an intended continuous relationship”.
In order to achieve this main goal, the work of the project has been divided into 5 tasks(Work Packages):
Work Package 1 Analysis of the 3PL marketWork Package 2 Analysis of European logistics regionsWork Package 3 Market demands and services offered by 3PLPsWork Package 4 Intermodality as an integral part of pan European strategiesWork Package 5 Conclusions, recommendations and dissemination
The results of these tasks are summarised in this executive summary of this Deliverable(No. 6), which summarises the total results of the PROTRANS project.
2 Third-party logistics market overview
The 3PLP market is a very dynamic one. Mergers, acquisitions and alliances are commonnews in this industry. Customer demands changes frequent, distribution channels emergeand new products are introduced on a daily basis. All these market developments requireadaptation of supply chains and a different role of 3PLPs in transport and logistics. In orderto gain insight in this role of 3PLPs, a ‘snapshot’ of the 3PLP market is taken in thePROTRANS project.
This snapshot is actually the stepping stone for further research within the PROTRANSproject, by providing a sound theoretical basis on the characteristics of a 3PLP and byproviding an extensive overview of possible 3PLP providers all over Europe. Thesecharacteristics consists of the following nine elements:• Origination (what was the original scope and activity of the 3PLP company).
PROTRANS, The Role of Third party Logistics Services Providers and their Impact on Transport 3
• The type of clients that are served (which industrial sectors).• (Part of) the supply chain that is covered (upstream or downstream).• The network structure that is covered (location of clients and facilities).• The type of activities that are carried out for the client (types of services).• The level of decision making (strategic/structural/functional/implementation).• Transport means served (segmentation along transport means and service provided,
with a special focus on intermodal transport).• Size of the 3PLP (in turnover, number of employees, number of locations, etc.).• Region (segmentation along the regions of interest as specified in the second Work
Package, on European logistics regions).• Degree of interrelationship between 3PLPs (level of participation in logistic networks,
alliances).
Based on these elements a database is designed in the PROTRANS project. The user-friendly database has been written in MS–Access and contains the structure for informationon 3PLPs, programmed in such a way that the information can be easily fed into thedatabase. The information filled in per 3PLP record is structured in five main input screens:
• Overview of parent companies• 3PLP general information• 3PLP facilities• 3PLP transport means• 3PLP client information
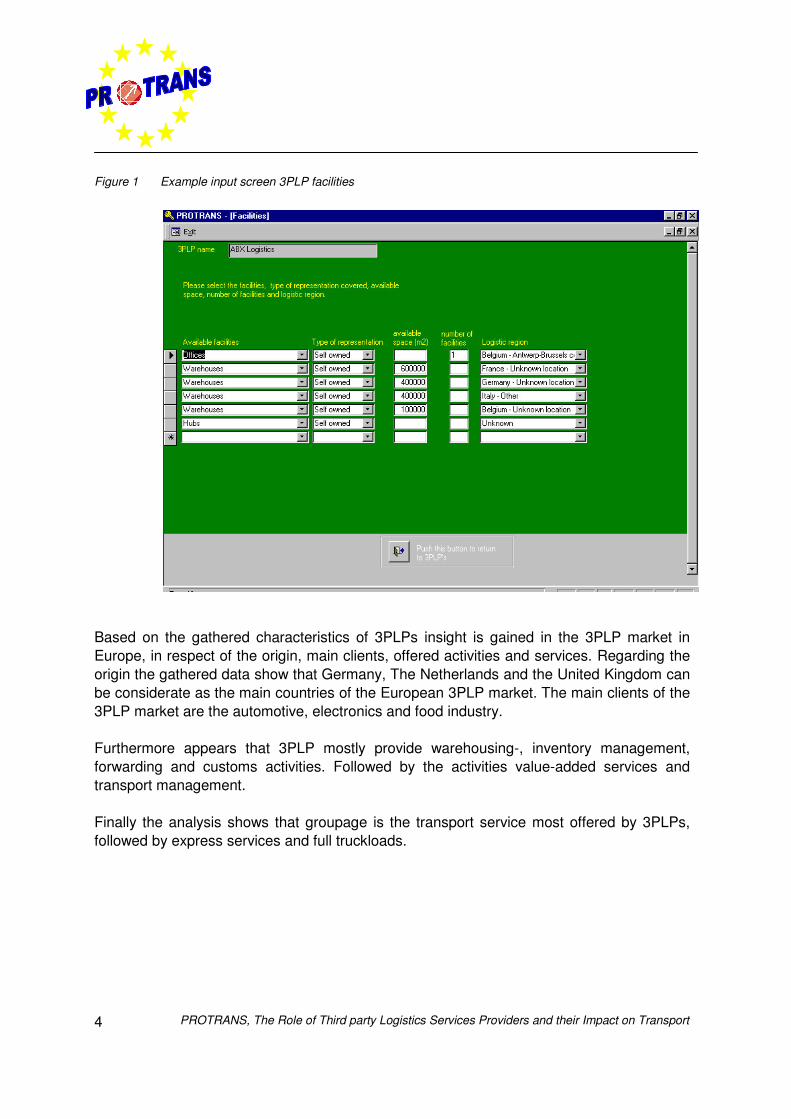
In figure 1 an example of the input screen of the 3PLP facilities is captured.
PROTRANS, The Role of Third party Logistics Services Providers and their Impact on Transport4
Figure 1 Example input screen 3PLP facilities
Based on the gathered characteristics of 3PLPs insight is gained in the 3PLP market inEurope, in respect of the origin, main clients, offered activities and services. Regarding theorigin the gathered data show that Germany, The Netherlands and the United Kingdom canbe considerate as the main countries of the European 3PLP market. The main clients of the3PLP market are the automotive, electronics and food industry.
Furthermore appears that 3PLP mostly provide warehousing-, inventory management,forwarding and customs activities. Followed by the activities value-added services andtransport management.
Finally the analysis shows that groupage is the transport service most offered by 3PLPs,followed by express services and full truckloads.
PROTRANS, The Role of Third party Logistics Services Providers and their Impact on Transport 5
3 Regional perspective of third-party logistics
Profile of a logistics region
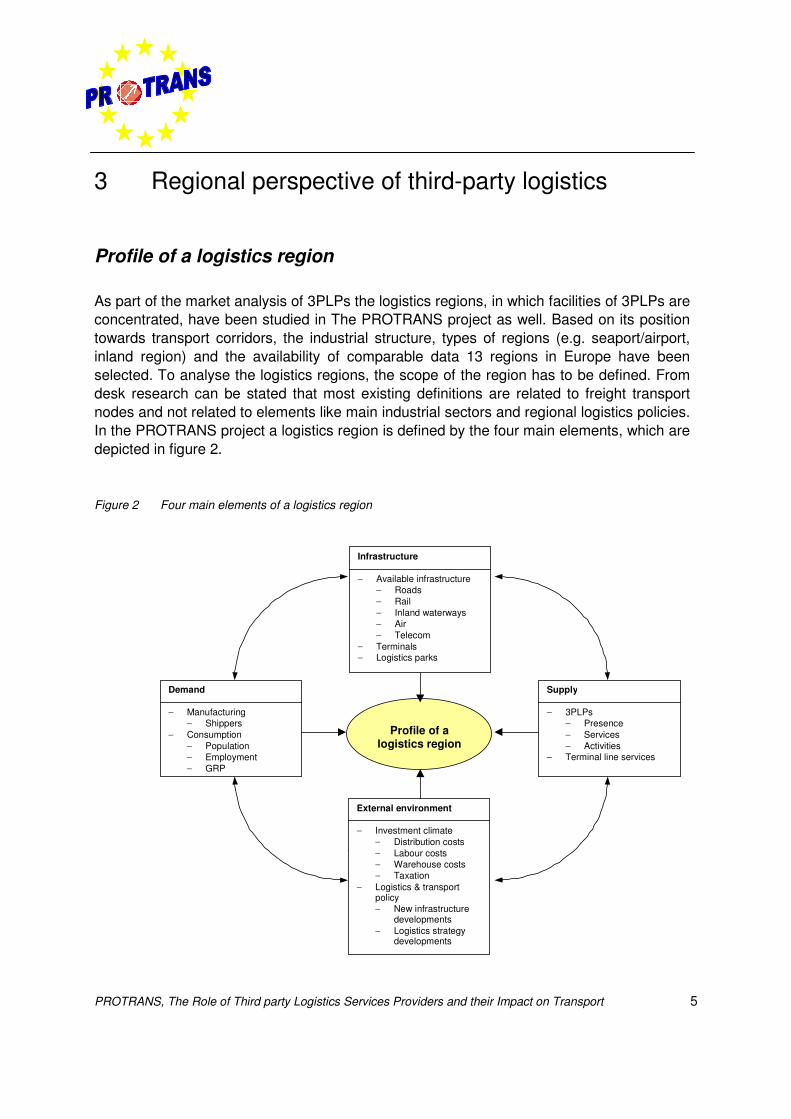
As part of the market analysis of 3PLPs the logistics regions, in which facilities of 3PLPs areconcentrated, have been studied in The PROTRANS project as well. Based on its positiontowards transport corridors, the industrial structure, types of regions (e.g. seaport/airport,inland region) and the availability of comparable data 13 regions in Europe have beenselected. To analyse the logistics regions, the scope of the region has to be defined. Fromdesk research can be stated that most existing definitions are related to freight transportnodes and not related to elements like main industrial sectors and regional logistics policies.In the PROTRANS project a logistics region is defined by the four main elements, which aredepicted in figure 2.
Figure 2 Four main elements of a logistics region
Demand
− Manufacturing− Shippers
− Consumption− Population− Employment− GRP
Supply
− 3PLPs− Presence− Services− Activities
− Terminal line services
Profile of alogistics region
Infrastructure
− Available infrastructure− Roads− Rail− Inland waterways− Air− Telecom
− Terminals− Logistics parks
External environment
− Investment climate− Distribution costs− Labour costs− Warehouse costs− Taxation
− Logistics & transportpolicy− New infrastructure
developments− Logistics strategy
developments
PROTRANS, The Role of Third party Logistics Services Providers and their Impact on Transport6
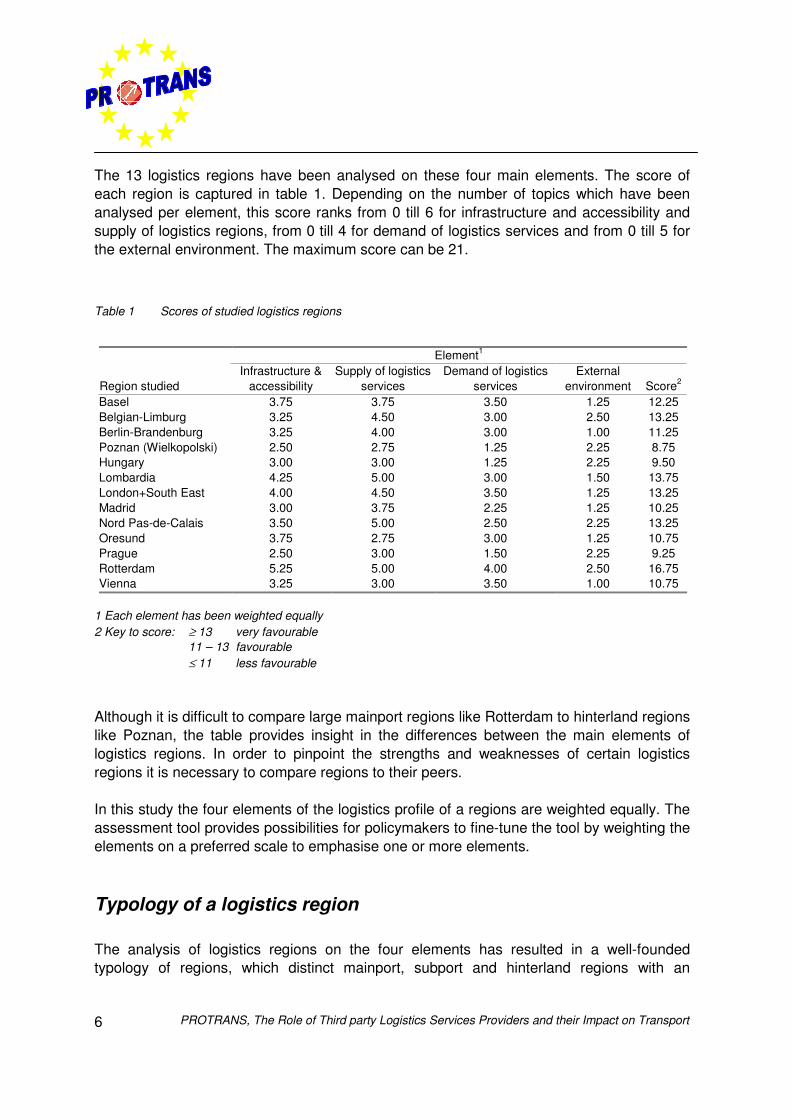
The 13 logistics regions have been analysed on these four main elements. The score ofeach region is captured in table 1. Depending on the number of topics which have beenanalysed per element, this score ranks from 0 till 6 for infrastructure and accessibility andsupply of logistics regions, from 0 till 4 for demand of logistics services and from 0 till 5 forthe external environment. The maximum score can be 21.
Table 1 Scores of studied logistics regions
Element1
Region studiedInfrastructure &
accessibilitySupply of logistics
servicesDemand of logistics
servicesExternal
environment Score2
Basel 3.75 3.75 3.50 1.25 12.25Belgian-Limburg 3.25 4.50 3.00 2.50 13.25Berlin-Brandenburg 3.25 4.00 3.00 1.00 11.25Poznan (Wielkopolski) 2.50 2.75 1.25 2.25 8.75Hungary 3.00 3.00 1.25 2.25 9.50Lombardia 4.25 5.00 3.00 1.50 13.75London+South East 4.00 4.50 3.50 1.25 13.25Madrid 3.00 3.75 2.25 1.25 10.25Nord Pas-de-Calais 3.50 5.00 2.50 2.25 13.25Oresund 3.75 2.75 3.00 1.25 10.75Prague 2.50 3.00 1.50 2.25 9.25Rotterdam 5.25 5.00 4.00 2.50 16.75Vienna 3.25 3.00 3.50 1.00 10.75
1 Each element has been weighted equally2 Key to score: ≥ 13 very favourable
11 – 13 favourable≤ 11 less favourable
Although it is difficult to compare large mainport regions like Rotterdam to hinterland regionslike Poznan, the table provides insight in the differences between the main elements oflogistics regions. In order to pinpoint the strengths and weaknesses of certain logisticsregions it is necessary to compare regions to their peers.
In this study the four elements of the logistics profile of a regions are weighted equally. Theassessment tool provides possibilities for policymakers to fine-tune the tool by weighting theelements on a preferred scale to emphasise one or more elements.
Typology of a logistics region
The analysis of logistics regions on the four elements has resulted in a well-foundedtypology of regions, which distinct mainport, subport and hinterland regions with an
PROTRANS, The Role of Third party Logistics Services Providers and their Impact on Transport 7
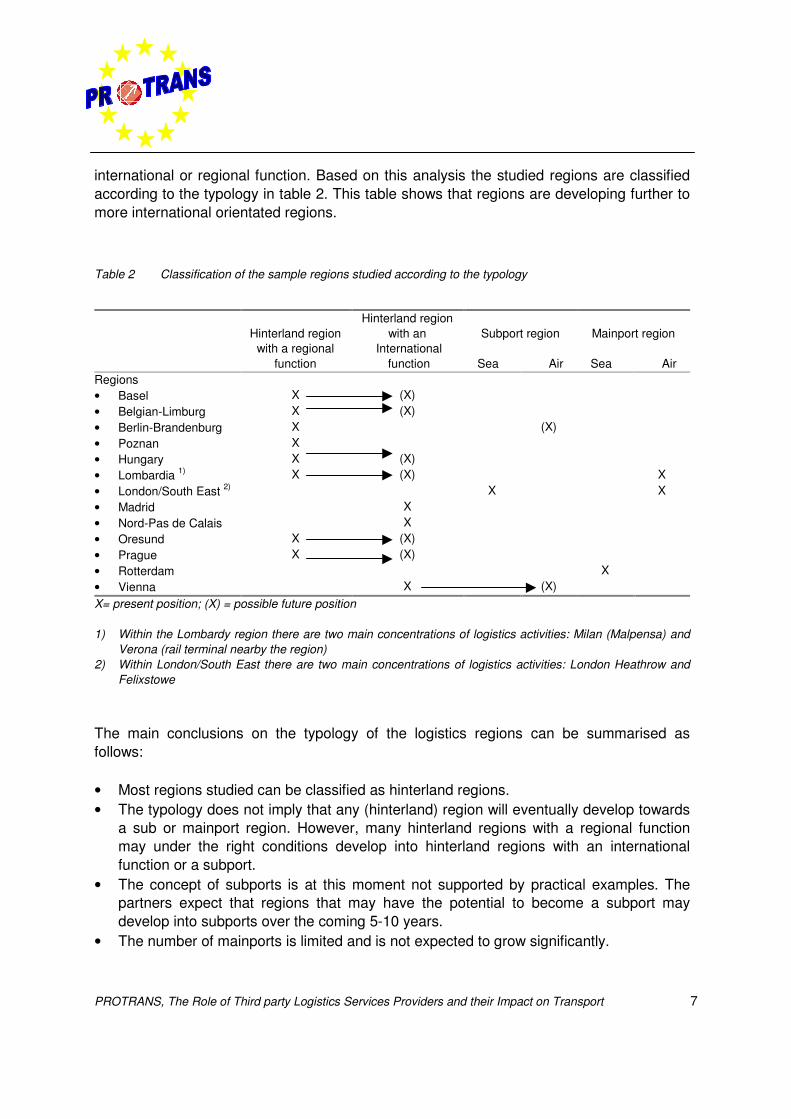
international or regional function. Based on this analysis the studied regions are classifiedaccording to the typology in table 2. This table shows that regions are developing further tomore international orientated regions.
Table 2 Classification of the sample regions studied according to the typology
Hinterland regionwith a regional
function
Hinterland regionwith an
International function
Subport region
Sea Air
Mainport region
Sea AirRegions• Basel X (X)• Belgian-Limburg X (X)• Berlin-Brandenburg X (X)• Poznan X• Hungary X (X)• Lombardia 1) X (X) X• London/South East 2) X X• Madrid X• Nord-Pas de Calais X• Oresund X (X)• Prague X (X)• Rotterdam X• Vienna X (X)X= present position; (X) = possible future position
1) Within the Lombardy region there are two main concentrations of logistics activities: Milan (Malpensa) andVerona (rail terminal nearby the region)
2) Within London/South East there are two main concentrations of logistics activities: London Heathrow andFelixstowe
The main conclusions on the typology of the logistics regions can be summarised asfollows:
• Most regions studied can be classified as hinterland regions.• The typology does not imply that any (hinterland) region will eventually develop towards
a sub or mainport region. However, many hinterland regions with a regional functionmay under the right conditions develop into hinterland regions with an internationalfunction or a subport.
• The concept of subports is at this moment not supported by practical examples. Thepartners expect that regions that may have the potential to become a subport maydevelop into subports over the coming 5-10 years.
• The number of mainports is limited and is not expected to grow significantly.
PROTRANS, The Role of Third party Logistics Services Providers and their Impact on Transport8
Policymakers, transport professionals and scientist in Europe have more and moreaccepted the typology of logistics regions as used in the PROTRANS project. This indicatesthat the logistics market needs a clear typology to identify and compare logistics regions.The exception of this typology also subscribes the innovative character of the projectexamined depend on the type of region.
Furthermore can be concluded that the presence of 3PLPs in the above-described types ofregions differ. 3PLPs in mainport regions are mainly focused on forwarding andwarehousing since these activities are related to locations where freight is consolidatedfrom various sources and redirected in high volume flows to national or regionalwarehouses in elsewhere in Europe. Since hinterland regions in general have loweroperating costs and more land available more presence of networking facilities is seen inthis type of logistics region.
Success and failure factors
A benchmark has been developed in PROTRANS, in order to define best practice regionsand to derive success and failure factors. This assessment tool can furthermore be used byregional, national or European policy makers to development of their logistics, but also byshippers and 3PLPs to gain insight in the regional variances, strengths and weaknesses ofregions. This information that can be of great value for decisions on for instance locationchoice and network development. The degree of success of a logistics region will even begreater if public and private partners like 3PLPs and shippers co-operated in thedevelopment of an integral strategic logistics vision of a region.
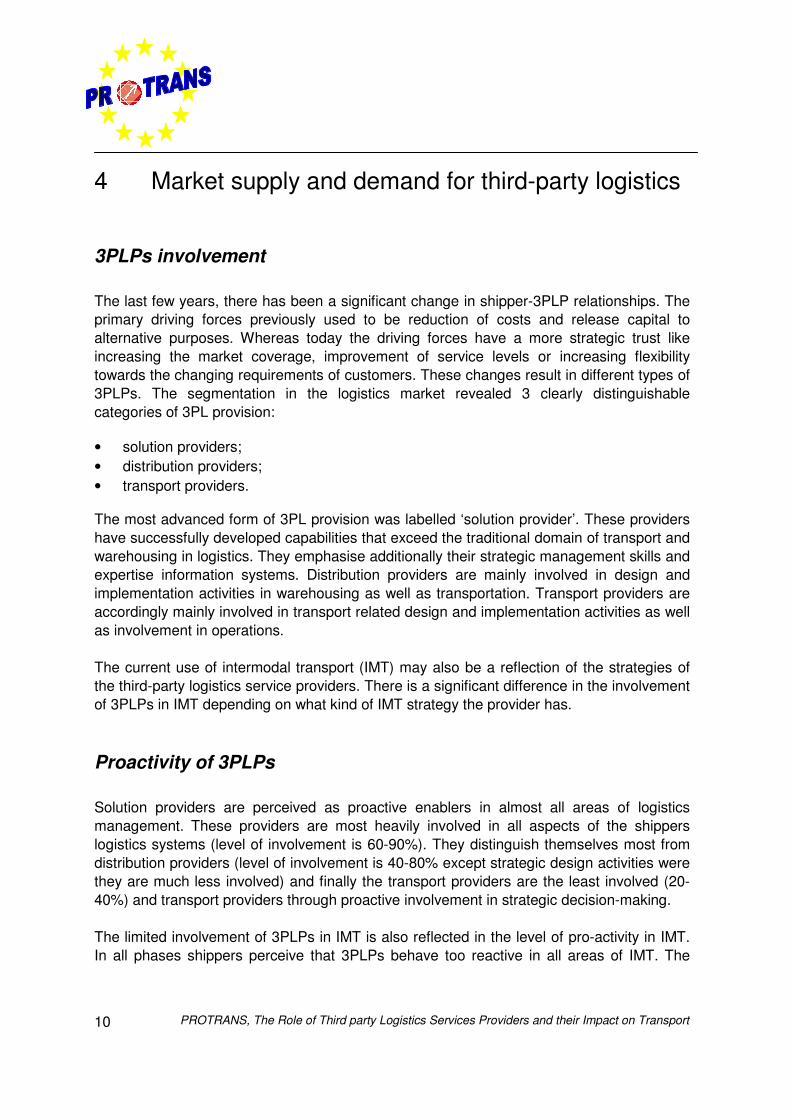
Looking at the success and failure factors of the various types of logistics regions and at thebenchmark of the best-practise regions in the PROTRANS project, the focus of each type ofregion in order to improve its logistics capabilities is summarised in table 3 the focus. Themain areas of focus are shaded in grey. The number of ‘plusses’ presents the success of aregion.
PROTRANS, The Role of Third party Logistics Services Providers and their Impact on Transport 9
Table 3 Focus of logistics regions
Transportconnections Terminals Accessibility Investment climate
Mainport +++ +++ +++ ++
Subport +(+) ++ ++ ++
Hinterland region with aninternational function
+ ++ ++ ++
Hinterland region with a regionalfunction
+ + ++ ++
Based on table 3 the following challenges for the different types of regions can be depicted:
• Mainports: The first priority for mainports is to ensure that terminal capacity andaccessibility of the area remain of high standard since the competition is fierce betweenthe large ports in Europe. Hence, possibilities of co-operation with smaller seaports orhinterland regions should be studied consequently by the mainports.
• Subports: Subports should focus on becoming a supporting hub of a mainport byconnecting and aligning its own network to the network of a mainport. However asubport region should also create an attractive investment climate in order to facilitatenew investment and expansions of the current industrial and logistics base.
• Hinterland regions with an international function: Since most hinterland regionshave a feeder function towards mainports and a growing demand for logistics services isoccurring, these hinterland regions with an international function should realise sufficientcapacity on international transport connections, meaning e.g. increasing terminalcapacity and frequency of services. In order to align the supply of the transport serviceson the demand of the industrial and logistics base in the region, an integral logisticsstrategy for the region should be developed in which public and private partnersparticipate
• Hinterland regions with a regional function: Hinterland regions are often more cost-effective in terms of e.g. cheaper and more readily available land and lower labourcosts. These regions should use this advantage since one of the main concerns of thistype of region is to attract new investors in order to stimulate the growth of the demandfor logistics services.
PROTRANS, The Role of Third party Logistics Services Providers and their Impact on Transport10
4 Market supply and demand for third-party logistics
3PLPs involvement
The last few years, there has been a significant change in shipper-3PLP relationships. Theprimary driving forces previously used to be reduction of costs and release capital toalternative purposes. Whereas today the driving forces have a more strategic trust likeincreasing the market coverage, improvement of service levels or increasing flexibilitytowards the changing requirements of customers. These changes result in different types of3PLPs. The segmentation in the logistics market revealed 3 clearly distinguishablecategories of 3PL provision:
• solution providers;• distribution providers;• transport providers.
The most advanced form of 3PL provision was labelled ‘solution provider’. These providershave successfully developed capabilities that exceed the traditional domain of transport andwarehousing in logistics. They emphasise additionally their strategic management skills andexpertise information systems. Distribution providers are mainly involved in design andimplementation activities in warehousing as well as transportation. Transport providers areaccordingly mainly involved in transport related design and implementation activities as wellas involvement in operations.
The current use of intermodal transport (IMT) may also be a reflection of the strategies ofthe third-party logistics service providers. There is a significant difference in the involvementof 3PLPs in IMT depending on what kind of IMT strategy the provider has.
Proactivity of 3PLPs
Solution providers are perceived as proactive enablers in almost all areas of logisticsmanagement. These providers are most heavily involved in all aspects of the shipperslogistics systems (level of involvement is 60-90%). They distinguish themselves most fromdistribution providers (level of involvement is 40-80% except strategic design activities werethey are much less involved) and finally the transport providers are the least involved (20-40%) and transport providers through proactive involvement in strategic decision-making.
The limited involvement of 3PLPs in IMT is also reflected in the level of pro-activity in IMT.In all phases shippers perceive that 3PLPs behave too reactive in all areas of IMT. The
PROTRANS, The Role of Third party Logistics Services Providers and their Impact on Transport 11
lowest degree of pro-activity according to shippers lies in the design of the services and thehighest can be found in the operationally related activities.
Competence of 3PLPs
The difference between the categories of 3PLPs is additionally underlined by significantdifferences in their resource and skill base. Particularly sufficient human resources andconceptual skills distinguish solution providers from distribution or transport providers. Itappears that differences in adequacy of skills occur between solution providers andtransport providers, in particular with respect to the design and operation of logisticssystems.
Regarding IMT the experience and know how can be marked as ‘moderate’ since most ofthe 3PLPs are originated from road transport.
Logistics performances
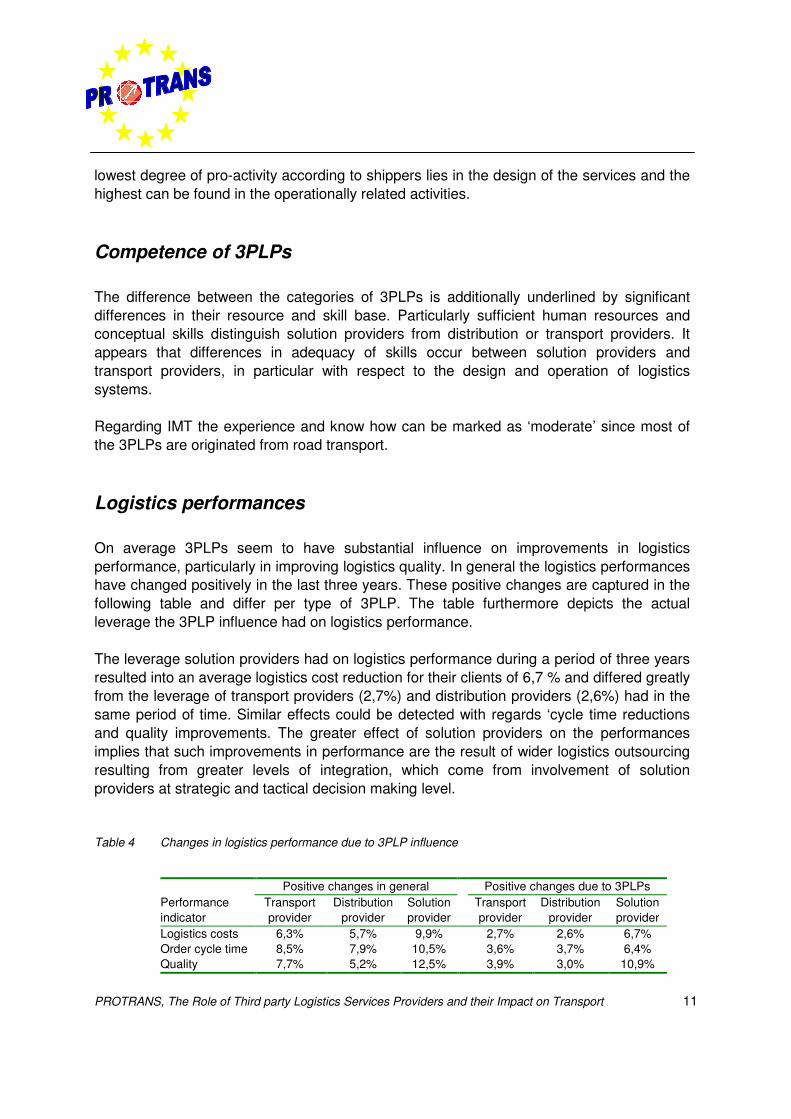
On average 3PLPs seem to have substantial influence on improvements in logisticsperformance, particularly in improving logistics quality. In general the logistics performanceshave changed positively in the last three years. These positive changes are captured in thefollowing table and differ per type of 3PLP. The table furthermore depicts the actualleverage the 3PLP influence had on logistics performance.
The leverage solution providers had on logistics performance during a period of three yearsresulted into an average logistics cost reduction for their clients of 6,7 % and differed greatlyfrom the leverage of transport providers (2,7%) and distribution providers (2,6%) had in thesame period of time. Similar effects could be detected with regards ‘cycle time reductionsand quality improvements. The greater effect of solution providers on the performancesimplies that such improvements in performance are the result of wider logistics outsourcingresulting from greater levels of integration, which come from involvement of solutionproviders at strategic and tactical decision making level.
Table 4 Changes in logistics performance due to 3PLP influence
Positive changes in general Positive changes due to 3PLPsPerformanceindicator
Transportprovider
Distributionprovider
Solutionprovider
Transportprovider
Distributionprovider
Solutionprovider
Logistics costs 6,3% 5,7% 9,9% 2,7% 2,6% 6,7%Order cycle time 8,5% 7,9% 10,5% 3,6% 3,7% 6,4%Quality 7,7% 5,2% 12,5% 3,9% 3,0% 10,9%
PROTRANS, The Role of Third party Logistics Services Providers and their Impact on Transport12
The use of 3PLPs is believed to currently improve road transport efficiency and to a lesserdegree IMT efficiency. The most important factor behind the fact that the 3PLPs achievebetter transport efficiency and effectiveness today is economies of scale. Because of theeconomies of scale and scope, 3PLPs are able for instance to consolidate physical flowsand optimise information flows.
Towards IMT shippers and 3PLPs share the same views on how third-party logisticscurrently improve the efficiency of IMT. They do that by:
• reducing transport cost;• increasing load factor;• reducing road transport kilometres for pre- and end haulage.
5 Barriers and opportunities for third-party logistics
The role of 3PLPs in the supply chain in general and in the provision of logistics and IMTservices in specific is increasing. Changes in the way logistics are managed and inparticular transport are a matter of designing or redesigning logistics and transport systems.Modal choice is a strategic decision that is determined at a very early stage of designing anew transport system. The degree of success in designing or redesigning logistics andtransport systems largely depends on the shipper-3PLP relationship and the ability toovercome the barriers in logistics and IMT and to effectuate the opportunities in the logisticsmarket.
Barriers for further outsourcing and IMT
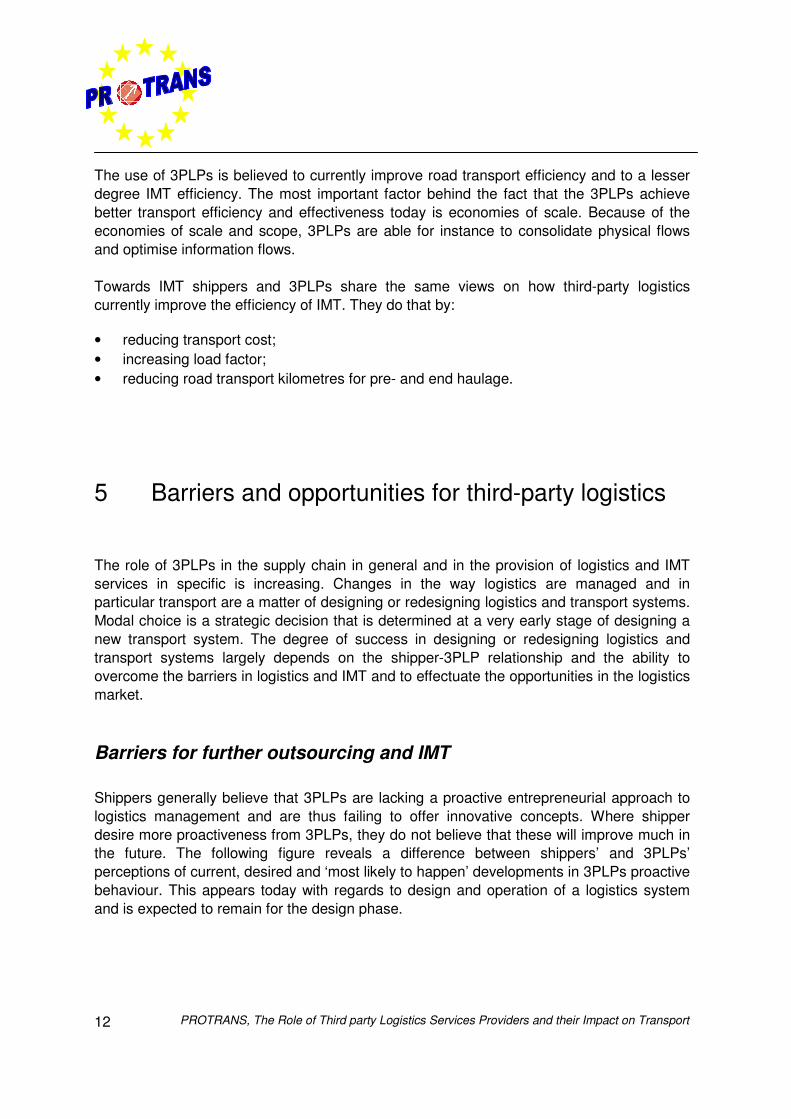
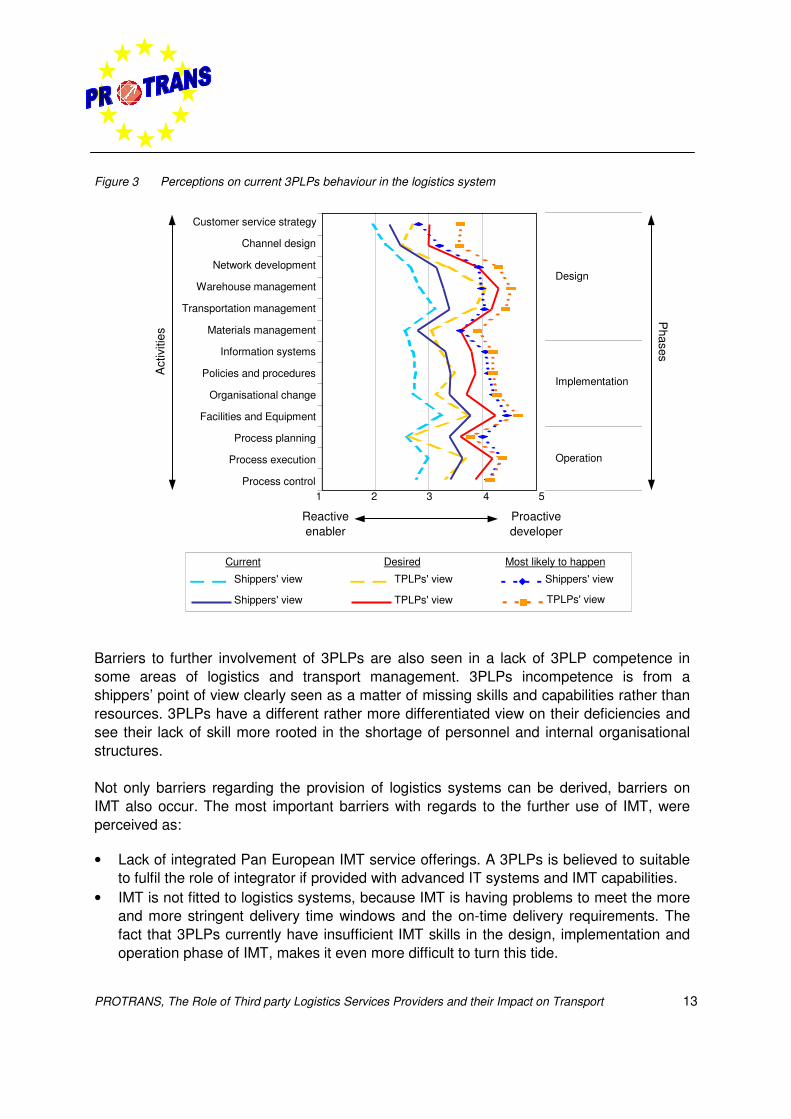
Shippers generally believe that 3PLPs are lacking a proactive entrepreneurial approach tologistics management and are thus failing to offer innovative concepts. Where shipperdesire more proactiveness from 3PLPs, they do not believe that these will improve much inthe future. The following figure reveals a difference between shippers’ and 3PLPs’perceptions of current, desired and ‘most likely to happen’ developments in 3PLPs proactivebehaviour. This appears today with regards to design and operation of a logistics systemand is expected to remain for the design phase.
PROTRANS, The Role of Third party Logistics Services Providers and their Impact on Transport 13
Figure 3 Perceptions on current 3PLPs behaviour in the logistics system
Barriers to further involvement of 3PLPs are also seen in a lack of 3PLP competence insome areas of logistics and transport management. 3PLPs incompetence is from ashippers’ point of view clearly seen as a matter of missing skills and capabilities rather thanresources. 3PLPs have a different rather more differentiated view on their deficiencies andsee their lack of skill more rooted in the shortage of personnel and internal organisationalstructures.
Not only barriers regarding the provision of logistics systems can be derived, barriers onIMT also occur. The most important barriers with regards to the further use of IMT, wereperceived as:
• Lack of integrated Pan European IMT service offerings. A 3PLPs is believed to suitableto fulfil the role of integrator if provided with advanced IT systems and IMT capabilities.
• IMT is not fitted to logistics systems, because IMT is having problems to meet the moreand more stringent delivery time windows and the on-time delivery requirements. Thefact that 3PLPs currently have insufficient IMT skills in the design, implementation andoperation phase of IMT, makes it even more difficult to turn this tide.
Customer service strategy
Channel design
Network development
Warehouse management
Transportation management
Materials management
Information systems
Policies and procedures
Organisational change
Facilities and Equipment
Process planning
Process execution
Process control
Shippers' view TPLPs' view Shippers' view
TPLPs' viewShippers' view TPLPs' view
Current Desired
1 2 3 4 5
Most likely to happen
Design
Implementation
Operation
Phases
Act
iviti
es
Reactiveenabler
Proactivedeveloper
PROTRANS, The Role of Third party Logistics Services Providers and their Impact on Transport14
• Lack of single liability of IMT according to the shippers, because of changes in laws andregulations on IMT and different actors involved in IMT.
With regards to the further use of intermodal transport there are barriers that are inherent toIMT and barrier that are rooted in the missing service offerings for IMT.
Opportunities for 3PLPs
In general opportunities for 3PLPs arise from the fact that shippers are more and moreturning to outsourcing strategies, not only in traditional operational areas, but also in areasof information and knowledge based logistics management. The 3PL industry in Europe isof a substantial size and is experiencing fast growth. The total expenditure, outsourced ornot outsourced, on logistics in Europe will grow annually between 3.5 and 3.8 % until 2005.This offers particular opportunities for solution providers that are capable of offeringservices at the high end of designing and implementing logistics systems. In general theuse of 3PLPs, especially in case of solution providers, has resulted in positive effects on thelogistics systems and there are several opportunities for 3PLPs to realise furtherimprovements. The main opportunities are:
• More proactive behaviour of 3PLPs in the optimisation of transport systems and furtherintegration of different transport modes. The solution providers can be seen as anexample since they show their capabilities in the strategic and tactical design of logisticssystems and are able to subcontract the daily operations to preferred subcontractors.
• Increase involvement of 3PLPs in the design phases of logistics systems.• Sustainable logistics by 3PLPs via consolidation of goods, mode selection, and carrier
selection. 3PLPs presently mainly contribute to the performances in IMT, theconsolidation and to the management of the carriers in the IMT. A 3PLP can furthermoreimprove the tracking information to improve the liability of intermodal transport since thisis not well developed in intermodal transport.
• 3PLPs are seen as potential facilitators of intermodal transport who will remove existingbarriers and hence make IMT more attractive. Potential future roles for 3PLPs are to actas Pan-European integrators and liability guarantors. The ‘Freight Integrator’ initiative asoutlined in the White Paper is in this respect a step in the right direction.
Finally the external aspects of IMT like regulatory measures provide opportunities that fosterthe use of IMT. Regulatory measures, like market regulations e.g. stimulation of opencompetition and transport regulations on for instance hazardous goods and loading capacityhave a positive effect on the use of IMT. This also applies for taxation, environmentalregulations and labour issues. Table 5 shows that regulations related to transport, taxationand environment have the most positive impact on the use of IMT. Almost 85% of therespondents perceive that environmental regulations on for instance road transport willfoster the use of IMT.
PROTRANS, The Role of Third party Logistics Services Providers and their Impact on Transport 15
Table 5 Impact of National and European laws on the use of intermodal transport
Marketregulations
Transportregulations
Taxation Environmentalregulations
Labour issues Technicalregulations
Negative impact 14.69% 11.74% 9.11% 0.00% 16.67% 15.00%No impact 38.16% 7.89% 22.06% 15.38% 34.17% 44.17%Positive impact 47.15% 80.36% 68.83% 84.62% 49.17% 40.83%
This perceived impact indicates that implementation of new regulatory measures on theseaspect will provide the opportunity to shift from road transport to IMT. However this does notdirectly mean that 3PLPs will shift since they will pass on the increased expenses for theirroad transport services to their clients. On the other hand regulatory measures that improvethe IMT systems provides 3PLPs the opportunity to make use of the improved IMT systems.
6 The potential for a modal shift
Since there is a general understanding that IMT could have a beneficial impact on theenvironment and on congestion intermodal transport always had a prominent spot on theagendas of national and European transport policy makers. However there are still lot ofactions to be taken to foster the use of road-rail IMT1. In order to depict a potential growth ofroad-rail, the existing and emerging market opportunities for 3PLPs in IMT have beendetermined in the PROTRANS project.
Framework of analysis
Survey
The PROTRANS partners have undertaken analyses from both the demand and the supplysides. With regards to the demand side, the value of the services offered by 3PLPs from theshippers’ point of view was assessed through a Stated Preference survey aiming to provideinsight in the factors that influence shippers’ behaviour and choices. By this survey data hasbeen gathered for different geographical corridors and four industries (Automotive, 1 In the analysis of the potential for a modal shift (the IPI research) the focus has been on intermodal road-rail
transport only, due to the selection of corridors. However, a number of conclusions can also be drawn forother types of intermodal transport (inland navigation, shortsea)
PROTRANS, The Role of Third party Logistics Services Providers and their Impact on Transport16
Chemicals, Fast Moving Consumer Goods and Steel). This data is related to transport offull-loads of non-hazardous and non-refrigerated goods. The Stated Preference surveyconsisted in 16 trade-offs between two alternatives (road-rail IMT and road transport).
Computation of the Intermodal Perception Index
Based on the gathered data for the industries, corridors and trade-offs of different actionvariables IMT, the potential market share of IMT can be computed via the IntermodalPerception Index (IPI). The IPI is the ratio of the potential market share of intermodaltransport (that can be reached by the application of a specific scenario), to the currentmarket share of intermodal transport.
Potential market share of Intermodal Transport IPI =
Current market share of Intermodal Transport
Strategies for 3PLPs on intermodal transport
Influence of 3PLPs on action variables
The potential growth of IMT depends on the degree in which action variables of IMT, liketransit time, transfer price or reliability is improved. This improvement is amongst othersdetermined by the influence of 3PLPs on these action variables. However 3PLPs can’tinfluence each action variable of IMT. For instance 3PLPs can’t impact the number ofshipments per year or the nature of goods (e.g. finished or semi-finished) since thesevariables are determined by the shipper. Hence, 3PLPs should develop strategies based onaction variables, which they can influence. In the following table a number of services arederived that can be offered by 3PLPs and which positively influence these action variables.
Table 6 Required 3PLPs services on action variables
Improvement of actionvariable Required servicesTransit time reduction • Acceleration of loading and unloading
• Better co-ordination of shipments, road transport with train schedules• Relocation of warehouses at terminal
Door-to-door transferprice reduction
• Rebates on rail price because of larger transport volumes• Economies of scales effects on the warehouse at the terminals
Shortening of trackinginformation delay
• Better integration with tracking (and management) systems of the rail mode
PROTRANS, The Role of Third party Logistics Services Providers and their Impact on Transport 17
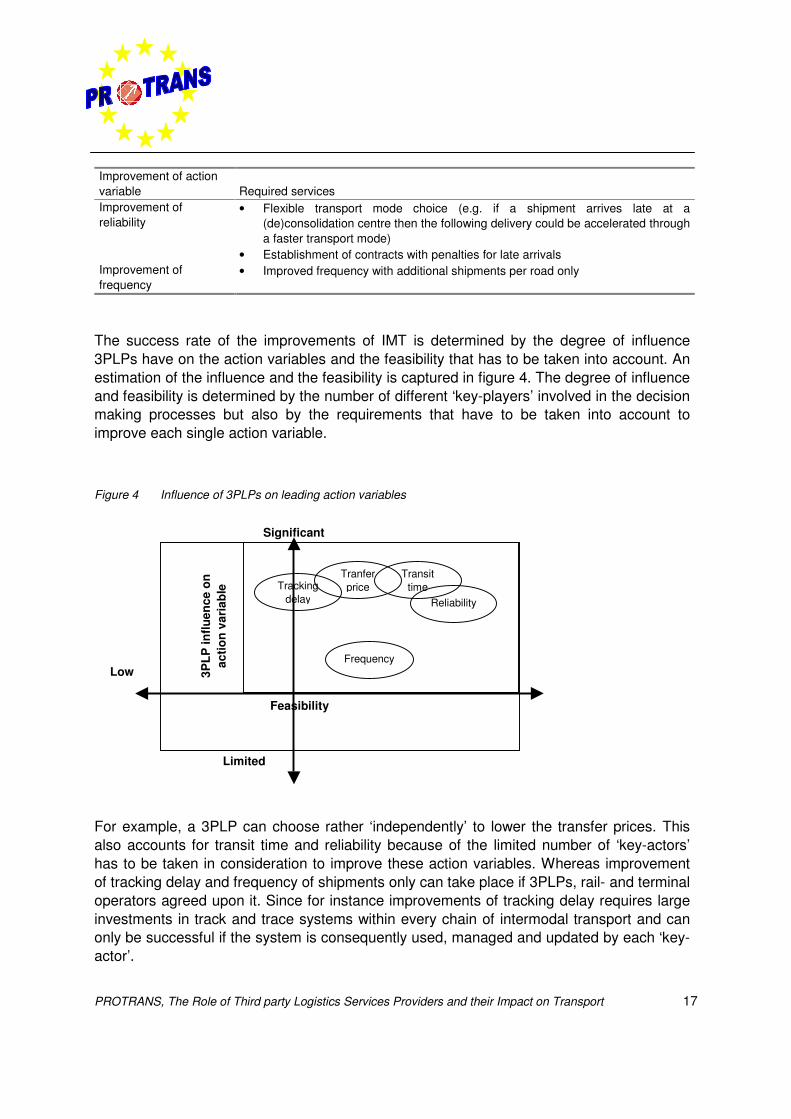
Improvement of actionvariable Required servicesImprovement ofreliability
• Flexible transport mode choice (e.g. if a shipment arrives late at a(de)consolidation centre then the following delivery could be accelerated througha faster transport mode)
• Establishment of contracts with penalties for late arrivalsImprovement offrequency
• Improved frequency with additional shipments per road only
The success rate of the improvements of IMT is determined by the degree of influence3PLPs have on the action variables and the feasibility that has to be taken into account. Anestimation of the influence and the feasibility is captured in figure 4. The degree of influenceand feasibility is determined by the number of different ‘key-players’ involved in the decisionmaking processes but also by the requirements that have to be taken into account toimprove each single action variable.
Figure 4 Influence of 3PLPs on leading action variables
For example, a 3PLP can choose rather ‘independently’ to lower the transfer prices. Thisalso accounts for transit time and reliability because of the limited number of ‘key-actors’has to be taken in consideration to improve these action variables. Whereas improvementof tracking delay and frequency of shipments only can take place if 3PLPs, rail- and terminaloperators agreed upon it. Since for instance improvements of tracking delay requires largeinvestments in track and trace systems within every chain of intermodal transport and canonly be successful if the system is consequently used, managed and updated by each ‘key-actor’.
Significant
Limited
Transittime
TranferpriceTracking
delay Reliability
Frequency
Feasibility
3PLP
influ
ence
on
actio
n va
riab
le
Low
PROTRANS, The Role of Third party Logistics Services Providers and their Impact on Transport18
Strategies of 3PLPs on intermodal transport
In order to foster the use of road-rail 3PLPs can implement IMT related strategies. Thesestrategies have been derived from interviews with stakeholders in logistics and have beenvalidated through discussion with 3PLPs already performing intermodal transport. The mainstrategy or strategies, which a 3PLP can follow, are:
• Logistic centres for (de)consolidation nearby or in conjunction with a railterminal: Efficient rail transport requires that full truckloads are shipped. However, theshare of full truck on the overall transport volume is decreasing – especially for theautomotive sector – and thus a consolidation or deconsolidation of less than truckloadshipments is necessary. Hence, a 3PLP has to provide such services at a logisticcentre on the location or nearby a rail terminal. Furthermore, the 3PLP has to performadditional services like warehousing or light assembly on these logistic centres.
• Access to rail capacity: A 3PLP can undertake a joint venture with a rail operator inorder to offer better services for customers. Such a close co-operation can improve theoverall performance. Another option is to license 3PLPs and shippers for rail transport.
• Development of intermodal transport units: Intermodal transport requires thattransport units are easy to load and unload from road to rail and vice versa. Currently, avariety of transport units exists for this purpose. Standardisation and broad applicationof transport units suitable for IMT is necessary to improve the IMT market share.
• Marketing intermodal transport: Currently, the possibilities of intermodal transportare not well known by customers. IMT has often a negative image. Thus activemarketing is needed to increase the IMT share of the overall transport volume.
• Revenue sharing between operators according to reliability: Sharing the transportrevenues between rail operators according to the reliability of delivery services. Thesystem could be based on a monitoring system involving GPS transmitters embarkedon a sample of containers.
Scenarios on Intermodal transport
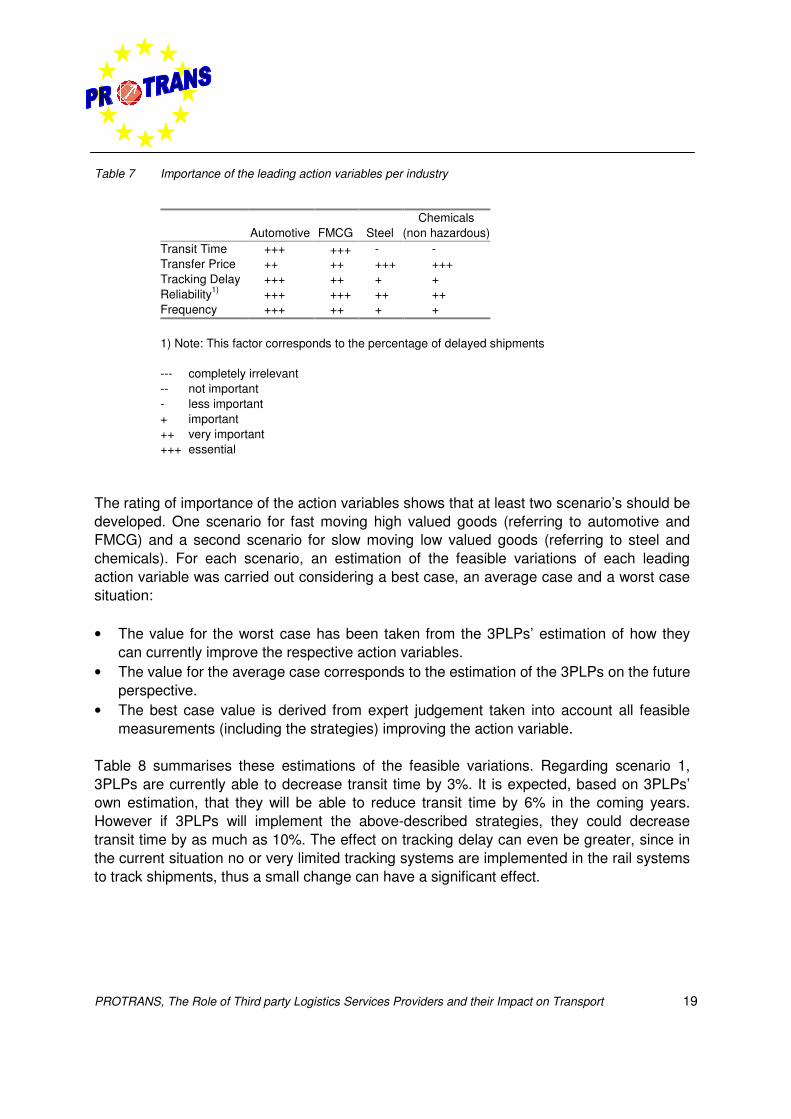
Since the value of goods and the number of shipments are high in the automotive andFMCG industries, transit time, tracking delay and reliability are more important in thesesectors than in the chemical and steel sectors. Whereas, 3PLPs active in steel andchemicals are likely to have more influence on transfer price and frequency since thesesectors are characterised by bulk because of the high batch sizes in production anddistribution. Hence, the importance of the leading variables varies per industry. Table 7depicts the rating of importance all types of shipments (Full Truckload and Less thanTruckload) and all type of transport modes per type of industry.
PROTRANS, The Role of Third party Logistics Services Providers and their Impact on Transport 19
Table 7 Importance of the leading action variables per industry
Automotive FMCG SteelChemicals
(non hazardous)Transit Time +++ +++ - -Transfer Price ++ ++ +++ +++Tracking Delay +++ ++ + +Reliability1) +++ +++ ++ ++Frequency +++ ++ + +
1) Note: This factor corresponds to the percentage of delayed shipments
--- completely irrelevant-- not important- less important+ important++ very important+++ essential
The rating of importance of the action variables shows that at least two scenario’s should bedeveloped. One scenario for fast moving high valued goods (referring to automotive andFMCG) and a second scenario for slow moving low valued goods (referring to steel andchemicals). For each scenario, an estimation of the feasible variations of each leadingaction variable was carried out considering a best case, an average case and a worst casesituation:
• The value for the worst case has been taken from the 3PLPs’ estimation of how theycan currently improve the respective action variables.
• The value for the average case corresponds to the estimation of the 3PLPs on the futureperspective.
• The best case value is derived from expert judgement taken into account all feasiblemeasurements (including the strategies) improving the action variable.
Table 8 summarises these estimations of the feasible variations. Regarding scenario 1,3PLPs are currently able to decrease transit time by 3%. It is expected, based on 3PLPs’own estimation, that they will be able to reduce transit time by 6% in the coming years.However if 3PLPs will implement the above-described strategies, they could decreasetransit time by as much as 10%. The effect on tracking delay can even be greater, since inthe current situation no or very limited tracking systems are implemented in the rail systemsto track shipments, thus a small change can have a significant effect.
PROTRANS, The Role of Third party Logistics Services Providers and their Impact on Transport20
Table 8 Estimated efficiency effects per action variable
Performance-indicator Worst case Average case Maximum caseScenario 1 Transit time 3% 6% 10%
Tracking delay 4% 7% 50%Reliability 5% 7% 12%Frequency 4% 7% 20%
Scenario 2 Transfer price 5% 9% 13%Reliability 5% 7% 12%
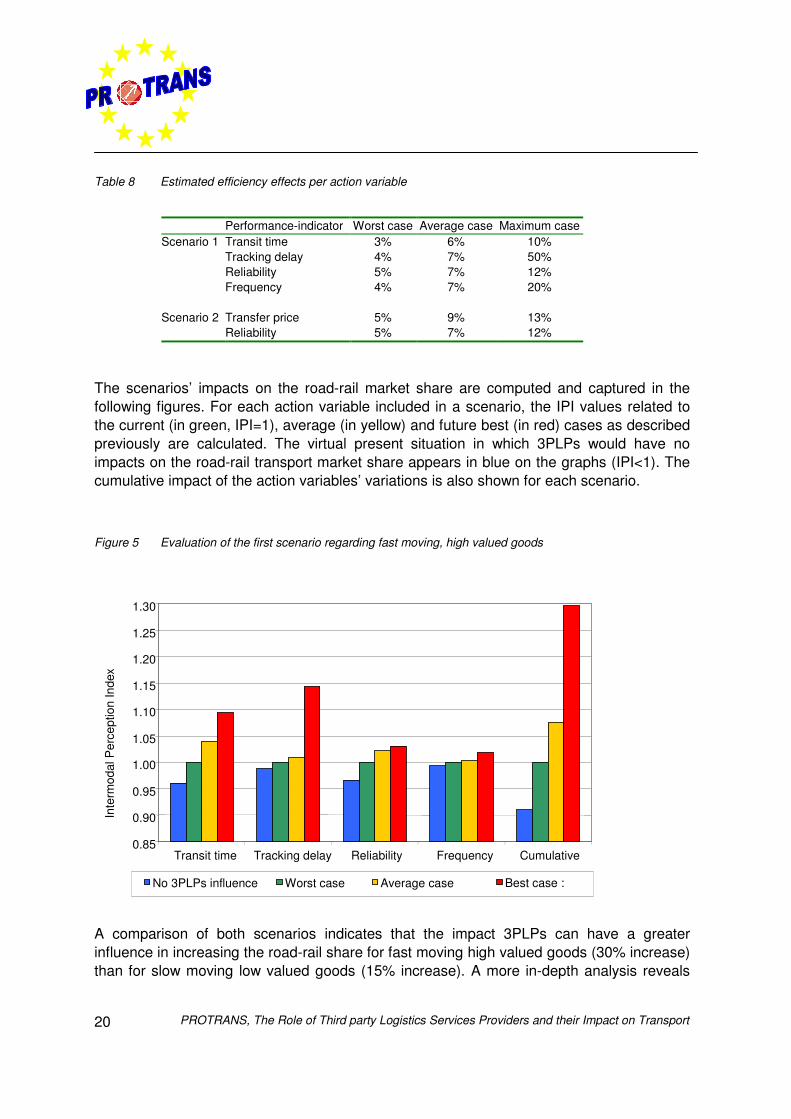
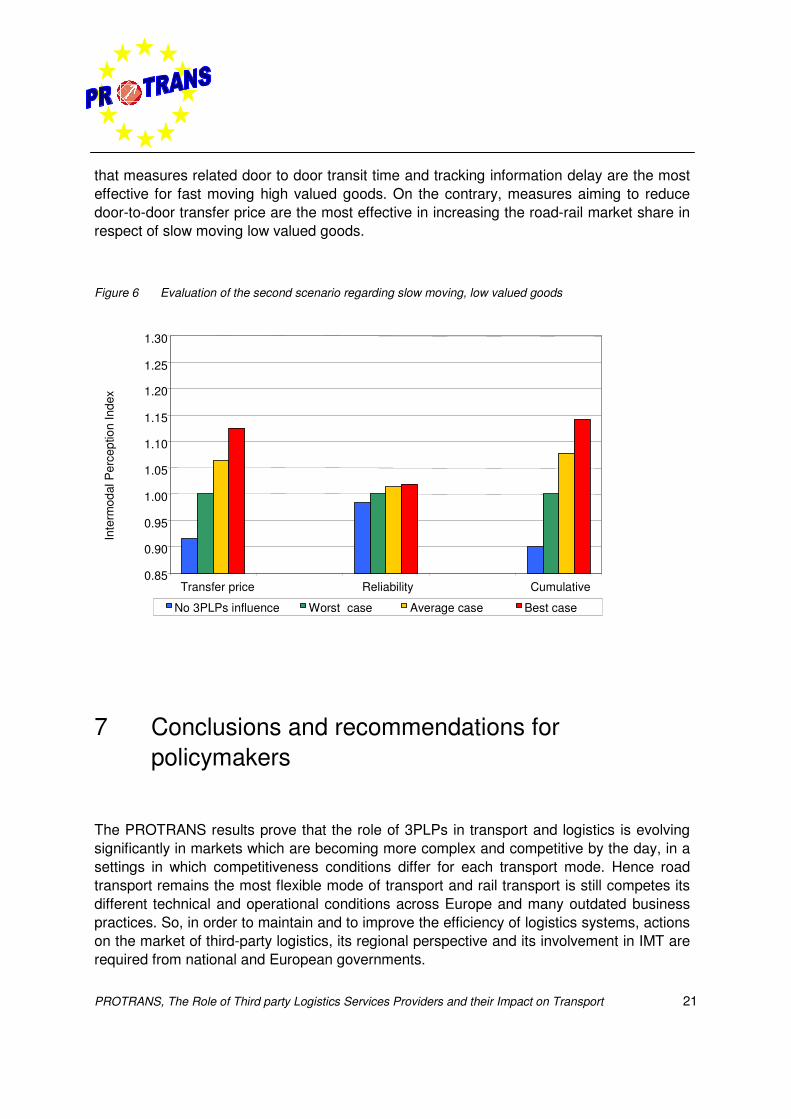
The scenarios’ impacts on the road-rail market share are computed and captured in thefollowing figures. For each action variable included in a scenario, the IPI values related tothe current (in green, IPI=1), average (in yellow) and future best (in red) cases as describedpreviously are calculated. The virtual present situation in which 3PLPs would have noimpacts on the road-rail transport market share appears in blue on the graphs (IPI<1). Thecumulative impact of the action variables’ variations is also shown for each scenario.
Figure 5 Evaluation of the first scenario regarding fast moving, high valued goods
A comparison of both scenarios indicates that the impact 3PLPs can have a greaterinfluence in increasing the road-rail share for fast moving high valued goods (30% increase)than for slow moving low valued goods (15% increase). A more in-depth analysis reveals
0.85
0.90
0.95
1.00
1.05
1.10
1.15
1.20
1.25
1.30
Transit time Tracking delay Reliability Frequency Cumulative
Inte
rmod
al P
erce
ptio
n In
dex
No 3PLPs influence Worst case Average case Best case :
PROTRANS, The Role of Third party Logistics Services Providers and their Impact on Transport 21
that measures related door to door transit time and tracking information delay are the mosteffective for fast moving high valued goods. On the contrary, measures aiming to reducedoor-to-door transfer price are the most effective in increasing the road-rail market share inrespect of slow moving low valued goods.
Figure 6 Evaluation of the second scenario regarding slow moving, low valued goods
7 Conclusions and recommendations forpolicymakers
The PROTRANS results prove that the role of 3PLPs in transport and logistics is evolvingsignificantly in markets which are becoming more complex and competitive by the day, in asettings in which competitiveness conditions differ for each transport mode. Hence roadtransport remains the most flexible mode of transport and rail transport is still competes itsdifferent technical and operational conditions across Europe and many outdated businesspractices. So, in order to maintain and to improve the efficiency of logistics systems, actionson the market of third-party logistics, its regional perspective and its involvement in IMT arerequired from national and European governments.
0.85
0.90
0.95
1.00
1.05
1.10
1.15
1.20
1.25
1.30
Transfer price Reliability Cumulative
Inte
rmod
al P
erce
ptio
n In
dex
No 3PLPs influence Worst case Average case Best case
PROTRANS, The Role of Third party Logistics Services Providers and their Impact on Transport22
These actions are not only required from the 3PL market and policies point of few, butshould also be seen in the context of the EU-enlargement and the current economicdownturn. Since the enlargement will influence logistics and transport flows, the networks inthe new member countries should be assessed to ensure network uniformity in theEuropean Union. Furthermore the current economic downturn should be taken inconsideration as well because this downturn might lead to the postponement of necessaryinvestments in IMT by both 3PLPs and operators.
Summarised can be stated that the Commission should take the initiative where regulatoryor legal measures are concerned and where intermodality depends on co-ordination atEuropean level. In this respect the Commission already has set various policy objectivesacross the different policy areas, which are convergent in their goals towards thecommunity’s transport policy i.e. the sustainability of the entire transport system. Theseobjectives have been supported by political documents the most important ones being thehere above described Commission’s White and Green Papers and Directives.
Guiding principles
To facilitate the increasing role of 3PLPs in transport systems and to IMT, Europeanpolicymakers should take action in the next few years. These actions should be based onfour common principles:
• Logistics integration: Integration of logistics systems provides the opportunity tooptimise the intermodal chain management and enables to inform the shipper and3PLPs. Hence unified communication systems for data exchanges are required.
• Effective tariff integration: Integration of all tariffs of the different services in IMT toone single ticket that is provided by one single point of contact facilitates an easier useof the IMT system.
• Administrative integration: An effective administrative integration, by means of anintegrated intermodal Bill of Lading (B/L), allows to overcome problems derived fromdealing with a number of different transport modes and their correspondent cargodocuments.
• Physical integration: Providing seamless connection between two consecutive stagesof the trip enables to benefit from the advantages of each transport mode.
PROTRANS, The Role of Third party Logistics Services Providers and their Impact on Transport 23
Recommendations for policy actions
In the Commission’s White and Green Papers and Directives a lot of initiatives to facilitatethe increasing role of 3PLPs and to improve IMT are already depicted. However, based onthe PROTRANS project the following actions should be taken by the Europeanpolicymakers.
Improving logistics regions
Policymakers can and should align infrastructure plans on different levels, from European toregional level, in order to improve the transport connections, which makes efficientconsolidation of goods possible in and between regions. But they should also stimulateintegrated logistics strategies in regions, in which public and private partners participate.
Improving of railways
The greatest challenge is to liberalise the railway markets, allowing e/g the access forrailway operations to parties other than traditional railway companies, amongst others3PLPs, in order to develop a more efficient, competitive and reliable IMT system in Europe.
However policymakers should also improve the rail infrastructure. New infrastructureinvestments are required since duration of the trip, price, tracking and tracing and reliabilityare the key variables that have a strong impact on the potential market share of IMT.
In order to improve the railways, policymakers should furthermore develop an integratedinfrastructure pricing policy. An integrated infrastructure pricing policy across EU memberStates might rise the contributions of the different transport modes towards sustainabledevelopment and help 3PLPs choose the most suitable transport mode on a morerepresentative economic basis.
However, pricing policies do not imply a legacy that 3PLPs will shift from road to road-rail,since they will simply pass on the increased expenses to their clients. Hence policymakersshould not only ‘oppress’ road transport mode without making the alternative (IMT) morecompetitive. Policymakers could for instance increase the liability of IMT through stimulationof tracking systems or improve the integrated IMT services by ‘facilitating’ the logisticsmarket to realise the role of Pan European integrator.
Regarding railways, European policymakers should finally promote an independentcertification organisation, which is charged to certify the quality of service of intermodaloperators, in order to realise sharing the transport revenue between rail operators.
PROTRANS, The Role of Third party Logistics Services Providers and their Impact on Transport24
Development of transfer points between modes
In order to develop transfer points between transport modes policymakers should promoteefficient transfer locations, by creating for instance investment incentives. But alsopromotion of freight villages will facilitate the development of transfer points. The advantageof these freight villages lies in the possibility to consolidate transport flows from differentorigins into bulk flows required for efficient use of IMT. At last the development of anIntegrated Logistic Master Plan should stimulate 3PLPs and shippers to locate on theselarge freight villages in order to consolidate flows.
Harmonisation of regulations
In order to foster the use of IMT by 3PLPs, EU Members States should harmonise theirregulations on intermodal transport units, carrier liability, labour and data processing. Firstof all standardisation of some characteristics of intermodal units (containers and swapbodies) is required to overcome delays in handling. A second aspect that needs to beharmonised is the carrier liability in order to be able to offer IMT clients a clear set ofcoherent, comprehensive and transparent liability conditions. Furthermore harmonisation oflabour conditions is an important rule of competition. Finally the Commission could providea legal framework on intermodal real-time electronic information systems to achieve dataprocessing systems and closer integration through the whole supply chain.
Marketing of intermodality
IMT should be marketed better. The European Commission and European organisationsand associations should facilitate information-related initiatives to improve overallawareness amongst shippers of IMT. The Commission should also promote educationinitiatives to expanding know-how and specialised skills on IMT amongst 3PLPs.
Evaluate intermodal processes
The last action that the European policy should take is the development of the criteria forassessing the impact of IMT on the environment, employment and social and regionaldevelopment. Hence further research should be encouraged to collect data on IMT on arevolving bases. This requires co-operation in data collection and data monitoring bydifferent Directorate Generals (e.g. DG Enterprise, DG Environment) and co-ordination byDG TREN.
PROTRANS, The Role of Third party Logistics Services Providers and their Impact on Transport 25
Chapter 1 Introduction
1.1 Background and definitions
Third party logistics service providers (3PLPs) become increasingly important because mostcompanies seek to outsource logistics tasks. However, 3PLPs perform their services formany different clients. Thus a simple outsourcing approach of the given structures (i.e.,operating existing warehouses and transport means for each customer separately) will notresult in overall optimised logistics networks. Hence, a 3PL must have a betterunderstanding how to organise their networks and on how to supply added value serviceswhich have greater complexity compared to the ‘traditional’ simple forwarding services.
The major 3PLPs are faced with a number of problems and challenges:
• They have to locate their scope in terms of services offered to shippers.• They have to extend their geographical coverage, offering a really pan-European
service.• They have to organise their network, combining the unique selling points of partners.• They have to offer a variety of transport options, including the use of intermodal
transport.• They have to optimise their transport processes with the aim of decoupling the rise of
economic growth from the rise of transport volume (reducing the negative effect on theenvironment).
• They have to supply additional services to their customers including the operation andmanagement of complex distribution/supply structures for their customers.
Although a lot of information has been gathered in the past couple of years, the impact androle of 3PLPs on transport, especially on intermodal transport on a European scale, still hasto be made. Also, a structured analysis of the main logistics regions and the reasons of theirsuccess hasn’t been carried out at a European level so far. In addition, there has beensome research on the perception of shippers regarding the use of intermodal transport, butnot from the 3PLP point of view.
PROTRANS, The Role of Third party Logistics Services Providers and their Impact on Transport26
Within the 5th Framework Programme, a specific task has been dedicated to this role of3PLP and their impact on transport. Main objectives of this task are:
• map and analyse (SWOT-analysis) the European 3PLPs market;• detail the most important challenges and determine barriers, success and failure factors;• assess the future importance of intermodal transport for the strategies of 3PLPs
To meet this task and to fill-in these objectives a group of companies (consulting firms,research organisations and universities, have formed a consortium that has designed thePROTRANS proposal. The main goal of the PROTRANS project is to identify the mostimportant challenges, to determine barriers, success and failure factors and to assess thefuture importance of intermodal transport for the strategies of 3PLPs on a European level. Inother words to determine the role of 3PLPs and their impact on transport.
The PROTRANS project is carried out by order of the European Commission in the periodJanuary 2000 and December 2002, the following project partners participate:
• Buck Consultants International (BCI)• Cranfield University (CU)• Zentrum für Logistik und Unternehmungsplanung GmbH (ZLU)• Fraunhofer Institut Materialfluss und Logistik (IML)• Ecorys Transport (NEI)• Stratec S.A. (SC)• PTV Planung Transport Verkehr A.G. (PTV)• Linköping Universitet (LU)• Technische Universität Berlin (TUB)• Environment, Transport & Planning (ETP)• Louis Berger S.A. (LB)
The first project partner BCI is also the overall co-ordinator of the project.
1.2 Objectives of PROTRANS
As described above the main goal of the PROTRANS project is to determine the role of3PLPs and their impact on transport on a European level. Derived from this main goal, thefollowing research objectives of the PROTRANS project can be listed:
PROTRANS, The Role of Third party Logistics Services Providers and their Impact on Transport 27
• Development of a theoretical framework for an analysis of the 3PLP market in Europe;• Description/mapping of scope (a/o. sector specialisation, business sectors of clients,
output volumes, geographical coverage network and transport options and important3PLPs in Europe, including a business profile;
• Identification of 15 main logistics regions in Europe, where a concentration of 3PLps canbe found, in conjunction with a node position in infrastructure networks and the mainEuropean networks;
• Analysis of the reasons why these regions have become successful as logistics hubs;• Analysis of present and future requirements (scope, course, network, transport options)
of 50 leading shippers operating on a European scale;• Review of the services offered by 3PLPs as an answer to the requirements posed;• Analysis of the existing barriers at leading 3PLPs to develop pan-European integrated
logistics serves;• Computation of the Intermodal Perception Index;• Integration of results on intermodal market demands, 3PLP perception and 3PLP future
strategies;• Defining of recommendations and actions;• Dissemination of project results.
1.3 Methodological approach
In order to meet the objectives of the PROTRANS project five different Work Packageshave been defined with the following research activities, which are mentioned in table 1.1.In annexe 1 a description of each Work Package is provided. This table below alsodescribes the involved project partners.
Table 1.1 Activities per Work Package
Work Package Description Work Package leader Involved partners0 Project Management BCI All partners
1 Analysis of the 3PL market NEI1.1 Analysis of the 3PL market in Europe CU, IML, NEI, LiU,
ETP1.2 Mapping most important 3PLPs CU, IML, NEI, LiU,
ETP
PROTRANS, The Role of Third party Logistics Services Providers and their Impact on Transport28
Work Package Description Work Package leader Involved partners2 Analysis of main European logistics
regionsBCI
2.1 Identification of logistics regions BCI, CU, ZLU, LiU,ETP
2.2 Analysis of successful regions BCI, CU, ZLU, LiU
3 Market demands and services offeredby 3PLPs
CU
3.1 Analysis of present and futurerequirements
BCI, CU, SC, NEI,LiU, TUB, LB
3.2 Review of 3PLP services BCI, CU, LU, TUB,LB
3.3 Analysis of existing barriers BCI, CU, NEI, LiU,TUB, LB
4 Intermodality as an integral part of panEuropean strategies
SC
4.1 Computation of the IntermodalPerception Index
CU, SC, PTV
4.2 Integration of the results of 3.1, 4.1 and3.3
BCI, ZLU, IML, SC,PTV
4.3 Recommendations for policy actions SC, PTV, BCI, CU
5 Conclusions, recommendations anddissemination
BCI
5.1 Conclusions and recommendations BCI, ZLU5.2 Dissemination BCI, CU
For the analysis of the current 3PLP market in Work Package 1 a database is developed.This database is built in MS–Access and structured according a typology of 3PLPs, whichencompasses e.g. size, type of clients and network structure of 3PLPs. The developeddatabase will be used in other Work Packages as well.
In Work Package 2 a model is used, in which different elements of a logistics region likeinfrastructure, presence of 3PLPs and logistics policies can be rated. Furthermore aassessment tool is developed to compare the rating of logistics regions with benchmarkregions in order to analysis the success and failure factors of these studied regions.
Two rounds of surveys gain insight in the market demands and services offered by 3PLPs.The surveys have been conducted as part of Work Package 3. In order to detectdevelopments in the logistics services the surveys were carried out separately with almost ayear in between.
Finally a stated preference survey is developed in PROTRANS for Work Package 4‘Intermodality as an integral part of pan European strategies’. The second round survey inWork Package 3 was also used to conduct this stated preference survey. To analyse the
PROTRANS, The Role of Third party Logistics Services Providers and their Impact on Transport 29
intermodality of 3PLPs the results of the stated preference survey have been used to ‘fill’ amodel that can calculate the potential market share of intermodal transport.
1.4 Report structure
The results of Work Packages 1 till 4 are captured in this final deliverable of thePROTRANS project. Since concepts like 3PLPs and supply chain management are relevantfor the total project, the main definitions are described in the following chapter, chapter 2.This chapter also provides a snapshot of the 3PLP market in Europe.In the third chapter 13 logistics regions are identified and analysed why some regionsbecome successful and why some others don’t.
Chapter 4 provides insight in the shippers’ and 3PLPs’ views on present and future marketdemands on logistics and transport systems in Europe. This accounts not only roadtransport but also intermodal transport. Furthermore this chapters describes how thesedemands are and will be facilitated by 3PLPs.
In the current situation of the market demands of logistics services barriers andopportunities for further outsourcing of logistics and intermodal transport can be identified.The fifth chapter of this deliverable describes these barriers and opportunities.
Not only the existing and emerging market opportunities for 3PLPs in intermodal transportare determined in the PROTRANS project. This deliverable also describes a potentialmarket share of intermodal transport. To realise this market share improvements strategiesin this mode of transport are required. In chapter 6 the analysis of the potential marketshare and its requirements are elaborated.
Finally the overall conclusions are captured in chapter 7. Based on these conclusionsrecommendations have been derived for policy actions on the 3PL market and onintermodal transport.

PROTRANS, The Role of Third party Logistics Services Providers and their Impact on Transport30
PROTRANS, The Role of Third party Logistics Services Providers and their Impact on Transport 31
Chapter 2 Third-party logistics marketoverview
2.1 Introduction and definitions
The third-party logistics market is becoming more complex. Success in this market isdetermined by the speed with which a supply chain adapts to changes in customerdemands, emerging distribution channels and new product introductions. In this chapter themarket of third-party logistics providers (3PLPs) in Europe is described. Before defining a3PLP in more detail, it is important to know what definitions of logistics and supply chainmanagement are taken into account in the PROTRANS project. For these definitions use ismade of the results of the TRILOG project (1999).
Definition of logistics
Based on the operational definition of logistics as used in the TRILOG project anddeveloped by the Council of Logistics Management, the definition of logistics used in thePROTRANS project is:
"Logistics is that part of the process that plans, implements, and controls theefficient, effective flow and storage of goods, services, and related information fromthe point of origin to the point of consumption in order to meet customers'requirements."
Regarding this definition the following remarks should be taken in consideration:
• The point of origin refers to a certain point in the supply chain from where the productsare transported. This point is not a fixed point when compared between different supplychains, but can be different according to the process that is analysed: a “movableorigin”.
• Financial activities, computing services and other activities that contribute to the supplychain, and have to be processed from origin to consumption, could enter the definition of
PROTRANS, The Role of Third party Logistics Services Providers and their Impact on Transport32
logistics. However, they are regarded as part of the term “services” in the definitionabove.
• Logistics can be applied to various scales (ranging from small production cells overlarge enterprises up to international domains).
• Implementing does not necessary imply physical action (such as transportation,warehousing, i.e.) but rather refers to the process of carrying out the defined plan.
Definition of supply chain management
Logistics management is an integrative process that seeks to optimise the flow of materialsand supplies through the organisation to the customer. If all firms involved in a particularsupply chain optimise their logistical systems independently of other firms in that chain themanagement of product flow across the whole chain, or ‘pipeline’, is likely to be sub-optimal.Attempts to overcome this problem have resulted in the creation of ‘supply chainmanagement’, in which the logistics activities are synchronised crossing geographical andorganisational boundaries. In PROTRANS the following definition of supply chainmanagement is used.
“Supply Chain Management (SCM) extends the principles of logistics acrossenterprise boundaries.”
Definition of Third-party logistics service provider (3PLP)
In the last decade many definitions of 3PL have been written. These definitions differ from‘outsourcing logistics functions’ to ‘strategic alliances in which shipper and provider bothwork on the best possible logistics solutions’. Several definitions that can be found in recentliterature are elaborated in annexe 2. Based on these definitions, for the PROTRANSproject the following definition of Third-party logistics has been selected:
Third-party logistics (3PL) are activities carried out by an external company on behalfof a shipper and consisting of at least the provision of management of multiplelogistics services. These activities are offered in an integrated way, not on a stand-alone basis. The co-operation between the shipper and the external company is anintended continuous relationship.
The shipper refers to the party that either sends or receives the goods; the source ordestination of the goods. External implies that the company is not being a subsidiarycompany in an exclusive unilateral relationship with the shipper (mother company). Basedon the above definition it can be stated that a 3PLP is a company who provides Third-partylogistics.
PROTRANS, The Role of Third party Logistics Services Providers and their Impact on Transport 33
Lately 4PL (Fourth-party logistics) have appeared in literature in connection to third partylogistics. This is originally a name for an Arthur Andersen consulting, which is starting to beused by different industry actors. Andersen define 4PL as: “a supply chain integrator thatassembles and manages the resources, capabilities, and technology of its ownorganisation with those of complementary service providers to deliver acomprehensive supply chain solution.” 4PL is normally connected to solution generatingand non-asset based providers or in more popular terms as a 3PL without an asset base.The 4PL term is not used in the 3PL typology as explained in this deliverable, as it is notlogically deductible from the construction of the term 3PL. However the focused issuesbehind 4PL are considered by the academically much more established positioningdimensions standardisation versus solution and asset based versus non-asset based.
Definition of intermodal transport
Since an element of the objective of the PROTRANS project is to point out the mostimportant challenges to intermodal transport (IMT) in relation to logistics and to assess theimportance of intermodal transport for the strategies of 3PLPs, it is important to know whichdefinition of intermodal transport is used in the PROTRANS project.
There are different definitions of intermodal transport and the related concepts of combinedtransport and multimodal transport. The ECMT (European Conference of Ministers ofTransport) and the European Committee for standardisation (CEN) use the followingdefinition for intermodal transport:
“Intermodal transport is the movement of goods in one and the same loading unit orvehicle, which uses successively several modes of transport without handling of thegoods themselves in changing modes.”
The ‘working definition’ used in the PROTRANS project is the same as the EC definition ofintermodal transport, which goes beyond the ECMT/CEN definition, and corresponds withthe ECMT/CEN definition of multimodal transport:
“Multimodal Transport is the movement of goods whereby at least two differentmodes are used in a door-to-door transport chain.”
PROTRANS, The Role of Third party Logistics Services Providers and their Impact on Transport34
2.2 Typology of the logistics service provider
With the main definitions being set, the next step is to develop a proper structure for 3PLPs.The purpose of the typology used in the PROTRANS project is to classify the 3PLPs for theanalysis of the 3PLP market in Europe, as well as for the development of the database,which will be used throughout the project. In this typology attention has also been paid toelements that have a relation to the application of intermodal transport by 3PLPs, since thisis part of the objective of the PROTRANS project and to more general elements, whichindicate for instance the size of a company.
The typology of 3PLPs used in the PROTRANS project contains the following mainelements:
• origination;• the type of clients that are served;• the network structure that is covered;• the type of activities that are carried out for the client;• the level of decision making;• transport means served;• size of the 3PLP;• regions of location;• degree of interrelationship between 3PLPs.
The above aspects will be further discussed in the following sub-paragraphs.
Origination of the 3PLP
In the 1980s, traditional logistics service providers entered the 3PL market. These providersare companies that have emerged from a traditionally strong position in either transportationor warehousing. In the 1990s, network players started as 3PLPs. These actors are mainlyparcel and express companies. In the late 1990s actors from non- traditional logistics areassuch as information technology, management consultancy and financial services, startedentering the market.
For the design of the database in the PROTRANS project, the following classification for theorigination of logistics service providers will be used:
• Carriers, i.e. road haulage companies, shipping companies, rail transport companies,and air freight companies.
• Forwarders and brokers.
PROTRANS, The Role of Third party Logistics Services Providers and their Impact on Transport 35
• Storage and warehousing companies.• Mail and express companies.• Shippers (manufacturer/wholesaler/retailer).• Actors from non-traditional logistics areas: Information technology providers, consultants
and financial service providers.
Type of clients
The 3PLP can offer its services to different types of industries. The following classification ofthe key clients of the 3PLP, based on the code used by Eurostat, is used for the typology.Annexe 3 describes the sub-categories of this classification.
• dry minerals;• chemicals and energy;• pharmaceuticals;• transport equipment/ metal products;• automotive;• electronics (HI-Tech);• food;• textiles;• wood and paper;• retailers/ wholesalers food;• retailers/ wholesalers non-food);• medical technology;• other manufacturing industries (e.g. furniture, jewellery, toys);• general (in case all categories apply);• unspecified.
The network structure
To describe the scale of the network of the 3PLP in Europe, an overview has been madefrom regional to Pan-European level of:
• the locations of the clients of the 3PLP within Europe;• the locations of the facilities that are operated within Europe by the 3PLP.
It is relevant that not only the facilities are indicated that are owned by the 3PLP, but that anoverview is made of all the facilities that are actually controlled and operated by the 3PLP;the facilities that the 3PLP is financially committed to. This gives an overview of the network
PROTRANS, The Role of Third party Logistics Services Providers and their Impact on Transport36
that the 3PLP is able to cover. The type of facilities that can be operated by the 3PLP, andthat will be included in the database, are:
• Warehouses• Offices• HUBs• Bulk Storage• Temperature controlled warehousing.
Type of activities that are carried out for the client
The 3PLP can provide different activities. Based the 3PLP activities listed in several studiesthe following final set of activities is used for the typology of the 3PLP in the PROTRANSproject:
• financial services;• information technology;• warehousing & inventory management;• transport planning & management;• consulting services;• product related service (VAL-activities and postponed activities);• forwarding and customs activities.
In annexe 4 the sub-categories of activities within these main categories are furtherdetailed.
Decision making process
Regarding the above-described activities of the 3PLP, a separation can be made betweendifferent levels of decision making. When analysing the decision making process the pointof view of the shipper is taken into account. This will allow for an indication of the level ofoutsourcing that has taken place (e.g. which parts of the decision making process of theshipper are outsourced to the 3PLP). This makes it possible to analyse the 3PLPs role in afurther development of intermodal transport within Europe.
In the literature different typologies for the decision making process can be found. Thesetypologies vary from two, three and four layers of decision making process. The two-layerdefinition is based on operational logistics services and logistics chain management.
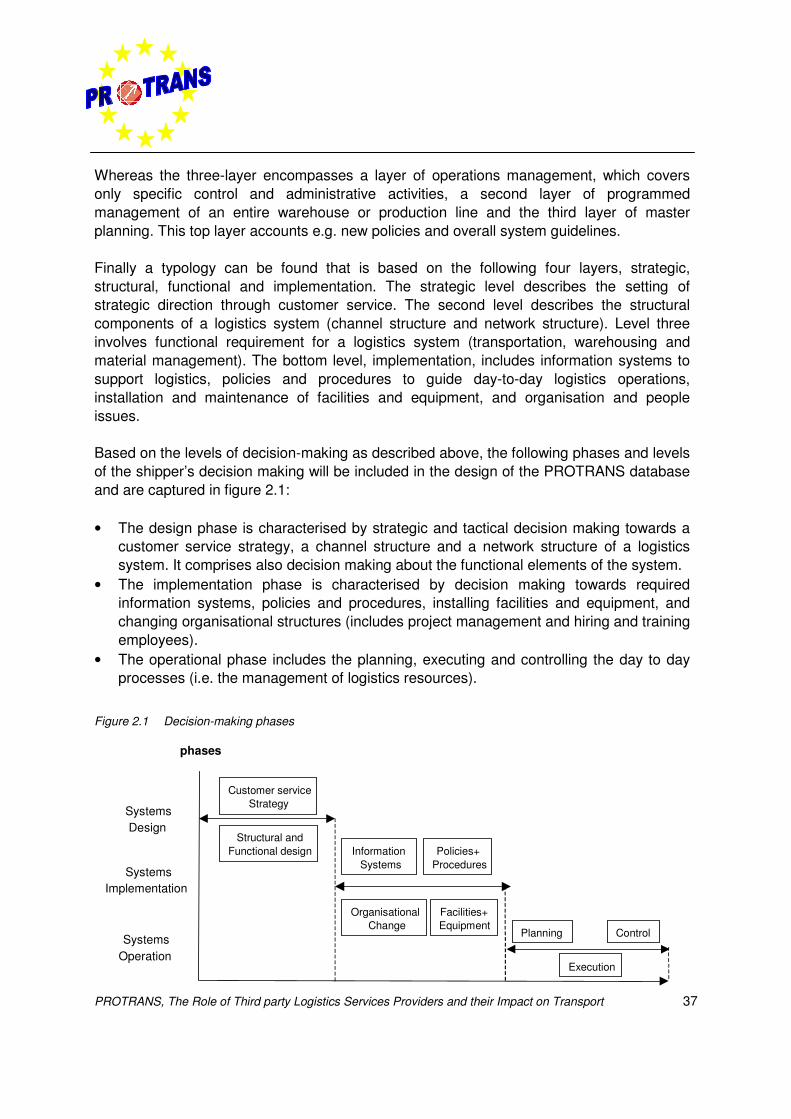
PROTRANS, The Role of Third party Logistics Services Providers and their Impact on Transport 37
Whereas the three-layer encompasses a layer of operations management, which coversonly specific control and administrative activities, a second layer of programmedmanagement of an entire warehouse or production line and the third layer of masterplanning. This top layer accounts e.g. new policies and overall system guidelines.
Finally a typology can be found that is based on the following four layers, strategic,structural, functional and implementation. The strategic level describes the setting ofstrategic direction through customer service. The second level describes the structuralcomponents of a logistics system (channel structure and network structure). Level threeinvolves functional requirement for a logistics system (transportation, warehousing andmaterial management). The bottom level, implementation, includes information systems tosupport logistics, policies and procedures to guide day-to-day logistics operations,installation and maintenance of facilities and equipment, and organisation and peopleissues.
Based on the levels of decision-making as described above, the following phases and levelsof the shipper’s decision making will be included in the design of the PROTRANS databaseand are captured in figure 2.1:
• The design phase is characterised by strategic and tactical decision making towards acustomer service strategy, a channel structure and a network structure of a logisticssystem. It comprises also decision making about the functional elements of the system.
• The implementation phase is characterised by decision making towards requiredinformation systems, policies and procedures, installing facilities and equipment, andchanging organisational structures (includes project management and hiring and trainingemployees).
• The operational phase includes the planning, executing and controlling the day to dayprocesses (i.e. the management of logistics resources).
Figure 2.1 Decision-making phases
phases
Customer serviceStrategy
Structural andFunctional design Information
SystemsPolicies+
Procedures
Organisational Change
Facilities+Equipment
SystemsDesign
SystemsImplementation
SystemsOperation
Planning
Execution
Control
PROTRANS, The Role of Third party Logistics Services Providers and their Impact on Transport38
Transport means served
The 3PLP serves different types of transport means to carry out logistics activities, like rail,different types of trucks, airline, barge and seagoing vessel. These transport means can befurther differentiated according to type of transport service (not all combinations betweenthe mentioned transport means and the types of transport service are relevant):
EXP = ExpressLTL = GroupageFTL = Full truck loadINT = Intermodal transportCRS = CourierserviceFCL = Full container loadLCL = Less than container loadBLK = Bulk
Size of the 3PLP
For the typology of 3PLPs used in the PROTRANS project the size of the 3PLP is alsorelevant. This can be characterised by:
• The annual turnover of the 3PLP• The number of employees of the 3PLP• The mother-daughter relationships• Transport (number of shipments, tonnes)• Warehouses (number of warehouses (operated), m2).
Since information on the last two characteristics is not always available, the database willonly be filled on these characteristics if possible.
3PLP regions
In order to gain insight in the regional perspective of third-party logistics the element of3PLP regions has been included in the database as part of the typology of 3PLPs. In thefollowing chapter this regional perspective is elaborated.
PROTRANS, The Role of Third party Logistics Services Providers and their Impact on Transport 39
Degree of interrelationship between 3PLPs
Finally the degree of interrelationship between 3PLPs is part of the typology of the 3PLP.Different 3PLPs might co-operate (nationally or internationally) to optimise their services, toa different extent. For instance, in Spain the 3PLPs tend to co-operate to save moneyduring transportation or warehousing. For example 3PLP wants to transport items frompoint A to point B and another 3PLP wants to transport items from point B to A. By sharing atruck fleet, both 3PLPs maximise their profits and save money because during thetransportation the fleet is never empty.
According to the degree of inter-relationship the following types could be distinguished:
• Isolated 3PLP: no interrelationships with others;• Partially related with others: just in particular cases inter-relationships are established;• Totally involved: these 3PLPs are involved in a national or international logistics network
or strategic alliance.
2.3 3PLP database development
As described in paragraph 1.2 one of the objectives of PROTRANS was to develop arelational database of 30 main European logistics service providers for easy reference inthe following tasks in the PROTRANS project. The design of the database is based on thetypology as described in the previous paragraph 2.2. The database has been written in MS–Access and structured to receive information in the most efficient and user-friendly way. Thefull database structure has been described in annexe 5. The information filled in per 3PLrecord is structured in five main input screens:
• Overview of parent companies• 3PLP general information• 3PLP facilities• 3PLP transport means• 3PLP client information
Figure 2.2 shows an example of the 3PLP facilities input screen.
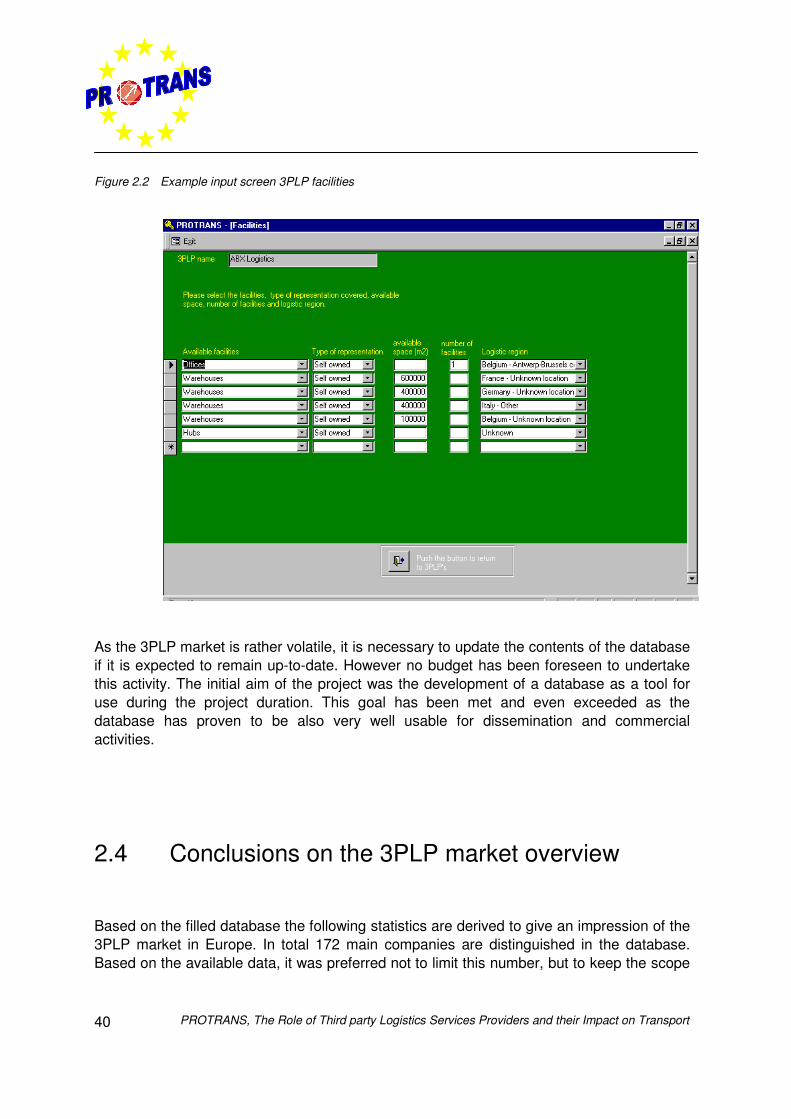
PROTRANS, The Role of Third party Logistics Services Providers and their Impact on Transport40
Figure 2.2 Example input screen 3PLP facilities
As the 3PLP market is rather volatile, it is necessary to update the contents of the databaseif it is expected to remain up-to-date. However no budget has been foreseen to undertakethis activity. The initial aim of the project was the development of a database as a tool foruse during the project duration. This goal has been met and even exceeded as thedatabase has proven to be also very well usable for dissemination and commercialactivities.
2.4 Conclusions on the 3PLP market overview
Based on the filled database the following statistics are derived to give an impression of the3PLP market in Europe. In total 172 main companies are distinguished in the database.Based on the available data, it was preferred not to limit this number, but to keep the scope
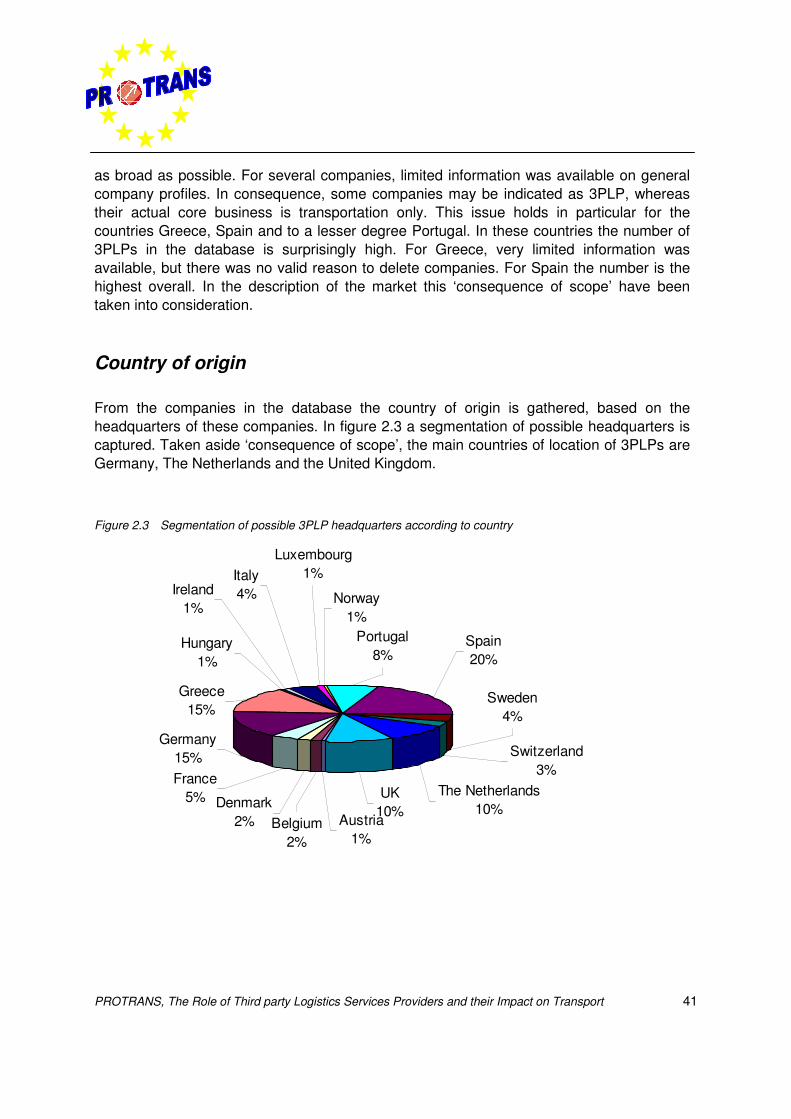
PROTRANS, The Role of Third party Logistics Services Providers and their Impact on Transport 41
as broad as possible. For several companies, limited information was available on generalcompany profiles. In consequence, some companies may be indicated as 3PLP, whereastheir actual core business is transportation only. This issue holds in particular for thecountries Greece, Spain and to a lesser degree Portugal. In these countries the number of3PLPs in the database is surprisingly high. For Greece, very limited information wasavailable, but there was no valid reason to delete companies. For Spain the number is thehighest overall. In the description of the market this ‘consequence of scope’ have beentaken into consideration.
Country of origin
From the companies in the database the country of origin is gathered, based on theheadquarters of these companies. In figure 2.3 a segmentation of possible headquarters iscaptured. Taken aside ‘consequence of scope’, the main countries of location of 3PLPs areGermany, The Netherlands and the United Kingdom.
Figure 2.3 Segmentation of possible 3PLP headquarters according to country
Belgium2%
UK10%
Germany15%
Greece15%
Hungary1%
The Netherlands10%
Sweden4%
Portugal8%
France5% Denmark
2%
Norway1%
Ireland1%
Italy4%
Luxembourg1%
Austria1%
Switzerland3%
Spain20%
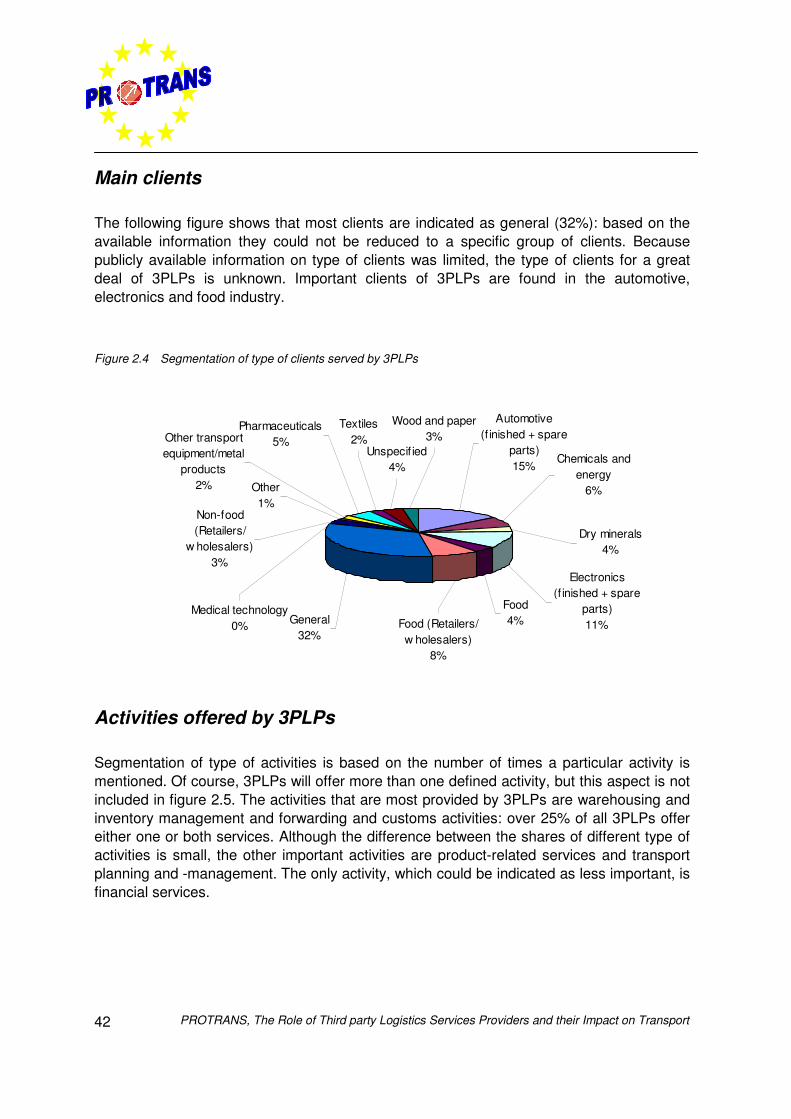
PROTRANS, The Role of Third party Logistics Services Providers and their Impact on Transport42
Main clients
The following figure shows that most clients are indicated as general (32%): based on theavailable information they could not be reduced to a specific group of clients. Becausepublicly available information on type of clients was limited, the type of clients for a greatdeal of 3PLPs is unknown. Important clients of 3PLPs are found in the automotive,electronics and food industry.
Figure 2.4 Segmentation of type of clients served by 3PLPs
Activities offered by 3PLPs
Segmentation of type of activities is based on the number of times a particular activity ismentioned. Of course, 3PLPs will offer more than one defined activity, but this aspect is notincluded in figure 2.5. The activities that are most provided by 3PLPs are warehousing andinventory management and forwarding and customs activities: over 25% of all 3PLPs offereither one or both services. Although the difference between the shares of different type ofactivities is small, the other important activities are product-related services and transportplanning and -management. The only activity, which could be indicated as less important, isfinancial services.
Textiles2%
Unspecif ied4%
Other1%
Wood and paper3%
Medical technology0%
Non-food (Retailers/
w holesalers)3%
Other transport equipment/metal
products2%
Pharmaceuticals5%
General32%
Food4%Food (Retailers/
w holesalers)8%
Electronics (f inished + spare
parts)11%
Dry minerals4%
Chemicals and energy
6%
Automotive (f inished + spare
parts)15%
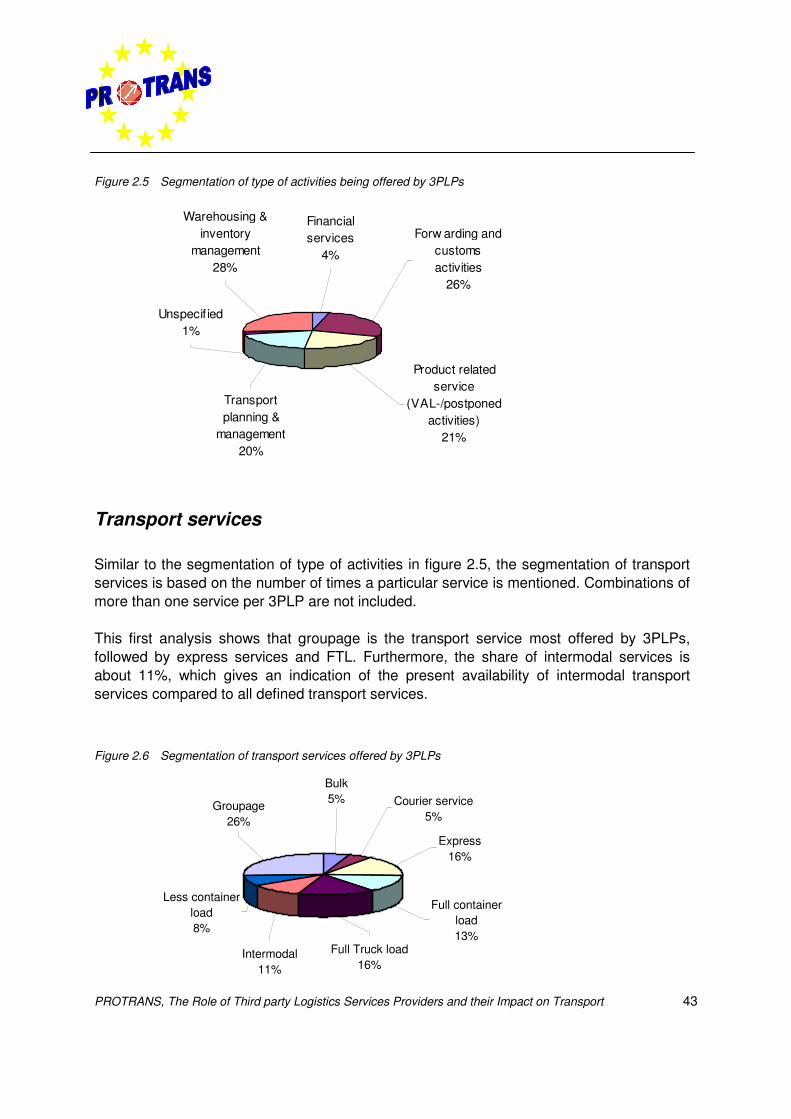
PROTRANS, The Role of Third party Logistics Services Providers and their Impact on Transport 43
Figure 2.5 Segmentation of type of activities being offered by 3PLPs
Transport services
Similar to the segmentation of type of activities in figure 2.5, the segmentation of transportservices is based on the number of times a particular service is mentioned. Combinations ofmore than one service per 3PLP are not included.
This first analysis shows that groupage is the transport service most offered by 3PLPs,followed by express services and FTL. Furthermore, the share of intermodal services isabout 11%, which gives an indication of the present availability of intermodal transportservices compared to all defined transport services.
Figure 2.6 Segmentation of transport services offered by 3PLPs
Financial services
4%
Forw arding and customs activities
26%
Product related service
(VAL-/postponed activities)
21%
Warehousing & inventory
management28%
Unspecif ied1%
Transport planning &
management20%
Less container load8%
Groupage26%
Full Truck load16%
Full container load13%
Express16%
Bulk5% Courier service
5%
Intermodal11%
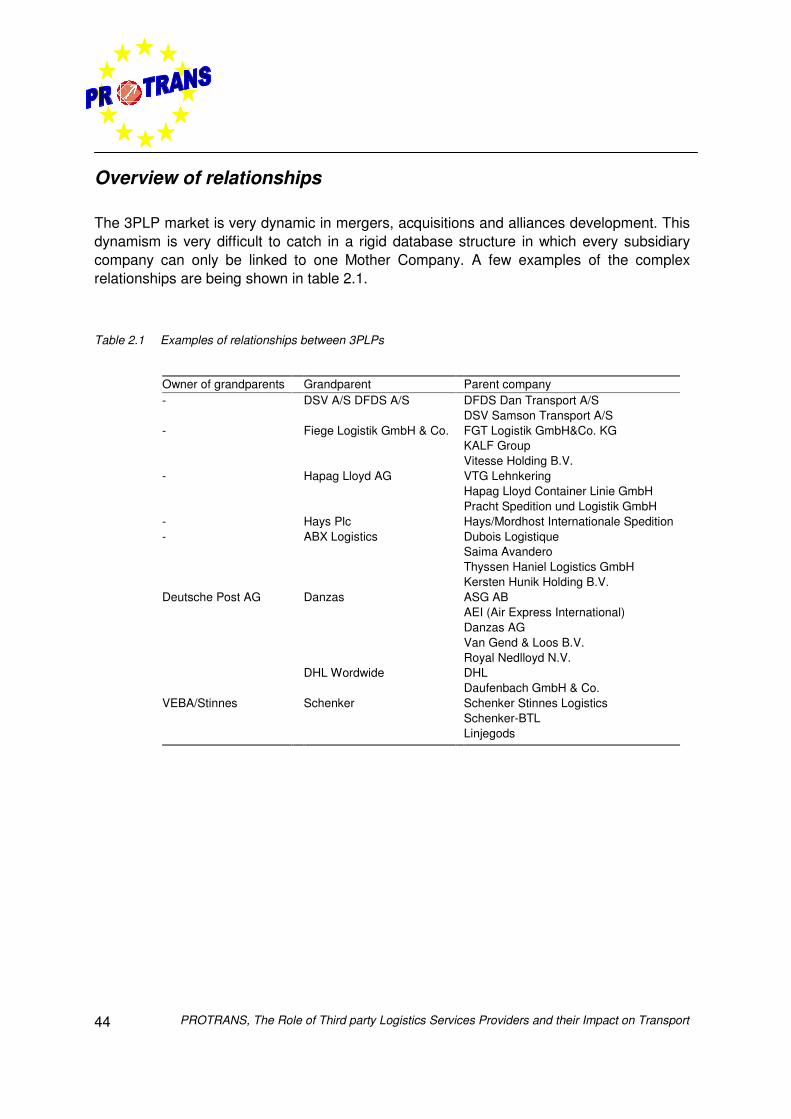
PROTRANS, The Role of Third party Logistics Services Providers and their Impact on Transport44
Overview of relationships
The 3PLP market is very dynamic in mergers, acquisitions and alliances development. Thisdynamism is very difficult to catch in a rigid database structure in which every subsidiarycompany can only be linked to one Mother Company. A few examples of the complexrelationships are being shown in table 2.1.
Table 2.1 Examples of relationships between 3PLPs
Owner of grandparents Grandparent Parent companyDFDS Dan Transport A/S- DSV A/S DFDS A/SDSV Samson Transport A/SFGT Logistik GmbH&Co. KGKALF Group
- Fiege Logistik GmbH & Co.
Vitesse Holding B.V.VTG LehnkeringHapag Lloyd Container Linie GmbH
- Hapag Lloyd AG
Pracht Spedition und Logistik GmbH- Hays Plc Hays/Mordhost Internationale Spedition
Dubois LogistiqueSaima AvanderoThyssen Haniel Logistics GmbH
- ABX Logistics
Kersten Hunik Holding B.V.ASG ABAEI (Air Express International)Danzas AGVan Gend & Loos B.V.
Danzas
Royal Nedlloyd N.V.DHL Wordwide DHL
Deutsche Post AG
Daufenbach GmbH & Co.Schenker Stinnes LogisticsSchenker-BTL
VEBA/Stinnes Schenker
Linjegods
PROTRANS, The Role of Third party Logistics Services Providers and their Impact on Transport 45
Chapter 3 Regional perspective of third-partylogistics
3.1 Introduction
To obtain more insight in the role of 3PLPs and their impact on transport a sample oflogistics regions is analysed in the PROTRANS project on a European scale. This analysisis based on the following objectives:
• Identification of 12 logistics regions in Europe, where a concentration of 3PLPs can befound, in conjunction with a node position in infrastructure networks and the mainEuropean transport corridors.
• Analysis of the reasons (benchmark) why these regions have become successful aslogistics hubs and why some others have not.
To obtain insight in the profile of a logistics region it is important to determine the scope ofthe region. There is hardly any preceding research projects on the definition and benchmarkof logistics regions to be found. Some existing definitions refer to concentration of logisticsactivities and are often defined in terms of local, regional or national freight transport nodes.
In PROTRANS, regions are not only defined by the logistics activities but also related toelements like population, consumption, main industrial sectors and regional logisticspolicies. Therefore the subject on logistics regions in the EU contributes to the innovativecharacter of the PROTRANS project.
Studied logistics regions
First a long list selection was made on logistics regions in Europe based on their expertise,experience of the PROTRANS partners and the available information on the logisticsregions. Instead of the 12 regions in the above-mentioned objectives a short list of 15regions was drawn up to get a good spread of logistics regions in Europe. The short list,which is displayed in table 3.1, is based on the following conditions:
PROTRANS, The Role of Third party Logistics Services Providers and their Impact on Transport46
• getting a varied mix in the type of region (seaport/airport, inland, logistics focus);• position towards transport corridors;• industrial structure of the region.
Table 3.1 Short list selected regions
Region Short descriptionBasel Logistics centre of the country (Rhine river)Belgian-Limburg Area with strong automotive focusBerlin-Brandenburg Strong developing area (e-commerce, multimedia)Hungary Emerging market in Eastern EuropeLombardia National concentration of logistics activities and large consumer marketLondon+South East Mainport area (sea and airport)Madrid Mainport area (airport). Concentration of distribution activitiesMalmö Seaport region. Corridor region. Focus on pharma and medtechNord Pas-de-Calais Concentration of logistics activities and e-commerce. Corridor to UKÖresund Corridor between Sweden and DenmarkPorto Coimbra Sea port areaPoznan Strong focus on logistics activities. Along corridor Berlin – MoscowPrague Centre of logistics activities in Czech Republic.Rotterdam area Mainport area. Pan-European logistics activitiesVienna National capital, gate to Eastern Europe
For data gathering purposes, NUTS 2 statistical data has been used as much as possiblesince data on this level is one of the few options to obtain comparable data on a pan-European basis. After evaluating all available data 13 regions of the short list remained foranalysis. The Porto Coimbra dropped out of the short list, because of a lack of valuablecomparable data. Malmö and Copenhagen were consolidated into one region: Öresund.
Main elements of a logistics region
To analyse the logistics regions on a European scale, the scope of the region has to bedetermined. Based on the desk research in this study, it may be concluded that mostexisting definitions are found in terms of local, regional or national freight transport nodesand not related to elements like main industrial sectors and regional logistics policies.Therefore a logistics region is defined in the PROTRANS project by four main elements, ofwhich a short description is surveyed in figure 3.1:
• infrastructure of the region with regard to transport and logistics activities;• demand for logistics services in a region;• supply of logistics services in a region (provided by 3PLPs);• external environment of the region.
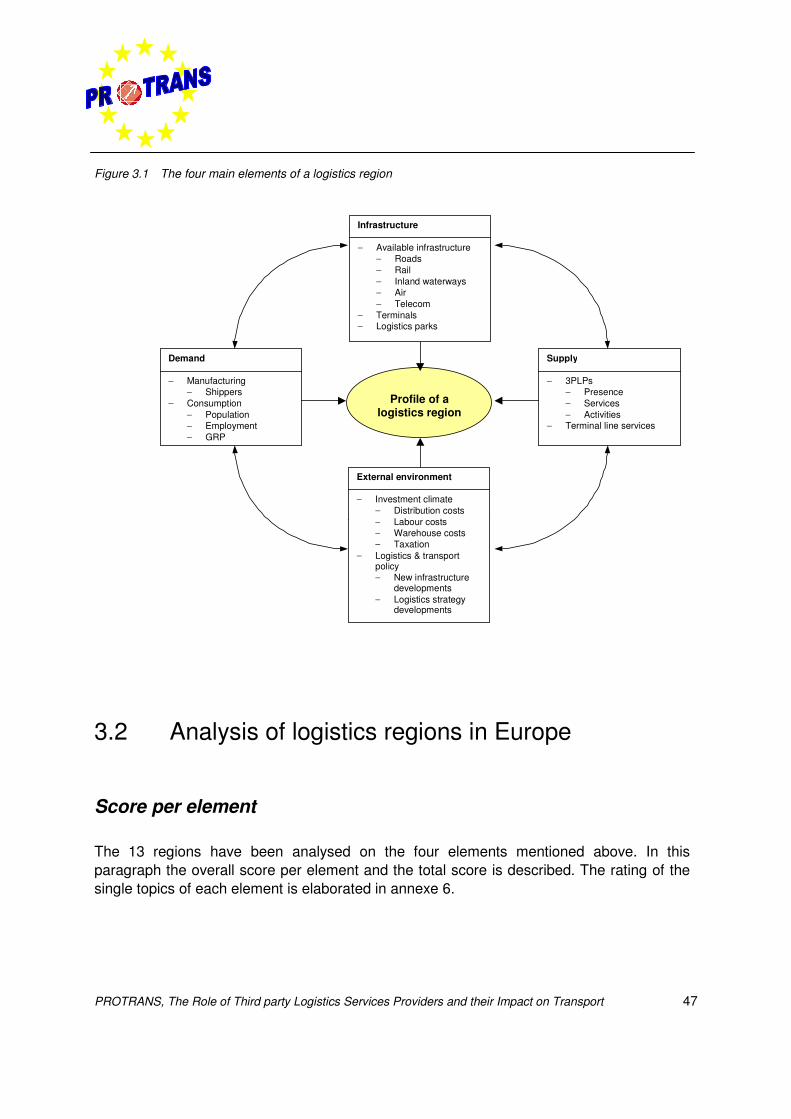
PROTRANS, The Role of Third party Logistics Services Providers and their Impact on Transport 47
Figure 3.1 The four main elements of a logistics region
Demand
− Manufacturing− Shippers
− Consumption− Population− Employment− GRP
Supply
− 3PLPs− Presence− Services− Activities
− Terminal line services
Profile of alogistics region
Infrastructure
− Available infrastructure− Roads− Rail− Inland waterways− Air− Telecom
− Terminals− Logistics parks
External environment
− Investment climate− Distribution costs− Labour costs− Warehouse costs− Taxation
− Logistics & transportpolicy− New infrastructure
developments− Logistics strategy
developments
3.2 Analysis of logistics regions in Europe
Score per element
The 13 regions have been analysed on the four elements mentioned above. In thisparagraph the overall score per element and the total score is described. The rating of thesingle topics of each element is elaborated in annexe 6.
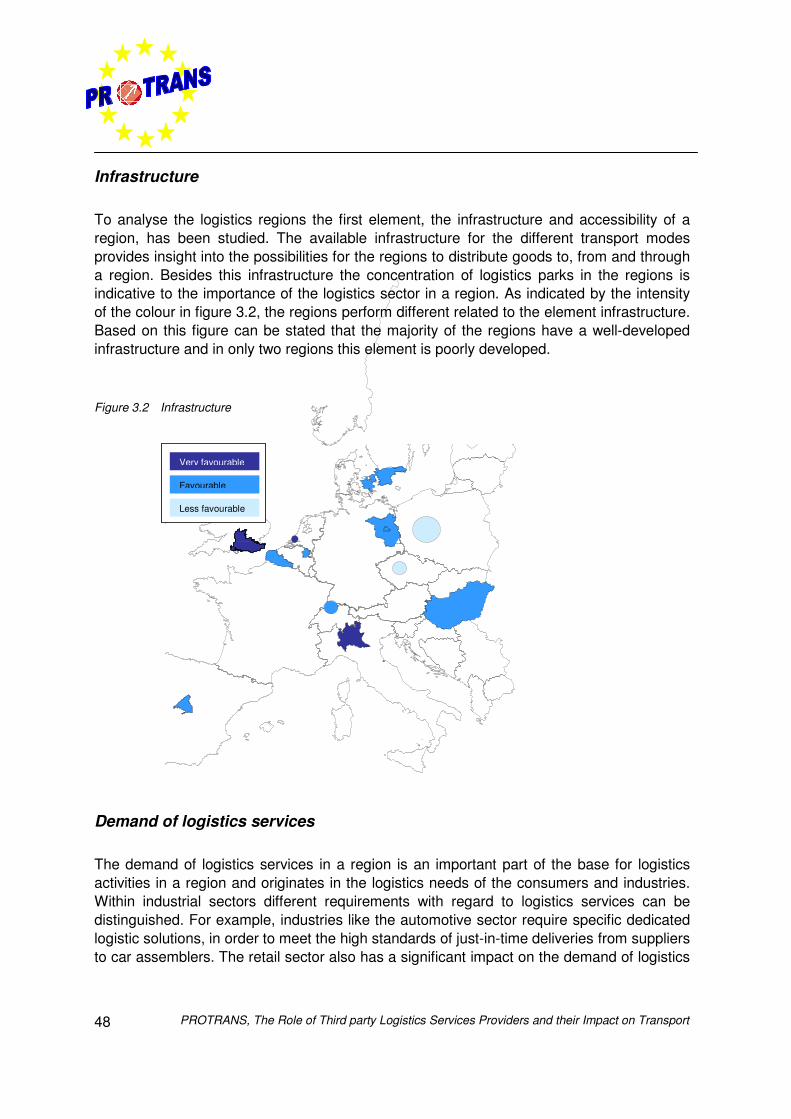
PROTRANS, The Role of Third party Logistics Services Providers and their Impact on Transport48
Infrastructure
To analyse the logistics regions the first element, the infrastructure and accessibility of aregion, has been studied. The available infrastructure for the different transport modesprovides insight into the possibilities for the regions to distribute goods to, from and througha region. Besides this infrastructure the concentration of logistics parks in the regions isindicative to the importance of the logistics sector in a region. As indicated by the intensityof the colour in figure 3.2, the regions perform different related to the element infrastructure.Based on this figure can be stated that the majority of the regions have a well-developedinfrastructure and in only two regions this element is poorly developed.
Figure 3.2 Infrastructure
Demand of logistics services
The demand of logistics services in a region is an important part of the base for logisticsactivities in a region and originates in the logistics needs of the consumers and industries.Within industrial sectors different requirements with regard to logistics services can bedistinguished. For example, industries like the automotive sector require specific dedicatedlogistic solutions, in order to meet the high standards of just-in-time deliveries from suppliersto car assemblers. The retail sector also has a significant impact on the demand of logistics
Very favourable
Favourable
Less favourable
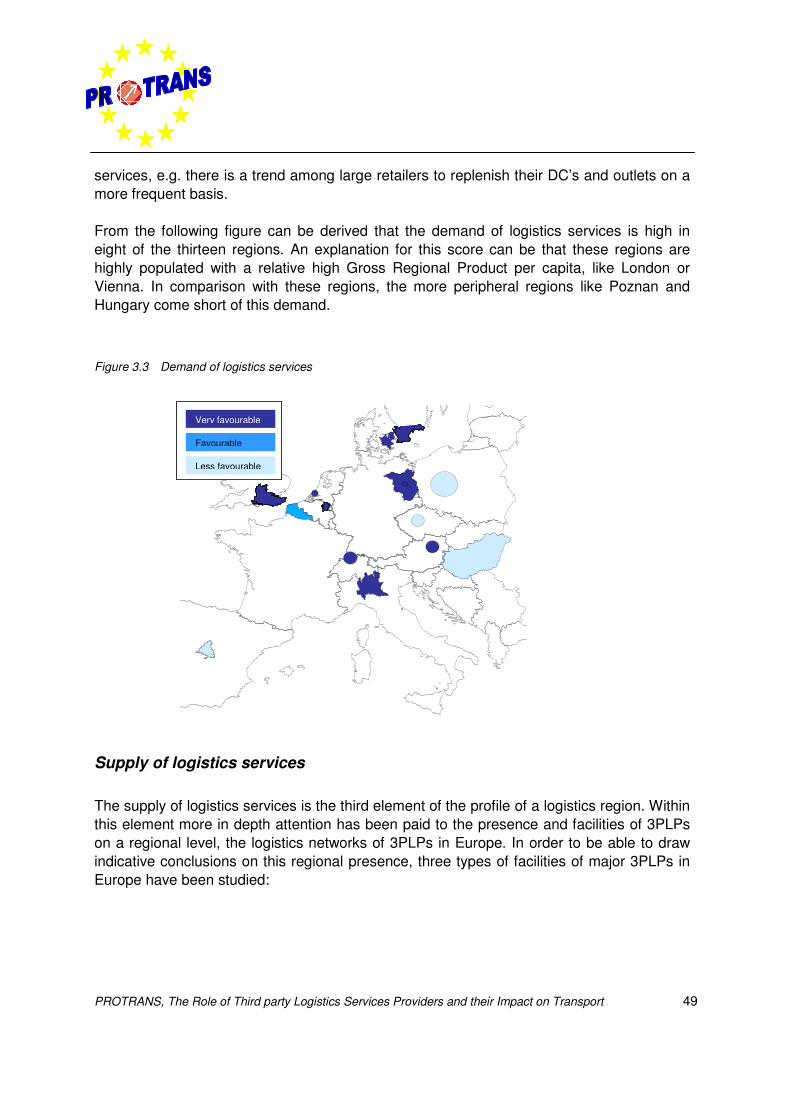
PROTRANS, The Role of Third party Logistics Services Providers and their Impact on Transport 49
services, e.g. there is a trend among large retailers to replenish their DC’s and outlets on amore frequent basis.
From the following figure can be derived that the demand of logistics services is high ineight of the thirteen regions. An explanation for this score can be that these regions arehighly populated with a relative high Gross Regional Product per capita, like London orVienna. In comparison with these regions, the more peripheral regions like Poznan andHungary come short of this demand.
Figure 3.3 Demand of logistics services
Supply of logistics services
The supply of logistics services is the third element of the profile of a logistics region. Withinthis element more in depth attention has been paid to the presence and facilities of 3PLPson a regional level, the logistics networks of 3PLPs in Europe. In order to be able to drawindicative conclusions on this regional presence, three types of facilities of major 3PLPs inEurope have been studied:
Very favourable
Favourable
Less favourable
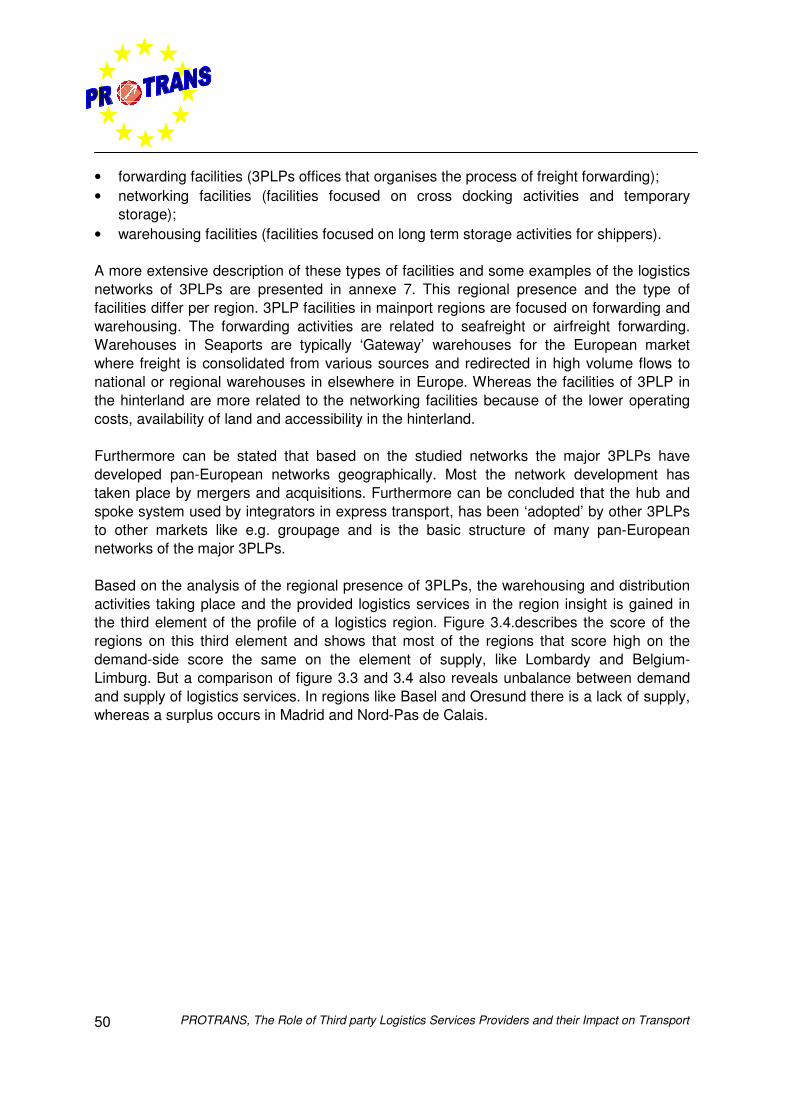
PROTRANS, The Role of Third party Logistics Services Providers and their Impact on Transport50
• forwarding facilities (3PLPs offices that organises the process of freight forwarding);• networking facilities (facilities focused on cross docking activities and temporary
storage);• warehousing facilities (facilities focused on long term storage activities for shippers).
A more extensive description of these types of facilities and some examples of the logisticsnetworks of 3PLPs are presented in annexe 7. This regional presence and the type offacilities differ per region. 3PLP facilities in mainport regions are focused on forwarding andwarehousing. The forwarding activities are related to seafreight or airfreight forwarding.Warehouses in Seaports are typically ‘Gateway’ warehouses for the European marketwhere freight is consolidated from various sources and redirected in high volume flows tonational or regional warehouses in elsewhere in Europe. Whereas the facilities of 3PLP inthe hinterland are more related to the networking facilities because of the lower operatingcosts, availability of land and accessibility in the hinterland.
Furthermore can be stated that based on the studied networks the major 3PLPs havedeveloped pan-European networks geographically. Most the network development hastaken place by mergers and acquisitions. Furthermore can be concluded that the hub andspoke system used by integrators in express transport, has been ‘adopted’ by other 3PLPsto other markets like e.g. groupage and is the basic structure of many pan-Europeannetworks of the major 3PLPs.
Based on the analysis of the regional presence of 3PLPs, the warehousing and distributionactivities taking place and the provided logistics services in the region insight is gained inthe third element of the profile of a logistics region. Figure 3.4.describes the score of theregions on this third element and shows that most of the regions that score high on thedemand-side score the same on the element of supply, like Lombardy and Belgium-Limburg. But a comparison of figure 3.3 and 3.4 also reveals unbalance between demandand supply of logistics services. In regions like Basel and Oresund there is a lack of supply,whereas a surplus occurs in Madrid and Nord-Pas de Calais.
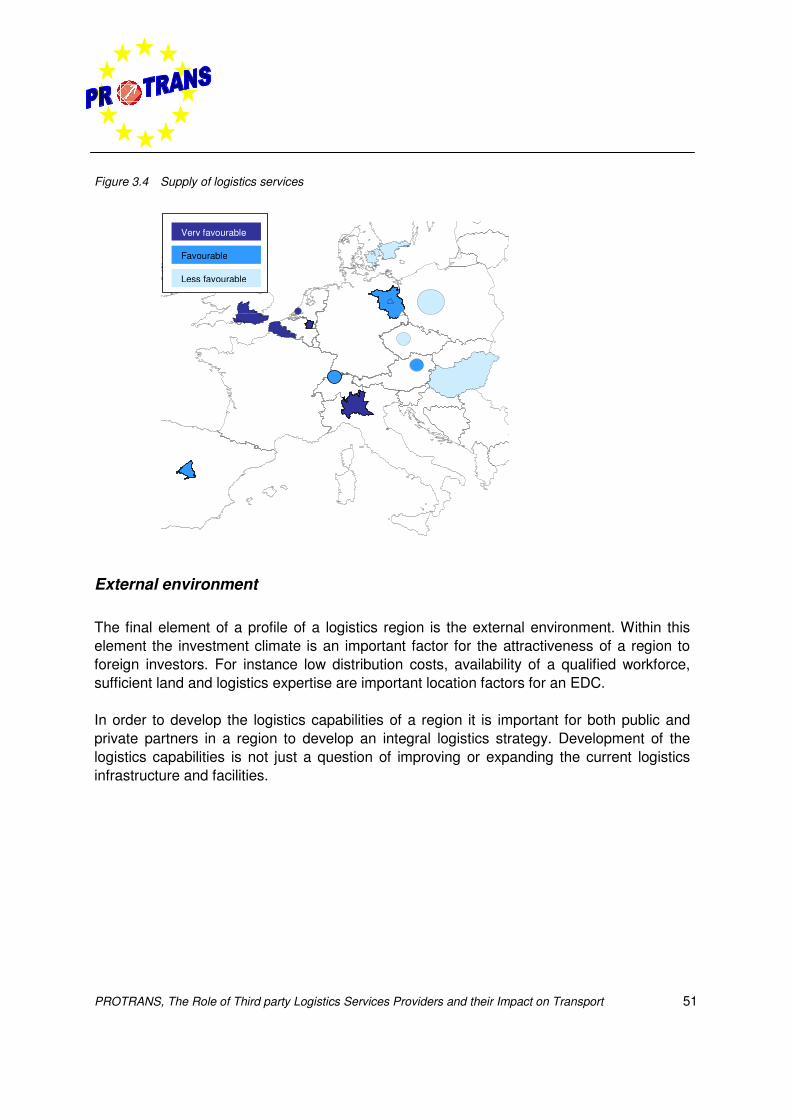
PROTRANS, The Role of Third party Logistics Services Providers and their Impact on Transport 51
Figure 3.4 Supply of logistics services
External environment
The final element of a profile of a logistics region is the external environment. Within thiselement the investment climate is an important factor for the attractiveness of a region toforeign investors. For instance low distribution costs, availability of a qualified workforce,sufficient land and logistics expertise are important location factors for an EDC.
In order to develop the logistics capabilities of a region it is important for both public andprivate partners in a region to develop an integral logistics strategy. Development of thelogistics capabilities is not just a question of improving or expanding the current logisticsinfrastructure and facilities.
Very favourable
Favourable
Less favourable
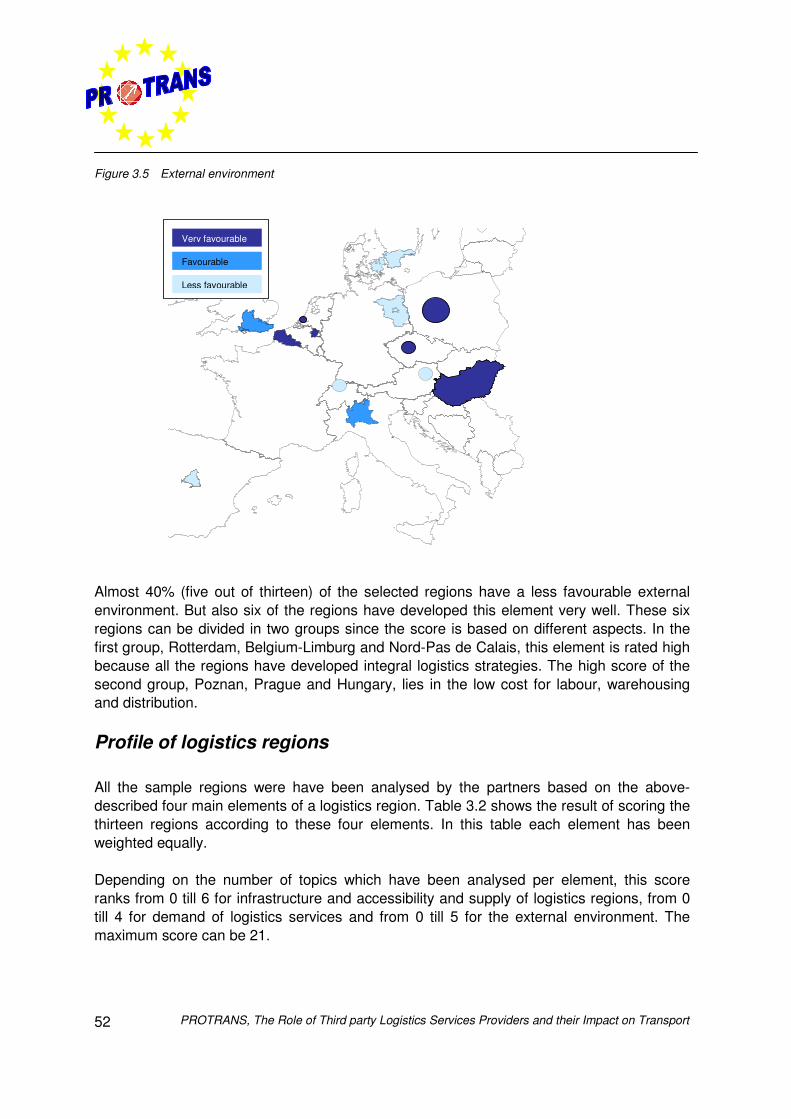
PROTRANS, The Role of Third party Logistics Services Providers and their Impact on Transport52
Figure 3.5 External environment
Almost 40% (five out of thirteen) of the selected regions have a less favourable externalenvironment. But also six of the regions have developed this element very well. These sixregions can be divided in two groups since the score is based on different aspects. In thefirst group, Rotterdam, Belgium-Limburg and Nord-Pas de Calais, this element is rated highbecause all the regions have developed integral logistics strategies. The high score of thesecond group, Poznan, Prague and Hungary, lies in the low cost for labour, warehousingand distribution.
Profile of logistics regions
All the sample regions were have been analysed by the partners based on the above-described four main elements of a logistics region. Table 3.2 shows the result of scoring thethirteen regions according to these four elements. In this table each element has beenweighted equally.
Depending on the number of topics which have been analysed per element, this scoreranks from 0 till 6 for infrastructure and accessibility and supply of logistics regions, from 0till 4 for demand of logistics services and from 0 till 5 for the external environment. Themaximum score can be 21.
Very favourable
Favourable
Less favourable
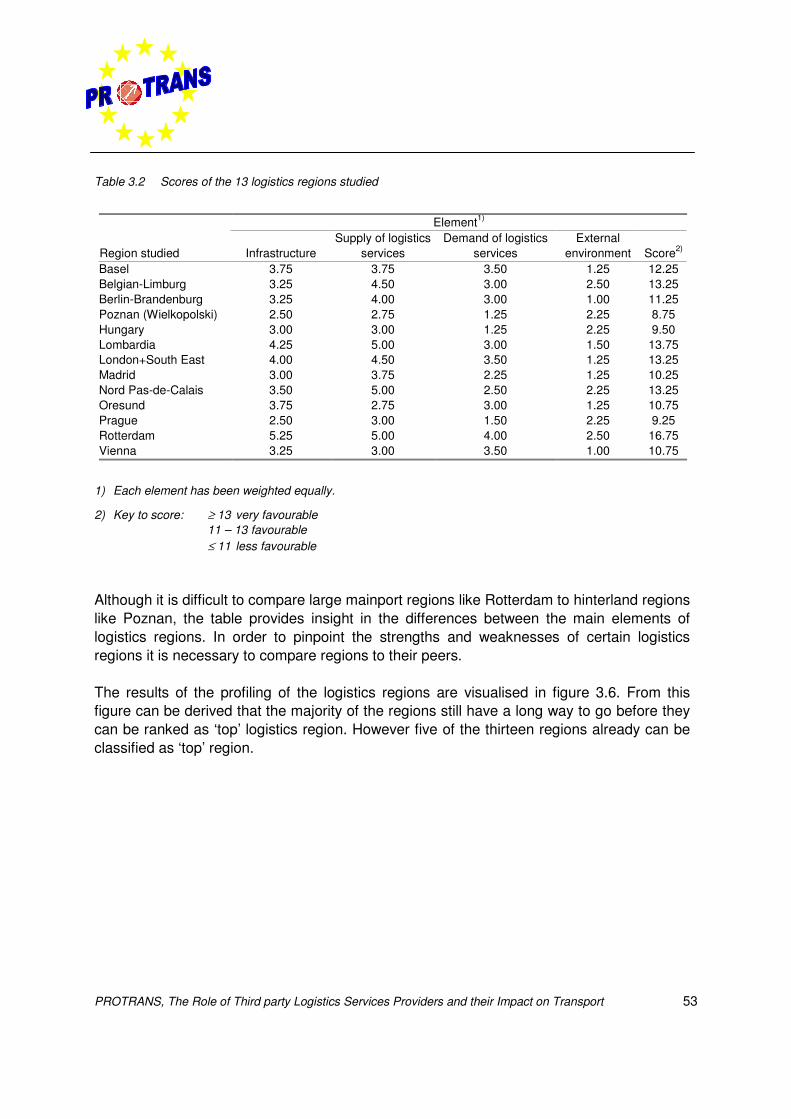
PROTRANS, The Role of Third party Logistics Services Providers and their Impact on Transport 53
Table 3.2 Scores of the 13 logistics regions studied
Element1)
Region studied InfrastructureSupply of logistics
servicesDemand of logistics
servicesExternal
environment Score2)
Basel 3.75 3.75 3.50 1.25 12.25Belgian-Limburg 3.25 4.50 3.00 2.50 13.25Berlin-Brandenburg 3.25 4.00 3.00 1.00 11.25Poznan (Wielkopolski) 2.50 2.75 1.25 2.25 8.75Hungary 3.00 3.00 1.25 2.25 9.50Lombardia 4.25 5.00 3.00 1.50 13.75London+South East 4.00 4.50 3.50 1.25 13.25Madrid 3.00 3.75 2.25 1.25 10.25Nord Pas-de-Calais 3.50 5.00 2.50 2.25 13.25Oresund 3.75 2.75 3.00 1.25 10.75Prague 2.50 3.00 1.50 2.25 9.25Rotterdam 5.25 5.00 4.00 2.50 16.75Vienna 3.25 3.00 3.50 1.00 10.75
1) Each element has been weighted equally.
2) Key to score: ≥ 13 very favourable11 – 13 favourable≤ 11 less favourable
Although it is difficult to compare large mainport regions like Rotterdam to hinterland regionslike Poznan, the table provides insight in the differences between the main elements oflogistics regions. In order to pinpoint the strengths and weaknesses of certain logisticsregions it is necessary to compare regions to their peers.
The results of the profiling of the logistics regions are visualised in figure 3.6. From thisfigure can be derived that the majority of the regions still have a long way to go before theycan be ranked as ‘top’ logistics region. However five of the thirteen regions already can beclassified as ‘top’ region.
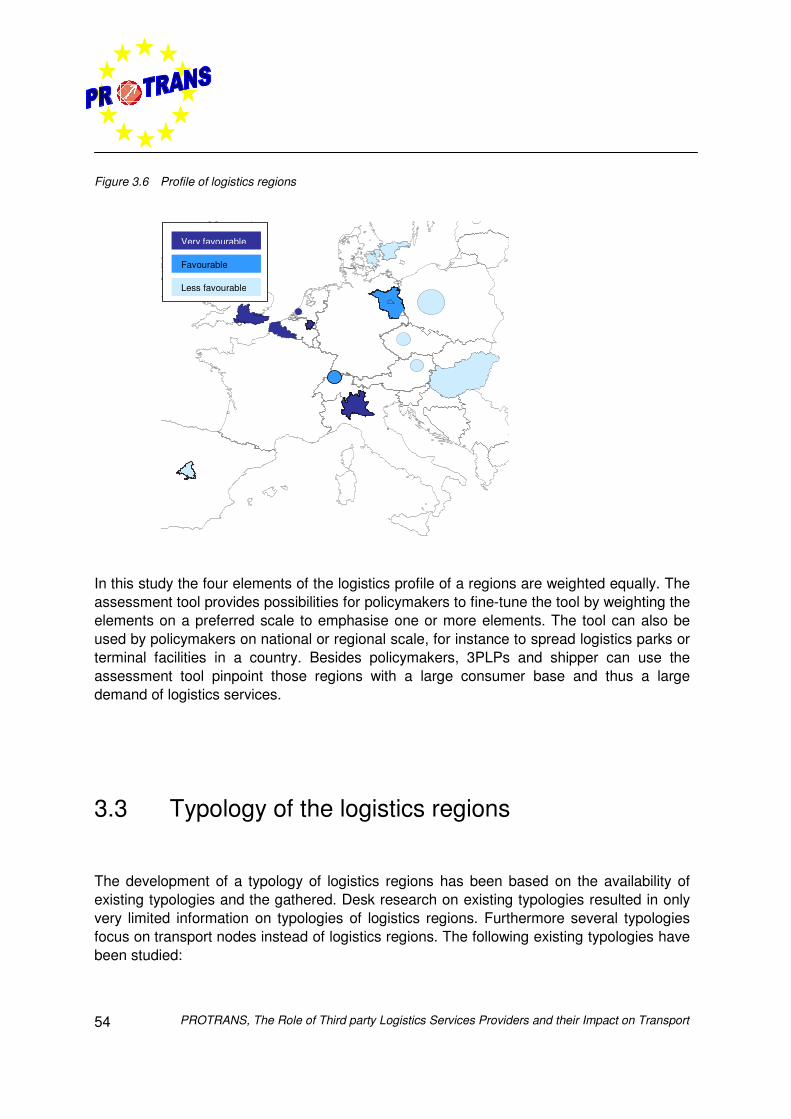
PROTRANS, The Role of Third party Logistics Services Providers and their Impact on Transport54
Figure 3.6 Profile of logistics regions
In this study the four elements of the logistics profile of a regions are weighted equally. Theassessment tool provides possibilities for policymakers to fine-tune the tool by weighting theelements on a preferred scale to emphasise one or more elements. The tool can also beused by policymakers on national or regional scale, for instance to spread logistics parks orterminal facilities in a country. Besides policymakers, 3PLPs and shipper can use theassessment tool pinpoint those regions with a large consumer base and thus a largedemand of logistics services.
3.3 Typology of the logistics regions
The development of a typology of logistics regions has been based on the availability ofexisting typologies and the gathered. Desk research on existing typologies resulted in onlyvery limited information on typologies of logistics regions. Furthermore several typologiesfocus on transport nodes instead of logistics regions. The following existing typologies havebeen studied:
Very favourable
Favourable
Less favourable
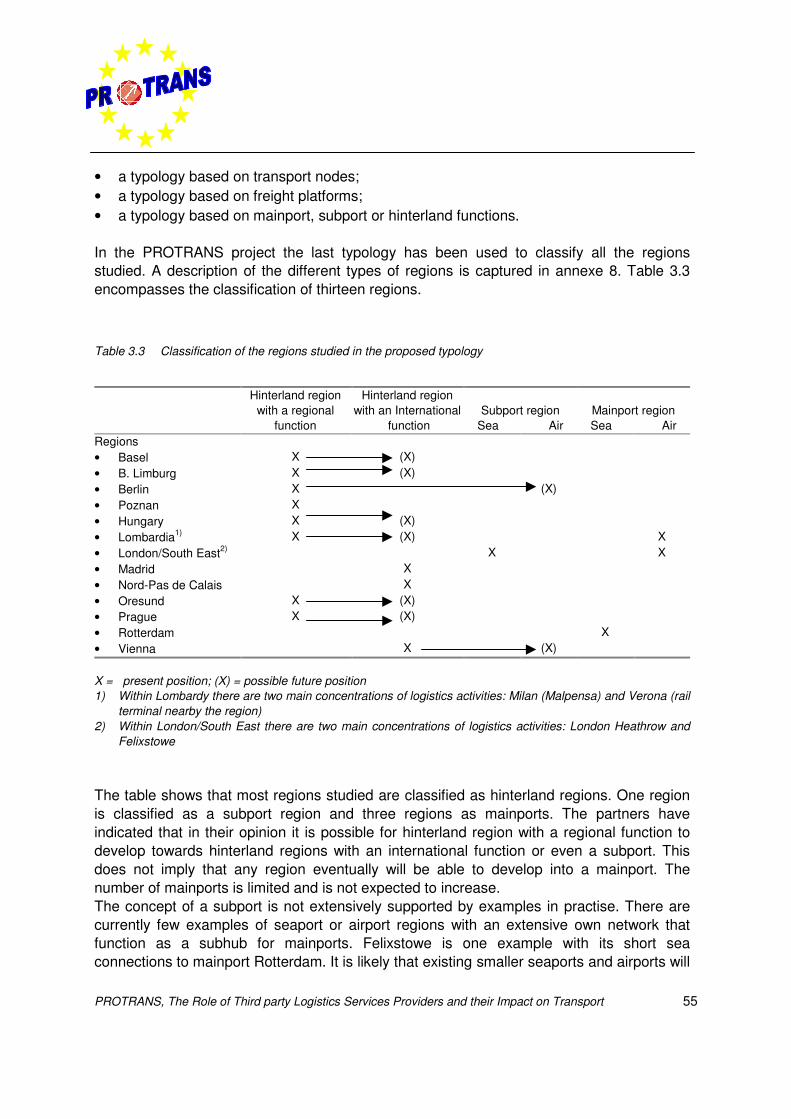
PROTRANS, The Role of Third party Logistics Services Providers and their Impact on Transport 55
• a typology based on transport nodes;• a typology based on freight platforms;• a typology based on mainport, subport or hinterland functions.
In the PROTRANS project the last typology has been used to classify all the regionsstudied. A description of the different types of regions is captured in annexe 8. Table 3.3encompasses the classification of thirteen regions.
Table 3.3 Classification of the regions studied in the proposed typology
Hinterland regionwith a regional
function
Hinterland regionwith an International
functionSubport region
Sea AirMainport regionSea Air
Regions• Basel X (X)• B. Limburg X (X)• Berlin X (X)• Poznan X• Hungary X (X)• Lombardia1) X (X) X• London/South East2) X X• Madrid X• Nord-Pas de Calais X• Oresund X (X)• Prague X (X)• Rotterdam X• Vienna X (X)
X = present position; (X) = possible future position1) Within Lombardy there are two main concentrations of logistics activities: Milan (Malpensa) and Verona (rail
terminal nearby the region)2) Within London/South East there are two main concentrations of logistics activities: London Heathrow and
Felixstowe
The table shows that most regions studied are classified as hinterland regions. One regionis classified as a subport region and three regions as mainports. The partners haveindicated that in their opinion it is possible for hinterland region with a regional function todevelop towards hinterland regions with an international function or even a subport. Thisdoes not imply that any region eventually will be able to develop into a mainport. Thenumber of mainports is limited and is not expected to increase.The concept of a subport is not extensively supported by examples in practise. There arecurrently few examples of seaport or airport regions with an extensive own network thatfunction as a subhub for mainports. Felixstowe is one example with its short seaconnections to mainport Rotterdam. It is likely that existing smaller seaports and airports will
PROTRANS, The Role of Third party Logistics Services Providers and their Impact on Transport56
try to develop into subports in the coming 5-10 years. Hinterland regions with aninternational hub function that may develop into subports are Vienna and Berlin. Berlin maybecome the second hub for Lufthansa in Germany. Vienna already disposes of a widenetwork into Eastern Europe by air. By trying to connect the current Eastern Europeannetwork to the global network of Main airports like Frankfurt, Heathrow or AmsterdamVienna could become a subport.
3.4 Success and failure factors of logistics regions
Three well performing logistics regions have been identified as best-practise regions andused as a benchmark to analyse the success and failure factors of the 13 logistics regions.These best-practise regions have been analysed on a similar basis as the other studiedlogistics regions. The score of the benchmark regions on the four elements is summarisedin annexe 9.
As described above there are at present hardly any good examples of the subport region.Therefore this type is not included in the benchmark. Of the remaining types of logisticsregions the following regions are identified for benchmark purposes:
• Antwerp (mainport region).• Duisburg (hinterland with a international function).• Venlo (hinterland region with a regional function).
Based on the success and failure factors of these best-practise regions conclusions can bedrawn on the required focus of each type of region in order to improve its logisticscapabilities. The main areas of focus are elaborated in table 3.4 and shaded in grey. Thenumber of ‘plusses’ presents the success of a region. A description per type of region isprovided below the table and provides connecting factors for policy and decision-makers toassess the logistics potentials of a region
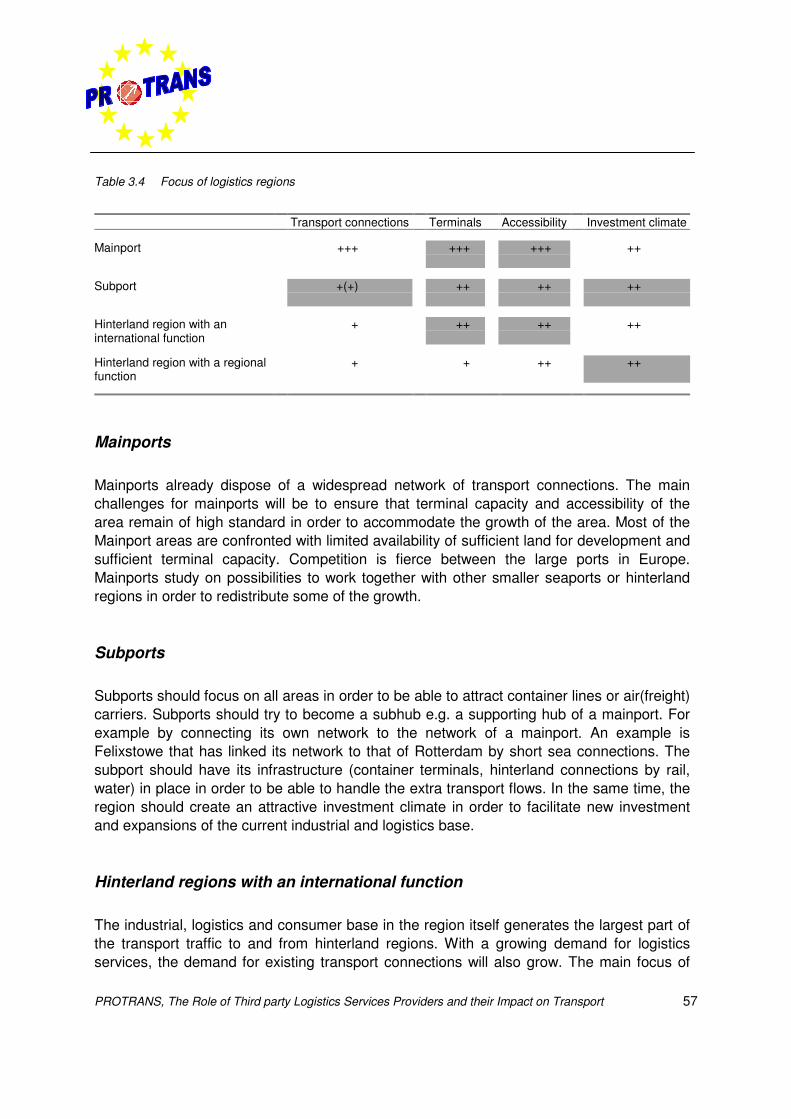
PROTRANS, The Role of Third party Logistics Services Providers and their Impact on Transport 57
Table 3.4 Focus of logistics regions
Transport connections Terminals Accessibility Investment climate
Mainport +++ +++ +++ ++
Subport +(+) ++ ++ ++
Hinterland region with aninternational function
+ ++ ++ ++
Hinterland region with a regionalfunction
+ + ++ ++
Mainports
Mainports already dispose of a widespread network of transport connections. The mainchallenges for mainports will be to ensure that terminal capacity and accessibility of thearea remain of high standard in order to accommodate the growth of the area. Most of theMainport areas are confronted with limited availability of sufficient land for development andsufficient terminal capacity. Competition is fierce between the large ports in Europe.Mainports study on possibilities to work together with other smaller seaports or hinterlandregions in order to redistribute some of the growth.
Subports
Subports should focus on all areas in order to be able to attract container lines or air(freight)carriers. Subports should try to become a subhub e.g. a supporting hub of a mainport. Forexample by connecting its own network to the network of a mainport. An example isFelixstowe that has linked its network to that of Rotterdam by short sea connections. Thesubport should have its infrastructure (container terminals, hinterland connections by rail,water) in place in order to be able to handle the extra transport flows. In the same time, theregion should create an attractive investment climate in order to facilitate new investmentand expansions of the current industrial and logistics base.
Hinterland regions with an international function
The industrial, logistics and consumer base in the region itself generates the largest part ofthe transport traffic to and from hinterland regions. With a growing demand for logisticsservices, the demand for existing transport connections will also grow. The main focus of
PROTRANS, The Role of Third party Logistics Services Providers and their Impact on Transport58
hinterland regions with an international function will be to offer sufficient capacity oninternational transport connections, meaning e.g. increasing terminal capacity andfrequency of services. Most hinterland regions have a feeder function towards mainports.These relations often exist in the form of rail or inland waterway connections (see e.g.Duisburg). The region should try to expand connections not only to mainports but also toother important transport nodes around the region, like e.g. large (inter)national airports,inland ports or important continental terminal locations. The supply of these transportservices should be focused on the demand of the industrial and logistics base in the region.Therefore it is advisable to stimulate the initiation of an organisation with public and privatepartners that aims to develop an integral logistics strategy for the region focusing on how toincrease the accessibility of the region and the network of terminal connections.
Hinterland regions with a regional function
One of the most important areas of attention for hinterland regions with a regional functionis to stimulate the growth of the demand for logistics services. This can be achieved by thegrowth of the existing industrial and logistics base in the region but also by the expansion ofthis base with direct investment by new companies. Hinterland regions often have theadvantage compared to mainport/subport of having a more cost-effective investmentclimate (e.g. cheaper and more readily available land, lower labour costs). Hinterlandregions with a regional function should try to take advantage of this and try to attract newinvestors to the region. Both shippers and 3PLPs are interesting new investors. Newshippers bring new demand for logistics services to the region. 3PLPs bring new logisticsservices. Warehousing and networking facilities are typical 3PLP facilities for hinterlandregions. Therefore it is advisable to stimulate the initiation of an organisation with public andprivate partners that aim to develop an integral logistics strategy for the region focusing onhow to increase the current demand for logistics services in the region.
3.5 Conclusions on the analysis of logistics regions
The analysis model that has been developed in PROTRANS can be utilised in otherEuropean regions. The model enables an overall ranking of European logistics regions,which has not been carried out within the framework of this project. The benchmark in thisanalysis of logistics regions makes it possible to define best practice regions and to derivesuccess and failure factors.
PROTRANS, The Role of Third party Logistics Services Providers and their Impact on Transport 59
This assessment tool facilitates regional policy makers in the development of their logisticsstrategy in general and on the 3PLP perspective in particular. By using this tool, shippersand 3PLPs can also gain insight in the regional variances and strengths of regions,information that can be of great value for decisions on for instance location choice andnetwork development. It also enables policymakers to fine-tune the assessment tool byweighting the elements on a preferred scale. The sensitivity of the various elements canthus be analysed, in order to develop specific logistics strategies for their region orcompany.
One of the main conclusions of the analysis of the selected logistics regions is that thedevelopment of transport connections between logistics hubs is vital for the development ofthe logistics network of the region. More effort should be spend on identifying the majortransport connections in Europe and the identification of the requirements in order toimprove the connections.
Furthermore can be concluded that many regions are successful as logistics region whenthe region has developed an integral strategic logistics vision in which both public andprivate partners are involved. Some examples are available through regions like Duisburg,Venlo and Belgian-Limburg. Such initiatives should be followed up in other regions.

PROTRANS, The Role of Third party Logistics Services Providers and their Impact on Transport60
PROTRANS, The Role of Third party Logistics Services Providers and their Impact on Transport 61
Chapter 4 Market supply and demand for third-partylogistics
4.1 Introduction
One of the main objectives of the PROTRANS project is to compare logistics servicesoffered by 3PLPs with shippers demands. Therefore insight is required in the shippers’ and3PLPs’ views on present and future requirements on logistics and transport systems. Butalso in how these requirements are and will be facilitated by 3PLPs. Furthermore this insightaccounts for every mode of transport at the pan-European level, including intermodaltransport (IMT).
Whereas chapter 2 provides a snapshot of the 3PLP market based on published data, thischapter provides a more in-depth insight in the market supply and demand for third-partylogistics as mentioned above. To gain this insight data is gathered based on two rounds ofin depth face-to-face interviews with leading 3PLPs and shippers (76 respondents) from thefour industries described in table 4.1. The first round of interviews focused on 3PLPs’ role inlogistics management and the second focused on their specific role in IMT.
Table 4.1 Respondents per industry
3PL 3PL Shipper Shipper Total TotalIndustry 1st round 2nd round 1st round 2nd round 1st round 2nd roundElectronics 12 8 16 9 28 17Automotive 8 5 6 7 14 12Food (retail) 9 10 9 9 18 19Chemicals/Energy 3 5 13 7 16 12Total 32 28 44 32 76 60
The sample on 3PLPs was determined from a previously compiled list of leading 3PLPs inEurope irrespective of their countries of origin. The number of shippers that had to beinterviewed in each European country was determined by its relative contribution GrossEuropean Product. 10 of the total shipper sample size were determined to be ‘European
PROTRANS, The Role of Third party Logistics Services Providers and their Impact on Transport62
shippers’, i.e. not relating to nationally based operations. There was also an appreciationthat in each industry companies of different sizes ought to be surveyed.
4.2 Conceptual framework and market conditions
Market conditions
The idea of outsourcing isolated logistics activities such as transportation and warehousingto external service providers is not a new phenomenon. Carrier services and publicwarehousing provide prominent examples. However, normally outsourcing has been basedon simple make-or-buy decision, choosing the cheapest alternative that meets pre-established service requirements.
However the last few years, there has been a pronounced change in shipper-3PLPrelationships. While the primary driving forces previously were to reduce costs and releasecapital to alternative purposes, the driving forces today have a more strategic trust: toincrease market coverage, improve the level of service or increase flexibility towards thechanging requirements of customers. Co-operation between the parties has become morelong-term in nature, mutually binding and is often combined with changes in bothorganisation and information systems. Solutions are tailored to specific services and ofteninclude value-adding services such as final assembly, packaging, quality control, andinformation services.
This trend of changing shipper-3PLP relationships will go on in the next few years sinceinternational competitiveness of European companies will increasingly depend on theirability to deliver customer-adapted products all over the world quickly and on time. In orderto meet these high standards European companies must go along with the following trends:
• Supply chain management (SCM). SCM entails that the links in the supply chain co-ordinate their planning, management and organization based on an assessment of theoverall efficiency and competitiveness of the supply chain.
• Globalisation of the supply chain. Measures to improve the efficiency of information andtransport systems have made it less expensive, quicker and safer to purchase goodsfrom remote supplier markets and distribute goods to remote customer markets.
• E-business enabled by the Internet, will in future influence logistics systems, becauseinformation flows can take place fast and efficient and products can be bought instantlyvia Internet, which also implicates quick delivery.
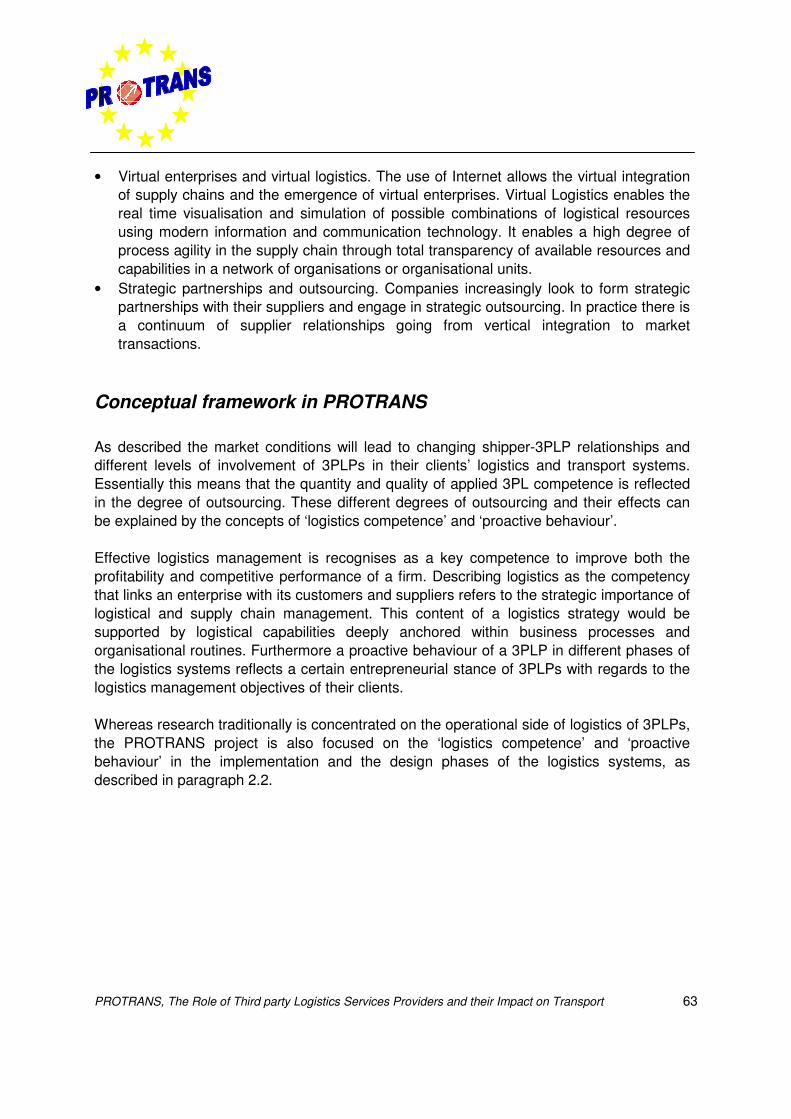
PROTRANS, The Role of Third party Logistics Services Providers and their Impact on Transport 63
• Virtual enterprises and virtual logistics. The use of Internet allows the virtual integrationof supply chains and the emergence of virtual enterprises. Virtual Logistics enables thereal time visualisation and simulation of possible combinations of logistical resourcesusing modern information and communication technology. It enables a high degree ofprocess agility in the supply chain through total transparency of available resources andcapabilities in a network of organisations or organisational units.
• Strategic partnerships and outsourcing. Companies increasingly look to form strategicpartnerships with their suppliers and engage in strategic outsourcing. In practice there isa continuum of supplier relationships going from vertical integration to markettransactions.
Conceptual framework in PROTRANS
As described the market conditions will lead to changing shipper-3PLP relationships anddifferent levels of involvement of 3PLPs in their clients’ logistics and transport systems.Essentially this means that the quantity and quality of applied 3PL competence is reflectedin the degree of outsourcing. These different degrees of outsourcing and their effects canbe explained by the concepts of ‘logistics competence’ and ‘proactive behaviour’.
Effective logistics management is recognises as a key competence to improve both theprofitability and competitive performance of a firm. Describing logistics as the competencythat links an enterprise with its customers and suppliers refers to the strategic importance oflogistical and supply chain management. This content of a logistics strategy would besupported by logistical capabilities deeply anchored within business processes andorganisational routines. Furthermore a proactive behaviour of a 3PLP in different phases ofthe logistics systems reflects a certain entrepreneurial stance of 3PLPs with regards to thelogistics management objectives of their clients.
Whereas research traditionally is concentrated on the operational side of logistics of 3PLPs,the PROTRANS project is also focused on the ‘logistics competence’ and ‘proactivebehaviour’ in the implementation and the design phases of the logistics systems, asdescribed in paragraph 2.2.
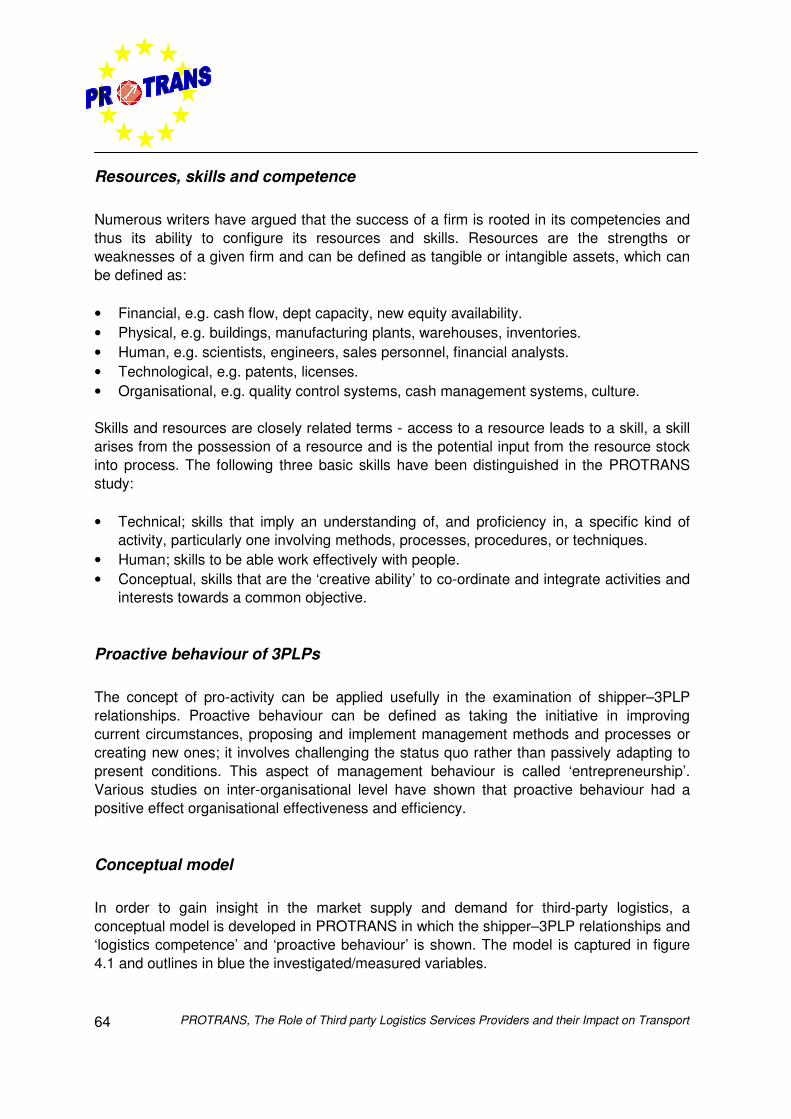
PROTRANS, The Role of Third party Logistics Services Providers and their Impact on Transport64
Resources, skills and competence
Numerous writers have argued that the success of a firm is rooted in its competencies andthus its ability to configure its resources and skills. Resources are the strengths orweaknesses of a given firm and can be defined as tangible or intangible assets, which canbe defined as:
• Financial, e.g. cash flow, dept capacity, new equity availability.• Physical, e.g. buildings, manufacturing plants, warehouses, inventories.• Human, e.g. scientists, engineers, sales personnel, financial analysts.• Technological, e.g. patents, licenses.• Organisational, e.g. quality control systems, cash management systems, culture.
Skills and resources are closely related terms - access to a resource leads to a skill, a skillarises from the possession of a resource and is the potential input from the resource stockinto process. The following three basic skills have been distinguished in the PROTRANSstudy:
• Technical; skills that imply an understanding of, and proficiency in, a specific kind ofactivity, particularly one involving methods, processes, procedures, or techniques.
• Human; skills to be able work effectively with people.• Conceptual, skills that are the ‘creative ability’ to co-ordinate and integrate activities and
interests towards a common objective.
Proactive behaviour of 3PLPs
The concept of pro-activity can be applied usefully in the examination of shipper–3PLPrelationships. Proactive behaviour can be defined as taking the initiative in improvingcurrent circumstances, proposing and implement management methods and processes orcreating new ones; it involves challenging the status quo rather than passively adapting topresent conditions. This aspect of management behaviour is called ‘entrepreneurship’.Various studies on inter-organisational level have shown that proactive behaviour had apositive effect organisational effectiveness and efficiency.
Conceptual model
In order to gain insight in the market supply and demand for third-party logistics, aconceptual model is developed in PROTRANS in which the shipper–3PLP relationships and‘logistics competence’ and ‘proactive behaviour’ is shown. The model is captured in figure4.1 and outlines in blue the investigated/measured variables.
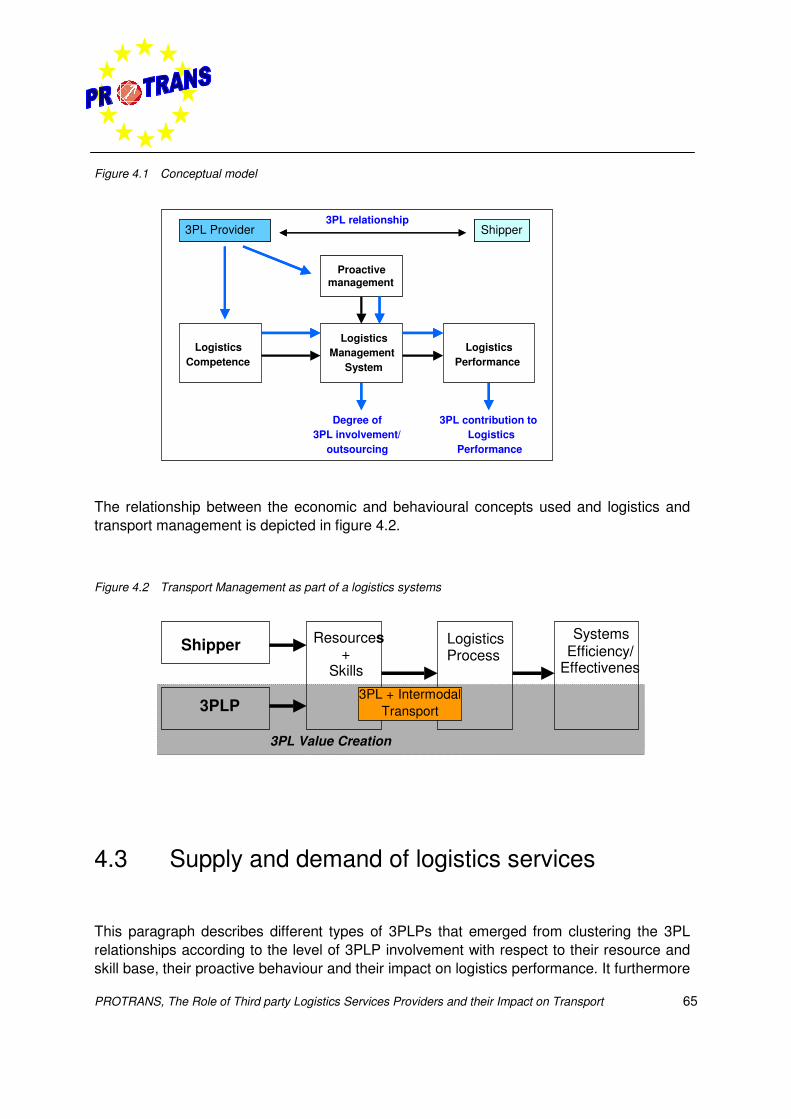
PROTRANS, The Role of Third party Logistics Services Providers and their Impact on Transport 65
Figure 4.1 Conceptual model
The relationship between the economic and behavioural concepts used and logistics andtransport management is depicted in figure 4.2.
Figure 4.2 Transport Management as part of a logistics systems
4.3 Supply and demand of logistics services
This paragraph describes different types of 3PLPs that emerged from clustering the 3PLrelationships according to the level of 3PLP involvement with respect to their resource andskill base, their proactive behaviour and their impact on logistics performance. It furthermore
LogisticsCompetence
LogisticsManagement
System
LogisticsPerformance
Shipper3PL Provider3PL relationship
Shipper3PL Provider
Proactivemanagement
Degree of3PL involvement/
outsourcing
3PL contribution toLogistics
Performance
Shipper
3PLP
Resources+
Skills
LogisticsProcess
SystemsEfficiency/
Effectiveness
3PL Value Creation
3PL + IntermodalTransport
PROTRANS, The Role of Third party Logistics Services Providers and their Impact on Transport66
profiles the differences in 3PL relationships with particular emphasis on IntermodalTransport.
3PLPs involvement
Involvement in logistics services
To classify 3PL relationships it was assumed that the participation of 3PLPs in the varioussub-processes across a sample of 3PL relationships follows distinguishable patterns,regardless of whether shipper organisations were surveyed or 3PLPs. Respondents in bothorganisations were asked to report on their involvement in logistics processes, sub-processes and activities. After cluster analysis was performed the result on aggregate levelrevealed the following distinguishable categories of 3PLPs, as outlined in figure 4.3:
• Solution providers• Distribution providers• Transport providers
Figure 4.3 Logistics services performed by logistics service providers
0% 20% 40% 60% 80% 100%
Degree of involvement
Customer service strategy
Channel design
Network design
Warehouse management
Transportation management
Material management
Policy and procedures
Organisational change
Facilities & equipment
IT hardware
Operational planning
OperationoperatieOperational control
Act
iviti
es
Transport equipment
Information systems
Transportprovider
Distributionprovider
Solutionprovider
Design
Operation
Implementation
Phases
PROTRANS, The Role of Third party Logistics Services Providers and their Impact on Transport 67
Transport providers are accordingly mainly involved in transport related design andimplementation activities as well as involvement in operations. This cluster practicallyreflects the traditional service portfolio of haulage providers. This cluster reflects overallcomparatively low involvement (below 20%) with only some areas of higher involvementsuch as transportation and warehouse design (40%), the implementation of policies andprocedures (38%) transport equipment (58%) and operational activities (45%).
Distribution providers are mainly involved in design and implementation activities inwarehousing as well as transportation. The capability of designing physical networks as wellas implementing IS systems seem to be a substantial part of services that are offered bythis category of provider. They also get much stronger involved, when it comes to theimplementation of policies and procedures and take joint responsibility to bring aboutorganisational change. This category of service provider reflects the service portfolio that inlate 70s and the beginning of the 80s led to the emergence of the term ‘contractdistribution’. Providers of this kind typically offer customised solutions for warehousing andtransport mostly with dedicated own or at least co-financed assets. Their involvement in theoperation of their clients’ logistics system is still the basis of their contractual relationshipwith their clients, and their expertise in transport and warehousing has led to a higherdegree of outsourcing with respect to design and implementation in these areas.
The most advanced form of 3PLPs was labelled ‘solution provider’. Their involvement inlogistics decisions is in comparison to both other forms of 3PLP considerably stronger in alldesign processes, contributing between 60% and 80 % to strategic decisions. They areeven more involved in the functional design of their clients logistics system (Warehousing68%, Transport 92 % and Materials Management 77%). They show also a high(er)involvement in all project management related activities. They distinguish themselvesparticularly through very high involvement in IS or IT related processes (92% / 99%).
These providers have successfully developed capabilities that exceed the traditional domainof transport and warehousing in logistics. They emphasise additionally their strategicmanagement skills and expertise information systems. This enables them to play a morecreative role in the management of their clients’ logistics system and has led to a higherdegree of outsourcing in an operational sense. Information and change management aretypical domains of management consultants. Their low level of involvement in theimplementation of transport equipment and warehouse facilities indicates that solutionproviders concentrate on the management of logistics systems rather than the provision ofthe necessary assets. They manage processes on behalf of their clients using additionalcontractors to implement and provide the necessary assets.
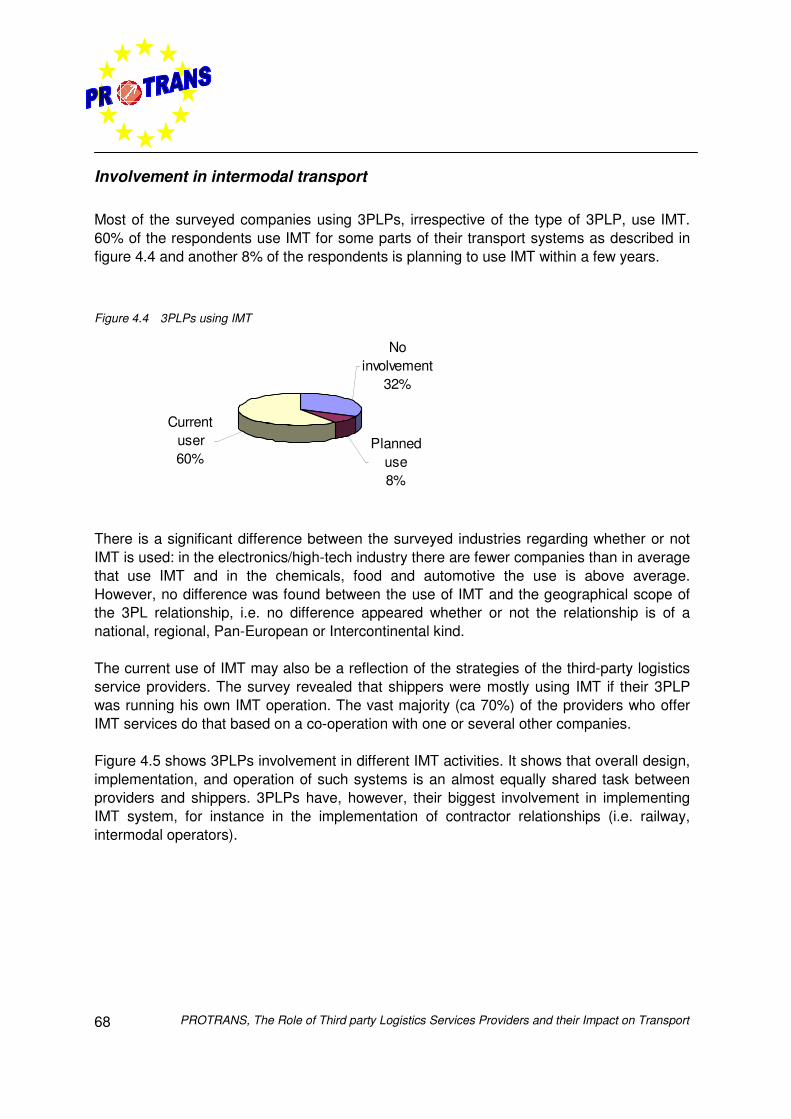
PROTRANS, The Role of Third party Logistics Services Providers and their Impact on Transport68
Involvement in intermodal transport
Most of the surveyed companies using 3PLPs, irrespective of the type of 3PLP, use IMT.60% of the respondents use IMT for some parts of their transport systems as described infigure 4.4 and another 8% of the respondents is planning to use IMT within a few years.
Figure 4.4 3PLPs using IMT
There is a significant difference between the surveyed industries regarding whether or notIMT is used: in the electronics/high-tech industry there are fewer companies than in averagethat use IMT and in the chemicals, food and automotive the use is above average.However, no difference was found between the use of IMT and the geographical scope ofthe 3PL relationship, i.e. no difference appeared whether or not the relationship is of anational, regional, Pan-European or Intercontinental kind.
The current use of IMT may also be a reflection of the strategies of the third-party logisticsservice providers. The survey revealed that shippers were mostly using IMT if their 3PLPwas running his own IMT operation. The vast majority (ca 70%) of the providers who offerIMT services do that based on a co-operation with one or several other companies.
Figure 4.5 shows 3PLPs involvement in different IMT activities. It shows that overall design,implementation, and operation of such systems is an almost equally shared task betweenproviders and shippers. 3PLPs have, however, their biggest involvement in implementingIMT system, for instance in the implementation of contractor relationships (i.e. railway,intermodal operators).
Current user60%
Planned use8%
No involvement
32%
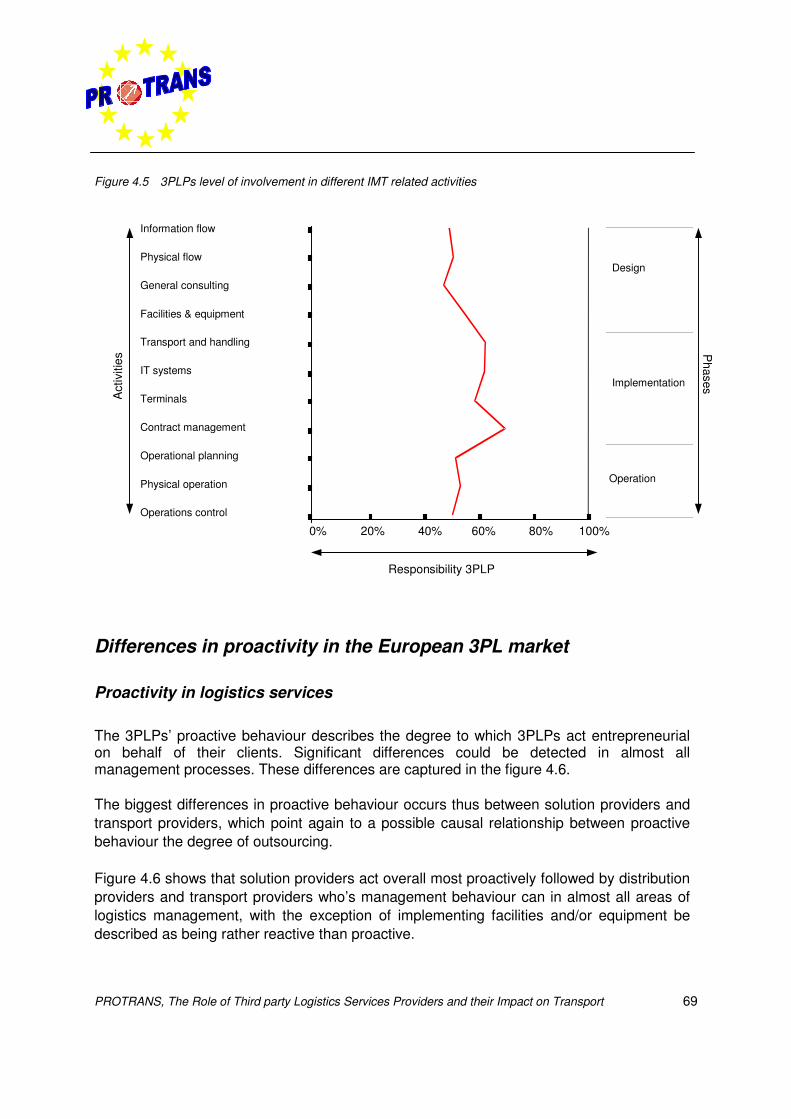
PROTRANS, The Role of Third party Logistics Services Providers and their Impact on Transport 69
Figure 4.5 3PLPs level of involvement in different IMT related activities
Differences in proactivity in the European 3PL market
Proactivity in logistics services
The 3PLPs’ proactive behaviour describes the degree to which 3PLPs act entrepreneurialon behalf of their clients. Significant differences could be detected in almost allmanagement processes. These differences are captured in the figure 4.6.
The biggest differences in proactive behaviour occurs thus between solution providers andtransport providers, which point again to a possible causal relationship between proactivebehaviour the degree of outsourcing.
Figure 4.6 shows that solution providers act overall most proactively followed by distributionproviders and transport providers who’s management behaviour can in almost all areas oflogistics management, with the exception of implementing facilities and/or equipment bedescribed as being rather reactive than proactive.
100%80%60%40%
Responsibility 3PLP
Information flow
20%
Physical operation
Operational planning
Contract management
Terminals
IT systems
Transport and handling
Facilities & equipment
General consulting
Physical flow
Operations control
Design
Operation
Implementation
Phases
Act
iviti
es
0%
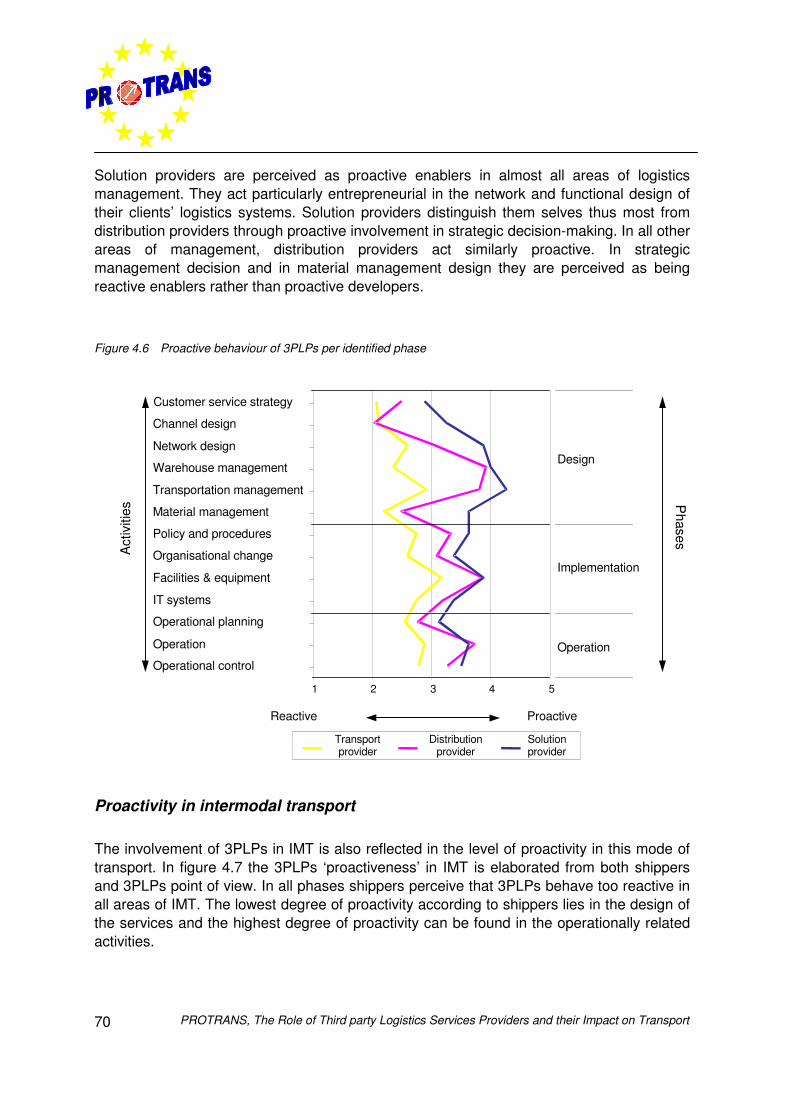
PROTRANS, The Role of Third party Logistics Services Providers and their Impact on Transport70
Solution providers are perceived as proactive enablers in almost all areas of logisticsmanagement. They act particularly entrepreneurial in the network and functional design oftheir clients’ logistics systems. Solution providers distinguish them selves thus most fromdistribution providers through proactive involvement in strategic decision-making. In all otherareas of management, distribution providers act similarly proactive. In strategicmanagement decision and in material management design they are perceived as beingreactive enablers rather than proactive developers.
Figure 4.6 Proactive behaviour of 3PLPs per identified phase
Proactivity in intermodal transport
The involvement of 3PLPs in IMT is also reflected in the level of proactivity in this mode oftransport. In figure 4.7 the 3PLPs ‘proactiveness’ in IMT is elaborated from both shippersand 3PLPs point of view. In all phases shippers perceive that 3PLPs behave too reactive inall areas of IMT. The lowest degree of proactivity according to shippers lies in the design ofthe services and the highest degree of proactivity can be found in the operationally relatedactivities.
Reactive
Transportprovider
Distributionprovider
Solutionprovider
1 2 3 4 5
Customer service strategy
Channel design
Network design
Warehouse management
Transportation management
Material management
Policy and procedures
Organisational change
Facilities & equipment
IT systems
Operational planning
OperationoperatieOperational control
Proactive
Design
Operation
Implementation
Act
iviti
esP
hases
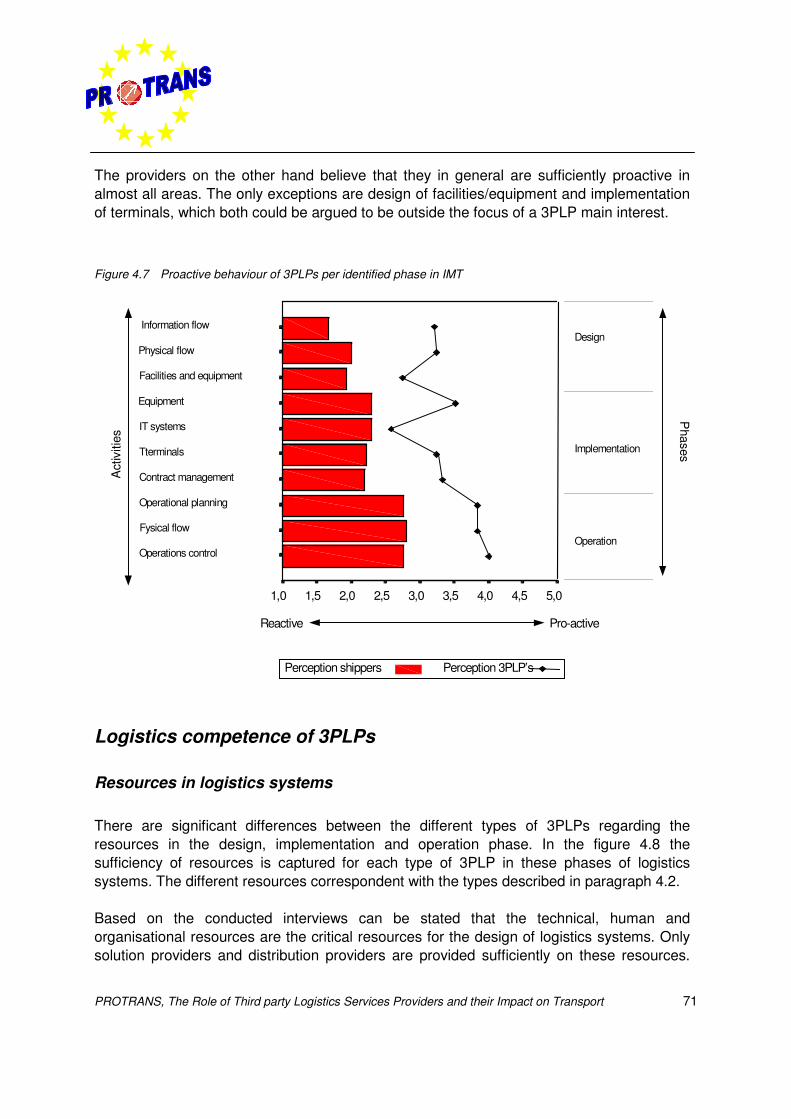
PROTRANS, The Role of Third party Logistics Services Providers and their Impact on Transport 71
The providers on the other hand believe that they in general are sufficiently proactive inalmost all areas. The only exceptions are design of facilities/equipment and implementationof terminals, which both could be argued to be outside the focus of a 3PLP main interest.
Figure 4.7 Proactive behaviour of 3PLPs per identified phase in IMT
Logistics competence of 3PLPs
Resources in logistics systems
There are significant differences between the different types of 3PLPs regarding theresources in the design, implementation and operation phase. In the figure 4.8 thesufficiency of resources is captured for each type of 3PLP in these phases of logisticssystems. The different resources correspondent with the types described in paragraph 4.2.
Based on the conducted interviews can be stated that the technical, human andorganisational resources are the critical resources for the design of logistics systems. Onlysolution providers and distribution providers are provided sufficiently on these resources.
Reactive Pro-active
5,04,54,03,53,02,52,01,51,0
Perception shippers Perception 3PLP’s
Information flow
Fysical flow
Operational planning
Contract management
Tterminals
IT systems
Equipment
Facilities and equipment
Physical flow
Operations control
Act
iviti
es
Design
Operation
Implementation
Phases
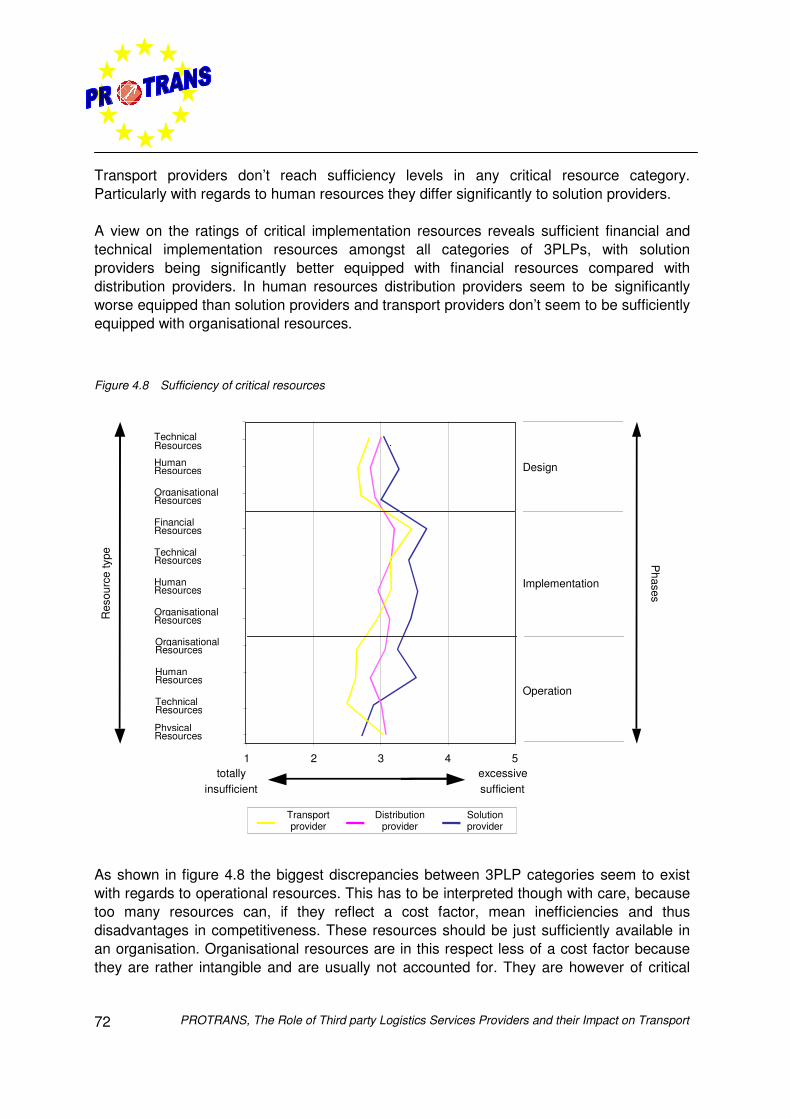
PROTRANS, The Role of Third party Logistics Services Providers and their Impact on Transport72
Transport providers don’t reach sufficiency levels in any critical resource category.Particularly with regards to human resources they differ significantly to solution providers.
A view on the ratings of critical implementation resources reveals sufficient financial andtechnical implementation resources amongst all categories of 3PLPs, with solutionproviders being significantly better equipped with financial resources compared withdistribution providers. In human resources distribution providers seem to be significantlyworse equipped than solution providers and transport providers don’t seem to be sufficientlyequipped with organisational resources.
Figure 4.8 Sufficiency of critical resources
As shown in figure 4.8 the biggest discrepancies between 3PLP categories seem to existwith regards to operational resources. This has to be interpreted though with care, becausetoo many resources can, if they reflect a cost factor, mean inefficiencies and thusdisadvantages in competitiveness. These resources should be just sufficiently available inan organisation. Organisational resources are in this respect less of a cost factor becausethey are rather intangible and are usually not accounted for. They are however of critical
OrganisationalResources
OrganisationalResources
OrganisationalResources
Design
Implementation
1 2 3 4 5
sufficientexcessivetotally
insufficient
Operation
Res
ourc
e ty
pe Phases
Technical
HumanResources
FinancialResources
TechnicalResources
HumanResources
PhysicalResources
TechnicalResources
HumanResources
Resources
Transportprovider
Distributionprovider
Solutionprovider
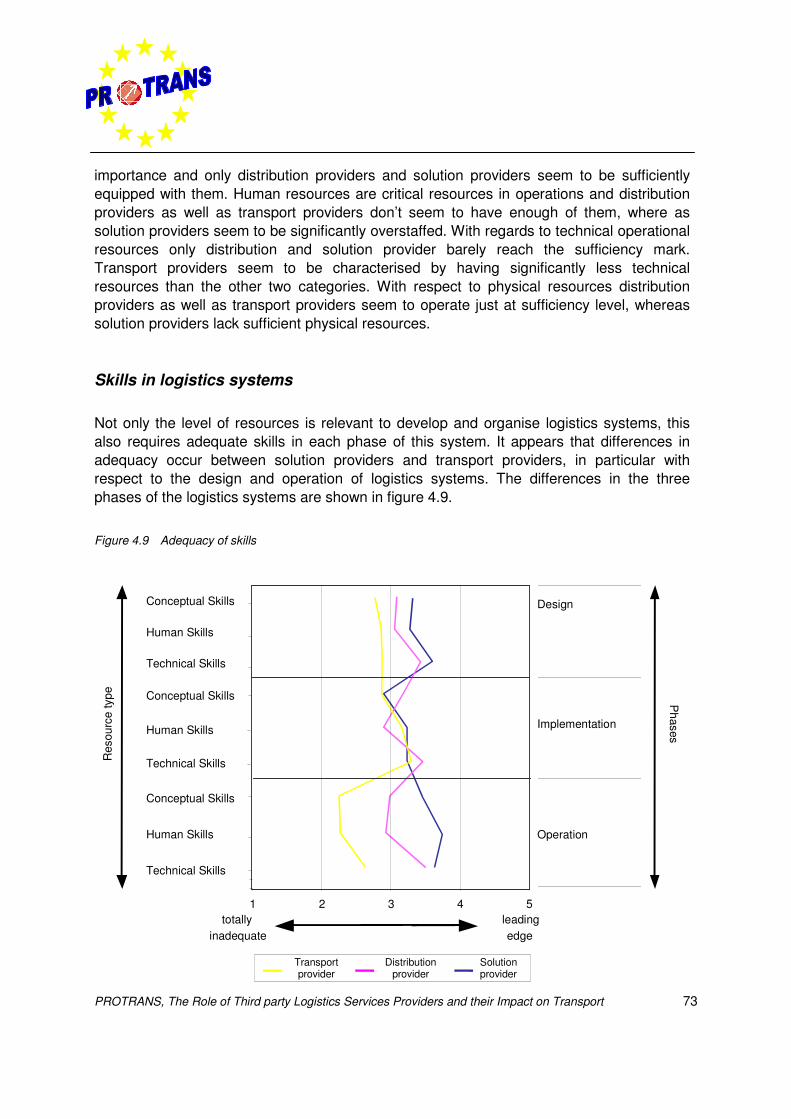
PROTRANS, The Role of Third party Logistics Services Providers and their Impact on Transport 73
importance and only distribution providers and solution providers seem to be sufficientlyequipped with them. Human resources are critical resources in operations and distributionproviders as well as transport providers don’t seem to have enough of them, where assolution providers seem to be significantly overstaffed. With regards to technical operationalresources only distribution and solution provider barely reach the sufficiency mark.Transport providers seem to be characterised by having significantly less technicalresources than the other two categories. With respect to physical resources distributionproviders as well as transport providers seem to operate just at sufficiency level, whereassolution providers lack sufficient physical resources.
Skills in logistics systems
Not only the level of resources is relevant to develop and organise logistics systems, thisalso requires adequate skills in each phase of this system. It appears that differences inadequacy occur between solution providers and transport providers, in particular withrespect to the design and operation of logistics systems. The differences in the threephases of the logistics systems are shown in figure 4.9.
Figure 4.9 Adequacy of skills
Technical Skills
Human Skills
Conceptual Skills
Technical Skills
Human Skills
Conceptual Skills
Technical Skills
Human Skills
Conceptual Skills
Design
Implementation
1 2 3 4 5
edgeleadingtotally
inadequate
Operation
Res
ourc
e ty
pe Phases
Transportprovider
Distributionprovider
Solutionprovider
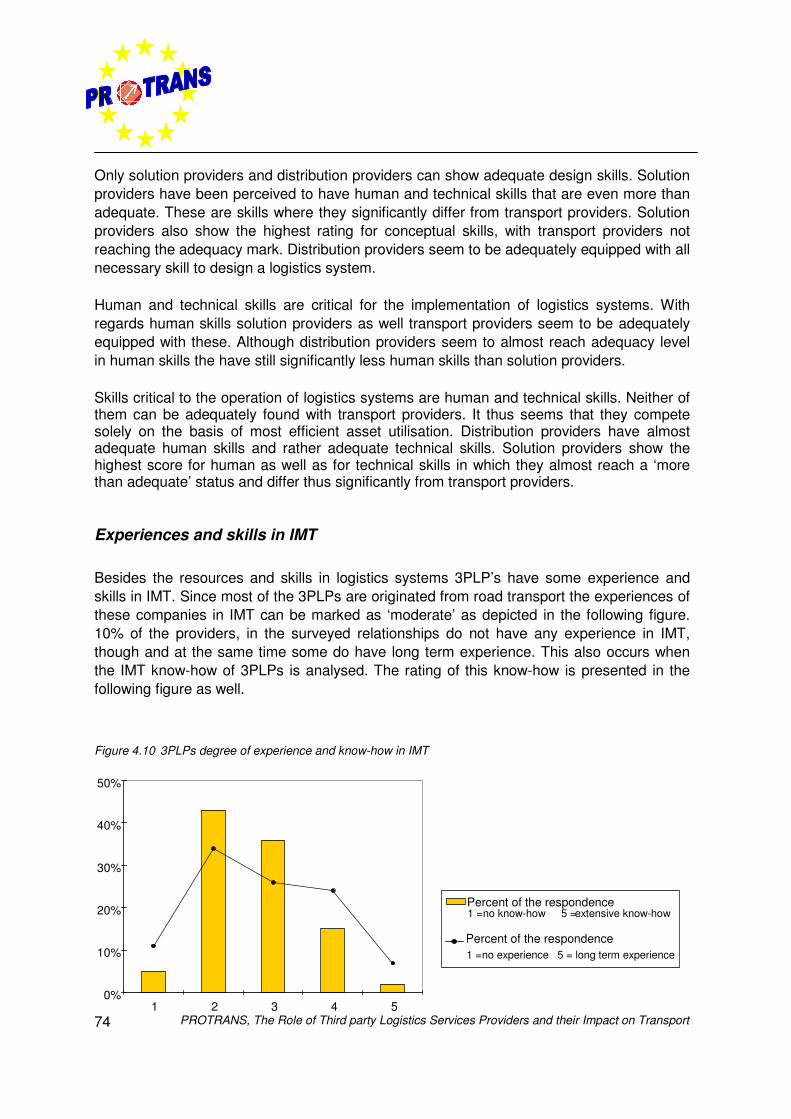
PROTRANS, The Role of Third party Logistics Services Providers and their Impact on Transport74
Only solution providers and distribution providers can show adequate design skills. Solutionproviders have been perceived to have human and technical skills that are even more thanadequate. These are skills where they significantly differ from transport providers. Solutionproviders also show the highest rating for conceptual skills, with transport providers notreaching the adequacy mark. Distribution providers seem to be adequately equipped with allnecessary skill to design a logistics system.
Human and technical skills are critical for the implementation of logistics systems. Withregards human skills solution providers as well transport providers seem to be adequatelyequipped with these. Although distribution providers seem to almost reach adequacy levelin human skills the have still significantly less human skills than solution providers.
Skills critical to the operation of logistics systems are human and technical skills. Neither ofthem can be adequately found with transport providers. It thus seems that they competesolely on the basis of most efficient asset utilisation. Distribution providers have almostadequate human skills and rather adequate technical skills. Solution providers show thehighest score for human as well as for technical skills in which they almost reach a ‘morethan adequate’ status and differ thus significantly from transport providers.
Experiences and skills in IMT
Besides the resources and skills in logistics systems 3PLP’s have some experience andskills in IMT. Since most of the 3PLPs are originated from road transport the experiences ofthese companies in IMT can be marked as ‘moderate’ as depicted in the following figure.10% of the providers, in the surveyed relationships do not have any experience in IMT,though and at the same time some do have long term experience. This also occurs whenthe IMT know-how of 3PLPs is analysed. The rating of this know-how is presented in thefollowing figure as well.
Figure 4.10 3PLPs degree of experience and know-how in IMT
0%
10%
20%
30%
40%
50%
1 2 3 4 5
Percent of the respondence1 =no know-how- 5 =extensive know-how
Percent of the respondence1 =no experience 5 = long term experience
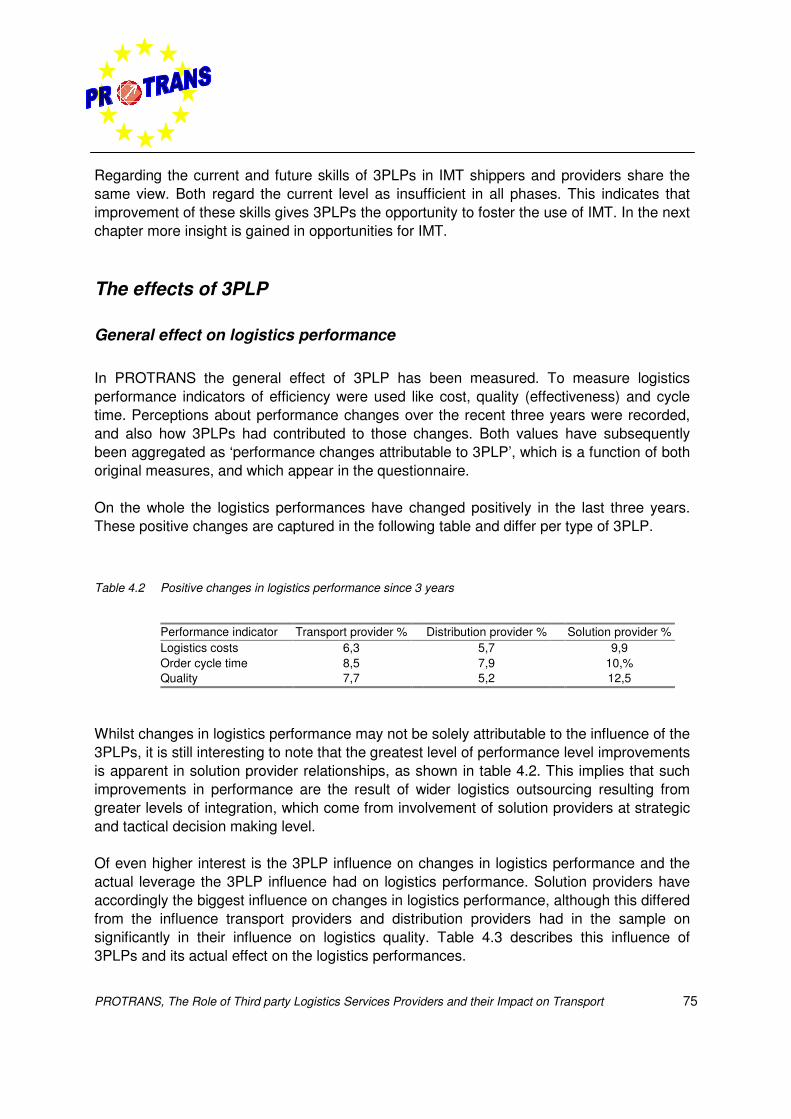
PROTRANS, The Role of Third party Logistics Services Providers and their Impact on Transport 75
Regarding the current and future skills of 3PLPs in IMT shippers and providers share thesame view. Both regard the current level as insufficient in all phases. This indicates thatimprovement of these skills gives 3PLPs the opportunity to foster the use of IMT. In the nextchapter more insight is gained in opportunities for IMT.
The effects of 3PLP
General effect on logistics performance
In PROTRANS the general effect of 3PLP has been measured. To measure logisticsperformance indicators of efficiency were used like cost, quality (effectiveness) and cycletime. Perceptions about performance changes over the recent three years were recorded,and also how 3PLPs had contributed to those changes. Both values have subsequentlybeen aggregated as ‘performance changes attributable to 3PLP’, which is a function of bothoriginal measures, and which appear in the questionnaire.
On the whole the logistics performances have changed positively in the last three years.These positive changes are captured in the following table and differ per type of 3PLP.
Table 4.2 Positive changes in logistics performance since 3 years
Performance indicator Transport provider % Distribution provider % Solution provider %Logistics costs 6,3 5,7 9,9Order cycle time 8,5 7,9 10,%Quality 7,7 5,2 12,5
Whilst changes in logistics performance may not be solely attributable to the influence of the3PLPs, it is still interesting to note that the greatest level of performance level improvementsis apparent in solution provider relationships, as shown in table 4.2. This implies that suchimprovements in performance are the result of wider logistics outsourcing resulting fromgreater levels of integration, which come from involvement of solution providers at strategicand tactical decision making level.
Of even higher interest is the 3PLP influence on changes in logistics performance and theactual leverage the 3PLP influence had on logistics performance. Solution providers haveaccordingly the biggest influence on changes in logistics performance, although this differedfrom the influence transport providers and distribution providers had in the sample onsignificantly in their influence on logistics quality. Table 4.3 describes this influence of3PLPs and its actual effect on the logistics performances.
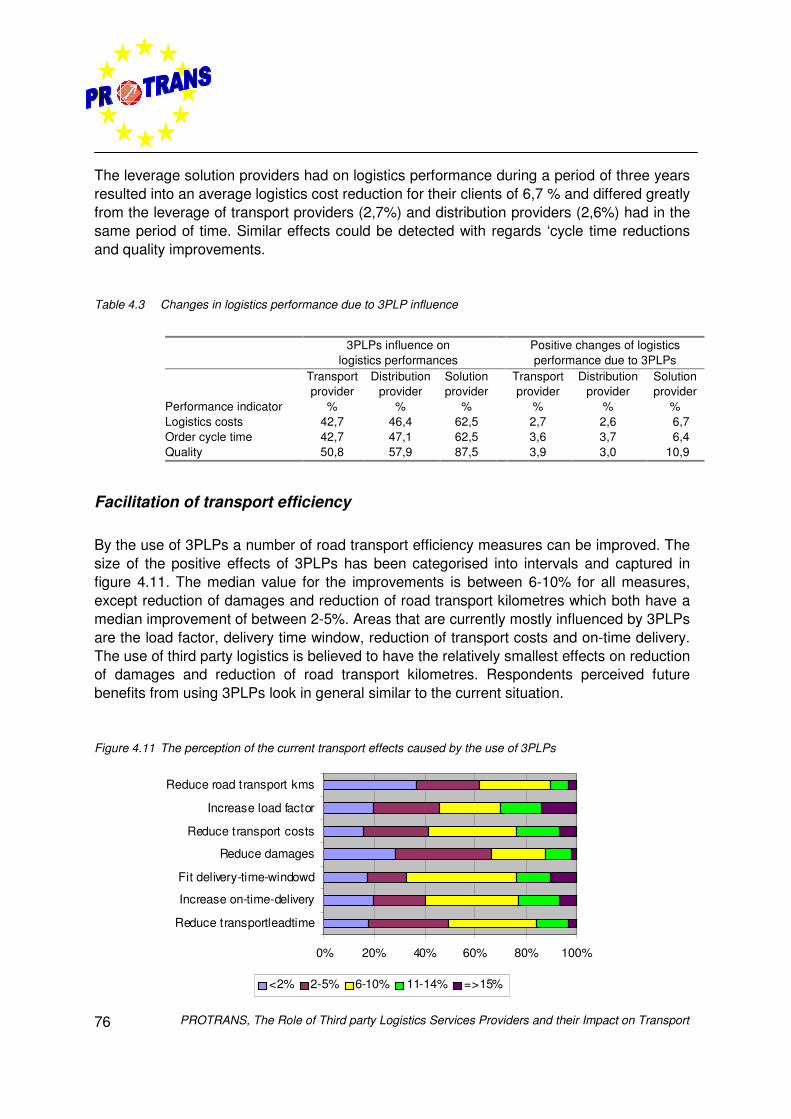
PROTRANS, The Role of Third party Logistics Services Providers and their Impact on Transport76
The leverage solution providers had on logistics performance during a period of three yearsresulted into an average logistics cost reduction for their clients of 6,7 % and differed greatlyfrom the leverage of transport providers (2,7%) and distribution providers (2,6%) had in thesame period of time. Similar effects could be detected with regards ‘cycle time reductionsand quality improvements.
Table 4.3 Changes in logistics performance due to 3PLP influence
3PLPs influence onlogistics performances
Positive changes of logisticsperformance due to 3PLPs
Performance indicator
Transportprovider
%
Distributionprovider
%
Solutionprovider
%
Transportprovider
%
Distributionprovider
%
Solutionprovider
%Logistics costs 42,7 46,4 62,5 2,7 2,6 6,7Order cycle time 42,7 47,1 62,5 3,6 3,7 6,4Quality 50,8 57,9 87,5 3,9 3,0 10,9
Facilitation of transport efficiency
By the use of 3PLPs a number of road transport efficiency measures can be improved. Thesize of the positive effects of 3PLPs has been categorised into intervals and captured infigure 4.11. The median value for the improvements is between 6-10% for all measures,except reduction of damages and reduction of road transport kilometres which both have amedian improvement of between 2-5%. Areas that are currently mostly influenced by 3PLPsare the load factor, delivery time window, reduction of transport costs and on-time delivery.The use of third party logistics is believed to have the relatively smallest effects on reductionof damages and reduction of road transport kilometres. Respondents perceived futurebenefits from using 3PLPs look in general similar to the current situation.
Figure 4.11 The perception of the current transport effects caused by the use of 3PLPs
0% 20% 40% 60% 80% 100%
Reduce transportleadtime
Increase on-time-delivery
Fit delivery-time-windowd
Reduce damages
Reduce transport costs
Increase load factor
Reduce road transport kms
<2% 2-5% 6-10% 11-14% =>15%
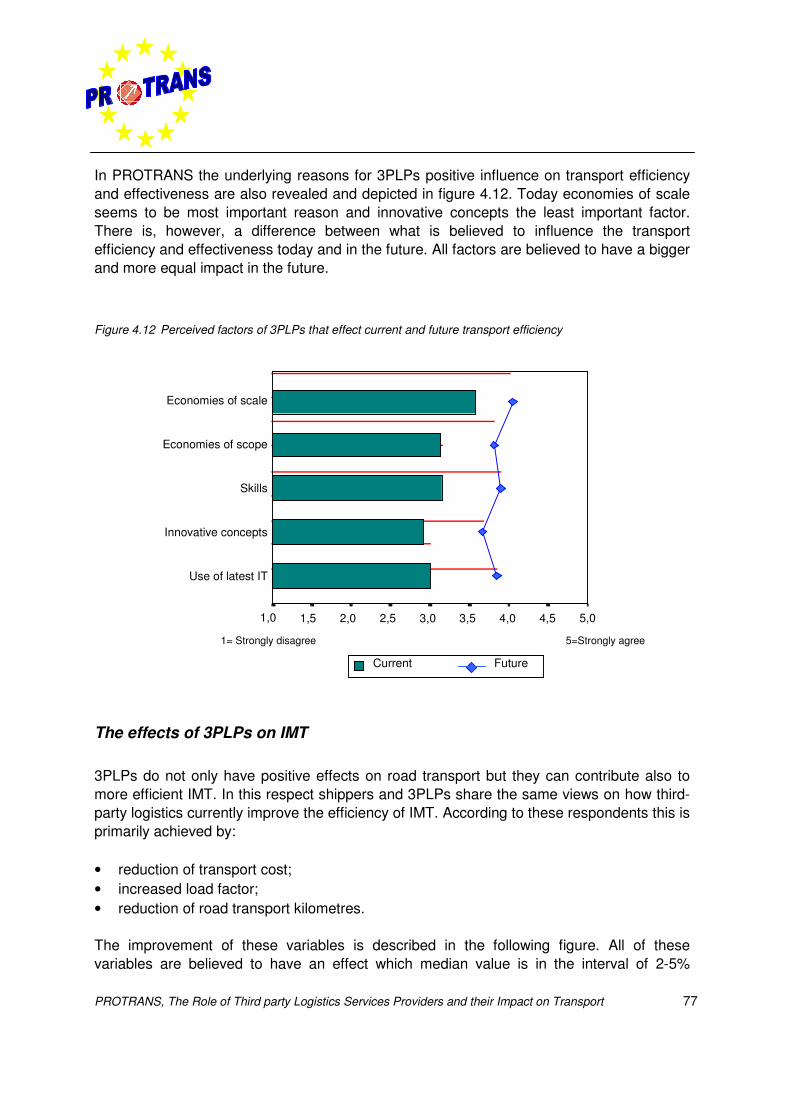
PROTRANS, The Role of Third party Logistics Services Providers and their Impact on Transport 77
In PROTRANS the underlying reasons for 3PLPs positive influence on transport efficiencyand effectiveness are also revealed and depicted in figure 4.12. Today economies of scaleseems to be most important reason and innovative concepts the least important factor.There is, however, a difference between what is believed to influence the transportefficiency and effectiveness today and in the future. All factors are believed to have a biggerand more equal impact in the future.
Figure 4.12 Perceived factors of 3PLPs that effect current and future transport efficiency
The effects of 3PLPs on IMT
3PLPs do not only have positive effects on road transport but they can contribute also tomore efficient IMT. In this respect shippers and 3PLPs share the same views on how third-party logistics currently improve the efficiency of IMT. According to these respondents this isprimarily achieved by:
• reduction of transport cost;• increased load factor;• reduction of road transport kilometres.
The improvement of these variables is described in the following figure. All of thesevariables are believed to have an effect which median value is in the interval of 2-5%
Use of latest IT
Innovative concepts
Skills
Economies of scope
Economies of scale
1= Strongly disagree 5=Strongly agree
5,04,54,03,53,02,52,01,51,0
FutureCurrent
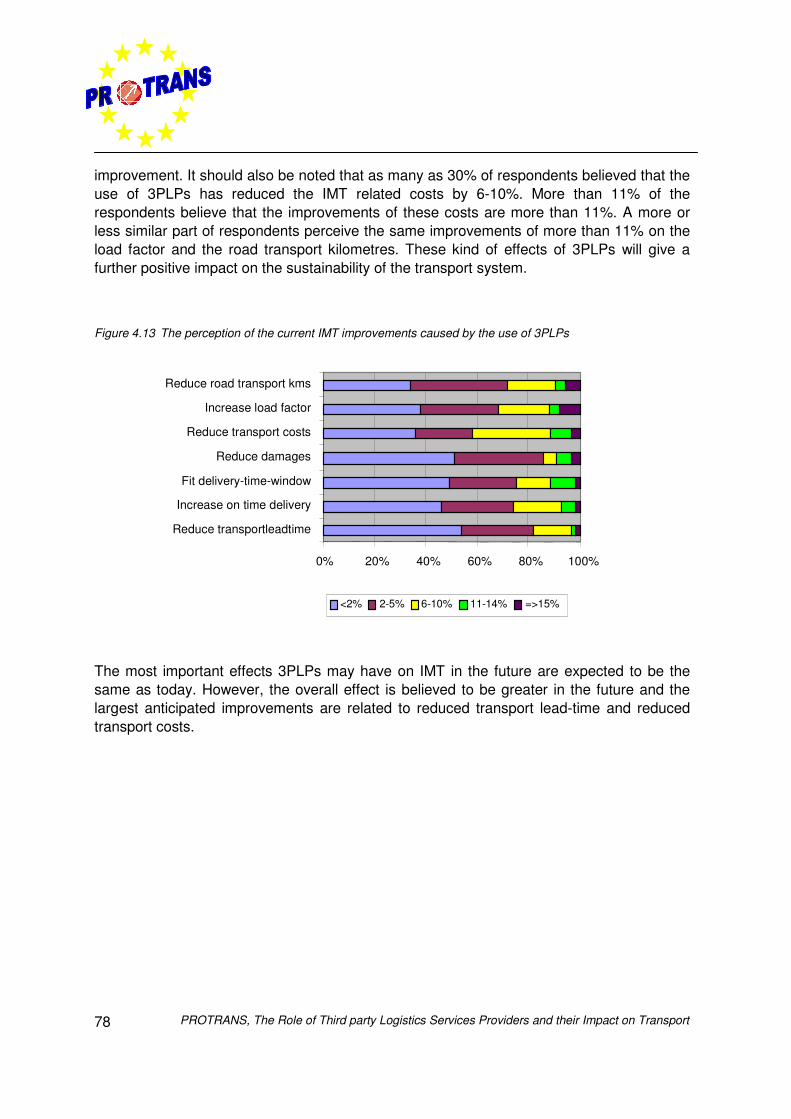
PROTRANS, The Role of Third party Logistics Services Providers and their Impact on Transport78
improvement. It should also be noted that as many as 30% of respondents believed that theuse of 3PLPs has reduced the IMT related costs by 6-10%. More than 11% of therespondents believe that the improvements of these costs are more than 11%. A more orless similar part of respondents perceive the same improvements of more than 11% on theload factor and the road transport kilometres. These kind of effects of 3PLPs will give afurther positive impact on the sustainability of the transport system.
Figure 4.13 The perception of the current IMT improvements caused by the use of 3PLPs
The most important effects 3PLPs may have on IMT in the future are expected to be thesame as today. However, the overall effect is believed to be greater in the future and thelargest anticipated improvements are related to reduced transport lead-time and reducedtransport costs.
0% 20% 40% 60% 80% 100%
Reduce transportleadtime
Fit delivery-time-window
Reduce transport costs
Reduce road transport kms
<2% 2-5% 6-10% 11-14% =>15%
Increase on time delivery
Reduce damages
Increase load factor
PROTRANS, The Role of Third party Logistics Services Providers and their Impact on Transport 79
4.4 Conclusions on supply and demand of logisticsservices
From the analysis of the shipper-3PLP relationship can be derived that the companiesoffering 3PL services can be clustered in three different categories with different serviceofferings:
• solution providers;• distribution providers;• transport providers.
Solution providers have clearly differentiated themselves successfully by high involvementin strategic and tactical decision making in their clients logistics systems. The solutionproviders are most heavily involved in all aspects of the shippers logistics systems (the levelof involvement is 60-90%) the distribution providers somewhat less involved (40-80%except strategic design activities were they are much less involved) and finally the transportproviders are the least involved (20-40%).
3PLPs facilitate shippers’ present and future requirements on logistics and transportsystems. However there is in general a low degree of 3PL involvement in strategic andtactical logistics design decisions. This will also have implications for modal choice wherethe changed demands can act as barrier for the use of IMT. The 3PL involvement in IMT isnot as developed as the involvement in logistics in general and in road transport inparticular. The 3PLPs have a role as systems integrators not operators of IMT systems andit is in the area of implementation that the 3PLPs are most deeply involved.
Finally can be stated that the use of 3PLPs in logistics processes and IMT will lead toimprovement of logistics performances. Because of the economies of scale and scope,3PLPs are able for instance to consolidate physical flows and optimise information flows. Inthe logistics processes the main performance improvements by 3PLP are quality and timerelated e.g. on-time delivery, lead-time reduction and capabilities to fit time-windows. Butalso the load factor is increased by interference of 3PLPs. Regarding IMT the reduction oftransport cost, increased load factor and road transport kilometres are the main indicatorsthat are improved by 3PLPs.

PROTRANS, The Role of Third party Logistics Services Providers and their Impact on Transport80
PROTRANS, The Role of Third party Logistics Services Providers and their Impact on Transport 81
Chapter 5 Barriers and opportunities for third-party logistics
5.1 Introduction
In the previous chapter the logistics services and intermodal services offered by 3PLPs arecompared with the shippers’ demands. Based on this comparison can be concluded that inthe relationship shipper-3PLP there are still some barriers need to be razed to the ground.But this comparison indicate that there are also opportunities for further outsourcing oflogistics and IMT. These barriers and opportunities are identified in the PROTRANS projectand described in this chapter.
5.2 Barriers and opportunities for further outsourcing
Barriers for outsourcing
The resource and skill base as well the entrepreneurial stance 3PLPs take towards themanagement of their clients logistics systems have been identified as influential on thedegree of outsourcing. From this point of view the main barriers to raze to the ground are:
• barriers due to lack of pro-activity;• barriers due to lack of skills and resources.
PROTRANS, The Role of Third party Logistics Services Providers and their Impact on Transport82
Barriers due to lack of pro-activity
The study reveals a difference between shippers’ and 3PLPs’ perceptions of current,desired and ‘most likely to happen’ developments in 3PLPs proactive behaviour. Thisappears today with regards to design and operation of a logistics system and is expected toremain for the design phase. With regards to the by shippers desired entrepreneurial stanceof 3PLPs there seems to be no difference between shippers’ and 3PLPs view. Overall thereseems to be a small difference in the perception about the current proactive behaviour of3PLPs and a significant difference with regards to expected future development, non thoughfor the (by shippers) desired entrepreneurial stance of 3PLPs. In figure 5.1 theseperceptions of the shippers’ and 3PLPs’ on the 3PLPs proactive behaviour are is captured.
Regarding the different design aspects of a logistics system, shippers perceive 3PLPs asbeing on average reactive rather than proactive whilst 3PLP perceive themselves as beingmore proactive than shippers do. Channel design was rated by shippers as being leastproactive and activity in transport management design as the most proactive. With respectto the desired role of 3PLPs (i.e., shippers’ expectations) it becomes apparent that shippers’and 3PLPs’ views don’t differ very much. Exceptions are here the strategic elements ofdesign decisions. This reveals that 3PLPs at large perceive their potential for furtherinvolvement correctly. Compared with their desired level of proactivity by 3PLPs shippersexpect a significant shortfall. The degree of desired 3PLP proactivity in setting customerservice strategy and channel design reflects this clearly.
In implementing logistics systems shippers regard 3PLPs, with the exception of installingfacilities and equipment, as more reactive than proactive. Providers again seem to regardthemselves as slightly more proactive. Since the measuring scale of objective proactivity inthis sense is the shippers’ perception it becomes clear that 3PLPs overate their degree ofproactive behaviour in this phase. There is, however, little or no difference in perceptionwith regard to the desired future entrepreneurial stance of 3PLPs in implementing logisticssystems. Shippers as well as 3PLPs see development of 3PLP proactive behaviour inlogistics management as desirable. And again, based on their assessment of the presentsituation, shippers’ hopes about the future in that sense seem to be more subdued.
At last comparing views on 3PLPs behaviour in operating a logistics system reveals that thecurrent view of shippers is that there is a slight tendency to reaction, with 3PLPs regardingthemselves as slightly proactive. As described in figure 5.1 there seems to be a differentinterpretation of 3PLPs’ proactivity with respect to process execution and process control.An explanation of the discrepancy in process execution could be the lack of resources3PLPs currently report. This circumstance would of course also explain 3PLPsmisunderstanding of proactivity in process control. In addition 3PLPs might not haveunderstood shippers’ or at least not share the same view on the necessity for processcontrol. In the future both shippers and providers desire a more proactive role from 3PLPsin operating logistics systems. However, shippers’ views of how much of this is actually
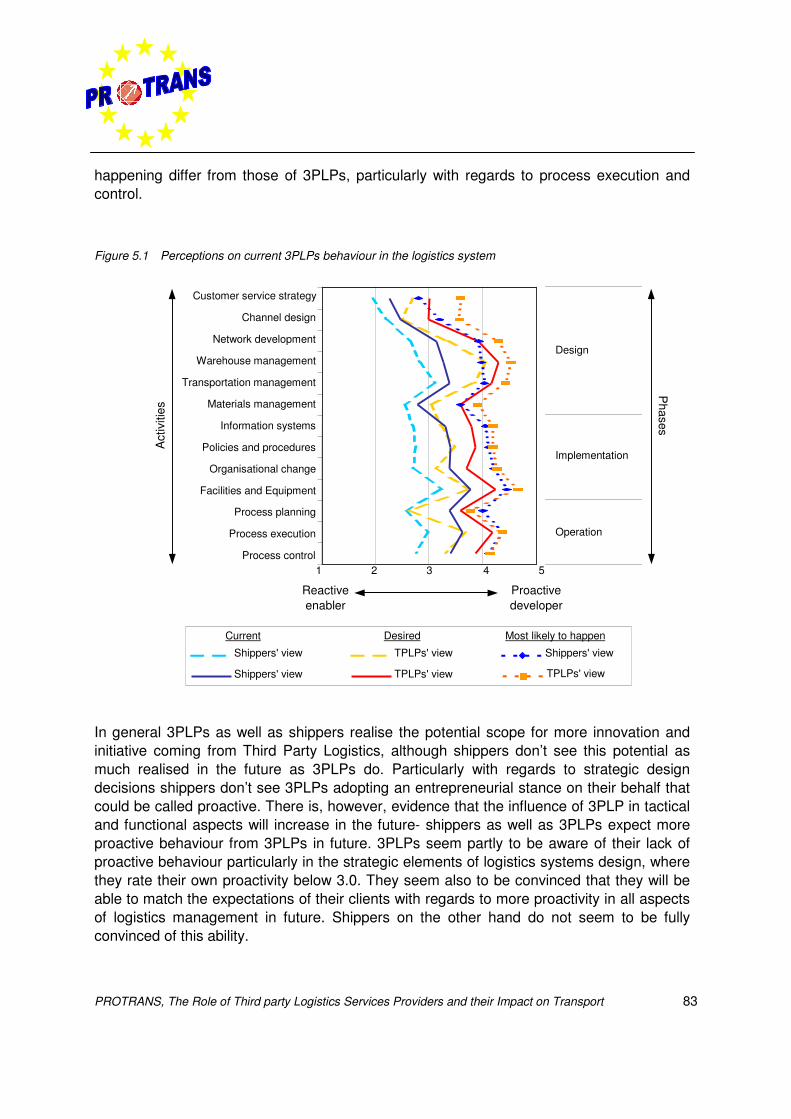
PROTRANS, The Role of Third party Logistics Services Providers and their Impact on Transport 83
happening differ from those of 3PLPs, particularly with regards to process execution andcontrol.
Figure 5.1 Perceptions on current 3PLPs behaviour in the logistics system
In general 3PLPs as well as shippers realise the potential scope for more innovation andinitiative coming from Third Party Logistics, although shippers don’t see this potential asmuch realised in the future as 3PLPs do. Particularly with regards to strategic designdecisions shippers don’t see 3PLPs adopting an entrepreneurial stance on their behalf thatcould be called proactive. There is, however, evidence that the influence of 3PLP in tacticaland functional aspects will increase in the future- shippers as well as 3PLPs expect moreproactive behaviour from 3PLPs in future. 3PLPs seem partly to be aware of their lack ofproactive behaviour particularly in the strategic elements of logistics systems design, wherethey rate their own proactivity below 3.0. They seem also to be convinced that they will beable to match the expectations of their clients with regards to more proactivity in all aspectsof logistics management in future. Shippers on the other hand do not seem to be fullyconvinced of this ability.
Customer service strategy
Channel design
Network development
Warehouse management
Transportation management
Materials management
Information systems
Policies and procedures
Organisational change
Facilities and Equipment
Process planning
Process execution
Process control
Shippers' view TPLPs' view Shippers' view
TPLPs' viewShippers' view TPLPs' view
Current Desired
1 2 3 4 5
Most likely to happen
Design
Implementation
Operation
Phases
Act
iviti
es
Reactiveenabler
Proactivedeveloper
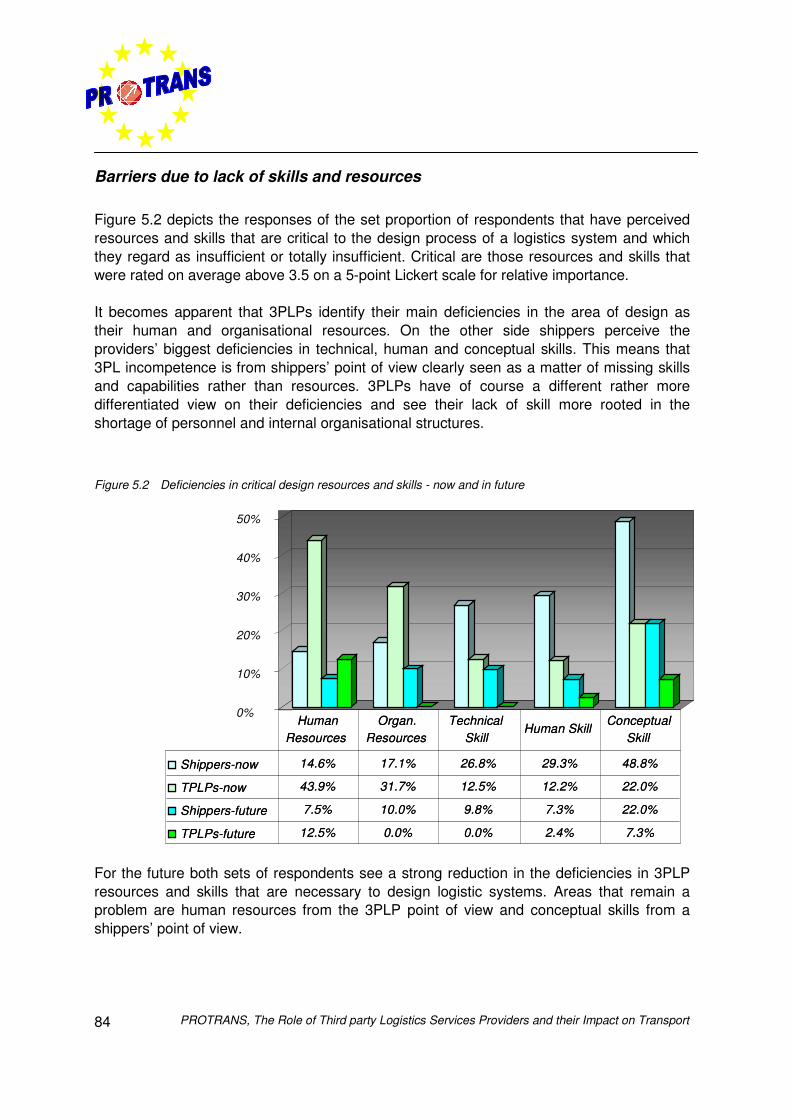
PROTRANS, The Role of Third party Logistics Services Providers and their Impact on Transport84
Barriers due to lack of skills and resources
Figure 5.2 depicts the responses of the set proportion of respondents that have perceivedresources and skills that are critical to the design process of a logistics system and whichthey regard as insufficient or totally insufficient. Critical are those resources and skills thatwere rated on average above 3.5 on a 5-point Lickert scale for relative importance.
It becomes apparent that 3PLPs identify their main deficiencies in the area of design astheir human and organisational resources. On the other side shippers perceive theproviders’ biggest deficiencies in technical, human and conceptual skills. This means that3PL incompetence is from shippers’ point of view clearly seen as a matter of missing skillsand capabilities rather than resources. 3PLPs have of course a different rather moredifferentiated view on their deficiencies and see their lack of skill more rooted in theshortage of personnel and internal organisational structures.
Figure 5.2 Deficiencies in critical design resources and skills - now and in future
For the future both sets of respondents see a strong reduction in the deficiencies in 3PLPresources and skills that are necessary to design logistic systems. Areas that remain aproblem are human resources from the 3PLP point of view and conceptual skills from ashippers’ point of view.
0%
10%
20%
30%
40%
50%
Shippers-now 14.6% 17.1% 26.8% 29.3% 48.8%
TPLPs-now 43.9% 31.7% 12.5% 12.2% 22.0%
Shippers-future 7.5% 10.0% 9.8% 7.3% 22.0%
TPLPs-future 12.5% 0.0% 0.0% 2.4% 7.3%
Human Resources
Organ. Resources
Technical Skill
Human SkillConceptual
Skill
0%
10%
20%
30%
40%
50%
Shippers-now 14.6% 17.1% 26.8% 29.3% 48.8%
TPLPs-now 43.9% 31.7% 12.5% 12.2% 22.0%
Shippers-future 7.5% 10.0% 9.8% 7.3% 22.0%
TPLPs-future 12.5% 0.0% 0.0% 2.4% 7.3%
Human Resources
Organ. Resources
Technical Skill
Human SkillConceptual
Skill
50%
40%
30%
20%
10%
0%
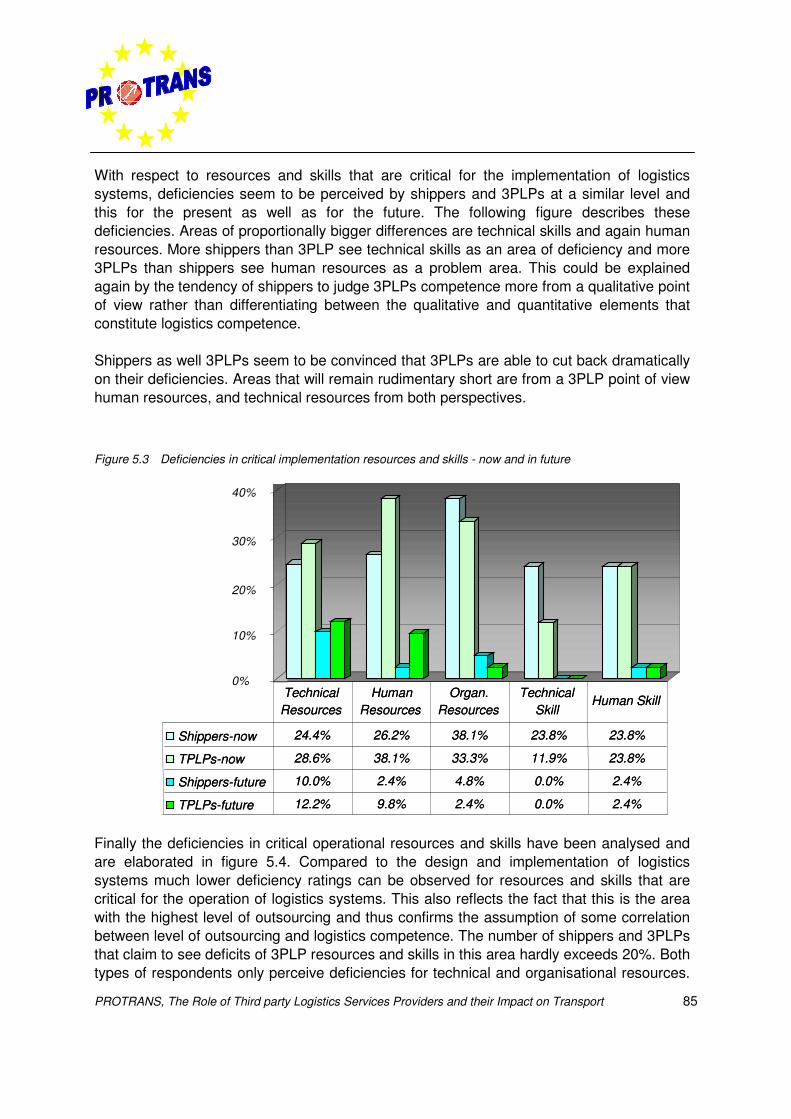
PROTRANS, The Role of Third party Logistics Services Providers and their Impact on Transport 85
With respect to resources and skills that are critical for the implementation of logisticssystems, deficiencies seem to be perceived by shippers and 3PLPs at a similar level andthis for the present as well as for the future. The following figure describes thesedeficiencies. Areas of proportionally bigger differences are technical skills and again humanresources. More shippers than 3PLP see technical skills as an area of deficiency and more3PLPs than shippers see human resources as a problem area. This could be explainedagain by the tendency of shippers to judge 3PLPs competence more from a qualitative pointof view rather than differentiating between the qualitative and quantitative elements thatconstitute logistics competence.
Shippers as well 3PLPs seem to be convinced that 3PLPs are able to cut back dramaticallyon their deficiencies. Areas that will remain rudimentary short are from a 3PLP point of viewhuman resources, and technical resources from both perspectives.
Figure 5.3 Deficiencies in critical implementation resources and skills - now and in future
Finally the deficiencies in critical operational resources and skills have been analysed andare elaborated in figure 5.4. Compared to the design and implementation of logisticssystems much lower deficiency ratings can be observed for resources and skills that arecritical for the operation of logistics systems. This also reflects the fact that this is the areawith the highest level of outsourcing and thus confirms the assumption of some correlationbetween level of outsourcing and logistics competence. The number of shippers and 3PLPsthat claim to see deficits of 3PLP resources and skills in this area hardly exceeds 20%. Bothtypes of respondents only perceive deficiencies for technical and organisational resources.
0%
10%
20%
30%
40%
Shippers-now 24.4% 26.2% 38.1% 23.8% 23.8%
TPLPs-now 28.6% 38.1% 33.3% 11.9% 23.8%
Shippers-future 10.0% 2.4% 4.8% 0.0% 2.4%
TPLPs-future 12.2% 9.8% 2.4% 0.0% 2.4%
Technical Resources
Human Resources
Organ. Resources
Technical Skill
Human Skill0%
10%
20%
30%
40%
Shippers-now 24.4% 26.2% 38.1% 23.8% 23.8%
TPLPs-now 28.6% 38.1% 33.3% 11.9% 23.8%
Shippers-future 10.0% 2.4% 4.8% 0.0% 2.4%
TPLPs-future 12.2% 9.8% 2.4% 0.0% 2.4%
Technical Resources
Human Resources
Organ. Resources
Technical Skill
Human Skill
40%
30%
20%
10%
0%
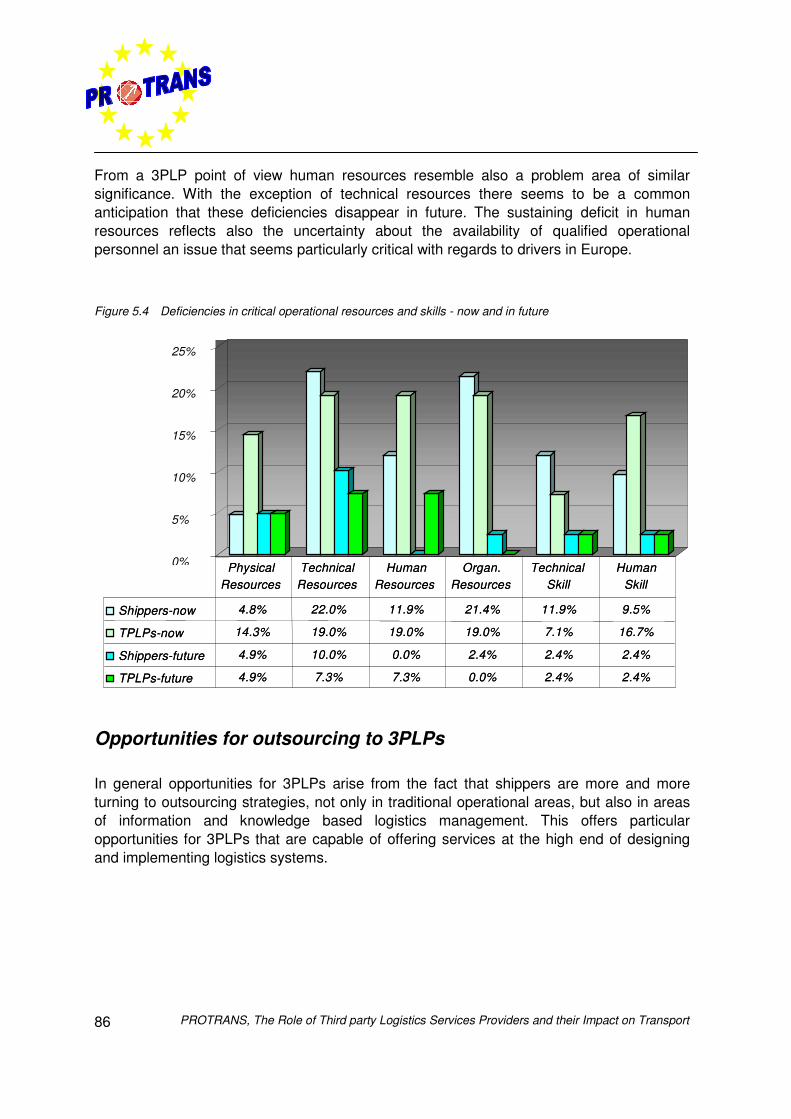
PROTRANS, The Role of Third party Logistics Services Providers and their Impact on Transport86
From a 3PLP point of view human resources resemble also a problem area of similarsignificance. With the exception of technical resources there seems to be a commonanticipation that these deficiencies disappear in future. The sustaining deficit in humanresources reflects also the uncertainty about the availability of qualified operationalpersonnel an issue that seems particularly critical with regards to drivers in Europe.
Figure 5.4 Deficiencies in critical operational resources and skills - now and in future
Opportunities for outsourcing to 3PLPs
In general opportunities for 3PLPs arise from the fact that shippers are more and moreturning to outsourcing strategies, not only in traditional operational areas, but also in areasof information and knowledge based logistics management. This offers particularopportunities for 3PLPs that are capable of offering services at the high end of designingand implementing logistics systems.
0%
5%
10%
15%
20%
25%
Shippers-now 4.8% 22.0% 11.9% 21.4% 11.9% 9.5%
TPLPs-now 14.3% 19.0% 19.0% 19.0% 7.1% 16.7%
Shippers-future 4.9% 10.0% 0.0% 2.4% 2.4% 2.4%
TPLPs-future 4.9% 7.3% 7.3% 0.0% 2.4% 2.4%
Physical Resources
Technical Resources
Human Resources
Organ. Resources
Technical Skill
Human Skill
25%
20%
15%
10%
5%
0%
PROTRANS, The Role of Third party Logistics Services Providers and their Impact on Transport 87
Opportunities arising from changing market
The 3PL market in Europe is of a substantial size and is experiencing fast growth. Recentresearch suggests (see table 5.1)2 that the total expenditure, outsourced or not outsourced,on logistics in Europe will grow annually between 3.5 and 3.8 % until 2005. This is morethan the expected growth rates for European GDP. This puts a value to the logistics marketin 2001 of 506 billion Euro expecting to grow to 585 billion Euro in 2005. The market for3PLPs is reflected in the outsourcing ratios of transport, handling, storage and called valueadded services. This was calculated for 2001 at 197 billions Euro and is forecasted to be250 billion Euro in 2005. It is also forecasted that the outsourcing ratio of value addedservices in Europe would grow above average from its level of 28% in 2001 to 35% in 2005.The figure that is currently (2001) put to the market for 3PL service providers is 50.4 billionEuro and is expected to grow between 11% and 12% per annum. The real segment growthcome thus from the acquisition of a growing variety of production related and administrativefunctions, which migrate from industry to service providers and which are commonly calledValue Added Services.
The stimulus for the rise of the 3PL market can be found in developments on both thedemand and the supply side of 3PL services. In addition to rather generic reasons, i.e.competitive pressure, globalisation, etc., these are the drivers for outsourcing in Europe:
• On the demand side: strategic reduction of asset intensity; restructuring of thedistribution structure, triggered by a restructuring of the production structure; and,potential reduction of labour costs by switching to a non-unionised labour force.
• And on the supply side: deregulation of the transportation industry, which made itpossible to provide 3PL services more competitively; declining profit margins in basicservices (i.e. freight transport); and, availability of capital to 3PLPs.
2 The important aspect of the projections, which are based on several sources, is not their absolute number but the expected growth rates of the individual sub-segments
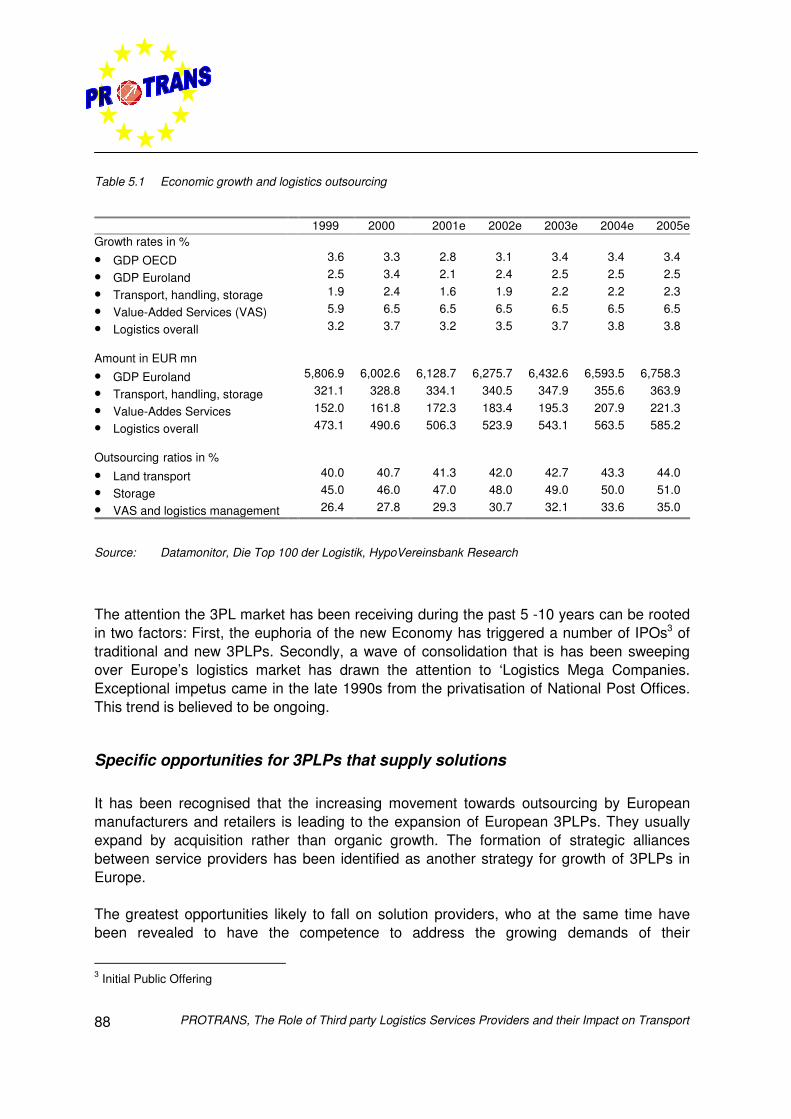
PROTRANS, The Role of Third party Logistics Services Providers and their Impact on Transport88
Table 5.1 Economic growth and logistics outsourcing
1999 2000 2001e 2002e 2003e 2004e 2005eGrowth rates in %
• GDP OECD 3.6 3.3 2.8 3.1 3.4 3.4 3.4
• GDP Euroland 2.5 3.4 2.1 2.4 2.5 2.5 2.5
• Transport, handling, storage 1.9 2.4 1.6 1.9 2.2 2.2 2.3
• Value-Added Services (VAS) 5.9 6.5 6.5 6.5 6.5 6.5 6.5
• Logistics overall 3.2 3.7 3.2 3.5 3.7 3.8 3.8
Amount in EUR mn
• GDP Euroland 5,806.9 6,002.6 6,128.7 6,275.7 6,432.6 6,593.5 6,758.3
• Transport, handling, storage 321.1 328.8 334.1 340.5 347.9 355.6 363.9
• Value-Addes Services 152.0 161.8 172.3 183.4 195.3 207.9 221.3
• Logistics overall 473.1 490.6 506.3 523.9 543.1 563.5 585.2
Outsourcing ratios in %
• Land transport 40.0 40.7 41.3 42.0 42.7 43.3 44.0
• Storage 45.0 46.0 47.0 48.0 49.0 50.0 51.0
• VAS and logistics management 26.4 27.8 29.3 30.7 32.1 33.6 35.0
Source: Datamonitor, Die Top 100 der Logistik, HypoVereinsbank Research
The attention the 3PL market has been receiving during the past 5 -10 years can be rootedin two factors: First, the euphoria of the new Economy has triggered a number of IPOs3 oftraditional and new 3PLPs. Secondly, a wave of consolidation that is has been sweepingover Europe’s logistics market has drawn the attention to ‘Logistics Mega Companies.Exceptional impetus came in the late 1990s from the privatisation of National Post Offices.This trend is believed to be ongoing.
Specific opportunities for 3PLPs that supply solutions
It has been recognised that the increasing movement towards outsourcing by Europeanmanufacturers and retailers is leading to the expansion of European 3PLPs. They usuallyexpand by acquisition rather than organic growth. The formation of strategic alliancesbetween service providers has been identified as another strategy for growth of 3PLPs inEurope.
The greatest opportunities likely to fall on solution providers, who at the same time havebeen revealed to have the competence to address the growing demands of their
3 Initial Public Offering
PROTRANS, The Role of Third party Logistics Services Providers and their Impact on Transport 89
outsourcing customers. The research clearly shows that solution providers have deliveredbetter logistics performance than transport and distribution providers. This is due to theirhigher level of involvement, particularly in strategic and tactical design of logistics systems,which they subsequently manage. It is also due to their ability to subcontract the dailyoperations to preferred subcontractors.Given the forecasted growth in outsourcing ratios, particularly with respect to value addedservices and management and/or information based services it can be assumed that 3PLPsof all ‘colours’ are naturally aspired to become solution providers. However, this is tosimplistic. The ability of transport and distribution providers to migrate to solution provisionis constrained by their lack of resources and skills. The opportunities for transport anddistribution providers are either to establish true economies of scale in a limited set ofservices and/or a broad set of services within a constrained geography. Put simply theymay have to except to be preferred sub-contractors to solution providers, who are thearchitects and managers of Pan-European logistics systems.
This backs the question, how solution providers actually develop, and which at this momentin time cannot conclusively be answered. The survey has shown that the key to theprovision of comprehensive logistics solution is a pool of highly developed and widespreadskills and appropriate resources. One single company, who mainly emerged of large scale3PLPs, can facilitate these. Alternatively solutions can be facilitated by (temporary)alliances of companies that pool their specific resources and skill in a form of virtualenterprise. Recent examples of big logistics contracts awarded in the automotive industryexemplify this.
5.3 Barriers and opportunities to intermodaltransport
Barriers to intermodal transport
In general there are very modest growth expectations for the use of IMT and this may bethe reality if nothing changes since different perceived barriers to intermodal transport canbe identified. But the modest growth IMT is also limited because of barriers, which areinherent to IMT.
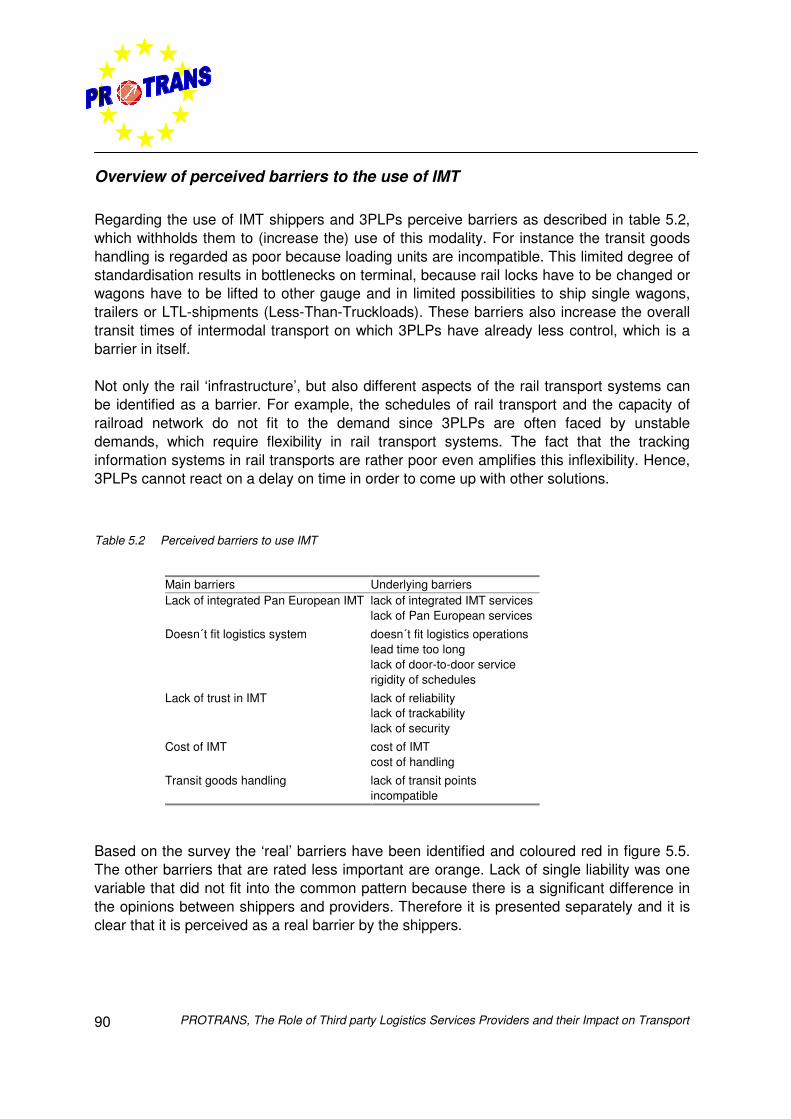
PROTRANS, The Role of Third party Logistics Services Providers and their Impact on Transport90
Overview of perceived barriers to the use of IMT
Regarding the use of IMT shippers and 3PLPs perceive barriers as described in table 5.2,which withholds them to (increase the) use of this modality. For instance the transit goodshandling is regarded as poor because loading units are incompatible. This limited degree ofstandardisation results in bottlenecks on terminal, because rail locks have to be changed orwagons have to be lifted to other gauge and in limited possibilities to ship single wagons,trailers or LTL-shipments (Less-Than-Truckloads). These barriers also increase the overalltransit times of intermodal transport on which 3PLPs have already less control, which is abarrier in itself.
Not only the rail ‘infrastructure’, but also different aspects of the rail transport systems canbe identified as a barrier. For example, the schedules of rail transport and the capacity ofrailroad network do not fit to the demand since 3PLPs are often faced by unstabledemands, which require flexibility in rail transport systems. The fact that the trackinginformation systems in rail transports are rather poor even amplifies this inflexibility. Hence,3PLPs cannot react on a delay on time in order to come up with other solutions.
Table 5.2 Perceived barriers to use IMT
Main barriers Underlying barriersLack of integrated Pan European IMT lack of integrated IMT services
lack of Pan European services
Doesn´t fit logistics system doesn´t fit logistics operationslead time too longlack of door-to-door servicerigidity of schedules
Lack of trust in IMT lack of reliabilitylack of trackabilitylack of security
Cost of IMT cost of IMTcost of handling
Transit goods handling lack of transit pointsincompatible
Based on the survey the ‘real’ barriers have been identified and coloured red in figure 5.5.The other barriers that are rated less important are orange. Lack of single liability was onevariable that did not fit into the common pattern because there is a significant difference inthe opinions between shippers and providers. Therefore it is presented separately and it isclear that it is perceived as a real barrier by the shippers.
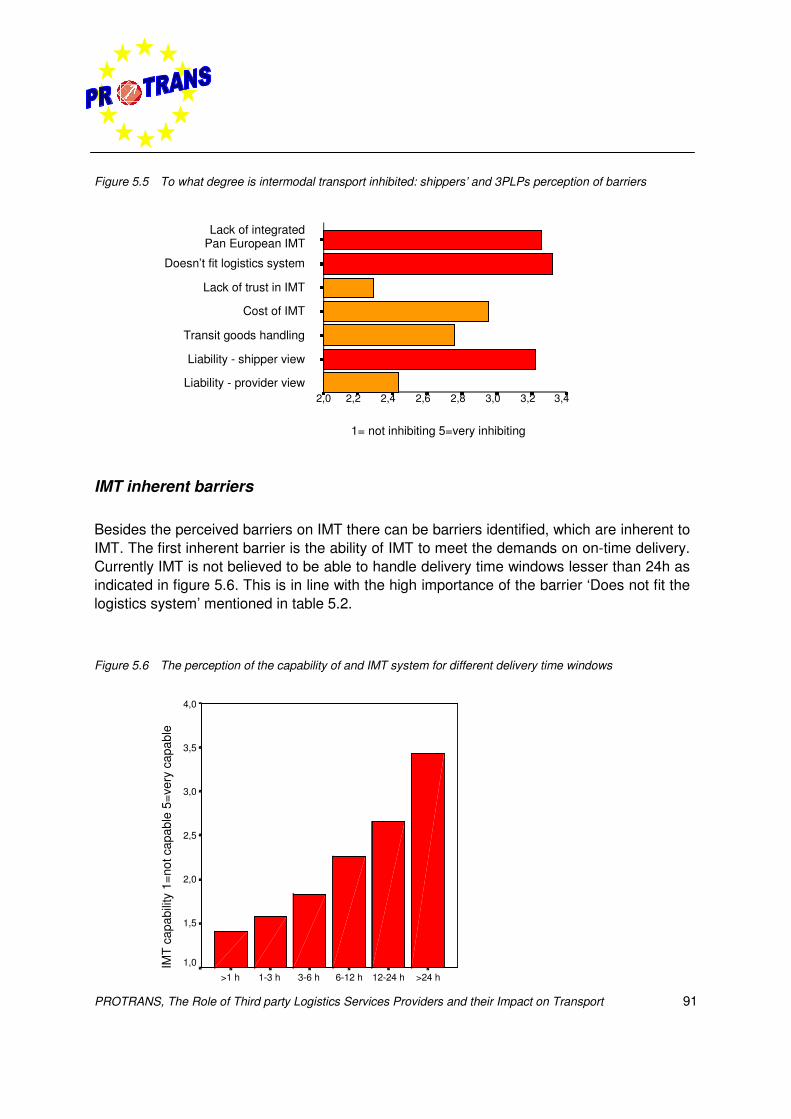
PROTRANS, The Role of Third party Logistics Services Providers and their Impact on Transport 91
Figure 5.5 To what degree is intermodal transport inhibited: shippers’ and 3PLPs perception of barriers
IMT inherent barriers
Besides the perceived barriers on IMT there can be barriers identified, which are inherent toIMT. The first inherent barrier is the ability of IMT to meet the demands on on-time delivery.Currently IMT is not believed to be able to handle delivery time windows lesser than 24h asindicated in figure 5.6. This is in line with the high importance of the barrier ‘Does not fit thelogistics system’ mentioned in table 5.2.
Figure 5.6 The perception of the capability of and IMT system for different delivery time windows
>24 h12-24 h6-12 h3-6 h1-3 h>1 h
IMT
capa
bilit
y 1=
not c
apab
le 5
=ver
y ca
pabl
e
4,0
3,5
3,0
2,5
2,0
1,5
1,0
3,43,23,02,82,62,42,22,0
1= not inhibiting 5=very inhibiting
Liability - provider view
Liability - shipper view
Transit goods handling
Cost of IMT
Lack of trust in IMT
Doesn’t fit logistics system
Lack of integratedPan European IMT
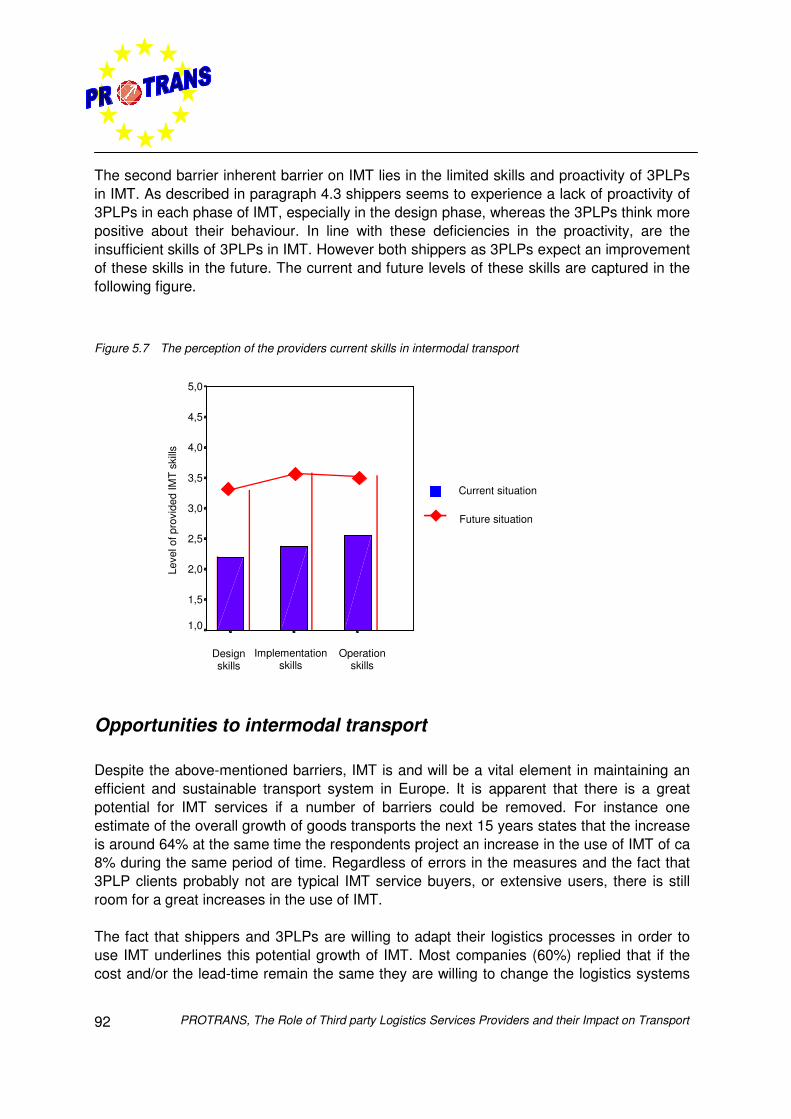
PROTRANS, The Role of Third party Logistics Services Providers and their Impact on Transport92
The second barrier inherent barrier on IMT lies in the limited skills and proactivity of 3PLPsin IMT. As described in paragraph 4.3 shippers seems to experience a lack of proactivity of3PLPs in each phase of IMT, especially in the design phase, whereas the 3PLPs think morepositive about their behaviour. In line with these deficiencies in the proactivity, are theinsufficient skills of 3PLPs in IMT. However both shippers as 3PLPs expect an improvementof these skills in the future. The current and future levels of these skills are captured in thefollowing figure.
Figure 5.7 The perception of the providers current skills in intermodal transport
Opportunities to intermodal transport
Despite the above-mentioned barriers, IMT is and will be a vital element in maintaining anefficient and sustainable transport system in Europe. It is apparent that there is a greatpotential for IMT services if a number of barriers could be removed. For instance oneestimate of the overall growth of goods transports the next 15 years states that the increaseis around 64% at the same time the respondents project an increase in the use of IMT of ca8% during the same period of time. Regardless of errors in the measures and the fact that3PLP clients probably not are typical IMT service buyers, or extensive users, there is stillroom for a great increases in the use of IMT.
The fact that shippers and 3PLPs are willing to adapt their logistics processes in order touse IMT underlines this potential growth of IMT. Most companies (60%) replied that if thecost and/or the lead-time remain the same they are willing to change the logistics systems
Current situation
Operationskills
Designskills
Leve
l of p
rovi
ded
IMT
skill
s
5,0
4,5
4,0
3,5
3,0
2,5
2,0
1,5
1,0
Future situation
Implementationskills
PROTRANS, The Role of Third party Logistics Services Providers and their Impact on Transport 93
to facilitate the use of IMT. 34% of the firms required cost and/or lead-time improvements inorder to consider a change. The remaining 6% could not consider adapting their logisticsprocesses in order to increase the use IMT. This potential growth also depends on thedegree in which actors in IMT are able to convert the main opportunities into money.
The main opportunities to increase the use of IMT can be categorised and related to:
• internal aspects of IMT:− efficiency effect of 3PLPs on IMT;− removal of barriers;− future role of 3PLPs in IMT;
• external (regulatory) aspects of IMT.
Efficiency effect of 3PLPs on IMT
The first ‘internal’ opportunity lies in the efficiency effect of 3PLPs on IMT. To increase theoverall efficiency of IMT means that further effort are necessary to integrate the existingsystems of transport services and logistics designed to ensure the delivery of consignmentsto the end user. In this respect 3PLPs have and can achieve improvements in IMT.Especially with respect to reduction of lead times, improved on-time deliveries, fit to deliverytime windows and the reduction of transport costs improvements can be expected form3PLPs as already mentioned in paragraph 4.3.
Removal of barriers
Barriers in other modes can induce an opportunity for 3PLPs to foster intermodal transport.For instance, the fact that the road networks are getting more and more congested will leadto a decreasing reliability of shipments via road transport. This will have a positive effect onthe use of intermodal transport since 3PLPs can change modes from road to railroad orother modes of transport.
Furthermore ‘internal’ opportunities for IMT are related to barriers that will have to beremoved and to what extend 3PLPs can fulfil a part in this ‘removal’ of barriers. The mainbarriers that should be razed to the ground are:
• does not fit the logistics system;• lack of single liability as the shippers perceive it;• lack of integrated Pan European IMT services.
A large part of the first barrier is made up of the incompatibility between IMT andestablished logistics processes. This may not be a permanent barrier since 90% of the
PROTRANS, The Role of Third party Logistics Services Providers and their Impact on Transport94
respondents are willing to change the processes if the cost/service level remain the same orimprove by the use of IMT. As described above 3PLPs can achieve improvements in IMT,which are related to this barrier like improvements of on-time deliveries and delivery timewindows. If 3PLPs gain insight in these effects and translated them to the shippers, parts ofthis 90% will actual adapt the logistics processes and use more IMT.
In order to ‘fit’ IMT to logistics processes 3PLPs can improve the loading and unloadingfacilities in order to decrease waiting times. They can also absorb variations in intermodaltransport since they have the flexibility to switch to road transport. An other solution 3PLPscan provide in respect to unstable demands is to realise (de)consolidation centres. In thesecentres LTL-shipments can be combined to realise more volume in order to fit to IMTprocesses.
The second barrier may be eliminated if 3PLPs were able to assume the liability. This maybe an opportunity for very large 3PLPs which are able to assume certain risks but whetheror not this barrier will be removed is probably also to a great extent a matter of changes inlegislation. A 3PLP can furthermore improve the tracking information to improve the liabilityof intermodal transport since this is not well developed in intermodal transport.
Future role of 3PLPs in IMT
The last barrier ‘lack of integrated Pan European IMT services’ can be ‘eliminated’ by3PLPs if they pick up the most desirable future roles in IMT. These future roles of 3PLPsare captured in figure 5.8. Shippers and 3PLPs see a number of different opportunities for3PLPs active in IMT. Regarding the roles of ‘Pan European integrator’ and ‘Provider ofequipment and infrastructure’ both have the same opinion. Within the role of integrator theemphasis lies on the facilitation of Pan European, services, door-to-door services and shortdistance IMT services. But also on the development of intermodal traffic systems andprovision of a information platform for IMT. Regarding the equipment and infrastructure,rolling stock, intermodal terminals and standardised loading units are the main issues that3PLP should provide.
On the contrary to these two roles, shippers and 3PLPs do not have the same perceptionwhen it comes to the role of liability guarantor. Therefor this role is presented separately inthe following figure.
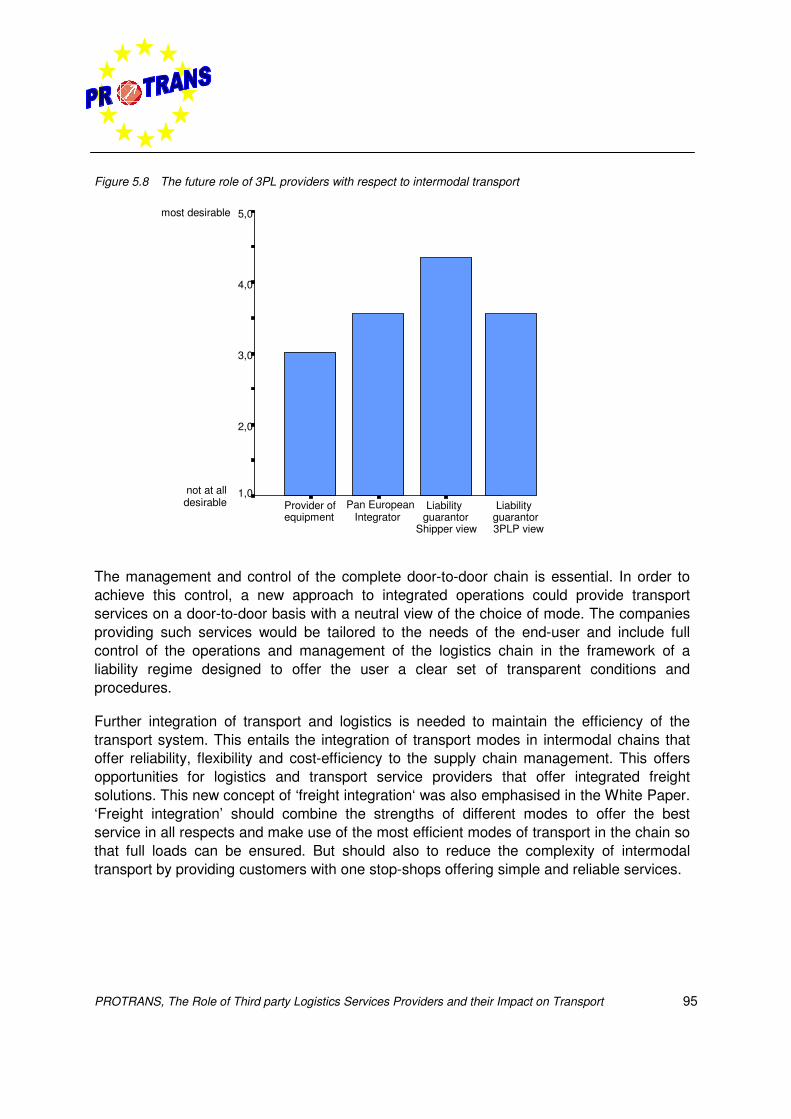
PROTRANS, The Role of Third party Logistics Services Providers and their Impact on Transport 95
Figure 5.8 The future role of 3PL providers with respect to intermodal transport
The management and control of the complete door-to-door chain is essential. In order toachieve this control, a new approach to integrated operations could provide transportservices on a door-to-door basis with a neutral view of the choice of mode. The companiesproviding such services would be tailored to the needs of the end-user and include fullcontrol of the operations and management of the logistics chain in the framework of aliability regime designed to offer the user a clear set of transparent conditions andprocedures.
Further integration of transport and logistics is needed to maintain the efficiency of thetransport system. This entails the integration of transport modes in intermodal chains thatoffer reliability, flexibility and cost-efficiency to the supply chain management. This offersopportunities for logistics and transport service providers that offer integrated freightsolutions. This new concept of ‘freight integration‘ was also emphasised in the White Paper.‘Freight integration’ should combine the strengths of different modes to offer the bestservice in all respects and make use of the most efficient modes of transport in the chain sothat full loads can be ensured. But should also to reduce the complexity of intermodaltransport by providing customers with one stop-shops offering simple and reliable services.
5,0
4,0
3,0
2,0
1,0Liability
guarantorShipper view
Pan EuropeanIntegrator
Provider ofequipment
not at alldesirable
most desirable
Liabilityguarantor3PLP view
PROTRANS, The Role of Third party Logistics Services Providers and their Impact on Transport96
External aspects of IMT
Besides the internals aspects that can foster the use of IMT, there can also be externalelements identified, which can have a positive or negative impact on the market share ofIMT. These external aspects are related to different regulatory measures. The mainmeasures that can be taken and some associated applications are summarised in table 5.3.
Table 5.3 Regulatory measures to foster intermodal transport
Measures ApplicationsMarket regulations Open competitionTransport regulations Transport of hazardous goods
Loading capacityTaxation Fuels
Transport equipmentEnvironmental regulations Emissions
Use of energyLabour issues Driving bans
Working conditionsTechnical regulations Infrastructure
In order to gain insight in the impact of these regulatory measures shippers and 3PLPswere asked in PROTRANS to share their opinions if these measures foster the use of IMTor not. The following table shows that regulations related to transport, taxation andenvironment have the most positive impact on the use of IMT. Almost 85% of therespondents perceive that environmental regulations on for instance road transport willfoster the use of IMT.
Table 5.4 Impact of National and European laws on the use of intermodal transport
Marketregulations
Transportregulations Taxation
Environmentalregulations Labour issues
Technicalregulations
Negative impact 14.69% 11.74% 9.11% 0.00% 16.67% 15.00%No impact 38.16% 7.89% 22.06% 15.38% 34.17% 44.17%Positive impact 47.15% 80.36% 68.83% 84.62% 49.17% 40.83%
Based on this perceived impact can be concluded that implementation of new regulatorymeasures on these aspect will lead to a modal shift from road to IMT. However this doesnot directly implies that every 3PLP will make this shift. A lot of 3PLP will simply pass on theincreased expenses to their clients. Taken this fact in consideration means thatpolicymakers should not only ‘oppress’ one transport mode without making the alternative
PROTRANS, The Role of Third party Logistics Services Providers and their Impact on Transport 97
one more competitive. In this respect policymakers on National and European level shouldtherefore drive on the ‘internal’ opportunities for IMT, like increasing the liability of IMTthrough stimulation of tracking systems or improve the integrated IMT services by‘facilitating’ the logistics market to realise the role of Pan European integrator.
5.4 Conclusions
In order to promote the role of 3PLPs with regards to further involvement in logisticsmanagement and specifically in the management of IMT understanding of the differentperspectives and concerns of the various stakeholders in logistics and transport systems isrequired. Within logistics and transport systems different levels of decision-making implydifferent issues of interest. Changes in the way logistics are managed and in particulartransport are a matter of designing or redesigning logistics and transport systems. Modalchoice is a strategic decision that is determined at a very early stage of designing a newtransport system.
The degree of success in designing or redesigning logistics and transport systems largelydepends on the shipper-3PLP relationship and the ability to overcome the barriers inlogistics and IMT and to effectuate the opportunities in the logistics market.
Barriers for further outsourcing and IMT
3PLPs play a crucial part in the supply chain in general and in the provision of logistics andIMT services in specific. In order to realise more efficient logistics operations, furtheroutsourcing of logistics and improvement of IMT the following barriers should be razed tothe ground:
• A perceived shortage of qualified personnel and the somewhat resulting deficiency inconceptual thinking at 3PLPs.
• Discrepancy in perception between shippers and 3PLPs of lack of proactive andentrepreneurial behaviour of 3PLPs.
• Lack of integrated Pan European IMT service offerings. A 3PLPs is believed to suitableto fulfil the role of integrator if provided with advanced IT systems and IMT capabilities.
• IMT is not fitted to logistics systems, because IMT is having problems to meet the moreand more stringent delivery time windows and the on-time delivery requirements. The
PROTRANS, The Role of Third party Logistics Services Providers and their Impact on Transport98
fact that 3PLPs currently have insufficient IMT skills in the design, implementation andoperation phase of IMT, makes it even more difficult to turn this tide.
• Lack of single liability of IMT according to the shippers, because of changes in laws andregulations on IMT and different actors involved in IMT.
Opportunities for 3PLPs
In general the use of 3PLPs, especially in case of solution providers, has resulted in positiveeffects on the logistics systems and there are several opportunities for 3PLPs to realisefurther improvements. The main opportunities are:
• More proactive behaviour of 3PLPs in the optimisation of transport systems and furtherintegration of different transport modes. The solution providers can be seen as anexample since they show their capabilities in the strategic and tactical design of logisticssystems and are able to subcontract the daily operations to preferred subcontractors.
• Increase involvement of 3PLPs in the design phases of logistics systems.• Sustainable logistics by 3PLPs via consolidation of goods, mode selection, and carrier
selection. 3PLPs presently mainly contribute to the consolidation and to themanagement of the carriers in the IMT.
• 3PLPs are seen as potential facilitators of intermodal transport who will remove existingbarriers and hence make IMT more attractive. Potential future roles for 3PLPs are to actas Pan-European integrators and liability guarantors.
• Implementation of new regulatory measures on e.g. transport, taxation and environmentwill lead to an increased use of IMT. Since it is likely that 3PLP will pass on theincreased expenses to their clients, policymakers should not restrict road transportwithout providing an alternative mode.
PROTRANS, The Role of Third party Logistics Services Providers and their Impact on Transport 99
Chapter 6 The potential for a modal shift
6.1 Introduction
Intermodal transport has become an important part of both national and European transportpolicies, especially from a sustainability point of view. Although there is a generalunderstanding that IMT could have a beneficial impact on the environment and oncongestion, a number of barriers prevent the implementation of IMT on a broad scale, asdescribed in the previous chapter.
In order to depict this potential growth of IMT, the existing and emerging marketopportunities for 3PLPs in IMT have are determined and described in the followingparagraphs. Furthermore the value of intermodal transport services offered by 3PLPs fromthe shippers’ point of view have to be analysed. But also scenarios for the possible impactsof 3PLPs on intermodal transport are built and elaborated. Insight in this impact provides3PLPs and shippers with input for their strategic decisions towards intermodal transport.
This chapter also describes the evaluation of these possible scenarios. The outcome of thisevaluation can be used for policy recommendations to the European Commission andnational governments.
6.2 Value of the services offered by 3PLPs
To analyse the value of the provided 3PLPs services a survey and a simulation model, theIntermodal Perception Index (IPI), was used for respectively data gathering andcomputation of the potential market share of IMT. In this paragraph the scope of the surveyand the concept of the simulation model is explained.
PROTRANS, The Role of Third party Logistics Services Providers and their Impact on Transport100
Scope of survey
In the PROTRANS project the value of the services offered by 3PLPs from the shippers’point of view is assessed through a Stated Preference survey, aiming to provide insight inthe factors that influence shippers’ behaviour and choices. The Stated Preference surveyconsist in 16 trade-offs between two alternatives (road-rail IMT and road transport)characterised by the following variables:
• distance (km);• transit time (hours);• door-to-door transport price (EURO/trailer equivalent);• percentage delayed shipment, considering that a shipment is late if it arrives at
destination 3 hours after the expected arrival time (the chosen indicator for reliability);• tracking information delay (hours);• frequency (number of arrivals per week).
In addition, the presence or absence of an intermodal terminal at the transport origin anddestination site is also considered and referred to as terminal proximity. Annexe 10 providesa more excessive description of the above-mentioned variables.
The required data for the survey was collected via interviews is related to transport of full-loads of non-hazardous and non-refrigerated goods. Furthermore different segments weredefined in order to gain insight in differences between the following corridors, sectors andintermodal modes:
5 geographical corridors: Rotterdam-Vienna, Rotterdam-Basel, Antwerp-Milano, Antwerp-Bilbao, Lyon-Antwerp
4 industrial sectors: Automotive & Machineries, Chemicals, Fast Moving ConsumerGoods (FMCG, including electronics and foods), Steel
3 intermodal modes: Inland Waterways, Rail, Short Sea Shipping
Intermodal Perception Index
The Intermodal Perception Index (IPI) is an indicator of the potential market share of freightintermodal transport that:
• represents the value that European shippers attribute to the intermodal transportalternative with regard to the road transport alternative;
• foresees the shippers’ transport choices whether prices and services are modified;• foresees the consequences of these choices on the intermodal transport market share.
PROTRANS, The Role of Third party Logistics Services Providers and their Impact on Transport 101
The IP is calculated as the ratio of the potential market share of intermodal transport (thatcan be reached by the application of a specific scenario) to the current market share ofintermodal transport.
Potential market share of Intermodal Transport IPI =
Current market share of Intermodal Transport
The index is calculated with software, which comes under the form of an EXCEL worksheet.Values for the action parameters that characterise a strategy to be assessed are defined onan input data screen. Simulation results are provided on a result screen. An example of theinput and output screen is provided in annexe 11.
Results of the Stated Preference survey
Utility functions for IMT and for road transport were calculated and analysed with statisticaltests. Results led to robust utility functions, which provide information relative to the weightthat shippers give to each variable in their modal choice. Two types of variables areincluded in the utility functions: variables to which a specific value is given (e.g. price, transittime) and ‘yes/no’ variables (e.g. presence of an IMT terminal near the origin anddestination sites, referred to below as terminal proximity).
Figure 6.1 represents the utilities (positive values) and disutilities4 (negative values) for theuse of IMT associated to variations of each variable in a hypothetical example. The barsrepresent gains and losses in terms of units of utility. For example, if door-to-door transferprice is increased from €950 to €1050 and all other variables being constant, total utility forIMT is reduced by 0.5 units. It can be deduced from this that one utility unit is worth €200.
On the other hand, if transit time is reduced from 48 hours to 44 hours (all other variablesremaining equal), total utility for IMT is increased by 0,10 units. If, in addition, trackinginformation delay is reduced from 18 hours to 6 hours, the cumulative effect of bothmeasures is an increase in utility of 0,45 units (0.10 +0.35). Reducing the percentage ofdelayed shipment from 15% to 5% leads to an increase in IMT utility of 0.08 units. Thesame effect can be reached by a decrease in door-to-door transfer price of €16 per trailerequivalent.
Besides the utility and disutilities depicts figure 6.1 error bars, which represent the 95%confidence intervals for each variable.
4 Disutility is dis-satisfaction resulting from the consumption of a product or service. The presence of disutility
reduces the total utility of the consumer.
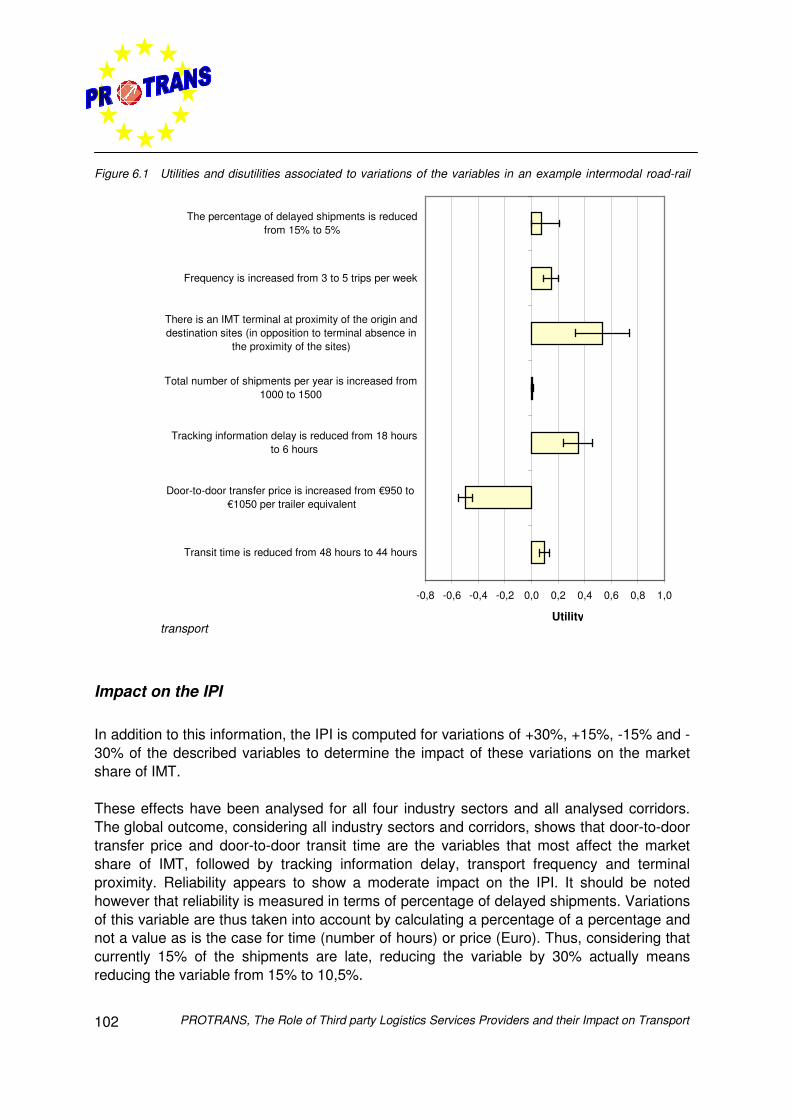
PROTRANS, The Role of Third party Logistics Services Providers and their Impact on Transport102
Figure 6.1 Utilities and disutilities associated to variations of the variables in an example intermodal road-rail
transport
Impact on the IPI
In addition to this information, the IPI is computed for variations of +30%, +15%, -15% and -30% of the described variables to determine the impact of these variations on the marketshare of IMT.
These effects have been analysed for all four industry sectors and all analysed corridors.The global outcome, considering all industry sectors and corridors, shows that door-to-doortransfer price and door-to-door transit time are the variables that most affect the marketshare of IMT, followed by tracking information delay, transport frequency and terminalproximity. Reliability appears to show a moderate impact on the IPI. It should be notedhowever that reliability is measured in terms of percentage of delayed shipments. Variationsof this variable are thus taken into account by calculating a percentage of a percentage andnot a value as is the case for time (number of hours) or price (Euro). Thus, considering thatcurrently 15% of the shipments are late, reducing the variable by 30% actually meansreducing the variable from 15% to 10,5%.
-0,8 -0,6 -0,4 -0,2 0,0 0,2 0,4 0,6 0,8 1,0
Transit time is reduced from 48 hours to 44 hours
Door-to-door transfer price is increased from €950 to €1050 per trailer equivalent
Tracking information delay is reduced from 18 hoursto 6 hours
Total number of shipments per year is increased from1000 to 1500
There is an IMT terminal at proximity of the origin anddestination sites (in opposition to terminal absence in
the proximity of the sites)
Frequency is increased from 3 to 5 trips per week
The percentage of delayed shipments is reducedfrom 15% to 5%
Utility
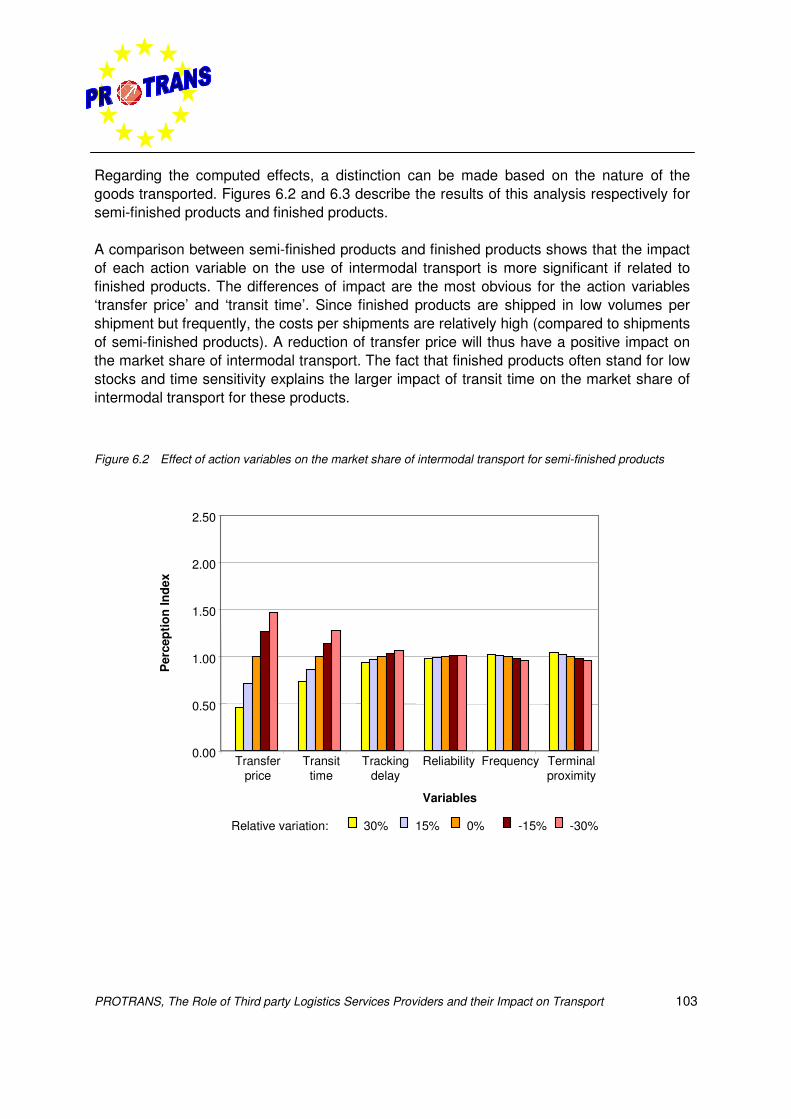
PROTRANS, The Role of Third party Logistics Services Providers and their Impact on Transport 103
Regarding the computed effects, a distinction can be made based on the nature of thegoods transported. Figures 6.2 and 6.3 describe the results of this analysis respectively forsemi-finished products and finished products.
A comparison between semi-finished products and finished products shows that the impactof each action variable on the use of intermodal transport is more significant if related tofinished products. The differences of impact are the most obvious for the action variables‘transfer price’ and ‘transit time’. Since finished products are shipped in low volumes pershipment but frequently, the costs per shipments are relatively high (compared to shipmentsof semi-finished products). A reduction of transfer price will thus have a positive impact onthe market share of intermodal transport. The fact that finished products often stand for lowstocks and time sensitivity explains the larger impact of transit time on the market share ofintermodal transport for these products.
Figure 6.2 Effect of action variables on the market share of intermodal transport for semi-finished products
0.00
0.50
1.00
1.50
2.00
2.50
Transferprice
Transittime
Trackingdelay
Reliability Frequency Terminalproximity
Variables
Per
cept
ion
Inde
x
Relative variation: 30% 15% 0% -15% -30%
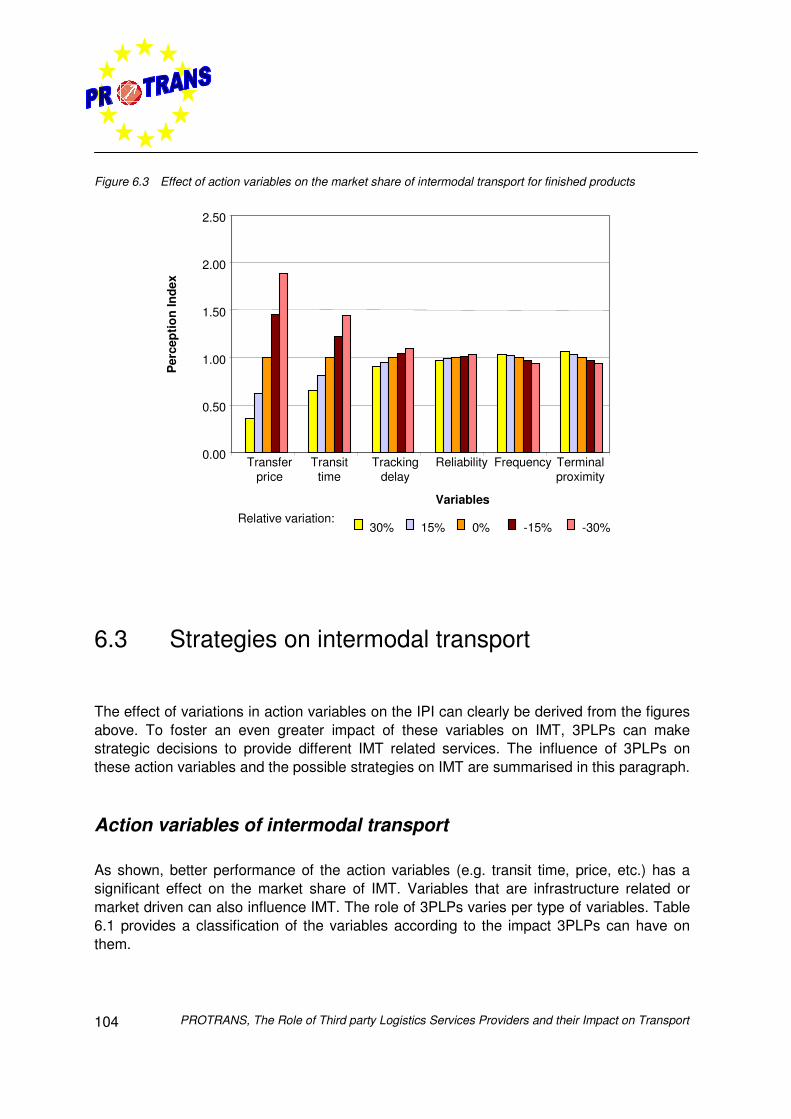
PROTRANS, The Role of Third party Logistics Services Providers and their Impact on Transport104
Figure 6.3 Effect of action variables on the market share of intermodal transport for finished products
6.3 Strategies on intermodal transport
The effect of variations in action variables on the IPI can clearly be derived from the figuresabove. To foster an even greater impact of these variables on IMT, 3PLPs can makestrategic decisions to provide different IMT related services. The influence of 3PLPs onthese action variables and the possible strategies on IMT are summarised in this paragraph.
Action variables of intermodal transport
As shown, better performance of the action variables (e.g. transit time, price, etc.) has asignificant effect on the market share of IMT. Variables that are infrastructure related ormarket driven can also influence IMT. The role of 3PLPs varies per type of variables. Table6.1 provides a classification of the variables according to the impact 3PLPs can have onthem.
0.00
0.50
1.00
1.50
2.00
2.50
Transferprice
Transittime
Trackingdelay
Reliability Frequency Terminalproximity
Variables
Per
cept
ion
Inde
x
Relative variation: 30% 15% 0% -15% -30%
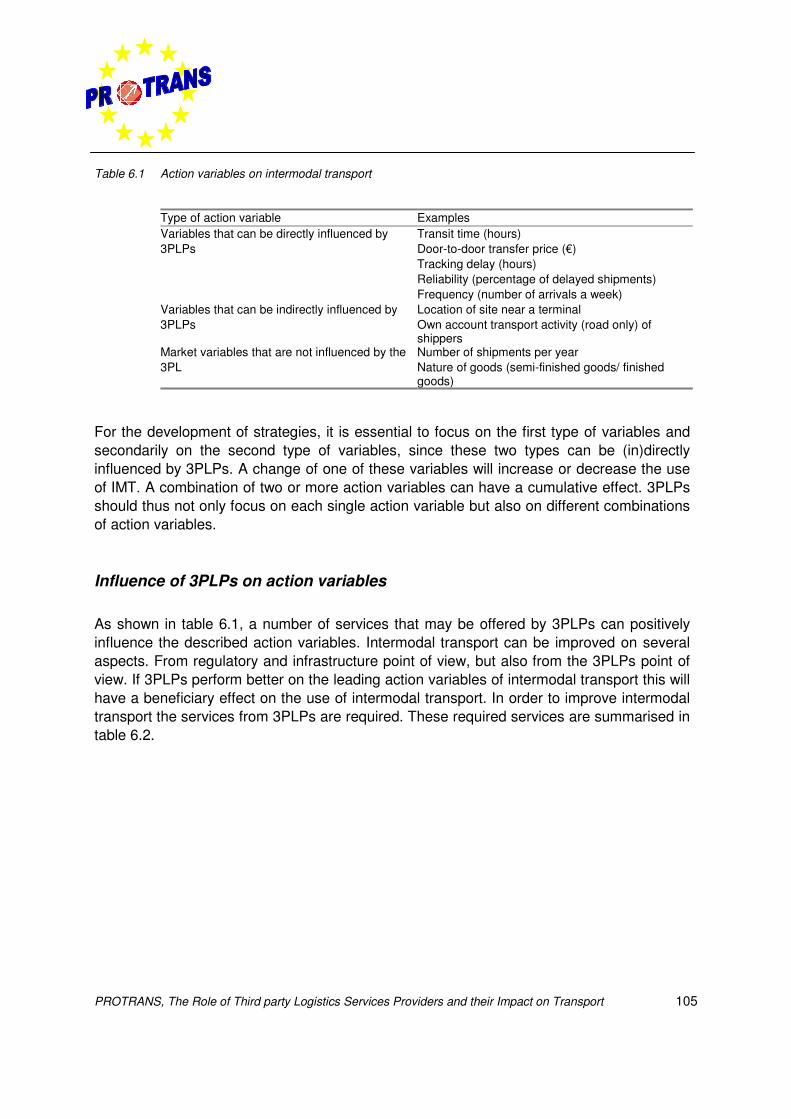
PROTRANS, The Role of Third party Logistics Services Providers and their Impact on Transport 105
Table 6.1 Action variables on intermodal transport
Type of action variable ExamplesVariables that can be directly influenced by3PLPs
Transit time (hours)Door-to-door transfer price (€)Tracking delay (hours)Reliability (percentage of delayed shipments)Frequency (number of arrivals a week)
Variables that can be indirectly influenced by3PLPs
Location of site near a terminalOwn account transport activity (road only) ofshippers
Market variables that are not influenced by the3PL
Number of shipments per yearNature of goods (semi-finished goods/ finishedgoods)
For the development of strategies, it is essential to focus on the first type of variables andsecondarily on the second type of variables, since these two types can be (in)directlyinfluenced by 3PLPs. A change of one of these variables will increase or decrease the useof IMT. A combination of two or more action variables can have a cumulative effect. 3PLPsshould thus not only focus on each single action variable but also on different combinationsof action variables.
Influence of 3PLPs on action variables
As shown in table 6.1, a number of services that may be offered by 3PLPs can positivelyinfluence the described action variables. Intermodal transport can be improved on severalaspects. From regulatory and infrastructure point of view, but also from the 3PLPs point ofview. If 3PLPs perform better on the leading action variables of intermodal transport this willhave a beneficiary effect on the use of intermodal transport. In order to improve intermodaltransport the services from 3PLPs are required. These required services are summarised intable 6.2.
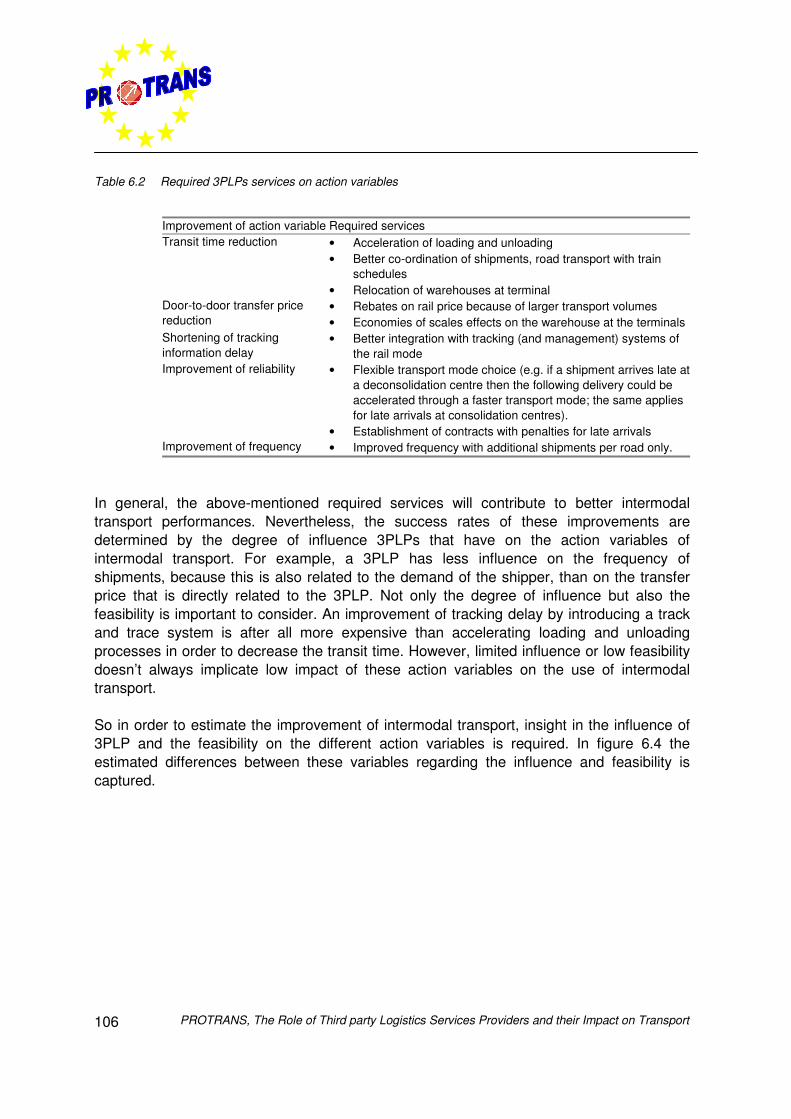
PROTRANS, The Role of Third party Logistics Services Providers and their Impact on Transport106
Table 6.2 Required 3PLPs services on action variables
Improvement of action variable Required servicesTransit time reduction • Acceleration of loading and unloading
• Better co-ordination of shipments, road transport with trainschedules
• Relocation of warehouses at terminalDoor-to-door transfer pricereduction
• Rebates on rail price because of larger transport volumes• Economies of scales effects on the warehouse at the terminals
Shortening of trackinginformation delay
• Better integration with tracking (and management) systems ofthe rail mode
Improvement of reliability • Flexible transport mode choice (e.g. if a shipment arrives late ata deconsolidation centre then the following delivery could beaccelerated through a faster transport mode; the same appliesfor late arrivals at consolidation centres).
• Establishment of contracts with penalties for late arrivalsImprovement of frequency • Improved frequency with additional shipments per road only.
In general, the above-mentioned required services will contribute to better intermodaltransport performances. Nevertheless, the success rates of these improvements aredetermined by the degree of influence 3PLPs that have on the action variables ofintermodal transport. For example, a 3PLP has less influence on the frequency ofshipments, because this is also related to the demand of the shipper, than on the transferprice that is directly related to the 3PLP. Not only the degree of influence but also thefeasibility is important to consider. An improvement of tracking delay by introducing a trackand trace system is after all more expensive than accelerating loading and unloadingprocesses in order to decrease the transit time. However, limited influence or low feasibilitydoesn’t always implicate low impact of these action variables on the use of intermodaltransport.
So in order to estimate the improvement of intermodal transport, insight in the influence of3PLP and the feasibility on the different action variables is required. In figure 6.4 theestimated differences between these variables regarding the influence and feasibility iscaptured.
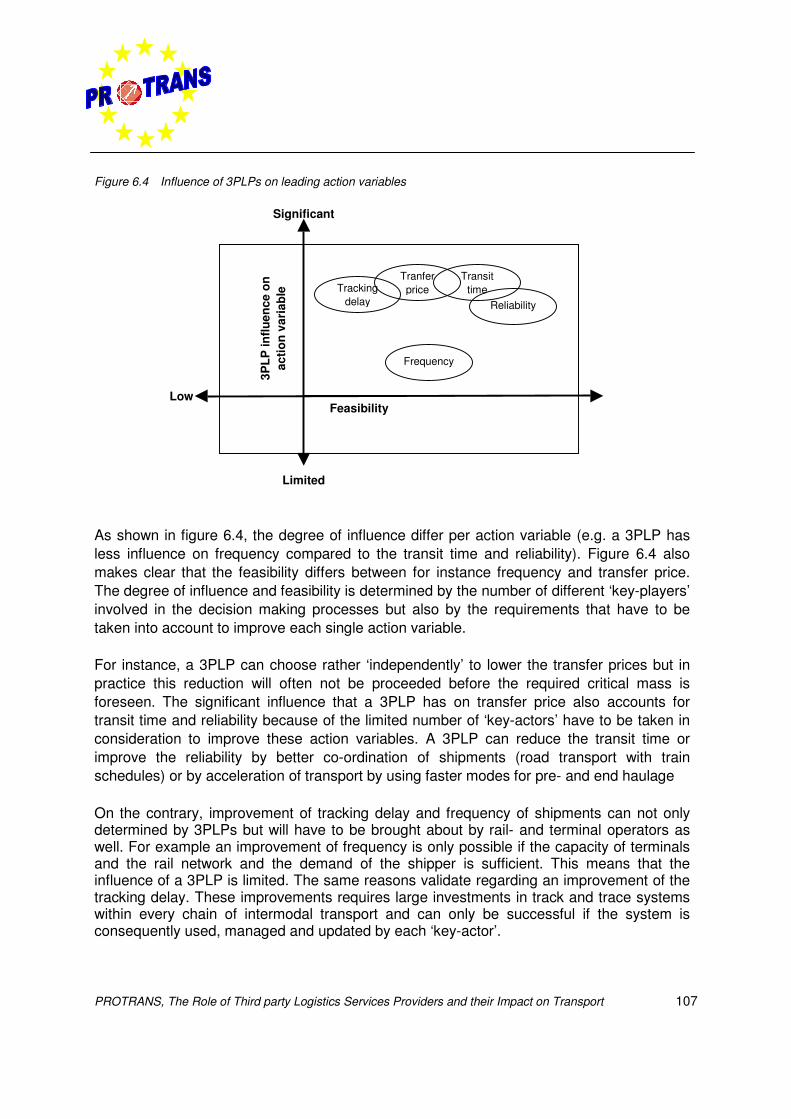
PROTRANS, The Role of Third party Logistics Services Providers and their Impact on Transport 107
Figure 6.4 Influence of 3PLPs on leading action variables
As shown in figure 6.4, the degree of influence differ per action variable (e.g. a 3PLP hasless influence on frequency compared to the transit time and reliability). Figure 6.4 alsomakes clear that the feasibility differs between for instance frequency and transfer price.The degree of influence and feasibility is determined by the number of different ‘key-players’involved in the decision making processes but also by the requirements that have to betaken into account to improve each single action variable.
For instance, a 3PLP can choose rather ‘independently’ to lower the transfer prices but inpractice this reduction will often not be proceeded before the required critical mass isforeseen. The significant influence that a 3PLP has on transfer price also accounts fortransit time and reliability because of the limited number of ‘key-actors’ have to be taken inconsideration to improve these action variables. A 3PLP can reduce the transit time orimprove the reliability by better co-ordination of shipments (road transport with trainschedules) or by acceleration of transport by using faster modes for pre- and end haulage
On the contrary, improvement of tracking delay and frequency of shipments can not onlydetermined by 3PLPs but will have to be brought about by rail- and terminal operators aswell. For example an improvement of frequency is only possible if the capacity of terminalsand the rail network and the demand of the shipper is sufficient. This means that theinfluence of a 3PLP is limited. The same reasons validate regarding an improvement of thetracking delay. These improvements requires large investments in track and trace systemswithin every chain of intermodal transport and can only be successful if the system isconsequently used, managed and updated by each ‘key-actor’.
Significant
Limited
Transittime
TranferpriceTracking
delay Reliability
Frequency
Feasibility
3PLP
influ
ence
on
actio
n va
riab
le
Low
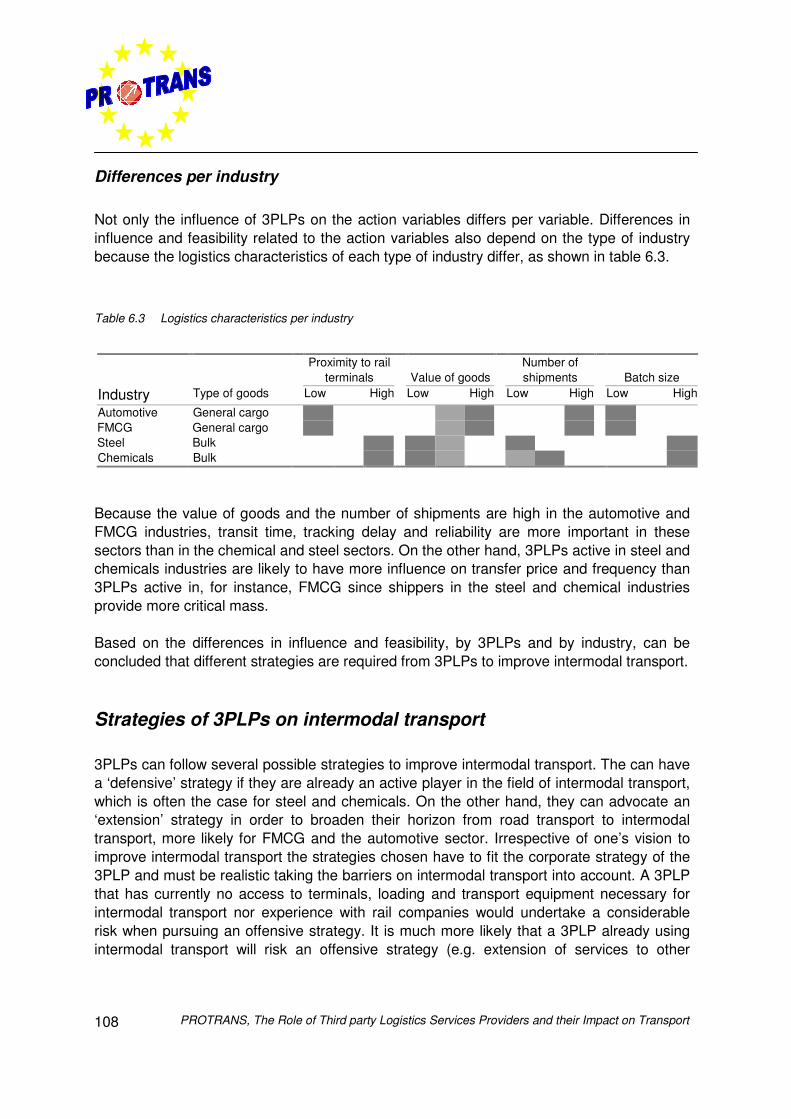
PROTRANS, The Role of Third party Logistics Services Providers and their Impact on Transport108
Differences per industry
Not only the influence of 3PLPs on the action variables differs per variable. Differences ininfluence and feasibility related to the action variables also depend on the type of industrybecause the logistics characteristics of each type of industry differ, as shown in table 6.3.
Table 6.3 Logistics characteristics per industry
Proximity to railterminals Value of goods
Number ofshipments Batch size
Industry Type of goods Low High Low High Low High Low High
Automotive General cargoFMCG General cargoSteel BulkChemicals Bulk
Because the value of goods and the number of shipments are high in the automotive andFMCG industries, transit time, tracking delay and reliability are more important in thesesectors than in the chemical and steel sectors. On the other hand, 3PLPs active in steel andchemicals industries are likely to have more influence on transfer price and frequency than3PLPs active in, for instance, FMCG since shippers in the steel and chemical industriesprovide more critical mass.
Based on the differences in influence and feasibility, by 3PLPs and by industry, can beconcluded that different strategies are required from 3PLPs to improve intermodal transport.
Strategies of 3PLPs on intermodal transport
3PLPs can follow several possible strategies to improve intermodal transport. The can havea ‘defensive’ strategy if they are already an active player in the field of intermodal transport,which is often the case for steel and chemicals. On the other hand, they can advocate an‘extension’ strategy in order to broaden their horizon from road transport to intermodaltransport, more likely for FMCG and the automotive sector. Irrespective of one’s vision toimprove intermodal transport the strategies chosen have to fit the corporate strategy of the3PLP and must be realistic taking the barriers on intermodal transport into account. A 3PLPthat has currently no access to terminals, loading and transport equipment necessary forintermodal transport nor experience with rail companies would undertake a considerablerisk when pursuing an offensive strategy. It is much more likely that a 3PLP already usingintermodal transport will risk an offensive strategy (e.g. extension of services to other
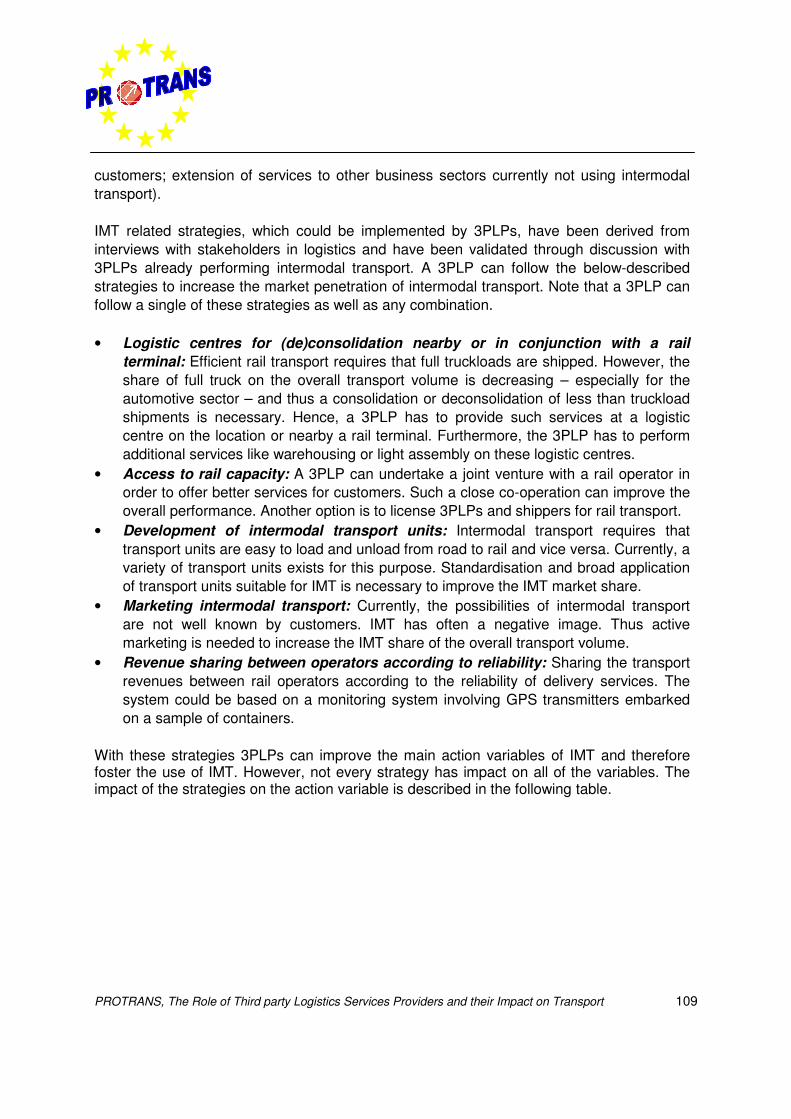
PROTRANS, The Role of Third party Logistics Services Providers and their Impact on Transport 109
customers; extension of services to other business sectors currently not using intermodaltransport).
IMT related strategies, which could be implemented by 3PLPs, have been derived frominterviews with stakeholders in logistics and have been validated through discussion with3PLPs already performing intermodal transport. A 3PLP can follow the below-describedstrategies to increase the market penetration of intermodal transport. Note that a 3PLP canfollow a single of these strategies as well as any combination.
• Logistic centres for (de)consolidation nearby or in conjunction with a railterminal: Efficient rail transport requires that full truckloads are shipped. However, theshare of full truck on the overall transport volume is decreasing – especially for theautomotive sector – and thus a consolidation or deconsolidation of less than truckloadshipments is necessary. Hence, a 3PLP has to provide such services at a logisticcentre on the location or nearby a rail terminal. Furthermore, the 3PLP has to performadditional services like warehousing or light assembly on these logistic centres.
• Access to rail capacity: A 3PLP can undertake a joint venture with a rail operator inorder to offer better services for customers. Such a close co-operation can improve theoverall performance. Another option is to license 3PLPs and shippers for rail transport.
• Development of intermodal transport units: Intermodal transport requires thattransport units are easy to load and unload from road to rail and vice versa. Currently, avariety of transport units exists for this purpose. Standardisation and broad applicationof transport units suitable for IMT is necessary to improve the IMT market share.
• Marketing intermodal transport: Currently, the possibilities of intermodal transportare not well known by customers. IMT has often a negative image. Thus activemarketing is needed to increase the IMT share of the overall transport volume.
• Revenue sharing between operators according to reliability: Sharing the transportrevenues between rail operators according to the reliability of delivery services. Thesystem could be based on a monitoring system involving GPS transmitters embarkedon a sample of containers.
With these strategies 3PLPs can improve the main action variables of IMT and thereforefoster the use of IMT. However, not every strategy has impact on all of the variables. Theimpact of the strategies on the action variable is described in the following table.
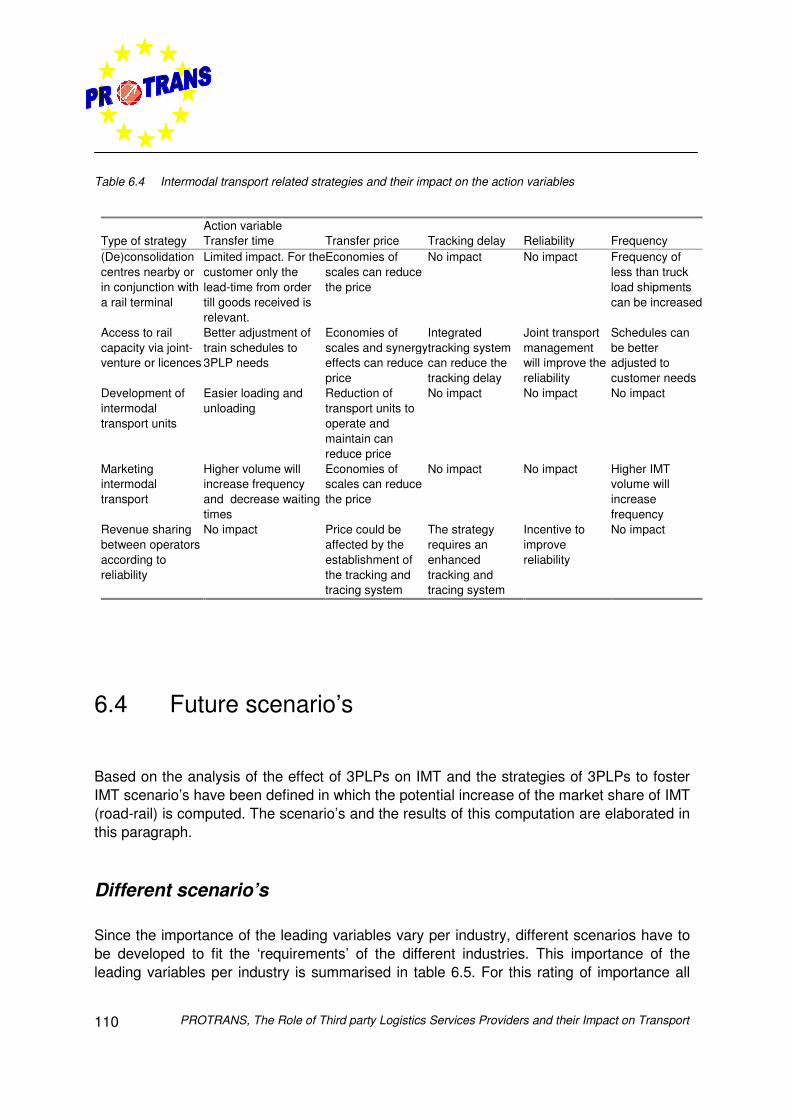
PROTRANS, The Role of Third party Logistics Services Providers and their Impact on Transport110
Table 6.4 Intermodal transport related strategies and their impact on the action variables
Action variableType of strategy Transfer time Transfer price Tracking delay Reliability Frequency(De)consolidationcentres nearby orin conjunction witha rail terminal
Limited impact. For thecustomer only thelead-time from ordertill goods received isrelevant.
Economies ofscales can reducethe price
No impact No impact Frequency ofless than truckload shipmentscan be increased
Access to railcapacity via joint-venture or licences
Better adjustment oftrain schedules to3PLP needs
Economies ofscales and synergyeffects can reduceprice
Integratedtracking systemcan reduce thetracking delay
Joint transportmanagementwill improve thereliability
Schedules canbe betteradjusted tocustomer needs
Development ofintermodaltransport units
Easier loading andunloading
Reduction oftransport units tooperate andmaintain canreduce price
No impact No impact No impact
Marketingintermodaltransport
Higher volume willincrease frequencyand decrease waitingtimes
Economies ofscales can reducethe price
No impact No impact Higher IMTvolume willincreasefrequency
Revenue sharingbetween operatorsaccording toreliability
No impact Price could beaffected by theestablishment ofthe tracking andtracing system
The strategyrequires anenhancedtracking andtracing system
Incentive toimprovereliability
No impact
6.4 Future scenario’s
Based on the analysis of the effect of 3PLPs on IMT and the strategies of 3PLPs to fosterIMT scenario’s have been defined in which the potential increase of the market share of IMT(road-rail) is computed. The scenario’s and the results of this computation are elaborated inthis paragraph.
Different scenario’s
Since the importance of the leading variables vary per industry, different scenarios have tobe developed to fit the ‘requirements’ of the different industries. This importance of theleading variables per industry is summarised in table 6.5. For this rating of importance all
PROTRANS, The Role of Third party Logistics Services Providers and their Impact on Transport 111
types of shipments (Full Truckload and Less than Truckload) and all type of transportmodes have been taken into consideration. From this table can be derived that the focus inthe automotive industry lies on the variables transit time, tracking delay, reliability andfrequency. This also accounts for the industry Fast Moving Consumer Goods (FMCG).Whereas the steel and chemicals industries are more focused on the transfer price sincethe impact of this variable is significant because of the ‘bulk’ volumes, which are transportedin these industries.
Table 6.5 Importance of the leading action variables per industry
Automotive FMCG SteelChemicals (non
hazardous)Transit Time +++ +++ - -Transfer Price ++ ++ +++ +++Tracking Delay +++ ++ + +Reliability1) +++ +++ ++ ++Frequency +++ ++ + +
1) Note: This factor corresponds to the percentage of delayed shipments
--- completely irrelevant-- not important- less important+ important++ very important+++ essential
Based on the differences in importance of the action variables two scenario’s are developedin the PROTRANS project. One scenario for fast moving high valued goods (referring toautomotive and FMCG) and a second scenario for slow moving low valued goods (referringto steel and chemicals). For each scenario, an estimation of the feasible variations of eachleading action variable was carried out considering a worst case, an average case and abest case situation:
• The values for the worst case have been taken from the 3PLPs’ estimation, which isdescribed in figure 4.11, of how they can currently improve the respective actionvariables.
• The value for the average case corresponds to the estimation of the 3PLPs on the futureperspective described in this same figure.
• The best case value is derived from expert judgement taken into account all feasiblemeasurements taken in the above-described strategies improving the action variable.
The results of the estimations of the feasible variations are depicted in the following table.For example, regarding scenario 1, 3PLPs are currently able to decrease transit time by
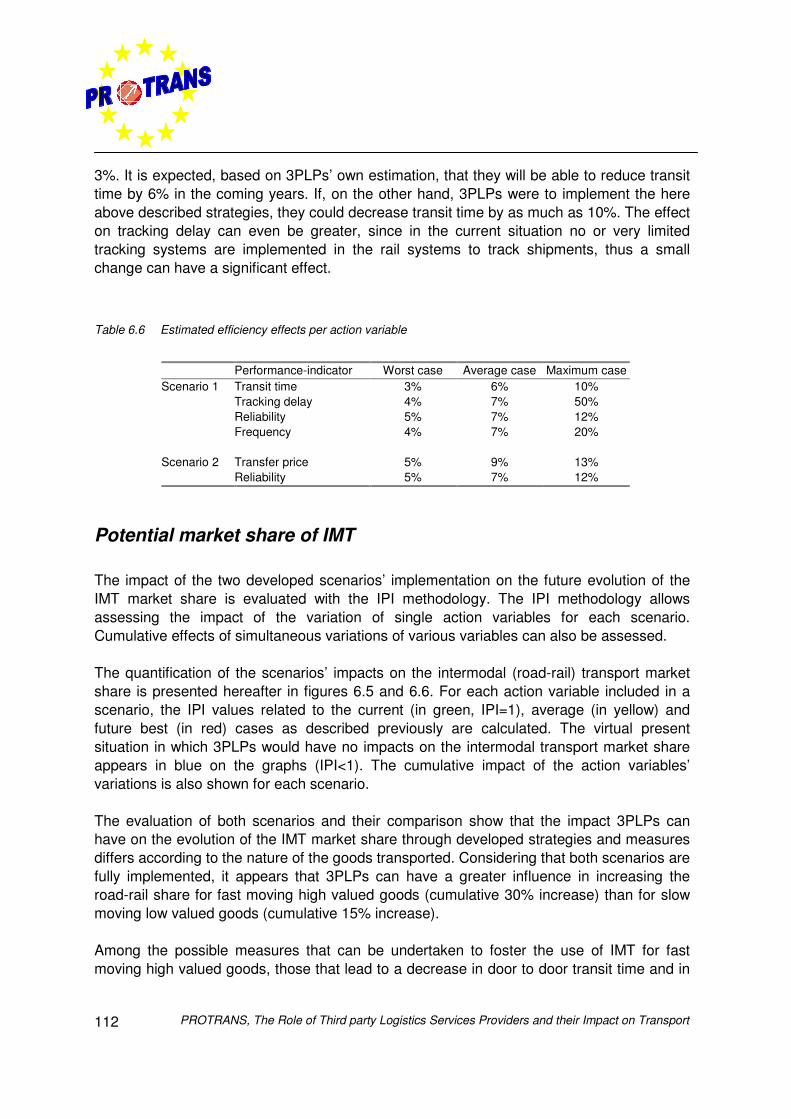
PROTRANS, The Role of Third party Logistics Services Providers and their Impact on Transport112
3%. It is expected, based on 3PLPs’ own estimation, that they will be able to reduce transittime by 6% in the coming years. If, on the other hand, 3PLPs were to implement the hereabove described strategies, they could decrease transit time by as much as 10%. The effecton tracking delay can even be greater, since in the current situation no or very limitedtracking systems are implemented in the rail systems to track shipments, thus a smallchange can have a significant effect.
Table 6.6 Estimated efficiency effects per action variable
Performance-indicator Worst case Average case Maximum caseScenario 1 Transit time 3% 6% 10%
Tracking delay 4% 7% 50%Reliability 5% 7% 12%Frequency 4% 7% 20%
Scenario 2 Transfer price 5% 9% 13%Reliability 5% 7% 12%
Potential market share of IMT
The impact of the two developed scenarios’ implementation on the future evolution of theIMT market share is evaluated with the IPI methodology. The IPI methodology allowsassessing the impact of the variation of single action variables for each scenario.Cumulative effects of simultaneous variations of various variables can also be assessed.
The quantification of the scenarios’ impacts on the intermodal (road-rail) transport marketshare is presented hereafter in figures 6.5 and 6.6. For each action variable included in ascenario, the IPI values related to the current (in green, IPI=1), average (in yellow) andfuture best (in red) cases as described previously are calculated. The virtual presentsituation in which 3PLPs would have no impacts on the intermodal transport market shareappears in blue on the graphs (IPI<1). The cumulative impact of the action variables’variations is also shown for each scenario.
The evaluation of both scenarios and their comparison show that the impact 3PLPs canhave on the evolution of the IMT market share through developed strategies and measuresdiffers according to the nature of the goods transported. Considering that both scenarios arefully implemented, it appears that 3PLPs can have a greater influence in increasing theroad-rail share for fast moving high valued goods (cumulative 30% increase) than for slowmoving low valued goods (cumulative 15% increase).
Among the possible measures that can be undertaken to foster the use of IMT for fastmoving high valued goods, those that lead to a decrease in door to door transit time and in
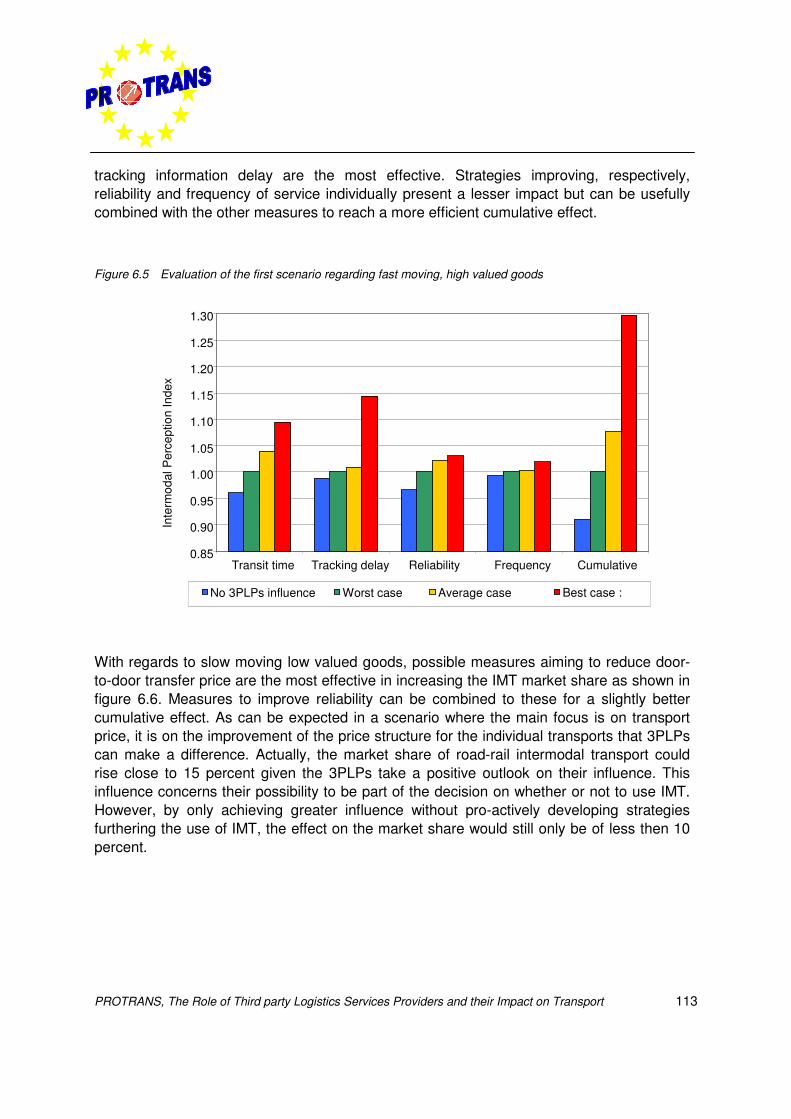
PROTRANS, The Role of Third party Logistics Services Providers and their Impact on Transport 113
tracking information delay are the most effective. Strategies improving, respectively,reliability and frequency of service individually present a lesser impact but can be usefullycombined with the other measures to reach a more efficient cumulative effect.
Figure 6.5 Evaluation of the first scenario regarding fast moving, high valued goods
With regards to slow moving low valued goods, possible measures aiming to reduce door-to-door transfer price are the most effective in increasing the IMT market share as shown infigure 6.6. Measures to improve reliability can be combined to these for a slightly bettercumulative effect. As can be expected in a scenario where the main focus is on transportprice, it is on the improvement of the price structure for the individual transports that 3PLPscan make a difference. Actually, the market share of road-rail intermodal transport couldrise close to 15 percent given the 3PLPs take a positive outlook on their influence. Thisinfluence concerns their possibility to be part of the decision on whether or not to use IMT.However, by only achieving greater influence without pro-actively developing strategiesfurthering the use of IMT, the effect on the market share would still only be of less then 10percent.
0.85
0.90
0.95
1.00
1.05
1.10
1.15
1.20
1.25
1.30
Transit time Tracking delay Reliability Frequency Cumulative
Inte
rmod
al P
erce
ptio
n In
dex
No 3PLPs influence Worst case Average case Best case :
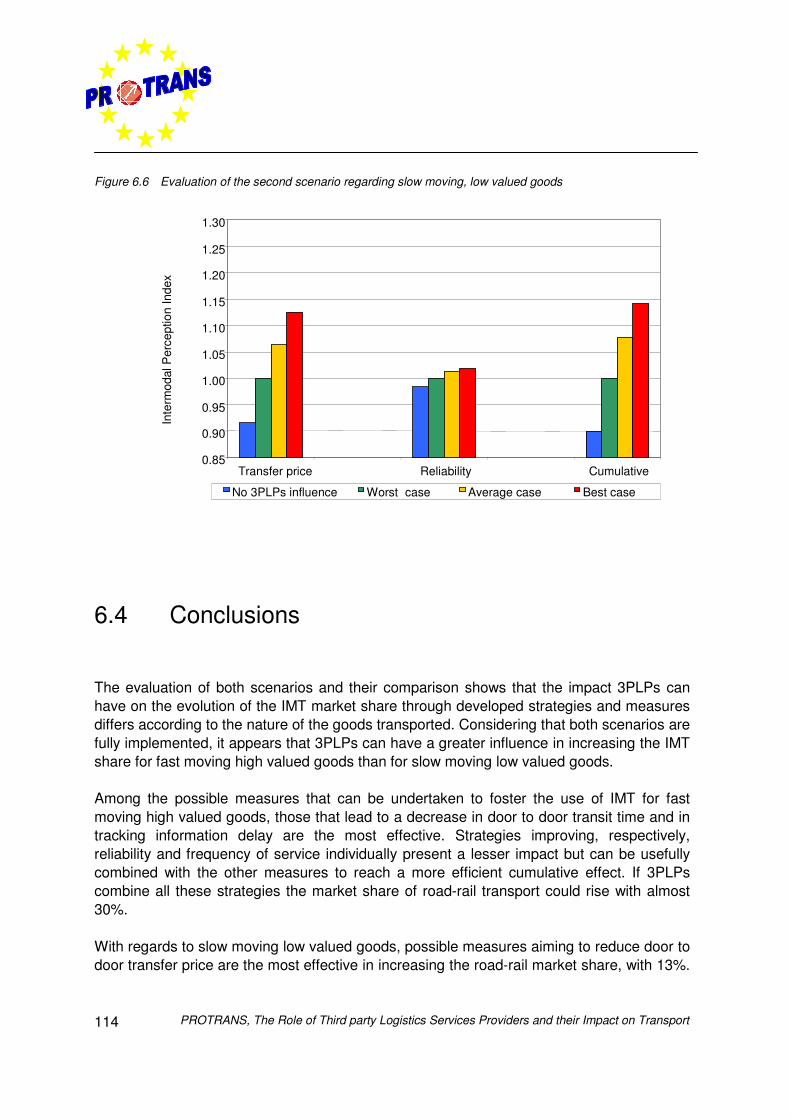
PROTRANS, The Role of Third party Logistics Services Providers and their Impact on Transport114
Figure 6.6 Evaluation of the second scenario regarding slow moving, low valued goods
6.4 Conclusions
The evaluation of both scenarios and their comparison shows that the impact 3PLPs canhave on the evolution of the IMT market share through developed strategies and measuresdiffers according to the nature of the goods transported. Considering that both scenarios arefully implemented, it appears that 3PLPs can have a greater influence in increasing the IMTshare for fast moving high valued goods than for slow moving low valued goods.
Among the possible measures that can be undertaken to foster the use of IMT for fastmoving high valued goods, those that lead to a decrease in door to door transit time and intracking information delay are the most effective. Strategies improving, respectively,reliability and frequency of service individually present a lesser impact but can be usefullycombined with the other measures to reach a more efficient cumulative effect. If 3PLPscombine all these strategies the market share of road-rail transport could rise with almost30%.
With regards to slow moving low valued goods, possible measures aiming to reduce door todoor transfer price are the most effective in increasing the road-rail market share, with 13%.
0.85
0.90
0.95
1.00
1.05
1.10
1.15
1.20
1.25
1.30
Transfer price Reliability Cumulative
Inte
rmod
al P
erce
ptio
n In
dex
No 3PLPs influence Worst case Average case Best case
PROTRANS, The Role of Third party Logistics Services Providers and their Impact on Transport 115
Measures to improve reliability can be combined to these for a slightly better cumulativeeffect of nearly 15% on the market share of road-rail transport.
The policy context is of great importance in allowing for the realisation of these scenarios.Indeed, a number of policies can be developed to assist 3PLPs in their implementation ofthe described measures and initiatives that can be implemented. These recommendedpolicy actions are described in the next chapter.

PROTRANS, The Role of Third party Logistics Services Providers and their Impact on Transport116
PROTRANS, The Role of Third party Logistics Services Providers and their Impact on Transport 117
Chapter 7 Conclusions and recommendationsfor policymakers
7.1 Conclusions on the market position of 3PLP’s
The 3PLP market is a very dynamic one. Mergers, acquisitions and alliances are commonnews in this industry. These market dynamic result in a strong 3PLP base in severalEuropean countries. Countries like Germany, The Netherlands and the United Kingdom canbe considerate as the main countries of the European 3PLP market. Within this market theemphasis lies on the provision of logistics services in the automotive, electronics and foodindustry. Furthermore shows the market analysis that groupage is the transport servicemost offered by 3PLPs, followed by express services and full truckloads.
The dynamics of the 3PLP is also related to the degree of complexity. Whereas activitieslike warehousing, inventory management, forwarding and customs activities are the mostprovided services by 3PLPs a shift to more sophisticated services occurs, because of theincreasing complexity of logistics systems. Increasing customer demands, shorter productlifecycles and changes in the network structure impact 3PLPs’ ability to offer more thesesophisticated services, like warehouse and transport management. Based on the analysisof the services offered by logistics service providers, three different types of providers areidentified with different service offerings:
• solution providers;• distribution providers;• transport providers.
Regarding the different phases of the logistics systems a clear distinction can be madebetween these types of providers. The solution providers can be identified as the mostextensive form of provider since they are most heavily involved in all aspects of the shipperslogistics systems (the level of involvement is 60-90%). Whereas the level of involvement inall types of activities is 40-80% for the distribution providers, with the exception of strategicdesign activities were they are much less involved. Finally the transport providers are theleast involved, with a level of involvement between 20% and 40% in the different type ofactivities
PROTRANS, The Role of Third party Logistics Services Providers and their Impact on Transport118
The low degree involvement in strategic and tactical logistics design decisions of 3PLPsalso impacts the modal choice where the changed demands can act as barrier for the use ofintermodal transport (IMT). The 3PL involvement in IMT is not as developed as theinvolvement in logistics in general and in road transport in particular. The 3PLPs are mostdeeply involved in the implementation phase of IMT and not in the design or operation. Inthis respect 3PLPs can have a role as integrators of IMT systems.
7.2 Conclusions on the regional perspective of 3PL
In order gain insight in the regional perspective of 3PLPs, a sample of logistics regions isanalysed on a European scale. A benchmark has been carried out in order to determine thesuccess and failure factors of these regions.
Based on the analysis and the benchmark can be stated that different types of regions canbe identified: mainports, subports and hinterland regions with an international or regionalfunction. As described above, networks of 3PLPs are emerging. From an infrastructurepoint of view it can be concluded that the transport connections between logistics hubs arecrucial for the development of these logistics networks in a region. Furthermore can beconcluded that integral logistics strategy is vital for regions to improve their logistics profile.It is important that both public and private partners participate in this strategy in order toalign the ‘demands’ of each partner and to make advantage of each other’ knowledge.
Finally the developed analysis model and the benchmark can be used for other purposes.For instance regional policymakers can use it in the development of their logistics strategyin general and on the 3PLP perspective in particular or to analyse the sensitivity of thevarious elements by weighting the elements on a preferred scale. But shippers and 3PLPssearching for ‘strong’ markets or looking for favourable regions to locate new networkfacilities can also use these tools.
PROTRANS, The Role of Third party Logistics Services Providers and their Impact on Transport 119
7.3 Conclusions on the barriers and opportunities
Barriers to develop integrated logistics solutions
The role of logistics is vital in maintaining an efficient and sustainable transport system inEurope now and in the future. To increase the overall efficiency of the system means thatfurther efforts are necessary to integrate existing systems of transport services into logisticssystems designed to ensure the delivery of consignments to end users. This requirescompetence and skills in the design or redesign of logistics solutions and the courage to beinnovative and take the initiative, i.e. a proactive, entrepreneurial approach.
Logistics competence of 3PLPs is generally regarded in all areas as slightly more thanadequate but will according to the estimation of all respondents develop sufficiently in the inthe next five years. Regarding the resources and skills shippers perceived the shortage ofqualified personnel and the somewhat resulting deficiency in conceptual thinking, bothcritical ingredients for the design of new logistics and transport solutions, as potential barrierfor further involvement of 3PLPs.
The second barrier to further 3PL involvement in logistics systems lies in the lack ofproactive and entrepreneurial behaviour of 3PLPs. Innovation and initiative coming from3PLPs is currently regarded as more reactive rather than proactive by shippers although3PLPs see themselves in general more proactive. This discrepancy in perception resemblesprobably the biggest barrier to further outsourcing.
One of the main current barriers to the use of IMT is related to a lack of integrated PanEuropean logistics service offerings. A 3PLP offering integrated Pan-European IMT serviceswill reduce this barrier and there is a general belief that 3PLPs are suitable to take this role.However, this requires providers of a certain size and advanced IT systems and capabilitiesin IMT.
Regarding the use of IMT, ‘not fitting shippers logistics systems’ is regarded as the secondmain barrier to improve IMT. Intermodal transport systems are having problems whendelivery time windows are limited and at the same time the on-time delivery capability isconsidered to be even more important in the future. Thus there is a need for capabilities into design, implement and operate logistics systems, which may incorporate a use of IMT, acapability which most providers lack, though.
The shippers also regard a lack of single liability as a main barrier to the use of IMT. Thehandling of this problem requires partly a certain organisational size of 3PLPs in order to beable to absorb risks. But also requires changes in laws and regulations which currently donot take into account the type of services and liabilities that shippers demand.
PROTRANS, The Role of Third party Logistics Services Providers and their Impact on Transport120
Opportunities for 3PLPs
Further outsourcing of shippers’ logistics systems are expected, since shippers are amongstothers reducing asset intensities and restructuring distribution structures. This outsourcingtrend gives 3PLPs the opportunity to increase their businesses. There are a number ofopportunities for 3PLPs to pro-actively influence the integration of European supply chainstrough further optimisation of transport systems and further developing the integration ofdifferent transport modes.
The main opportunities a related to solution providers, which have delivered better logisticsperformance than transport and distribution providers due to their higher level ofinvolvement in strategic and tactical design of logistics systems. The transport efficiencyhas been improved by 3PLPs primarily by economies of scale and scope since a large sizeis necessary to create the required network and enables 3PLPs to invest in IT and liability.
The solution provider’ level of involvement design of logistics systems also indicates on anopportunities for other types of providers like distribution providers to improve theirinvolvement this phase of the logistics systems. However, it should be taken inconsideration that the ability of transport and distribution providers to migrate to solutionprovision is constrained by their lack of resources and skills.
3PLPs can contribute to the development of efficient IMT at the Pan-European level andthereby ensure sustainable competitiveness and growth in Europe. Actions which 3PLPscan take to reduce the amount of pollutants and other environmental problems may forinstance realisation of (de)consolidation centres to realise more volume by combined LTL-shipments in order to fit to IMT processes. 3PLPs can also ensure sustainability by modeselection and carrier selection. Regarding these aspects the 3PLPs presently mainlycontribute to the consolidation and the management of the carriers.
Furthermore 3PLPs are seen as potential facilitators of IMT who will remove existingbarriers and hence make IMT more attractive. This implies that IMT companies themselveswill accept their role as transport sub-contractors. Potential future roles for 3PLPs are to actas Pan-European integrators and liability guarantors. In line with the role of liabilityguarantor lies an opportunity for 3PLPs to improve the tracking information since this isinsufficiently developed in IMT.
Finally an opportunity for 3PLPs on IMT lies in the fact that implementation of regulatorymeasures on for instance taxation and environmental aspects foster the use of IMT.Although policymakers should take in consideration that restrictions on road transport doesnot automatically leads to a shift to IMT, since 3PLP will probably get back their increasedvia higher transport rates.
PROTRANS, The Role of Third party Logistics Services Providers and their Impact on Transport 121
7.4 Conclusions on the intermodal potential
To determine the existing and emerging market opportunities for 3PLPs in IMT, an analysiswas carried out to identify the conditions, which would optimise the possibilities for a modalshift from road transport to road-rail intermodal transport. From the analysis can be statedthat 3PLPs could indeed undertake a combination of measures to influence the efficiency inIMT. The efficiency performance of IMT can be illustrated by different action variables.
Variations in the values of these variables have significant effects on the market share ofintermodal transport. The analysis of these effects shows that the strongest impacts on themarket share of intermodal transport are price, duration of the trip, tracking and tracingfacilities and reliability. Combined variations of several of these action variables can fosteran even greater demand of intermodal transport.
3PLP strategies on IMT
In order to foster the use of IMT 3PLPs can directly influence the variables price, transit timeand tracking and tracing facilities by developing the following strategies on IMT:
• Logistic centres for (de)consolidation nearby or in conjunction with a rail terminal inwhich smaller shipments can be combined to full truckloads in order to realise enoughmass for IMT and in which IMT shipped goods can be prepared (deconsolidated) fordistribution to the customers via road transport.
• Creating access to rail capacity by undertaking a joint venture with a rail operator or getlicensed for IMT in order to offer better services for customers.
• Development of intermodal transport units to easily load and unload from road to railand vice versa.
• Marketing intermodal transport, since the possibilities of intermodal transport arecurrently not well known by customers
• Revenue sharing between operators according to reliability of delivered services basedon a monitoring system with for instance Global Positioning Systems transmittersembarked on a sample of containers.
Effects on the use of intermodal transport
Results have shown that these possible 3PLP strategies increase the IMT use but that theirimpacts on the IMT market share differ per type of goods, type of industries andgeographical corridors. Therefore two scenario’s have been developed in the PROTRANS
PROTRANS, The Role of Third party Logistics Services Providers and their Impact on Transport122
project both with a different focus on the action variables of IMT. Hence, the scenarioaiming to reduce door-to-door transit time, tracking information delay and to improvereliability seems to be the most efficient in the case of fast moving high valued goods like inthe industries automotive and fast moving consumer goods. Whereas measures in thesecond scenario to reduce door-to-door price and to improve reliability are most efficient inthe case of slow moving low valued goods (steel and chemicals). Comparing these twoscenario’s reveals that the effect on the potential market share of IMT of the first scenario(on transit time and tracking information delay) is twice the effect of the scenario on transferprice, 30% versus 15%.
7.5 Recommendations for policymakers
It is clear that the present competitiveness conditions are not the same across everytransport mode, given the different liberalisation levels. At present, road transport isconsidered to be the most flexible mode of transport, whereas rail transport is considered tobe the less competitive one, with difficult access to activity, different technical andoperational conditions across Europe and many outdated business practices. Intermodalitypresents also some specific barriers, especially linked to the interoperability between modesand to the barriers in information flows.
In order to assure an efficient transport system that is a prerequisite to maintaining theEuropean Union’s competitiveness National and European governments can and shouldtake action towards the market of third-party logistics. From market perspective, but alsofrom regional perspective and regarding the different scenario’s for IMT, these governmentsin co-operation with shippers and 3PLPs can make the difference in improving the logisticssystems and its environmental aspects like emission of greenhouse gases, congestion,accidents and noise. In order to make the difference, actions on policy relevant issues arerequired. These issues and recommendations for policy actions are derived in thisparagraph.
Policy relevant issues
To depict and to recommend policy actions to the policymakers, first the policy relevantissues were identified in the PROTRANS project. Regarding the improvement of thelogistics systems in Europe the following issues are considered to be important:
PROTRANS, The Role of Third party Logistics Services Providers and their Impact on Transport 123
• EU changing transport policy: The European Commission, through the Task Force“Transport Intermodality” has been addressing the crucial aspects of the transportproblem, from the “business as usual” approach to a systems approach. A systemsapproach to transport implies an integrated and simultaneous approach to the maintransport problems, instead of punctual interventions trying to deal with one singleproblem at a time. This implies co-operation and co-ordination between differentDirectorates Generals (DG) of the European Commission, like DG TREN and DGEnterprise.
• The role of third-party logistics providers in the new EU transport policy: The roleof 3PLPs in the new context of the changing EU policy towards transport is crucial.3PLPs are the main actors in the European and world logistics, being able to integrateevery element in the logistics chain. In the context of a modal shift and promotion ofintermodality, 3PLPs are more and more making the decision of which modes oftransport or combinations of modes should be chosen. It should always be borne inmind that the decision-making process towards transport services is market driven andthat the prevailing criteria have an economic basis.
• Analysis of barriers to use IMT: Insight in the barriers to use IMT is also relevant toelaborate the policy recommendations. These barriers have been analysed in thePROTRANS project and are described in paragraph 5.3.
• Key European actions towards the development of intermodal transport: Towardsthe development of intermodal transport the Commission shall take the initiative whereregulatory or legal measures are concerned and where intermodality depends on co-ordination at European level. The key actions towards intermodality develop aroundthree main fields of action: Integrated infrastructure and transport means; interoperableand interconnected operations and mode-independent services and regulations.
Besides the above-mentioned issues, the EU-enlargement and the current economicdownturn should be taken in consideration as well. Since the accession of the candidatecountries to the European Union will influence logistics and transport flows the existingnetworks in these countries should be assessed, in particular to ensure uniformity of thenetwork in the enlarged European Union. 3PLPs can furthermore become important actorsthrough their presence in these countries, the provision of specific services, and assistanceto their clients in entering new markets.
Finally the current economic downturn should be kept in mind also since this downturnmight lead to the postponement of necessary investments by both 3PLPs and operators,which could hold back the described possible developments in IMT.
Based on the policy relevant issues and the current situation in Europe (EU enlargementand economic downturn) can be stated that policy actions on the 3PL market and
PROTRANS, The Role of Third party Logistics Services Providers and their Impact on Transport124
intermodal transport are required. The Commission should take the initiative whereregulatory or legal measures are concerned and where intermodality depends on co-ordination at European level. In this respect the Commission already has set various policyobjectives across the different policy areas, which are convergent in their goals towards thecommunity’s transport policy i.e. the sustainability of the entire transport system. Theseobjectives have been supported by political documents the most important ones being thehere above described Commission’s White and Green Papers and Directives. Thesedocuments constitute the present legal and regulatory framework available for theCommission. The Commission has however certain limitations to its intervention. TheCommission can not go beyond the scope of its competencies: those that collide with thelegislation of the Member States, the rights already acquired by individuals and companiesand the rights acquired by the implementation of the Common Market.
Principles to follow
In the PROTRANS project the role of 3PLPs and their impact on transport on a Europeanlevel is determined. Based on this project can be concluded that their role is becoming moreimportant and changing ‘upwards’ in the supply chain to more sophisticated services ineach phase of the logistics systems including IMT, from operation to design. This implicatesthat they will more and more determine and manage the flows of goods and theaccompanying information flows on a Pan-European or even greater level. To facilitate thisincreasing role of 3PLPs in transport systems and to improve intermodal transport,European policymakers should take action in the next few years. These actions should bebased on the following common principles:
• Logistics integration: Integration of logistics systems provides the opportunity tooptimise the intermodal chain management (e.g. integrated information flows thatenable collaborative planning, costing and execution of transport flows). But it alsoenables to inform the shipper and 3PLPs (tracking and tracing facilities). Achievinglogistical integration means that the transport system should be perceived as one,explicitly to the ‘demand side’ of the logistics system (shippers), with a unifiedcommunication system for data exchange, common for all users. This unifiedcommunication system is especially important across all transport modes and in thenodes of the supply chain.
• Effective tariff integration: Ensuring that IMT users are not penalised twice, once forhaving to interrupt the trip and another for having to deal with separate operators whenchanging mode of transport. The creation of a intermodal ticket for all transport modesused in the trip contributes to an easier use of the system, since customers then onlyhave one single point of contact.
PROTRANS, The Role of Third party Logistics Services Providers and their Impact on Transport 125
• Administrative integration: An effective administrative integration, by means of anintegrated intermodal Bill of Lading (B/L), allows to overcome problems derived from dealingwith a number of different transport modes and their correspondent cargo documents.
• Physical integration: Providing seamless connection (thus avoiding excessive timelosses at node points between transport means) between two consecutive stages of the trip.Physical integration offers the possibility of benefiting from the advantages of each transportmode to deliver an efficient and reliable door-to-door transport service. Emphasis should beon developing integrated consolidation/mode transfer nodes which could save roadhaulage, time and would give extra leverage to alternative modes.
Obviously, the influence of European policy makers differs on all these principles. Forexample, logistics integration depends mainly from the customer’s perception of a singletransport system while tariff integration and the creation of an intermodal ticket should bejointly developed with transport operators, both public and private. On the other side,European policy makers through encouraging measures can influence the inception of anintermodal bill of lading and integrating administrative tasks.
Recommendations for policy actions
In order to facilitate the increasing role of 3PLPs in transport systems and to improveintermodal transport via road-rail, European policymakers should take action according tothe integrated principles and not on a single way on separate approach. In theCommission’s White and Green Papers and Directives a lot of initiatives are alreadydepicted. Based on the PROTRANS project the following actions should be taken by theEuropean policymakers:
• improving logistics regions;• improvements of railways;• development of transfer points between modes;• harmonisation of regulations;• marketing of intermodality;• evaluate intermodal processes.
These recommended policy actions are summarised below.
PROTRANS, The Role of Third party Logistics Services Providers and their Impact on Transport126
Improving logistics regions
To improve the profile of logistics region transport connections between logistics hubs arecrucial for the development of these logistics networks in a region. Policymakers can andshould align infrastructure plans on different levels, from European to regional level, in orderto improve these transport connections, which makes efficient consolidation of goodspossible in and between regions. Furthermore should policymakers stimulate integratedlogistics strategies in regions, since this is a vital element for regions to improve theirlogistics profile. Both public and private partners should participate in this strategy in orderto align the ‘demands’ of each partner and to make use of each other’ know-how.
Improvements of railways
Rail transport is the most critical mode of transport, thus European policy makers shouldfocus on railways in order to foster reliable IMT. The greatest challenge is consequently toliberalise railways market allowing the access for railway operations to parties other thanrailway companies, amongst others 3PLPs, in order to develop a more efficient, competitiveand reliable intermodal transportation system throughout Europe. However this not the onlychallenge for policymakers regarding railways. They should also:
• Improve the rail infrastructure: New infrastructure investment initiatives are requiredsince duration of the trip, price, tracking and tracing and reliability are the key variablesthat have a strong impact on the demand of intermodal transport. Consequently,improvements of infrastructure might enable prioritised and dedicated freight transport inorder to meet these requirements. Measures optimising railway capacity, promotingfreight transport priority or creating dedicated railtracks may also have positive effects onthe perception of intermodal transport by customers (mainly 3PLPs) and on the reliabilityof the intermodal system.
• Integrated infrastructure pricing policy: The large amount of externalities produced bytransport means is not currently being charged to the user. This situation createsdistortion of modal choices and inefficiencies in combining transport modes. Thesecircumstances benefit the mode of transport producing the largest externalities, namelyroad transport. Consequently, European policy-makers should develop commoncharging and pricing principles. An integrated infrastructure pricing policy across EUMembers States might rise the contributions of the different transport modes towardssustainable development and help 3PLPs choose the most suitable transport mode on amore representative economic basis. However, road and rail pricing is still very much anational issue that is determined by the principle position of the state towards regulationor deregulation.
PROTRANS, The Role of Third party Logistics Services Providers and their Impact on Transport 127
Furthermore should be taken in consideration that not every 3PLP will make a shiftfrom road to rail because of pricing policies. A lot of 3PLP will simply pass on theincreased expenses to their clients. Taken this fact in consideration means thatpolicymakers should not only ‘oppress’ one transport mode without making thealternative one more competitive. In this respect policymakers on National andEuropean level should therefore drive on the ‘internal’ opportunities for IMT, likeincreasing the liability of IMT through stimulation of tracking systems or improve theintegrated IMT services by ‘facilitating’ the logistics market to realise the role of PanEuropean integrator.
• Promoting integration of rail and road transport: The European Commission candefine the setting in which 3PLPs may operate in IMT. By expanding the right to railwaylicenses to 3PLPs and shippers the Commission creates a playing field for all IMToperators and foster competitiveness in the framework of efficiency and sustainability.
• Sharing the transport revenue: Sharing the transport revenue between rail operatorsaccording to the reliability of delivery services will foster the competitiveness withinroad-rail intermodal transport. The Commission should promote an independentcertification organisation charged to certify the quality of service of intermodal operatorsbased on a monitoring system involving GPS transmitters embarked on a sample ofcontainers.
Development of transfer points between modes
Nodes are the weakest link in the current intermodal transportation system. A solution is tocreate intermodal transfer points jointly managed by the operators, to achieve an optimalutilisation of the platform without increasing the price for the user. Since this jointlymanaged operations depends on the proactivity of the involved private parties, ‘public’policymakers can only facilitate by:
• Promoting efficient transfer locations: The goal for European policy makers is to shiftfrom a ‘transport corridors’ point of view to a ‘development corridors’ point of view,integrating regional economic supply and demand potential into logistics structures.'Development corridors' might be fostered by investment incentives for adequate transferlocations.
• Promoting freight villages: Freight villages increase the possibility of consolidatingtransport flows from different origins into common massified flows required for efficient useof IMT. They reduce transport needs and contribute to the success of intermodality, byintroducing a new type of distribution network in logistics based on the ‘hub and spoke’system as it is used in air passenger transport.
PROTRANS, The Role of Third party Logistics Services Providers and their Impact on Transport128
• Development of an Integrated Logistic Master Plan: By developing this Master Planat the European level, 3PLPs and shippers should be stimulated to locate on theselarge freight villages in order to consolidate flows.
Harmonisation of regulations
The current lack of policy harmonisation in several areas, directly or indirectly related withtransport, creates an obstacle for intermodal transport. Moreover, current nationalinvestments and political decision are taken under a ‘transport mode’ basis instead of undera ‘corridor’ basis, more oriented towards intermodal transport. In order to foster the use ofIMT, EU Members States should harmonise their regulations on the following aspects:
• Standardisation of intermodal units: A certain degree of uniformity can be achievedthrough the standardisation of some characteristics of intermodal units (containers andswap bodies). European standards should be developed in order to avoid delayinghandling operations and unnecessary friction costs.
• Carrier liability: The principles of carrier liability define the conditions under whichgoods carriers are responsible regarding delays, losses or damages. Intermodalityrequires the harmonisation across the different national carrier liability in order to beable to offer to their customers a clear set of coherent, comprehensive and transparentliability conditions. Therefore the European Commission should invest its efforts onpromoting an intermodal liability regime, covering all the EU territory (present andfuture), which should be valid across all transport modes.
• Labour regulations: Harmonisation of labour conditions is an important rule ofcompetition for reaching the completion of the European Single Market. Common anduniform speed limits, maximum loads and driving hours regulation may help EU policy-makers create fair competition between modes in the internal market.
• Generalised data processing systems: Common information systems are asimportant as the transport service itself. For 3PLPs activity, efficient data processingsystems play an important role, increasing the quality and added value of the transportservice. The public sector plays an important role in developing advanced technologiesensuring availability of information to all potential users. The European Commissioncould provide a legal framework on intermodal real-time electronic information systemsto achieve a paperless administration and closer integration through the whole supplychain.
PROTRANS, The Role of Third party Logistics Services Providers and their Impact on Transport 129
Marketing of intermodality
Since IMT services are generally not well known and the perception on the deliveredservices differ significant between shipper and 3PLPs, IMT should be marketed better.Marketing highlighting the benefits of intermodality and providing insight on the availableservices would allow reducing these differences in perception. The European Commissionand European organisations and associations (such as the European Logistics Association)are key actors in this promotion effort. In particular, information related initiatives areneeded to improve overall awareness amongst shippers while education initiatives will be acrucial element to expanding know-how and specialised skills amongst 3PLPs.
Evaluate intermodal processes
The European policy decision-makers should develop the criteria for assessing(benchmarking) the impact of IMT on the environment, employment and social and regionaldevelopment. Hence, this insight can be used in the marketing of intermodality.
These policymakers should furthermore encourage further research in order to identify bestpractices in intermodal transport and assess the potential of intermodality. Reliablemeasuring and monitoring of logistics and supply chain management performance at aEuropean level is a complex task. 3PLPs, amongst others, have developed KPIs but it isdifficult to get insight on these indicators because of confidentiality issues. However, it maybe possible to collect data on a revolving base with a time lap of two years for example.Additional challenges arise from the diversity of existing KPIs, which makes it difficult toestablish comparisons, for example, between countries. Co-ordination by DG TREN of datacollection and data monitoring by different Directorate Generals (e.g. DG Enterprise, DGEnvironment) could contribute to overcoming these difficulties. Actors such as the EuropeanLogistics Association (ELA) could also play a role in this respect.

PROTRANS, The Role of Third party Logistics Services Providers and their Impact on Transport130

PROTRANS, The Role of Third party Logistics Services Providers and their Impact on Transport 131
Bibliography

PROTRANS, The Role of Third party Logistics Services Providers and their Impact on Transport132
PROTRANS, The Role of Third party Logistics Services Providers and their Impact on Transport 133
Bibliography
Deliverable 1
Bagchi, P., Virum, H., (1998) Logistics Alliances: Trends and Prospects in IntegratedEurope, Journal of Business Logistics, Vol. 19, No. 1, pp. 191 – 212.
Berglund, M. (2000), Strategic Positioning of the emerging Third-Party logistics providers,Department of Management and Economics, Linköping studies in Management andeconomics, Dissertation No. 45.
Berglund, M., (1997) Third-Party Logistics Providers – Towards a Conceptual StrategicModel, Dissertation from the international Graduate School of Management and IndustrialEngineering, No. 7, Licentiate Thesis, Linköping Studies in Science and Technology, ThesisNo. 642, Linköping University Sweden.
Berglund, M., P. van Laarhoven, M. Peters (1999), Third-party logistics in Europe-five yearslater.
Berglund, P. van Laarhoven, G. Sharman, S. Wandel (1999), Third-Party logistics: is there afuture?, in the International Journal of Logistics Management.
Boels, V. and H.B. Roos (1992), Logistics services and the European food industry: Atheoretical contribution to the elements of satisfaction in contracted logistics services.
Buck Consultants International (1995), Spatial Aspects of Logistics Activities.
Coopers & Lybrand (1999), Ondernemingsanalyses 1999-Trends in transport, Den Haag.
PROTRANS, The Role of Third party Logistics Services Providers and their Impact on Transport134
Coyle,J.J., E.J. Bardi, C.J. Langley jr., (1992), The management of business logistics.
Gattorna, J. (1998), Strategic Supply chain Alignment, Gower.
Goor, A.R. van (1993), Value Added Logistics: valkuil of uitdaging.
Goor, A.R. van, M.J. Ploos van Amstel, W. Ploos van Amstel (1996), Fysieke distributie:denken in toegevoegde waarde.
GVB, Die “Top 100” der Logistik, 2000.
Kearney, A.T. (1993), Logistics Excellence in Europe.
Klaus, P., Müller-Steinfahrt u., (2000), Die Top 100 der Logistik: Eine Studie zuMarktgrößen Marktsegmenten und Marktführern in der Logistik-Dienstleistungswirtschaft.
KPMG (1993), Logistieke Concepten van de toekomst.
KPMG (1998), European Transport & Distribution market.
KPMG (1998), Top 100 companies European Transportation market.
Magill, P. (2000), Outsourcing Logistics, The transition to 4th party partnerships in Europe –KPMG.
NEI (1994), 80 largest logistics providers in Europe in Logistiek en de concurrentiepositievan de Nederlandse havens: fase 1 Identificatie en typologie van logistieke dienstverlenersin Europa.
Peters, M., Jockel, O., (1998) The day of the mega-carrier, Logistics Europe, June, pp. 16-25.
PROTRANS, The Role of Third party Logistics Services Providers and their Impact on Transport 135
Price Waterhouse Coopers (2000), the changing shape of European Logistics, PELSYearbook 2000.
Ruijgrok, C.J. and B. Knippenberg (1994), Successful Strategies of Logistics ServiceProviders for Creating Competitive Advantage through using Information Technology: theCase of The Netherlands.
Sheffi, Y., (1990) Third Party Logistics: Present and Future Prospects, Journal of BusinessLogistics, Vol. 11, No. 2, pp. 27 -39.
Sink, H.L et al (1996), Buyer observations of the US 3PL market, Int. Journal of PhysicalDistribution and Logistics Mngt. Vol 26/3-1996.
TNO-INRO et al, TRILOG–Europe end Report, (1999).
Vermunt (1993), Wegen naar logistieke dienstverlening.
Virum, H., (1993) Third Party Logistics development in Europe, Logistics and TransportationReview, Vol. 29, No. 4, pp. 355-361.Vol 10, No1.
www.3plogistics.com.
www.ac.com/services
www.inro.tno.nl/trilog.
PROTRANS, The Role of Third party Logistics Services Providers and their Impact on Transport136
Deliverable 2
Binsbergen, A. van, Visser, J. (1998), Distribution regions and concentrations of logisticsactivities. Delft: Trail Research Institute.
Buck Consultants International (1998), The development of logistics activities in the Elzasregion: study of the proposed logistics strategy.
Buck Consultants International (1997), The development of logistics activities in the Elzasregion: positioning and strategy.
Buck Consultants International (1997), Business estates and multi-modal transport.
Buck Consultants International (1996), Inland terminals for intermodal transport.
Priemus, A., Konings, J.W., and Kreutzberger, E. (1995), Freight transport nodes: typologyand dynamics. Delft: OTB.
REFORM. Research on freight platforms and freight organisation (1999). Belgium:Transport Research Fourth Framework Programme Urban Transport.
Schéma national des plates-formes multimodales et du transport combiné (1997). Rapportde mission de Marc-Phillipe Daubresse. Lambersart: Ministère de l’Equipement, duLogement, des Transports et du Tourisme.
Spatial pattern of transportation, Atlas of freight transport in Europe (1998). The Hague:Ministry of Housing, Spatial Planning and Environment.
PROTRANS, The Role of Third party Logistics Services Providers and their Impact on Transport 137
Literature per studied region
Antwerp
VEA; 2000Buck Consultants International: 1998, 2000NIS; 1999Port of Antwerp; 2000GHA; 2000Regional Development Authority for the Province of Antwerp, 1996, 2000, 2001;http://www.gomantwerpen.be/International Airport Antwerp: 2000Eurostat ;1994PVB; 2000,NMBS/SNCB; 2000Lúsine Nouvelle, 1996
Basel
Euroairport Basel-Mulhouse-Freiburg; 04.October 2000; www.euroairport.com/pages/autoportraitDie Rheinhäfen in Basel; 02. October 2000; www.portofbasel.chDie Stadt Basel; 02. October 2000; www.basel.chBasel-online service; 04. October 2000; www.bsonline.chWillkommen in Basel; 05. October 2000; www.baseltourismus.ch/BT/AUTO.HTM[Die Region Basel; 02. October 2000; www.baselarea.org/allgStatistisches Amt des Kantons Basel-Stadt; 28. September 2000;www.statistik.bs.ch/service_blick.htmlJolanda Mühlhausen; Statistik Basel-Stadt; Statistisches Amt des Kantons Basel-Stadt;Basel; 10. October 2000Statistik Basel-Land; Statistisches Amt des Kantons Basel-Land; Basel; 11. October 2000
Belgium Limburg
RSZ; 1999Logistics Association Limburg; 2001; http://www.logforlim.beGOM Limburg; 2000; http://www.gomlimburg.be/N.I.S., VAT; 1998I.N.R., N.B.B; 1998Dienst voor de Scheepvaart; 2000
PROTRANS, The Role of Third party Logistics Services Providers and their Impact on Transport138
Berlin-Brandenburg
Projekt Zukunft; Der Berliner Weg in die Informationsgesellschaft; TU-Berlin, BereichLogistik, Zentrum für Logistik und Unternehmensplanung; Berlin; 1998www.statistik-bund.de, 10.October 2000www.brandenburg.de/ids/daten, 06.October 2000www.berlin.de/ids/daten, 06.October 200Berlin-Stadt der Logistik, TU-Berlin, Fachbereich Logistik, Berlin, 1999
Duisburg
IHK Duisburg, 2001Logport; 2000; http://www.logport.de/logport/index.htmRhein-Ruhr Ports Duisburg; 2000Stadt Duisburg; 2001; http://www.duisburg.deLogistik Forum Duisburg; 2001; http://www.logistics-forum.de/Buck Consultants International; 1998, 2001
Poznan (Wielkopolski)
Französische und Deutsche Investitionen in Posen und in der Wojewodschaft;28.September 2000; http://www.man.poznan.pl/weimar/kont_gosp_2_d.htmlSlowik-Page; Wirtschaft; 29.September 2000; http://www.slowik-page.de/eko.htmPolish Airports State Enterprise (PPL); 27.September 2000; http://www.polish-airports.comHessen - Wirtschaftspartner Posen; Wojewodschaft Poznan; 29.September 2000;http://www.hlt.de/moe/aussen/poznan.htm
Warenaustausch; Übertragung der Pressekonferenz Poznan, 21. February 1998, 16.00Uhr; 28. September 2000; http://www.man.poznan.pl/weimar/kont_gosp_3_d.htmlKurze Charakteristik der Stadt Posen; Übertragung der Pressekonferenz Poznan, 21.February 1998, 16.00 Uhr; 28. September 2000; http://www.man.poznan.pl/weimar/poz_info_d.htmlSpedpol; Spedpols offer's; logistic services; 27.September 2000;http://www.spedpol.com.pl/english/frame_logistyczne.htmlPolish Agency for Foreign Investment (PAIZ); 2001; http://www.paiz.pl/indexm.html
PROTRANS, The Role of Third party Logistics Services Providers and their Impact on Transport 139
Hungary
Hungarian Association of Forwarders, 1075 Budapest, Kristóf tér 6. Phone/Fax: +36 12666771.Hungarian Association of Logistics, Inventory and Purchasing Management, 1053Budapest, Veres Palne utca 36. Phone/Fax: +36 1 3172959.Association of Forwarder SMEs, 1036 Budapest, Nagyszombat u. 1. Phone: +36 13487503.Hungarian Logistics Association, 1077 Budapest, Rózsa u. 4-6. Phone/Fax: (1) 342-0500Logistics Promotion Centre, 1063 Budapest, Munkácsy M. u. 16. Phone: +36 1 3122480Fax: +36 1 3320787Ministry of Economic Affairs www.gm.huRequirements and Framework for Environment and Transport Telematics Country Report:Hungary, 1998 november, CAPE ProjectHungarian Statistics Office (2000), “Transportation Sector I-IV Quarters 1999” BudapestFigyelo (1998), Special IssueNavigator (1999), Special Issue
Lombardy
Istat; 1991,1995, 1996, 1997AILOG, 2000Eurostat 1997Portrait of the regions; Eurostat, 1993Kompass; 2000Promos; 1997Airports Council International (ACI); 2000ONCOR International Real Estate Guide; 1999
London+South East
The South East England Development Agency (SEEDA); 2000; http://www.seeda.co.uk/Distribution Business; 5/99Institute of Shipping Economics and Logistics, Bremen; 1998Inland Revenue Statistics 1999, Press release, Inland Revenue; 19, 9 March 1999Greater London Authority (GLA);1999
PROTRANS, The Role of Third party Logistics Services Providers and their Impact on Transport140
Madrid
Operadores Logisticos Magazine nº 1 Jan 2000Aena; december 2000; http://www2.anea.esCentro de Carga Area Madrid/Barajas, S.A; February 2000Aeronáuticos; March 2000; http://www.coiae.com/aerobas.htm#indice497
Nord Pas-de-Calais
Cedex (Lille Nord-Pas de Calais); 1999Sitram (DAEI); 1997INSEE; 1997ONCOR International Real Estate Guide; 1999Regional development agency Nord Pas-de-Calais; 2000;http://www.ardnpc.org/sommaire/default.htmInvestment Promotion Agency for Northern France; 2001;http://www.logistics-in-europe.com/anglais/majorlogisticsites/nord_pasdecalais/
Oresund
ISA; April 1999Danmarks Statistik, Sveriges Statistik , 1996Banverket, SCB (Seaport statistics, UVAV, Foreign trade statistics); 1998Copenhagen Capacity; March 2001OresundBron; 2001; http://www.oeresundsbron.com/english.phpBusiness Guide Oresund; 2001; http://www.bgoresund.com/
Prague
Prague Business Journal, 2000Metrans Prague Uhrineves (Rail/Road Terminal); 2000City Invest Czech; 2000Prague-Ruzyne airport; 2000
PROTRANS, The Role of Third party Logistics Services Providers and their Impact on Transport 141
Rotterdam
Port of Rotterdam; 2000Buck Consultants International; 1998Belastingdienst; 2000Rotterdam Regional Council of Government; 2000; http://www.stadsregio.rotterdam.nlRotterdam City Development Corporation (RCDC); 2000; http://www.city.rotterdam.nl/
Venlo
City of Venlo; Economic Affairs; 1998, 2000; http://ez.venlo.nlLimburg Development Bank; 2000; http://www.liof.nlBuck Consultants International; 1998, 2001
Vienna
Zentralverband Spedition & Logistik; Aufstellung der Wiener Mitgliedsfirmen; Stand 09/2000Wirtschaftskammer Wien; TEN-Knoten Region Wien: Beurteilung der wirtschaft-lichen Wirkung; Wien 1999Wiener Hafen; Zahlen und Fakten; Stand 09/2000 http://www.basel.ch/Wiener Wirtschaftsförderungsfonds; Informations- und Servicehandbuch; Stand 12/1999Wiener Konjukturtelegramm 2000; 11. Oktober 2000;http://www.wkw.at/docextern/abtwipol/refstat/Konjunk/wrtelegr.htmFEEI – Fachverband der Elektro- und Elektronikindustrie; Aufstellung der WienerMitgliedsfirmen; Stand 09/2000Fachverband der Fahrzeugindustrie Österreichs; Aufstellung der Wiener Mitgliedsfirmen;Stand 09/2000Fachverband der Maschinen- und Stahlbauindustrie Österreichs; Aufstellung der WienerMitgliedsfirmen; Stand 09/2000Fachverband der chemischen Industrie Österreichs; Aufstellung der Wienr Mitgliedsfirmen;Stand 09/2000Fachverband der Nahrungs- und Genußmittelindustrie Österreichs; Aufstellung der WienerMitgliedsfirmen; Stand 09/2000Henry/Snizek; TEN-Knoten Wien; Eckwerte zum Güterverkehr; Arbeitspapier 23.07.1998
PROTRANS, The Role of Third party Logistics Services Providers and their Impact on Transport142
Deliverable 4
Andersson, D. (1995), Logistics Alliances and Structural Change (unpublished thesis),Linköping Studies in Science and Technology, Thesis No. 470, Department of Managementand Economics, Linköping University, Sweden.
Andersson, D. (1997), Third Party Logistics - Outsourcing Logistics in Partnerships(unpublished dissertation), Linköping Studies in Management and Economics, DissertationNo. 34, Department of Management and Economics, Linköping University, Sweden.
Arthur Andersen, (2000), European Deal Survey 2000 – Logistics; Mergers and Acquisitionsin the Logistics Industry.
Bhatnagar, R.; Sohal, A. & Millen, R. (1999). Third party logistics services: a Singaporeperspective. International journal of Physical distribution & Logistics Management, Vol 29,No 9, pp 569-587.
Berglund, M. (2000), Strategic Positioning of the Emerging Third-Party Logistics Providers(unpublished dissertation), Linköping Studies in Management and Economics, DissertationNo. 45, Department of Management and Economics.
Bowersox, D.J. and Closs, D.J. (1996), Logistical Management, McGraw Hill, Chicago.
Christopher, M. (1992), Logistics and Supply Chain Management: Strategies for ReducingCosts and Improving Service, Pitman, London.
Jockel, O. and Peters, M. (1998), ‘The Day of the Mega-Carrier’, Logistics Europe, Vol. 6,No. 3, June, pp. 16-25.
Jockel, O., Franke, U. (1999) “Virtual Logistics“, Logistics Europe, September Issue, pp. 17-25.
Katz, R.L. (1974), ‘Skills of an Effective Administrator’, Harvard Business Review, Vol. 52,No. 5, pp. 90-102.
Lambert M. D., Stock J. R., (1998), ‘Strategic Logistics Management’, McGraw Hill,Chicago.
Langley, J.C., et al. (1999), ‘Has the Future of Third Party Logistics Already Arrived?’,Supply Chain Management Review, vol 5/ Fall 1999, pp. 85-94.McKinnon Alan (1995b)Reducing the impact, in LOGISTICSeurope, ELA, August, pp. 14-21.
McKinnon, Alan (1995a) Logistics and the environment, in LOGISTICSeurope, ELA, June,pp. 16-22.
PROTRANS, The Role of Third party Logistics Services Providers and their Impact on Transport 143
Millen, R.; Sohal, A.; Dapiran, P.; Lieb, R. & Van Wassenhove, L.N. (1997, 1995 survey).Benchmarking Australian firms' usage of contract logistics services - A comparison withAmerican and Western European proactices. Benchmarking for Quality Management &Technology, Vol 4, No 1, pp 34-46.
Murphy, P.R. & Poist, R.F. (2000). Third-party logistics: Some user versus providerperspectives. Journal of Business Logistics, Vol 21, No 1, pp 121-133.
Nanda, A. (1996), ‘Resources, Capabilities and Competencies’, in Moingeon, B. andEdmondson, A. (eds), Organisational Learning and Competitive Advantage, Sage, London,pp. 93-120.
Nelson, R.P. and Winter, S. (1982), An Evolution Theory of Economic Change, HarvardUniversity Press, Cambridge.
Penrose, E.T. 1959, The Theory of the Growth of the Firm, Blackwell, Oxford.
Prahalad, C.K. and Hamel, G. (1990), ‘The Core Competence of the Corporation’, HarvardBusiness Review, Vol. 68, No. 3, pp. 79-91.
Hofer, C.W. and Schendel, D. (1978), Strategy Formulation: Analytical Concepts, WestPublishing Company, St. Paul.
Skjoett-Larsen, T. (2000), ‘European Logistics Beyond 2000, International Journal ofPhysical Distribution and Logistics Management, Vol. 30, No. 5, pp. 377-387.
Sohal, A.; Millen, R. & Moss, S. (2002, 1999 survey). A comparison of the use of third-partylogistics services by Australian firms between 1995 and 1999. International journal ofPhysical distribution & Logistics Management, Vol 32, No 1, pp 59-68.
Wu, Haw-Jan & Dunn, Steven C. (1995) Environmentally responsible logistics systems, inInternational Journal of Physical Distribution & Logistics Management, Vol. 25, No. 2, pp.20-38.
Deliverable 5
European Commission. (2001). White Paper ‘European transport policy for 2010: Time toDecide’. COM(2001)370. Office for Official Publications of the European Communities,Luxembourg.
European Commission (2001). EU Transport and Energy in Figures. Directorate General forTransport and Energy, Brussels.
PROTRANS, The Role of Third party Logistics Services Providers and their Impact on Transport144
European Commission. (2000). Green Paper ‘Towards a European strategy for the securityof energy supply’. COM(2000)769 final. Office for Official Publications of the EuropeanCommunities, Luxembourg.
European Commission. (1999). Intermodality and intermodal freight transport in theEuropean Union. Communication from the Commission to the European Parliament and theCouncil. COM(1999)-0519.
IPC. The mail pipeline / UNEX. http://www.ipc.be/unexdac1.asp. Internet site accessed on16 January 2003.
Lobé, P. (1998). Computation of a Perception Index in Intermodal Transport. PTRCconference proceedings, Loughborough (UK), September 1998.
Price WaterhouseCoopers and Stratec. (1999). Integration of Intermodal Transport in theSupply Chain (ITT). Project carried out for the European Commission , DG VII.
Protrans Partners. (2002). Deliverable 4: Market Demands and Services Offered by ThirdParty Logistics.
Schils, J. (2003). Les expéditeurs et chargeurs doivent également pouvoir obtenir de lacapacité ferroviaire. Lloyd, p. 2.
PROTRANS, The Role of Third party Logistics Services Providers and their Impact on Transport 145
Annexes

PROTRANS, The Role of Third party Logistics Services Providers and their Impact on Transport146
PROTRANS, The Role of Third party Logistics Services Providers and their Impact on Transport 147
Annexe 1 Description per work package
Work Package 1
The technical and scientific objectives of Work Package 1 can be summarised as follows:
• Development of a theoretical framework in order to make an analysis of the Third partylogistics service providers market (3PLP market) in Europe.
• Development of a database: Description/ mapping of scope of geographical coveragenetwork and transport options of the 30 most important 3PLPs in Europe, including abusiness profile (turnover, profit, asset base).
Work in this Work Package has been relatively straightforward in terms of structure andmethodological approach. With respect to the first task of Work Package 1 on the 3PLPmarket, experts on the subject who were represented in Work Package 1 have extensivelydiscussed the definition and typology of 3PLPs (also in relation to the PROTRANS projectobjectives) based on a discussion paper containing an extensive literature overview. Basedon these discussions, a selection was made of the most applicable definitions and structure.The selected typology and the discussion paper were put at the disposal of all PROTRANSpartners and the PROTRANS steering committee after which their comments have beenintegrated in the report.
The second task within Work Package 1 covering the development of a database on 3PLPsactually consisted of two separate activities. Based on the typology of 3PLPs, a userfriendly database structure was programmed in MS-Access by the Work Package 1 leader.This dummy structure was then carefully reviewed and tested by all Work Package 1partners. After another thorough review of database functionalities a final databasestructure was developed. The second database-related activity was the actual feeding ofinformation on 3PLPs into the database.
The activities of Work Package 1 are actually the stepping stone for further research withinthe PROTRANS project, by providing a sound theoretical basis on the characteristics of a3PLP and by providing an extensive overview of possible 3PLPs all over Europe.
PROTRANS, The Role of Third party Logistics Services Providers and their Impact on Transport148
Work Package 2
Description of Work Package 2.1- Identification of logistics regions
Logistics policies and 3PLP networks distinct between logistics regions. To point out thosedifferences, logistics regions are identified in WP 2.1 and evaluated on the basis of thefollowing aspects captured in the Description Of Work (DOW) of the PROTRANS project:
• the size (transport volume and turnover of the 3PLs);• the concentration/density of 3PLs;• the special areas of competence (logistics and transport);• the infrastructure (transport, intermodal hubs, telecommunication);• situation towards logistics corridors;• the volume of the material flows from, to and through the region;• investments in or existence of intangible matters (RTD, innovations, patents,
intermediary organisations like the Holland International Distribution Council).
By an evaluation of logistics regions a foundation is laid to define a typology for logisticsregions. The identification of a logistics region makes it possible to compare regions witheach other in the analysis of successful regions.
Description of Work Package 2.2 - Analysis of successful regions
In second part of this Work Package the gathered data and obtained insights are allocatedto benchmark the different main logistics regions. By this benchmark the findings of first partare applicable for policy makers at the international, national and regional level as well asfor other relevant organisations and companies. Based on the described aspects in theDOW the benchmark will encompass:
• identification of logistic regions working with ‘best practice’;• reasons for ‘leadershipment’ of some logistic regions;• analysis of the trend to have more or less main logistics regions in the future;• analysis of polarisation of logistic regions and its relation with corridors. Within this
analysis, special attention will be paid towards strategy development of the transportsector in these regions and the impact of polarisation of the transport sector on theorganisation and execution of transport and logistics.
Within this Work Package an analysis has been made on the reasons why the identifiedregions have become successful as logistics hubs and why some are not based on thefollowing aspects:
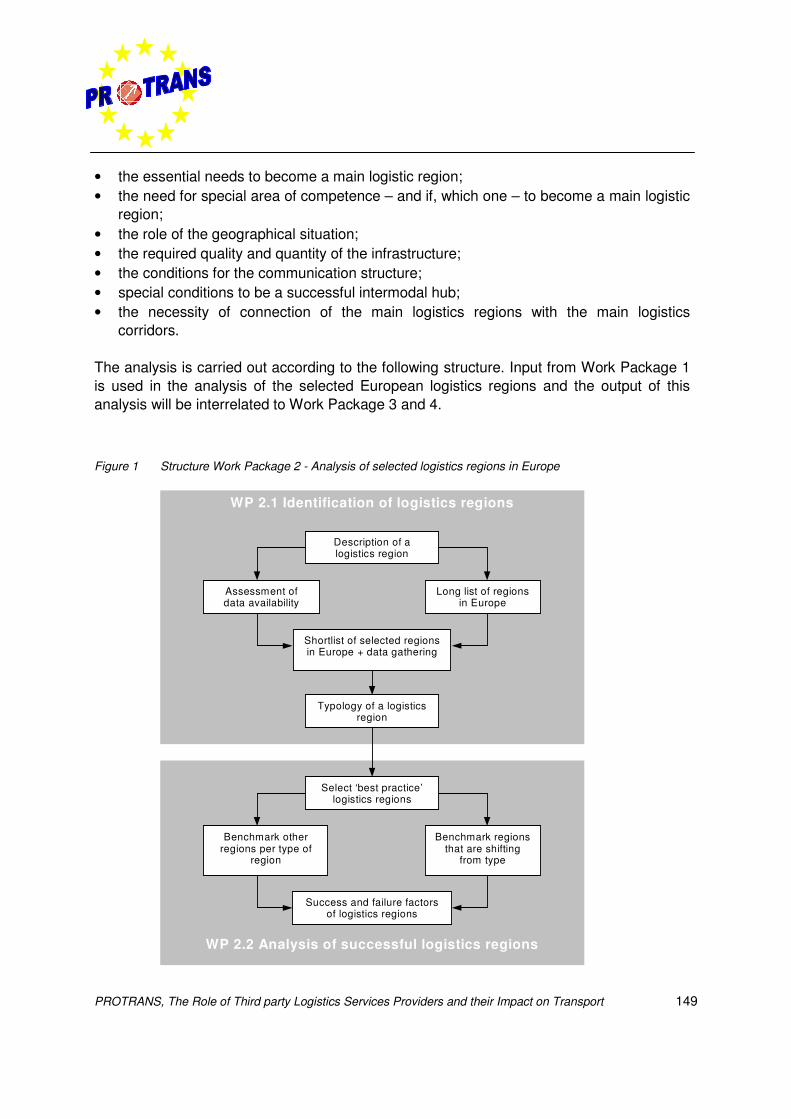
PROTRANS, The Role of Third party Logistics Services Providers and their Impact on Transport 149
• the essential needs to become a main logistic region;• the need for special area of competence – and if, which one – to become a main logistic
region;• the role of the geographical situation;• the required quality and quantity of the infrastructure;• the conditions for the communication structure;• special conditions to be a successful intermodal hub;• the necessity of connection of the main logistics regions with the main logistics
corridors.
The analysis is carried out according to the following structure. Input from Work Package 1is used in the analysis of the selected European logistics regions and the output of thisanalysis will be interrelated to Work Package 3 and 4.
Figure 1 Structure Work Package 2 - Analysis of selected logistics regions in Europe
WP 2.1 Identification of logistics regions
WP 2.2 Analysis of successful logistics regions
Description of alogistics region
Assessment ofdata availability
Long list of regionsin Europe
Shortlist of selected regionsin Europe + data gathering
Typology of a logisticsregion
Select ‘best practice’logistics regions
Benchmark otherregions per type of
region
Benchmark regionsthat are shifting
from type
Success and failure factorsof logistics regions
PROTRANS, The Role of Third party Logistics Services Providers and their Impact on Transport150
Work Package 3
In Work Package 3 the aim is to compare logistics services offered by Third Party Logisticsproviders (3PLPs) with shippers demands. The overall objectives of Work Package 3 are toinvestigate:
• shippers’ and providers’ views on present and future requirements on logistics andtransport systems;
• how these are currently facilitated by 3PLPs, including the portfolio of services offeredby 3PLP;
• how they will have to be facilitated in the future.
Further sub-objectives were set:
• understand how 3PLPs can contribute to the development of efficient intermodaltransport at the pan-European level;
• identify how 3PLPs are responding to changes in logistics demands across industrysectors and the implications for modal choice;
• recognise the implications of modal choice on sustainable competitiveness and growthin Europe;
• identify existing barriers limiting 3PLPs response to European shipper demands;• evaluate what opportunities exist for greater transport systems optimisation and the
integration of modes.The achievement of these objectives must take place within the context of the management,finance, ecological, and regulatory environment that are described in the preceding chapter.The data collection for this study is based on two rounds of in depth face-to-face interviewswith leading 3PLPs and shippers from four industries (see Table 1). The first round ofinterviews focused on 3PLPs’ role in logistics management and the second focused on theirspecific role in intermodal transport.
In the first survey (conducted between November 2000 to June 2001) 76 respondents wereinterviewed in total (each interview took at least two hours). In the second survey, which hasbeen conducted between January 2002 and August 2002, the same companies have beeninterviewed again.
The sample on 3PLPs was determined from a previously compiled list of leading 3PLPs inEurope irrespective of their countries of origin. The number of shippers that had to beinterviewed in each European country was determined by its relative contribution GrossEuropean Product. 10 of the total shipper sample size were determined to be ‘Europeanshippers’, i.e. not relating to nationally based operations. There was also an appreciationthat in each industry companies of different sizes ought to be surveyed.
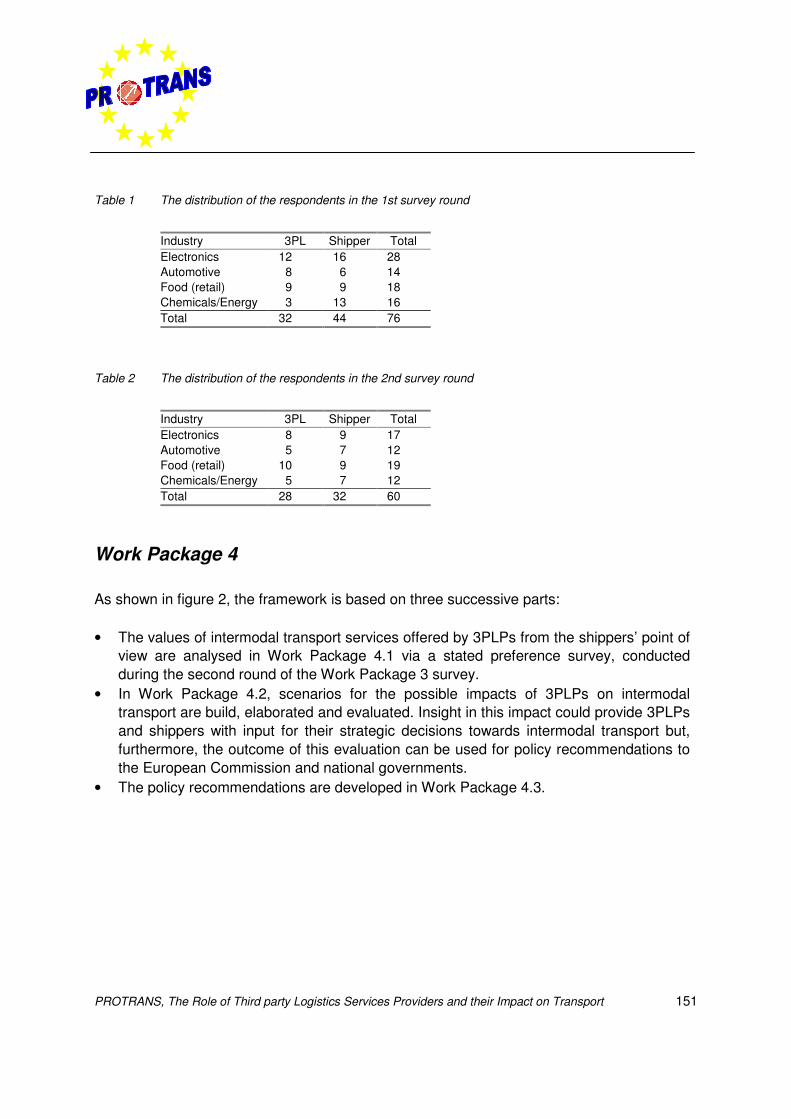
PROTRANS, The Role of Third party Logistics Services Providers and their Impact on Transport 151
Table 1 The distribution of the respondents in the 1st survey round
Industry 3PL Shipper TotalElectronics 12 16 28Automotive 8 6 14Food (retail) 9 9 18Chemicals/Energy 3 13 16Total 32 44 76
Table 2 The distribution of the respondents in the 2nd survey round
Industry 3PL Shipper TotalElectronics 8 9 17Automotive 5 7 12Food (retail) 10 9 19Chemicals/Energy 5 7 12Total 28 32 60
Work Package 4
As shown in figure 2, the framework is based on three successive parts:
• The values of intermodal transport services offered by 3PLPs from the shippers’ point ofview are analysed in Work Package 4.1 via a stated preference survey, conductedduring the second round of the Work Package 3 survey.
• In Work Package 4.2, scenarios for the possible impacts of 3PLPs on intermodaltransport are build, elaborated and evaluated. Insight in this impact could provide 3PLPsand shippers with input for their strategic decisions towards intermodal transport but,furthermore, the outcome of this evaluation can be used for policy recommendations tothe European Commission and national governments.
• The policy recommendations are developed in Work Package 4.3.
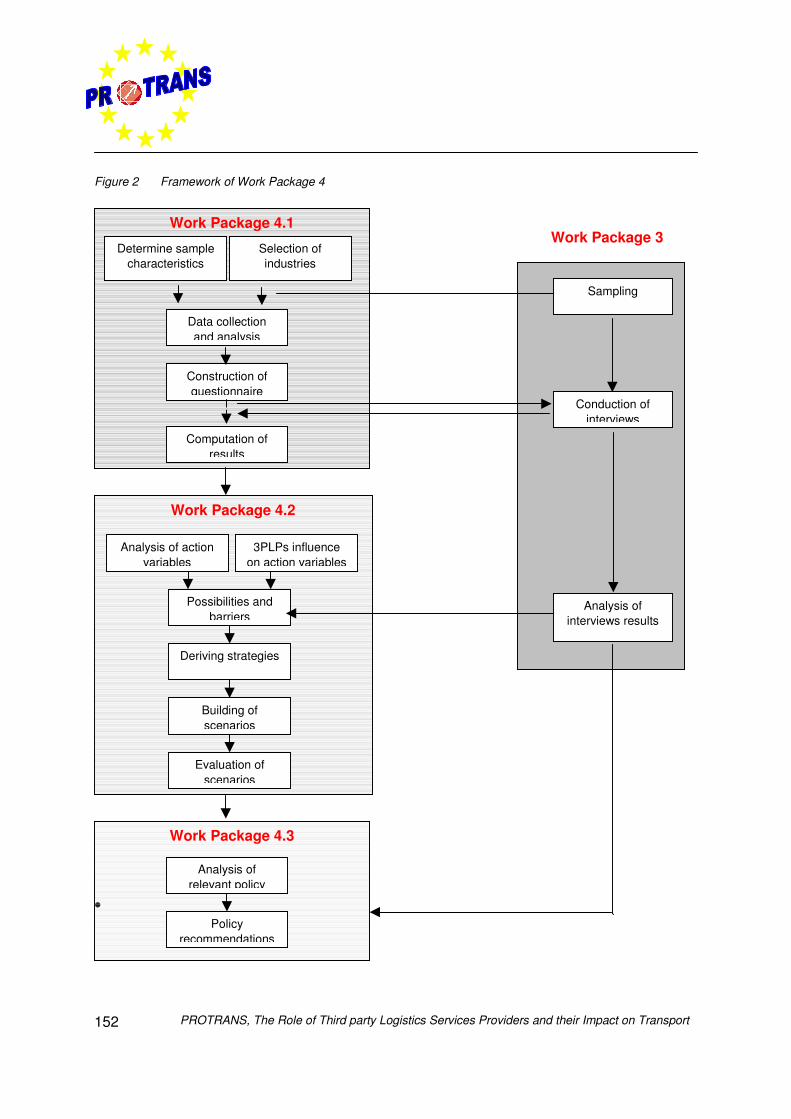
PROTRANS, The Role of Third party Logistics Services Providers and their Impact on Transport152
Figure 2 Framework of Work Package 4
Work Package 3
•
Work Package 4.1
Determine samplecharacteristics
Selection ofindustries
Computation ofresults
Conduction ofinterviews
Construction ofquestionnaire
Data collectionand analysis
Work Package 4.2
Work Package 4.3
Analysis of actionvariables
Deriving strategies
Building ofscenarios
Evaluation ofscenarios
Possibilities andbarriers
3PLPs influenceon action variables
Analysis ofrelevant policy
Policyrecommendations
Analysis ofinterviews results
Sampling
PROTRANS, The Role of Third party Logistics Services Providers and their Impact on Transport 153
A short description of each part of Work Package 4 is given below.
Description of Work Package 4.1
Work Package 4.1 is devoted to analysing the opinion of shippers on the services offered by3PLPs and to estimating the actual value (in monetary units) of the improvements 3PLPscould bring to intermodal transports. The method used is the computation of the IntermodalPerception Index (IPI), developed in the framework of an earlier pilot project5, based on theresults of a stated preference survey. The aim of this survey, which comprises a total of 325interviewees across Europe, is to identify the variables to which shippers are most sensitivewhen it comes to modal choice. Based on this information, it is possible to foresee theshippers’ future behaviour with regards to modal choice depending on the evolution of thesevariables. This analysis is performed for a selection of geographical corridors.
Work Package 4.1 thus provides insight on the potential market share of intermodaltransport that may be reached when the characteristics of the services offered are modifiedthrough variations of action variables, like door-to-door transport price and door-to-doortransit time.
Description of Work Package 4.2
Work Package 4.2 concentrates on the possible strategies that 3PLPs can develop withregards to the use of intermodal transport. To derive these strategies for 3PLPs, the actionvariables as defined in Work Package 4.1 and the opportunities that occur for 3PLPs toimprove intermodal transport have to be analysed. These opportunities consist not only ofexisting opportunities but also of potential future services presenting the highest equivalentmonetary value from the shippers’ point of view, which could be offered by 3PLPs. Not onlyopportunities but also barriers that hamper the growth of intermodal transport have to bedescribed. The barriers on intermodal transport identified in Work Package 3 are used inWork Package 4.2. Once the possible strategies for 3PLPs on intermodal transport areidentified, they need to be validated. In particular, the feasibility of the strategies can betested by presenting theory-based strategies to a sample of 3PLPs.
Finally, Work Package 4.2 provides concrete scenarios by which 3PLPs can pro-activelyinfluence intermodal transport efficiency and shippers’ perception on the selected corridors.These scenarios are evaluated with the Intermodal Perception Index to estimate the impactof these 3PLPs’ pro-active behaviours on the market share of intermodal transport.
5 PriceWaterhouseCoopers and Stratec. 1999). Integration of Intermodal Transport in the Supply Chain
(ITT). Project carried out for the European Commission , DG VII.
PROTRANS, The Role of Third party Logistics Services Providers and their Impact on Transport154
Description of Work Package 4.3
The first proposed objective of this task is to determine the potential for improvement ofcurrent and future activities of 3PLPs, based on the results of the scenarios’ evaluation andto provide concrete recommendations on possible paths and policy options to achieve thatpotential in the framework of EU transport, environmental and competitiveness policies.
The second objective of this task is to demonstrate to policy-makers the importance of theactivity of 3PLPs both in the development of an integrated freight transport system and in thewider economy and competitiveness in the European Union. This goal will be achieved byproviding policy decision-makers with a clear view on the current and future state ofintermodal transport, including the identification of barriers and the assessment of a likelyfuture policy orientation in fostering the integration between the different modes.
To achieve these objectives, this task is divided into three sequential subtasks:
• identification of policy relevant issues;• stakeholders analysis;• development of policy issues and recommendations.
Work Package 5
In Work Package 5, the conclusions and recommendations will be drawn. There is also animportant role for dissemination activities. Depending on the outcomes of the project, theresults will be presented to for example government officials involved in intermodal transportand the third part logistics industry. This Work Package will be partly carried out togetherwith the SULOGTRA project, in particular regarding the creation of a web site. Within thisco-operation attention will be paid to a comparison of the results between PROTRANS andSULOGTRA. It is difficult to predict how extensive these dissemination activities should be.If the project provides input for a growth of the use of intermodal transport, disseminationactivities to be held will likely be widespread and have a high level of publicity. Otherwise, asomewhat more moderate approach can be chosen.
Work Package 0
In the PROTRANS project there is also an extra Work Package for the projectmanagement, Work Package 0. This Work Package consists of all co-ordinating activitiesand the Project Management. In all phases of the project there will be a strong validationthrough a continual interaction with market parties. This Work Package will be carried out in
PROTRANS, The Role of Third party Logistics Services Providers and their Impact on Transport 155
close co-operation with the SULOGTRA project, in particular regarding the establishment ofan Advisory Committee.

PROTRANS, The Role of Third party Logistics Services Providers and their Impact on Transport156
PROTRANS, The Role of Third party Logistics Services Providers and their Impact on Transport 157
Annexe 2 Definitions of 3PL
In this annexe several definitions of 3PL are enumerated on which the definition of a 3PLPis formulated in the PROTRANS project.
Coyle, Bardi, Langley (1992) defined Outsourcing or Third-party logistics as purchasinglogistics services from a service provider outside the company. Lieb, et al (1993) defineThird-party logistics as: The use of external companies to perform logistics functions whichhave traditionally been performed within the organisation. The functions performed by theThird-party logistics firm can encompass the entire logistics process or selected activitieswithin that process.
The definition of Sink, H.L et al (Buyer observations of the US 3PL market, Int. Journal ofPhysical Distribution and Logistics Mngt. Vol 26/3-1996) is: “Third party logistics servicesare multiple activities provided by an external party, assuming no ownership of inventory toaccomplish related functions that are not desired to be rendered and/or managed by thepurchasing organisation”.
In 1999, Langley, et al gave a more comprehensive view of what they understand as 3PLP:“A company that provides multiple logistics services for its customers, whereby the Third-party logistics provider is external to the customer company and is compensated for itsservices. One desirable attribute of a Third-party logistics provider is that the multiplelogistics services be integrated as opposed to being performed on a stand-alone basis. Byproviding integrated solutions the provider can solve its customer’s business problems moreeffectively”.
Bowersox (1996) refers to a new type of service, which emerged from service providers thatformerly offered warehousing and transport services and have extended their basiccompetitiveness by adding new and unique value-added services. Sheffi(1990) and SemeijnVallenga (1995) even refer to the emergence of Mega Carriers that offer virtually “One-stopshopping“ for transportation and logistics needs including consulting and analysis.
Jan Africk of A.T. Kearney (Bradley 1994) focuses more on the complexity of 3PL andincludes within its definition references to the management system: “multiple logisticsservices provided by a single vendor on a contractual basis, who offer at least two servicesthat are bundled and combined, with a single point of accountability using distinctinformation systems that are dedicated to and integral to the logistics process.“
PROTRANS, The Role of Third party Logistics Services Providers and their Impact on Transport158
Van Laarhoven, P., Berglund, M., Peters, M., (1999) define 3PL as follows: “Third-partylogistics are activities carried out by a logistics service provider on behalf of a shipper andconsisting of at least management and execution of transportation and warehousing. Inaddition, other activities can be included, for example inventory management, informationrelated activities, such as tracking and tracing, value added activities, such as secondaryassembly and installation of products, or even supply chain management. Also, the contractis required to contain some management, analytical or design activities, and the length ofthe co-operation between shipper and provider to be at least one year, to distinguish Third-party logistics from traditional ”arm’s length” sourcing of transportation and/or warehousing”.
Berglund (1997, 2000) also uses the following definition of third party logistics:“Organisations use of external providers, in intended continuous relationships bound byformal or informal agreements considered mutually beneficial, which render all or aconsiderable number of the activities required for the focal logistical need without takingtitle.”
Virum (1993) uses the following definition: “3PL are the services offered by a middleman inthe logistics channel that has specialised in providing, by contract, for a given time period,all or a considerable number of the logistics activities for other firms.” However, Virum´sdefinition is not complete without the following information: “consists of a long termrelationship between two parties which regard each other as partners. The logistics solutionis worked out in co-operation specifically for each shipper. The goal for the relationshipshould be to develop into strategic alliances with win-win for both parties”. This leads tologistics alliances, which can be defined as (Bagchi and Virum, 1996): “A long-termpartnership arrangement between a shipper and a logistics vendor for providing a widearray of logistics services”.
Jockel (1998) defines third party logistics as: “the provision of a bundle of logistical servicesby a third party to serve the logistical needs of one or more organisations in the supplychain encompassing selected logistics functions or entire logistics processes that havebeen outsourced”.
PROTRANS, The Role of Third party Logistics Services Providers and their Impact on Transport 159
Annexe 3 Type of clients
Dry minerals
Non-energy mining and quarrying (e.g. iron ore, stone, construction raw materials).Ferrous metals (e.g. iron, steel).Non-ferrous metals (e.g. aluminium, copper, lead).Non-metallic mineral products (e.g. cement, clay, glass).Construction (e.g. building, civil engineering)
Chemicals and energy
Energy (e.g. crude oil, natural gas, water).Chemicals (e.g. basic industrial chemicals, petrochemicals, paints, fertilisers, but notpharmaceuticals).Rubber and plastics (e.g. rubber products, plastics processing).
Pharmaceuticals
Other transport equipment/ metal products.
Transport equipment (e.g. shipbuilding, railway rolling stock, but not automotive).Metal products (e.g. light metal packaging, hand tools, steel drums).Mechanical engineering. (e.g. machine tools, machinery).
Automotive
Finished products.Spare parts.
PROTRANS, The Role of Third party Logistics Services Providers and their Impact on Transport160
Electronics (HI-Tech)
Electronics: finished productsElectronics: spare partsElectrical engineering (e.g. batteries, electrical machinery)Electronic engineering (e.g. electronic components, computer electronics)Instrument engineering (e.g. control instruments, clocks and watches).
Food
Textiles
Wood and paper
Wood processing (e.g. sawing, wooden building components).Pulp, paper, printing and publishing (e.g. printing and publishing).
Retailers/ wholesalers food (Grocery Retail)
Retailers/ wholesalers non-food (Other Retail)
Other manufacturing industries (e.g. furniture, jewellery, toys).
Medical technology
General (in case all categories apply)
Unspecified (in case it is unknown which category applies)
PROTRANS, The Role of Third party Logistics Services Providers and their Impact on Transport 161
Annexe 4 Overview of sub-activities
1 Financial Services
• Financing Warehouses and MHE• Financing Transport equipment• Financing IT systems• Crediting/ invoicing
2 Information Technology
Information systems design, software specification, including:
• Software development for materials management, warehouse management,transportation management
• Software installation• Software compatibility management
Implementation of IT systems
• Hardware specification• Project management• Tendering • Contract management• Hardware compatibility management
PROTRANS, The Role of Third party Logistics Services Providers and their Impact on Transport162
3 Warehousing & Inventory Management
• Specifying Warehouse layout• Specification Materials Handling • Equipment• Specification of • Packing and labelling • Process simulation• Design of information flow• Design of physical flow• Resource planning• Health and safety policy• Environmental policy• Standard procedures and working instructions (ISO)• Project management• Tendering• Contract management• Warehouse capacity planning• Cross docking• Storing• Picking• Inventory control
4 Transport Planning & Management
• Design of information flow• Design of physical flow • Expert advice• Design of intermodal systems• Process simulation• Resource planning• Relationships with 2nd tier providers• Health and safety policy• Environmental policy• Standard procedures and working instructions (ISO)• Project management• Tendering• Contract management• Transport scheduling• Transport capacity planning
PROTRANS, The Role of Third party Logistics Services Providers and their Impact on Transport 163
• Planning of intermodal transport• Planning of reverse logistics• Transport• Intermodal transport• Loading/unloading • Tracking and tracing• Carrier performance measure
5 Consulting Services
Setting a Customer Service strategy
• Scenario building• Data analysis• Making business cases• Expert advice• Providing data• Customer communication• Packaging design• Providing data• Simulations• Decisions on channel members• Decisions on kind and number of locations• Resource planning
Implementation of Organisational Change
• Changing organisational structure• (Re-)defining responsibilities• Setting performance goals • Hiring employees • Training employees
PROTRANS, The Role of Third party Logistics Services Providers and their Impact on Transport164
Product related services
Materials management design
• Replenishment • Order management• Inventory management• Expert advice• Process automation• Process simulation• Resource planning
Planning (scheduling)
• (demand) Forecasting • (finished Products)• Inventory planning• Material production scheduling• Production capacity planning • Materials planning• Supplier scheduling• Order processing• (re-)packing/labelling• Product configuration• Product installation• Sequence to production line• Shelf replenishment• Product return administration• Product repair• Scrap/disposal/recycling• Replenishment control• Order fulfilment control
6 Forwarding and Customs activities
• Customs warehouse administration• Customs administration• Shipping documentation
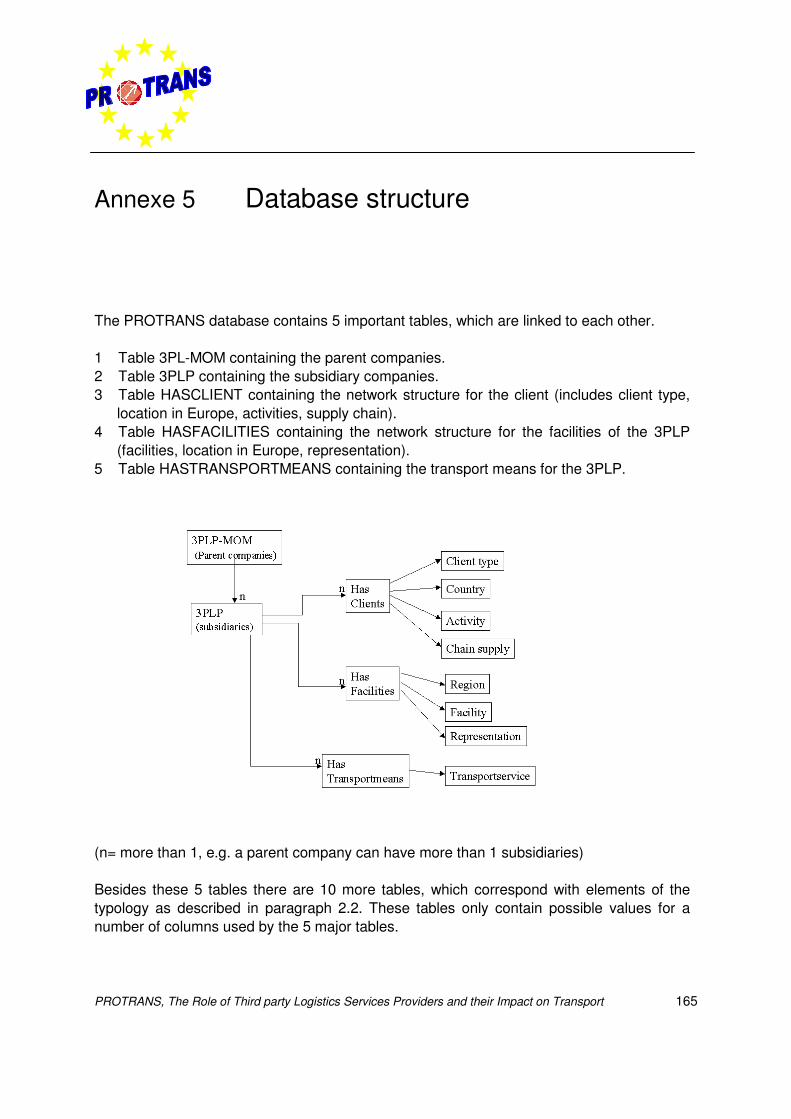
PROTRANS, The Role of Third party Logistics Services Providers and their Impact on Transport 165
Annexe 5 Database structure
The PROTRANS database contains 5 important tables, which are linked to each other.
1 Table 3PL-MOM containing the parent companies.2 Table 3PLP containing the subsidiary companies.3 Table HASCLIENT containing the network structure for the client (includes client type,
location in Europe, activities, supply chain).4 Table HASFACILITIES containing the network structure for the facilities of the 3PLP
(facilities, location in Europe, representation).5 Table HASTRANSPORTMEANS containing the transport means for the 3PLP.
(n= more than 1, e.g. a parent company can have more than 1 subsidiaries)
Besides these 5 tables there are 10 more tables, which correspond with elements of thetypology as described in paragraph 2.2. These tables only contain possible values for anumber of columns used by the 5 major tables.
PROTRANS, The Role of Third party Logistics Services Providers and their Impact on Transport166
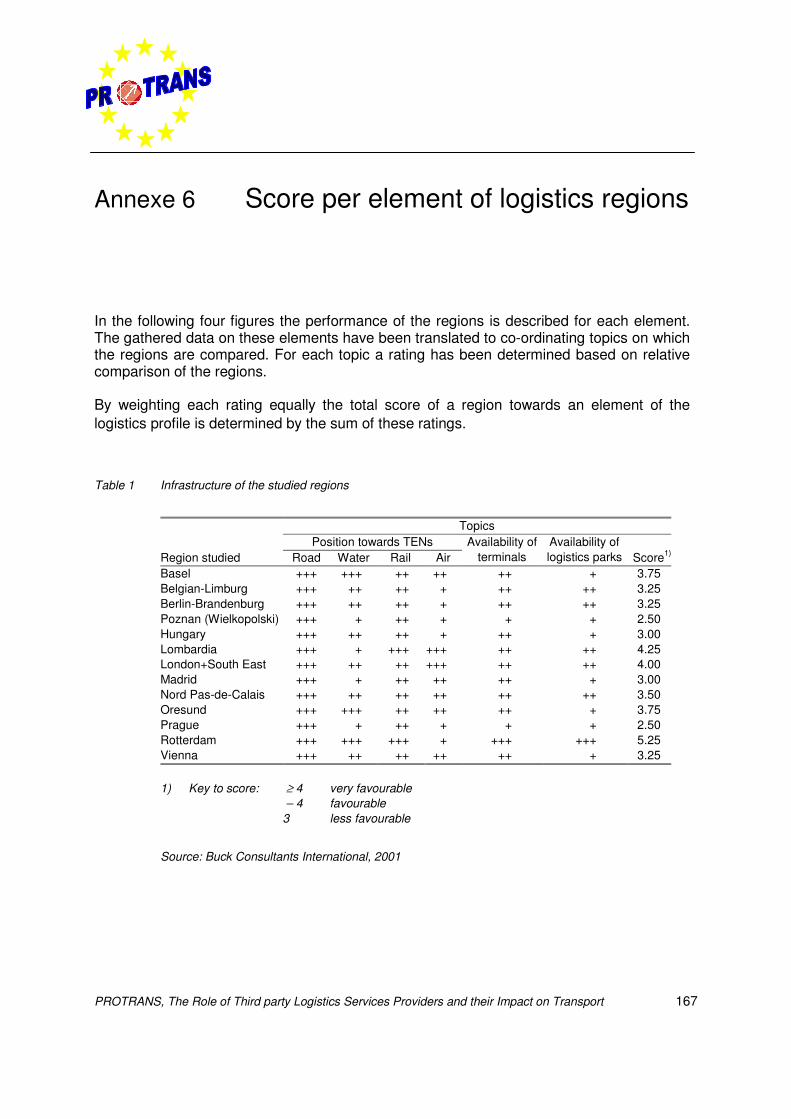
PROTRANS, The Role of Third party Logistics Services Providers and their Impact on Transport 167
Annexe 6 Score per element of logistics regions
In the following four figures the performance of the regions is described for each element.The gathered data on these elements have been translated to co-ordinating topics on whichthe regions are compared. For each topic a rating has been determined based on relativecomparison of the regions.
By weighting each rating equally the total score of a region towards an element of thelogistics profile is determined by the sum of these ratings.
Table 1 Infrastructure of the studied regions
TopicsPosition towards TENs
Region studied Road Water Rail AirAvailability of
terminalsAvailability oflogistics parks Score1)
Basel +++ +++ ++ ++ ++ + 3.75Belgian-Limburg +++ ++ ++ + ++ ++ 3.25Berlin-Brandenburg +++ ++ ++ + ++ ++ 3.25Poznan (Wielkopolski) +++ + ++ + + + 2.50Hungary +++ ++ ++ + ++ + 3.00Lombardia +++ + +++ +++ ++ ++ 4.25London+South East +++ ++ ++ +++ ++ ++ 4.00Madrid +++ + ++ ++ ++ + 3.00Nord Pas-de-Calais +++ ++ ++ ++ ++ ++ 3.50Oresund +++ +++ ++ ++ ++ + 3.75Prague +++ + ++ + + + 2.50Rotterdam +++ +++ +++ + +++ +++ 5.25Vienna +++ ++ ++ ++ ++ + 3.25
1) Key to score: ≥ 4 very favourable – 4 favourable3 less favourable
Source: Buck Consultants International, 2001
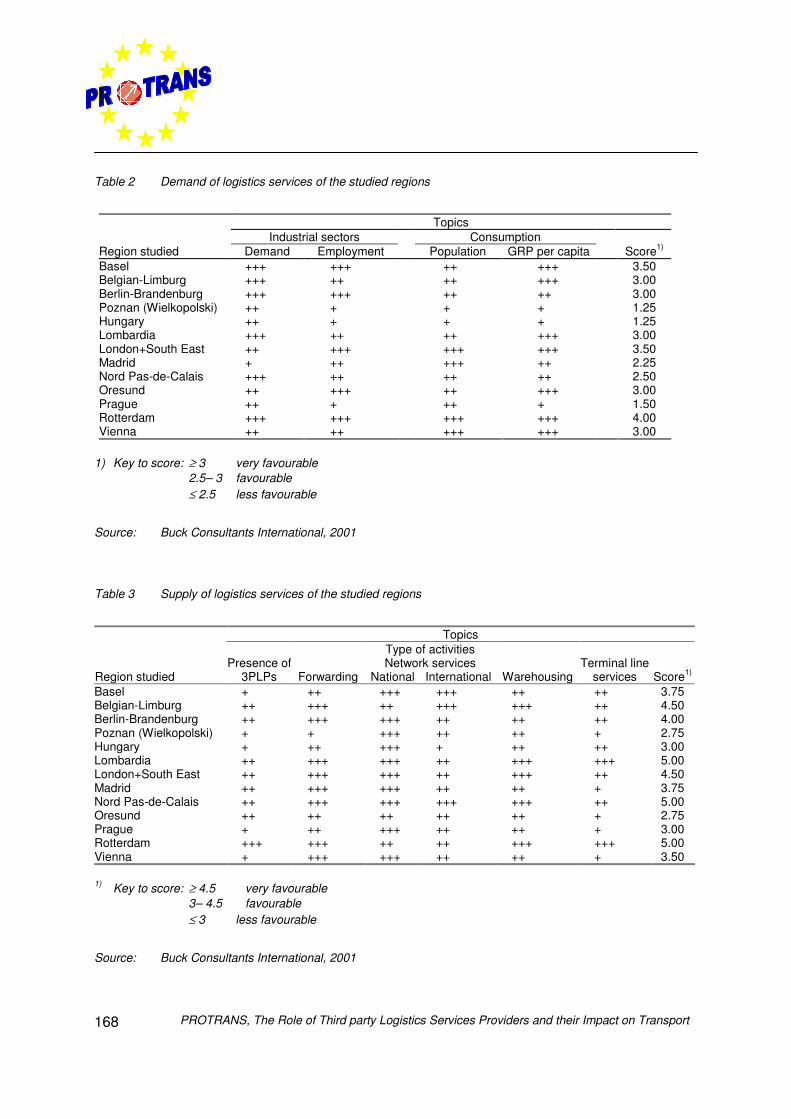
PROTRANS, The Role of Third party Logistics Services Providers and their Impact on Transport168
Table 2 Demand of logistics services of the studied regions
TopicsIndustrial sectors Consumption
Region studied Demand Employment Population GRP per capita Score1)
Basel +++ +++ ++ +++ 3.50Belgian-Limburg +++ ++ ++ +++ 3.00Berlin-Brandenburg +++ +++ ++ ++ 3.00Poznan (Wielkopolski) ++ + + + 1.25Hungary ++ + + + 1.25Lombardia +++ ++ ++ +++ 3.00London+South East ++ +++ +++ +++ 3.50Madrid + ++ +++ ++ 2.25Nord Pas-de-Calais +++ ++ ++ ++ 2.50Oresund ++ +++ ++ +++ 3.00Prague ++ + ++ + 1.50Rotterdam +++ +++ +++ +++ 4.00Vienna ++ ++ +++ +++ 3.00
1) Key to score: ≥ 3 very favourable2.5– 3 favourable≤ 2.5 less favourable
Source: Buck Consultants International, 2001
Table 3 Supply of logistics services of the studied regions
TopicsType of activitiesNetwork services
Region studiedPresence of
3PLPs Forwarding National International WarehousingTerminal line
services Score1)
Basel + ++ +++ +++ ++ ++ 3.75Belgian-Limburg ++ +++ ++ +++ +++ ++ 4.50Berlin-Brandenburg ++ +++ +++ ++ ++ ++ 4.00Poznan (Wielkopolski) + + +++ ++ ++ + 2.75Hungary + ++ +++ + ++ ++ 3.00Lombardia ++ +++ +++ ++ +++ +++ 5.00London+South East ++ +++ +++ ++ +++ ++ 4.50Madrid ++ +++ +++ ++ ++ + 3.75Nord Pas-de-Calais ++ +++ +++ +++ +++ ++ 5.00Oresund ++ ++ ++ ++ ++ + 2.75Prague + ++ +++ ++ ++ + 3.00Rotterdam +++ +++ ++ ++ +++ +++ 5.00Vienna + +++ +++ ++ ++ + 3.50
1) Key to score: ≥ 4.5 very favourable3– 4.5 favourable≤ 3 less favourable
Source: Buck Consultants International, 2001
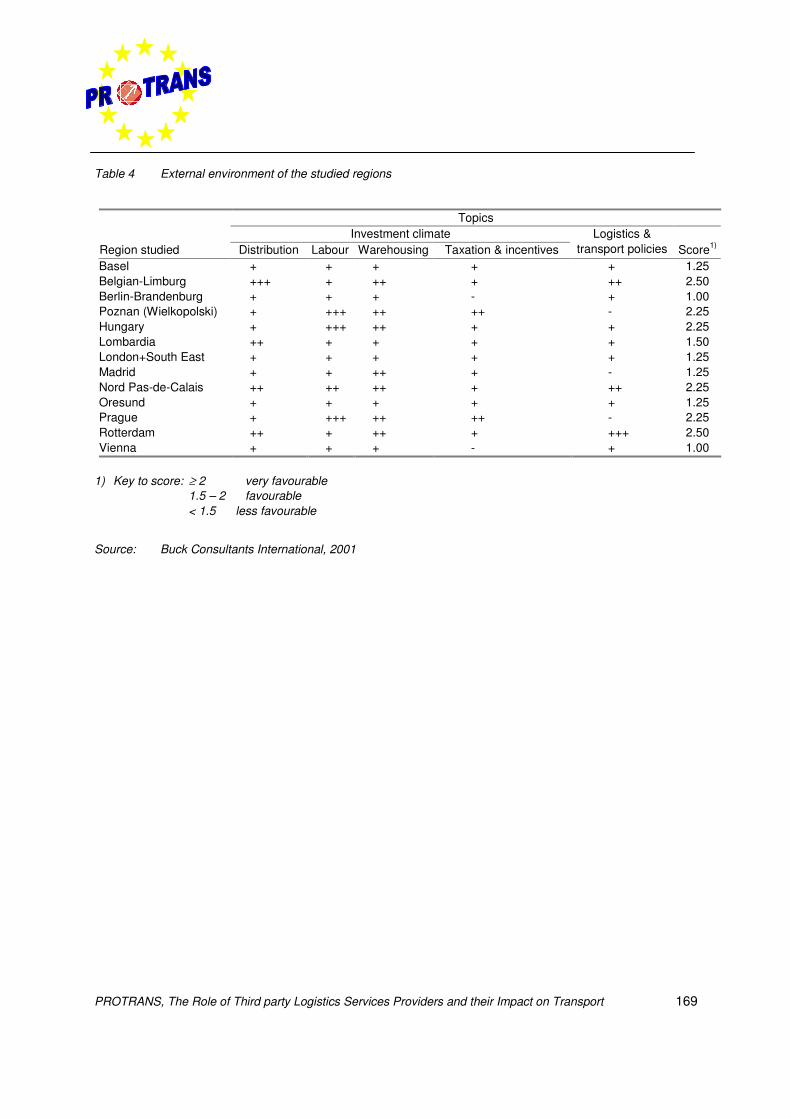
PROTRANS, The Role of Third party Logistics Services Providers and their Impact on Transport 169
Table 4 External environment of the studied regions
TopicsInvestment climate
Region studied Distribution Labour Warehousing Taxation & incentivesLogistics &
transport policies Score1)
Basel + + + + + 1.25Belgian-Limburg +++ + ++ + ++ 2.50Berlin-Brandenburg + + + - + 1.00Poznan (Wielkopolski) + +++ ++ ++ - 2.25Hungary + +++ ++ + + 2.25Lombardia ++ + + + + 1.50London+South East + + + + + 1.25Madrid + + ++ + - 1.25Nord Pas-de-Calais ++ ++ ++ + ++ 2.25Oresund + + + + + 1.25Prague + +++ ++ ++ - 2.25Rotterdam ++ + ++ + +++ 2.50Vienna + + + - + 1.00
1) Key to score: ≥ 2 very favourable1.5 – 2 favourable< 1.5 less favourable
Source: Buck Consultants International, 2001

PROTRANS, The Role of Third party Logistics Services Providers and their Impact on Transport170
PROTRANS, The Role of Third party Logistics Services Providers and their Impact on Transport 171
Annexe 7 Examples of 3PLP networks in Europe
In the PROTRANS project the regional presence of the following 10 major 3PLPs in Europehas been studied:
• Frans Maas• TPG• Exel• P&O• Geodis• Schenker• Danzas• UPS• Kuhne & Nagel• ABX
The insight in the regional presence is based on the forwarding, network and warehousingfacilities. Forwarding facilities are defined as branch offices of 3PLPs mainly focused atforwarding activities meaning the company does not physically handle the freight butorganises the process. Most of these activities are very much seaport or airport related.
Networking facilities are part of the physical distribution network of the 3PLP. Thesefacilities are focused on cross docking activities and temporary storage (no strategic longterm stock). Most networks are organised in the form of hub and spoke systems. The 3PLPoperates e.g. one or several main national hubs where shipments from various regions in acountry are received, broken down and cross docked. The main national hubs areconnected to hubs in other countries by line hauls (strict time regulated trucking services).The large integrators (e.g. TNT, UPS, DHL) have developed hub and spoke systems forparcel distribution. These form of networks have also been developed for larger shipments(e.g. groupage).
Finally warehousing facilities of 3PLPs have been studied. Warehousing facilities are 3PLPfacilities focused on long term storage activities for shippers (strategic stock locations). Thewarehouses may have a regional, (inter)national or pan-European coverage.
PROTRANS, The Role of Third party Logistics Services Providers and their Impact on Transport172
The facilities of the different types of 3PLPs have been studied. In table 1 a shortdescription of these types is provided.
Table 1 Description of types of 3PLPs
Type Scope Coverage Network ExamplesPan-Europeanplayers
Warehousing,distribution, groupage,express transport andspecialised forms oftransport
Europe Own network, withalliances to fill gaps
Danzas,Schenker, P&O,Kuhne & Nagel,Frans Maas,Panalpina
Home baseplayers
Warehousing,distribution, groupage,express transport andspecialised forms oftransport
Domestic market and alimited number ofsubsidiaries(particularly inneighbouring countries
ExpandingEuropean coverageby setting upalliances or jointventures
Mory, DFDS,Dachser, WimBosman
Integrators Express transport Europe Own network UPS, TNT, DHL
Warehousers Warehousingsometimes distribution,groupage and/or tankertransport
Often based in the UK,also active in otherparts of Europe
Independentoperation withinEurope, take overof local warehouses
Mayne Nickless,ChristianSalvesen, NFC,Nippon Express
Other nicheplayers
Specialised forms oftransports, bulktransport, bulk storage
Strong base in mothercountry, strategic takeovers abroad
Independentoperation withinEurope, expansionby acquisition
Pakhoed, TDG,United Transport,Vos Logistics
In the following figures the facilities of three 3PLPs are depicted.
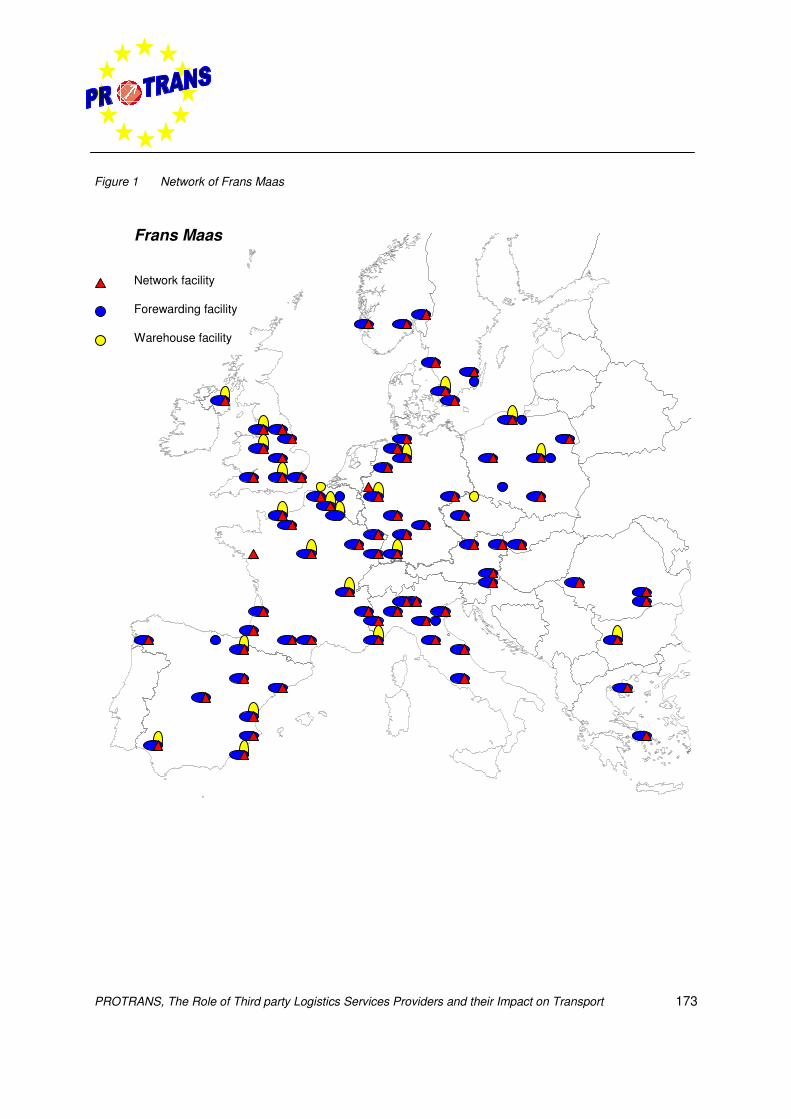
PROTRANS, The Role of Third party Logistics Services Providers and their Impact on Transport 173
Figure 1 Network of Frans Maas
Network facility
Forewarding facility
Warehouse facility
Frans Maas
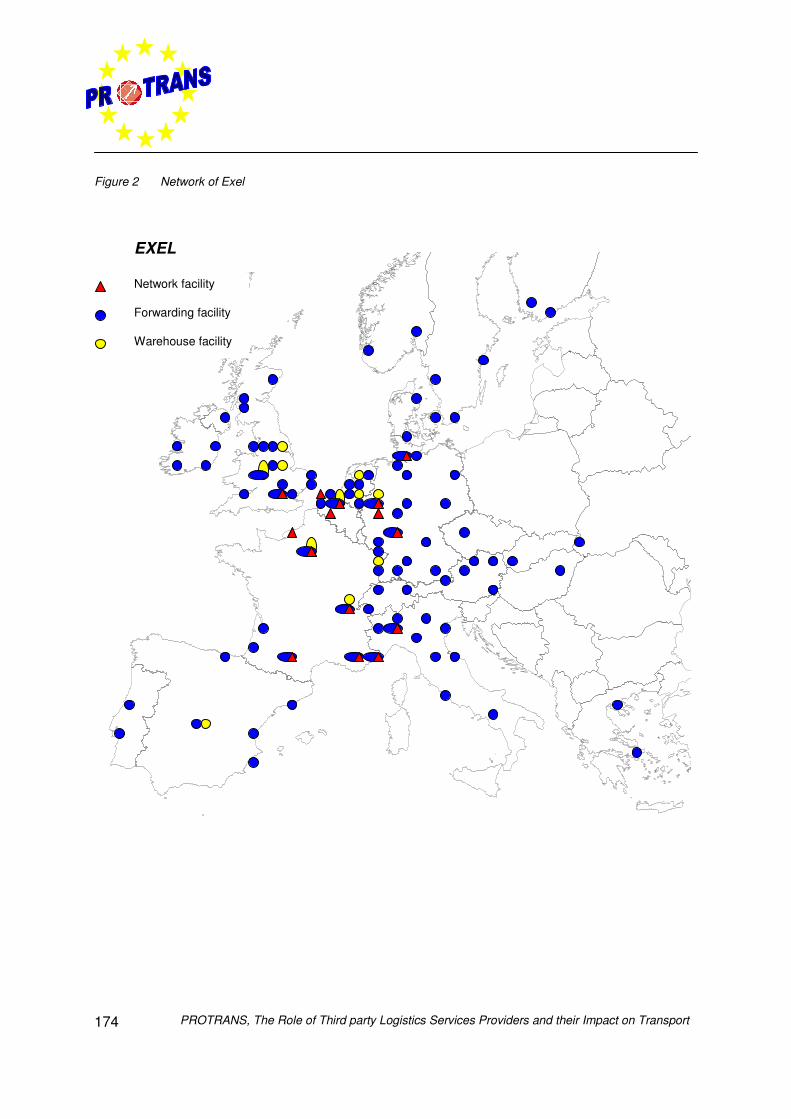
PROTRANS, The Role of Third party Logistics Services Providers and their Impact on Transport174
Figure 2 Network of Exel
Network facility
Forwarding facility
Warehouse facility
EXEL
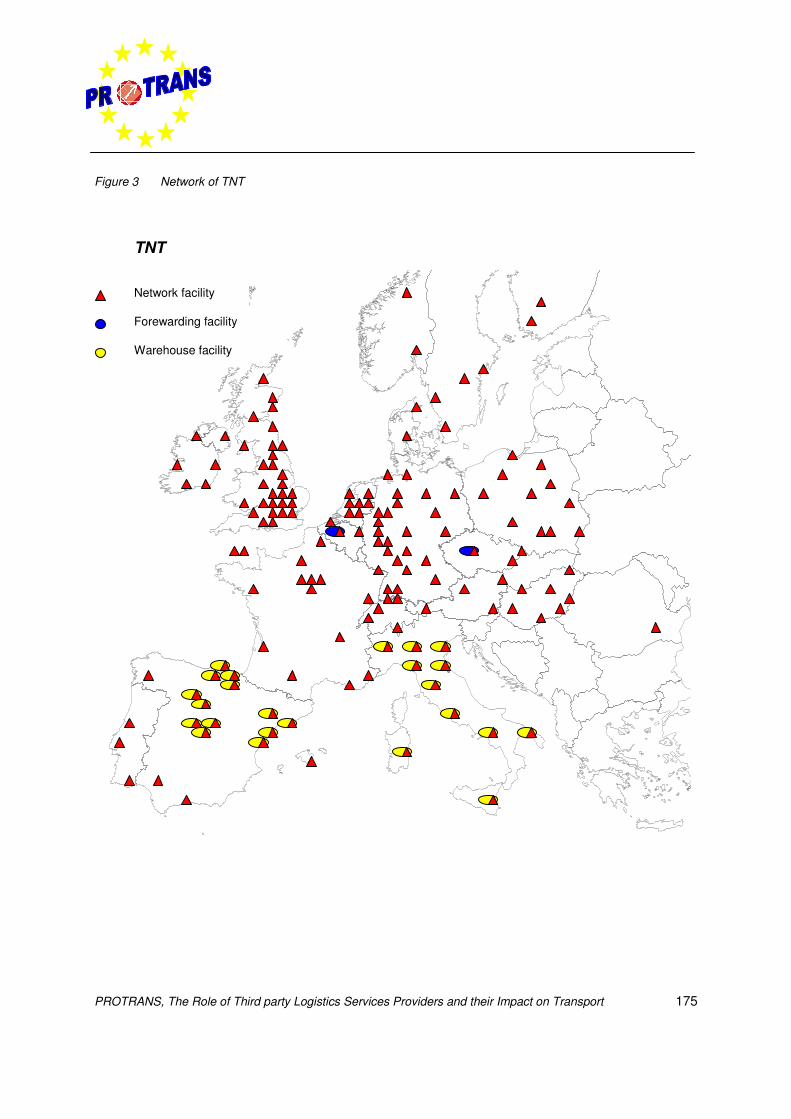
PROTRANS, The Role of Third party Logistics Services Providers and their Impact on Transport 175
Figure 3 Network of TNT
Network facility
Forewarding facility
Warehouse facility
TNT

PROTRANS, The Role of Third party Logistics Services Providers and their Impact on Transport176
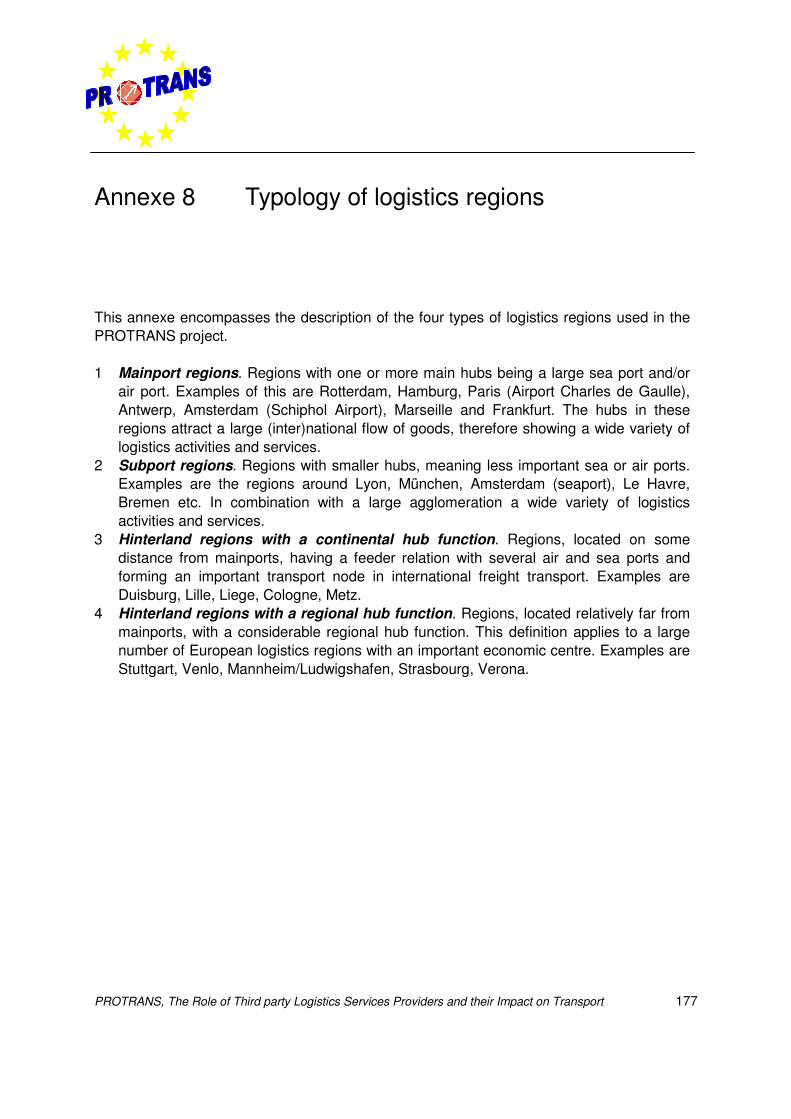
PROTRANS, The Role of Third party Logistics Services Providers and their Impact on Transport 177
Annexe 8 Typology of logistics regions
This annexe encompasses the description of the four types of logistics regions used in thePROTRANS project.
1 Mainport regions. Regions with one or more main hubs being a large sea port and/orair port. Examples of this are Rotterdam, Hamburg, Paris (Airport Charles de Gaulle),Antwerp, Amsterdam (Schiphol Airport), Marseille and Frankfurt. The hubs in theseregions attract a large (inter)national flow of goods, therefore showing a wide variety oflogistics activities and services.
2 Subport regions. Regions with smaller hubs, meaning less important sea or air ports.Examples are the regions around Lyon, München, Amsterdam (seaport), Le Havre,Bremen etc. In combination with a large agglomeration a wide variety of logisticsactivities and services.
3 Hinterland regions with a continental hub function. Regions, located on somedistance from mainports, having a feeder relation with several air and sea ports andforming an important transport node in international freight transport. Examples areDuisburg, Lille, Liege, Cologne, Metz.
4 Hinterland regions with a regional hub function. Regions, located relatively far frommainports, with a considerable regional hub function. This definition applies to a largenumber of European logistics regions with an important economic centre. Examples areStuttgart, Venlo, Mannheim/Ludwigshafen, Strasbourg, Verona.

PROTRANS, The Role of Third party Logistics Services Providers and their Impact on Transport178
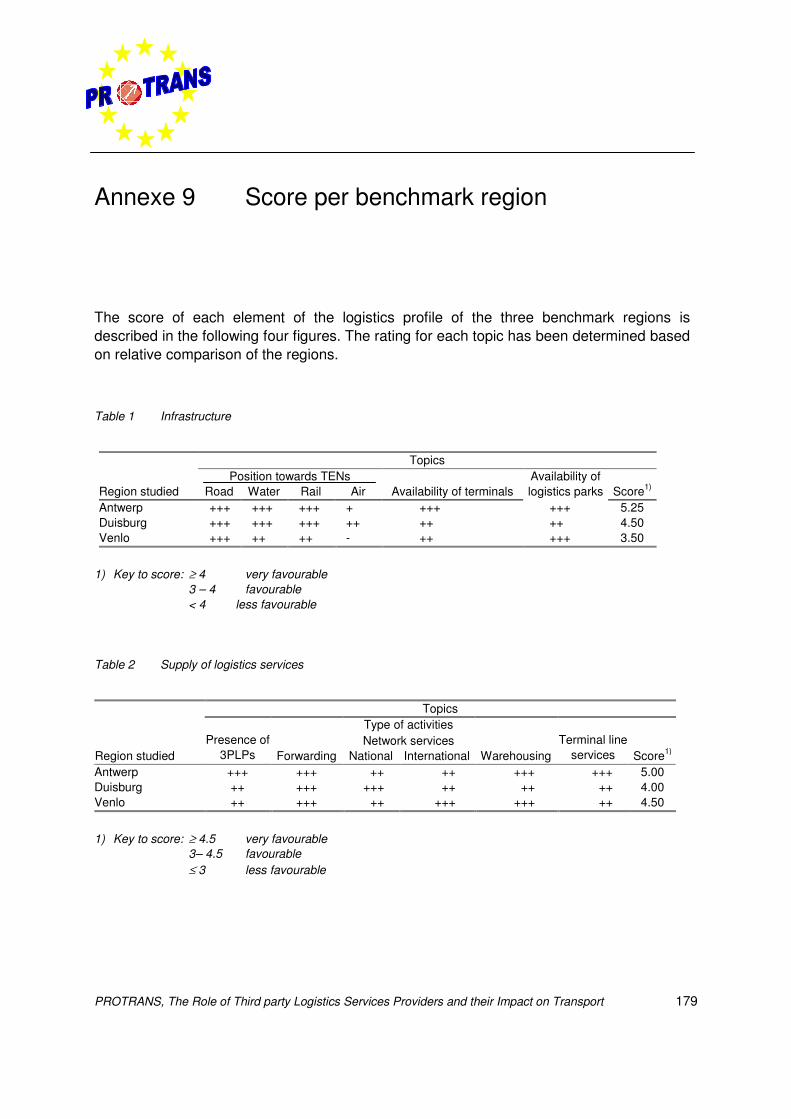
PROTRANS, The Role of Third party Logistics Services Providers and their Impact on Transport 179
Annexe 9 Score per benchmark region
The score of each element of the logistics profile of the three benchmark regions isdescribed in the following four figures. The rating for each topic has been determined basedon relative comparison of the regions.
Table 1 Infrastructure
TopicsPosition towards TENs Availability of
Region studied Road Water Rail Air Availability of terminals logistics parks Score1)
Antwerp +++ +++ +++ + +++ +++ 5.25Duisburg +++ +++ +++ ++ ++ ++ 4.50Venlo +++ ++ ++ - ++ +++ 3.50
1) Key to score: ≥ 4 very favourable3 – 4 favourable< 4 less favourable
Table 2 Supply of logistics services
TopicsType of activitiesNetwork services
Region studiedPresence of
3PLPs Forwarding National International WarehousingTerminal line
services Score1)
Antwerp +++ +++ ++ ++ +++ +++ 5.00Duisburg ++ +++ +++ ++ ++ ++ 4.00Venlo ++ +++ ++ +++ +++ ++ 4.50
1) Key to score: ≥ 4.5 very favourable3– 4.5 favourable≤ 3 less favourable
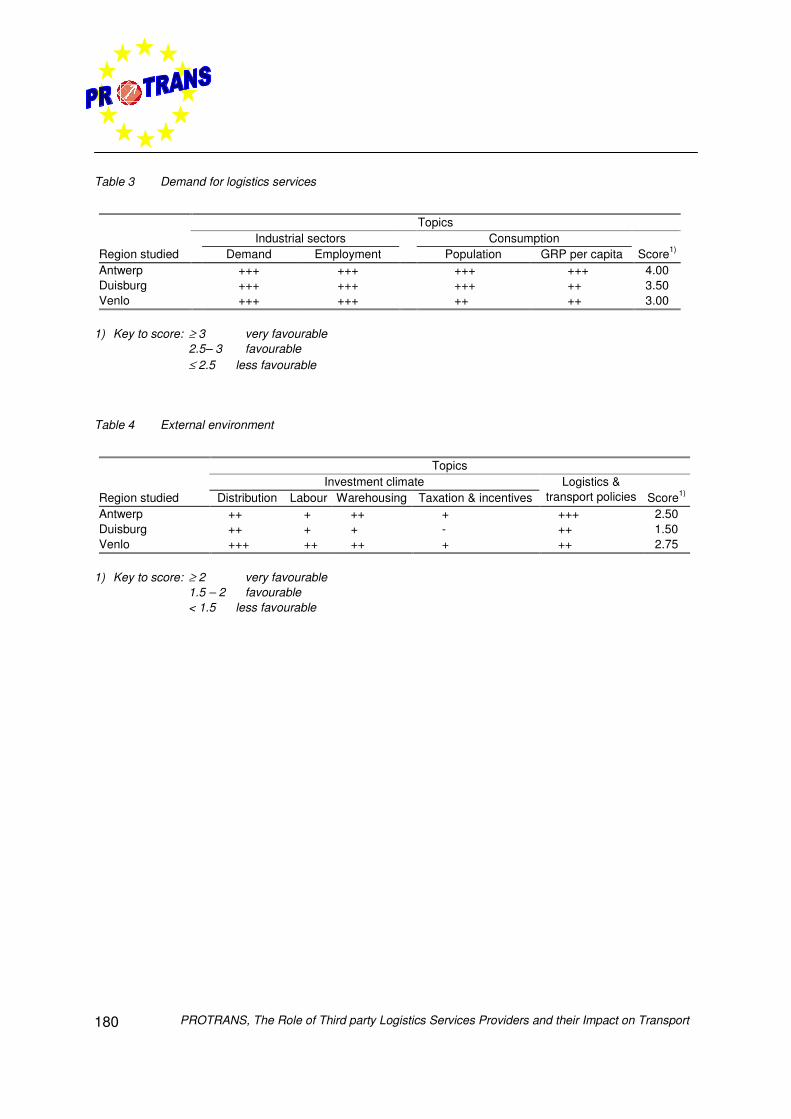
PROTRANS, The Role of Third party Logistics Services Providers and their Impact on Transport180
Table 3 Demand for logistics services
TopicsIndustrial sectors Consumption
Region studied Demand Employment Population GRP per capita Score1)
Antwerp +++ +++ +++ +++ 4.00Duisburg +++ +++ +++ ++ 3.50Venlo +++ +++ ++ ++ 3.00
1) Key to score: ≥ 3 very favourable2.5– 3 favourable≤ 2.5 less favourable
Table 4 External environment
TopicsInvestment climate
Region studied Distribution Labour Warehousing Taxation & incentivesLogistics &
transport policies Score1)
Antwerp ++ + ++ + +++ 2.50Duisburg ++ + + - ++ 1.50Venlo +++ ++ ++ + ++ 2.75
1) Key to score: ≥ 2 very favourable1.5 – 2 favourable< 1.5 less favourable
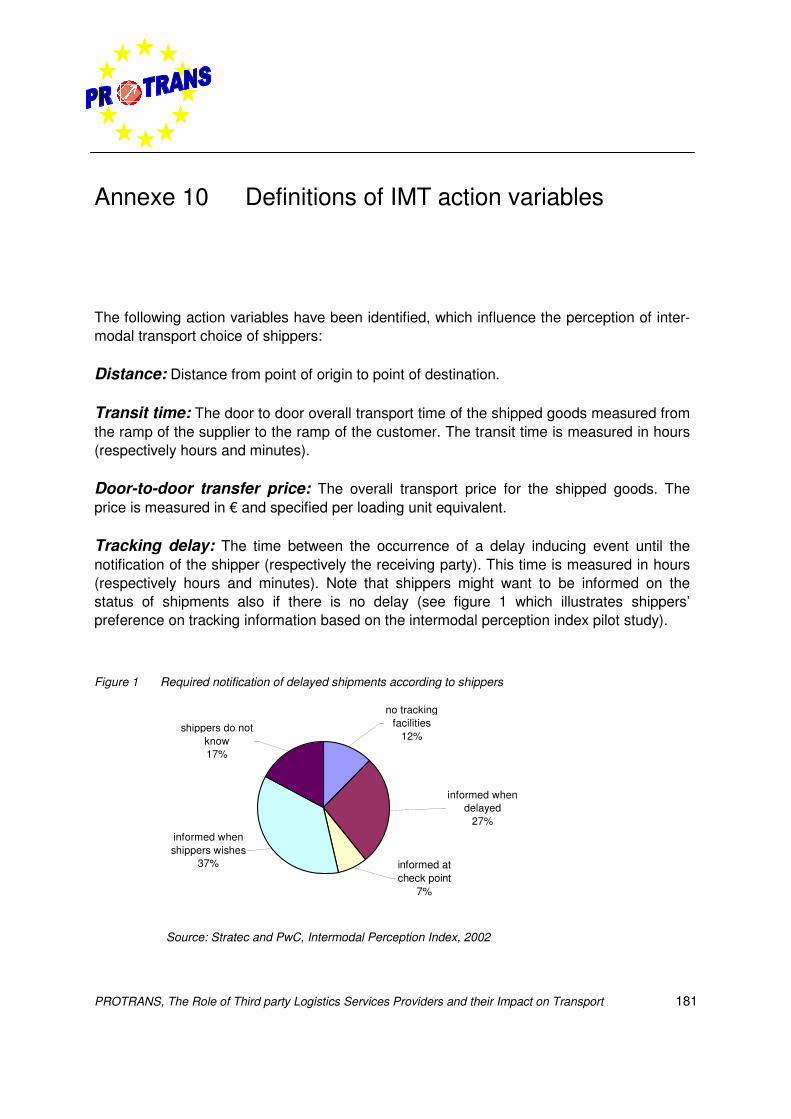
PROTRANS, The Role of Third party Logistics Services Providers and their Impact on Transport 181
Annexe 10 Definitions of IMT action variables
The following action variables have been identified, which influence the perception of inter-modal transport choice of shippers:
Distance: Distance from point of origin to point of destination.
Transit time: The door to door overall transport time of the shipped goods measured fromthe ramp of the supplier to the ramp of the customer. The transit time is measured in hours(respectively hours and minutes).
Door-to-door transfer price: The overall transport price for the shipped goods. Theprice is measured in € and specified per loading unit equivalent.
Tracking delay: The time between the occurrence of a delay inducing event until thenotification of the shipper (respectively the receiving party). This time is measured in hours(respectively hours and minutes). Note that shippers might want to be informed on thestatus of shipments also if there is no delay (see figure 1 which illustrates shippers’preference on tracking information based on the intermodal perception index pilot study).
Figure 1 Required notification of delayed shipments according to shippers
Source: Stratec and PwC, Intermodal Perception Index, 2002
informed when shippers wishes
37% informed at check point
7%
informed when delayed
27%
no tracking facilities
12%shippers do not
know17%
PROTRANS, The Role of Third party Logistics Services Providers and their Impact on Transport182
Reliability: Reliability in percentage of delayed shipments. The proportion of delayedshipments of the overall number of shipments during the period under consideration.Therefore it is necessary to define after what time a shipment is late. Note that this definitionvaries among the considered industries, enterprises and even within an enterprise amongthe shipped goods. For the purpose of the Stated Preference study, an average of 3 hourswas given as threshold based on an earlier study1.
Frequency: The number of possible shipments per week (e.g., only on Mondays, everyday, every two hours). The volume per shipment can differ and depends on the volume ofthe used loading unit.
Terminal proximity: The nearness of an intermodal transport terminal at the shipping siteand the destination site. Proximity is characterised qualitatively: onsite terminal, nearbyterminal or no terminal.
Own account transport activity (road only): Transport activities managed by a shipperhimself with his own fleet of trucks. This variable indicates whether or not the shipperoutsources the haulage.
1 PriceWaterhouseCoopers and Stratec. 1999). Integration of Intermodal Transport in the Supply Chain (ITT).
Project carried out for the European Commission , DG VII.
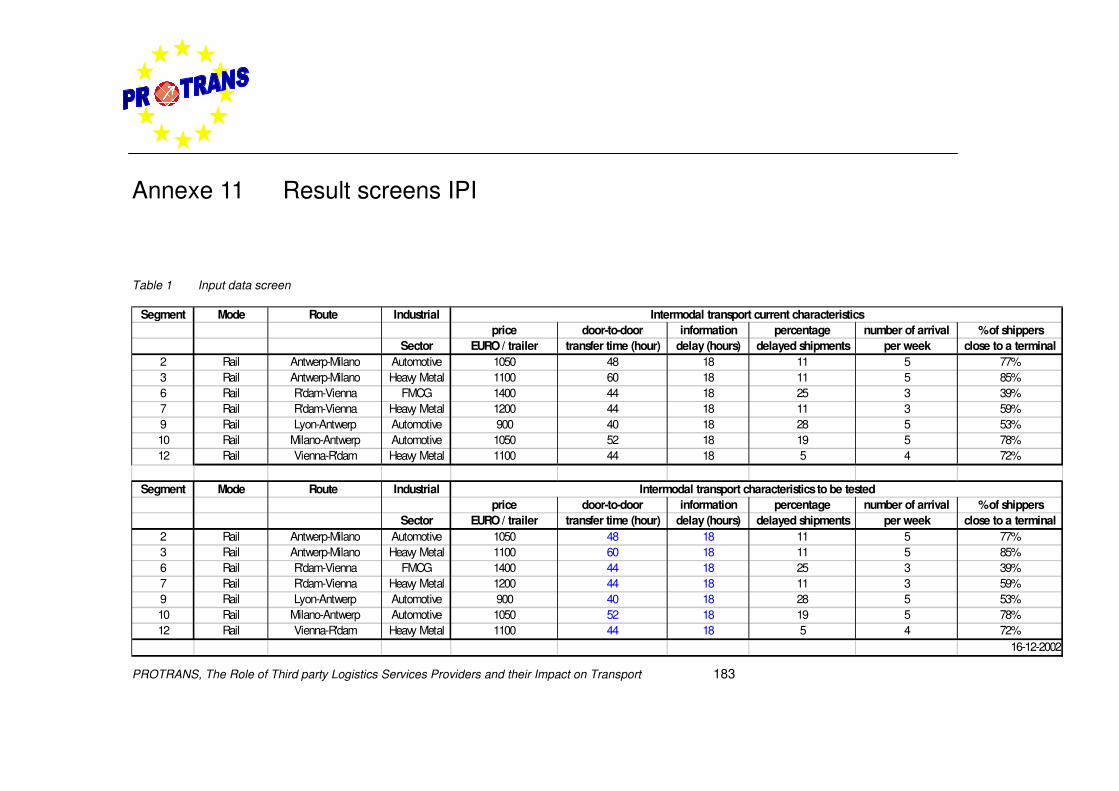
PROTRANS, The Role of Third party Logistics Services Providers and their Impact on Transport 183
Annexe 11 Result screens IPI
Table 1 Input data screen
Segment Mode Route Industrialprice door-to-door information percentage number of arrival % of shippers
Sector EURO / trailer transfer time (hour) delay (hours) delayed shipments per week close to a terminal2 Rail Antwerp-Milano Automotive 1050 48 18 11 5 77%3 Rail Antwerp-Milano Heavy Metal 1100 60 18 11 5 85%6 Rail R'dam-Vienna FMCG 1400 44 18 25 3 39%7 Rail R'dam-Vienna Heavy Metal 1200 44 18 11 3 59%9 Rail Lyon-Antwerp Automotive 900 40 18 28 5 53%10 Rail Milano-Antwerp Automotive 1050 52 18 19 5 78%12 Rail Vienna-R'dam Heavy Metal 1100 44 18 5 4 72%
16-12-2002
Intermodal transport current characteristics
Intermodal transport characteristics to be tested
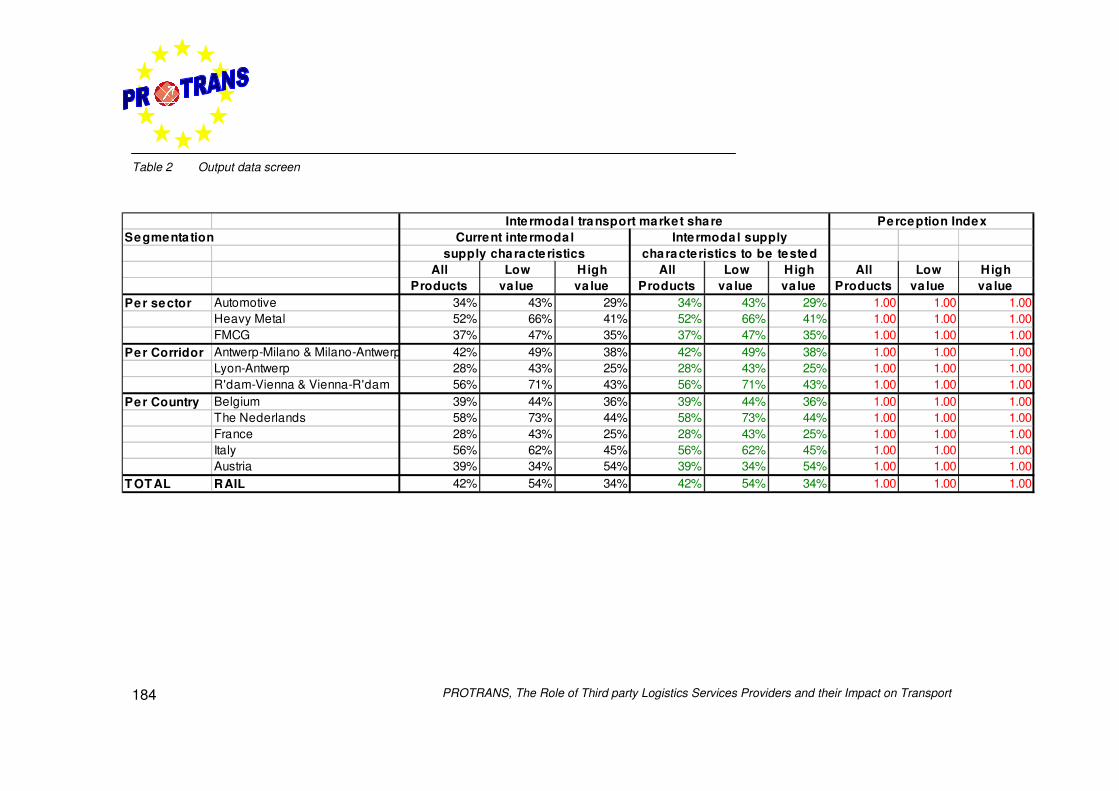
PROTRANS, The Role of Third party Logistics Services Providers and their Impact on Transport184
Table 2 Output data screen
Segmenta tion
All Low High All Low High All Low HighProducts va lue va lue Products va lue va lue Products va lue va lue
Per sector Automotive 34% 43% 29% 34% 43% 29% 1.00 1.00 1.00Heavy Metal 52% 66% 41% 52% 66% 41% 1.00 1.00 1.00FMCG 37% 47% 35% 37% 47% 35% 1.00 1.00 1.00
Per Corridor Antwerp-Milano & Milano-Antwerp 42% 49% 38% 42% 49% 38% 1.00 1.00 1.00Lyon-Antwerp 28% 43% 25% 28% 43% 25% 1.00 1.00 1.00R'dam-Vienna & Vienna-R'dam 56% 71% 43% 56% 71% 43% 1.00 1.00 1.00
Per Country Belgium 39% 44% 36% 39% 44% 36% 1.00 1.00 1.00The Nederlands 58% 73% 44% 58% 73% 44% 1.00 1.00 1.00France 28% 43% 25% 28% 43% 25% 1.00 1.00 1.00Italy 56% 62% 45% 56% 62% 45% 1.00 1.00 1.00Austria 39% 34% 54% 39% 34% 54% 1.00 1.00 1.00
T OTAL RAIL 42% 54% 34% 42% 54% 34% 1.00 1.00 1.00
Inte rmodal transport market share Perception IndexCurrent inte rmodal Intermodal supply
supply characte ristics characteristics to be tested
PROTRANS, The Role of Third party Logistics Services Providers and their Impact on Transport 185