Embed Size (px)
Citation preview

NIST Technical Note 1765
Prototype Residential Building Designs for Energy and
Sustainability Assessment
Joshua Kneifel
http://dx.doi.org/10.6028/NIST.TN.1765


NIST Technical Note 1765
Prototype Residential Building Designs for Energy and
Sustainability Assessment
Joshua Kneifel Applied Economics Office
Engineering Laboratory
http://dx.doi.org/10.6028/NIST.TN.1765
October 2012
U.S. Department of Commerce Rebecca Blank, Acting Secretary
National Institute of Standards and Technology
Patrick D. Gallagher, Under Secretary of Commerce for Standards and Technology and Director

Certain commercial entities, equipment, or materials may be identified in this
document in order to describe an experimental procedure or concept adequately. Such identification is not intended to imply recommendation or endorsement by the National Institute of Standards and Technology, nor is it intended to imply that the entities, materials, or equipment are necessarily the best available for the purpose.
National Institute of Standards and Technology Technical Note 1765 Natl. Inst. Stand. Technol. Tech. Note 1765, 45 pages (October 2012)
http://dx.doi.org/10.6028/NIST.TN.1765 CODEN: NTNOEF

i
Abstract
Residential building energy efficiency is becoming increasingly important in U.S. energy policy. Analyzing the effectiveness of potential energy efficiency improvements in the residential sector involves running whole building energy simulations for alternative building designs. Such analysis requires detailed building design characteristics including climate, fuel type, energy technologies, and design improvements. For broad studies of the U.S. residential sector, prototypical designs representing “typical” residential buildings are necessary to provide the basis for this detailed analysis.
This report defines two prototype detached residential house designs based on the 2009 International Energy Conservation Code (IECC). These prototypes can be used as baselines from which to analyze homes built to older IECC codes as well as to estimate the energy savings and sustainability impacts from increasing residential building energy efficiency beyond current state energy codes. These prototypes can also be used as a framework for developing additional prototype designs.
Keywords
Building economics; life-cycle costing; energy efficiency; residential building; prototype building designs; sustainability assessment

ii
iii
Preface
This study was conducted by the Applied Economics Office (AEO) in the Engineering Laboratory (EL) at the National Institute of Standards and Technology (NIST). The study is designed to document the assumptions and approaches implemented in creating two “prototypical” residential building designs to use as the basis for energy, life-cycle cost, and sustainability estimates for new and existing residential buildings. This document supersedes NIST TN 1688 for defining residential prototype designs. The intended audience is researchers in the residential building sector concerned with energy efficiency and sustainability.
Disclaimer
Certain trade names and company products are mentioned in the text in order to adequately specify the technical procedures and equipment used. In no case does such identification imply recommendation or endorsement by the National Institute of Standards and Technology, nor does it imply that the products are necessarily the best available for the purpose.
The policy of the National Institute of Standards and Technology is to use metric units in all of its published materials. Because this report is intended for the U.S. construction industry that uses U.S. customary units, it is more practical and less confusing to include U.S. customary units as well as metric units. Measurement values in this report are therefore stated in metric units first, followed by the corresponding values in U.S. customary units within parentheses.

iv

v
Acknowledgements
The author wishes to thank all those who contributed ideas and suggestions for this report. They include Ms. Barbara Lippiatt and Dr. Robert Chapman of EL’s Applied Economics Office, Dr. William Healy of EL’s Energy and Environment Division, Dr. Nicos S. Martys of EL’s Materials and Structural Systems Division, Philip Kerrigan of Building Science Corporation, and S. Craig Drumheller and Joseph Wiehagen of the National Association of Home Builders (NAHB) Research Center.
Author Information
Joshua D. Kneifel Economist National Institute of Standards and Technology 100 Bureau Drive, Mailstop 8603 Gaithersburg, MD 20899-8603 Tel.: 301-975-6857 Email: [email protected]

vi

vii
Contents
Abstract ............................................................................................................................... i Preface ............................................................................................................................... iii Acknowledgements ........................................................................................................... v Author Information .......................................................................................................... v List of Acronyms ............................................................................................................ xiii 1 Introduction ............................................................................................................... 1
1.1 Background .......................................................................................................... 1 1.2 Purpose ................................................................................................................. 1 1.3 Literature Review ................................................................................................. 1 1.4 Approach .............................................................................................................. 2
2 One-Story Building Design Specification................................................................ 5 2.1 Building Envelope ................................................................................................ 5
2.1.1 General Assumptions .................................................................................. 5 2.1.2 Climate Zone-Specific Assumptions .......................................................... 8
2.2 Heating, Ventilating, and Air Conditioning Equipment .................................... 10 2.3 Operating Conditions ......................................................................................... 10 2.4 Outdoor Air Ventilation and Infiltration ............................................................ 10 2.5 Domestic Hot Water ........................................................................................... 11 2.6 Lighting .............................................................................................................. 14 2.7 Appliances and Miscellaneous Electrical Loads ................................................ 16 2.8 Internal Mass ...................................................................................................... 17 2.9 Occupancy .......................................................................................................... 18 2.10 Internal Heat Gains............................................................................................. 18
3 Two-Story Building Design Specification ............................................................. 21 3.1 Building Envelope .............................................................................................. 21
3.1.1 General Assumptions ................................................................................ 21 3.1.2 Climate Zone-Specific Assumptions ........................................................ 24
3.2 Heating, Ventilating, and Air Conditioning Equipment .................................... 26 3.3 Operating Conditions ......................................................................................... 26 3.4 Air Infiltration and Mechanical Ventilation ....................................................... 26 3.5 Domestic Hot Water ........................................................................................... 27 3.6 Lighting .............................................................................................................. 30 3.7 Appliances and Miscellaneous Electrical Loads ................................................ 32 3.8 Internal Mass ...................................................................................................... 33 3.9 Occupancy .......................................................................................................... 34 3.10 Internal Heat Gains............................................................................................. 34
4 Recommendations for Future Research ............................................................... 37 References ........................................................................................................................ 39 A Appendix .................................................................................................................. 41

viii
ix
List of Figures
Figure 2-1 Building material layers for exterior wall ........................................................ 6 Figure 2-2 Building material layers for ceiling .................................................................. 7 Figure 2-3 Building material layers for roof ...................................................................... 7 Figure 2-4 Building material layers for slab-on-grade foundation .................................... 8 Figure 2-5 Domestic Hot Water Load Profiles as a Proportion of Peak Flow Rate, By Hour of the Day ................................................................................................................ 13 Figure 2-6 Electrical Equipment Load Profiles as a Proportion of Peak Wattage, By Hour of the Day .......................................................................................................................... 17 Figure 3-1 Building material layers for exterior wall ...................................................... 22 Figure 3-2 Building material layers for ceiling ................................................................ 23 Figure 3-3 Building material layers for roof .................................................................... 23 Figure 3-4 Building material layers for slab-on-grade foundation .................................. 24 Figure 3-5 Domestic Hot Water Load Profiles as a Proportion of Peak Flow Rate, By Hour of the Day ................................................................................................................ 29 Figure 3-6 Electrical Equipment Load Profiles as a Proportion of Peak Wattage, By Hour of the Day .......................................................................................................................... 33 Figure A-1 ASHRAE Climate Zones by County ............................................................. 41 Figure A-2 Conditioned Floor Area of New 1-Story Single-Family Housing ................ 42 Figure A-3 Conditioned Floor Area of New 2-Story Single-Family Housing ................ 43 Figure A-4 Conditioned Floor Area of New 1-Story Single-Family Housing by Number of Bedrooms ...................................................................................................................... 44 Figure A-5 Conditioned Floor Area of New 2-Story Single-Family Housing by Number of Bedrooms ...................................................................................................................... 45

x

xi
List of Tables
Table 2-1 Material Parameter Calculation Approach ........................................................ 5 Table 2-2 2009 IECC energy code requirements for exterior envelope ............................ 9 Table 2-3 Hot Water Consumption .................................................................................. 12 Table 2-4 Domestic Hot Water Daily Internal Heat Gains .............................................. 14 Table 2-5 Annual Lighting Electricity Consumption ...................................................... 15 Table 2-6 Lighting Load Profile as Proportion of Peak Wattage in Use, by Hour of the Day .................................................................................................................................... 15 Table 2-7 Appliance and MEL Electricity Consumption ................................................ 16 Table 2-8 Occupancy Load Profile as a Proportion of Maximum Occupancy, and Total Occupants, By Hour of the Day ........................................................................................ 18 Table 2-9 Daily Heat Gain Comparison-Reference and Prototype Designs.................... 19 Table 3-1 Material Parameter Calculation Approach ...................................................... 21 Table 3-2 2009 IECC energy code requirements for exterior envelope .......................... 25 Table 3-3 Hot Water Consumption .................................................................................. 28 Table 3-4 Domestic Hot Water Internal Heat Gains ........................................................ 30 Table 3-5 Annual Lighting Electricity Consumption ...................................................... 31 Table 3-6 Lighting Load Profiles as a Proportion of Peak Wattage in Use, By Hour of the Day .................................................................................................................................... 31 Table 3-7 Appliance and MEL Electricity Consumption ................................................ 32 Table 3-8 Occupancy Load Profile as a Proportion of Maximum Occupancy, and Total Occupants, By Hour of the Day ........................................................................................ 34 Table 3-9 Heat Gain Comparison-Reference and Prototype Designs ............................. 35 Table 4-1 Additional Prototype Sizes .............................................................................. 37

xii
xiii
List of Acronyms
Acronym Definition
ACH Air Changes Per HourAEO Applied Economics Office
AFUE Annual Fuel Utilization EfficiencyAHS American Housing SurveyASHRAE American Society of Heating, Refrigerating and Air-Conditioning EngineersBA Building AmericaCBECS Commercial Building Energy Consumption SurveyCFA Conditioned Floor AreaCFL Compact Fluorescent LightingCFM Cubic Feet Per MinuteDOE Department of Energy
E+ EnergyPlusEIA Energy Information AdministrationEL Engineering Laboaratory
ELA Effective Leakage AreaEPA Environmental Protection AgencyGWB Gypsum Wall BoardHVAC Heating, Ventilating, and Air Conditioning
IECC International Energy Conservation CodeLBL Lawrence Berkeley LaboratoryMEL Miscellanous Electric LoadNBR number of bedrooms
NAHB National Association of Home BuildersNIST National Institute of Standards and Technology
NREL National Renewable Energy LaboratoryOC On CenterPNNL Pacific Northwest National LaboratoryRECS Residential Energy Consumption SurveySEER Seasonal Energy Efficiency Ratio
SHGC Solar Heat Gain CoefficientSLA Specific Leakage Area

xiv
Acronym Definition
VT Visible TransmittanceXPS Extruded Polystyrene
1
1 Introduction
1.1 Background
Previous research on residential building energy efficiency has created energy modeling parameters for predicting energy use for both new and existing residential buildings. These studies specify a majority of the parameters required to create a residential building energy simulation model, which are useful when the building design is known. However, prototype residential building designs that represent “typical” residential buildings are required to consistently analyze and compare energy efficiency improvements across the U.S. building stock.
1.2 Purpose
The purpose of this report is twofold. First, it develops and documents prototype residential building designs. These prototype designs provide a consistent basis for running building energy simulations across the U.S. residential building stock for different climate zones and varying levels of energy efficiency.1 Second, this report can be used as a basis for adding more prototype building designs or for developing more detailed designs of the prototypes reported here.
1.3 Literature Review
Previous research on prototype building designs has focused on commercial buildings. The National Renewable Energy Laboratory (NREL) has documented 16 commercial prototypical buildings for each of 16 U.S. climate zones.2 These 256 reference commercial buildings are based on the Commercial Building Energy Consumption Survey (CBECS) database and the American Society of Heating, Refrigerating and Air-Conditioning Engineers (ASHRAE) 90.1 Standard, and represent greater than 70 % of the U.S. building stock. These prototypes have become the basis for significant research on energy efficiency measures in commercial buildings. Two reports from the Building America (BA) program of the Department of Energy (DOE) Building Technologies Program -- Hendron and Engebrecht (2010) and Hendron (2006) -- document the assumptions for energy efficiency performance comparison for new and existing residential buildings, respectively. These reports define total loads and load profiles for energy and water usage within a home based on the number of bedrooms, bathrooms, and square footage. Since the focus of this study is on new
1 This document supersedes NIST TN 1688 for defining residential prototype designs. 2 Field, Deru, and Studer (2010)

2
residential buildings, Hendron and Engebrecht (2010) will be a primary source of information for the prototype designs. Persily et al. (2007) define a suite of over 200 homes that represent approximately 80 % of the U.S. housing stock, including detached, attached, manufactured, and apartment buildings for use in indoor air quality research. The prototypes are based on the Residential Energy Consumption Survey (RECS) and American Housing Survey (AHS) databases. The study defines the conditioned floor area (CFA) and dimensions of 3 different detached homes: 107.0 m2 (1152 ft2), 180.4 m2 (1942 ft2), and 275.5 m2 (2966 ft2).3 Pacific Northwest National Laboratory (PNNL) published a report for the DOE Building Energy Codes Program that analyzes the state-level impacts of the adoption of 2009 IECC for residential buildings.4 The study uses EnergyGauge (based on the DOE-2 whole building energy simulation software) to determine the energy use and cost savings for a two-story, 223 m2 (2400 ft2) house.5 PNNL has created whole building energy simulations for two residential building designs, a single-family detached house and multifamily apartment building, based on the International Energy Conservation Code (IECC) Residential Code for One- and Two-Story Dwellings. EnergyPlus (E+) Version 5.0 energy simulations are generated for 119 locations, 3 editions of the IECC (2006, 2009, and 2012), four heating system types, and four foundation types for a total of 11 424 simulations. All simulations are available on the DOE Building Energy Codes Program website.6 As of August 2012, the documentation for the whole building energy simulation designs is not publically available. 1.4 Approach
The prototype residential building designs in this report are based on a number of sources, including the research described above by Building America. Additional resources are RS Means cost databases, U.S. Census and Energy Information Administration (EIA) housing stock data, and a collection of ASHRAE standards and IECC codes. The prototype buildings are designed in the E+ Version 7.1 simulation software.7
3 Persily et al. (2007) does not create 3-dimensional representations of the prototypical homes because it was not required for their analysis. 4 PNNL (2009) 5 The report does not specify the reasoning behind the building design selection. 6 Department of Energy (2012a) 7 Department of Energy (2012b)

3
Two prototypical residential building designs are documented in this report: one-story and two-story detached homes. The framework for these designs is the 2009 IECC Residential Code for One- and Two-Story Dwellings. IECC code defines the thermostat control, window specifications, exterior envelope R-values (m²-K/W), minimum lighting efficiency, maximum infiltration rates, mechanical ventilation, internal and structural mass, and heating, ventilating, and air-conditioning (HVAC) system requirements. Although 2009 IECC defines the general construction requirements, the code does not address the building’s plug loads, occupancy, or geometry. Also lacking are a number of small but important details and assumptions required to effectively simulate the energy use of a residential building. One source of this additional information is the Building America House Simulation Protocols (Hendron and Engebrecht, 2010), which is used for the annual loads, load profiles, and internal heat gains for lighting, occupancy, and domestic hot water as well as the outdoor air infiltration rate. Prototypical building size and geometry are selected based on three sources. The U.S. Census Bureau Survey of Construction is used to determine the square footage and number of bedrooms for one-story and two-story residential detached buildings. The Annual 2010 Characteristics of New Housing released by the U.S. Census Bureau’s Manufacturing, Mining, and Construction Statistics Division and RSMeans Square Foot Costs (2011) are used to determine appropriate prototype building geometries. Other codes and standards are needed to establish additional specifications: ASHRAE 90.2-2007, ASHRAE 62.2-2010, and the ASHRAE Fundamentals Handbook. Their use will be defined in detail where appropriate in the remainder of the document.

4

5
2 One-Story Building Design Specification
The first building design represents a typical 1-story, 3-bedroom, slab-on-grade detached house with no garage. This design was chosen because it is the simplest building design and can be used as the framework for more detailed single-story house designs. In the remainder of this section, each aspect of the building design and operation will be defined.
2.1 Building Envelope
Some building envelope assumptions are constant regardless of the building location’s climate while other assumptions are specific to the climate zones shown in Figure A-1, which is located in the appendix due to the size of the map. The following two subsections will define each set of assumptions separately.
2.1.1 General Assumptions
The prototype is a 2009 IECC compliant 1-story, 3-bedroom, slab-on-grade house. The dimensions are 19.5 m x 7.6 m (64 ft x 25 ft) for a total of 148.6 m2 (1,600 ft2) of conditioned floor area (CFA). The house is oriented 19.5 m (64 ft) east to west and 7.6 m (25 ft) north to south. The first floor has a 2.4 m (8 ft) high ceiling. The roof slope is assumed to be 4:12 with 0.3 m (1 ft) overhangs on the north and south sides of the building. There is assumed to be no garage in the prototype.
The house is built to meet 2009 IECC for low-rise residential buildings. The EnergyPlus parameters for the materials used in the exterior envelope (excluding the roof) are estimated using an average transmittance with the surface-weighted path fractions. In other words, using a simple weighted average of parameter values based on the percentage of framing in the surface. The roof controls for varying materials by splitting the roof into two separate surfaces. The framing percentage for each surface type is shown in Table 2-1.
Table 2-1 Material Parameter Calculation Approach
Construction Pct. Frame Approach
Exterior Wall 23 % surface-weighted path fractions
Ceiling 11 % surface-weighted path fractions
Roof 11 % split into separate surfaces
The exterior wall is assumed to be 3.8 cm x 8.9 cm (1.5 in. x 3.5 in.) wood-framed 41 cm (16 in.) on center (OC) with 9 cm (3.42 in.) of fiberglass batt cavity insulation having a
6
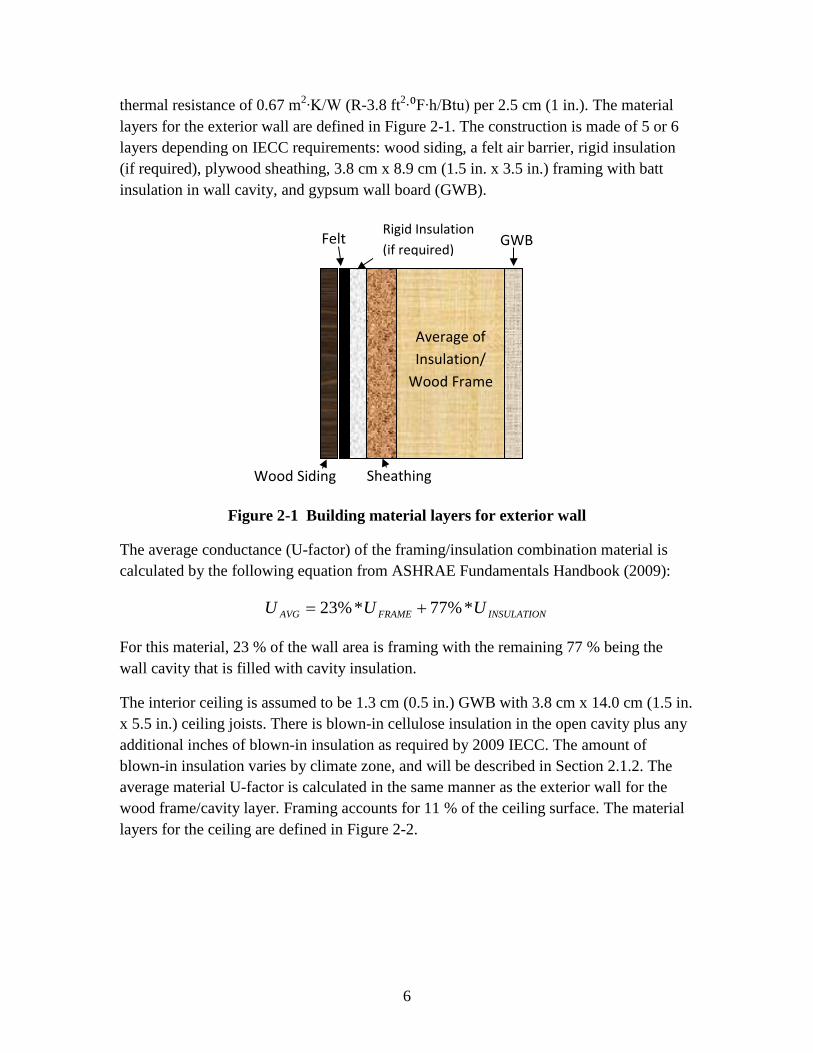
thermal resistance of 0.67 m2∙K/W (R-3.8 ft2∙⁰F∙h/Btu) per 2.5 cm (1 in.). The material layers for the exterior wall are defined in Figure 2-1. The construction is made of 5 or 6 layers depending on IECC requirements: wood siding, a felt air barrier, rigid insulation (if required), plywood sheathing, 3.8 cm x 8.9 cm (1.5 in. x 3.5 in.) framing with batt insulation in wall cavity, and gypsum wall board (GWB).
Figure 2-1 Building material layers for exterior wall
The average conductance (U-factor) of the framing/insulation combination material is calculated by the following equation from ASHRAE Fundamentals Handbook (2009):
INSULATIONFRAMEAVG UUU *%77*%23 +=
For this material, 23 % of the wall area is framing with the remaining 77 % being the wall cavity that is filled with cavity insulation.
The interior ceiling is assumed to be 1.3 cm (0.5 in.) GWB with 3.8 cm x 14.0 cm (1.5 in. x 5.5 in.) ceiling joists. There is blown-in cellulose insulation in the open cavity plus any additional inches of blown-in insulation as required by 2009 IECC. The amount of blown-in insulation varies by climate zone, and will be described in Section 2.1.2. The average material U-factor is calculated in the same manner as the exterior wall for the wood frame/cavity layer. Framing accounts for 11 % of the ceiling surface. The material layers for the ceiling are defined in Figure 2-2.
Sheathing
Felt
Average of Insulation/
Wood Frame
GWB
Wood Siding
Rigid Insulation (if required)
7
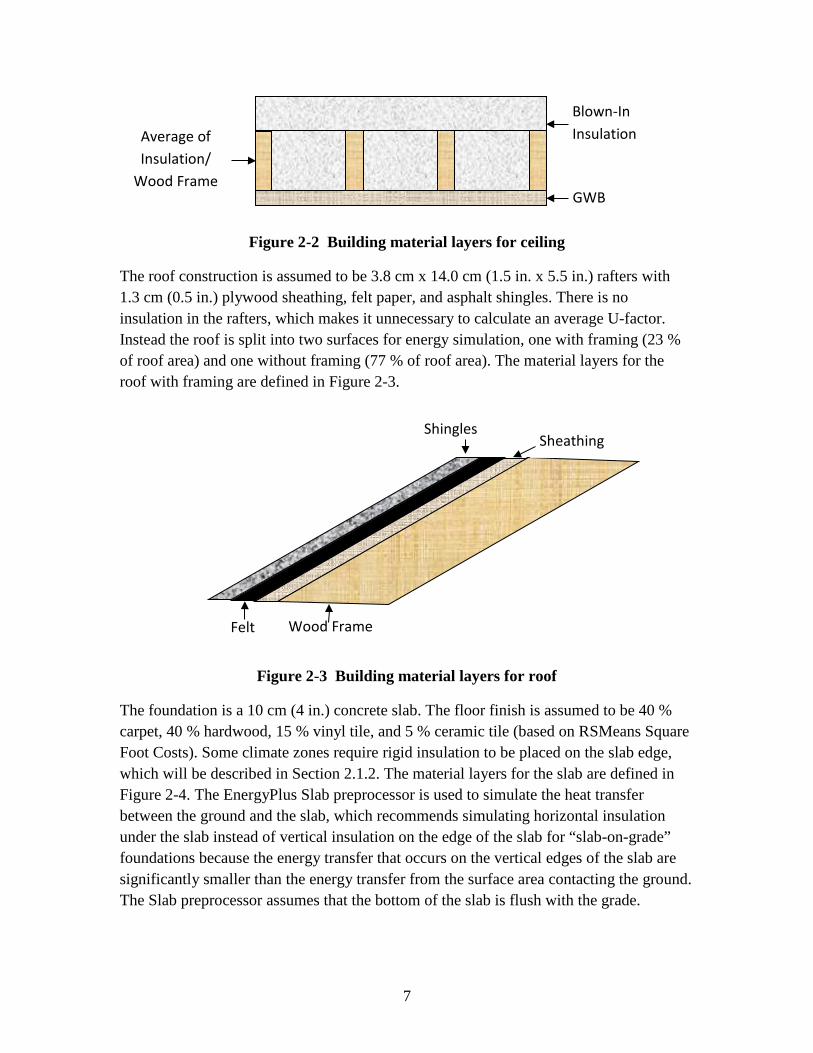
Figure 2-2 Building material layers for ceiling
The roof construction is assumed to be 3.8 cm x 14.0 cm (1.5 in. x 5.5 in.) rafters with 1.3 cm (0.5 in.) plywood sheathing, felt paper, and asphalt shingles. There is no insulation in the rafters, which makes it unnecessary to calculate an average U-factor. Instead the roof is split into two surfaces for energy simulation, one with framing (23 % of roof area) and one without framing (77 % of roof area). The material layers for the roof with framing are defined in Figure 2-3.
Figure 2-3 Building material layers for roof
The foundation is a 10 cm (4 in.) concrete slab. The floor finish is assumed to be 40 % carpet, 40 % hardwood, 15 % vinyl tile, and 5 % ceramic tile (based on RSMeans Square Foot Costs). Some climate zones require rigid insulation to be placed on the slab edge, which will be described in Section 2.1.2. The material layers for the slab are defined in Figure 2-4. The EnergyPlus Slab preprocessor is used to simulate the heat transfer between the ground and the slab, which recommends simulating horizontal insulation under the slab instead of vertical insulation on the edge of the slab for “slab-on-grade” foundations because the energy transfer that occurs on the vertical edges of the slab are significantly smaller than the energy transfer from the surface area contacting the ground. The Slab preprocessor assumes that the bottom of the slab is flush with the grade.
Blown-In Insulation
GWB
Average of Insulation/
Wood Frame
Shingles
Wood Frame
Sheathing
Felt

8
Figure 2-4 Building material layers for slab-on-grade foundation
Window glazing area is assumed to be 15 % of conditioned floor area and is split between the four exterior walls based on wall area. Two 1.2 m (4 ft) high windows on each side of the house (8 in total) are assumed to be located equal distance from the wall edge. The width of the windows is based on the fraction of total wall area represented by each side. There are assumed to be two 0.9 m x 2.0 m (3 ft x 6 ft 8 in.) x 4.4 cm (1.75 in.) solid pine wood doors, located in the center of the wall on the north and south walls. Windows are defined in EnergyPlus using the “Simple Glazing System,” which requires only 3 parameters: U-factor (W/ (m2∙K)), solar heat gain coefficient (SHGC), and visible transmittance (VT). These parameters vary by climate zone, and will be described in Section 2.1.2.
2.1.2 Climate Zone-Specific Assumptions
The exterior envelope performance requirements of 2009 IECC vary depending on the climate zone. Table 2-2 is an abridged version of Table 402.1.1 found in Chapter 4: Residential Energy Efficiency of the 2009 IECC. A map of the climate zones by county is found in the appendix.
Floor Finish
Concrete
Rigid Insulation (IECC Requirement)
Rigid Insulation (Simulated in E+)

9
Table 2-2 2009 IECC energy code requirements for exterior envelope
Climate Zone Fenestration
U-Factor (W/m2∙K)
Glazed Fenestration
SHGC
Ceiling R-Value
Wood Frame Wall R-Value Slab Edge R-Value
Slab Depth
1 1.2 0.30 5.3 (30) 2.3 (13) 0 (0) 0 (0)
2 0.65 0.30 5.3 (30) 2.3 (13) 0 (0) 0 (0)
3 0.50 0.30 5.3 (30) 2.3 (13) 0 (0) 0 (0)
4 except Marine 0.35 NR* 6.7 (38) 2.3 (13) 1.8 (10) 0.61 m (2 ft)
5 and 4 Marine 0.35 NR* 6.7 (38) 3.5 (20) or 2.3+0.88 (13+5)** 1.8 (10) 0.61 m (2 ft)
6 0.35 NR* 8.6 (49) 3.5 (20) or 2.3+0.88 (13+5)** 1.8 (10) 1.21 m (4 ft)
7 and 8 0.35 NR* 8.6 (49) 3.7 (21) 1.8 (10) 1.21 m (4 ft)
*NR = No Requirement **13+5 means R-13 cavity insulation plus R-5 insulated sheathing. Note: R-value Units = m2∙K/W (ft2∙⁰F∙h/Btu)
Although EnergyPlus requires three parameters for defining window performance, 2009 IECC only specifies two: U-factor and SHGC. The U-factor is restricted to below 1.2 in Zone 1 and becomes stricter the colder the climate zone, restricting the U-factor to below 0.35 in Zone 7 and Zone 8. The SHGC must be less than 0.30 for Zone 1 through Zone 3, but has no requirement for Zone 4 through Zone 8. The SHGC for the standard reference design specified in 2009 IECC is 0.40 for Zone 4 through Zone 8. The visible transmittance is not restricted in 2009 IECC for any climate zones, and is assumed to be 0.16 for Zone 1, 0.22 for Zone 2, 0.46 for Zone 3, and 0.40 for Zone 4 through Zone 8.8
The insulation R-values for the exterior walls, ceiling, and foundation increase as the climate zone gets colder. The exterior wall R-value ranges from R-13 in Zone 1 through Zone 4 to R-21 in Zone 7 and Zone 8. The first R-13 is met with high density cavity insulation in the wall cavity. Additional R-value is met by adding rigid insulation to the exterior of the wall. The ceiling R-value ranges from R-30 in Zone 1 through Zone 3 to R-49 in Zone 6 through Zone 8. Additional cellulose blown-in insulation is used to reach the required R-value. R-10 insulation under the foundation is required in Zone 4 through Zone 8 only, which is met by adding 2 in. of extruded polystyrene (XPS) below the slab.
8 Visible transmittance values are based on window characteristics defined in the ASHRAE Fundamentals Handbook (2009).
10
2.2 Heating, Ventilating, and Air Conditioning Equipment
The HVAC system in the prototype building design is a single-speed unitary system with an air conditioner with a seasonal energy efficiency ratio (SEER) rating of 13,9 and a gas furnace with annual fuel utilization efficiency (AFUE) of 78 % (both current minimum federal energy efficiency requirements). No dehumidification option or economizer is included in the system. The supply fan is assumed to cycle, and has a total efficiency of 70 %. The supply fan motor efficiency is 90 %. The ductwork is assumed to be within the conditioned space, which leads to zero energy loss from the ductwork. This assumption assists in simplifying the model, and will be relaxed in future research to account for split systems and the resulting duct leakage.10
2.3 Operating Conditions
The thermostat setpoints are based on the standard reference designs defined in 2009 IECC, which are 23.9°C (75°F) cooling and 22.2°C (72°F) heating.
2.4 Outdoor Air Ventilation and Infiltration
The prescriptive maximum air leakage of 7 air changes per hour at 50 pascals (ACH50) specified in Section 402.4.2.1 of the 2009 IECC is not defined under normal operating conditions. The air infiltration rate must be converted into effective leakage area (ELA), which requires two conversions. First, the ACH50 is converted into cubic feet per minute at 50 pascals (CFM50) based on the following equation.
𝐶𝐹𝑀50 = 𝐴𝐶𝐻50 ∗𝑉𝑜𝑙𝑢𝑚𝑒[𝑓𝑡3]
60= 7 ∗
1280060
= 1493
Second, the following equation from Lawrence Berkeley Laboratory (LBL) converts the CFM50 into an ELA of 520 cm2 (0.56 ft2).11
𝐸𝐿𝐴 =𝐶𝐹𝑀50
2700= 0.55 𝑓𝑡2 = 520 𝑐𝑚2
Previous editions of the IECC do not specify the air infiltration rate. The air infiltration rate for these prototypes will use the following equation from Hendron and Engebrecht
9 The 13 SEER rating converts to a Coefficient of Performance (COP) of 3.28 for the EnergyPlus simulation based on the following equation: 𝐶𝑂𝑃 = (−0.02 ∗ 𝑆𝐸𝐸𝑅2 + 1.12 ∗ 𝑆𝐸𝐸𝑅)/3.412. 10 The 2009 IECC prescriptive requirements include a duct tightness post-construction test showing duct leakage less than or equal to 226.5 L/min (8 CFM) per 9.29 m2 (100 ft2) at 25 Pascal (Pa). 11 LBL (2012)

11
(2010), where the ELA is the specific leakage area (SLA) multiplied by the conditioned floor area (CFA).12
𝐸𝐿𝐴 = 𝑆𝐿𝐴 ∗ 𝐶𝐹𝐴
Table 405.5.2(1) of the 2009 IECC specifies that for “residences with mechanical ventilation that are tested in accordance with ASHRAE 119, Section 5.1, the measured air exchange rate combined with the mechanical ventilation rate…shall not be less than” the ASHRAE 62.2-2010 minimum outdoor air flow rate.
The minimum mechanical ventilation rate based on ASHRAE Standard 62.2-2010 (liters per second) is calculated using ASHRAE 62.2-2010 equation 4.1b:
0.05 ∗ 𝑚2 + 3.5 ∗ (𝑁𝐵𝑅 + 1)
For the prototype design’s 148.6 m2 (1600 ft2) and 3 bedrooms, the total outdoor air rate is 0.022 m3 per second (46 CFM), which converts to 0.22 ACH. The 2009 IECC maximum air infiltration rate of 7 ACH50 can be converted into a relative natural air change per hour (ACHNAT) with the following equation from Environmental Protection Agency (EPA) (2001), where the LBL Factor ranges from 14 to 26 and the Location Factor ranges from 0.72 to 1.00.
𝐴𝐶𝐻𝑁𝐴𝑇 =𝐴𝐶𝐻50
𝐿𝐵𝐿 𝐹𝑎𝑐𝑡𝑜𝑟 ∗ 𝐿𝑜𝑐𝑎𝑡𝑖𝑜𝑛 𝐹𝑎𝑐𝑡𝑜𝑟
The ACHNAT will range between 0.27 and 0.50. Since the air infiltration ACH is always greater than the minimum ventilation rate defined in ASHRAE 62.2-2010, no mechanical ventilation is required.
Based on ASHRAE 90.2-2007, an additional 0.15 ACH is added to the model for occupant activity, such as window and door operation and running exhaust fans.13
Based on Hendron and Engebrecht (2010) and the 2009 IECC, the attic ventilation is equivalent to 1 unit per 300 units of the ceiling area, which converts to an effective leakage area (ELA) of 4955 cm2 (5.33 ft2).
2.5 Domestic Hot Water
The BA Protocol functions defined in Table 2-3 are used instead of 2009 IECC to estimate the hot water consumption of each piece of equipment and activities. Total hot water consumption based on the BA Protocol is 228 liters (60 gallons). These estimates
12 All values in the same units. 13 According to the ASHRAE Fundamentals Handbook, “In residences...air exchange associated with a door can be estimated based on air leakage through cracks between door and frame.”
12
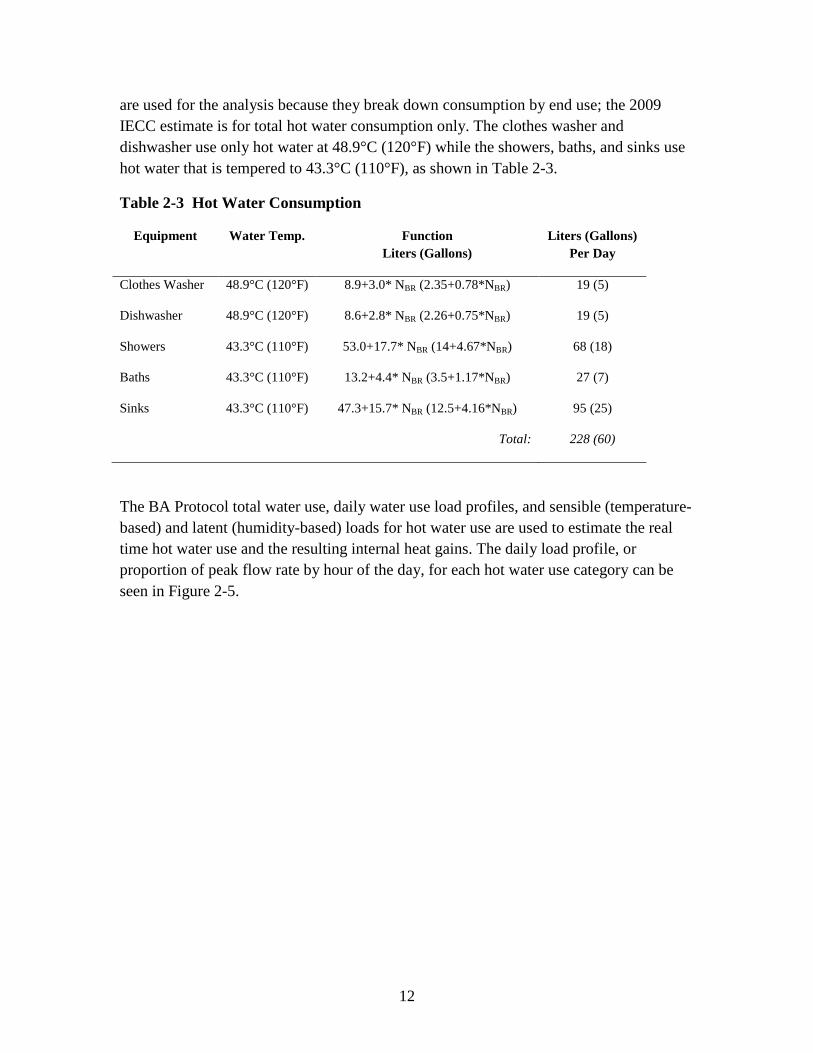
are used for the analysis because they break down consumption by end use; the 2009 IECC estimate is for total hot water consumption only. The clothes washer and dishwasher use only hot water at 48.9°C (120°F) while the showers, baths, and sinks use hot water that is tempered to 43.3°C (110°F), as shown in Table 2-3.
Table 2-3 Hot Water Consumption
Equipment Water Temp. Function Liters (Gallons)
Liters (Gallons) Per Day
Clothes Washer 48.9°C (120°F) 8.9+3.0* NBR (2.35+0.78*NBR) 19 (5)
Dishwasher 48.9°C (120°F) 8.6+2.8* NBR (2.26+0.75*NBR) 19 (5)
Showers 43.3°C (110°F) 53.0+17.7* NBR (14+4.67*NBR) 68 (18)
Baths 43.3°C (110°F) 13.2+4.4* NBR (3.5+1.17*NBR) 27 (7)
Sinks 43.3°C (110°F) 47.3+15.7* NBR (12.5+4.16*NBR) 95 (25)
Total: 228 (60)
The BA Protocol total water use, daily water use load profiles, and sensible (temperature-based) and latent (humidity-based) loads for hot water use are used to estimate the real time hot water use and the resulting internal heat gains. The daily load profile, or proportion of peak flow rate by hour of the day, for each hot water use category can be seen in Figure 2-5.

13
Figure 2-5 Domestic Hot Water Load Profiles as a Proportion of Peak Flow Rate, By Hour of the Day
Based on the BA Protocol, internal heat gains from hot water for the clothes washer and dishwasher are assumed to be zero for both sensible and latent loads. Any heat gains for this equipment are included in the equipment electricity use heat gains. The sensible and latent load fractions for shower, bath, and sinks are reverse engineered from internal heat gains estimated using the BA Protocol functions in Table 2-4.
0.0
0.2
0.4
0.6
0.8
1.0
1 3 5 7 9 11 13 15 17 19 21 23
Clothes Washer
0.0
0.2
0.4
0.6
0.8
1.0
1 3 5 7 9 11 13 15 17 19 21 23
Dish Washer
0.0
0.2
0.4
0.6
0.8
1.0
1 3 5 7 9 11 13 15 17 19 21 23
Bath
0.0
0.2
0.4
0.6
0.8
1.0
1 3 5 7 9 11 13 15 17 19 21 23
Shower
0.0
0.5
1.0
1 3 5 7 9 11 13 15 17 19 21 23
Sinks

14
Table 2-4 Domestic Hot Water Daily Internal Heat Gains
Equipment End Use
Sensible Load Latent Load
Function kWh (Btu)
Heat Gain kWh (Btu)
Load Fraction
Function kWh (Btu)
Heat Gain kWh (Btu)
Load Fraction
Showers 0.22+0.07*NBR (741+247*NBR)
0.4 (1482) 0.1947 0.21+0.07* NBR (703+235*NBR)
0.4 (1408) 0.0055
Baths 0.05+0.02* NBR (185+62*NBR)
0.4 (1371) 0.7262 0 (0) 0 (0) 0.0000
Sinks 0.09+0.03*NBR (310+103*NBR)
0.2 (619) 0.0917 0.04+0.01* NBR (140+47*NBR)
0.1 (281) 0.0012
Based on 2009 IECC, the water heater must meet federal energy efficiency requirements. The water heater is assumed to be a gas water heater with a perfectly mixed storage tank with an efficiency of 76 %,14 a firing rate of 10 554 W,15 and a setpoint temperature of 48.9°C (120°F). The heat loss coefficient from the water heater to the ambient temperature in the internal space is assumed to be 2.1 W/K.16
2.6 Lighting
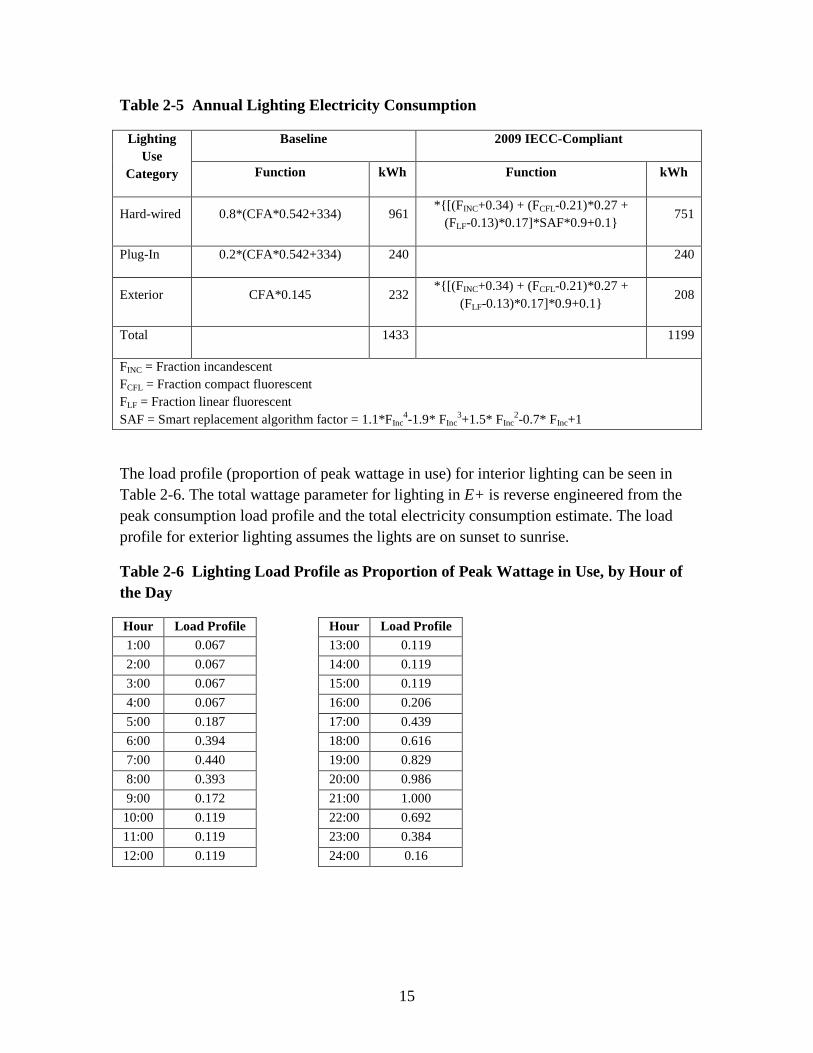
The lighting load profiles and electricity consumption are based on the simplest profile in the BA Protocol, which varies by time of day, but not from day to day. Total electricity use is estimated based on the two-stage process defined in the BA Protocol as expressed in Table 2-5. The baseline lighting estimate is based on 66 % incandescent, 21 % compact fluorescent (CFL), and 13 % T-8 linear fluorescent use. The lighting requirements in 2009 IECC require 50 % high efficacy lights for all hard-wired lighting, which is met by shifting 16 % of all hard-wired lighting from incandescent to CFL. The BA Protocol adjustment functions shown on the right in Table 2-5 are used to adjust the total electricity consumption estimate to represent the greater efficiency required by 2009 IECC. The baseline total lighting electricity consumption is estimated at 1918 kWh. The 2009 IECC-compliant lighting decreases lighting electricity consumption by 22 %.
14 Minimum federal efficiency requirement for gas water heaters. 15 Based on the BA Benchmark for a 3 bedroom/2 bathroom house with a gas unit. 16 Based on NIST expert recommendation.
15
Table 2-5 Annual Lighting Electricity Consumption
Lighting Use
Category
Baseline 2009 IECC-Compliant
Function kWh Function kWh
Hard-wired 0.8*(CFA*0.542+334) 961 *{[(FINC+0.34) + (FCFL-0.21)*0.27 +
(FLF-0.13)*0.17]*SAF*0.9+0.1} 751
Plug-In 0.2*(CFA*0.542+334) 240 240
Exterior CFA*0.145 232 *{[(FINC+0.34) + (FCFL-0.21)*0.27 +
(FLF-0.13)*0.17]*0.9+0.1} 208
Total 1433 1199
FINC = Fraction incandescent FCFL = Fraction compact fluorescent FLF = Fraction linear fluorescent SAF = Smart replacement algorithm factor = 1.1*FInc
4-1.9* FInc3+1.5* FInc
2-0.7* FInc+1
The load profile (proportion of peak wattage in use) for interior lighting can be seen in Table 2-6. The total wattage parameter for lighting in E+ is reverse engineered from the peak consumption load profile and the total electricity consumption estimate. The load profile for exterior lighting assumes the lights are on sunset to sunrise.
Table 2-6 Lighting Load Profile as Proportion of Peak Wattage in Use, by Hour of the Day
Hour Load Profile Hour Load Profile 1:00 0.067 13:00 0.119 2:00 0.067 14:00 0.119 3:00 0.067 15:00 0.119 4:00 0.067 16:00 0.206 5:00 0.187 17:00 0.439 6:00 0.394 18:00 0.616 7:00 0.440 19:00 0.829 8:00 0.393 20:00 0.986 9:00 0.172 21:00 1.000
10:00 0.119 22:00 0.692 11:00 0.119 23:00 0.384 12:00 0.119 24:00 0.16

16
Monthly multipliers defined in Hendron and Engebrecht (2010) are used to account for the variation across the year in lighting use. The load profile in Table 2-6 is adjusted by the multiplier for each month.
2.7 Appliances and Miscellaneous Electrical Loads
The electrical equipment in the house includes a refrigerator, clothes washer, clothes dryer, dishwasher, electric range, and a combination of variable miscellaneous electrical loads (MELs). MELs encompass electronics such as computers, televisions, stereos, and other plug loads. The electricity consumption for each category is based on the BA Protocol functions seen in Table 2-7. Electricity consumption is usually a function of the number of bedrooms in the home (NBR).
Table 2-7 Appliance and MEL Electricity Consumption
Equipment Function kWh
Refrigerator Constant 434
Clothes Washer 38.8+12.9*NBR 78
Clothes Dryer 538.2+179.4* NBR 1076
Dishwasher 87.6+29.2* NBR 175
Electric Range 250+83* NBR 499
Variable MELs 1703+ (266* NBR) + (0.454*CFA) 3227
Total: 5489
Source: Hendron and Engebrecht (2010)
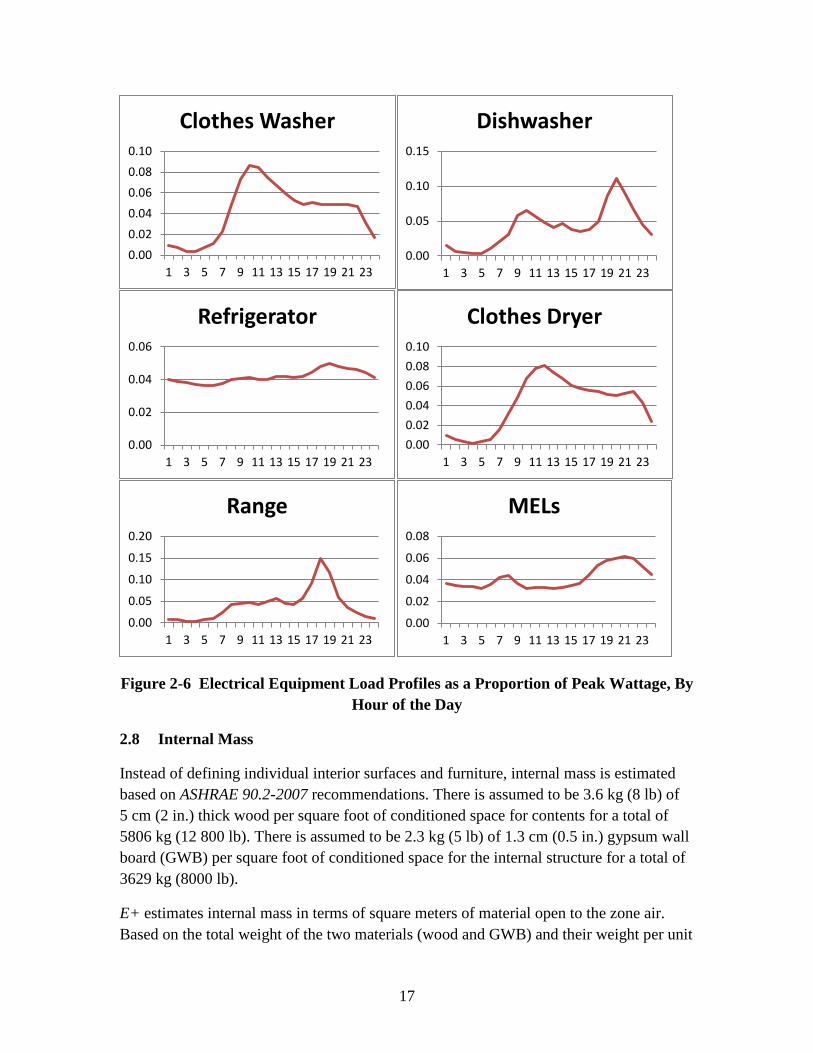
The BA Protocol load profiles in Figure 2-6 create a real-time variation in electricity consumption for each category. Appliances such as the electric range and dishwasher have a significant variation in time-of-day use while refrigerator use only varies slightly over a day.
17
Figure 2-6 Electrical Equipment Load Profiles as a Proportion of Peak Wattage, By Hour of the Day
2.8 Internal Mass
Instead of defining individual interior surfaces and furniture, internal mass is estimated based on ASHRAE 90.2-2007 recommendations. There is assumed to be 3.6 kg (8 lb) of 5 cm (2 in.) thick wood per square foot of conditioned space for contents for a total of 5806 kg (12 800 lb). There is assumed to be 2.3 kg (5 lb) of 1.3 cm (0.5 in.) gypsum wall board (GWB) per square foot of conditioned space for the internal structure for a total of 3629 kg (8000 lb).
E+ estimates internal mass in terms of square meters of material open to the zone air. Based on the total weight of the two materials (wood and GWB) and their weight per unit
0.000.020.040.060.080.10
1 3 5 7 9 11 13 15 17 19 21 23
Clothes Washer
0.00
0.05
0.10
0.15
1 3 5 7 9 11 13 15 17 19 21 23
Dishwasher
0.00
0.02
0.04
0.06
1 3 5 7 9 11 13 15 17 19 21 23
Refrigerator
0.000.020.040.060.080.10
1 3 5 7 9 11 13 15 17 19 21 23
Clothes Dryer
0.00
0.05
0.10
0.15
0.20
1 3 5 7 9 11 13 15 17 19 21 23
Range
0.00
0.02
0.04
0.06
0.08
1 3 5 7 9 11 13 15 17 19 21 23
MELs

18
of thickness, it is possible to determine the comparable surface area needed to match the amount of internal mass required. Assuming the wood density is equivalent to that of white oak, 753 kg/m3 (47 lb/ft3), the 5 cm (2 in.) thick wood weighs 38 kg/m2 (7.833 lb/ft2) and would require 151.8 m2 (1634 ft2) of content mass. Assuming GWB density of 10 kg/m2 (2.08 lb/ft2), a total of 357.3 m2 (3846 ft2) of structural mass is required to meet the standard recommendation.
2.9 Occupancy
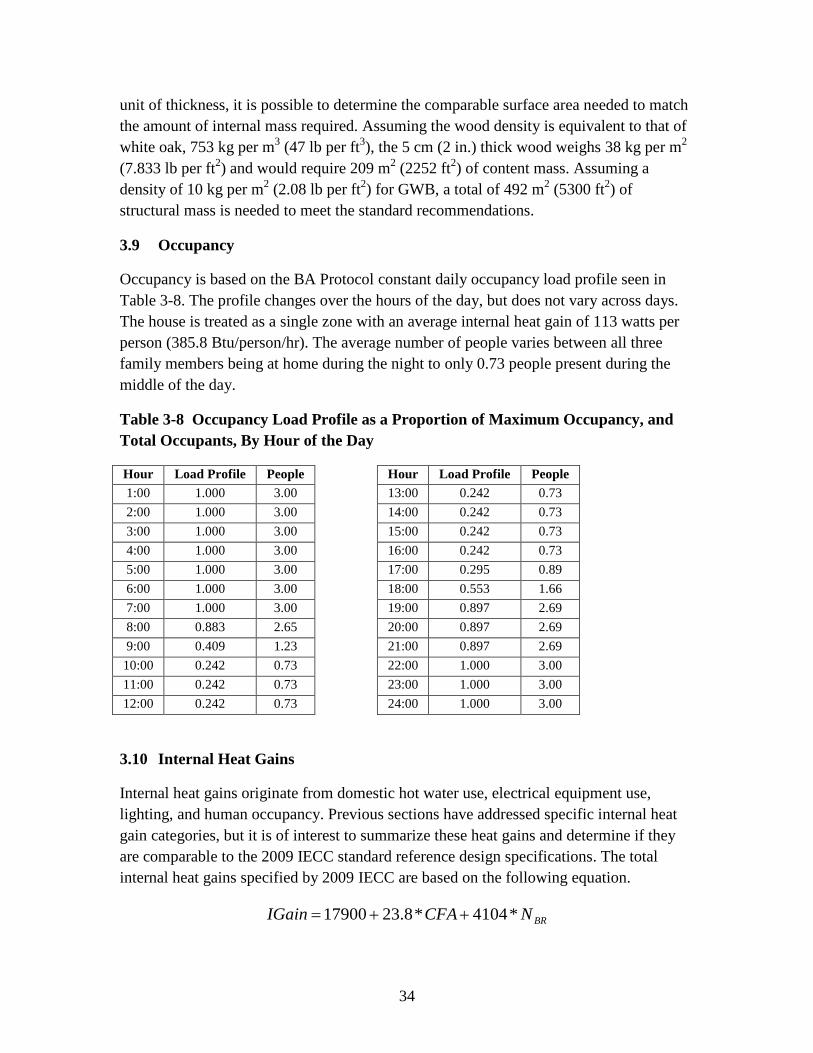
Occupancy is based on the BA Protocol constant daily occupancy load profile seen in Table 2-8. The profile changes over the hours of the day, but does not vary across days. The house is treated as a single zone with an average internal heat gain of 113 watts per person (385.8 Btu/person/hr). The average number of people varies between all three family members being at home during the night to only 0.73 people present during the middle of the day.
Table 2-8 Occupancy Load Profile as a Proportion of Maximum Occupancy, and Total Occupants, By Hour of the Day
Hour Load Profile People Hour Load Profile People 1:00 1.000 3.00 13:00 0.242 0.73 2:00 1.000 3.00 14:00 0.242 0.73 3:00 1.000 3.00 15:00 0.242 0.73 4:00 1.000 3.00 16:00 0.242 0.73 5:00 1.000 3.00 17:00 0.295 0.89 6:00 1.000 3.00 18:00 0.553 1.66 7:00 1.000 3.00 19:00 0.897 2.69 8:00 0.883 2.65 20:00 0.897 2.69 9:00 0.409 1.23 21:00 0.897 2.69
10:00 0.242 0.73 22:00 1.000 3.00 11:00 0.242 0.73 23:00 1.000 3.00 12:00 0.242 0.73 24:00 1.000 3.00
2.10 Internal Heat Gains
Internal heat gains originate from domestic hot water use, electrical equipment use, lighting, and human occupancy. Previous sections have addressed specific internal heat gain categories, but it is of interest to summarize these heat gains and determine if they are comparable to the 2009 IECC standard reference design specifications. The total internal heat gains specified by 2009 IECC are based on the following equation.
BRNCFAIGain *4104*8.23900,17 ++=
19
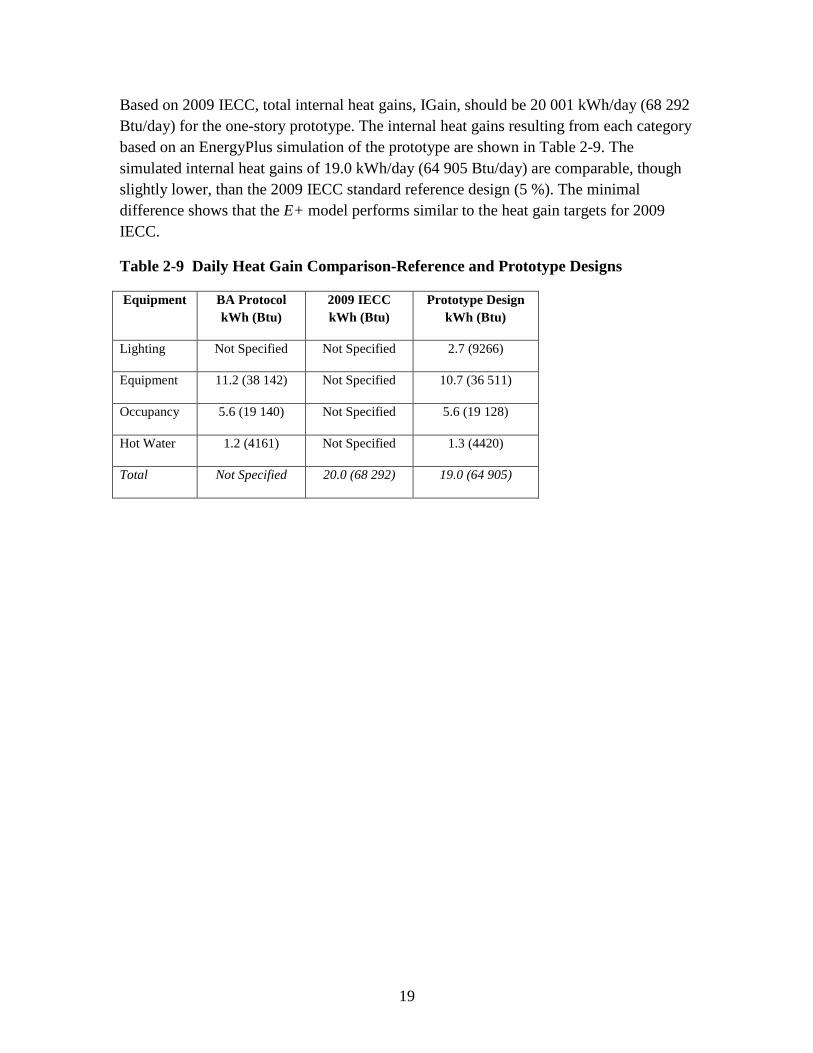
Based on 2009 IECC, total internal heat gains, IGain, should be 20 001 kWh/day (68 292 Btu/day) for the one-story prototype. The internal heat gains resulting from each category based on an EnergyPlus simulation of the prototype are shown in Table 2-9. The simulated internal heat gains of 19.0 kWh/day (64 905 Btu/day) are comparable, though slightly lower, than the 2009 IECC standard reference design (5 %). The minimal difference shows that the E+ model performs similar to the heat gain targets for 2009 IECC.
Table 2-9 Daily Heat Gain Comparison-Reference and Prototype Designs
Equipment BA Protocol kWh (Btu)
2009 IECC kWh (Btu)
Prototype Design kWh (Btu)
Lighting Not Specified Not Specified 2.7 (9266)
Equipment 11.2 (38 142) Not Specified 10.7 (36 511)
Occupancy 5.6 (19 140) Not Specified 5.6 (19 128)
Hot Water 1.2 (4161) Not Specified 1.3 (4420)
Total Not Specified 20.0 (68 292) 19.0 (64 905)

20
21
3 Two-Story Building Design Specification
The second building design represents a typical 2-story, 3-bedroom, slab-on-grade detached house with no garage. This design was chosen because it is the simplest building design and can be used as the framework for more detailed 2-story house designs. In the remainder of this section, each aspect of the building design and operation will be defined.
3.1 Building Envelope
There are some building envelope assumptions that are constant regardless of the building location’s climate while other assumptions are climate specific. The following two subsections will define each set of assumptions separately.
3.1.1 General Assumptions
The prototype is a 2009 IECC compliant 2-story, 3-bedroom, slab-on-grade house. The dimensions are 12.8 m x 8.0 m (42 ft x 26.25 ft) for a total of 204.9 m2 (2205 ft2) of conditioned floor area. The house is oriented 12.8 m (42 ft) east to west and 8.0 m (26.25 ft) north to south. The first and second floors have 2.4 m (8 ft) high ceilings. The roof slope is assumed to be 4:12 with 0.3 m (1 ft) overhangs on the north and south sides of the building. There is assumed to be no garage in the prototype.
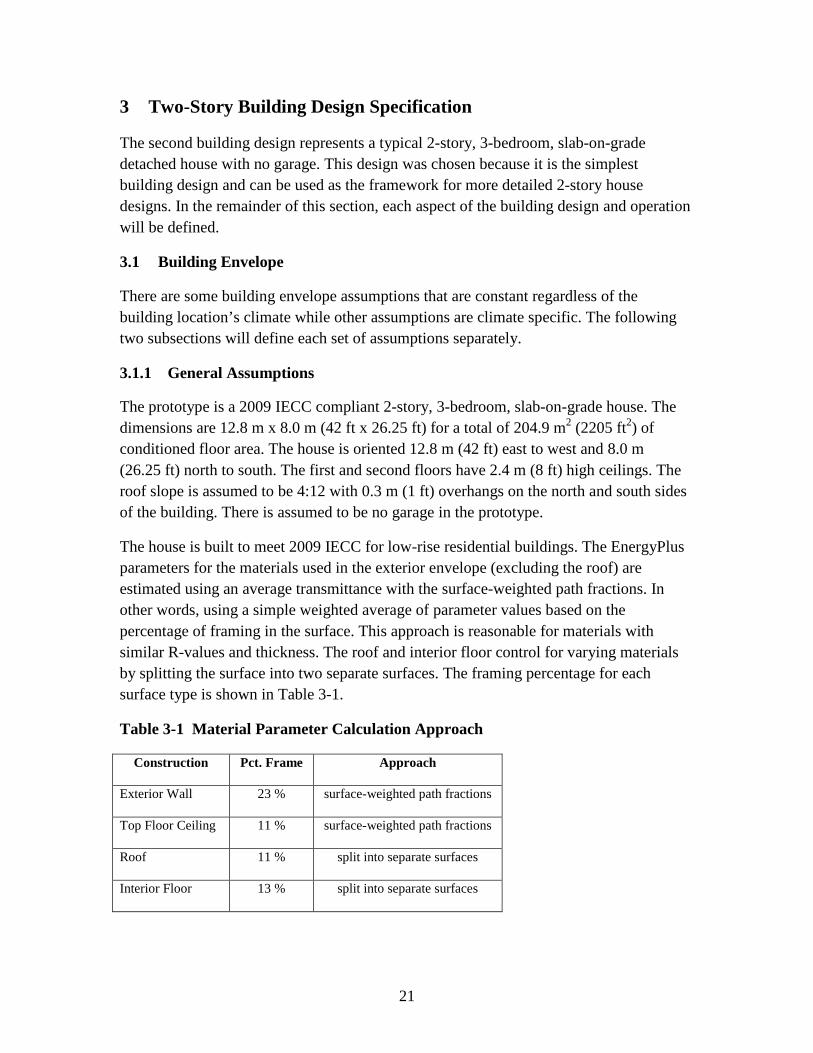
The house is built to meet 2009 IECC for low-rise residential buildings. The EnergyPlus parameters for the materials used in the exterior envelope (excluding the roof) are estimated using an average transmittance with the surface-weighted path fractions. In other words, using a simple weighted average of parameter values based on the percentage of framing in the surface. This approach is reasonable for materials with similar R-values and thickness. The roof and interior floor control for varying materials by splitting the surface into two separate surfaces. The framing percentage for each surface type is shown in Table 3-1.
Table 3-1 Material Parameter Calculation Approach
Construction Pct. Frame Approach
Exterior Wall 23 % surface-weighted path fractions
Top Floor Ceiling 11 % surface-weighted path fractions
Roof 11 % split into separate surfaces
Interior Floor 13 % split into separate surfaces
22
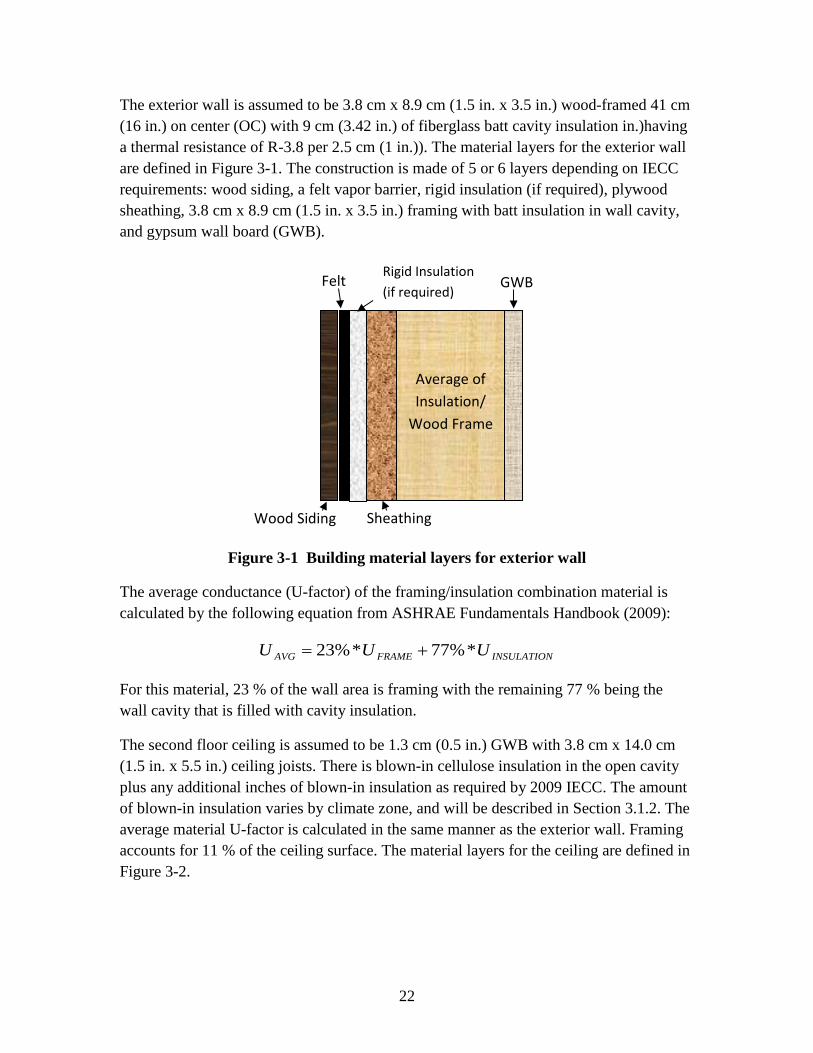
The exterior wall is assumed to be 3.8 cm x 8.9 cm (1.5 in. x 3.5 in.) wood-framed 41 cm (16 in.) on center (OC) with 9 cm (3.42 in.) of fiberglass batt cavity insulation in.)having a thermal resistance of R-3.8 per 2.5 cm (1 in.)). The material layers for the exterior wall are defined in Figure 3-1. The construction is made of 5 or 6 layers depending on IECC requirements: wood siding, a felt vapor barrier, rigid insulation (if required), plywood sheathing, 3.8 cm x 8.9 cm (1.5 in. x 3.5 in.) framing with batt insulation in wall cavity, and gypsum wall board (GWB).
Figure 3-1 Building material layers for exterior wall
The average conductance (U-factor) of the framing/insulation combination material is calculated by the following equation from ASHRAE Fundamentals Handbook (2009):
INSULATIONFRAMEAVG UUU *%77*%23 +=
For this material, 23 % of the wall area is framing with the remaining 77 % being the wall cavity that is filled with cavity insulation.
The second floor ceiling is assumed to be 1.3 cm (0.5 in.) GWB with 3.8 cm x 14.0 cm (1.5 in. x 5.5 in.) ceiling joists. There is blown-in cellulose insulation in the open cavity plus any additional inches of blown-in insulation as required by 2009 IECC. The amount of blown-in insulation varies by climate zone, and will be described in Section 3.1.2. The average material U-factor is calculated in the same manner as the exterior wall. Framing accounts for 11 % of the ceiling surface. The material layers for the ceiling are defined in Figure 3-2.
Sheathing
Felt
Average of Insulation/
Wood Frame
GWB
Wood Siding
Rigid Insulation (if required)

23
Figure 3-2 Building material layers for ceiling
The roof construction is assumed to be 3.8 cm x 14.0 cm (1.5 in. x 5.5 in.) rafters with 1.3 cm (0.5 in.) plywood sheathing, felt paper, and asphalt shingles. There is no insulation in the rafters, which makes it unrealistic to calculate an average U-factor. Instead the roof is split into two surfaces for energy simulation, one with framing (23 % of roof area) and one without framing (77 % of roof area). The material layers for the roof with framing are defined in Figure 3-3.
Figure 3-3 Building material layers for roof
The interior floor/ceiling (first level ceiling/second level floor) construction is assumed to be 3.8 cm x 19.1 cm (1.5 in. x 7.5 in.) floor joists with 1.6 cm (5/8 in.) plywood subflooring and 100% carpet finish. The framing accounts for 13 % of the floor. No insulation is required for interior surfaces because there is no thermal benefit from restricting thermal transfer within the same zone.
The foundation is a 10 cm (4 in.) concrete slab. The floor finish is assumed to be 40 % carpet, 40 % hardwood, 15 % vinyl tile, and 5 % ceramic tile (based on RSMeans Square Foot Costs). Some climate zones require rigid insulation to be placed on the slab edge, which will be described in Section 3.1.2. The material layers for the slab are defined in Figure 3-4. The EnergyPlus Slab preprocessor is used to simulate the heat transfer between the ground and the slab, which recommends simulating horizontal insulation
Blown-In Insulation
GWB
Average of Insulation/
Wood Frame
Shingles
Wood Frame
Sheathing
Felt

24
under the slab instead of vertical insulation on the edge of the slab for “slab-on-grade” foundations because the energy transfer that occurs on the vertical edges of the slab are significantly smaller than the energy transfer from the surface area contacting the ground. The Slab preprocessor assumes that the bottom of the slab is flush with the grade.
Figure 3-4 Building material layers for slab-on-grade foundation
Window glazing area is assumed to be 15 % of conditioned floor area and is split between the four exterior walls based on wall area. Two 1.2 m (4 ft) high windows on each side of the house for each floor (16 in total) are assumed to be located at an equal distance from the wall edge. The width of the windows is based on the fraction of total wall area represented by each side. There are assumed to be two 0.9 m x 2.0 m (3 ft x 6 ft 8 in.) – 4.4 cm (1.75 in.) solid pine wood doors, located in the center of the wall on the north and south walls. Windows are defined in EnergyPlus using the “Simple Glazing System,” which requires only 3 parameters: U-factor (W/m2∙K), solar heat gain coefficient (SHGC), and visible transmittance (VT). These parameters vary by climate zone, and will be described in Section 3.1.2.
3.1.2 Climate Zone-Specific Assumptions
The exterior envelope performance requirements of 2009 IECC vary depending on the climate zone. Table 3-2 is an abridged version of Table 402.1.1 found in Chapter 4: Residential Energy Efficiency of the 2009 IECC. A map of the climate zones by county is found in the appendix.
Floor Finish
Concrete
Rigid Insulation (IECC Requirement)
Rigid Insulation (Simulated in E+)

25
Table 3-2 2009 IECC energy code requirements for exterior envelope
Climate Zone Fenestration U-Factor (W/m2∙K)
Glazed Fenestration
SHGC
Ceiling R-Value
Wood Frame Wall R-Value Slab Edge R-Value
Slab Depth
1 1.2 0.30 5.3 (30) 2.3 (13) 0 (0) 0 (0)
2 0.65 0.30 5.3 (30) 2.3 (13) 0 (0) 0 (0)
3 0.50 0.30 5.3 (30) 2.3 (13) 0 (0) 0 (0)
4 except Marine 0.35 NR* 6.7 (38) 2.3 (13) 1.8 (10) 0.61 m (2 ft)
5 and 4 Marine 0.35 NR* 6.7 (38) 3.5 (20) or 2.3+0.88 (13+5)** 1.8 (10) 0.61 m (2 ft)
6 0.35 NR* 8.6 (49) 3.5 (20) or 2.3+0.88 (13+5)** 1.8 (10) 1.21 m (4 ft)
7 and 8 0.35 NR* 8.6 (49) 3.7 (21) 1.8 (10) 1.21 m (4 ft)
*NR = No Requirement **13+5 means R-13 cavity insulation plus R-5 insulated sheathing. Note: R-value Units = m2∙K/W (ft2∙⁰F∙h/Btu)
Although EnergyPlus requires three parameters to define windows, 2009 IECC only specifies two: U-factor and SHGC. The U-factor is allowed to be as high as 1.2 in Zone 1 to as low as 0.35 in Zone 7 and Zone 8. The SHGC must be less than 0.30 for Zone 1 through Zone 3, but has no requirement for Zone 4 through Zone 8. The SHGC for the standard reference design specified in 2009 IECC is 0.40 for Zone 4 through Zone 8. The visible transmittance is not restricted in 2009 IECC for any climate zones, and is assumed to be 0.16 for Zone 1, 0.22 for Zone 2, 0.46 for Zone 3, and 0.40 for Zone 4 through Zone 8.17
The insulation R-values for the exterior walls, ceiling, and foundation increase as the climate zone gets colder. The exterior wall R-value ranges from R-13 in Zone 1 through Zone 4 to R-21 in Zone 7 and Zone 8. The first R-13 is met with high density cavity insulation in the wall cavity. Additional R-value is met by adding rigid insulation to the exterior of the wall. The ceiling R-value ranges from R-30 in Zone 1 through Zone 3 to R-49 in Zone 6 through Zone 8. Additional cellulose blown-in insulation is used to reach the required R-value. R-10 insulation under the foundation is required in Zone 4 through Zone 8 only, which is met by adding 10 cm (2 in.) of extruded polystyrene (XPS) below the slab.
17 Visible transmittance values are based on window characteristics defined in the ASHRAE Fundamentals Handbook (2009).

26
3.2 Heating, Ventilating, and Air Conditioning Equipment
As in the one-story model, the HVAC system in the prototype building design is a single-speed unitary system with an air conditioner with a seasonal energy efficiency ratio (SEER) rating of 13,18 and a gas furnace with annual fuel utilization efficiency (AFUE) of 78 % (both current minimum federal energy efficiency requirements). No dehumidification option or economizer is included in the system. The supply fan is assumed to cycle, and has a total efficiency of 70 %. The supply fan motor efficiency is 90 %. The first and second floors are assumed to be a single zone, with the HVAC equipment located on the first floor. The ductwork is assumed to be within the conditioned space, which leads to zero energy loss from the ductwork. These two assumptions assist in simplifying the model, and will be relaxed in future research to account for split systems and the resulting duct leakage.19
3.3 Operating Conditions
As in the one-story model, the thermostat setpoints are based on the standard reference designs defined in 2009 IECC, which are 23.9 °C (75°F) cooling and 22.2 °C (72°F) heating.
3.4 Air Infiltration and Mechanical Ventilation
The prescriptive maximum air leakage of 7 air changes per hour at 50 pascals (ACH50) specified in Section 402.4.2.1 of the 2009 IECC is not defined under normal operating conditions. The air infiltration rate must be converted into effective leakage area (ELA), which requires two conversions. First, the ACH50 is converted into cubic feet per minute at 50 pascals (CFM50) based on the following equation.
𝐶𝐹𝑀50 = 𝐴𝐶𝐻50 ∗𝑉𝑜𝑙𝑢𝑚𝑒[𝑓𝑡3]
60= 7 ∗
1764060
= 2058
Second, the following equation from Lawrence Berkeley Laboratory (LBL) converts the CFM50 into an ELA of 717 cm2 (0.77 ft2).20
𝐸𝐿𝐴 =𝐶𝐹𝑀50
2700= 0.76 𝑓𝑡2 = 717 𝑐𝑚2
18 The 13 SEER rating converts to a Coefficient of Performance (COP) of 3.28 for the EnergyPlus simulation based on the following equation: 𝐶𝑂𝑃 = (−0.02 ∗ 𝑆𝐸𝐸𝑅2 + 1.12 ∗ 𝑆𝐸𝐸𝑅)/3.412. 19 2009 IECC prescriptive requirements include a duct tightness post-construction test showing duct leakage less than or equal to 226.5 L/min (8 CFM) per 9.29 m2 (100 ft2) at 25 Pascal (Pa). 20 LBL (2012)

27
Previous editions of the IECC do not specify the air infiltration rate. The air infiltration rate for these prototypes will use the following equation from Hendron and Engebrecht (2010), where the ELA is the specific leakage area (SLA) multiplied by the conditioned floor area (CFA).21
𝐸𝐿𝐴 = 𝑆𝐿𝐴 ∗ 𝐶𝐹𝐴
Table 405.5.2(1) of the 2009 IECC specifies that for “residences with mechanical ventilation that are tested in accordance with ASHRAE 119, Section 5.1, the measured air exchange rate combined with the mechanical ventilation rate…shall not be less than” the ASHRAE 62.2-2010 minimum outdoor air flow rate.
The minimum mechanical ventilation rate based on ASHRAE Standard 62.2-2010 (liters per second) is calculated using ASHRAE 62.2-2010 equation 4.1b:
0.05 ∗ 𝑚2 + 3.5 ∗ (𝑁𝐵𝑅 + 1)
For the prototype design’s 204.9 m2 (2205 ft2) and 3 bedrooms, the total outdoor air rate is 0.024 m3 per second (51 CFM), which converts to 0.17 ACH. The 2009 IECC maximum air infiltration rate of 7 ACH50 can be converted into a relative natural air change per hour (ACHNAT) with the following equation from EPA (2001), where the LBL Factor ranges from 14 to 26 and the Location Factor ranges from 0.72 to 1.00.
𝐴𝐶𝐻𝑁𝐴𝑇 =𝐴𝐶𝐻50
𝐿𝐵𝐿 𝐹𝑎𝑐𝑡𝑜𝑟 ∗ 𝐿𝑜𝑐𝑎𝑡𝑖𝑜𝑛 𝐹𝑎𝑐𝑡𝑜𝑟
The ACHNAT will range between 0.27 and 0.50. Since the air infiltration ACH is always greater than the minimum ventilation rate defined in ASHRAE 62.2-2010, no mechanical ventilation is required.
Based on ASHRAE 90.2-2007, an additional 0.15 ACH is added to the model for occupant activity, such as window and door operation and running exhaust fans.22
Based on Hendron and Engebrecht (2010) and the 2009 IECC, the attic ventilation is equivalent to 1 unit per 300 units of the ceiling area, which converts to an effective leakage area (ELA) of 6829 cm2 (7.4 ft2).
3.5 Domestic Hot Water
As in the one-story model, the BA Protocol functions defined in Table 3-3 are used instead of 2009 IECC to estimate the hot water consumption of each piece of equipment
21 All values in the same units. 22 According to the ASHRAE Fundamentals Handbook, “In residences...air exchange associated with a door can be estimated based on air leakage through cracks between door and frame.”

28
and activities. Total hot water consumption based on the BA Protocol is 228 liters (60 gallons) which is the same as in the one-story prototype because the number of bedrooms is equal. These estimates are used for the analysis because they break down consumption by end use; the 2009 IECC estimate is for total hot water consumption only. The clothes washer and dishwasher use only hot water at 48.9°C (120°F) while the showers, baths, and sinks use hot water that is tempered to 43.3°C (110°F), as shown in Table 3-3.
Table 3-3 Hot Water Consumption
Equipment Water Temp. Function Liters (Gallons)
Liters (Gallons) Per Day
Clothes Washer 48.9°C (120°F) 8.9+3.0* NBR (2.35+0.78*NBR) 19 (5)
Dishwasher 48.9°C (120°F) 8.6+2.8* NBR (2.26+0.75*NBR) 19 (5)
Showers 43.3°C (110°F) 53.0+17.7* NBR (14+4.67*NBR) 68 (18)
Baths 43.3°C (110°F) 13.2+4.4* NBR (3.5+1.17*NBR) 27 (7)
Sinks 43.3°C (110°F) 47.3+15.7* NBR (12.5+4.16*NBR) 95 (25)
Total: 228 (60)
The BA Protocol total water use, daily water use load profiles, and sensible (temperature-based) and latent (humidity-based) loads for hot water use are used to estimate the real-time hot water use and the resulting internal heat gains. The daily load profiles, or proportion of peak flow rate by hour of the day, for each hot water use category can be seen in Figure 3-5.

29
Figure 3-5 Domestic Hot Water Load Profiles as a Proportion of Peak Flow Rate, By Hour of the Day
Based on the BA Protocol, internal heat gains from hot water for the clothes washer and dishwasher are assumed to be zero for both sensible and latent loads. Any heat gains for this equipment are included in the equipment electricity use heat gains. The sensible and latent load fractions for shower, bath, and sinks are reverse engineered from internal heat gains estimated using the BA Protocol functions in Table 3-4.
0.0
0.2
0.4
0.6
0.8
1.0
1 3 5 7 9 11 13 15 17 19 21 23
Clothes Washer
0.0
0.2
0.4
0.6
0.8
1.0
1 3 5 7 9 11 13 15 17 19 21 23
Dishwasher
0.0
0.2
0.4
0.6
0.8
1.0
1 3 5 7 9 11 13 15 17 19 21 23
Bath
0.0
0.2
0.4
0.6
0.8
1.0
1 3 5 7 9 11 13 15 17 19 21 23
Shower
0.00.20.40.60.81.0
1 3 5 7 9 11 13 15 17 19 21 23
Sinks
30
Table 3-4 Domestic Hot Water Internal Heat Gains
Equipment End Use
Sensible Load Latent Load
Function kWh (Btu)
Heat Gain kWh (Btu)
Load Fraction
Function kWh (Btu)
Heat Gain kWh (Btu)
Load Fraction
Showers 0.22+0.07*NBR (741+247*NBR)
0.4 (1482) 0.1947 0.21+0.07* NBR (703+235*NBR)
0.4 (1408) 0.0055
Baths 0.05+0.02* NBR (185+62*NBR)
0.4 (1371) 0.7262 0 (0) 0 (0) 0.0000
Sinks 0.09+0.03*NBR (310+103*NBR)
0.2 (619) 0.0917 0.04+0.01* NBR (140+47*NBR)
0.1 (281) 0.0012
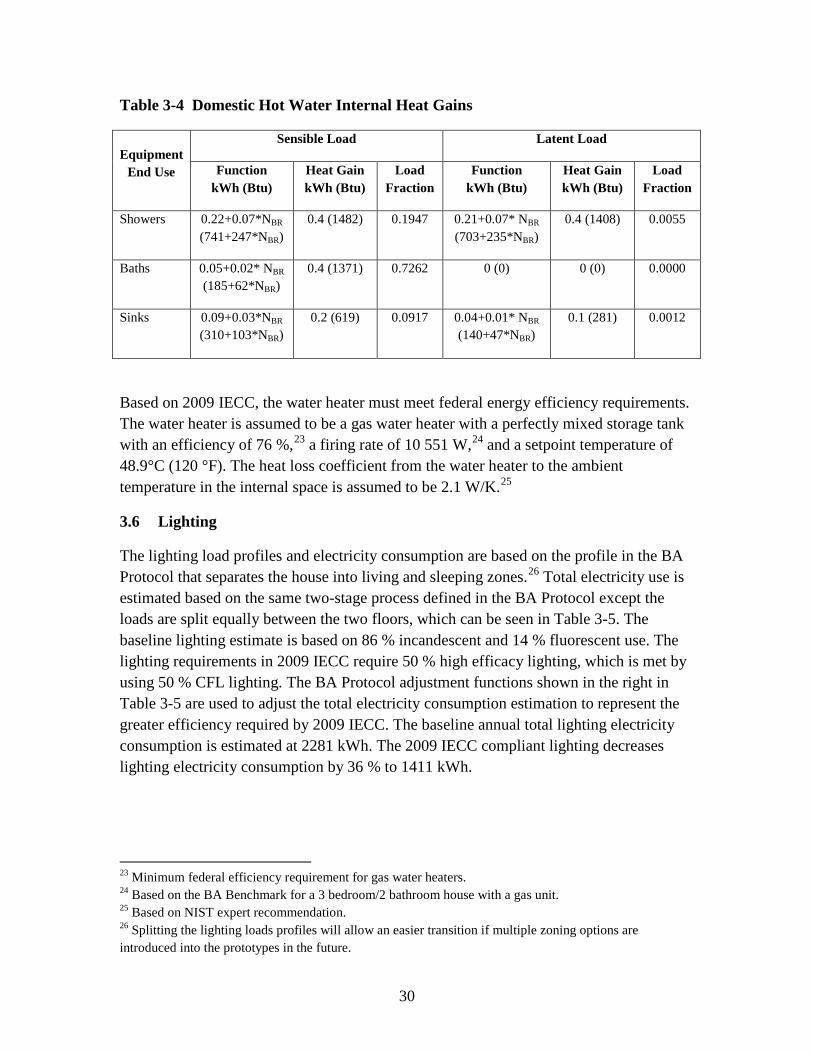
Based on 2009 IECC, the water heater must meet federal energy efficiency requirements. The water heater is assumed to be a gas water heater with a perfectly mixed storage tank with an efficiency of 76 %,23 a firing rate of 10 551 W,24 and a setpoint temperature of 48.9°C (120 °F). The heat loss coefficient from the water heater to the ambient temperature in the internal space is assumed to be 2.1 W/K.25
3.6 Lighting
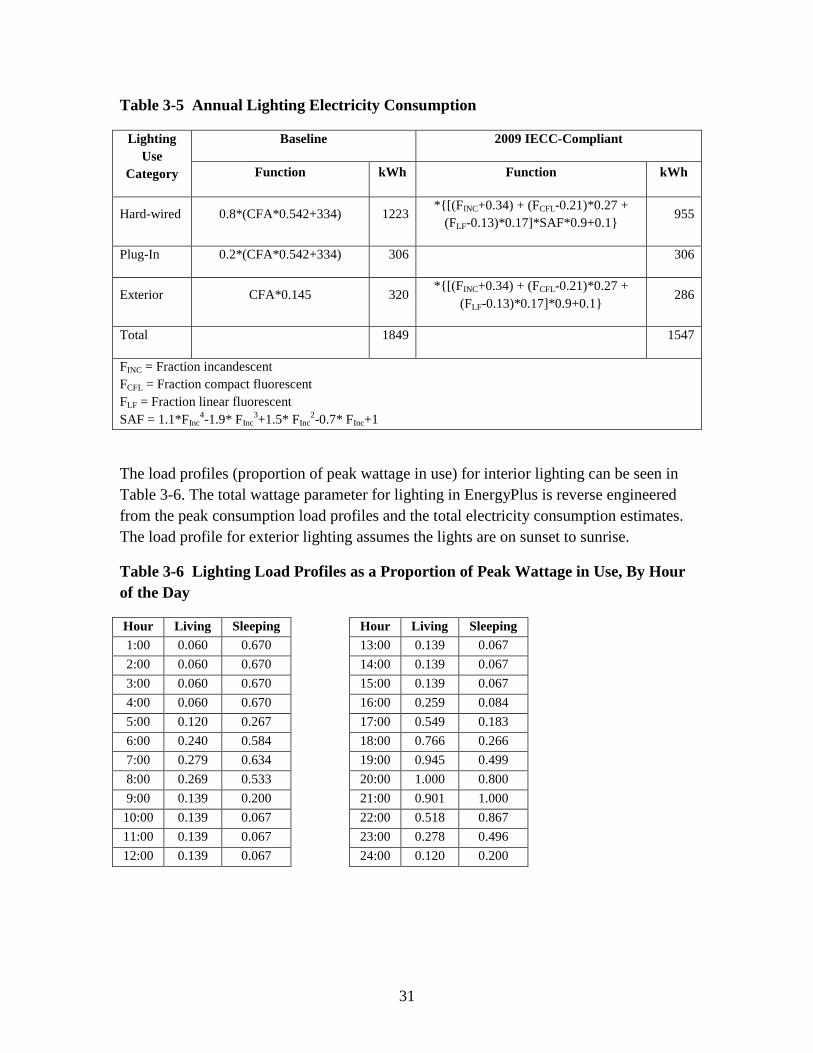
The lighting load profiles and electricity consumption are based on the profile in the BA Protocol that separates the house into living and sleeping zones.26 Total electricity use is estimated based on the same two-stage process defined in the BA Protocol except the loads are split equally between the two floors, which can be seen in Table 3-5. The baseline lighting estimate is based on 86 % incandescent and 14 % fluorescent use. The lighting requirements in 2009 IECC require 50 % high efficacy lighting, which is met by using 50 % CFL lighting. The BA Protocol adjustment functions shown in the right in Table 3-5 are used to adjust the total electricity consumption estimation to represent the greater efficiency required by 2009 IECC. The baseline annual total lighting electricity consumption is estimated at 2281 kWh. The 2009 IECC compliant lighting decreases lighting electricity consumption by 36 % to 1411 kWh.
23 Minimum federal efficiency requirement for gas water heaters. 24 Based on the BA Benchmark for a 3 bedroom/2 bathroom house with a gas unit. 25 Based on NIST expert recommendation. 26 Splitting the lighting loads profiles will allow an easier transition if multiple zoning options are introduced into the prototypes in the future.
31
Table 3-5 Annual Lighting Electricity Consumption
Lighting Use
Category
Baseline 2009 IECC-Compliant
Function kWh Function kWh
Hard-wired 0.8*(CFA*0.542+334) 1223 *{[(FINC+0.34) + (FCFL-0.21)*0.27 +
(FLF-0.13)*0.17]*SAF*0.9+0.1} 955
Plug-In 0.2*(CFA*0.542+334) 306 306
Exterior CFA*0.145 320 *{[(FINC+0.34) + (FCFL-0.21)*0.27 +
(FLF-0.13)*0.17]*0.9+0.1} 286
Total 1849 1547
FINC = Fraction incandescent FCFL = Fraction compact fluorescent FLF = Fraction linear fluorescent SAF = 1.1*FInc
4-1.9* FInc3+1.5* FInc
2-0.7* FInc+1
The load profiles (proportion of peak wattage in use) for interior lighting can be seen in Table 3-6. The total wattage parameter for lighting in EnergyPlus is reverse engineered from the peak consumption load profiles and the total electricity consumption estimates. The load profile for exterior lighting assumes the lights are on sunset to sunrise.
Table 3-6 Lighting Load Profiles as a Proportion of Peak Wattage in Use, By Hour of the Day
Hour Living Sleeping Hour Living Sleeping 1:00 0.060 0.670 13:00 0.139 0.067 2:00 0.060 0.670 14:00 0.139 0.067 3:00 0.060 0.670 15:00 0.139 0.067 4:00 0.060 0.670 16:00 0.259 0.084 5:00 0.120 0.267 17:00 0.549 0.183 6:00 0.240 0.584 18:00 0.766 0.266 7:00 0.279 0.634 19:00 0.945 0.499 8:00 0.269 0.533 20:00 1.000 0.800 9:00 0.139 0.200 21:00 0.901 1.000
10:00 0.139 0.067 22:00 0.518 0.867 11:00 0.139 0.067 23:00 0.278 0.496 12:00 0.139 0.067 24:00 0.120 0.200
32
Monthly multipliers defined in Hendron and Engebrecht (2010) are used to account for the variation across the year in lighting use. The load profile in Table 3-6 is adjusted by the multiplier for each month.
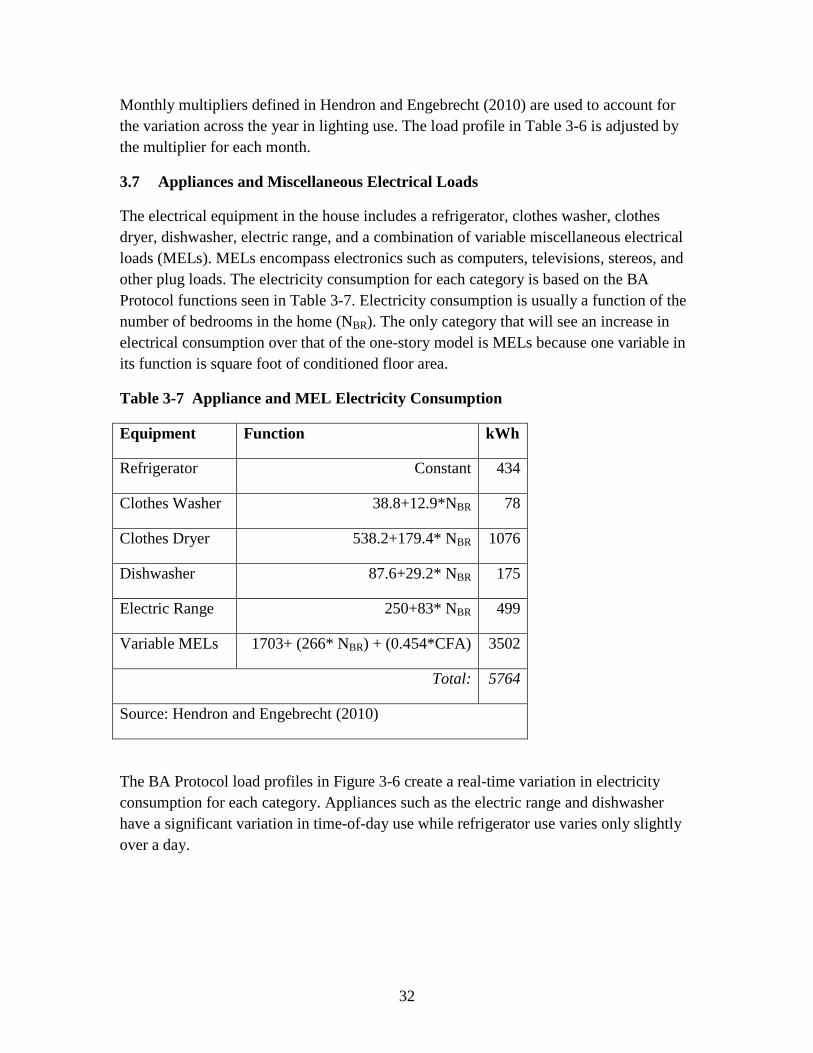
3.7 Appliances and Miscellaneous Electrical Loads
The electrical equipment in the house includes a refrigerator, clothes washer, clothes dryer, dishwasher, electric range, and a combination of variable miscellaneous electrical loads (MELs). MELs encompass electronics such as computers, televisions, stereos, and other plug loads. The electricity consumption for each category is based on the BA Protocol functions seen in Table 3-7. Electricity consumption is usually a function of the number of bedrooms in the home (NBR). The only category that will see an increase in electrical consumption over that of the one-story model is MELs because one variable in its function is square foot of conditioned floor area.
Table 3-7 Appliance and MEL Electricity Consumption
Equipment Function kWh
Refrigerator Constant 434
Clothes Washer 38.8+12.9*NBR 78
Clothes Dryer 538.2+179.4* NBR 1076
Dishwasher 87.6+29.2* NBR 175
Electric Range 250+83* NBR 499
Variable MELs 1703+ (266* NBR) + (0.454*CFA) 3502
Total: 5764
Source: Hendron and Engebrecht (2010)
The BA Protocol load profiles in Figure 3-6 create a real-time variation in electricity consumption for each category. Appliances such as the electric range and dishwasher have a significant variation in time-of-day use while refrigerator use varies only slightly over a day.

33
Figure 3-6 Electrical Equipment Load Profiles as a Proportion of Peak Wattage, By Hour of the Day
3.8 Internal Mass
Instead of defining individual interior surfaces and furniture, internal mass is estimated based on ASHRAE 90.2-2007 recommendations. There is assumed to be 3.6 kg (8 lb) of 5 cm (2 in.) thick wood per square foot of conditioned space for a total of 8001 kg (17 640 lb). There is assumed to be 2.3 kg (5 lb) of 1.3 cm (0.5 in.) gypsum wall board (GWB) per square foot of conditioned space for the internal structure for a total of 5001 kg (11 025 lb).
EnergyPlus estimates internal mass in terms of square meters of material open to the zone air. Based on the total weight of the two materials (wood and GWB) and their weight per
0.000.020.040.060.080.10
1 3 5 7 9 11 13 15 17 19 21 23
Clothes Washer
0.000.020.040.060.080.100.12
1 3 5 7 9 11 13 15 17 19 21 23
Dishwasher
0.00
0.02
0.04
0.06
1 3 5 7 9 11 13 15 17 19 21 23
Refrigerator
0.000.020.040.060.080.10
1 3 5 7 9 11 13 15 17 19 21 23
Clothes Dryer
0.00
0.05
0.10
0.15
0.20
1 3 5 7 9 11 13 15 17 19 21 23
Range
0.00
0.02
0.04
0.06
0.08
1 3 5 7 9 11 13 15 17 19 21 23
MELs
34
unit of thickness, it is possible to determine the comparable surface area needed to match the amount of internal mass required. Assuming the wood density is equivalent to that of white oak, 753 kg per m3 (47 lb per ft3), the 5 cm (2 in.) thick wood weighs 38 kg per m2 (7.833 lb per ft2) and would require 209 m2 (2252 ft2) of content mass. Assuming a density of 10 kg per m2 (2.08 lb per ft2) for GWB, a total of 492 m2 (5300 ft2) of structural mass is needed to meet the standard recommendations.
3.9 Occupancy
Occupancy is based on the BA Protocol constant daily occupancy load profile seen in Table 3-8. The profile changes over the hours of the day, but does not vary across days. The house is treated as a single zone with an average internal heat gain of 113 watts per person (385.8 Btu/person/hr). The average number of people varies between all three family members being at home during the night to only 0.73 people present during the middle of the day.
Table 3-8 Occupancy Load Profile as a Proportion of Maximum Occupancy, and Total Occupants, By Hour of the Day
Hour Load Profile People Hour Load Profile People 1:00 1.000 3.00 13:00 0.242 0.73 2:00 1.000 3.00 14:00 0.242 0.73 3:00 1.000 3.00 15:00 0.242 0.73 4:00 1.000 3.00 16:00 0.242 0.73 5:00 1.000 3.00 17:00 0.295 0.89 6:00 1.000 3.00 18:00 0.553 1.66 7:00 1.000 3.00 19:00 0.897 2.69 8:00 0.883 2.65 20:00 0.897 2.69 9:00 0.409 1.23 21:00 0.897 2.69
10:00 0.242 0.73 22:00 1.000 3.00 11:00 0.242 0.73 23:00 1.000 3.00 12:00 0.242 0.73 24:00 1.000 3.00
3.10 Internal Heat Gains
Internal heat gains originate from domestic hot water use, electrical equipment use, lighting, and human occupancy. Previous sections have addressed specific internal heat gain categories, but it is of interest to summarize these heat gains and determine if they are comparable to the 2009 IECC standard reference design specifications. The total internal heat gains specified by 2009 IECC are based on the following equation.
BRNCFAIGain *4104*8.2317900 ++=
35
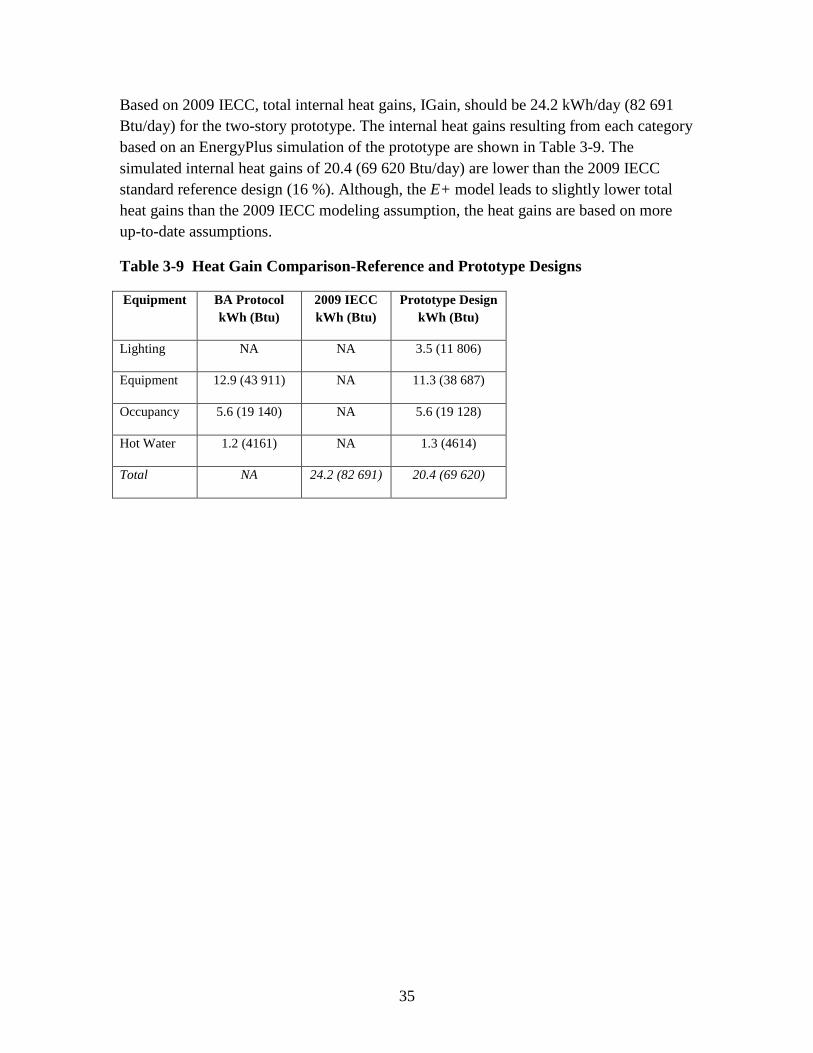
Based on 2009 IECC, total internal heat gains, IGain, should be 24.2 kWh/day (82 691 Btu/day) for the two-story prototype. The internal heat gains resulting from each category based on an EnergyPlus simulation of the prototype are shown in Table 3-9. The simulated internal heat gains of 20.4 (69 620 Btu/day) are lower than the 2009 IECC standard reference design (16 %). Although, the E+ model leads to slightly lower total heat gains than the 2009 IECC modeling assumption, the heat gains are based on more up-to-date assumptions.
Table 3-9 Heat Gain Comparison-Reference and Prototype Designs
Equipment BA Protocol kWh (Btu)
2009 IECC kWh (Btu)
Prototype Design kWh (Btu)
Lighting NA NA 3.5 (11 806)
Equipment 12.9 (43 911) NA 11.3 (38 687)
Occupancy 5.6 (19 140) NA 5.6 (19 128)
Hot Water 1.2 (4161) NA 1.3 (4614)
Total NA 24.2 (82 691) 20.4 (69 620)

36

37
4 Recommendations for Future Research
Expansion of Current Prototypes. These one-story and two-story residential prototype designs are non-location specific and serve as a basis from which additional prototypes can be designed. Alterations to these two prototype designs should include selecting the location of the building, changing the square footage, changing the foundation type, adding a garage, changing orientation, changing the heating fuel type, and designing to meet different editions of the IECC.
Location-Specific Factors. The prototype design is location neutral. For energy simulation, each location requires its own weather file as well as specification of the following local parameters: location, ground temperature, water main temperature, and design days.27
Additional Building Sizes. Leaving the house dimension ratios the same at approximately 2.56:1 and 1.60:1 for the 1-story and 2-story prototypes, respectively, the prototypes can be expanded or contracted to meet the building sizes described in Table 4-1.
Table 4-1 Additional Prototype Sizes
1-Story Prototypes 2-Story Prototypes
m2 (ft2) Dimensions m (ft)
BR m2 (ft2) Dimension m (ft)
BR
111.9 (1205) 6.61 x 16.89 (21.67x55.42)
3 148.8 (1602) 6.8x10.9 (22.37x35.8)
3
148.6 (1600) 7.62 x 19.51 (25.0x64.0)
3 204.9 (2205) 8.00 x 12.80 (26.25x42.0)
3
176.6 (1901) 8.31 x 21.26 (27.25x69.75)
3 251.2 (2704) 8.86 x 14.17 (29.07x46.5)
4
215.8 (2323) 9.17 x 23.53 (30.1x77.21)
3 311.0 (3348) 9.85 x 15.78 (32.33x51.78)
4
292.8 (3152) 10.67 x 27.43 (35.0x90.0)
3 420.2 (4523) 11.49 x 18.29 (37.7x60.0)
4
These alternative building sizes are based on the U.S. Census’ Survey of Construction database. Figure A-2 and Figure A-3 show the percentile breakdown of the size of new single-family detached houses for one-story and two-story houses, respectively, both in
27 An EnergyPlus database can be created with location-specific information readily available.
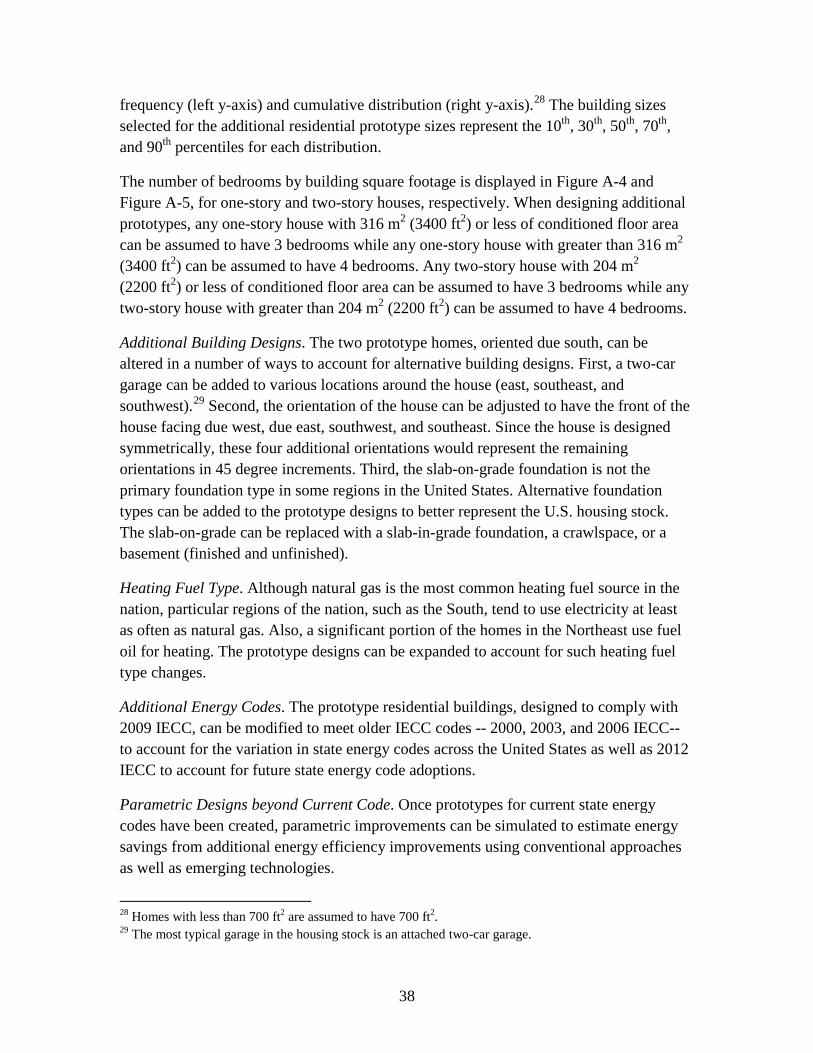
38
frequency (left y-axis) and cumulative distribution (right y-axis).28 The building sizes selected for the additional residential prototype sizes represent the 10th, 30th, 50th, 70th, and 90th percentiles for each distribution.
The number of bedrooms by building square footage is displayed in Figure A-4 and Figure A-5, for one-story and two-story houses, respectively. When designing additional prototypes, any one-story house with 316 m2 (3400 ft2) or less of conditioned floor area can be assumed to have 3 bedrooms while any one-story house with greater than 316 m2 (3400 ft2) can be assumed to have 4 bedrooms. Any two-story house with 204 m2 (2200 ft2) or less of conditioned floor area can be assumed to have 3 bedrooms while any two-story house with greater than 204 m2 (2200 ft2) can be assumed to have 4 bedrooms.
Additional Building Designs. The two prototype homes, oriented due south, can be altered in a number of ways to account for alternative building designs. First, a two-car garage can be added to various locations around the house (east, southeast, and southwest).29 Second, the orientation of the house can be adjusted to have the front of the house facing due west, due east, southwest, and southeast. Since the house is designed symmetrically, these four additional orientations would represent the remaining orientations in 45 degree increments. Third, the slab-on-grade foundation is not the primary foundation type in some regions in the United States. Alternative foundation types can be added to the prototype designs to better represent the U.S. housing stock. The slab-on-grade can be replaced with a slab-in-grade foundation, a crawlspace, or a basement (finished and unfinished).
Heating Fuel Type. Although natural gas is the most common heating fuel source in the nation, particular regions of the nation, such as the South, tend to use electricity at least as often as natural gas. Also, a significant portion of the homes in the Northeast use fuel oil for heating. The prototype designs can be expanded to account for such heating fuel type changes.
Additional Energy Codes. The prototype residential buildings, designed to comply with 2009 IECC, can be modified to meet older IECC codes -- 2000, 2003, and 2006 IECC-- to account for the variation in state energy codes across the United States as well as 2012 IECC to account for future state energy code adoptions.
Parametric Designs beyond Current Code. Once prototypes for current state energy codes have been created, parametric improvements can be simulated to estimate energy savings from additional energy efficiency improvements using conventional approaches as well as emerging technologies.
28 Homes with less than 700 ft2 are assumed to have 700 ft2. 29 The most typical garage in the housing stock is an attached two-car garage.

39
References
American Society of Heating Refrigerating and Air-Conditioning Engineers, Inc., 2007, ANSI/ASHRAE Standard 62.2-2010, Ventilation and acceptable indoor air quality in low-rise residential buildings.
American Society of Heating Refrigerating and Air-Conditioning Engineers, Inc., 2007, ANI/ASHRAE Standard 90.2-2007, Energy-efficient design of low-rise residential buildings.
American Society of Heating Refrigerating and Air-Conditioning Engineers, Inc., 2009, ASHRAE handbook – fundamentals.
Department of Energy, 2012a, Building Energy Codes Program, Residential Prototype Building Models, http://www.energycodes.gov/development/residential/iecc_models/.
Department of Energy, Building Technologies Program, EnergyPlus energy simulation software, 2012b, http://apps1.eere.energy.gov/buildings/energyplus/.
Energy Information Administration, Commercial building energy consumption survey, http://www.eia.doe.gov/emeu/cbecs/.
Energy Information Administration, Residential energy consumption survey, http://www.eia.doe.gov/emeu/recs/.
Environmental Protection Agency, 2001, EPA Energy star home sealing specification.
Field, K., Deru, M., Studer, D., August 2010, Using DOE commercial reference building for simulation studies, Conference paper, presented at SimBuild 2010, NREL/CP-550-48588.
Hendron, R., Engebrecht, C., January 2010, Building America research benchmark definition, National Renewable Energy Laboratory, Technical Report NREL/TP-550-47246.
Hendron, R., Engebrecht, C., September 2010, Building America house simulation protocols, National Renewable Energy Laboratory, Building Technologies Program.
International Code Council, 2009, International residential code for one- and two-family dwellings.
International Code Council, 2009, International energy conservation code.

40
Lawrence Berkeley National Laboratory, accessed 2012, Useful conversion equations, http://epb.lbl.gov/blowerdoor/docs/conversions.pdf.
Pacific Northwest National Laboratory, September 2009, Impacts of the 2009 IECC for residential buildings at state level, Department of Energy Building Energy Codes Program.
Persily, A., Musser, A., Leber, D., August 2006, A collection of homes to represent the U.S. housing stock, National Institute of Standards and Technology, NISTIR 7330.
RSMeans, 2005, Square foot costs – 27th annual edition, Reed construction data.
U.S. Census Bureau, National american housing survey, http://www.census.gov/hhes/www/housing/ahs/ahs.html.
U.S. Census Bureau, Manufacturing, Mining, and Construction Statistics Division, 2011, Annual 2010 characteristics of new housing, http://www.census.gov/const/www/charindex.html.

41
A Appendix
Figure A-1 ASHRAE Climate Zones by County
42
Figure A-2 Conditioned Floor Area of New 1-Story Single-Family Housing
0%
10%
20%
30%
40%
50%
60%
70%
80%
90%
100%
0
5000
10000
15000
20000
25000
30000
35000
40000
45000
50000H
ousi
ng U
nits
Conditioned Floor Area - m^2 (ft^2) Frequency
Cumulative %
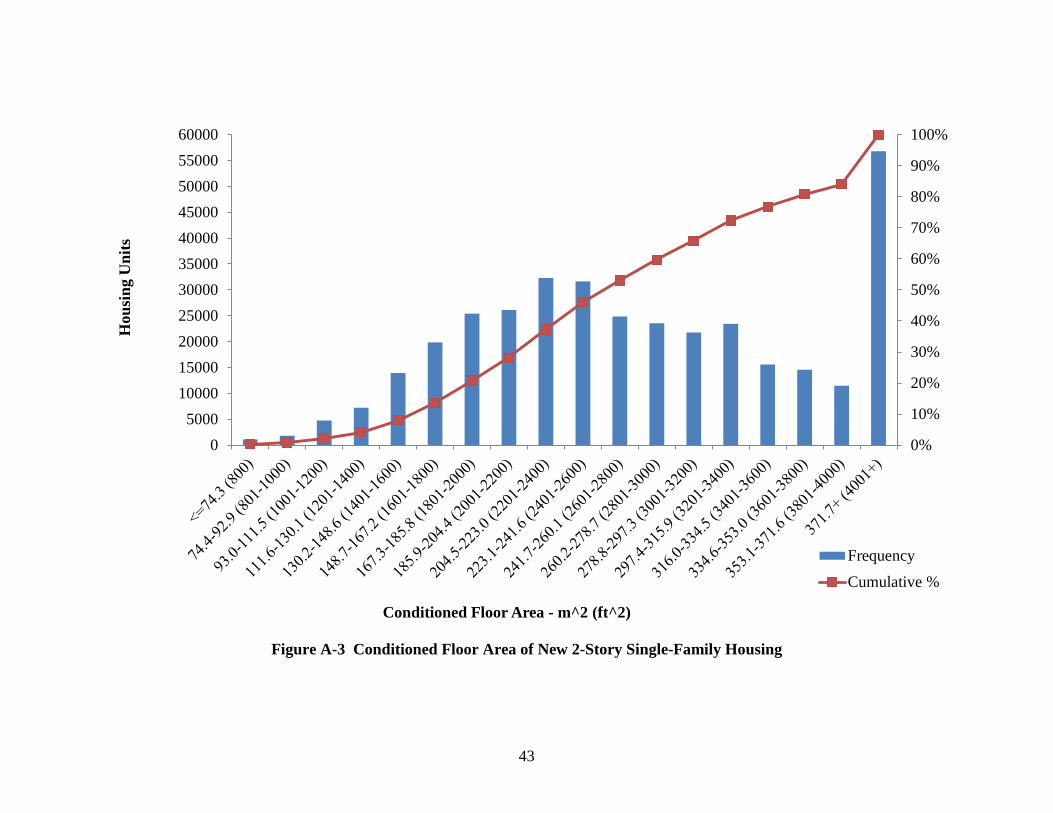
43
Figure A-3 Conditioned Floor Area of New 2-Story Single-Family Housing
0%
10%
20%
30%
40%
50%
60%
70%
80%
90%
100%
05000
1000015000200002500030000350004000045000500005500060000
Hou
sing
Uni
ts
Conditioned Floor Area - m^2 (ft^2)
Frequency
Cumulative %
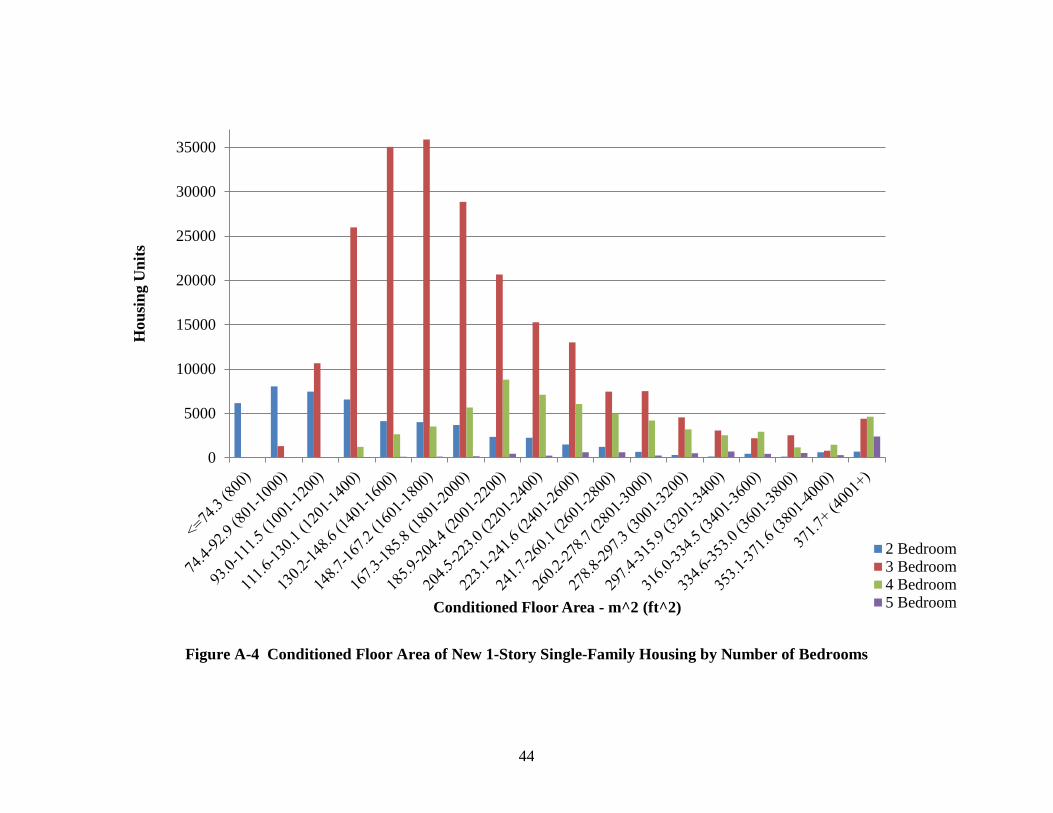
44
Figure A-4 Conditioned Floor Area of New 1-Story Single-Family Housing by Number of Bedrooms
0
5000
10000
15000
20000
25000
30000
35000H
ousi
ng U
nits
Conditioned Floor Area - m^2 (ft^2)
2 Bedroom3 Bedroom4 Bedroom5 Bedroom
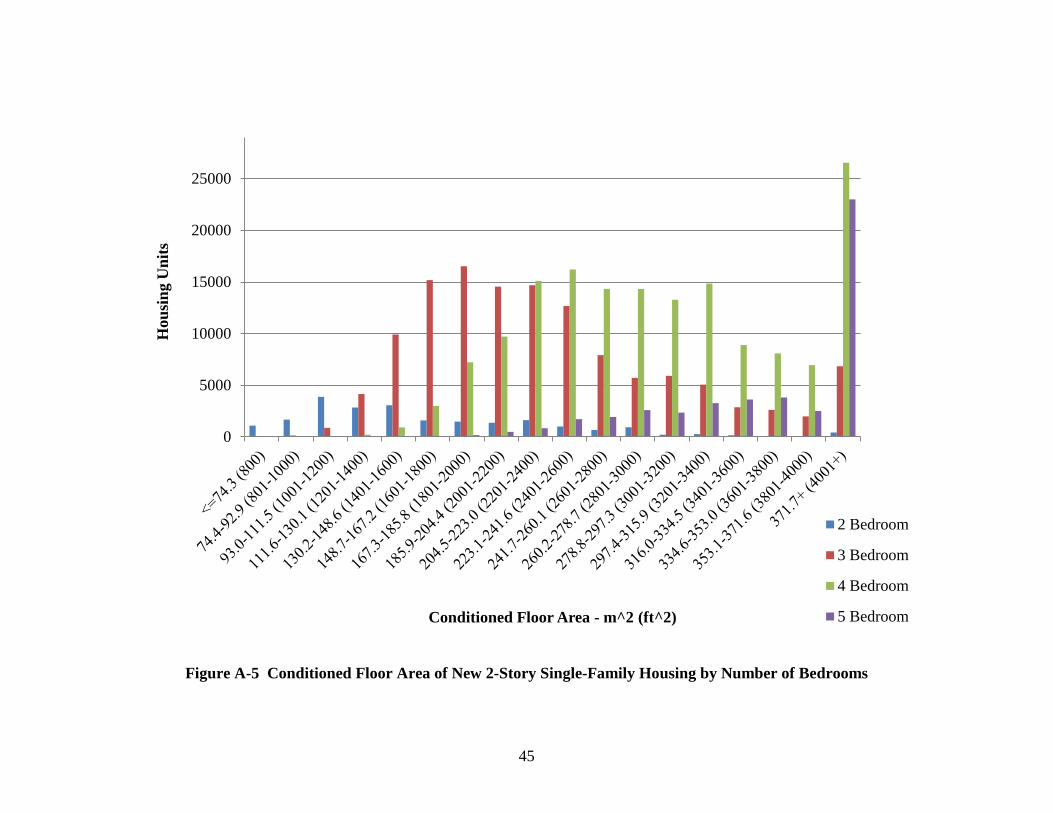
45
Figure A-5 Conditioned Floor Area of New 2-Story Single-Family Housing by Number of Bedrooms
0
5000
10000
15000
20000
25000H
ousi
ng U
nits
Conditioned Floor Area - m^2 (ft^2)
2 Bedroom
3 Bedroom
4 Bedroom
5 Bedroom