Embed Size (px)
Citation preview
ORNL/TM-2017/2
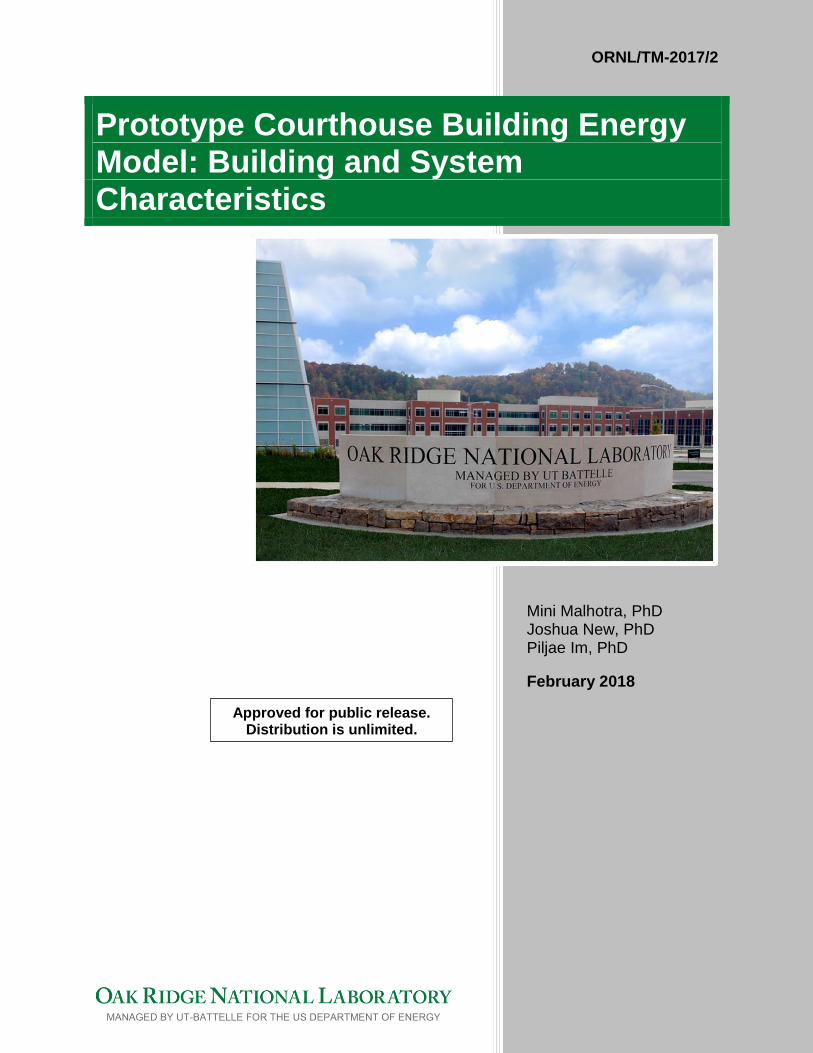
Prototype Courthouse Building Energy Model: Building and System Characteristics
Mini Malhotra, PhD Joshua New, PhD Piljae Im, PhD
February 2018
Approved for public release. Distribution is unlimited.
DOCUMENT AVAILABILITY Reports produced after January 1, 1996, are generally available free via US Department of Energy (DOE) SciTech Connect. Website www.osti.gov Reports produced before January 1, 1996, may be purchased by members of the public from the following source: National Technical Information Service 5285 Port Royal Road Springfield, VA 22161 Telephone 703-605-6000 (1-800-553-6847) TDD 703-487-4639 Fax 703-605-6900 E-mail [email protected] Website http://classic.ntis.gov/ Reports are available to DOE employees, DOE contractors, Energy Technology Data Exchange representatives, and International Nuclear Information System representatives from the following source: Office of Scientific and Technical Information PO Box 62 Oak Ridge, TN 37831 Telephone 865-576-8401 Fax 865-576-5728 E-mail [email protected] Website http://www.osti.gov/contact.html
This report was prepared as an account of work sponsored by an agency of the United States Government. Neither the United States Government nor any agency thereof, nor any of their employees, makes any warranty, express or implied, or assumes any legal liability or responsibility for the accuracy, completeness, or usefulness of any information, apparatus, product, or process disclosed, or represents that its use would not infringe privately owned rights. Reference herein to any specific commercial product, process, or service by trade name, trademark, manufacturer, or otherwise, does not necessarily constitute or imply its endorsement, recommendation, or favoring by the United States Government or any agency thereof. The views and opinions of authors expressed herein do not necessarily state or reflect those of the United States Government or any agency thereof.
ORNL/TM-2017/2
Energy and Transportation Science Division
PROTOTYPE COURTHOUSE BUILDING ENERGY MODEL: BUILDING AND
SYSTEM CHARACTERISTICS
Mini Malhotra, PhD
Joshua New, PhD
Piljae Im, PhD
Date Published: February 2018
Prepared by
OAK RIDGE NATIONAL LABORATORY
Oak Ridge, TN 37831-6283
managed by
UT-BATTELLE, LLC
for the
US DEPARTMENT OF ENERGY
under contract DE-AC05-00OR22725

iii
TABLE OF CONTENTS
LIST OF FIGURES ...................................................................................................................................... v LIST OF TABLES ...................................................................................................................................... vii ACKNOWLEDGMENTS ........................................................................................................................... ix ACRONYMS ............................................................................................................................................... xi EXECUTIVE SUMMARY ....................................................................................................................... xiii 1. INTRODUCTION ................................................................................................................................ 1
1.1 BACKGROUND ........................................................................................................................ 1 1.2 RESOURCES ............................................................................................................................. 2
1.2.1 Design Guides ................................................................................................................ 2 1.2.2 Courthouse Operation .................................................................................................... 2 1.2.3 Database of Courthouses ................................................................................................ 2 1.2.4 Courthouse Projects ....................................................................................................... 3 1.2.5 Personal Communication ............................................................................................... 4
1.3 COURTHOUSE VERSUS OTHER BUILDINGS IN CBECS .................................................. 4 1.3.1 Percent of Total Commercial Building Floor Space ...................................................... 4 1.3.2 Building Floor Area ....................................................................................................... 5 1.3.3 Fuel Consumption Intensity ........................................................................................... 6
2. OVERVIEW OF COURTHOUSES IN THE UNITED STATES........................................................ 7 2.1 US COURT SYSTEM ................................................................................................................ 7
2.1.1 State Courts .................................................................................................................... 7 2.1.2 Federal Courts ................................................................................................................ 7
2.2 FUNCTIONAL SPACES ........................................................................................................... 9 2.3 KEY OPERATIONAL AND ORGANIZATIONAL CONCEPTS .......................................... 10
2.3.1 Grossing and Efficiency Factors .................................................................................. 10 2.3.2 Circulation.................................................................................................................... 10 2.3.3 Adjacency, Stacking and Blocking .............................................................................. 12
2.4 BUILDING SIZE AND SPACE REQUIREMENT DETERMINANTS ................................. 16 2.5 SPACES-SPECIFIC REQUIREMENTS .................................................................................. 16
2.5.1 Area .............................................................................................................................. 16 2.5.2 Ceiling Height .............................................................................................................. 21 2.5.3 Occupancy and Internal Loads ..................................................................................... 21 2.5.4 HVAC Design Conditions ........................................................................................... 23
3. BUILDING DATA ............................................................................................................................. 27 3.1 BUILDING AREA ................................................................................................................... 27 3.2 BUILDING SHAPE .................................................................................................................. 33 3.3 NUMBER OF FLOORS ........................................................................................................... 34 3.4 WINDOWS ............................................................................................................................... 35 3.5 NUMBER OF ELEVATORS ................................................................................................... 36 3.6 CONSTRUCTION .................................................................................................................... 37 3.7 FLOOR LAYOUT .................................................................................................................... 38 3.8 SCHEDULE OF BUILDING USE ........................................................................................... 38 3.9 HVAC SYSTEM ...................................................................................................................... 40
3.9.1 Main heating source and heating equipment ................................................................ 40 3.9.2 Main cooling system type ............................................................................................ 41 3.9.3 Air Handling Unit Type ............................................................................................... 42
4. PROTOTYPE MODELING CHARACTERISTICS .......................................................................... 43 4.1 BUILDING FORM ................................................................................................................... 43
4.1.1 Floor Area, Number of Floors, and Building Shape .................................................... 43
iv
4.1.2 Window Fraction and Window Locations ................................................................... 43 4.1.3 Floor Height ................................................................................................................. 43 4.1.4 Layout of Spaces .......................................................................................................... 43
4.2 STRUCTURE ........................................................................................................................... 47 4.3 HVAC SYSTEM AND CONTROL ......................................................................................... 47 4.4 INTERNAL LOADS AND MISCELLANEOUS LOADS ...................................................... 48
BIBLIOGRAPHY ....................................................................................................................................... 49 APPENDIX A. 2012 CBECS DATA ....................................................................................................... A-1 APPENDIX B. GSA US COURTHOUSE PORTFOLIO DATA ............................................................ B-1
v
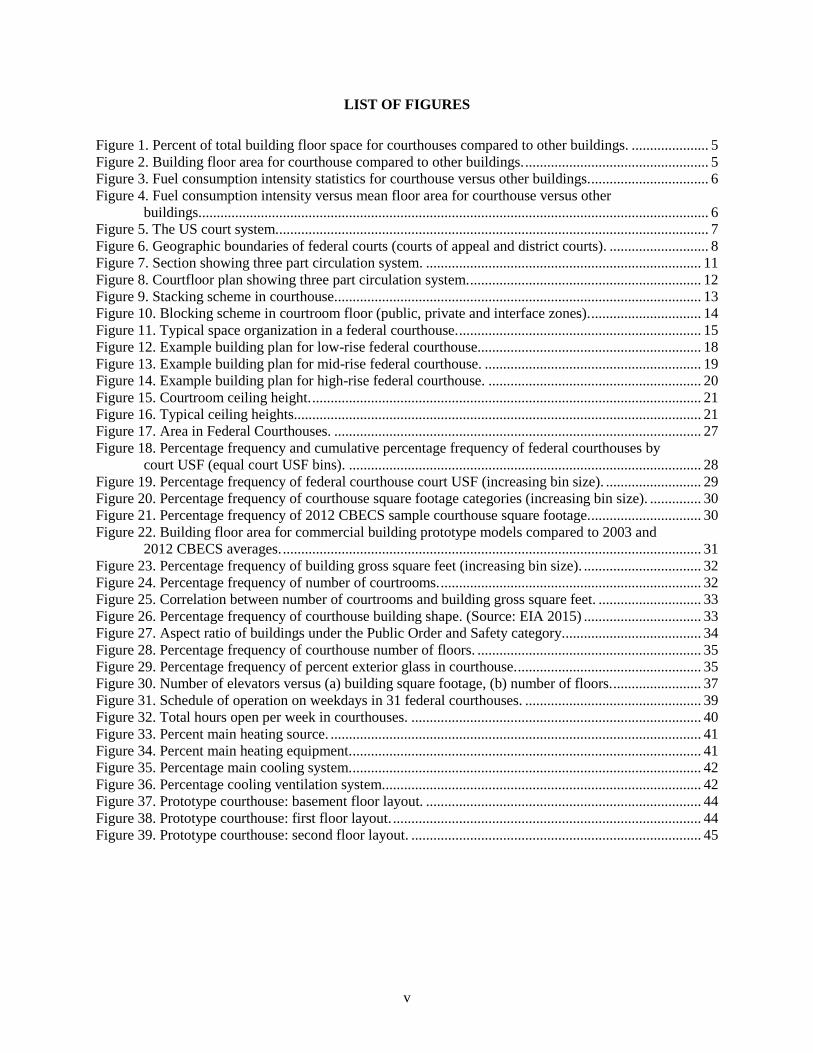
LIST OF FIGURES
Figure 1. Percent of total building floor space for courthouses compared to other buildings. ..................... 5 Figure 2. Building floor area for courthouse compared to other buildings. .................................................. 5 Figure 3. Fuel consumption intensity statistics for courthouse versus other buildings. ................................ 6 Figure 4. Fuel consumption intensity versus mean floor area for courthouse versus other
buildings. .......................................................................................................................................... 6 Figure 5. The US court system...................................................................................................................... 7 Figure 6. Geographic boundaries of federal courts (courts of appeal and district courts). ........................... 8 Figure 7. Section showing three part circulation system. ........................................................................... 11 Figure 8. Courtfloor plan showing three part circulation system. ............................................................... 12 Figure 9. Stacking scheme in courthouse. ................................................................................................... 13 Figure 10. Blocking scheme in courtroom floor (public, private and interface zones). .............................. 14 Figure 11. Typical space organization in a federal courthouse. .................................................................. 15 Figure 12. Example building plan for low-rise federal courthouse............................................................. 18 Figure 13. Example building plan for mid-rise federal courthouse. ........................................................... 19 Figure 14. Example building plan for high-rise federal courthouse. .......................................................... 20 Figure 15. Courtroom ceiling height. .......................................................................................................... 21 Figure 16. Typical ceiling heights............................................................................................................... 21 Figure 17. Area in Federal Courthouses. .................................................................................................... 27 Figure 18. Percentage frequency and cumulative percentage frequency of federal courthouses by
court USF (equal court USF bins). ................................................................................................ 28 Figure 19. Percentage frequency of federal courthouse court USF (increasing bin size). .......................... 29 Figure 20. Percentage frequency of courthouse square footage categories (increasing bin size). .............. 30 Figure 21. Percentage frequency of 2012 CBECS sample courthouse square footage. .............................. 30 Figure 22. Building floor area for commercial building prototype models compared to 2003 and
2012 CBECS averages. .................................................................................................................. 31 Figure 23. Percentage frequency of building gross square feet (increasing bin size). ................................ 32 Figure 24. Percentage frequency of number of courtrooms. ....................................................................... 32 Figure 25. Correlation between number of courtrooms and building gross square feet. ............................ 33 Figure 26. Percentage frequency of courthouse building shape. (Source: EIA 2015) ................................ 33 Figure 27. Aspect ratio of buildings under the Public Order and Safety category...................................... 34 Figure 28. Percentage frequency of courthouse number of floors. ............................................................. 35 Figure 29. Percentage frequency of percent exterior glass in courthouse. .................................................. 35 Figure 30. Number of elevators versus (a) building square footage, (b) number of floors. ........................ 37 Figure 31. Schedule of operation on weekdays in 31 federal courthouses. ................................................ 39 Figure 32. Total hours open per week in courthouses. ............................................................................... 40 Figure 33. Percent main heating source. ..................................................................................................... 41 Figure 34. Percent main heating equipment. ............................................................................................... 41 Figure 35. Percentage main cooling system. ............................................................................................... 42 Figure 36. Percentage cooling ventilation system....................................................................................... 42 Figure 37. Prototype courthouse: basement floor layout. ........................................................................... 44 Figure 38. Prototype courthouse: first floor layout. .................................................................................... 44 Figure 39. Prototype courthouse: second floor layout. ............................................................................... 45


vii
LIST OF TABLES
Table 1. Example area program for low-rise, mid-rise and high-rise federal courthouse ........................... 17 Table 2. Indoor design conditions. .............................................................................................................. 23 Table 3. HVAC requirements by space type ............................................................................................... 26 Table 4. Prototype courthouse area program. ............................................................................................. 45

ix
ACKNOWLEDGMENTS
This work was funded by field work proposal CEBT105 under the Department of Energy Building
Technology Activity Number BT0201000. We would like to thank Amir Roth for his support and review
of this project.
The authors acknowledge several individuals and organizations who have provided significant help in
conducting this research.
Don Hardenbergh, Court Works
Michael Griebel, Research Design Solutions LLC
John Sporidis, Vanderweil Engineers
Henry Pittner, AIA, BVK Group Architects & Engineers
Bob Schwartz, HOK
Bob S. Slattery, Oak Ridge National Laboratory
Bing Liu, Pacific Northwest National Laboratory
Mark Halverson, Pacific Northwest National Laboratory
National Center for States Courts
US General Services Administration
The Federal Judiciary of the United States

xi
ACRONYMS
AHU air handling unit
AIA American Institute of Architects
A/V audio/visual
BGSF building gross square feet
CAV Constant Air Volume
CBECS Commercial Building Energy Consumption Survey
Cfm cubic feet per minute
CGSF component gross square feet
CHW chilled water
CSOP Court Statistics Project
DGSF departmental gross square feet
DOE Department of Energy
ESPC Energy Savings Performance Contract
FEMP Federal Energy Management Program
GSA General Service Administration
GSF gross square feet
HVAC heating, ventilation, and air conditioning
HW hot water
IECC International Energy Conservation Code
IGA investment grade audit
JCUS The Judicial Conference of the United States
JFR Justice Facilities Review
NCSC National Center for State Courts
NSF net square feet
ORNL Oak Ridge National Laboratory
PNNL Pacific Northwest National Laboratory
RSF rentable square feet
SCO State Court Organization
SHW service hot water
EIA US Energy Information Administration
USCDG US Courts Design Guide
USF usable square feet
VAV variable air volume
WBDG whole-building design guide
WWR window-to-wall area ratio

EXECUTIVE SUMMARY
As part of the Department of Energy’s support of ANSI/ASHRAE/IES Standard 90.1 and the
International Energy Conservation Code, researchers at Pacific Northwest National Laboratory apply a
suite of prototype buildings covering 80% of the commercial building floor area in the United States for
new construction. Efforts have begun to cover 90% of the commercial building floor area in the United
States by developing prototype models for additional building types that include supermarket, laboratory,
place of worship, public order and safety, and public assembly. “Courthouse” is a subcategory under the
“Public Order and Safety” building type category defined by the Commercial Buildings Energy
Consumption Survey (CBECS); other subcategories include police station, fire station, and detention and
correctional facilities (i.e., jail, reformatory, or penitentiary).
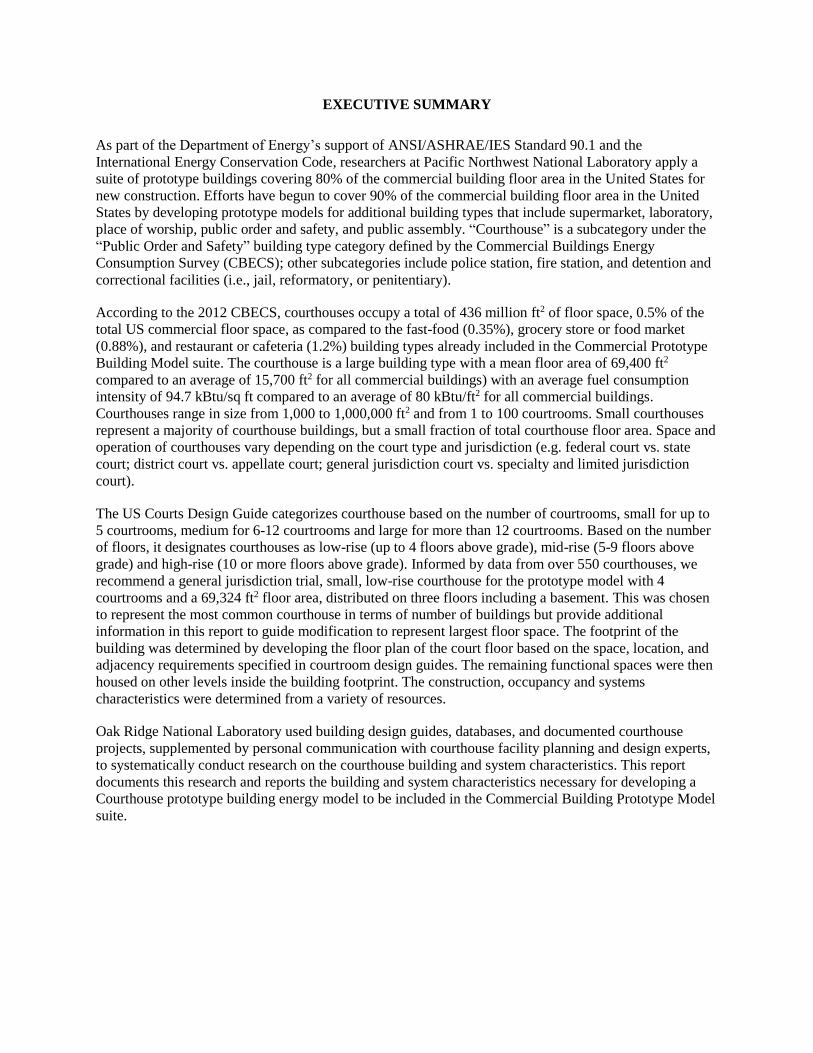
According to the 2012 CBECS, courthouses occupy a total of 436 million ft2 of floor space, 0.5% of the
total US commercial floor space, as compared to the fast-food (0.35%), grocery store or food market
(0.88%), and restaurant or cafeteria (1.2%) building types already included in the Commercial Prototype
Building Model suite. The courthouse is a large building type with a mean floor area of 69,400 ft2
compared to an average of 15,700 ft2 for all commercial buildings) with an average fuel consumption
intensity of 94.7 kBtu/sq ft compared to an average of 80 kBtu/ft2 for all commercial buildings.
Courthouses range in size from 1,000 to 1,000,000 ft2 and from 1 to 100 courtrooms. Small courthouses
represent a majority of courthouse buildings, but a small fraction of total courthouse floor area. Space and
operation of courthouses vary depending on the court type and jurisdiction (e.g. federal court vs. state
court; district court vs. appellate court; general jurisdiction court vs. specialty and limited jurisdiction
court).
The US Courts Design Guide categorizes courthouse based on the number of courtrooms, small for up to
5 courtrooms, medium for 6-12 courtrooms and large for more than 12 courtrooms. Based on the number
of floors, it designates courthouses as low-rise (up to 4 floors above grade), mid-rise (5-9 floors above
grade) and high-rise (10 or more floors above grade). Informed by data from over 550 courthouses, we
recommend a general jurisdiction trial, small, low-rise courthouse for the prototype model with 4
courtrooms and a 69,324 ft2 floor area, distributed on three floors including a basement. This was chosen
to represent the most common courthouse in terms of number of buildings but provide additional
information in this report to guide modification to represent largest floor space. The footprint of the
building was determined by developing the floor plan of the court floor based on the space, location, and
adjacency requirements specified in courtroom design guides. The remaining functional spaces were then
housed on other levels inside the building footprint. The construction, occupancy and systems
characteristics were determined from a variety of resources.
Oak Ridge National Laboratory used building design guides, databases, and documented courthouse
projects, supplemented by personal communication with courthouse facility planning and design experts,
to systematically conduct research on the courthouse building and system characteristics. This report
documents this research and reports the building and system characteristics necessary for developing a
Courthouse prototype building energy model to be included in the Commercial Building Prototype Model
suite.
1
1. INTRODUCTION
1.1 BACKGROUND
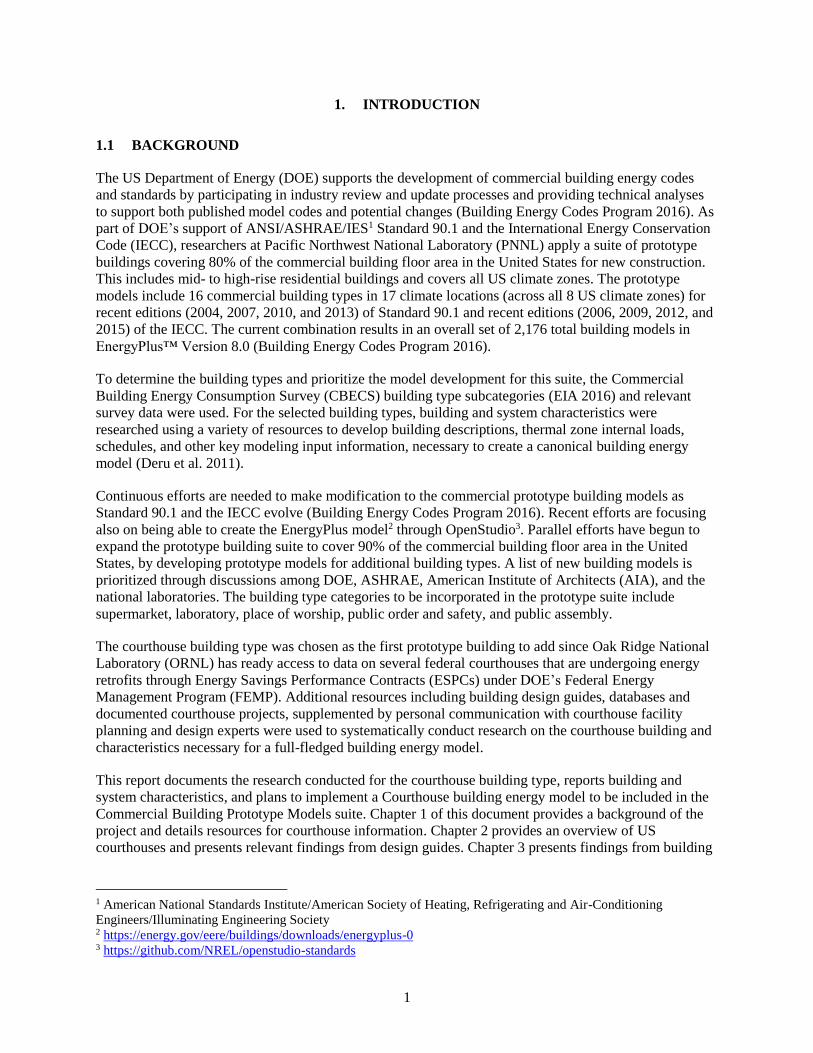
The US Department of Energy (DOE) supports the development of commercial building energy codes
and standards by participating in industry review and update processes and providing technical analyses
to support both published model codes and potential changes (Building Energy Codes Program 2016). As
part of DOE’s support of ANSI/ASHRAE/IES1 Standard 90.1 and the International Energy Conservation
Code (IECC), researchers at Pacific Northwest National Laboratory (PNNL) apply a suite of prototype
buildings covering 80% of the commercial building floor area in the United States for new construction.
This includes mid- to high-rise residential buildings and covers all US climate zones. The prototype
models include 16 commercial building types in 17 climate locations (across all 8 US climate zones) for
recent editions (2004, 2007, 2010, and 2013) of Standard 90.1 and recent editions (2006, 2009, 2012, and
2015) of the IECC. The current combination results in an overall set of 2,176 total building models in
EnergyPlus™ Version 8.0 (Building Energy Codes Program 2016).
To determine the building types and prioritize the model development for this suite, the Commercial
Building Energy Consumption Survey (CBECS) building type subcategories (EIA 2016) and relevant
survey data were used. For the selected building types, building and system characteristics were
researched using a variety of resources to develop building descriptions, thermal zone internal loads,
schedules, and other key modeling input information, necessary to create a canonical building energy
model (Deru et al. 2011).
Continuous efforts are needed to make modification to the commercial prototype building models as
Standard 90.1 and the IECC evolve (Building Energy Codes Program 2016). Recent efforts are focusing
also on being able to create the EnergyPlus model2 through OpenStudio3. Parallel efforts have begun to
expand the prototype building suite to cover 90% of the commercial building floor area in the United
States, by developing prototype models for additional building types. A list of new building models is
prioritized through discussions among DOE, ASHRAE, American Institute of Architects (AIA), and the
national laboratories. The building type categories to be incorporated in the prototype suite include
supermarket, laboratory, place of worship, public order and safety, and public assembly.
The courthouse building type was chosen as the first prototype building to add since Oak Ridge National
Laboratory (ORNL) has ready access to data on several federal courthouses that are undergoing energy
retrofits through Energy Savings Performance Contracts (ESPCs) under DOE’s Federal Energy
Management Program (FEMP). Additional resources including building design guides, databases and
documented courthouse projects, supplemented by personal communication with courthouse facility
planning and design experts were used to systematically conduct research on the courthouse building and
characteristics necessary for a full-fledged building energy model.
This report documents the research conducted for the courthouse building type, reports building and
system characteristics, and plans to implement a Courthouse building energy model to be included in the
Commercial Building Prototype Models suite. Chapter 1 of this document provides a background of the
project and details resources for courthouse information. Chapter 2 provides an overview of US
courthouses and presents relevant findings from design guides. Chapter 3 presents findings from building
1 American National Standards Institute/American Society of Heating, Refrigerating and Air-Conditioning
Engineers/Illuminating Engineering Society 2 https://energy.gov/eere/buildings/downloads/energyplus-0 3 https://github.com/NREL/openstudio-standards
2
databases on courthouses and documented courthouse projects. Chapter 4 presents recommendations for
the building and system characteristics required to develop the prototype courthouse energy model.
1.2 RESOURCES
1.2.1 Design Guides
Several courthouse design guides were reviewed to provide functional program requirements, adjacency
relationships, and performance criteria for related building systems. Key resources include:
• General design guides
o Phillips and Griebel (2003)
o Hardenbergh et al. (1991)
o The Virtual Courthouse (n.d.)
o Wong (2001)
o The American Courthouse (1973)
• Design guides for federal courts
o US Courts Design Guide (USCDG; 2007)
o US General Services Administration (GSA; 2017a, n.d.)
o Whole-building design guide (WBDG; 2016a, 2016b, 2016c)
o Thacker (2017)
• Design guides for state courts
o California: California Trial Court Facilities Standards (draft) (2011)
o Illinois: Minimum Courtroom Standards in the State of Illinois (2011)
o Kentucky: Kentucky Court Facilities Criteria (2007), Kentucky Court Facilities Design
Guide (2007)
o Michigan: The Michigan Courthouse (2000)
o Nebraska: Nebraska Courts Facility Planning (1999)
o New York: Guidelines for New York State Court Facilities (2009)
o Utah: Utah Judicial Facility Design Standards (2016)
o Virginia: Hardenbergh (2015)
In addition, supplemental sources were reviewed to determine space requirements for security (Griebel
and Phillips 2001), circulation (GSA 2012), and detention area (Kimme & Associates, Inc. 1998).
1.2.2 Courthouse Operation
In order to determine the function and schedule of different spaces in a courthouse, courthouse operation
was reviewed from resources from the American Bar Association (ABA 2017), the US Department of
Justice (Offices of the US Attorneys 2017) and the US Courts (Administrative Office of the US Courts
2016, US Courts 2017).
1.2.3 Database of Courthouses
2012 CBECS data: The 2012 CBECS public use microdata (EIA 2015) includes a detailed set of data for
a statistical sample of 26 courthouses ranging from 1,300 to 800,000 ft2. Combined with sample weights,
they represent 6,278 courthouses in the United States. This dataset provides a range of information
including general building characteristics (e.g. building square footage, number of floors, glass area, and
floor height); construction characteristics; schedules of use; and heating, ventilation, and air-conditioning
(HVAC) system characteristics.
3
1992 CBECS data: The 1992 CBECS public use microdata (EIA 1996) includes a detailed set of data for
a statistical sample of 83 buildings under public order and safety. This dataset is used to supplement
information not available in the 2012 CBECS database (e.g. building aspect ratio).
Court Statistics Project DataViewer: The Court Statistics Project provides an interactive tool that
serves caseload data and population served by state courts (Schauffler et al. 2017). A rough correlation is
found between the number of caseloads and population in order to inform a common number of
courtrooms.
State Court Organization App: This interactive, web-based application presents detailed comparative
data about how state trial and appellate courts are organized and administered (Strickland et al. 2017). It
includes a complete list of court types established in each state, which we use to determine the type of
court the prototype model should represent.
U.S. General Services Administration (GSA) Portfolio Data: GSA manages leased and owned assets
of the federal government covering a variety of facility types including office buildings, courthouses, land
ports of entry, and warehouses. The Office of Portfolio Management at GSA maintains a portfolio of
these assets. According to the FY 2016 State of the Portfolio Snapshot (GSA 2016), federal courthouses
constitute rentable square feet (RSF) of 29.7 million sq ft as owned assets and 1.3 million sq ft in leased
assets (i.e., a total of 31 million sq ft).
A subset of GSA Portfolio Data on courthouses (GSA 2017b) was obtained that lists 158 federal
buildings covering 34.65 million building gross square feet (BGSF). Federal courthouse buildings may
include a post office or other federal offices. Excluding all non-court functions, covered parking, common
spaces (lobbies, corridors, mechanical and electrical service areas, toilet, janitorial, loading docks),
vertical penetrations (stairs, elevators, service shafts, etc.), and exterior walls, these buildings comprise
17.23 million sq ft of total court usable square feet (USF). This data helped investigate the area statistics
in federal courthouses.
1.2.4 Courthouse Projects
Courthouse Retrospective book series: The National Center for State Courts (NCSC) publishes three
volumes of a series that chronicles the major courthouse design trends of three decades 1980-1991
(Hardenbergh 1992), 1991-2001 (Hardenbergh and Phillips 2001), and 2001-2010 (Yeh et al. 2010a).
Each volume is a collection of several courthouse projects featuring a full range of court jurisdictions,
including federal, state, local, and international courts, and illustrates architectural innovations and
solutions sought in addressing the evolving judicial needs of the decades. Collectively, there are 236
courthouse projects included in these volumes. Projects included in each publication were submitted by
architectural design firms in response to call for entries by NCSC and selected by a jury composed of
justice system professional and courts planning and design professionals. Yeh et al. (2010b) summarizes
the evolving courthouse design issues documented in these volumes.
These publications provide an overview description and technical data for each project including the
building square footage, number of courtrooms, typical court floor plans, photos of the inside and/or
outside of the building, and a discussion on the overall design trend including the courtroom design,
massing strategies, and architectural style reflected in the façade and use of materials.
Justice Facilities Review archive: The Justice Facilities Review (JFR) is an annual publication by the
American Institute of Architects (AIA), which documents best practices in planning and design for Justice
Architecture. Publications for the last 21 years (1997-2016) are available online (AIA 2017). Each
publication includes up to 12 courthouse projects, submitted by architectural design firms and selected by
4
a jury composed of justice system professional and courts planning and design professionals. Many
projects included in these publications overlap with those included in the Courthouse Retrospective series.
Investment grade audit (IGA) documentation of federal courthouses4: Under FEMP ESPCs, 31
awarded projects in 2010 included federal courthouses in four states including Arkansas, Louisiana, New
Mexico, and Texas. The IGA documentation of these projects provides information on general building
characteristics, construction, occupancy, detailed information on HVAC systems and controls, and energy
and water use.
1.2.5 Personal Communication
Personal communication with architects, facility design, and planning experts specialized in courthouses
helped the team identify useful resources; understand courthouse operations, space requirements, and
occupancy characteristics; and develop area programming and floor plans.
1.3 COURTHOUSE VERSUS OTHER BUILDINGS IN CBECS
According to CBECS Building Type Definitions (EIA n.d., 2016), courthouse is a subcategory under the
“Public Order and Safety” building type category; other sub-categories include police station/fire station
and jail, reformatory, or penitentiary (i.e., detention or correctional facilities). To gauge courthouses’
share of the existing US building stock and the energy used in the buildings, the 2012 CBECS data (EIA
2016) for courthouse is compared with other building types included in the Commercial Prototype
Building Models suite (Building Energy Codes Program 2016)5.
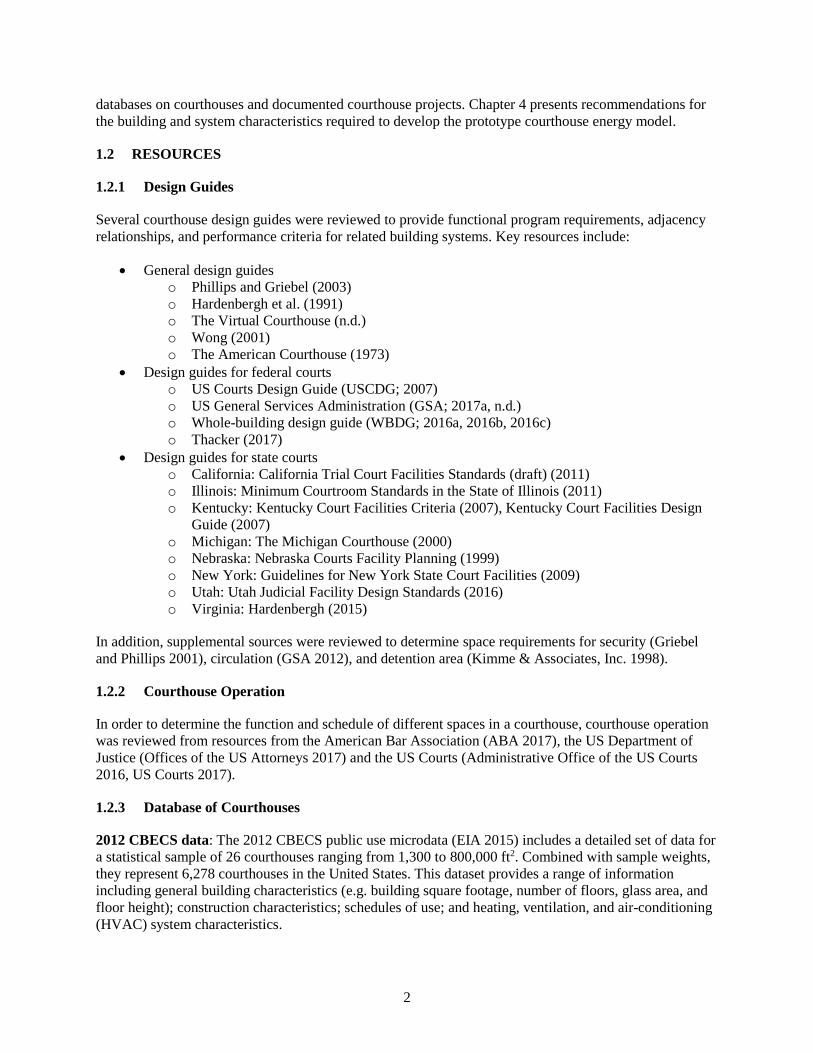
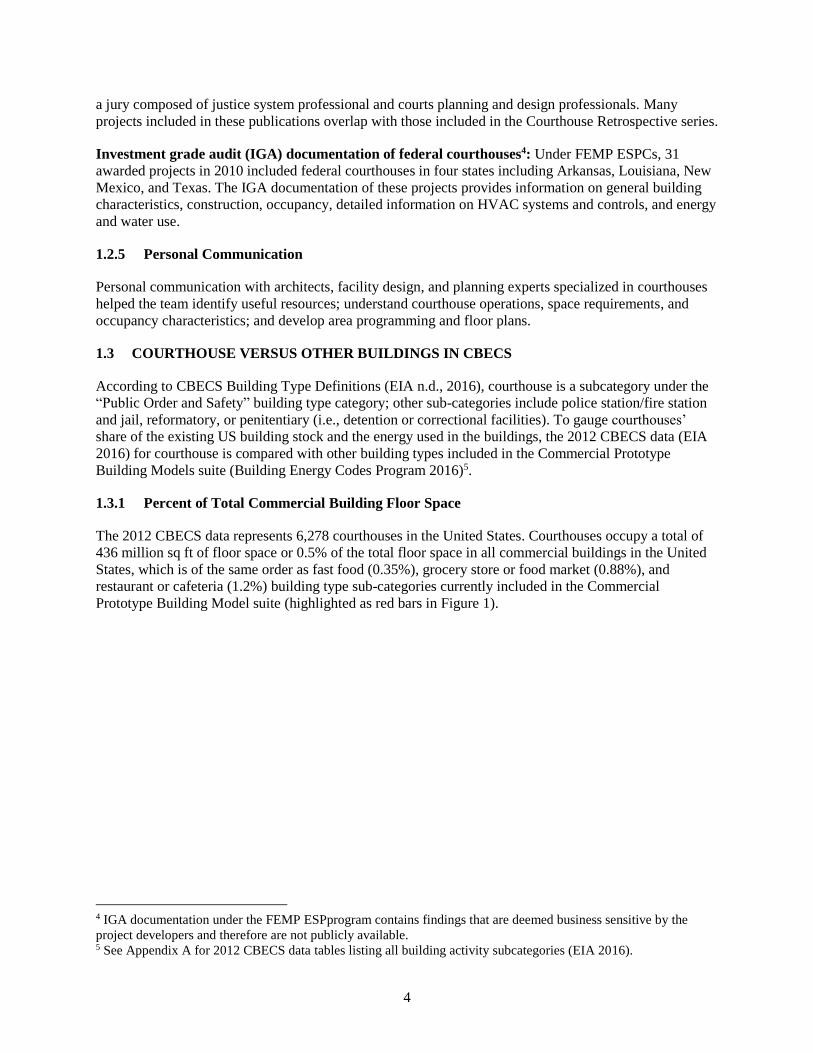
1.3.1 Percent of Total Commercial Building Floor Space
The 2012 CBECS data represents 6,278 courthouses in the United States. Courthouses occupy a total of
436 million sq ft of floor space or 0.5% of the total floor space in all commercial buildings in the United
States, which is of the same order as fast food (0.35%), grocery store or food market (0.88%), and
restaurant or cafeteria (1.2%) building type sub-categories currently included in the Commercial
Prototype Building Model suite (highlighted as red bars in Figure 1).
4 IGA documentation under the FEMP ESPprogram contains findings that are deemed business sensitive by the
project developers and therefore are not publicly available. 5 See Appendix A for 2012 CBECS data tables listing all building activity subcategories (EIA 2016).
5
Figure 1. Percent of total building floor space for courthouses compared to other buildings currently in the
Commercial Prototype Building Model suite. (Source: EIA 2015)
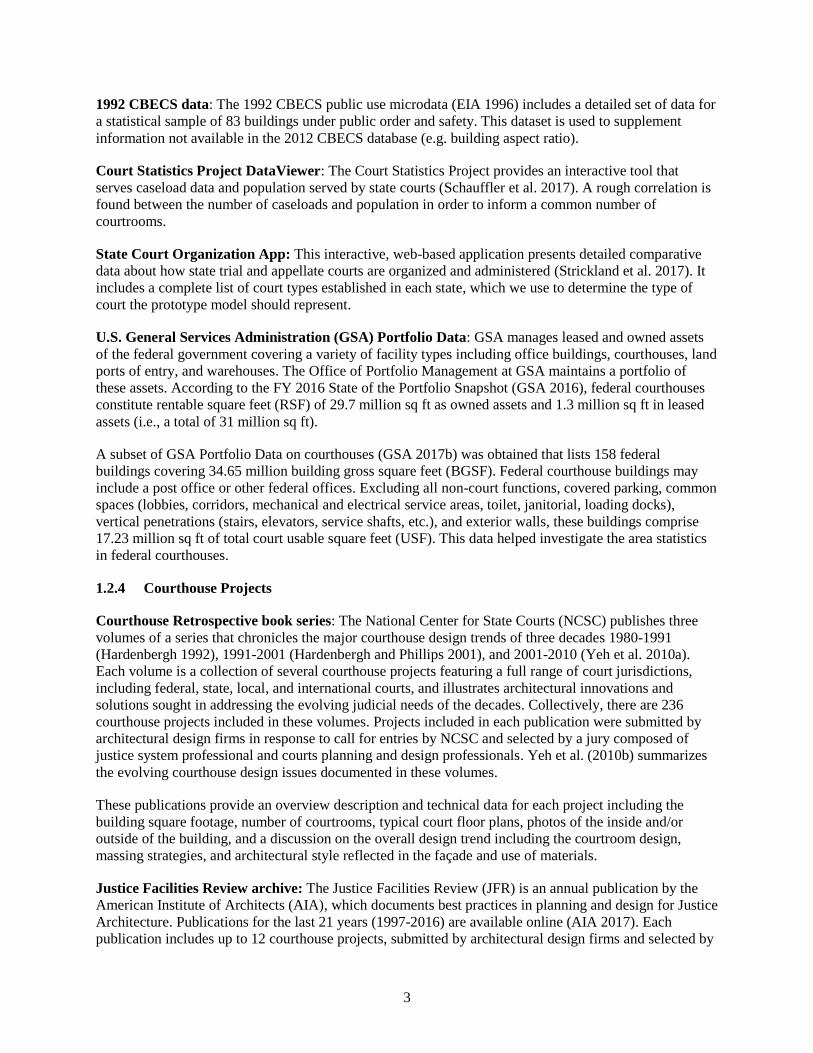
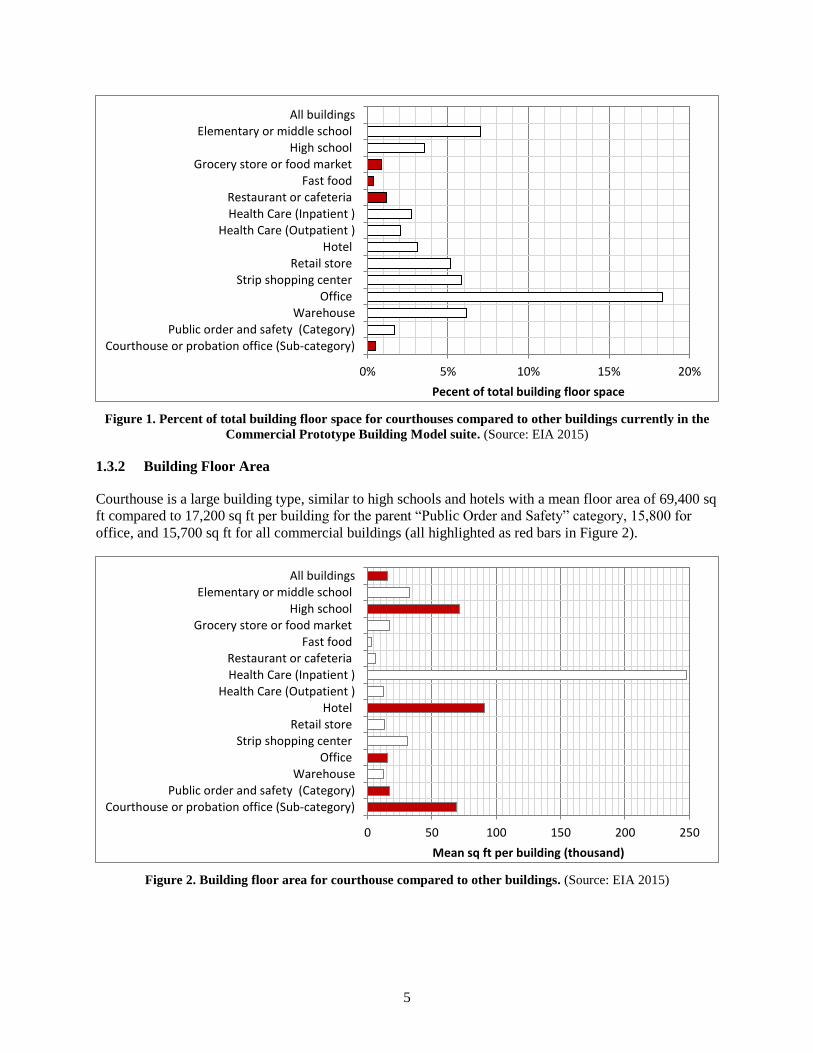
1.3.2 Building Floor Area
Courthouse is a large building type, similar to high schools and hotels with a mean floor area of 69,400 sq
ft compared to 17,200 sq ft per building for the parent “Public Order and Safety” category, 15,800 for
office, and 15,700 sq ft for all commercial buildings (all highlighted as red bars in Figure 2).
Figure 2. Building floor area for courthouse compared to other buildings. (Source: EIA 2015)
0% 5% 10% 15% 20%
All buildingsElementary or middle school
High schoolGrocery store or food market
Fast foodRestaurant or cafeteriaHealth Care (Inpatient )
Health Care (Outpatient )Hotel
Retail storeStrip shopping center
OfficeWarehouse
Public order and safety (Category)Courthouse or probation office (Sub-category)
Pecent of total building floor space
0 50 100 150 200 250
All buildingsElementary or middle school
High schoolGrocery store or food market
Fast foodRestaurant or cafeteriaHealth Care (Inpatient )
Health Care (Outpatient )Hotel
Retail storeStrip shopping center
OfficeWarehouse
Public order and safety (Category)Courthouse or probation office (Sub-category)
Mean sq ft per building (thousand)
6
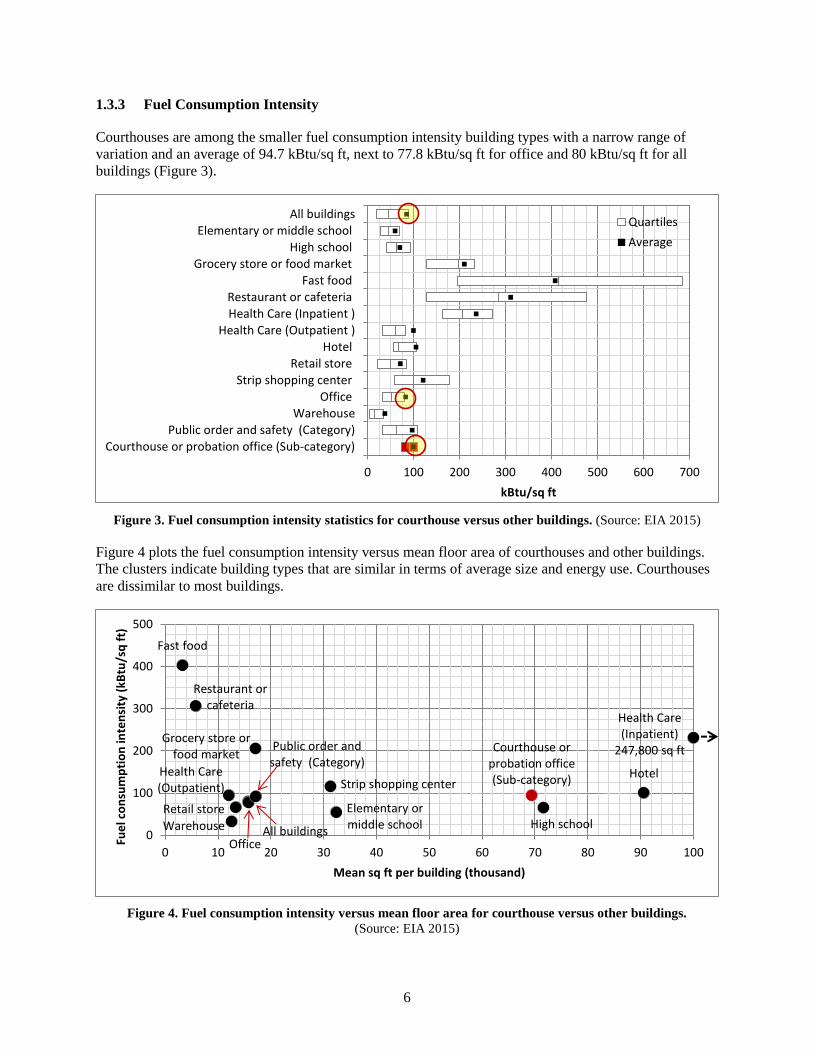
1.3.3 Fuel Consumption Intensity
Courthouses are among the smaller fuel consumption intensity building types with a narrow range of
variation and an average of 94.7 kBtu/sq ft, next to 77.8 kBtu/sq ft for office and 80 kBtu/sq ft for all
buildings (Figure 3).
Figure 3. Fuel consumption intensity statistics for courthouse versus other buildings. (Source: EIA 2015)
Figure 4 plots the fuel consumption intensity versus mean floor area of courthouses and other buildings.
The clusters indicate building types that are similar in terms of average size and energy use. Courthouses
are dissimilar to most buildings.
Figure 4. Fuel consumption intensity versus mean floor area for courthouse versus other buildings.
(Source: EIA 2015)
0 100 200 300 400 500 600 700
All buildings
Elementary or middle school
High school
Grocery store or food market
Fast food
Restaurant or cafeteria
Health Care (Inpatient )
Health Care (Outpatient )
Hotel
Retail store
Strip shopping center
Office
Warehouse
Public order and safety (Category)
Courthouse or probation office (Sub-category)
kBtu/sq ft
Quartiles
Average
All buildings
Elementary or middle school High school
Grocery store or food market
Fast food
Restaurant or cafeteria
Health Care (Inpatient)
247,800 sq ft
Health Care (Outpatient)
Hotel
Retail store
Strip shopping center
Office
Warehouse
Public order and safety (Category)
Courthouse or probation office (Sub-category)
0
100
200
300
400
500
0 10 20 30 40 50 60 70 80 90 100
Fue
l co
nsu
mp
tio
n in
ten
sity
(kB
tu/s
q f
t)
Mean sq ft per building (thousand)
7
2. OVERVIEW OF COURTHOUSES IN THE UNITED STATES
Characteristics of courthouses in the United States vary widely in terms of court type, operations, and
size. Prior to researching the building and system characteristics for courthouses, it is important to
recognize the types, operations and statistics of the courts that comprise the US court system. This can be
used to prioritize and define a narrative for the prototype model in order to represent most, if not all, types
of courts. Understanding court operations is important to accurately defining the space types, usage,
occupancy characteristics, and schedule of use for those spaces.
2.1 US COURT SYSTEM
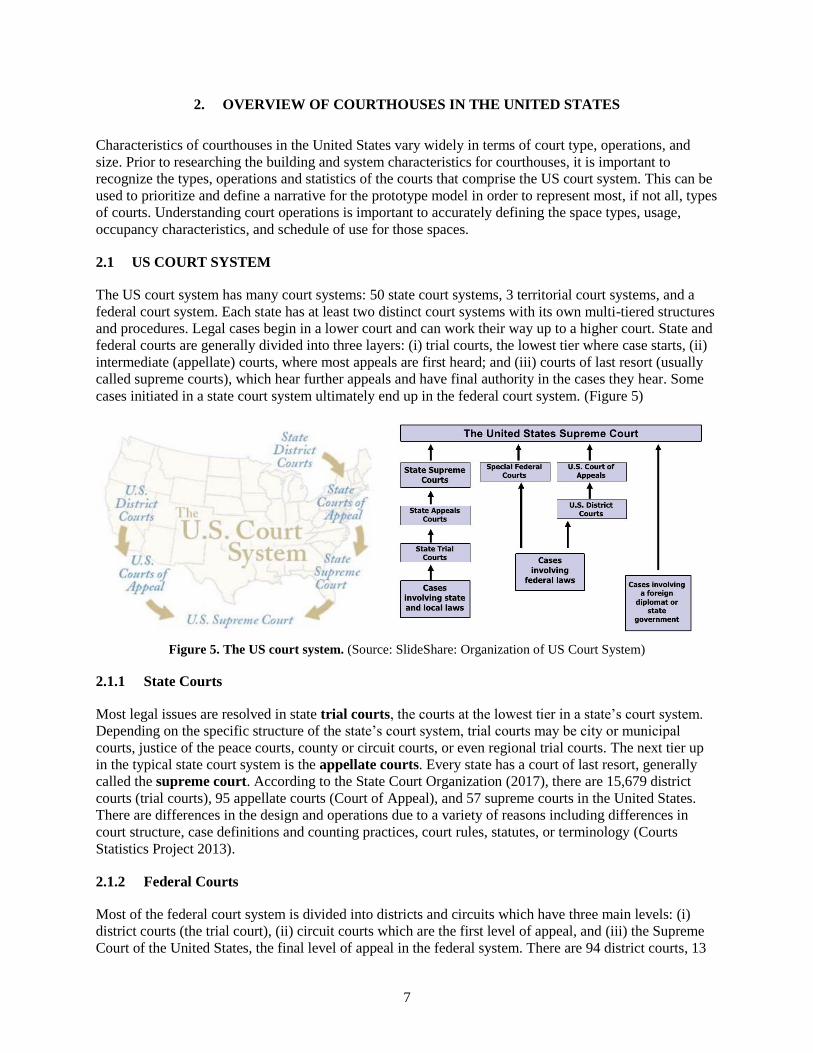
The US court system has many court systems: 50 state court systems, 3 territorial court systems, and a
federal court system. Each state has at least two distinct court systems with its own multi-tiered structures
and procedures. Legal cases begin in a lower court and can work their way up to a higher court. State and
federal courts are generally divided into three layers: (i) trial courts, the lowest tier where case starts, (ii)
intermediate (appellate) courts, where most appeals are first heard; and (iii) courts of last resort (usually
called supreme courts), which hear further appeals and have final authority in the cases they hear. Some
cases initiated in a state court system ultimately end up in the federal court system. (Figure 5)
Figure 5. The US court system. (Source: SlideShare: Organization of US Court System)
2.1.1 State Courts
Most legal issues are resolved in state trial courts, the courts at the lowest tier in a state’s court system.
Depending on the specific structure of the state’s court system, trial courts may be city or municipal
courts, justice of the peace courts, county or circuit courts, or even regional trial courts. The next tier up
in the typical state court system is the appellate courts. Every state has a court of last resort, generally
called the supreme court. According to the State Court Organization (2017), there are 15,679 district
courts (trial courts), 95 appellate courts (Court of Appeal), and 57 supreme courts in the United States.
There are differences in the design and operations due to a variety of reasons including differences in
court structure, case definitions and counting practices, court rules, statutes, or terminology (Courts
Statistics Project 2013).
2.1.2 Federal Courts
Most of the federal court system is divided into districts and circuits which have three main levels: (i)
district courts (the trial court), (ii) circuit courts which are the first level of appeal, and (iii) the Supreme
Court of the United States, the final level of appeal in the federal system. There are 94 district courts, 13
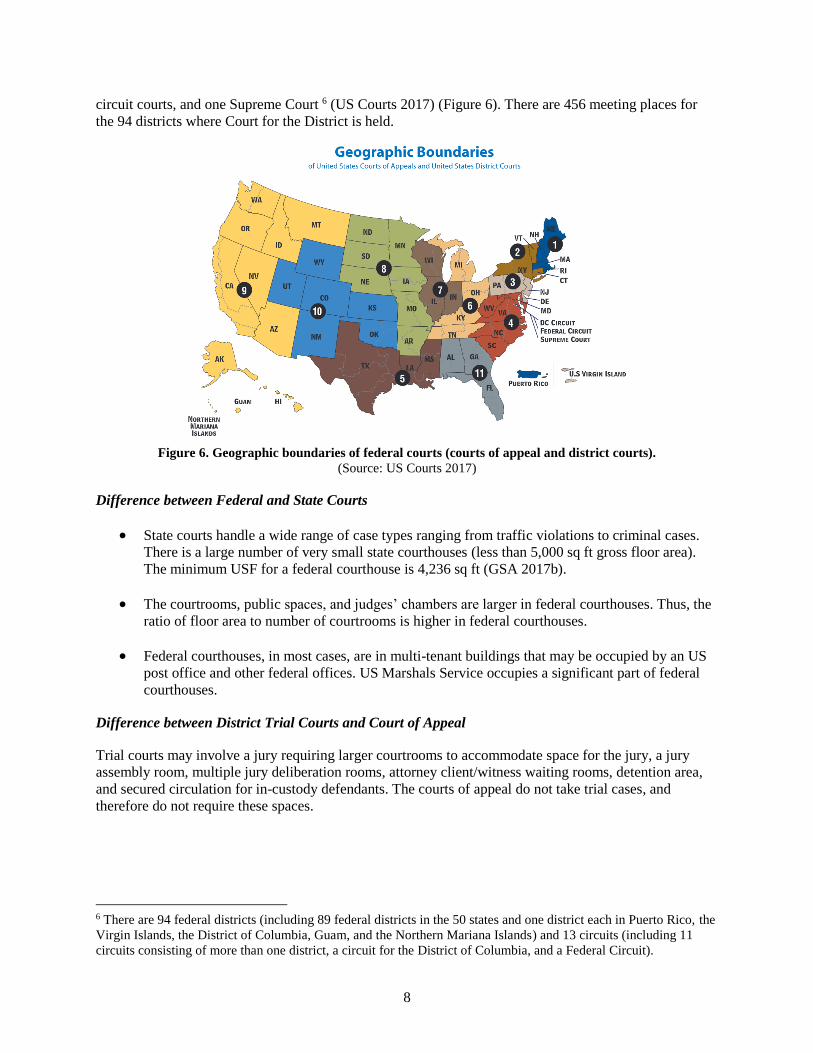
8
circuit courts, and one Supreme Court 6 (US Courts 2017) (Figure 6). There are 456 meeting places for
the 94 districts where Court for the District is held.
Figure 6. Geographic boundaries of federal courts (courts of appeal and district courts).
(Source: US Courts 2017)
Difference between Federal and State Courts
• State courts handle a wide range of case types ranging from traffic violations to criminal cases.
There is a large number of very small state courthouses (less than 5,000 sq ft gross floor area).
The minimum USF for a federal courthouse is 4,236 sq ft (GSA 2017b).
• The courtrooms, public spaces, and judges’ chambers are larger in federal courthouses. Thus, the
ratio of floor area to number of courtrooms is higher in federal courthouses.
• Federal courthouses, in most cases, are in multi-tenant buildings that may be occupied by an US
post office and other federal offices. US Marshals Service occupies a significant part of federal
courthouses.
Difference between District Trial Courts and Court of Appeal
Trial courts may involve a jury requiring larger courtrooms to accommodate space for the jury, a jury
assembly room, multiple jury deliberation rooms, attorney client/witness waiting rooms, detention area,
and secured circulation for in-custody defendants. The courts of appeal do not take trial cases, and
therefore do not require these spaces.
6 There are 94 federal districts (including 89 federal districts in the 50 states and one district each in Puerto Rico, the
Virgin Islands, the District of Columbia, Guam, and the Northern Mariana Islands) and 13 circuits (including 11
circuits consisting of more than one district, a circuit for the District of Columbia, and a Federal Circuit).
9
2.2 FUNCTIONAL SPACES
Courthouses are used by a variety of people including judges, attorneys, witnesses, victims, in-custody
defendants, clerks, other employees, outside social agencies, the press, and the general public. The
characteristic spaces in a courthouse include courtrooms, judge’s suites, offices, lobby, waiting areas, and
secured parking or garage (for judges, court officers, and others with high security clearance). Trial
courthouses additionally require spaces for jury operation. The location, size, and occupancy of these
spaces are based on the following requirements (Don Hardenbergh, February 15, 2017):
• Courtrooms: separate access from public circulation, private circulation and secured circulation
o Court support: audio/visual (A/V) equipment room, evidence and exhibit storage rooms
(in private circulation areas),
o Courtroom waiting
o Attorney-client/witness waiting rooms: two per courtroom
o Sound lock vestibule: between courtroom and waiting area
• Judges suite: Courtroom floors or dedicated floor(s)
o Judge’s chamber with a toilet
o Conference room
o Staff
o Support
• Court clerk
o Open office: staff area, counters facing queuing area
o Clerk office (private)
• Court administration
• In-custody Defendant holding
o Central: Basement or lower floor, entrance through sally port, a central control area,
equipment loads, connection to secure elevators.
o Distributed: on courtroom floors usually serving pairs of courtrooms.
• Jury spaces
o Jury assembly area: first floor, seating facing A/V or podium, lounge, toilets
o Jury deliberation suite: located on courtroom floors, access from private circulation, with
two toilets, sound lock vestibule
• Law library (optional)
• Court reporters
• Public support
o Lobby: First floor, through a security screening area
o Vending/snack bar
• Building support:
o Mail room
o Maintenance area
o Storage
o Mechanical/electrical room
• Building entrances:
o A shared staff and public entrance;
o A separate entrance for judges and bench officers (from secured parking)
o A loading zone for delivery vehicles
• Circulation:
o Public circulation: public stairs and elevators; corridors
o Private circulation: separate corridors for staff, judges, and jury; separate elevator and
stairs for judges from secured parking to judge’s chambers
10
o Secured circulation: corridors wide enough to allow 3 people in one direction and one
from the opposite direction; detention elevators
• Parking:
o Secure parking: for judges, court officers, and others with high security clearance
(adjacent to or within the courthouse)
o General Parking: for all other courthouse users; 2-4 spaces per 1,000 BGSF
2.3 KEY OPERATIONAL AND ORGANIZATIONAL CONCEPTS
Courthouses have several unique characteristics which differentiate them from commercial office
buildings and government administration buildings.
2.3.1 Grossing and Efficiency Factors
According to The Virtual Courthouse (n.d.), courthouses have relatively less space efficiency compared to
typical commercial office buildings due to special volume, circulation and security needs.
• Net square feet (NSF) includes space required for a particular function, exclusive of interior wall
or circulation space around the functional area. NSF for a courthouse is typically 57-65%
compared to 66-70% in a typical commercial office building.
• Departmental gross square feet (DGSF)7 equals NSF plus circulation factor that includes space
for interior walls and partitions, internal corridors, and circulation among functional components.
DGSF for a courthouse should be 75-85% (1.3-1.4 times NSF). DGSF for administrative
purposes is similar to those in commercial offices or govt. administration buildings. DGSF of
courtrooms and holding facilities typically require considerably more internal circulation.
• Building gross square feet (BGSF) includes basic core functions to link various functional
departments and transport people among floors (corridors, public elevators and elevator lobbies,
private and secure elevators, stairs, mechanical electrical and plumbing chases, public toilet
facilities, and the exterior walls of the building). Main lobbies, bulk storage areas and major
mechanical systems might be treated as net assignable spaces. Considering BGSF to be 100%, in
a typical courthouse (1.18-1.25 times DGSF).
Usable area typically accounts for 67% of the total gross area of court facilities (USCDG 2007).
California Trial Court Facilities Standards (2011) recommends BGSF of 9,000-14,000 per courtroom,
NSF of 57-65% of BGSF, and CGSF (or DGSF) of 71-74% of BGSF.
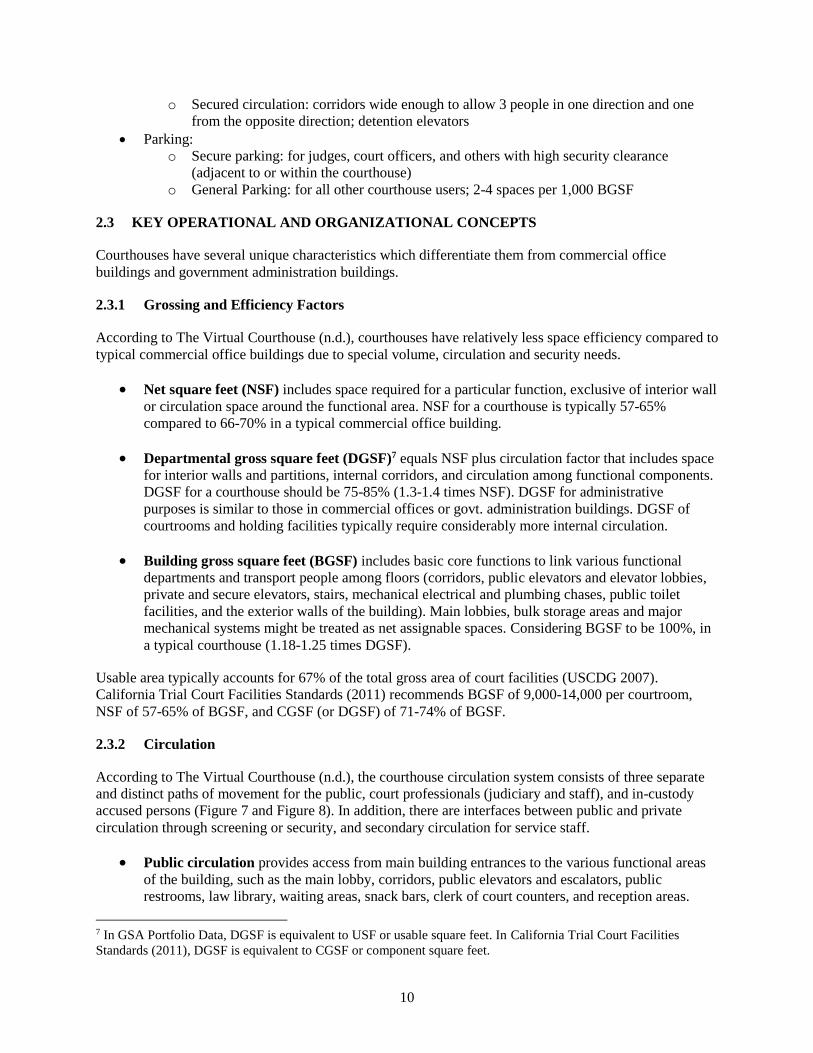
2.3.2 Circulation
According to The Virtual Courthouse (n.d.), the courthouse circulation system consists of three separate
and distinct paths of movement for the public, court professionals (judiciary and staff), and in-custody
accused persons (Figure 7 and Figure 8). In addition, there are interfaces between public and private
circulation through screening or security, and secondary circulation for service staff.
• Public circulation provides access from main building entrances to the various functional areas
of the building, such as the main lobby, corridors, public elevators and escalators, public
restrooms, law library, waiting areas, snack bars, clerk of court counters, and reception areas.
7 In GSA Portfolio Data, DGSF is equivalent to USF or usable square feet. In California Trial Court Facilities
Standards (2011), DGSF is equivalent to CGSF or component square feet.
11
Users of the public circulation include general public, attorneys, clients, witnesses, jurors (before
sequestration), courthouse staff, prosecutors, lawyers, police officers, witnesses, reporters,
accused persons who are not in custody, members of the public, persons with business at the
clerks’ offices, and courtroom spectators.
• Private circulation provides controlled access to particular courthouse users and is not easily or
routinely used by the general public. It permits the movement of judges and other trial-related
court personnel between chambers and courtrooms, and the movement of sequestered jurors
between courtrooms and jury deliberation rooms, without uncontrolled interaction with other
courthouse users.
• Secure circulation provides for the movement of defendants in custody. Access to the building
through a secure vehicular or pedestrian sally port, a secure central holding and staging area
before being escorted to individual courtrooms as needed. Small holding units directly adjacent to
the court rooms, secure elevators for circulation from the central holding area to the individual
courtrooms. The only quasi-public interface that might occur would involve meetings with
defense attorneys in holding areas. This interface may be addressed by allowing attorneys to meet
with clients at either the central holding areas or the individual holding facilities adjacent to the
courtrooms. It must be physically separate from all non-secure spaces and circulation systems in
the courthouse.
• Secondary Circulation: There is generally a secondary circulation zone for staff and building
services, especially, in larger courthouses. This zone is largely contained within the space
envelope of the staff areas of the building. The integrity of this zone relies on controlled access
between public and private circulation. Included in the service zone are all those spaces that serve
as building support areas for the courthouse, such as the receiving dock, program and building
storage areas, building maintenance areas, and the mechanical spaces that are accessed in a
secondary circulation zone. The entrances to the building through the receiving dock must be
secure and access must be controlled. Entry from public circulation into these areas should be via
a door with controlled access.
Figure 7. Section showing three part circulation system.
(Source: California Trial Court Facilities Standards 2011)
12
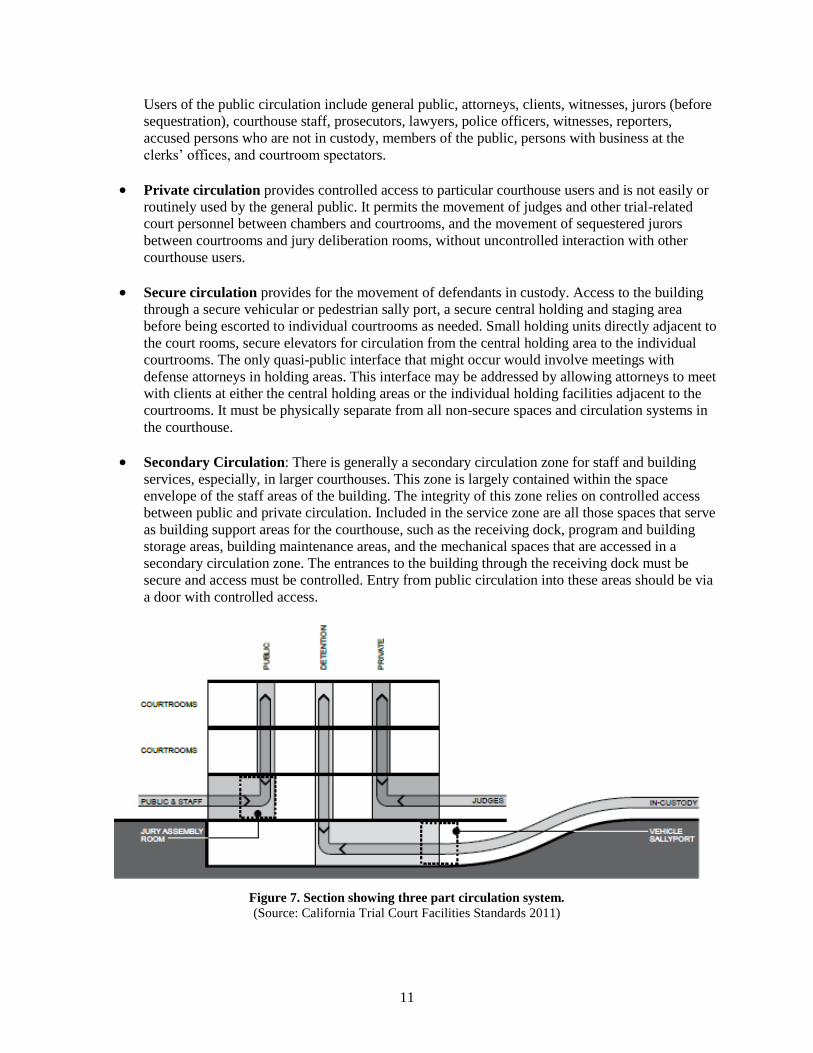
Figure 8. Court floor plan showing three-part circulation system.
(Source: California Trial Court Facilities Standards 2011)
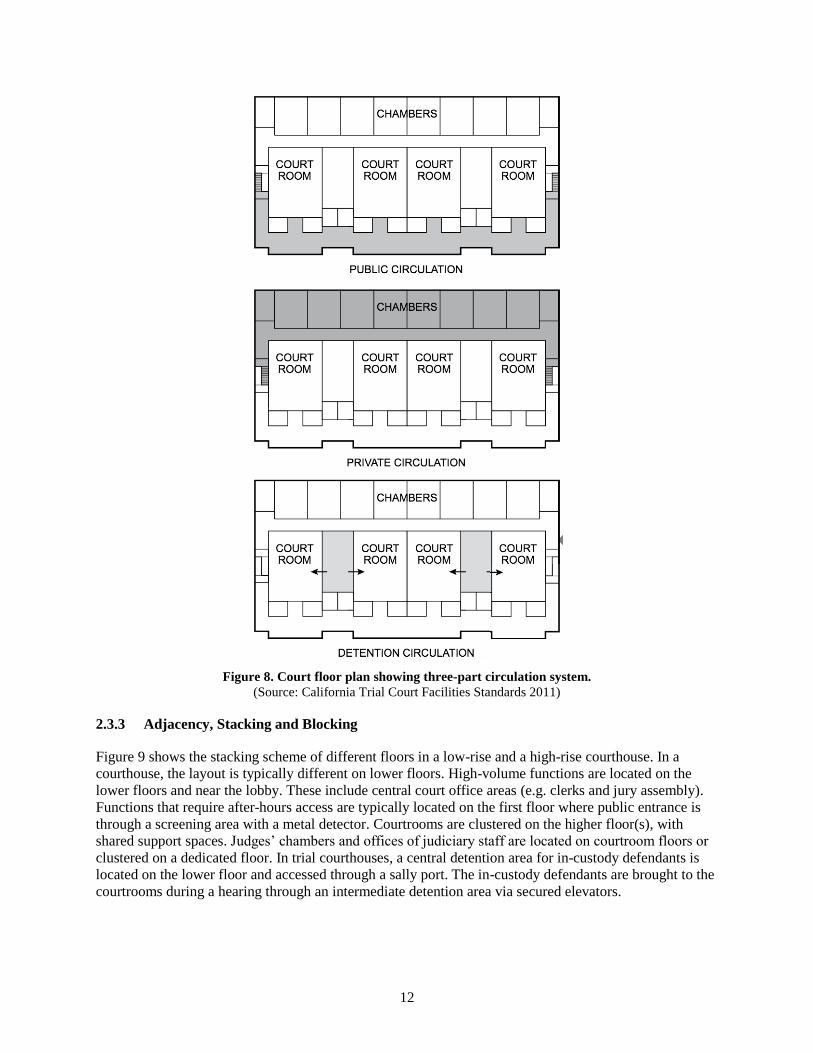
2.3.3 Adjacency, Stacking and Blocking
Figure 9 shows the stacking scheme of different floors in a low-rise and a high-rise courthouse. In a
courthouse, the layout is typically different on lower floors. High-volume functions are located on the
lower floors and near the lobby. These include central court office areas (e.g. clerks and jury assembly).
Functions that require after-hours access are typically located on the first floor where public entrance is
through a screening area with a metal detector. Courtrooms are clustered on the higher floor(s), with
shared support spaces. Judges’ chambers and offices of judiciary staff are located on courtroom floors or
clustered on a dedicated floor. In trial courthouses, a central detention area for in-custody defendants is
located on the lower floor and accessed through a sally port. The in-custody defendants are brought to the
courtrooms during a hearing through an intermediate detention area via secured elevators.
13
Figure 9. Stacking scheme in courthouse. (Source: The Virtual Courthouse, n.d., by HOK)
14
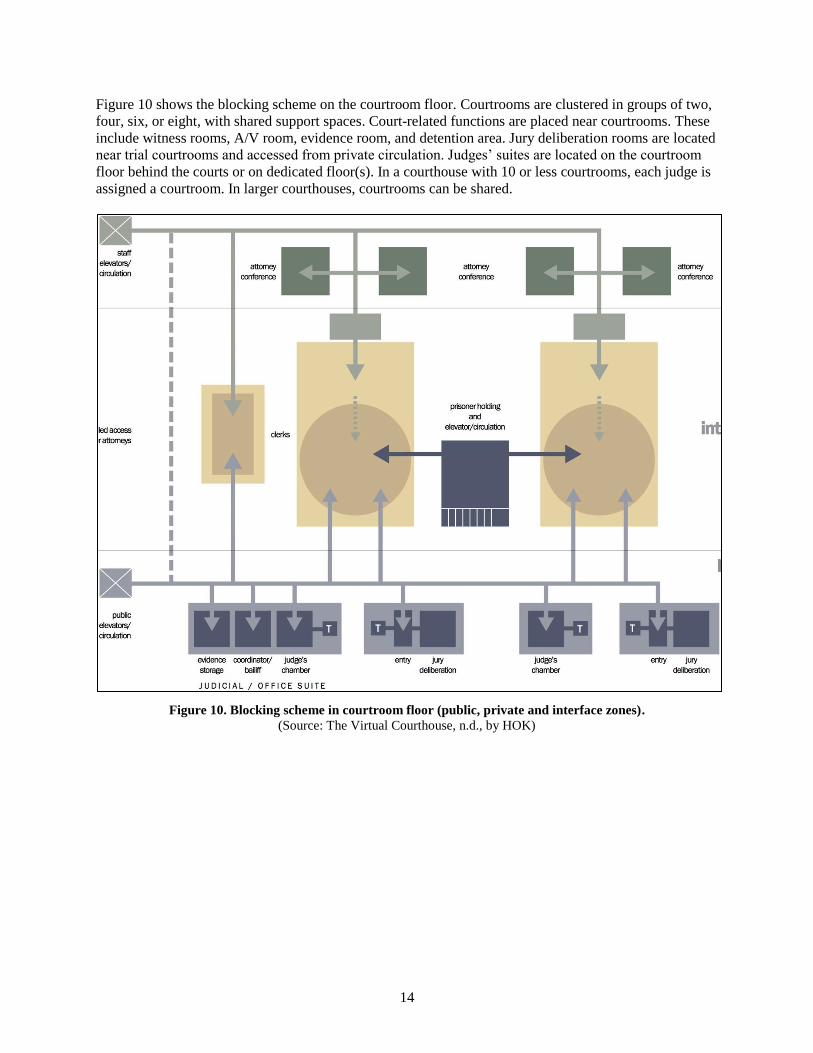
Figure 10 shows the blocking scheme on the courtroom floor. Courtrooms are clustered in groups of two,
four, six, or eight, with shared support spaces. Court-related functions are placed near courtrooms. These
include witness rooms, A/V room, evidence room, and detention area. Jury deliberation rooms are located
near trial courtrooms and accessed from private circulation. Judges’ suites are located on the courtroom
floor behind the courts or on dedicated floor(s). In a courthouse with 10 or less courtrooms, each judge is
assigned a courtroom. In larger courthouses, courtrooms can be shared.
Figure 10. Blocking scheme in courtroom floor (public, private and interface zones).
(Source: The Virtual Courthouse, n.d., by HOK)
15
(a)
(b)
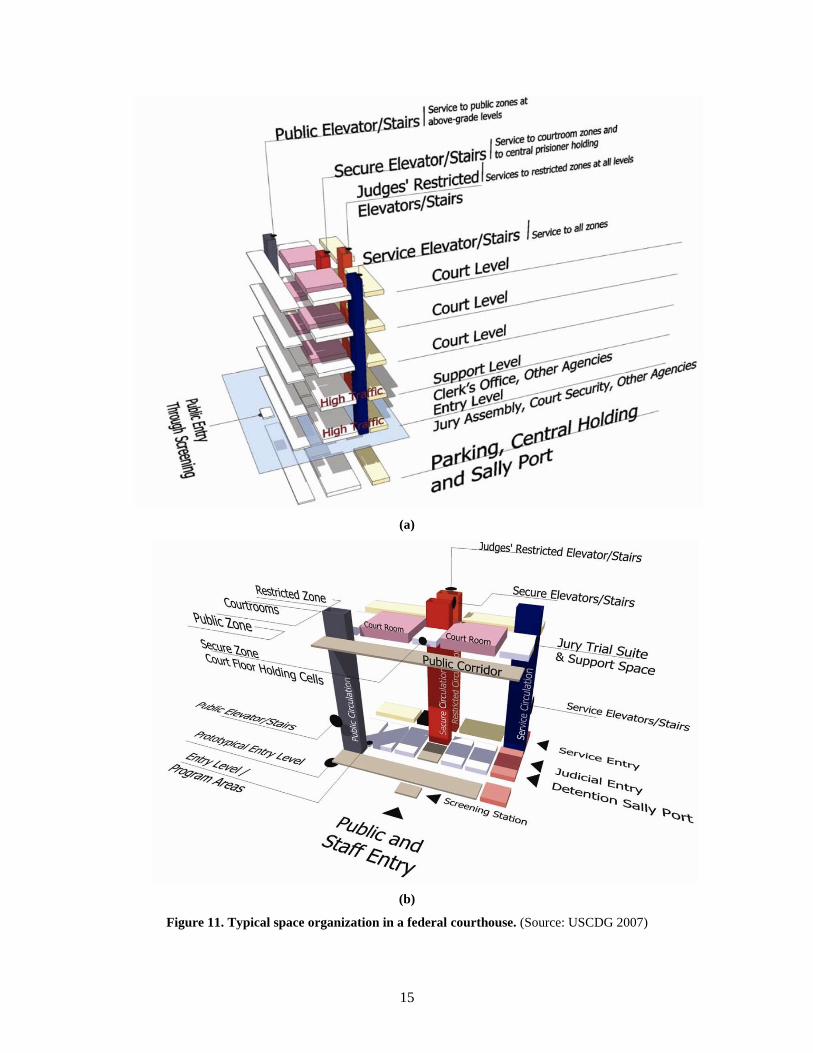
Figure 11. Typical space organization in a federal courthouse. (Source: USCDG 2007)
16
2.4 BUILDING SIZE AND SPACE REQUIREMENT DETERMINANTS
According to Hardenbergh (2015), the number of courtrooms is the main determinant of the scale of a
courthouse, and a primary indicator of size for courthouses. Additionally, the courtrooms are the major
factor determining the number and size of the judicial, clerk, public, technical and other spaces
throughout the building.
California Trial Court Facilities Standards (2011) recommends building GSF of 9,000-14,000 per
courtroom. Hardenbergh (2015) reports a range of 12,000 to 17,000 BGSF per courtroom base on a
national court project and recommends between 13,000 and 16,000 BGSF per courtroom for courthouses
in Virginia.
USCDG (2007) categorizes courthouse based on the number of courtrooms, small for up to 5 courtrooms,
medium for 6-12 courtrooms and large for more than 12 courtrooms. Based on the number of floors, it
designates courthouses as low-rise (up to 4 floors above grade), mid-rise (5-9 floors above grade) and
high-rise (10 or more floors above grade).
Ratio of Courtrooms to Judges: According to The Virtual Courthouse (n.d.), one courtroom per judge is
typical. In less populated areas, one courtroom may be shared by several divisions of the same court, or
by different courts. Some courts have adopted a ratio of one courtroom per judge until the court reaches
about ten judges; above that number, the court may need only three courtrooms for every four judges. For
courtroom sharing to work, all courtrooms should be identical in their capabilities. All should be capable
of holding a criminal jury trial. It is to be noted that not every hearing or proceeding has to take place in a
courtroom; many can be held in chambers or in a smaller hearing or conference room.
Ratio of Jury Deliberation Rooms to Courtrooms: According to The Virtual Courthouse (n.d.), the
precise ratio of jury deliberation rooms to courtrooms depends on many factors, some experts use a rule
of one jury deliberation room per courtroom until the court expands to more than four or five courtrooms,
at which point a ratio of 75% is typically applied. Criminal courts may require a higher ratio of
deliberation rooms per courtroom than civil, municipal, and traffic courts. Some courts have used a ratio
of six or seven deliberation rooms per ten jury courtrooms, as long as deliberation rooms are accessible to
all courtrooms.
Ratio of Jury to Non-Jury Courtrooms: The ratio of jury to non-jury courtrooms, likewise, depends
upon several factors. The most flexible situation is for each courtroom to have a jury box or space for a
jury box. As a general rule, unless jury trials are extremely rare, the court should plan to make most
courtrooms jury-capable.
2.5 SPACES-SPECIFIC REQUIREMENTS
2.5.1 Area
Courthouse design guides provide guidance on floor area requirements for different spaces. GSA Unit
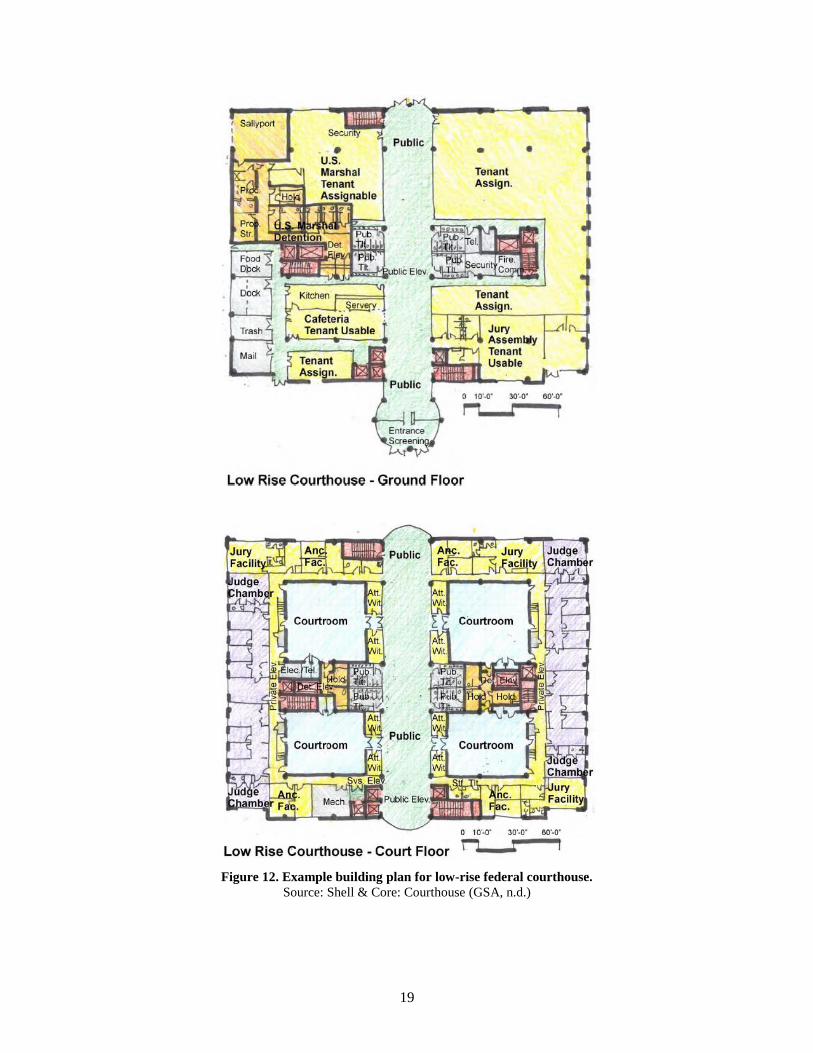
Cost Study (GSA n.d.) provides example area program (

17
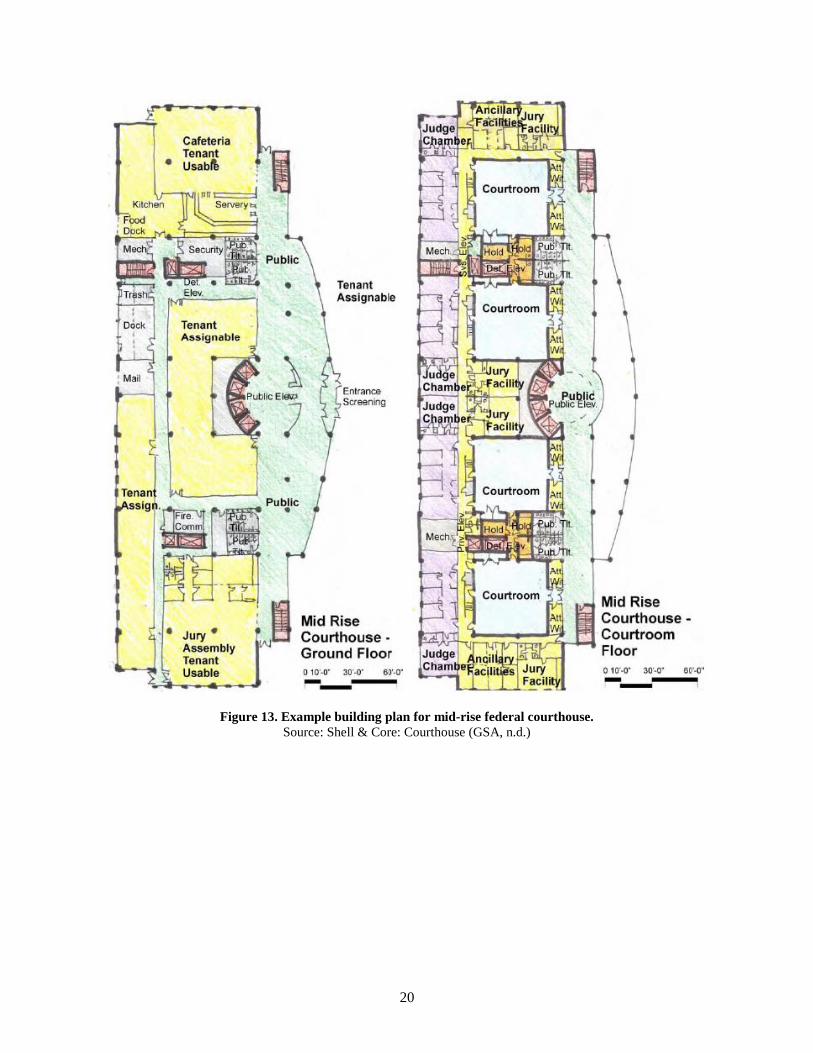
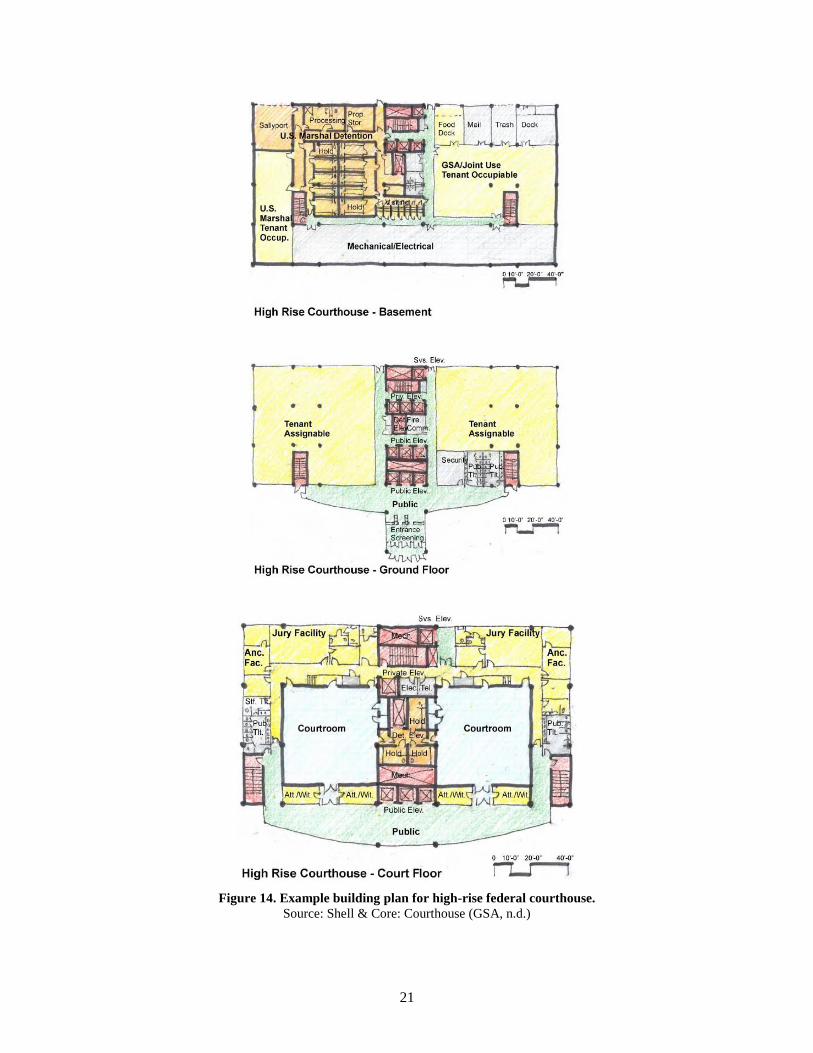
Table 1) and floor plans (Figure 12, Figure 13, and Figure 14) of low-, mid-, and high-rise federal
courthouses. A comparison among these shows the commonalities and size-related variations in space
area requirements to assist determinations for space sizes in the prototype model.
18
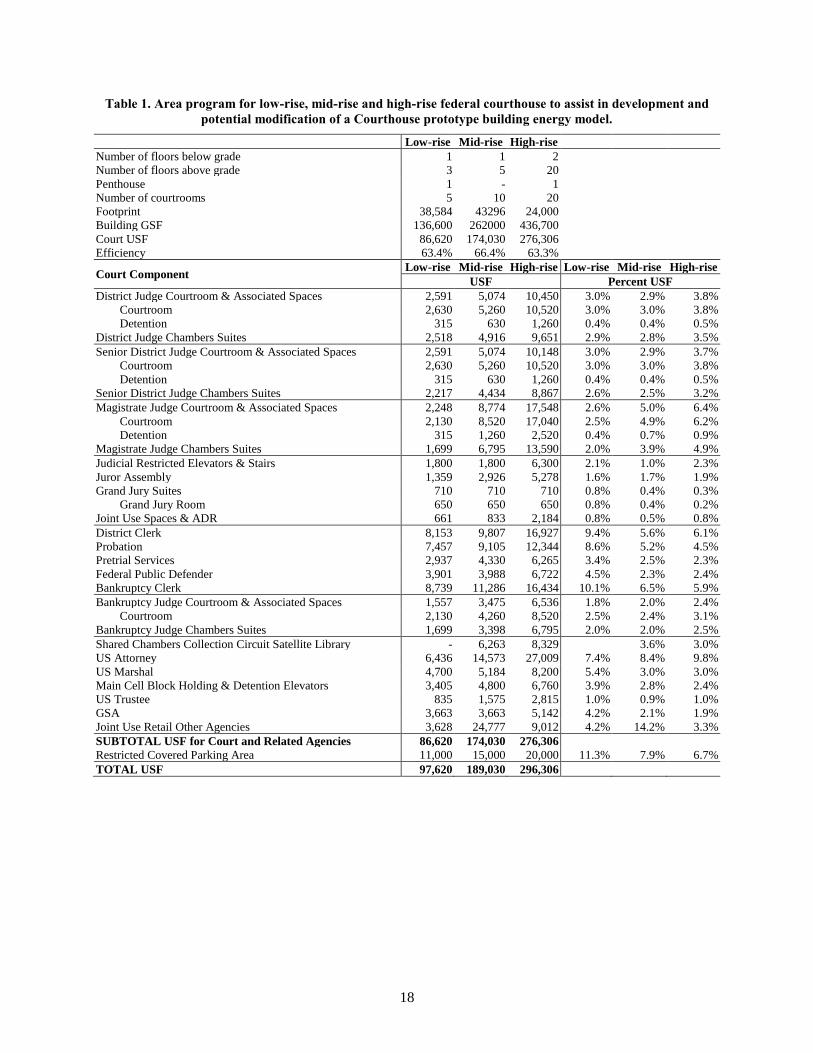
Table 1. Area program for low-rise, mid-rise and high-rise federal courthouse to assist in development and
potential modification of a Courthouse prototype building energy model.
Low-rise Mid-rise High-rise
Number of floors below grade 1 1 2
Number of floors above grade 3 5 20
Penthouse 1 - 1
Number of courtrooms 5 10 20
Footprint 38,584 43296 24,000
Building GSF 136,600 262000 436,700
Court USF 86,620 174,030 276,306
Efficiency 63.4% 66.4% 63.3%
Court Component Low-rise Mid-rise High-rise Low-rise Mid-rise High-rise
USF Percent USF
District Judge Courtroom & Associated Spaces 2,591 5,074 10,450 3.0% 2.9% 3.8%
Courtroom 2,630 5,260 10,520 3.0% 3.0% 3.8%
Detention 315 630 1,260 0.4% 0.4% 0.5%
District Judge Chambers Suites 2,518 4,916 9,651 2.9% 2.8% 3.5%
Senior District Judge Courtroom & Associated Spaces 2,591 5,074 10,148 3.0% 2.9% 3.7%
Courtroom 2,630 5,260 10,520 3.0% 3.0% 3.8%
Detention 315 630 1,260 0.4% 0.4% 0.5%
Senior District Judge Chambers Suites 2,217 4,434 8,867 2.6% 2.5% 3.2%
Magistrate Judge Courtroom & Associated Spaces 2,248 8,774 17,548 2.6% 5.0% 6.4%
Courtroom 2,130 8,520 17,040 2.5% 4.9% 6.2%
Detention 315 1,260 2,520 0.4% 0.7% 0.9%
Magistrate Judge Chambers Suites 1,699 6,795 13,590 2.0% 3.9% 4.9%
Judicial Restricted Elevators & Stairs 1,800 1,800 6,300 2.1% 1.0% 2.3%
Juror Assembly 1,359 2,926 5,278 1.6% 1.7% 1.9%
Grand Jury Suites 710 710 710 0.8% 0.4% 0.3%
Grand Jury Room 650 650 650 0.8% 0.4% 0.2%
Joint Use Spaces & ADR 661 833 2,184 0.8% 0.5% 0.8%
District Clerk 8,153 9,807 16,927 9.4% 5.6% 6.1%
Probation 7,457 9,105 12,344 8.6% 5.2% 4.5%
Pretrial Services 2,937 4,330 6,265 3.4% 2.5% 2.3%
Federal Public Defender 3,901 3,988 6,722 4.5% 2.3% 2.4%
Bankruptcy Clerk 8,739 11,286 16,434 10.1% 6.5% 5.9%
Bankruptcy Judge Courtroom & Associated Spaces 1,557 3,475 6,536 1.8% 2.0% 2.4%
Courtroom 2,130 4,260 8,520 2.5% 2.4% 3.1%
Bankruptcy Judge Chambers Suites 1,699 3,398 6,795 2.0% 2.0% 2.5%
Shared Chambers Collection Circuit Satellite Library - 6,263 8,329
3.6% 3.0%
US Attorney 6,436 14,573 27,009 7.4% 8.4% 9.8%
US Marshal 4,700 5,184 8,200 5.4% 3.0% 3.0%
Main Cell Block Holding & Detention Elevators 3,405 4,800 6,760 3.9% 2.8% 2.4%
US Trustee 835 1,575 2,815 1.0% 0.9% 1.0%
GSA 3,663 3,663 5,142 4.2% 2.1% 1.9%
Joint Use Retail Other Agencies 3,628 24,777 9,012 4.2% 14.2% 3.3%
SUBTOTAL USF for Court and Related Agencies 86,620 174,030 276,306
Restricted Covered Parking Area 11,000 15,000 20,000 11.3% 7.9% 6.7%
TOTAL USF 97,620 189,030 296,306
19
Figure 12. Example building plan for low-rise federal courthouse.
Source: Shell & Core: Courthouse (GSA, n.d.)
20
Figure 13. Example building plan for mid-rise federal courthouse.
Source: Shell & Core: Courthouse (GSA, n.d.)
21
Figure 14. Example building plan for high-rise federal courthouse.
Source: Shell & Core: Courthouse (GSA, n.d.)
22
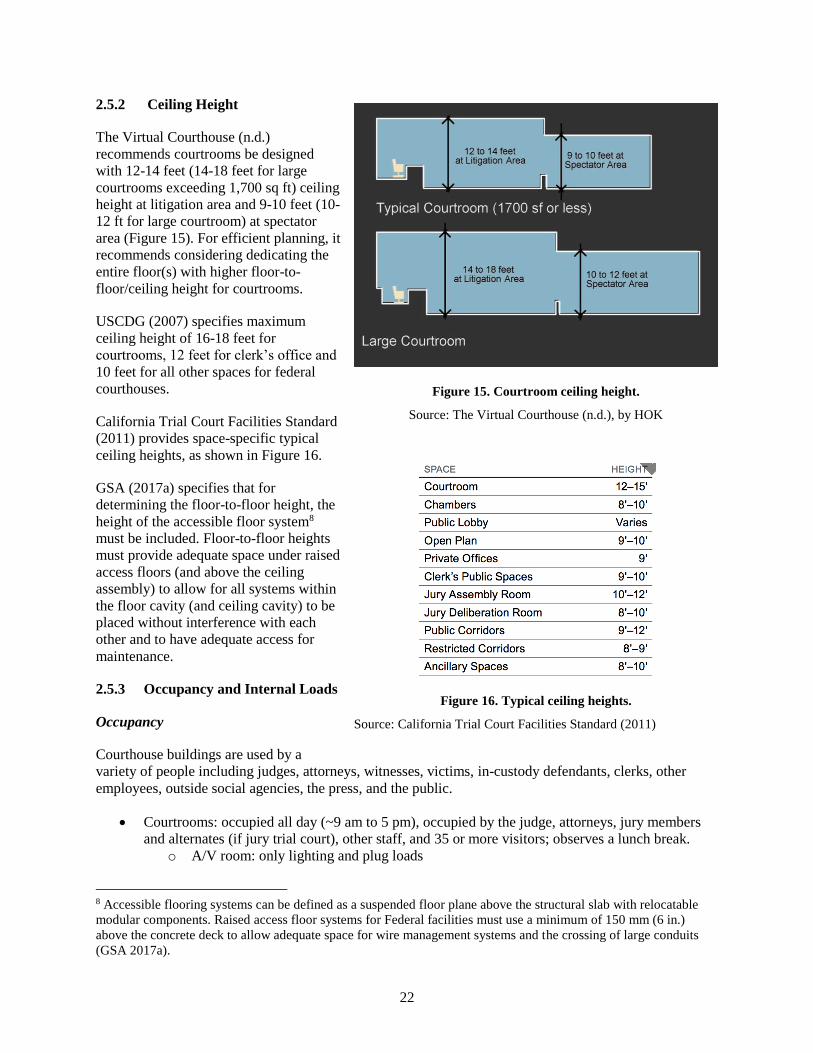
2.5.2 Ceiling Height
The Virtual Courthouse (n.d.)
recommends courtrooms be designed
with 12-14 feet (14-18 feet for large
courtrooms exceeding 1,700 sq ft) ceiling
height at litigation area and 9-10 feet (10-
12 ft for large courtroom) at spectator
area (Figure 15). For efficient planning, it
recommends considering dedicating the
entire floor(s) with higher floor-to-
floor/ceiling height for courtrooms.
USCDG (2007) specifies maximum
ceiling height of 16-18 feet for
courtrooms, 12 feet for clerk’s office and
10 feet for all other spaces for federal
courthouses.
California Trial Court Facilities Standard
(2011) provides space-specific typical
ceiling heights, as shown in Figure 16.
GSA (2017a) specifies that for
determining the floor-to-floor height, the
height of the accessible floor system8
must be included. Floor-to-floor heights
must provide adequate space under raised
access floors (and above the ceiling
assembly) to allow for all systems within
the floor cavity (and ceiling cavity) to be
placed without interference with each
other and to have adequate access for
maintenance.
2.5.3 Occupancy and Internal Loads
Occupancy
Courthouse buildings are used by a
variety of people including judges, attorneys, witnesses, victims, in-custody defendants, clerks, other
employees, outside social agencies, the press, and the public.
• Courtrooms: occupied all day (~9 am to 5 pm), occupied by the judge, attorneys, jury members
and alternates (if jury trial court), other staff, and 35 or more visitors; observes a lunch break.
o A/V room: only lighting and plug loads
8 Accessible flooring systems can be defined as a suspended floor plane above the structural slab with relocatable
modular components. Raised access floor systems for Federal facilities must use a minimum of 150 mm (6 in.)
above the concrete deck to allow adequate space for wire management systems and the crossing of large conduits
(GSA 2017a).
Figure 15. Courtroom ceiling height.
Source: The Virtual Courthouse (n.d.), by HOK
Figure 16. Typical ceiling heights.
Source: California Trial Court Facilities Standard (2011)
23
o Attorney-client/witness rooms: 2 per courtroom, up to 4 people
• Court room waiting: up to 20 people per courtroom (witnesses and visitors)
• Judges suite: One judge, up to 4 staff
• Clerk: open plan and private offices
• Jury assembly area: 20 people per courtroom
• Jury deliberation rooms: like conference rooms, 12-16 people, two toilets per room
• Prisoner holding: occupied only during the day; size and capacity vary by courtroom
• Secured corridor:
Lighting systems
• The use of indirect pendant-mounted fluorescent fixtures for general lighting in a courtroom,
complemented with recessed concentrated light sources at the judge’s bench, the witness box, and
attorneys’ tables.
• Remote electronic dimmers with preset lighting arrangements, for large courtrooms with high
ceilings.
• Electronic ballasts for fluorescent lamps must not be used in areas that contain sensitive security
devices or special equipment that is sensitive to electronic interference, such as assisted listening
device (ALD) infrared emitters.
• New courthouses predominantly use LED lighting.
Equipment and plug loads:
• Computers in all offices/desks, clerks, courtrooms, holding areas
• A/V equipment in courtrooms/support spaces, jury assembly area
• Plug loads and kitchenette in judge’s chambers suite, jury assembly, and staff areas
• Elevators: public elevators, private elevators for judges, secure elevators for in-custody
defendants, service elevators
• Sump pump, if basement is present
• Electric heating for outdoor walkways, garage ramp
• Courthouse-specific security devices
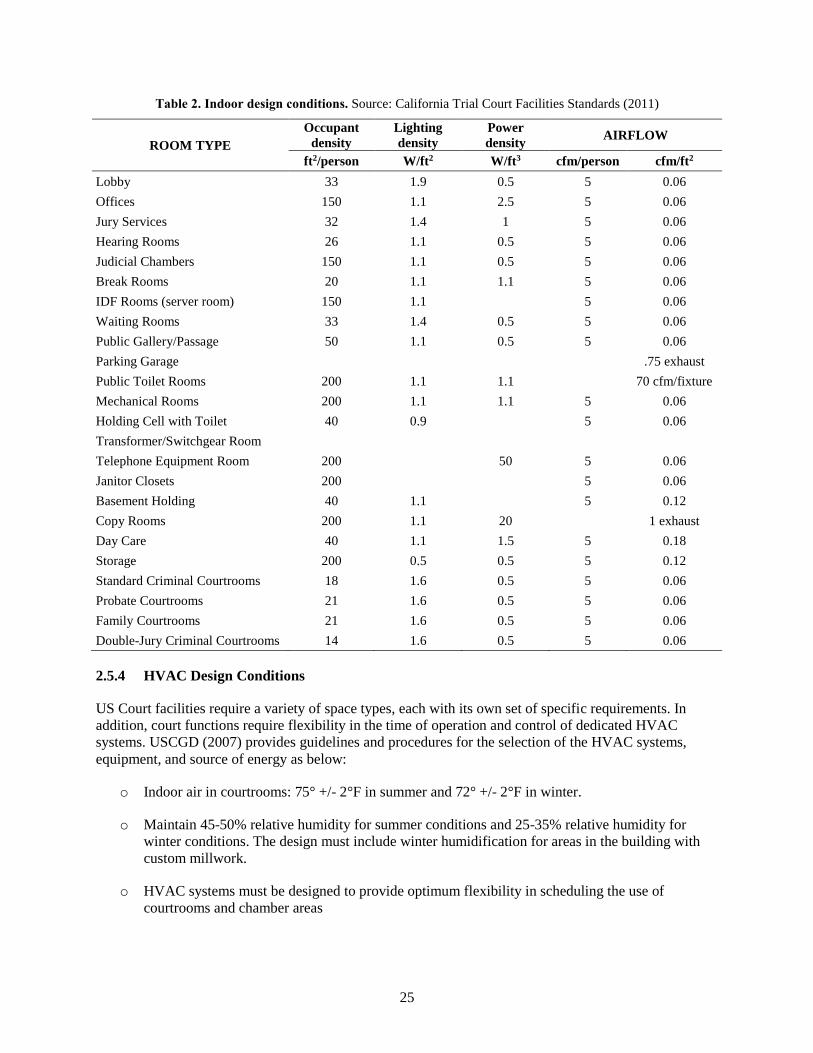
California Trial Court Facilities Standards (2011) specifies indoor design conditions for courthouse
spaces, as shown in

24
Table 2.
25
Table 2. Indoor design conditions. Source: California Trial Court Facilities Standards (2011)
ROOM TYPE
Occupant
density
Lighting
density
Power
density AIRFLOW
ft2/person W/ft2 W/ft3 cfm/person cfm/ft2
Lobby 33 1.9 0.5 5 0.06
Offices 150 1.1 2.5 5 0.06
Jury Services 32 1.4 1 5 0.06
Hearing Rooms 26 1.1 0.5 5 0.06
Judicial Chambers 150 1.1 0.5 5 0.06
Break Rooms 20 1.1 1.1 5 0.06
IDF Rooms (server room) 150 1.1
5 0.06
Waiting Rooms 33 1.4 0.5 5 0.06
Public Gallery/Passage 50 1.1 0.5 5 0.06
Parking Garage
.75 exhaust
Public Toilet Rooms 200 1.1 1.1
70 cfm/fixture
Mechanical Rooms 200 1.1 1.1 5 0.06
Holding Cell with Toilet 40 0.9
5 0.06
Transformer/Switchgear Room
Telephone Equipment Room 200
50 5 0.06
Janitor Closets 200
5 0.06
Basement Holding 40 1.1
5 0.12
Copy Rooms 200 1.1 20
1 exhaust
Day Care 40 1.1 1.5 5 0.18
Storage 200 0.5 0.5 5 0.12
Standard Criminal Courtrooms 18 1.6 0.5 5 0.06
Probate Courtrooms 21 1.6 0.5 5 0.06
Family Courtrooms 21 1.6 0.5 5 0.06
Double-Jury Criminal Courtrooms 14 1.6 0.5 5 0.06
2.5.4 HVAC Design Conditions
US Court facilities require a variety of space types, each with its own set of specific requirements. In
addition, court functions require flexibility in the time of operation and control of dedicated HVAC
systems. USCGD (2007) provides guidelines and procedures for the selection of the HVAC systems,
equipment, and source of energy as below:
o Indoor air in courtrooms: 75° +/- 2°F in summer and 72° +/- 2°F in winter.
o Maintain 45-50% relative humidity for summer conditions and 25-35% relative humidity for
winter conditions. The design must include winter humidification for areas in the building with
custom millwork.
o HVAC systems must be designed to provide optimum flexibility in scheduling the use of
courtrooms and chamber areas
26
o The HVAC system must be designed to provide 74°F in judges’ chambers, courtrooms, and trial
jury suites on average. The courtroom HVAC system must be designed so that courtroom
thermostats can be reset from the building automation system to precool the courtrooms to 70°F
before scheduled occupancy.
o Trial jury suites (when located adjacent to a courtroom), judges’ chamber suites (when located
adjacent to a courtroom), attorney/witness rooms, attorney work room, and courtrooms must be
placed on the same system with separate zones having related thermostats and the design must
account for variation in occupancy load.
o Mechanical systems will provide a minimum of 20 cfm per person in all occupied areas.
o To allow flexible and efficient use of the HVAC systems for hours of activity occurring at times
other than standard building operations and to satisfy specific requirements in a US Court facility,
the central plant equipment (e.g. chillers, boilers, cooling towers, pumps, air handling units) must
be designed using redundant equipment of various sizes to satisfy the requirements of a differing
number and sizes of zones with the goal of servicing no more than two courtrooms per air
handling unit.
o The HVAC system design for the courtroom, judge’s chamber suite, and the jury deliberation
room, which compose a single “court set,” must be designed to allow the HVAC system to
operate after standard building operations hours in an efficient manner.
o Piping systems must allow arrangements to permit changing courtroom HVAC systems from
primary to secondary chilled water for off hours.
o Mechanical systems must be designed to minimize noise in the courtroom.
Courtroom and chambers:
o Air Distribution: Three HVAC zones must be provided: one for the judge and attorney areas, a
second for the jury areas, and a third for the spectator area.
o The maximum percentage of recirculated air must not exceed 85%.
o If the courtroom is served by a fan system dedicated to more than one courtroom, the return air
from each courtroom and its associated areas must be ducted directly to the unit.
Jury Facilities:
o System Description and Control: Trial jury suites should be served from the same system as the
associated courtrooms. A separate thermostat for each trial jury room is desirable.
o Air distribution systems in the jury facilities must provide separate temperature control and a high
degree of acoustical isolation, particularly in the grand jury and trial jury rooms.
o Air Changes: In the jury assembly suites, trial jury suites, grand jury suites, and libraries, the
system must provide 10 air changes per hour (ACH) with 80-85% return.
27
Information Technology System Loads
o Information technology systems are not the largest source of heat within the office spaces, but
may be the largest sources in other areas. Information technology systems may be the most
uncertain source of heat flows during design phases; therefore, the HVAC system must be
planned with capacity and control to accommodate the need for constant temperature and
humidity environments 24 hours a day, where systems hardware could be placed.
o The design of the HVAC systems must take into consideration provisions for separate units for
critical areas such as computer rooms, control room, and elevator machine rooms which generate
additional heat loads. The HVAC design for these areas must have redundancy and be connected
to the emergency power system. Computer and audio-visual equipment should be collocated
where possible to reduce the number of separate areas requiring 24-hour cooling.
Two additional sources for courthouse building controls are California Trial Court Facilities Standards
(2011), and 2015 ASHRAE Handbook HVAC Applications (2015). The California Trial Court Facilities
Standards defines the thermostat setpoint for heating and cooling should be 72°F ± 2°F, and 75°F ± 2°F,
respectively. The relative humidity of the building should be maintained with 50% ± 5%. ASHRAE
Handbook Chapter 9 provides some requirements of the HVAC systems in Courthouses. The handbook
defines that the indoor air should be maintained 74°F and 50% RH for summer conditions and occupancy,
and 72°F and 20-35%RH for winter.9
The California Trial Court Facilities Standards provide more requirements for temperature control zone as
below.
• Interior control zone shall not exceed 1,500 gross sq. ft. for open areas, or a maximum of three
enclosed offices.
• Perimeter zones shall not exceed 400 gross sq ft, or a maximum of two enclosed offices
• Corner offices shall be independent zones.
• Provide independent zones for each courtroom, chambers suite, jury deliberation room, entrance
lobby, mailroom, staff lounge, conference room, atrium, child waiting area, and equipment
rooms.
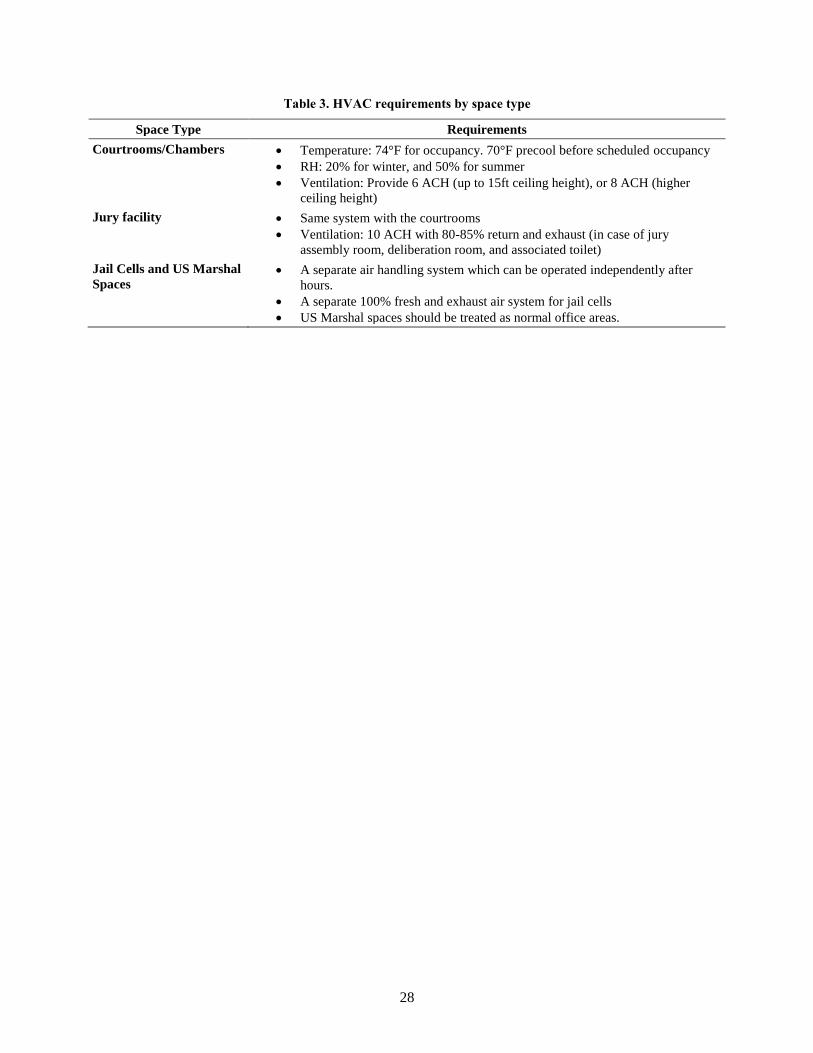
ASHRAE Handbook – HVAC Applications (ASHRAE 2015) provides HVAC requirements by space
types in Courthouse. Table 3 provides the space type and corresponding requirements.
9 Architectural features in courtrooms are generally above standard conventional design, and often include wood and
ornate ceilings, which require both temperature and humidity control (ASHRAE 2013).
28
Table 3. HVAC requirements by space type
Space Type Requirements
Courtrooms/Chambers • Temperature: 74°F for occupancy. 70°F precool before scheduled occupancy
• RH: 20% for winter, and 50% for summer
• Ventilation: Provide 6 ACH (up to 15ft ceiling height), or 8 ACH (higher
ceiling height)
Jury facility • Same system with the courtrooms
• Ventilation: 10 ACH with 80-85% return and exhaust (in case of jury
assembly room, deliberation room, and associated toilet)
Jail Cells and US Marshal
Spaces • A separate air handling system which can be operated independently after
hours.
• A separate 100% fresh and exhaust air system for jail cells
• US Marshal spaces should be treated as normal office areas.
29
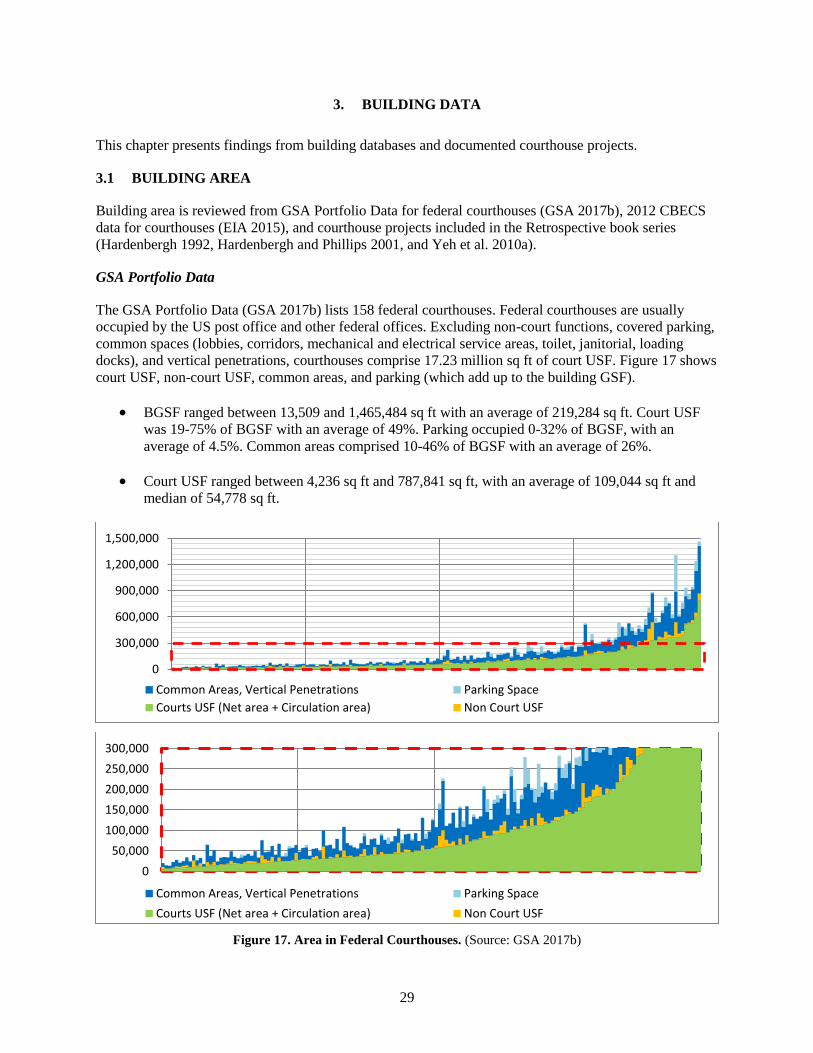
3. BUILDING DATA
This chapter presents findings from building databases and documented courthouse projects.
3.1 BUILDING AREA
Building area is reviewed from GSA Portfolio Data for federal courthouses (GSA 2017b), 2012 CBECS
data for courthouses (EIA 2015), and courthouse projects included in the Retrospective book series
(Hardenbergh 1992, Hardenbergh and Phillips 2001, and Yeh et al. 2010a).
GSA Portfolio Data
The GSA Portfolio Data (GSA 2017b) lists 158 federal courthouses. Federal courthouses are usually
occupied by the US post office and other federal offices. Excluding non-court functions, covered parking,
common spaces (lobbies, corridors, mechanical and electrical service areas, toilet, janitorial, loading
docks), and vertical penetrations, courthouses comprise 17.23 million sq ft of court USF. Figure 17 shows
court USF, non-court USF, common areas, and parking (which add up to the building GSF).
• BGSF ranged between 13,509 and 1,465,484 sq ft with an average of 219,284 sq ft. Court USF
was 19-75% of BGSF with an average of 49%. Parking occupied 0-32% of BGSF, with an
average of 4.5%. Common areas comprised 10-46% of BGSF with an average of 26%.
• Court USF ranged between 4,236 sq ft and 787,841 sq ft, with an average of 109,044 sq ft and
median of 54,778 sq ft.
Figure 17. Area in Federal Courthouses. (Source: GSA 2017b)
0
300,000
600,000
900,000
1,200,000
1,500,000
Common Areas, Vertical Penetrations Parking Space
Courts USF (Net area + Circulation area) Non Court USF
0
50,000
100,000
150,000
200,000
250,000
300,000
Common Areas, Vertical Penetrations Parking Space
Courts USF (Net area + Circulation area) Non Court USF
30
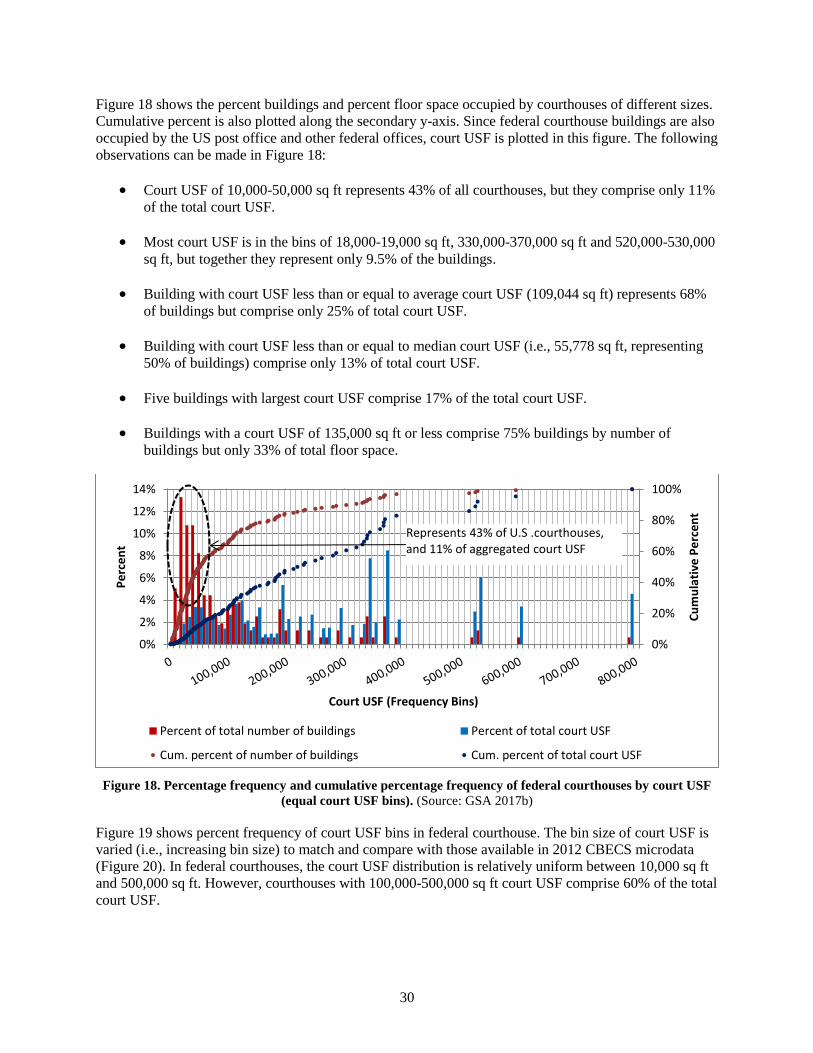
Figure 18 shows the percent buildings and percent floor space occupied by courthouses of different sizes.
Cumulative percent is also plotted along the secondary y-axis. Since federal courthouse buildings are also
occupied by the US post office and other federal offices, court USF is plotted in this figure. The following
observations can be made in Figure 18:
• Court USF of 10,000-50,000 sq ft represents 43% of all courthouses, but they comprise only 11%
of the total court USF.
• Most court USF is in the bins of 18,000-19,000 sq ft, 330,000-370,000 sq ft and 520,000-530,000
sq ft, but together they represent only 9.5% of the buildings.
• Building with court USF less than or equal to average court USF (109,044 sq ft) represents 68%
of buildings but comprise only 25% of total court USF.
• Building with court USF less than or equal to median court USF (i.e., 55,778 sq ft, representing
50% of buildings) comprise only 13% of total court USF.
• Five buildings with largest court USF comprise 17% of the total court USF.
• Buildings with a court USF of 135,000 sq ft or less comprise 75% buildings by number of
buildings but only 33% of total floor space.
Figure 18. Percentage frequency and cumulative percentage frequency of federal courthouses by court USF
(equal court USF bins). (Source: GSA 2017b)
Figure 19 shows percent frequency of court USF bins in federal courthouse. The bin size of court USF is
varied (i.e., increasing bin size) to match and compare with those available in 2012 CBECS microdata
(Figure 20). In federal courthouses, the court USF distribution is relatively uniform between 10,000 sq ft
and 500,000 sq ft. However, courthouses with 100,000-500,000 sq ft court USF comprise 60% of the total
court USF.
- 100 ,000 200 ,000 300 ,000 400 ,000 500 ,000 600 ,000 700 ,000 800 ,000
0%
20%
40%
60%
80%
100%
0%
2%
4%
6%
8%
10%
12%
14%
Cu
mu
lati
ve P
erc
en
t
Pe
rce
nt
Court USF (Frequency Bins)
Percent of total number of buildings Percent of total court USF
Cum. percent of number of buildings Cum. percent of total court USF
Represents 43% of U.S .courthouses, and 11% of aggregated court USF
31
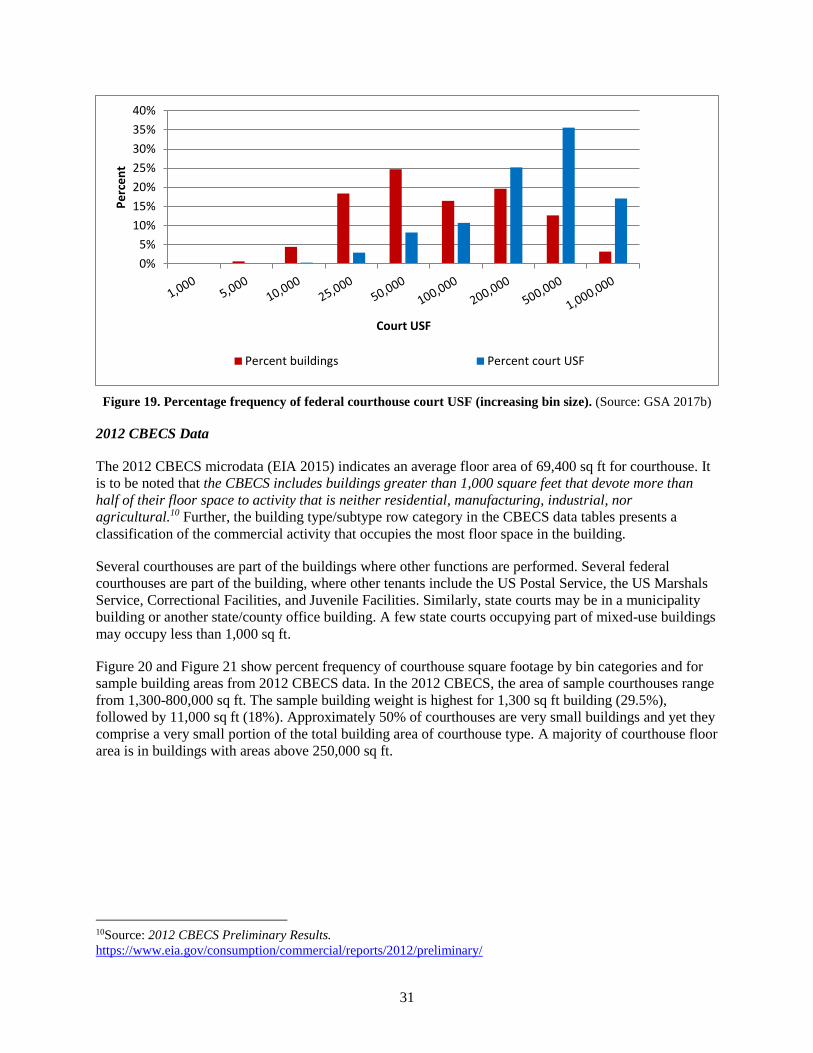
Figure 19. Percentage frequency of federal courthouse court USF (increasing bin size). (Source: GSA 2017b)
2012 CBECS Data
The 2012 CBECS microdata (EIA 2015) indicates an average floor area of 69,400 sq ft for courthouse. It
is to be noted that the CBECS includes buildings greater than 1,000 square feet that devote more than
half of their floor space to activity that is neither residential, manufacturing, industrial, nor
agricultural.10 Further, the building type/subtype row category in the CBECS data tables presents a
classification of the commercial activity that occupies the most floor space in the building.
Several courthouses are part of the buildings where other functions are performed. Several federal
courthouses are part of the building, where other tenants include the US Postal Service, the US Marshals
Service, Correctional Facilities, and Juvenile Facilities. Similarly, state courts may be in a municipality
building or another state/county office building. A few state courts occupying part of mixed-use buildings
may occupy less than 1,000 sq ft.
Figure 20 and Figure 21 show percent frequency of courthouse square footage by bin categories and for
sample building areas from 2012 CBECS data. In the 2012 CBECS, the area of sample courthouses range
from 1,300-800,000 sq ft. The sample building weight is highest for 1,300 sq ft building (29.5%),
followed by 11,000 sq ft (18%). Approximately 50% of courthouses are very small buildings and yet they
comprise a very small portion of the total building area of courthouse type. A majority of courthouse floor
area is in buildings with areas above 250,000 sq ft.
10Source: 2012 CBECS Preliminary Results.
https://www.eia.gov/consumption/commercial/reports/2012/preliminary/
0%
5%
10%
15%
20%
25%
30%
35%
40%P
erc
en
t
Court USF
Percent buildings Percent court USF
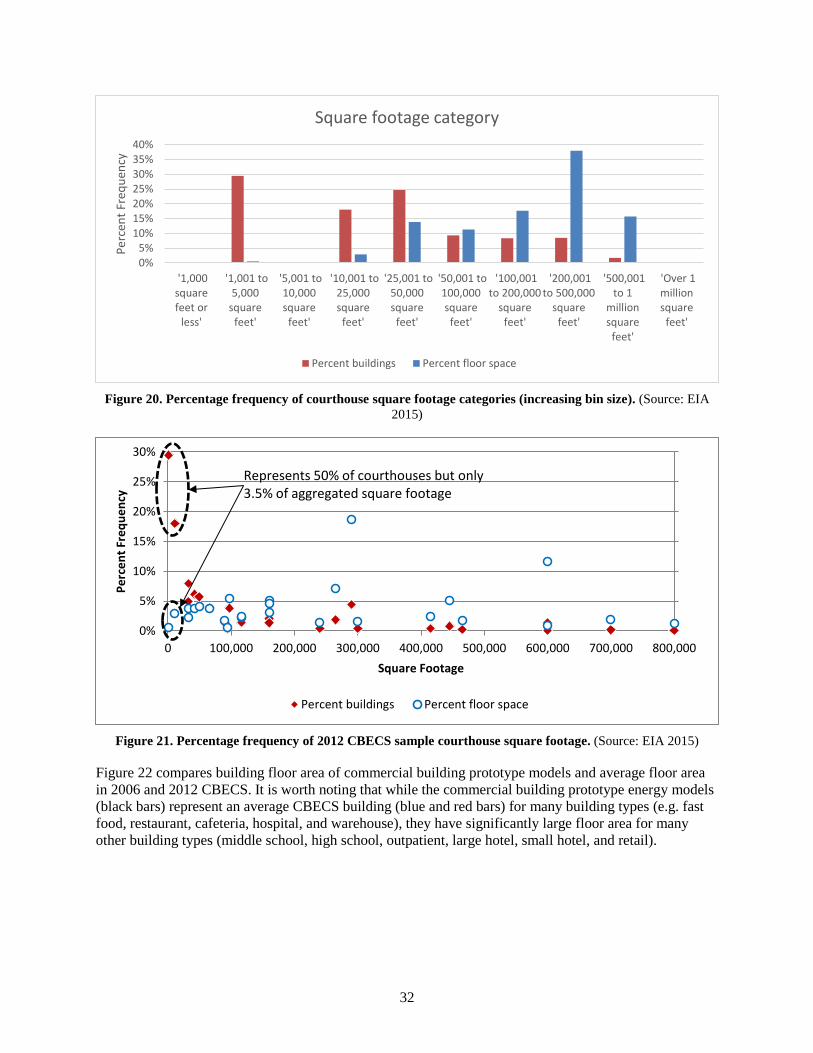
32
Figure 20. Percentage frequency of courthouse square footage categories (increasing bin size). (Source: EIA
2015)
Figure 21. Percentage frequency of 2012 CBECS sample courthouse square footage. (Source: EIA 2015)
Figure 22 compares building floor area of commercial building prototype models and average floor area
in 2006 and 2012 CBECS. It is worth noting that while the commercial building prototype energy models
(black bars) represent an average CBECS building (blue and red bars) for many building types (e.g. fast
food, restaurant, cafeteria, hospital, and warehouse), they have significantly large floor area for many
other building types (middle school, high school, outpatient, large hotel, small hotel, and retail).
0%5%
10%15%20%25%30%35%40%
'1,000squarefeet or
less'
'1,001 to5,000
squarefeet'
'5,001 to10,000square
feet'
'10,001 to25,000square
feet'
'25,001 to50,000square
feet'
'50,001 to100,000square
feet'
'100,001to 200,000
squarefeet'
'200,001to 500,000
squarefeet'
'500,001to 1
millionsquare
feet'
'Over 1millionsquare
feet'
Per
cen
t Fr
equ
ency
Square footage category
Percent buildings Percent floor space
0%
5%
10%
15%
20%
25%
30%
0%
5%
10%
15%
20%
25%
30%
0 100,000 200,000 300,000 400,000 500,000 600,000 700,000 800,000
Pe
rce
nt
Fre
qu
en
cy
Square Footage
Percent buildings Percent floor space
Represents 50% of courthouses but only 3.5% of aggregated square footage
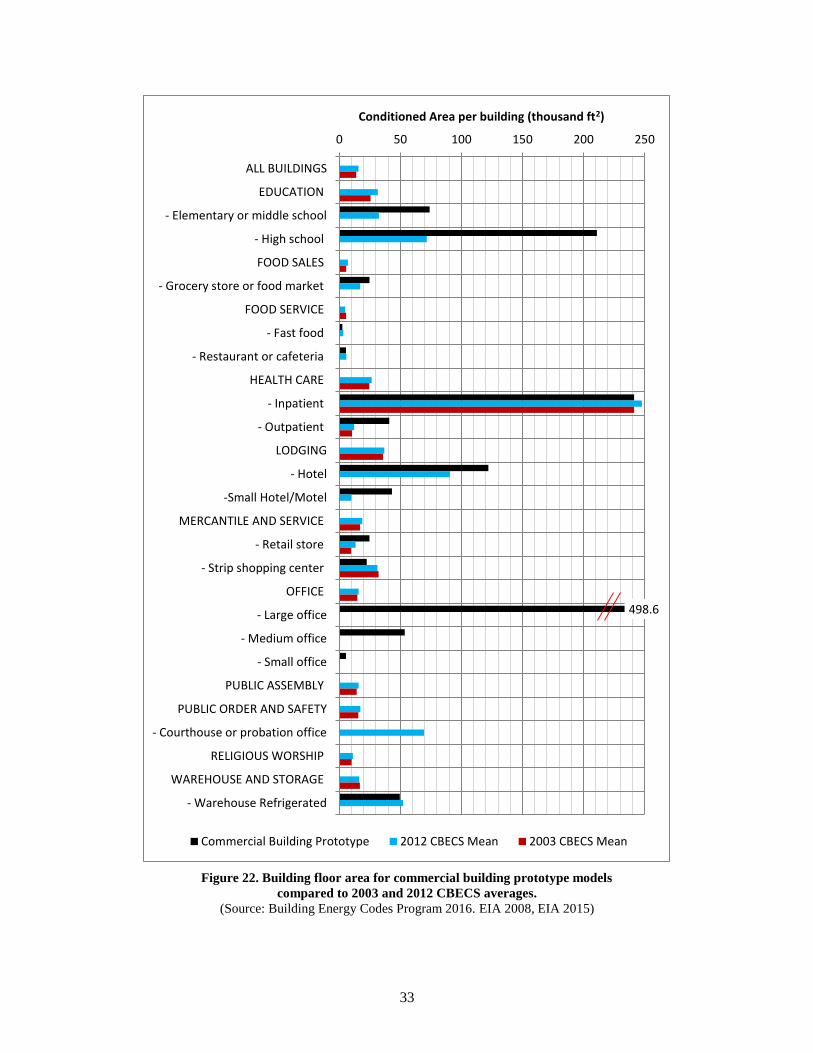
33
Figure 22. Building floor area for commercial building prototype models
compared to 2003 and 2012 CBECS averages.
(Source: Building Energy Codes Program 2016. EIA 2008, EIA 2015)
498.6
0 50 100 150 200 250
ALL BUILDINGS
EDUCATION
- Elementary or middle school
- High school
FOOD SALES
- Grocery store or food market
FOOD SERVICE
- Fast food
- Restaurant or cafeteria
HEALTH CARE
- Inpatient
- Outpatient
LODGING
- Hotel
-Small Hotel/Motel
MERCANTILE AND SERVICE
- Retail store
- Strip shopping center
OFFICE
- Large office
- Medium office
- Small office
PUBLIC ASSEMBLY
PUBLIC ORDER AND SAFETY
- Courthouse or probation office
RELIGIOUS WORSHIP
WAREHOUSE AND STORAGE
- Warehouse Refrigerated
Conditioned Area per building (thousand ft2)
Commercial Building Prototype 2012 CBECS Mean 2003 CBECS Mean
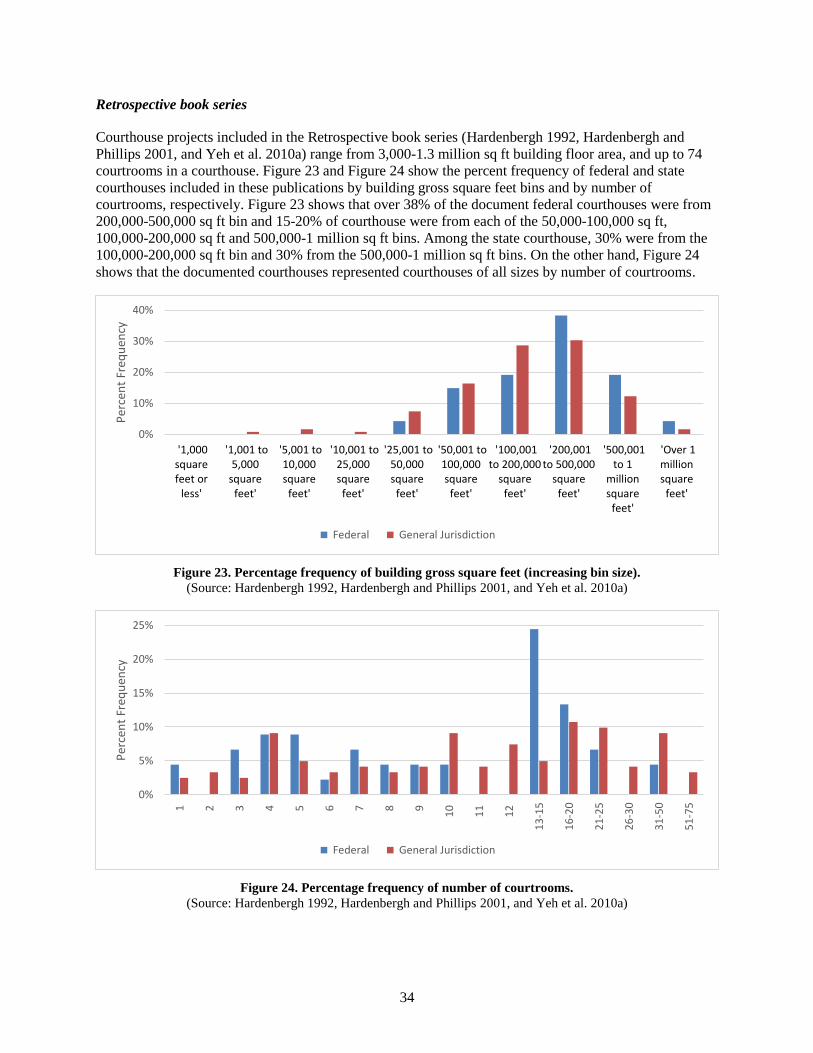
34
Retrospective book series
Courthouse projects included in the Retrospective book series (Hardenbergh 1992, Hardenbergh and
Phillips 2001, and Yeh et al. 2010a) range from 3,000-1.3 million sq ft building floor area, and up to 74
courtrooms in a courthouse. Figure 23 and Figure 24 show the percent frequency of federal and state
courthouses included in these publications by building gross square feet bins and by number of
courtrooms, respectively. Figure 23 shows that over 38% of the document federal courthouses were from
200,000-500,000 sq ft bin and 15-20% of courthouse were from each of the 50,000-100,000 sq ft,
100,000-200,000 sq ft and 500,000-1 million sq ft bins. Among the state courthouse, 30% were from the
100,000-200,000 sq ft bin and 30% from the 500,000-1 million sq ft bins. On the other hand, Figure 24
shows that the documented courthouses represented courthouses of all sizes by number of courtrooms.
Figure 23. Percentage frequency of building gross square feet (increasing bin size).
(Source: Hardenbergh 1992, Hardenbergh and Phillips 2001, and Yeh et al. 2010a)
Figure 24. Percentage frequency of number of courtrooms.
(Source: Hardenbergh 1992, Hardenbergh and Phillips 2001, and Yeh et al. 2010a)
0%
10%
20%
30%
40%
'1,000squarefeet or
less'
'1,001 to5,000
squarefeet'
'5,001 to10,000square
feet'
'10,001 to25,000square
feet'
'25,001 to50,000square
feet'
'50,001 to100,000square
feet'
'100,001to 200,000
squarefeet'
'200,001to 500,000
squarefeet'
'500,001to 1
millionsquare
feet'
'Over 1millionsquare
feet'
Per
cen
t Fr
equ
ency
Federal General Jurisdiction
0%
5%
10%
15%
20%
25%
1 2 3 4 5 6 7 8 9
10
11
12
13
-15
16
-20
21
-25
26
-30
31
-50
51
-75
Per
cen
t Fr
equ
ency
Federal General Jurisdiction
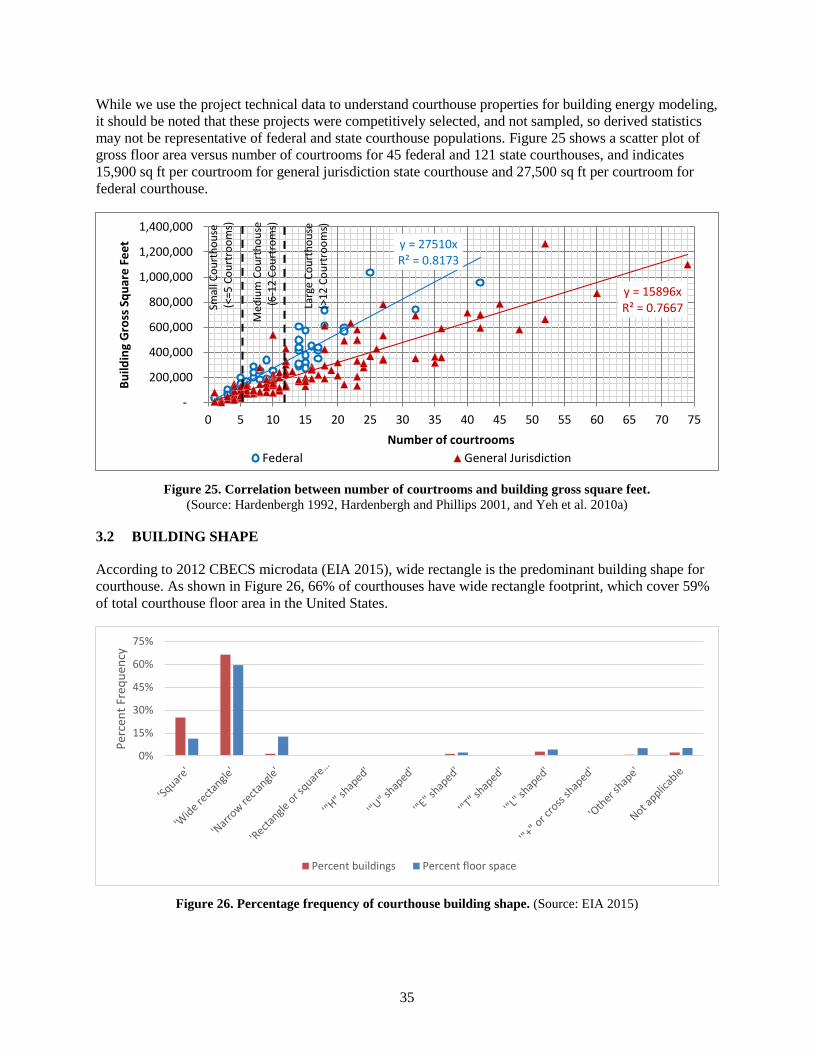
35
While we use the project technical data to understand courthouse properties for building energy modeling,
it should be noted that these projects were competitively selected, and not sampled, so derived statistics
may not be representative of federal and state courthouse populations. Figure 25 shows a scatter plot of
gross floor area versus number of courtrooms for 45 federal and 121 state courthouses, and indicates
15,900 sq ft per courtroom for general jurisdiction state courthouse and 27,500 sq ft per courtroom for
federal courthouse.
Figure 25. Correlation between number of courtrooms and building gross square feet.
(Source: Hardenbergh 1992, Hardenbergh and Phillips 2001, and Yeh et al. 2010a)
3.2 BUILDING SHAPE
According to 2012 CBECS microdata (EIA 2015), wide rectangle is the predominant building shape for
courthouse. As shown in Figure 26, 66% of courthouses have wide rectangle footprint, which cover 59%
of total courthouse floor area in the United States.
Figure 26. Percentage frequency of courthouse building shape. (Source: EIA 2015)
y = 27510xR² = 0.8173
y = 15896xR² = 0.7667
-
200,000
400,000
600,000
800,000
1,000,000
1,200,000
1,400,000
0 5 10 15 20 25 30 35 40 45 50 55 60 65 70 75
Bu
ildin
g G
ross
Sq
uar
e F
ee
t
Number of courtrooms
Federal General Jurisdiction
Smal
l Co
urt
ho
use
(<
=5 C
ou
rtro
om
s)
Med
ium
Co
urt
ho
use
(6-1
2 C
ou
rtro
ms)
Larg
e C
ou
rth
ou
se(>
12
Co
urt
roo
ms)
0%
15%
30%
45%
60%
75%
Per
cen
t Fr
equ
ency
Percent buildings Percent floor space
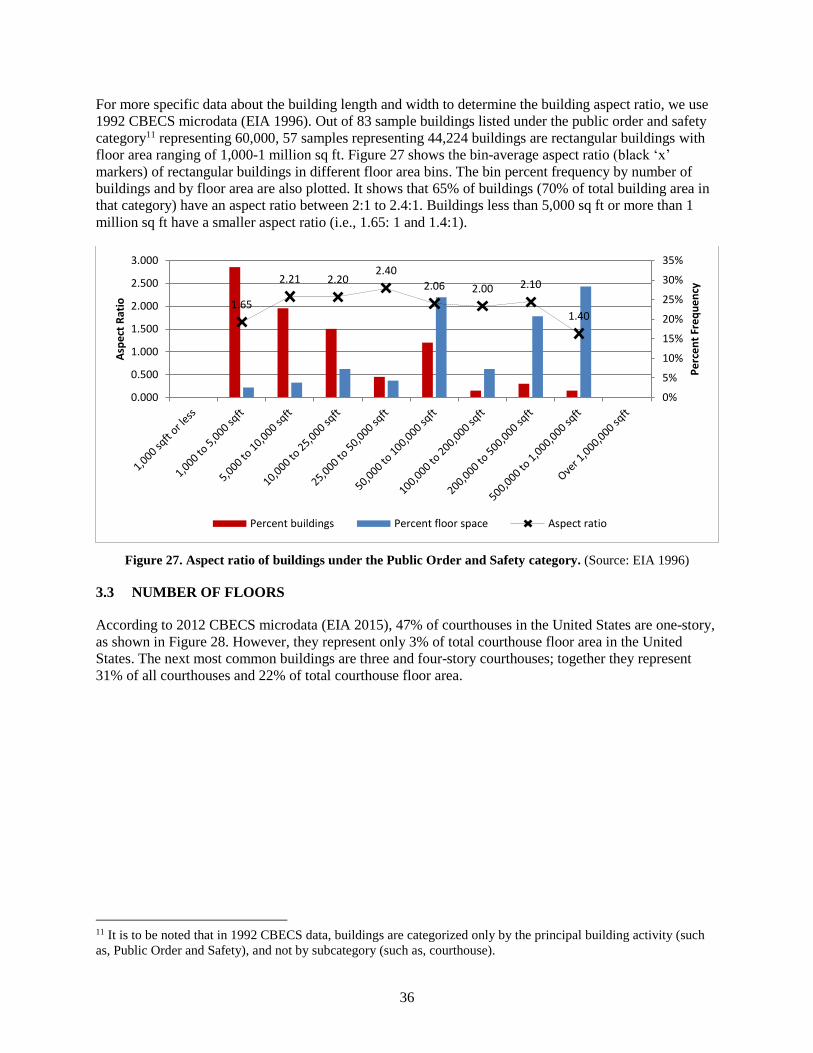
36
For more specific data about the building length and width to determine the building aspect ratio, we use
1992 CBECS microdata (EIA 1996). Out of 83 sample buildings listed under the public order and safety
category11 representing 60,000, 57 samples representing 44,224 buildings are rectangular buildings with
floor area ranging of 1,000-1 million sq ft. Figure 27 shows the bin-average aspect ratio (black ‘x’
markers) of rectangular buildings in different floor area bins. The bin percent frequency by number of
buildings and by floor area are also plotted. It shows that 65% of buildings (70% of total building area in
that category) have an aspect ratio between 2:1 to 2.4:1. Buildings less than 5,000 sq ft or more than 1
million sq ft have a smaller aspect ratio (i.e., 1.65: 1 and 1.4:1).
Figure 27. Aspect ratio of buildings under the Public Order and Safety category. (Source: EIA 1996)
3.3 NUMBER OF FLOORS
According to 2012 CBECS microdata (EIA 2015), 47% of courthouses in the United States are one-story,
as shown in Figure 28. However, they represent only 3% of total courthouse floor area in the United
States. The next most common buildings are three and four-story courthouses; together they represent
31% of all courthouses and 22% of total courthouse floor area.
11 It is to be noted that in 1992 CBECS data, buildings are categorized only by the principal building activity (such
as, Public Order and Safety), and not by subcategory (such as, courthouse).
1.65
2.21 2.202.40
2.06 2.00 2.10
1.40
0%
5%
10%
15%
20%
25%
30%
35%
0.000
0.500
1.000
1.500
2.000
2.500
3.000
Pe
rce
nt
Fre
qu
en
cy
Asp
ect
Rat
io
Percent buildings Percent floor space Aspect ratio
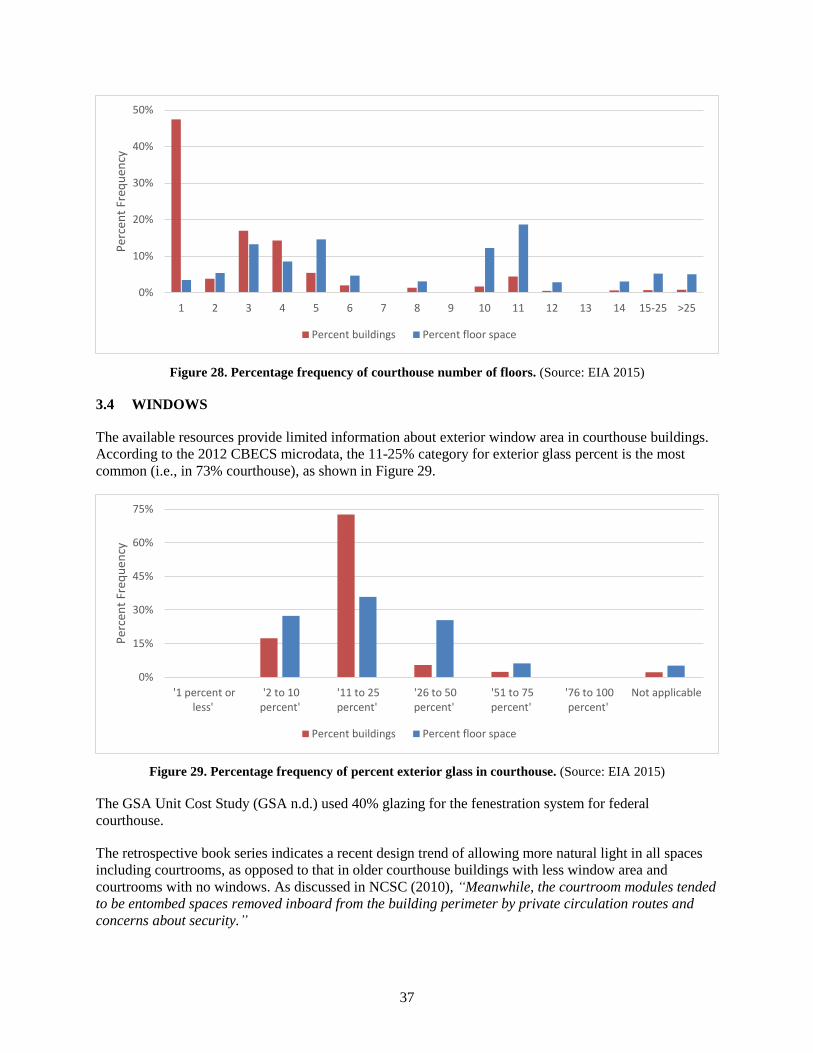
37
Figure 28. Percentage frequency of courthouse number of floors. (Source: EIA 2015)
3.4 WINDOWS
The available resources provide limited information about exterior window area in courthouse buildings.
According to the 2012 CBECS microdata, the 11-25% category for exterior glass percent is the most
common (i.e., in 73% courthouse), as shown in Figure 29.
Figure 29. Percentage frequency of percent exterior glass in courthouse. (Source: EIA 2015)
The GSA Unit Cost Study (GSA n.d.) used 40% glazing for the fenestration system for federal
courthouse.
The retrospective book series indicates a recent design trend of allowing more natural light in all spaces
including courtrooms, as opposed to that in older courthouse buildings with less window area and
courtrooms with no windows. As discussed in NCSC (2010), “Meanwhile, the courtroom modules tended
to be entombed spaces removed inboard from the building perimeter by private circulation routes and
concerns about security.”
0%
10%
20%
30%
40%
50%
1 2 3 4 5 6 7 8 9 10 11 12 13 14 15-25 >25
Per
cen
t Fr
equ
ency
Percent buildings Percent floor space
0%
15%
30%
45%
60%
75%
'1 percent orless'
'2 to 10percent'
'11 to 25percent'
'26 to 50percent'
'51 to 75percent'
'76 to 100percent'
Not applicable
Per
cen
t Fr
equ
ency
Percent buildings Percent floor space
38
“The projects in [NCSC (2010)] demonstrate a clear evolution beyond those earlier priorities –
suggesting that the courtroom design challenges that surfaced in the 1990’s have now been worked out -
and the emergence of a new priority that involves the introduction of natural light. There were examples
of modern courtrooms with natural light in [Hardenbergh et al. (1991) and Hardenbergh and Phillips
(2001)], but the emphasis upon light has become more widespread as a primary goal. A variety of
techniques for bringing light into the courtroom directly or on a borrowed basis are illustrated in the
projects and reflect appreciation for the virtues of natural light in often stressful settings.”
Further,
“Similar advances are being made with the design of public space that reflects greater awareness of the
need for safe, easily comprehensible corridors and light-filled waiting areas.”
Yeh et al. (2010a) also emphasizes on the recent trend towards designing courthouses with more glass,
even in the courtrooms, Affirming Transparency and Openness, “Rejecting the Architecture of Fear.”
For determining the placement of windows in different spaces in the courthouse (e.g., presence, size, sill
height), one relevant consideration is found in California Trial Courts Facilities Standards (2011), which
specifies that for courtrooms, chambers and jury assembly rooms, windows with direct line of sight from
public areas, circulation zones, and parking garages, should be minimized to prevent observation of
activities, threat exposure, or communication with courthouse occupants.
3.5 NUMBER OF ELEVATORS
The 2012 CBECS microdata (EIA 2015) lists number of elevators in the building. Figure 30 plots the
number of elevators versus (a) building square footage and (b) number of floors. The number of floors for
each data point is marked in Figure 30(a). The plot shows that, in general, the number of elevators is
roughly correlated with the building square footage with a maximum of 12 elevators. For medium and
large courthouses, such dependence is less discernable. Likewise, Figure 30(b) shows that the number of
elevators is roughly correlated with number of floors, with a few outlying data points.
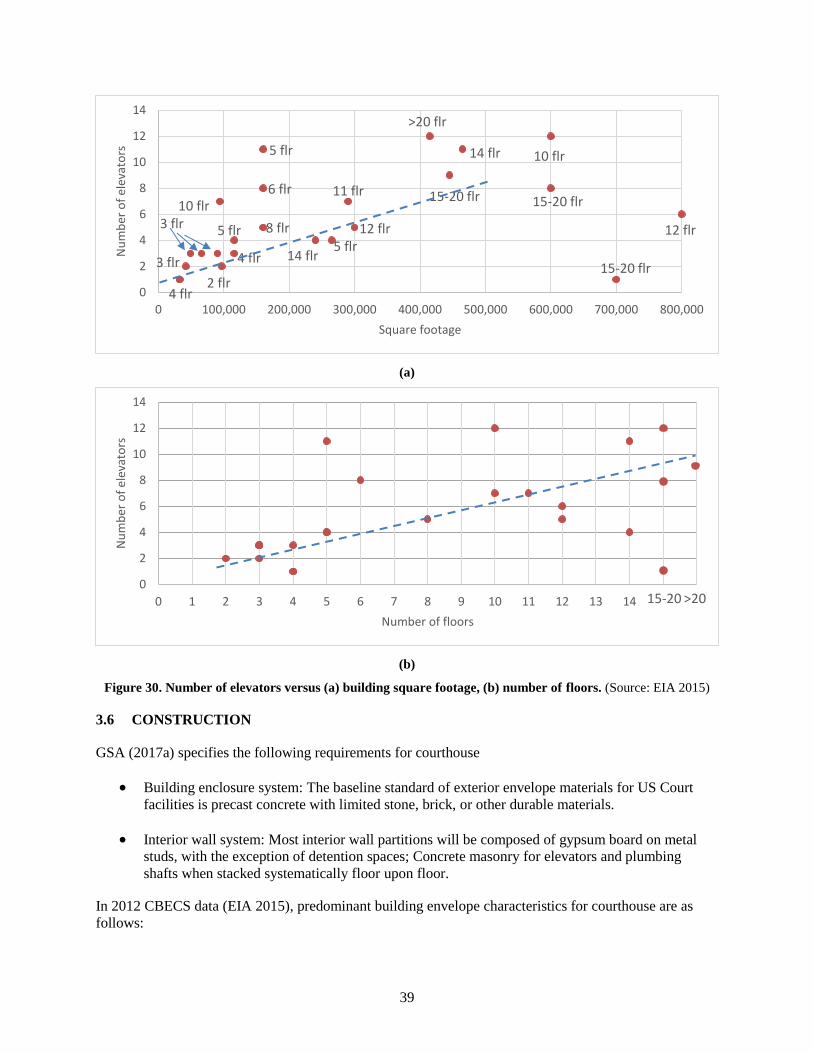
39
(a)
(b)
Figure 30. Number of elevators versus (a) building square footage, (b) number of floors. (Source: EIA 2015)
3.6 CONSTRUCTION
GSA (2017a) specifies the following requirements for courthouse
• Building enclosure system: The baseline standard of exterior envelope materials for US Court
facilities is precast concrete with limited stone, brick, or other durable materials.
• Interior wall system: Most interior wall partitions will be composed of gypsum board on metal
studs, with the exception of detention spaces; Concrete masonry for elevators and plumbing
shafts when stacked systematically floor upon floor.
In 2012 CBECS data (EIA 2015), predominant building envelope characteristics for courthouse are as
follows:
0
2
4
6
8
10
12
14
0 100,000 200,000 300,000 400,000 500,000 600,000 700,000 800,000
Nu
mb
er o
f el
evat
ors
Square footage
4 flr
3 flr
10 flr
4 flr
5 flr3 flr
2 flr
5 flr
8 flr 12 flr
15-20 flr
10 flr
15-20 flr
14 flr
15-20 flr
>20 flr
12 flr
11 flr
5 flr14 flr
6 flr
0
2
4
6
8
10
12
14
0 1 2 3 4 5 6 7 8 9 10 11 12 13 14 15 16
Nu
mb
er o
f el
evat
ors
Number of floors
>2015-20
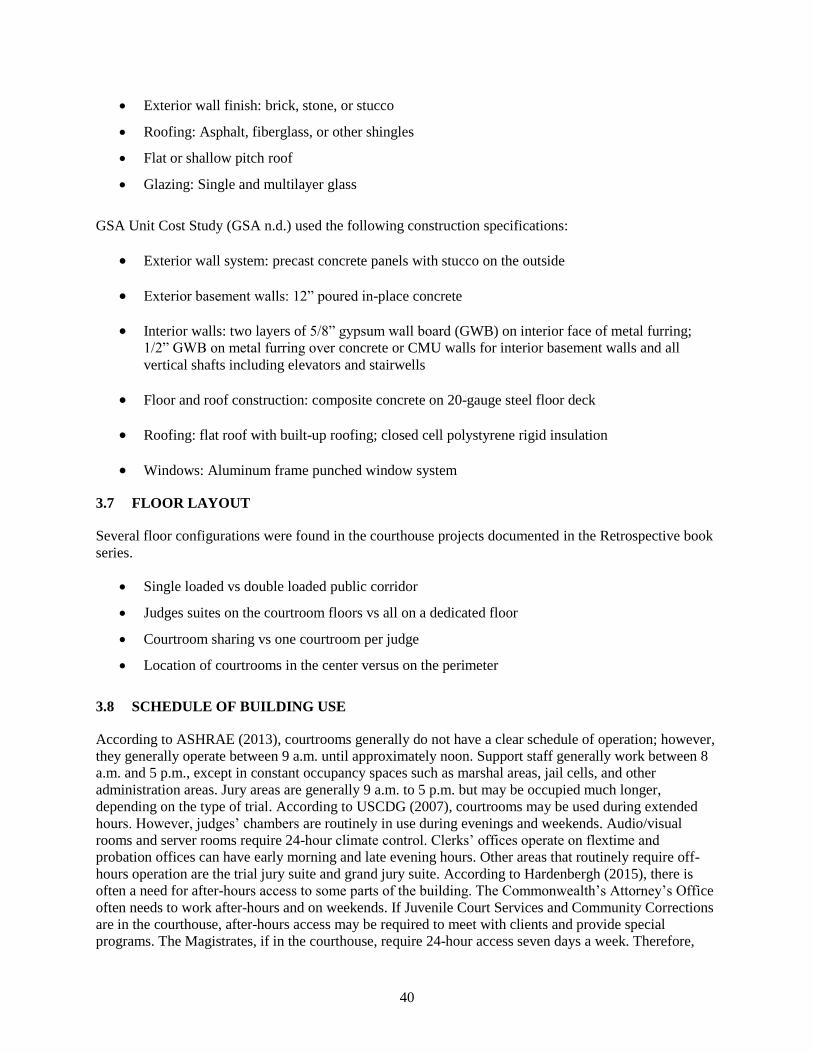
40
• Exterior wall finish: brick, stone, or stucco
• Roofing: Asphalt, fiberglass, or other shingles
• Flat or shallow pitch roof
• Glazing: Single and multilayer glass
GSA Unit Cost Study (GSA n.d.) used the following construction specifications:
• Exterior wall system: precast concrete panels with stucco on the outside
• Exterior basement walls: 12” poured in-place concrete
• Interior walls: two layers of 5/8” gypsum wall board (GWB) on interior face of metal furring;
1/2” GWB on metal furring over concrete or CMU walls for interior basement walls and all
vertical shafts including elevators and stairwells
• Floor and roof construction: composite concrete on 20-gauge steel floor deck
• Roofing: flat roof with built-up roofing; closed cell polystyrene rigid insulation
• Windows: Aluminum frame punched window system
3.7 FLOOR LAYOUT
Several floor configurations were found in the courthouse projects documented in the Retrospective book
series.
• Single loaded vs double loaded public corridor
• Judges suites on the courtroom floors vs all on a dedicated floor
• Courtroom sharing vs one courtroom per judge
• Location of courtrooms in the center versus on the perimeter
3.8 SCHEDULE OF BUILDING USE
According to ASHRAE (2013), courtrooms generally do not have a clear schedule of operation; however,
they generally operate between 9 a.m. until approximately noon. Support staff generally work between 8
a.m. and 5 p.m., except in constant occupancy spaces such as marshal areas, jail cells, and other
administration areas. Jury areas are generally 9 a.m. to 5 p.m. but may be occupied much longer,
depending on the type of trial. According to USCDG (2007), courtrooms may be used during extended
hours. However, judges’ chambers are routinely in use during evenings and weekends. Audio/visual
rooms and server rooms require 24-hour climate control. Clerks’ offices operate on flextime and
probation offices can have early morning and late evening hours. Other areas that routinely require off-
hours operation are the trial jury suite and grand jury suite. According to Hardenbergh (2015), there is
often a need for after-hours access to some parts of the building. The Commonwealth’s Attorney’s Office
often needs to work after-hours and on weekends. If Juvenile Court Services and Community Corrections
are in the courthouse, after-hours access may be required to meet with clients and provide special
programs. The Magistrates, if in the courthouse, require 24-hour access seven days a week. Therefore,
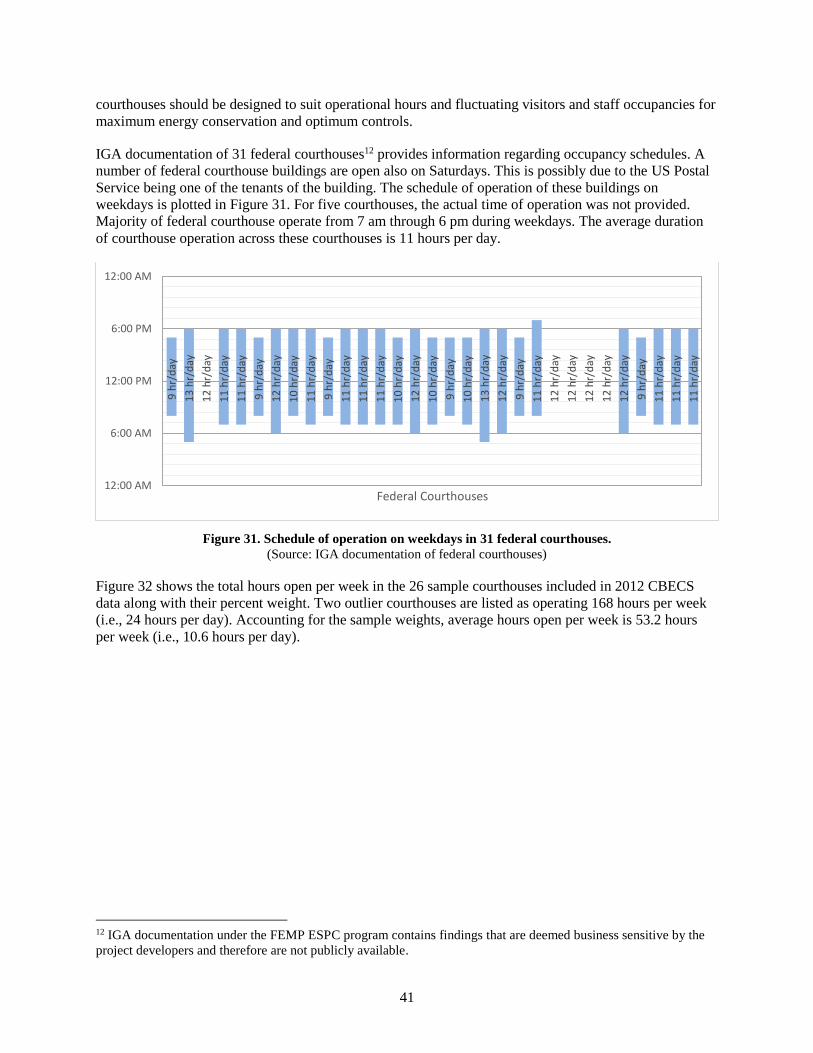
41
courthouses should be designed to suit operational hours and fluctuating visitors and staff occupancies for
maximum energy conservation and optimum controls.
IGA documentation of 31 federal courthouses12 provides information regarding occupancy schedules. A
number of federal courthouse buildings are open also on Saturdays. This is possibly due to the US Postal
Service being one of the tenants of the building. The schedule of operation of these buildings on
weekdays is plotted in Figure 31. For five courthouses, the actual time of operation was not provided.
Majority of federal courthouse operate from 7 am through 6 pm during weekdays. The average duration
of courthouse operation across these courthouses is 11 hours per day.
Figure 31. Schedule of operation on weekdays in 31 federal courthouses.
(Source: IGA documentation of federal courthouses)
Figure 32 shows the total hours open per week in the 26 sample courthouses included in 2012 CBECS
data along with their percent weight. Two outlier courthouses are listed as operating 168 hours per week
(i.e., 24 hours per day). Accounting for the sample weights, average hours open per week is 53.2 hours
per week (i.e., 10.6 hours per day).
12 IGA documentation under the FEMP ESPC program contains findings that are deemed business sensitive by the
project developers and therefore are not publicly available.
9 h
r/d
ay
13
hr/
day
12
hr/
day
11
hr/
day
11
hr/
day
9 h
r/d
ay
12
hr/
day
10
hr/
day
11
hr/
day
9 h
r/d
ay
11
hr/
day
11
hr/
day
11
hr/
day
10
hr/
day
12
hr/
day
10
hr/
day
9 h
r/d
ay
10
hr/
day
13
hr/
day
12
hr/
day
9 h
r/d
ay
11
hr/
day
12
hr/
day
12
hr/
day
12
hr/
day
12
hr/
day
12
hr/
day
9 h
r/d
ay
11
hr/
day
11
hr/
day
11
hr/
day
-240 hr/day
-190 hr/day
-140 hr/day
-90 hr/day
-40 hr/day
10 hr/day
60 hr/day
110 hr/day
160 hr/day
210 hr/day
12:00 AM
6:00 AM
12:00 PM
6:00 PM
12:00 AM
Federal Courthouses
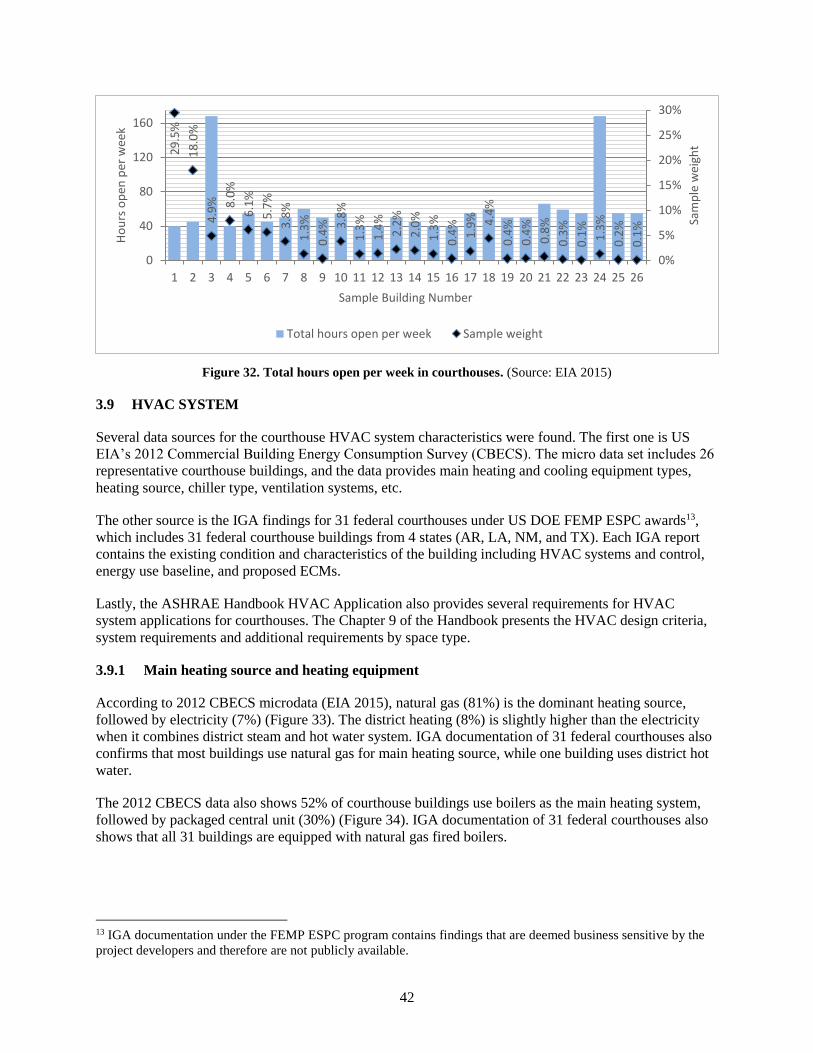
42
Figure 32. Total hours open per week in courthouses. (Source: EIA 2015)
3.9 HVAC SYSTEM
Several data sources for the courthouse HVAC system characteristics were found. The first one is US
EIA’s 2012 Commercial Building Energy Consumption Survey (CBECS). The micro data set includes 26
representative courthouse buildings, and the data provides main heating and cooling equipment types,
heating source, chiller type, ventilation systems, etc.
The other source is the IGA findings for 31 federal courthouses under US DOE FEMP ESPC awards13,
which includes 31 federal courthouse buildings from 4 states (AR, LA, NM, and TX). Each IGA report
contains the existing condition and characteristics of the building including HVAC systems and control,
energy use baseline, and proposed ECMs.
Lastly, the ASHRAE Handbook HVAC Application also provides several requirements for HVAC
system applications for courthouses. The Chapter 9 of the Handbook presents the HVAC design criteria,
system requirements and additional requirements by space type.
3.9.1 Main heating source and heating equipment
According to 2012 CBECS microdata (EIA 2015), natural gas (81%) is the dominant heating source,
followed by electricity (7%) (Figure 33). The district heating (8%) is slightly higher than the electricity
when it combines district steam and hot water system. IGA documentation of 31 federal courthouses also
confirms that most buildings use natural gas for main heating source, while one building uses district hot
water.
The 2012 CBECS data also shows 52% of courthouse buildings use boilers as the main heating system,
followed by packaged central unit (30%) (Figure 34). IGA documentation of 31 federal courthouses also
shows that all 31 buildings are equipped with natural gas fired boilers.
13 IGA documentation under the FEMP ESPC program contains findings that are deemed business sensitive by the
project developers and therefore are not publicly available.
29
.5%
18
.0%
4.9
% 8.0
%
6.1
%
5.7
%
3.8
%
1.3
%
0.4
% 3.8
%
1.3
%
1.4
%
2.2
%
2.0
%
1.3
%
0.4
%
1.9
% 4.4
%
0.4
%
0.4
%
0.8
%
0.3
%
0.1
%
1.3
%
0.2
%
0.1
%
0%
5%
10%
15%
20%
25%
30%
0
40
80
120
160
1 2 3 4 5 6 7 8 9 10 11 12 13 14 15 16 17 18 19 20 21 22 23 24 25 26
Sam
ple
wei
ght
Ho
urs
op
en p
er w
eek
Sample Building Number
Total hours open per week Sample weight
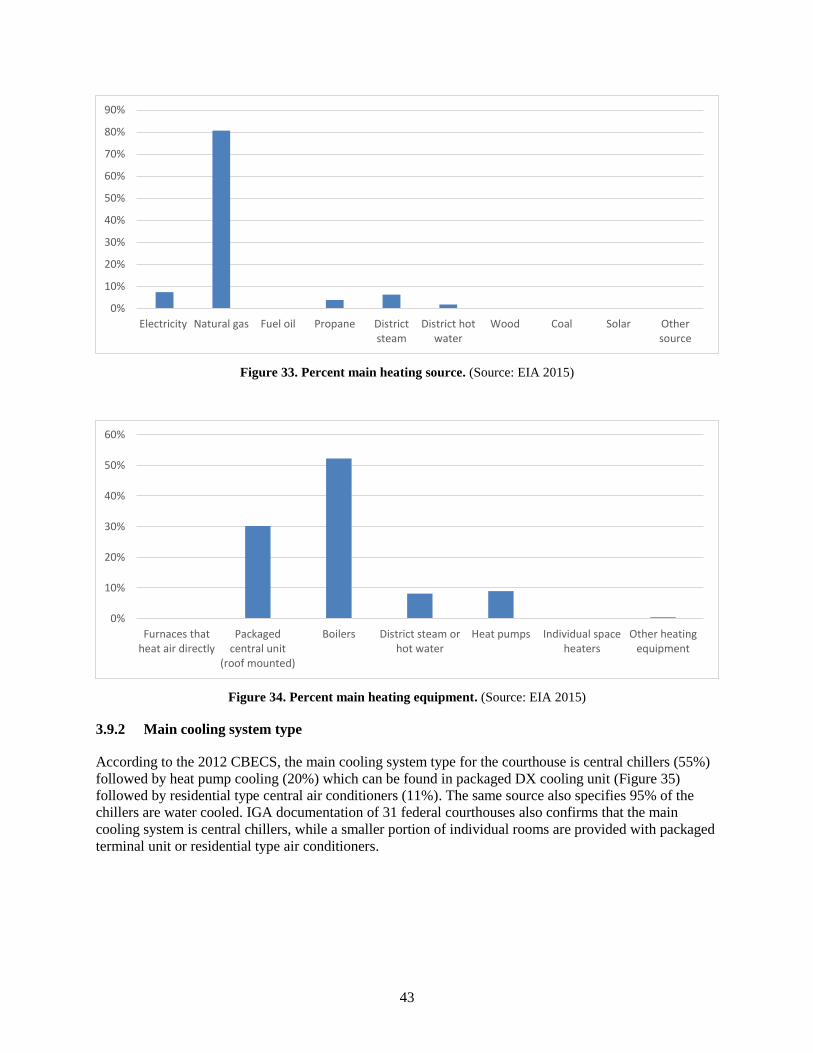
43
Figure 33. Percent main heating source. (Source: EIA 2015)
Figure 34. Percent main heating equipment. (Source: EIA 2015)
3.9.2 Main cooling system type
According to the 2012 CBECS, the main cooling system type for the courthouse is central chillers (55%)
followed by heat pump cooling (20%) which can be found in packaged DX cooling unit (Figure 35)
followed by residential type central air conditioners (11%). The same source also specifies 95% of the
chillers are water cooled. IGA documentation of 31 federal courthouses also confirms that the main
cooling system is central chillers, while a smaller portion of individual rooms are provided with packaged
terminal unit or residential type air conditioners.
0%
10%
20%
30%
40%
50%
60%
70%
80%
90%
Electricity Natural gas Fuel oil Propane Districtsteam
District hotwater
Wood Coal Solar Othersource
0%
10%
20%
30%
40%
50%
60%
Furnaces thatheat air directly
Packagedcentral unit
(roof mounted)
Boilers District steam orhot water
Heat pumps Individual spaceheaters
Other heatingequipment
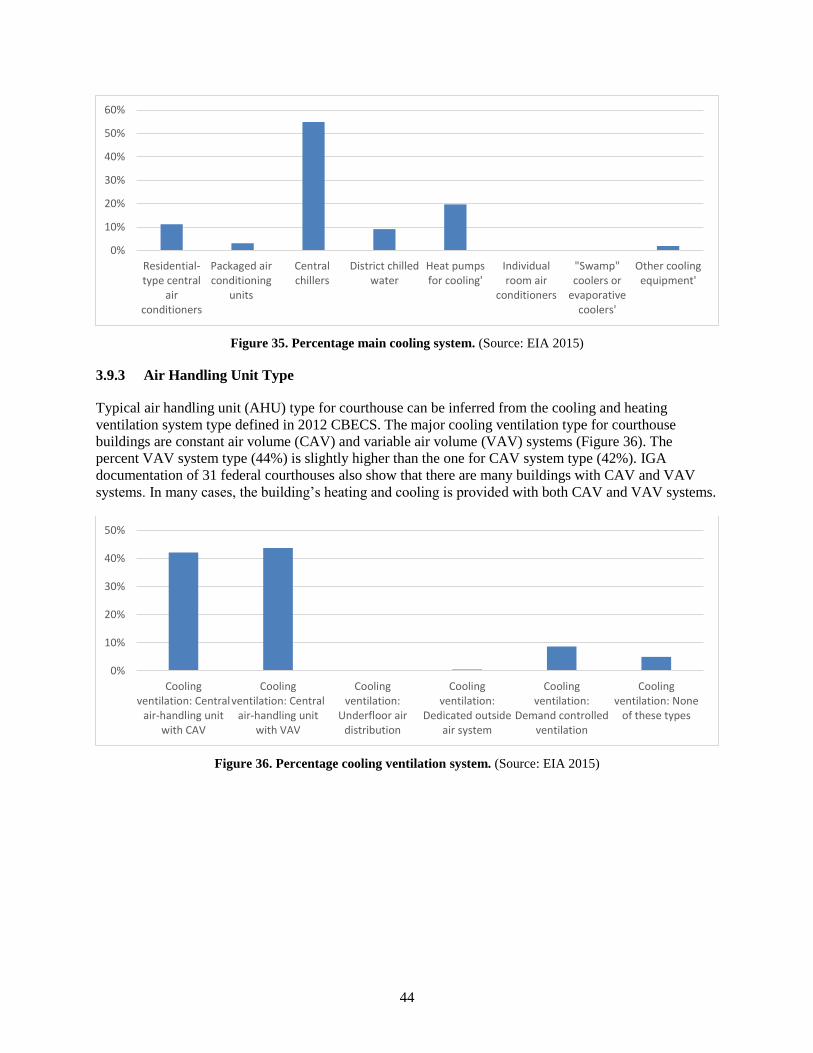
44
Figure 35. Percentage main cooling system. (Source: EIA 2015)
3.9.3 Air Handling Unit Type
Typical air handling unit (AHU) type for courthouse can be inferred from the cooling and heating
ventilation system type defined in 2012 CBECS. The major cooling ventilation type for courthouse
buildings are constant air volume (CAV) and variable air volume (VAV) systems (Figure 36). The
percent VAV system type (44%) is slightly higher than the one for CAV system type (42%). IGA
documentation of 31 federal courthouses also show that there are many buildings with CAV and VAV
systems. In many cases, the building’s heating and cooling is provided with both CAV and VAV systems.
Figure 36. Percentage cooling ventilation system. (Source: EIA 2015)
0%
10%
20%
30%
40%
50%
60%
Residential-type central
airconditioners
Packaged airconditioning
units
Centralchillers
District chilledwater
Heat pumpsfor cooling'
Individualroom air
conditioners
"Swamp"coolers or
evaporativecoolers'
Other coolingequipment'
0%
10%
20%
30%
40%
50%
Coolingventilation: Central
air-handling unitwith CAV
Coolingventilation: Central
air-handling unitwith VAV
Coolingventilation:
Underfloor airdistribution
Coolingventilation:
Dedicated outsideair system
Coolingventilation:
Demand controlledventilation
Coolingventilation: None
of these types
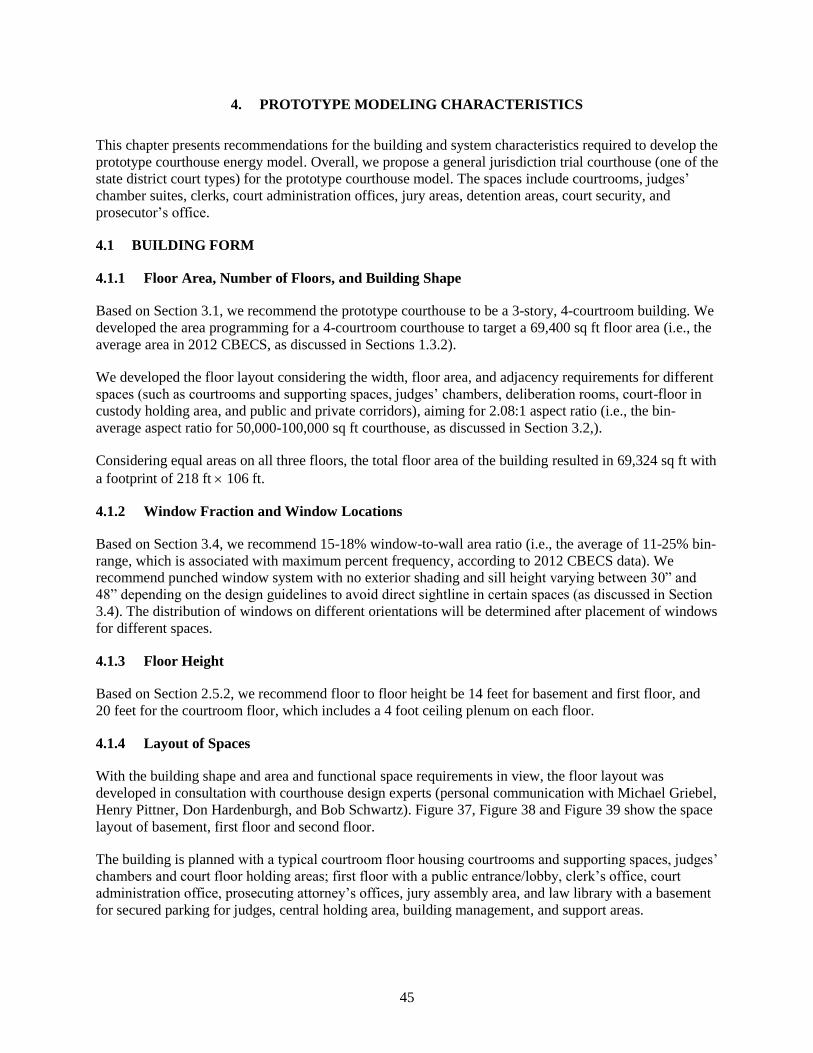
45
4. PROTOTYPE MODELING CHARACTERISTICS
This chapter presents recommendations for the building and system characteristics required to develop the
prototype courthouse energy model. Overall, we propose a general jurisdiction trial courthouse (one of the
state district court types) for the prototype courthouse model. The spaces include courtrooms, judges’
chamber suites, clerks, court administration offices, jury areas, detention areas, court security, and
prosecutor’s office.
4.1 BUILDING FORM
4.1.1 Floor Area, Number of Floors, and Building Shape
Based on Section 3.1, we recommend the prototype courthouse to be a 3-story, 4-courtroom building. We
developed the area programming for a 4-courtroom courthouse to target a 69,400 sq ft floor area (i.e., the
average area in 2012 CBECS, as discussed in Sections 1.3.2).
We developed the floor layout considering the width, floor area, and adjacency requirements for different
spaces (such as courtrooms and supporting spaces, judges’ chambers, deliberation rooms, court-floor in
custody holding area, and public and private corridors), aiming for 2.08:1 aspect ratio (i.e., the bin-
average aspect ratio for 50,000-100,000 sq ft courthouse, as discussed in Section 3.2,).
Considering equal areas on all three floors, the total floor area of the building resulted in 69,324 sq ft with
a footprint of 218 ft 106 ft.
4.1.2 Window Fraction and Window Locations
Based on Section 3.4, we recommend 15-18% window-to-wall area ratio (i.e., the average of 11-25% bin-
range, which is associated with maximum percent frequency, according to 2012 CBECS data). We
recommend punched window system with no exterior shading and sill height varying between 30” and
48” depending on the design guidelines to avoid direct sightline in certain spaces (as discussed in Section
3.4). The distribution of windows on different orientations will be determined after placement of windows
for different spaces.
4.1.3 Floor Height
Based on Section 2.5.2, we recommend floor to floor height be 14 feet for basement and first floor, and
20 feet for the courtroom floor, which includes a 4 foot ceiling plenum on each floor.
4.1.4 Layout of Spaces
With the building shape and area and functional space requirements in view, the floor layout was
developed in consultation with courthouse design experts (personal communication with Michael Griebel,
Henry Pittner, Don Hardenburgh, and Bob Schwartz). Figure 37, Figure 38 and Figure 39 show the space
layout of basement, first floor and second floor.
The building is planned with a typical courtroom floor housing courtrooms and supporting spaces, judges’
chambers and court floor holding areas; first floor with a public entrance/lobby, clerk’s office, court
administration office, prosecuting attorney’s offices, jury assembly area, and law library with a basement
for secured parking for judges, central holding area, building management, and support areas.
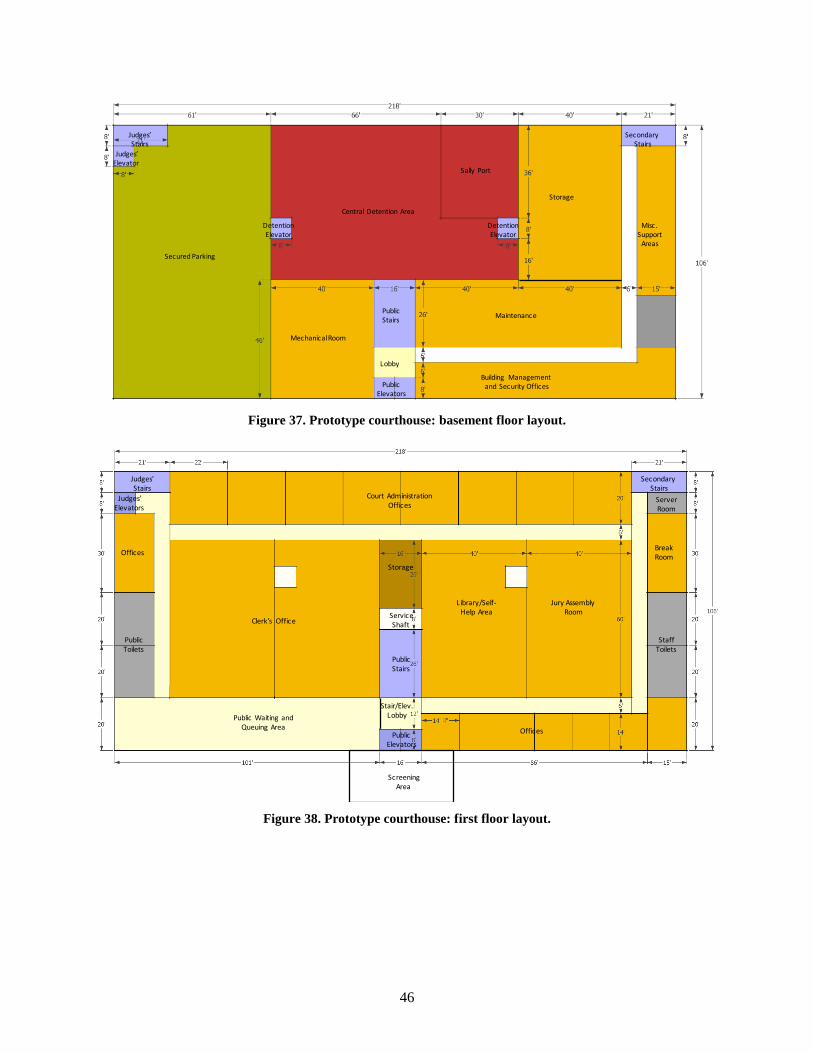
46
Figure 37. Prototype courthouse: basement floor layout.
Figure 38. Prototype courthouse: first floor layout.
SecuredParking
CentralDetentionArea
SecondaryStairs
PublicStairs
PublicElevators
Judges’Stairs
Judges’Elevator
DetentionElevator
DetentionElevator
Storage
BuildingManagementandSecurityOffices
Maintenance
MechanicalRoom
Lobby
SallyPort
Misc.SupportAreas
Clerk’sOffice
PublicWaitingandQueuingArea
Library/Self-HelpArea
JuryAssemblyRoom
Offices
StaffToilets
Storage
BreakRoom
ServerRoom
CourtAdministrationOffices
PublicStairs
PublicElevators
Judges’Stairs
Judges’Elevators
SecondaryStairs
PublicToilets
ScreeningArea
Stair/Elev.Lobby
Offices
ServiceShaft
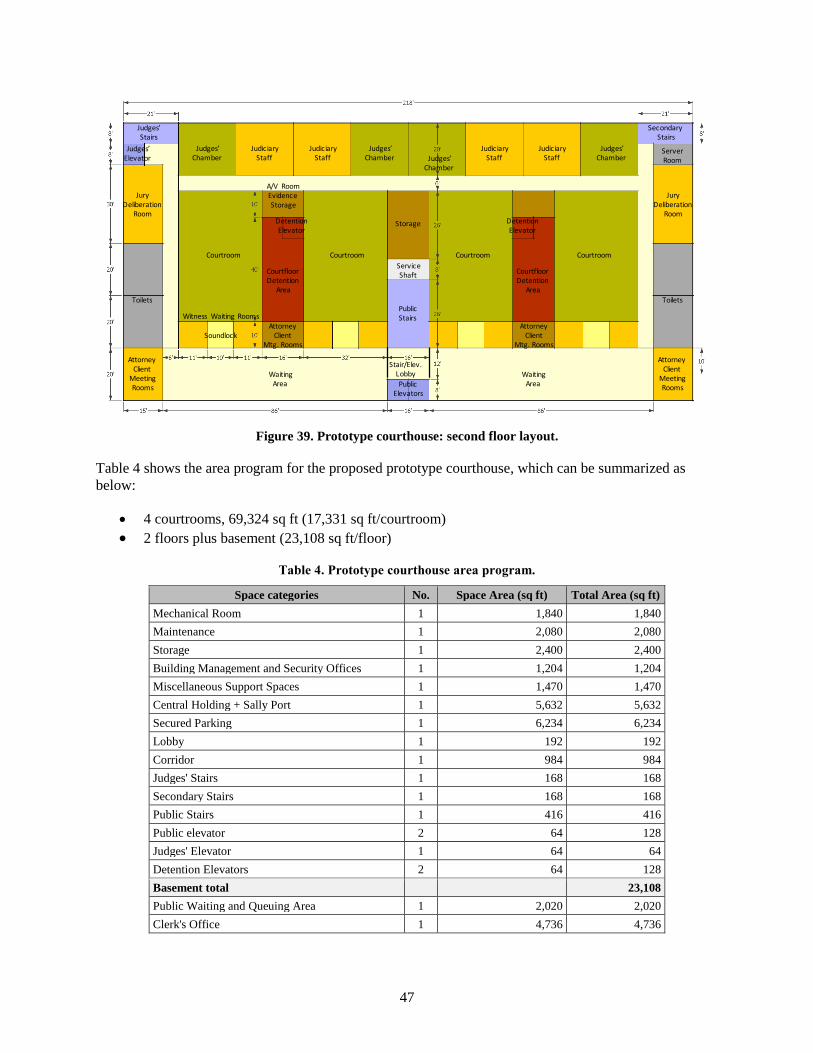
47
Figure 39. Prototype courthouse: second floor layout.
Table 4 shows the area program for the proposed prototype courthouse, which can be summarized as
below:
• 4 courtrooms, 69,324 sq ft (17,331 sq ft/courtroom)
• 2 floors plus basement (23,108 sq ft/floor)
Table 4. Prototype courthouse area program.
Space categories No. Space Area (sq ft) Total Area (sq ft)
Mechanical Room 1 1,840 1,840
Maintenance 1 2,080 2,080
Storage 1 2,400 2,400
Building Management and Security Offices 1 1,204 1,204
Miscellaneous Support Spaces 1 1,470 1,470
Central Holding + Sally Port 1 5,632 5,632
Secured Parking 1 6,234 6,234
Lobby 1 192 192
Corridor 1 984 984
Judges' Stairs 1 168 168
Secondary Stairs 1 168 168
Public Stairs 1 416 416
Public elevator 2 64 128
Judges' Elevator 1 64 64
Detention Elevators 2 64 128
Basement total 23,108
Public Waiting and Queuing Area 1 2,020 2,020
Clerk's Office 1 4,736 4,736
SecondaryStairs
PublicStairs
WaitingArea
Judges’Stairs
Judges’Elevator
DetentionElevator
DetentionElevator
WaitingArea
CourtroomCourtroomCourtroomCourtroom
Soundlock
WitnessWaitingRooms
Judges’Chamber
Judges’Chamber Judges’
Chamber
Judges’Chamber
JudiciaryStaff
JudiciaryStaff
JudiciaryStaff
JudiciaryStaff
ToiletsToilets
CourtfloorDetention
Area
CourtfloorDetention
Area
JuryDeliberation
Room
JuryDeliberation
RoomStorage
PublicElevators
AttorneyClientMeetingRooms
AttorneyClientMeetingRooms
A/VRoomEvidenceStorage
ServiceShaft
ServerRoom
AttorneyClient
Mtg.Rooms
AttorneyClient
Mtg.Rooms
Stair/Elev.Lobby
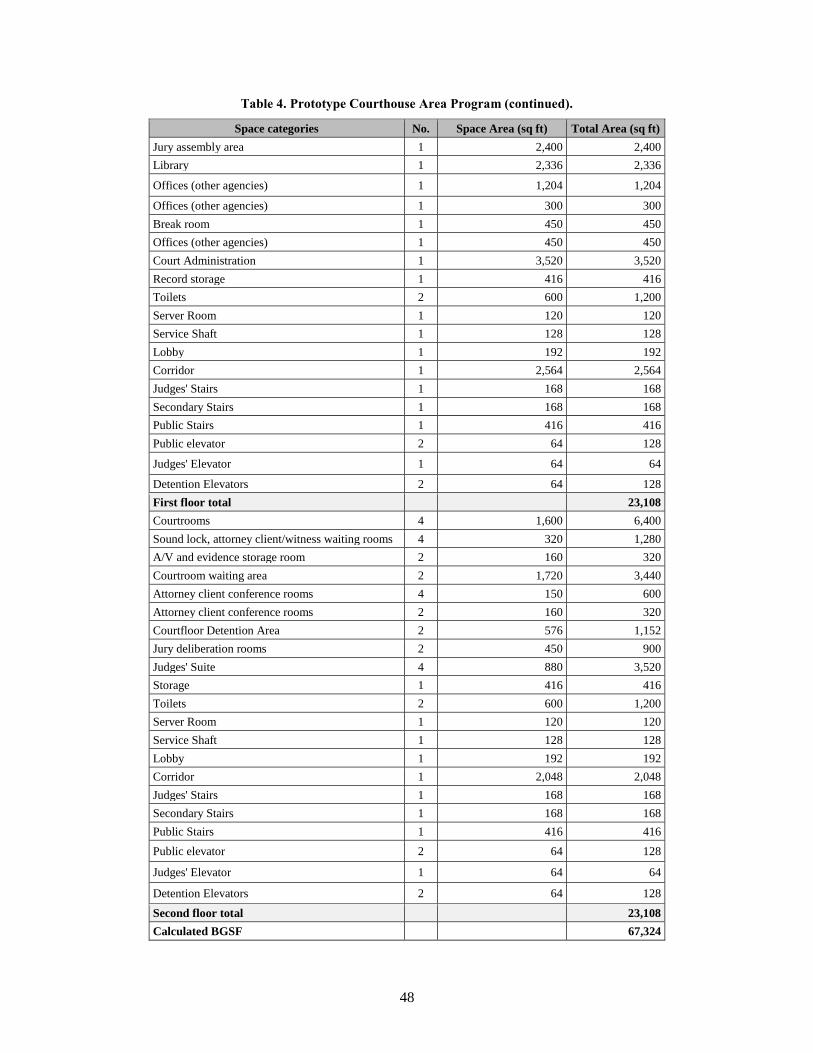
48
Table 4. Prototype Courthouse Area Program (continued).
Space categories No. Space Area (sq ft) Total Area (sq ft)
Jury assembly area 1 2,400 2,400
Library 1 2,336 2,336
Offices (other agencies) 1 1,204 1,204
Offices (other agencies) 1 300 300
Break room 1 450 450
Offices (other agencies) 1 450 450
Court Administration 1 3,520 3,520
Record storage 1 416 416
Toilets 2 600 1,200
Server Room 1 120 120
Service Shaft 1 128 128
Lobby 1 192 192
Corridor 1 2,564 2,564
Judges' Stairs 1 168 168
Secondary Stairs 1 168 168
Public Stairs 1 416 416
Public elevator 2 64 128
Judges' Elevator 1 64 64
Detention Elevators 2 64 128
First floor total 23,108
Courtrooms 4 1,600 6,400
Sound lock, attorney client/witness waiting rooms 4 320 1,280
A/V and evidence storage room 2 160 320
Courtroom waiting area 2 1,720 3,440
Attorney client conference rooms 4 150 600
Attorney client conference rooms 2 160 320
Courtfloor Detention Area 2 576 1,152
Jury deliberation rooms 2 450 900
Judges' Suite 4 880 3,520
Storage 1 416 416
Toilets 2 600 1,200
Server Room 1 120 120
Service Shaft 1 128 128
Lobby 1 192 192
Corridor 1 2,048 2,048
Judges' Stairs 1 168 168
Secondary Stairs 1 168 168
Public Stairs 1 416 416
Public elevator 2 64 128
Judges' Elevator 1 64 64
Detention Elevators 2 64 128
Second floor total 23,108
Calculated BGSF 67,324
49
4.2 STRUCTURE
Based on Section 3.6, we recommend the following construction characteristics for the prototype model:
• Exterior walls: Mass walls (precast concrete panels) with wall insulation, stucco on the outside,
gypsum wall board on metal furring on the inside;
• Basement walls: Mass walls (12” poured-in-place concrete) with insulation; gypsum wall board
on metal furring on the inside;
• Roof: Horizontal, built-up roof with roof membrane, insulation and metal decking
• Floors: Concrete on metal deck
• Interior partition walls: Metal stud walls with acoustic insulation filling and 5/8” gypsum wall
board; concrete walls for vertical shafts including stairwells with gypsum wall board on metal
furring;
• Windows: Hypothetical window with weighted U-factor and SHGC
• Thermal properties of all envelope systems: based on ASHRAE Standard 90.1.
4.3 HVAC SYSTEM AND CONTROL
System Type
Based on the data described in Section 3.9, the prototype HVAC system is defined as following:
• Heating type: gas fired boiler
• Cooling type: air-cooled chiller
• Distribution and terminal units: VAV terminal box with damper and hot-water reheating coil
• System sizes (chiller, boiler, zone reheating, airflow) will be auto sized.
• Economizers, Demand control ventilation, Energy recovery: Those will be determined per
requirements in ASHRAE Standard 90.1
• Pump type: Primary chilled water (CHW) pumps: constant speed; secondary CHW pump:
variable speed; cooling tower pump: variable speed; service water heating (SWH): constant
speed; hot water (HW) pump: variable speed
• Rated pump head and pump power assumptions as specified in ASHRAE Standard 90.1,
Appendix G
Control
• Thermostat setpoint: 74°F Cooling/72°F Heating
50
• Thermostat setback: 85°F Cooling/60°F Heating
• Humidifier will be used to maintain the RH to be 20 to 35% during winter season
• Supply air temperature: Maximum 104°F, Minimum 55°F
• Chilled water supply temperature: 44°F
• Hot water supply temperature: 180°F
Air Distribution
Based on size and complexity of the building, we recommend air distribution systems to be semi-custom
air-handling units (AHU) or custom-designed, built-up central air-handling systems. Blow-through type
AHUs are preferred.
4.4 INTERNAL LOADS AND MISCELLANEOUS LOADS
• Occupancy, lighting loads, and plug loads: Based on thermal zone-specific requirements in codes
and standards, supplemented by specifications in design guidelines (as discussed in Section 2.5.3)
• Elevators: five hydraulic elevators including two public elevators, two detention elevators, one
judges’ elevator;
• Exterior lighting: peak power based on design assumptions for façade, parking lot, entrance, etc.
and requirements in codes or standards
51
BIBLIOGRAPHY
ASHRAE. 2015. 2015 ASHRAE Handbook – HVAC Applications. Atlanta, GA: ASHRAE.
Building Energy Codes Program. 2016. Commercial Prototype Building Models. US Department of
Energy, Energy Efficiency and Renewable Energy.
https://www.energycodes.gov/development/commercial/prototype_models
EIA. n.d. CBECS Building Type Definitions. US Energy Information Administration.
https://www.eia.gov/consumption/commercial/building-type-definitions.php
EIA. 2016. 2012 CBECS Building Activity Subcategory Examples and Definitions. US Energy
Information Administration.
https://www.eia.gov/consumption/commercial/data/2012/bc/pdf/pbaplus%20examples%20and%20de
finitions.pdf
GSA. 2016. State of the Portfolio FY16 Snapshot. US General Services Administration.
https://www.gsa.gov/portal/category/22180.
Deru, M., K. Field, D. Studer, K. Benne, B. Griffith, P. Torcellini, B. Liu, M. Halverson, D. Winiarski,
M. Rosenberg, M. Yazdanian, J. Huang, and D. Crawley. 2011. US Department of Energy
Commercial Reference Building Models of the National Building Stock. NREL/TP-5500-46861.
Golden, CO: National Renewable Energy Laboratory.
Courthouse Design Guides
Phillips, T.S. and M.A. Griebel. 2003. Building Type Basics for Justice Facilities. Indianapolis, IN:
Wiley.
Hardenbergh, D., R. Tobin, and C.M. Yeh. 1991. The Courthouse: A Planning and Design Guide for
Court Facilities. Williamsburg, VA: National Center for State Courts.
https://ncsc.contentdm.oclc.org/digital/collection/facilities/id/74/
The Virtual Courthouse: A Guide to Planning and Design [electronic]. n.d. National Center for State
Courts. http://courthouseplanning.ncsc.wikispaces.net
Wong, F.M. (ed.). 2001. Judicial Administration and Space Management: A Guide for Architects, Court
Administrators, and Planners. Gainesville, FL: University Press of Florida.
The American Courthouse: Planning and Design for the Judicial Process. 1973. Ann Arbor, MI: Institute
of Continuing Legal Education.
U.S. Courts Design Guide (USCDG). 2007. Washington, D.C.: Judicial Conference of the United States.
GSA. 2017a. Facilities Standards for the Public Buildings Service, PBS-P100. Chapter 8 Design
Standards for U.S. Court Facilities. US General Services Administration. https://www.gsa.gov/real-
estate/design-construction/architecture-engineering/facilities-standards-p100-overview alt:
https://www.wbdg.org/ffc/gsa/criteria/pbs-p100
GSA. n.d. GSA Construction Criteria for Courtroom. From GSA Unit Cost Study. pp.20.1-9.
https://www.wbdg.org/FFC/GSA/gsa_constr_criteria_courtroom.pdf
52
GSA. n.d. Shell and Core: Courthouse. From GSA Unit Cost Study. pp.C1-C35. US General Services
Administration. https://www.wbdg.org/files/pdfs/gsa_usc_shell_courthouse.pdf alt:
https://www.wbdg.org/FFC/GSA/gsa_usc_shell_courthouse.pdf
Whole Building Design Guide (WBDG). 2016a. Design Recommendation, Space Types, Courthouse:
Courtroom. National Institute of Building Sciences. Available at: https://www.wbdg.org/space-
types/courthouse-courtroom
Whole Building Design Guide (WBDG). 2016b. Design Recommendation, Space Types, Courthouse:
Enhanced Office. National Institute of Building Sciences. Available at https://www.wbdg.org/space-
types/courthouse-enhanced-office
Whole Building Design Guide (WBDG). 2016c. Design Recommendation, Space Types, Courthouse:
Judicial Chamber. National Institute of Building Sciences. Available at https://www.wbdg.org/space-
types/courthouse-judicial-chamber
Thacker, G. 2017. Federal Courthouse. Design Recommendations: Building Types. National Institute of
Building Sciences. Available at: https://www.wbdg.org/building-types/federal-courthouse-1
Supplementary Design Guides
Griebel, M. and T.S. Phillips. 2001. Architectural Design for Security in Courthouse Facilities. The
Annals of the American Academy of Political and Social Science 576(1):118-131.
GSA. 2012. Circulation: Defining and Planning. Washington, DC: US General Services Administration,
Public Building Services.
Kimme & Associates, Inc. 1998. Jail Design Guide, A Resource for Small and Medium-Sized Jails. US
Department of Justice, National Institute of Corrections.
Green Courthouse Design Concepts. 1997. Washington, DC: Public Buildings Service, US General
Services Administration. Available at: https://www.wbdg.org/FFC/GSA/green2.pdf
National Association for Court Management (NACM). Achieving and Sustaining the Green Court: 2009
Mini Guide.
State-specific Courthouse Design Guides
California Trial Court Facilities Standards 2011(draft). 2014. San Francisco, CA: Judicial Council of
California, Administrative Office of the Courts. http://www.courts.ca.gov/documents/ctcfs2011.pdf
Guidelines for New York State Court Facilities. 2009. New York State Unified Court System. PART 34,
Administrative Rules of the Unified Court System & Uniform Rules of the Trial Courts.
https://www.nycourts.gov/rules/chiefjudge/34.shtml
Hardenbergh, D. 2015. Virginia Courthouse Facility Guidelines. Richmond, VA: Office of the Executive
Secretary, Supreme Court of Virginia.
Kentucky Court Facilities Criteria. 2007. Project Development Guide Section II, Kentucky Court of
Justice: Court Facilities Criteria. Frankfort, KY: Kentucky Administrative Office of the Court.
http://courts.ky.gov/courtprograms/judicialconstruction/Documents/ProjectDevelopmentGuideSectio
nII.pdf
Kentucky Court Facilities Design Guide. 2007. Project Development Guide Section III, Kentucky Court
Facilities: Design and Construction. Frankfort, KY: Kentucky Administrative Office of the Court.
53
http://courts.ky.gov/courtprograms/judicialconstruction/Documents/ProjectDevelopmentGuideSectio
nIII.pdf
Minimum Courtroom Standards in the State of Illinois. 2011. Supreme Court of Illinois.
www.illinoiscourts.gov/SupremeCourt/Policies/Pdf/Courtroom_Standards.pdf
The Michigan Courthouse: A Planning and Design Guide for Trial Court Facilities. 2000. Lansing, MI:
Michigan Court Facilities Standards Project Advisory Committee.
http://courts.mi.gov/Administration/SCAO/Resources/Documents/standards/FacilityStandards.pdf
Nebraska Courts Facility Planning: Guidelines and Standards. 1999. Supreme Court of Nebraska.
http://nlc1.nlc.state.ne.us/epubs/S3200/B002-1999.pdf
Utah Judicial Facility Design Standards. 2016. State of Utah Judicial Branch.
https://www.utcourts.gov/admin/facilities/docs/Utah_Judicial_Facility_Design_Standards.pdf
Evolution of Courthouse Over the Years
American Bar Association (ABA). 1993. Twenty Years of Courthouse Design Revisited - Supplement to
The American Courthouse. Chicago, IL: American Bar Association Judicial Administration Division,
National Center for State Courts, State Justice Institute.
https://ncsc.contentdm.oclc.org/digital/collection/facilities/id/67/rec/1
Dixon, H.B. (Hon.). 2011. The Evolution of a High-Technology Courtroom. Future Trends in State
Courts 2011: 28-32. Williamsburg, VA: National Center for State Courts.
Hall, N. 2009. Green Courthouse Planning and Design. Future Trends in State Courts 2009: 27-
31. Williamsburg, VA: National Center for State Courts.
Hall, N. 2010. Implementing Collegial Chambers as a Means for Courtroom Sharing. Future Trends in
State Courts 2010: 85-89. Williamsburg, VA: National Center for State Courts.
Hardenbergh, D. 2004. Trends in Courthouse Design. Future Trends in State Courts 2004: 119-122.
Williamsburg, VA: National Center for State Courts.
Yeh, C.M., D. Hardenbergh, T. Phillips. 2010b.Thirty Years of Courthouse Design, The Retrospectives:
1980-2010. National Center for State Courts. Presented at the 7th International Conference on Justice
Design, Boston, MA, November 2010.
Courthouse Operation
American Bar Association (ABA). 2017. How Courts Work.
https://www.americanbar.org/groups/public_education/resources/law_related_education_network/ho
w_courts_work.html
Offices of the United States Attorneys. 2017. Introduction to the Federal Court System. Washington,
D.C.: US Department of Justice. https://www.justice.gov/usao/justice-101/federal-courts
Administrative Office of the US Courts. 2016. The Federal Court System in the United States: An
Introduction for Judges and Judicial Administrators in Other Countries. Washington, D.C.: United
States Courts. http://www.uscourts.gov/sites/default/files/federalcourtssystemintheus.pdf
US Courts. 2017. About Federal Courts: Court Role and Structure. Washington, D.C.: United States
Courts. http://www.uscourts.gov/about-federal-courts/court-role-and-structure
54
Courts Statistics Project. 2013. State Court Structure Charts. Williamsburg, VA: National Center for State
Courts. http://www.courtstatistics.org/Other-Pages/State_Court_Structure_Charts.aspx
Database
Schauffler, R., R. LaFountain, S. Strickland, K. Holt, and K. Genthon, eds. 2017. Court Statistics Project
DataViewer. Williamsburg, VA: National Center for State Courts. http://www.courtstatistics.org/.
Strickland, S., R. Schauffler, R. LaFountain & K. Holt, eds. 2017. Interactive State Court Organization
App. Williamsburg, VA: National Center for State Courts. http://www.ncsc.org/sco.
EIA. 2015. 2012 CBECS Public Use Microdata File. US Energy Information Administration
https://www.eia.gov/consumption/commercial/data/2012/index.php?view=microdata
EIA. 2008. 2003 CBECS Public Use Microdata File. US Energy Information Administration
https://www.eia.gov/consumption/commercial/data/2003/index.php?view=microdata
EIA. 1996. 1992 CBECS Public Use Microdata File. US Energy Information Administration
https://www.eia.gov/consumption/commercial/data/1992/index.php?view=microdata
GSA. 2017b. The Portfolio Data on Courthouses. US General Services Administration.
Documented Courthouse Projects
Hardenbergh, D. (ed.). 1992. Retrospective of Courthouse Design 1980-1991.Williamsburg, VA: National
Center for State Courts.
Hardenbergh, D., and T. S. Phillips (eds.). 2001. Retrospective of Courthouse Design, 1991-
2001. Williamsburg, VA: National Center for State Courts.
Yeh, C.M., D. Hardenbergh, T. Phillips (eds.). 2010a. Retrospective of Courthouse Design 2001-2010.
Williamsburg, VA: National Center for State Courts.
AIA. 2017. Justice Facilities Review (JFR) 1997-2016 Archive. The American Institute of Architects.
https://network.aia.org/academyofarchitectureforjustice/viewdocument/justice-facilities-r
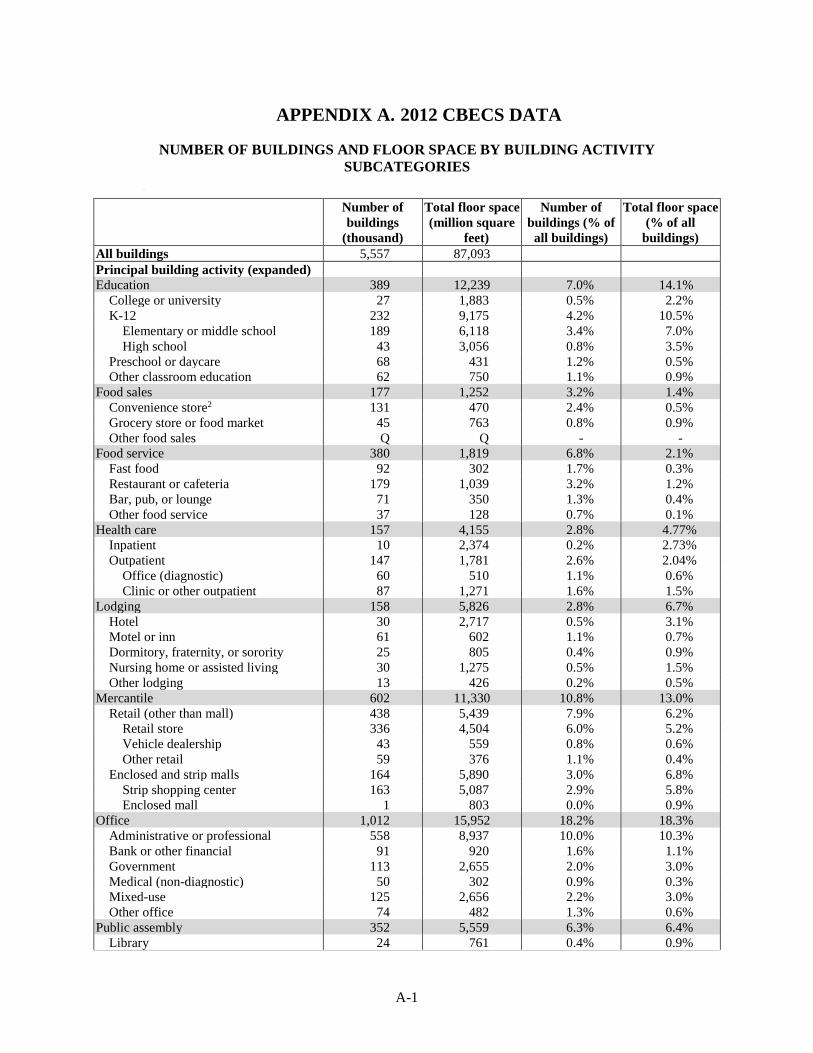
A-1
APPENDIX A. 2012 CBECS DATA
NUMBER OF BUILDINGS AND FLOOR SPACE BY BUILDING ACTIVITY
SUBCATEGORIES
Number of
buildings
(thousand)
Total floor space
(million square
feet)
Number of
buildings (% of
all buildings)
Total floor space
(% of all
buildings)
All buildings 5,557 87,093
Principal building activity (expanded)
Education 389 12,239 7.0% 14.1%
College or university 27 1,883 0.5% 2.2%
K-12 232 9,175 4.2% 10.5%
Elementary or middle school 189 6,118 3.4% 7.0%
High school 43 3,056 0.8% 3.5%
Preschool or daycare 68 431 1.2% 0.5%
Other classroom education 62 750 1.1% 0.9%
Food sales 177 1,252 3.2% 1.4%
Convenience store2 131 470 2.4% 0.5%
Grocery store or food market 45 763 0.8% 0.9%
Other food sales Q Q - -
Food service 380 1,819 6.8% 2.1%
Fast food 92 302 1.7% 0.3%
Restaurant or cafeteria 179 1,039 3.2% 1.2%
Bar, pub, or lounge 71 350 1.3% 0.4%
Other food service 37 128 0.7% 0.1%
Health care 157 4,155 2.8% 4.77%
Inpatient 10 2,374 0.2% 2.73%
Outpatient 147 1,781 2.6% 2.04%
Office (diagnostic) 60 510 1.1% 0.6%
Clinic or other outpatient 87 1,271 1.6% 1.5%
Lodging 158 5,826 2.8% 6.7%
Hotel 30 2,717 0.5% 3.1%
Motel or inn 61 602 1.1% 0.7%
Dormitory, fraternity, or sorority 25 805 0.4% 0.9%
Nursing home or assisted living 30 1,275 0.5% 1.5%
Other lodging 13 426 0.2% 0.5%
Mercantile 602 11,330 10.8% 13.0%
Retail (other than mall) 438 5,439 7.9% 6.2%
Retail store 336 4,504 6.0% 5.2%
Vehicle dealership 43 559 0.8% 0.6%
Other retail 59 376 1.1% 0.4%
Enclosed and strip malls 164 5,890 3.0% 6.8%
Strip shopping center 163 5,087 2.9% 5.8%
Enclosed mall 1 803 0.0% 0.9%
Office 1,012 15,952 18.2% 18.3%
Administrative or professional 558 8,937 10.0% 10.3%
Bank or other financial 91 920 1.6% 1.1%
Government 113 2,655 2.0% 3.0%
Medical (non-diagnostic) 50 302 0.9% 0.3%
Mixed-use 125 2,656 2.2% 3.0%
Other office 74 482 1.3% 0.6%
Public assembly 352 5,559 6.3% 6.4%
Library 24 761 0.4% 0.9%
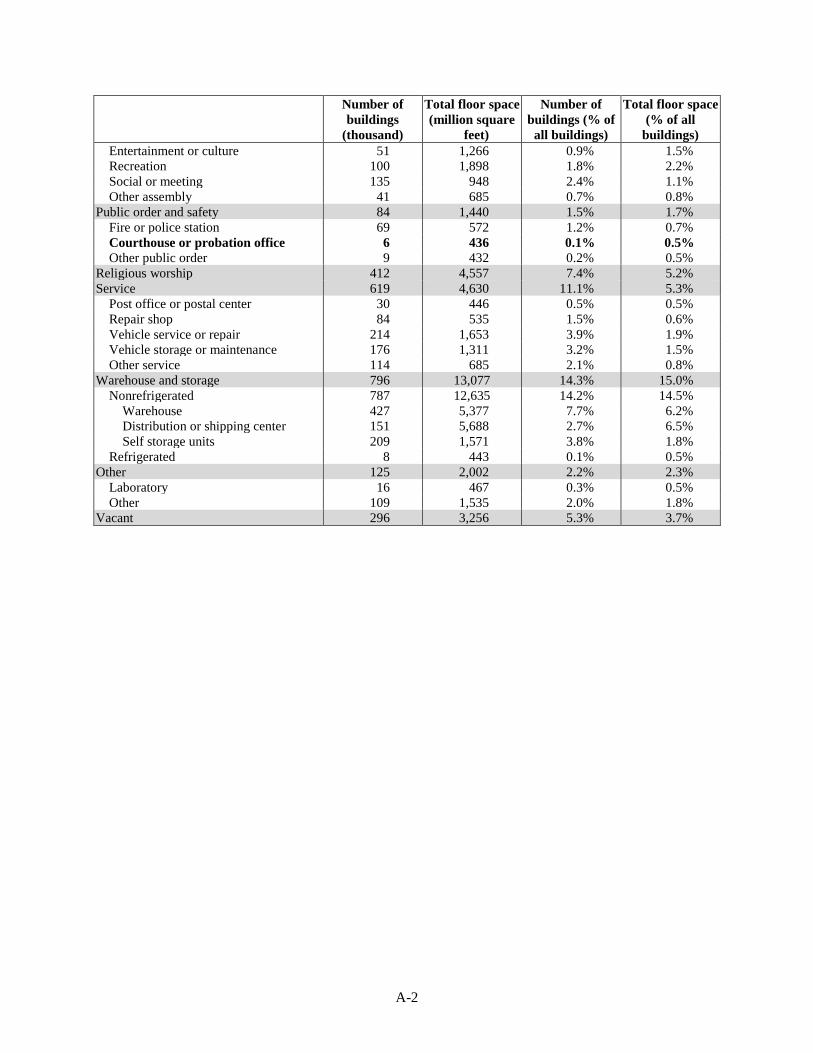
A-2
Number of
buildings
(thousand)
Total floor space
(million square
feet)
Number of
buildings (% of
all buildings)
Total floor space
(% of all
buildings)
Entertainment or culture 51 1,266 0.9% 1.5%
Recreation 100 1,898 1.8% 2.2%
Social or meeting 135 948 2.4% 1.1%
Other assembly 41 685 0.7% 0.8%
Public order and safety 84 1,440 1.5% 1.7%
Fire or police station 69 572 1.2% 0.7%
Courthouse or probation office 6 436 0.1% 0.5%
Other public order 9 432 0.2% 0.5%
Religious worship 412 4,557 7.4% 5.2%
Service 619 4,630 11.1% 5.3%
Post office or postal center 30 446 0.5% 0.5%
Repair shop 84 535 1.5% 0.6%
Vehicle service or repair 214 1,653 3.9% 1.9%
Vehicle storage or maintenance 176 1,311 3.2% 1.5%
Other service 114 685 2.1% 0.8%
Warehouse and storage 796 13,077 14.3% 15.0%
Nonrefrigerated 787 12,635 14.2% 14.5%
Warehouse 427 5,377 7.7% 6.2%
Distribution or shipping center 151 5,688 2.7% 6.5%
Self storage units 209 1,571 3.8% 1.8%
Refrigerated 8 443 0.1% 0.5%
Other 125 2,002 2.2% 2.3%
Laboratory 16 467 0.3% 0.5%
Other 109 1,535 2.0% 1.8%
Vacant 296 3,256 5.3% 3.7%
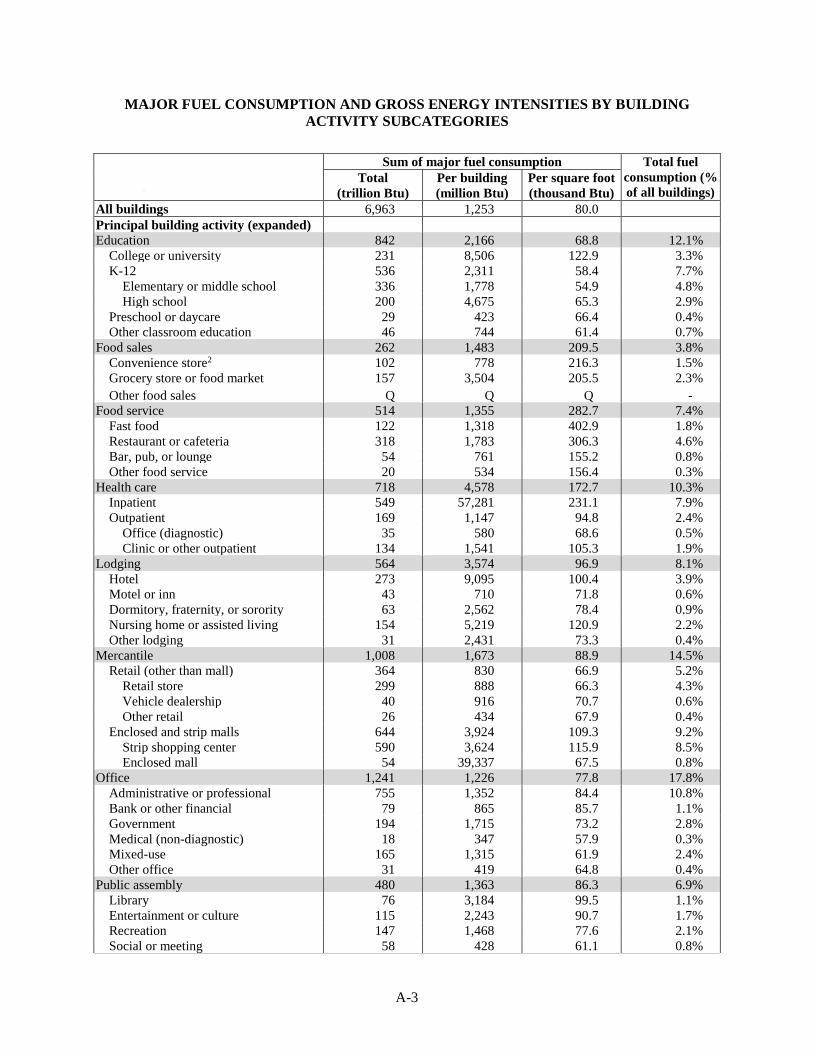
A-3
MAJOR FUEL CONSUMPTION AND GROSS ENERGY INTENSITIES BY BUILDING
ACTIVITY SUBCATEGORIES
Sum of major fuel consumption Total fuel
consumption (%
of all buildings) Total
(trillion Btu)
Per building
(million Btu)
Per square foot
(thousand Btu)
All buildings 6,963 1,253 80.0
Principal building activity (expanded)
Education 842 2,166 68.8 12.1%
College or university 231 8,506 122.9 3.3%
K-12 536 2,311 58.4 7.7%
Elementary or middle school 336 1,778 54.9 4.8%
High school 200 4,675 65.3 2.9%
Preschool or daycare 29 423 66.4 0.4%
Other classroom education 46 744 61.4 0.7%
Food sales 262 1,483 209.5 3.8%
Convenience store2 102 778 216.3 1.5%
Grocery store or food market 157 3,504 205.5 2.3%
Other food sales Q Q Q -
Food service 514 1,355 282.7 7.4%
Fast food 122 1,318 402.9 1.8%
Restaurant or cafeteria 318 1,783 306.3 4.6%
Bar, pub, or lounge 54 761 155.2 0.8%
Other food service 20 534 156.4 0.3%
Health care 718 4,578 172.7 10.3%
Inpatient 549 57,281 231.1 7.9%
Outpatient 169 1,147 94.8 2.4%
Office (diagnostic) 35 580 68.6 0.5%
Clinic or other outpatient 134 1,541 105.3 1.9%
Lodging 564 3,574 96.9 8.1%
Hotel 273 9,095 100.4 3.9%
Motel or inn 43 710 71.8 0.6%
Dormitory, fraternity, or sorority 63 2,562 78.4 0.9%
Nursing home or assisted living 154 5,219 120.9 2.2%
Other lodging 31 2,431 73.3 0.4%
Mercantile 1,008 1,673 88.9 14.5%
Retail (other than mall) 364 830 66.9 5.2%
Retail store 299 888 66.3 4.3%
Vehicle dealership 40 916 70.7 0.6%
Other retail 26 434 67.9 0.4%
Enclosed and strip malls 644 3,924 109.3 9.2%
Strip shopping center 590 3,624 115.9 8.5%
Enclosed mall 54 39,337 67.5 0.8%
Office 1,241 1,226 77.8 17.8%
Administrative or professional 755 1,352 84.4 10.8%
Bank or other financial 79 865 85.7 1.1%
Government 194 1,715 73.2 2.8%
Medical (non-diagnostic) 18 347 57.9 0.3%
Mixed-use 165 1,315 61.9 2.4%
Other office 31 419 64.8 0.4%
Public assembly 480 1,363 86.3 6.9%
Library 76 3,184 99.5 1.1%
Entertainment or culture 115 2,243 90.7 1.7%
Recreation 147 1,468 77.6 2.1%
Social or meeting 58 428 61.1 0.8%
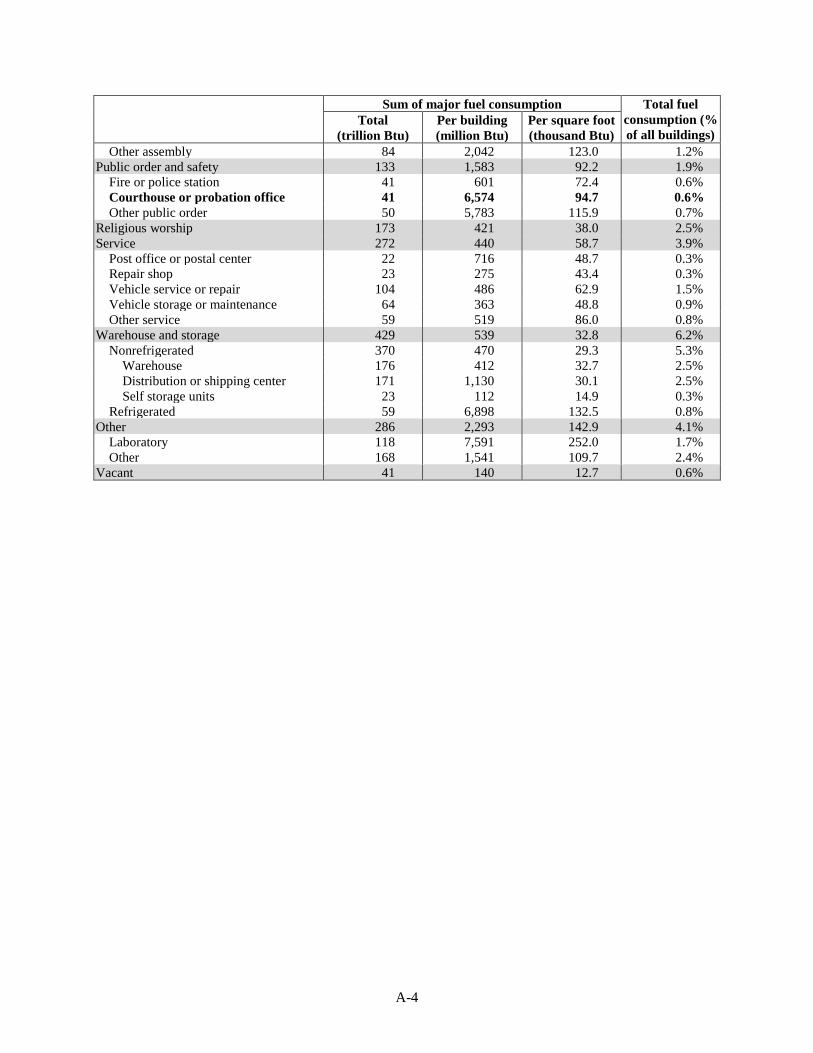
A-4
Sum of major fuel consumption Total fuel
consumption (%
of all buildings) Total
(trillion Btu)
Per building
(million Btu)
Per square foot
(thousand Btu)
Other assembly 84 2,042 123.0 1.2%
Public order and safety 133 1,583 92.2 1.9%
Fire or police station 41 601 72.4 0.6%
Courthouse or probation office 41 6,574 94.7 0.6%
Other public order 50 5,783 115.9 0.7%
Religious worship 173 421 38.0 2.5%
Service 272 440 58.7 3.9%
Post office or postal center 22 716 48.7 0.3%
Repair shop 23 275 43.4 0.3%
Vehicle service or repair 104 486 62.9 1.5%
Vehicle storage or maintenance 64 363 48.8 0.9%
Other service 59 519 86.0 0.8%
Warehouse and storage 429 539 32.8 6.2%
Nonrefrigerated 370 470 29.3 5.3%
Warehouse 176 412 32.7 2.5%
Distribution or shipping center 171 1,130 30.1 2.5%
Self storage units 23 112 14.9 0.3%
Refrigerated 59 6,898 132.5 0.8%
Other 286 2,293 142.9 4.1%
Laboratory 118 7,591 252.0 1.7%
Other 168 1,541 109.7 2.4%
Vacant 41 140 12.7 0.6%
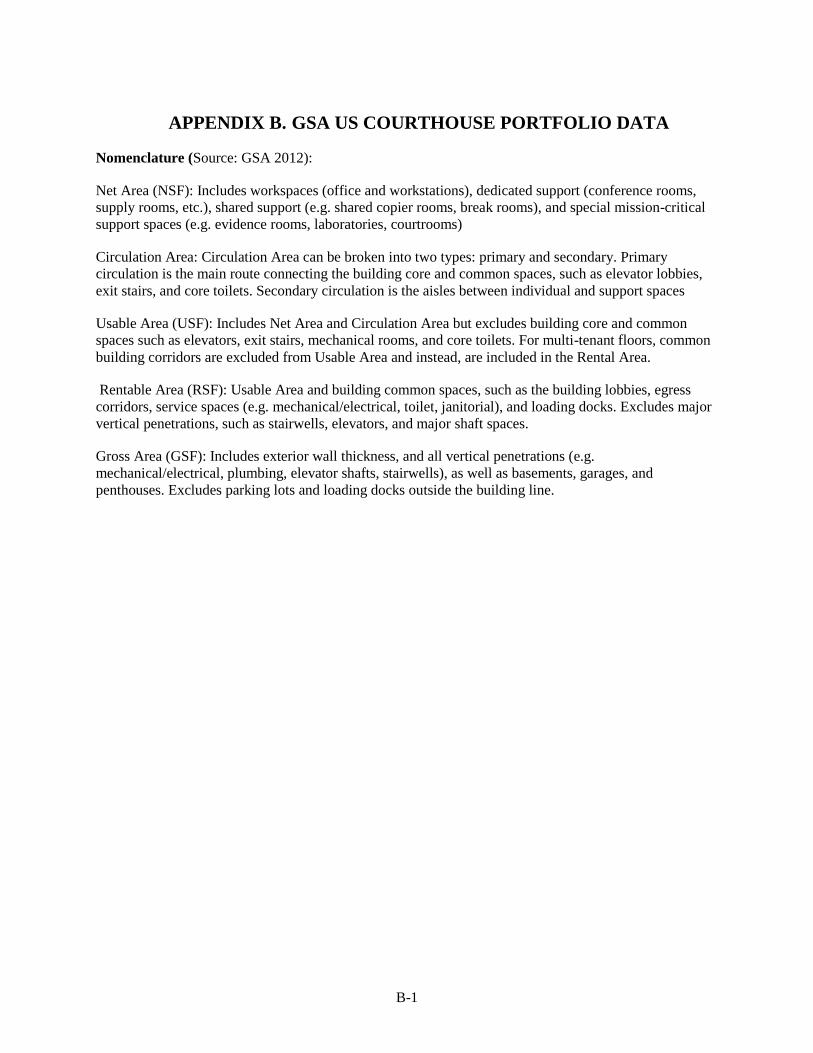
B-1
APPENDIX B. GSA US COURTHOUSE PORTFOLIO DATA
Nomenclature (Source: GSA 2012):
Net Area (NSF): Includes workspaces (office and workstations), dedicated support (conference rooms,
supply rooms, etc.), shared support (e.g. shared copier rooms, break rooms), and special mission-critical
support spaces (e.g. evidence rooms, laboratories, courtrooms)
Circulation Area: Circulation Area can be broken into two types: primary and secondary. Primary
circulation is the main route connecting the building core and common spaces, such as elevator lobbies,
exit stairs, and core toilets. Secondary circulation is the aisles between individual and support spaces
Usable Area (USF): Includes Net Area and Circulation Area but excludes building core and common
spaces such as elevators, exit stairs, mechanical rooms, and core toilets. For multi-tenant floors, common
building corridors are excluded from Usable Area and instead, are included in the Rental Area.
Rentable Area (RSF): Usable Area and building common spaces, such as the building lobbies, egress
corridors, service spaces (e.g. mechanical/electrical, toilet, janitorial), and loading docks. Excludes major
vertical penetrations, such as stairwells, elevators, and major shaft spaces.
Gross Area (GSF): Includes exterior wall thickness, and all vertical penetrations (e.g.
mechanical/electrical, plumbing, elevator shafts, stairwells), as well as basements, garages, and
penthouses. Excludes parking lots and loading docks outside the building line.
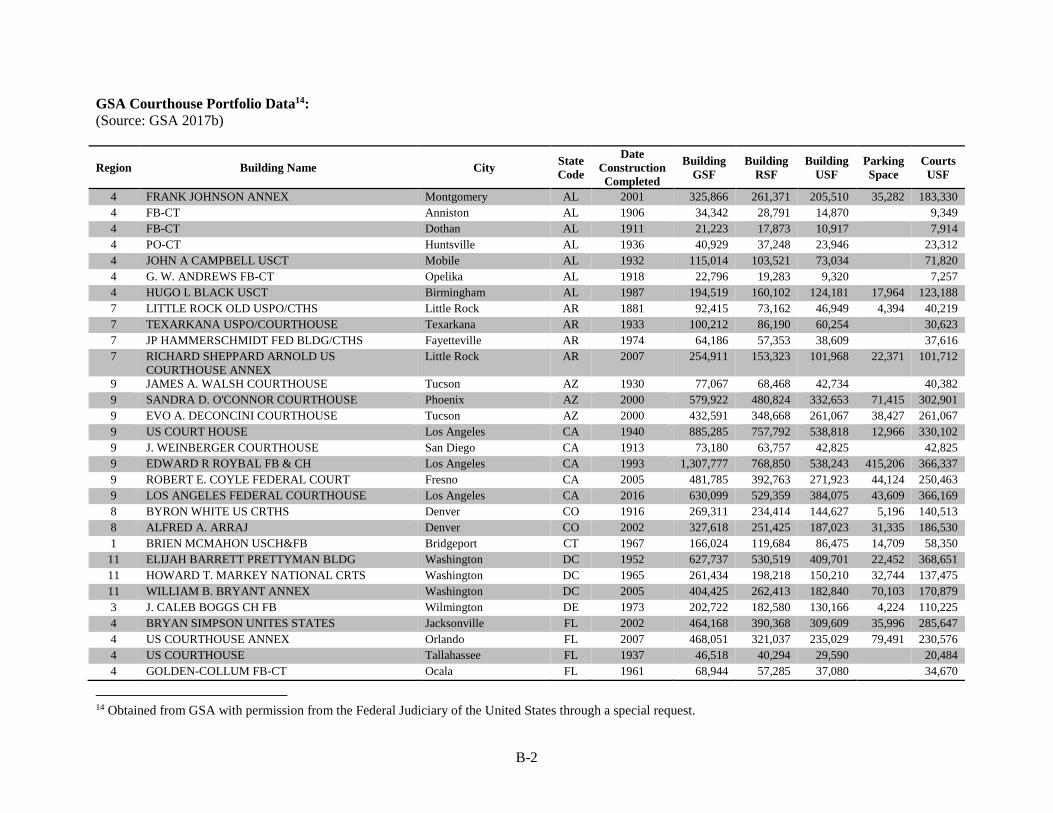
B-2
GSA Courthouse Portfolio Data14:
(Source: GSA 2017b)
Region Building Name City State
Code
Date
Construction
Completed
Building
GSF
Building
RSF
Building
USF
Parking
Space
Courts
USF
4 FRANK JOHNSON ANNEX Montgomery AL 2001 325,866 261,371 205,510 35,282 183,330
4 FB-CT Anniston AL 1906 34,342 28,791 14,870 9,349
4 FB-CT Dothan AL 1911 21,223 17,873 10,917 7,914
4 PO-CT Huntsville AL 1936 40,929 37,248 23,946 23,312
4 JOHN A CAMPBELL USCT Mobile AL 1932 115,014 103,521 73,034 71,820
4 G. W. ANDREWS FB-CT Opelika AL 1918 22,796 19,283 9,320 7,257
4 HUGO L BLACK USCT Birmingham AL 1987 194,519 160,102 124,181 17,964 123,188
7 LITTLE ROCK OLD USPO/CTHS Little Rock AR 1881 92,415 73,162 46,949 4,394 40,219
7 TEXARKANA USPO/COURTHOUSE Texarkana AR 1933 100,212 86,190 60,254 30,623
7 JP HAMMERSCHMIDT FED BLDG/CTHS Fayetteville AR 1974 64,186 57,353 38,609 37,616
7 RICHARD SHEPPARD ARNOLD US
COURTHOUSE ANNEX
Little Rock AR 2007 254,911 153,323 101,968 22,371 101,712
9 JAMES A. WALSH COURTHOUSE Tucson AZ 1930 77,067 68,468 42,734 40,382
9 SANDRA D. O'CONNOR COURTHOUSE Phoenix AZ 2000 579,922 480,824 332,653 71,415 302,901
9 EVO A. DECONCINI COURTHOUSE Tucson AZ 2000 432,591 348,668 261,067 38,427 261,067
9 US COURT HOUSE Los Angeles CA 1940 885,285 757,792 538,818 12,966 330,102
9 J. WEINBERGER COURTHOUSE San Diego CA 1913 73,180 63,757 42,825 42,825
9 EDWARD R ROYBAL FB & CH Los Angeles CA 1993 1,307,777 768,850 538,243 415,206 366,337
9 ROBERT E. COYLE FEDERAL COURT Fresno CA 2005 481,785 392,763 271,923 44,124 250,463
9 LOS ANGELES FEDERAL COURTHOUSE Los Angeles CA 2016 630,099 529,359 384,075 43,609 366,169
8 BYRON WHITE US CRTHS Denver CO 1916 269,311 234,414 144,627 5,196 140,513
8 ALFRED A. ARRAJ Denver CO 2002 327,618 251,425 187,023 31,335 186,530
1 BRIEN MCMAHON USCH&FB Bridgeport CT 1967 166,024 119,684 86,475 14,709 58,350
11 ELIJAH BARRETT PRETTYMAN BLDG Washington DC 1952 627,737 530,519 409,701 22,452 368,651
11 HOWARD T. MARKEY NATIONAL CRTS Washington DC 1965 261,434 198,218 150,210 32,744 137,475
11 WILLIAM B. BRYANT ANNEX Washington DC 2005 404,425 262,413 182,840 70,103 170,879
3 J. CALEB BOGGS CH FB Wilmington DE 1973 202,722 182,580 130,166 4,224 110,225
4 BRYAN SIMPSON UNITES STATES Jacksonville FL 2002 464,168 390,368 309,609 35,996 285,647
4 US COURTHOUSE ANNEX Orlando FL 2007 468,051 321,037 235,029 79,491 230,576
4 US COURTHOUSE Tallahassee FL 1937 46,518 40,294 29,590 20,484
4 GOLDEN-COLLUM FB-CT Ocala FL 1961 68,944 57,285 37,080 34,670
14 Obtained from GSA with permission from the Federal Judiciary of the United States through a special request.
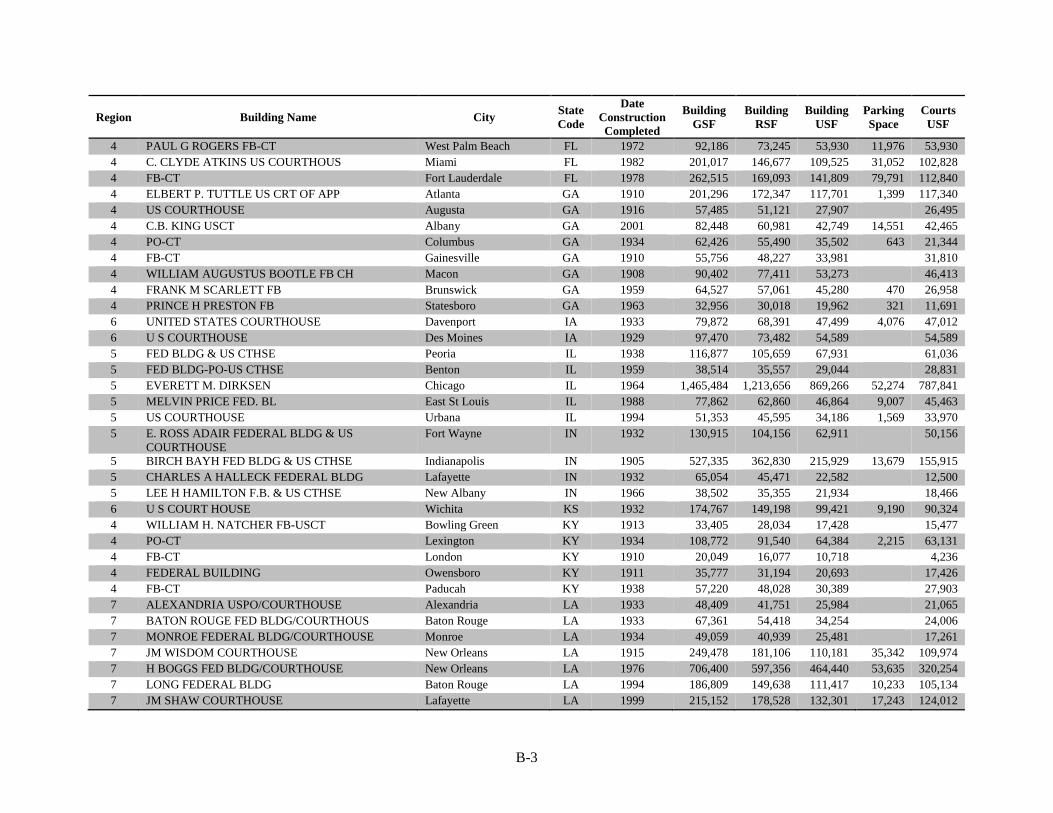
B-3
Region Building Name City State
Code
Date
Construction
Completed
Building
GSF
Building
RSF
Building
USF
Parking
Space
Courts
USF
4 PAUL G ROGERS FB-CT West Palm Beach FL 1972 92,186 73,245 53,930 11,976 53,930
4 C. CLYDE ATKINS US COURTHOUS Miami FL 1982 201,017 146,677 109,525 31,052 102,828
4 FB-CT Fort Lauderdale FL 1978 262,515 169,093 141,809 79,791 112,840
4 ELBERT P. TUTTLE US CRT OF APP Atlanta GA 1910 201,296 172,347 117,701 1,399 117,340
4 US COURTHOUSE Augusta GA 1916 57,485 51,121 27,907 26,495
4 C.B. KING USCT Albany GA 2001 82,448 60,981 42,749 14,551 42,465
4 PO-CT Columbus GA 1934 62,426 55,490 35,502 643 21,344
4 FB-CT Gainesville GA 1910 55,756 48,227 33,981 31,810
4 WILLIAM AUGUSTUS BOOTLE FB CH Macon GA 1908 90,402 77,411 53,273 46,413
4 FRANK M SCARLETT FB Brunswick GA 1959 64,527 57,061 45,280 470 26,958
4 PRINCE H PRESTON FB Statesboro GA 1963 32,956 30,018 19,962 321 11,691
6 UNITED STATES COURTHOUSE Davenport IA 1933 79,872 68,391 47,499 4,076 47,012
6 U S COURTHOUSE Des Moines IA 1929 97,470 73,482 54,589 54,589
5 FED BLDG & US CTHSE Peoria IL 1938 116,877 105,659 67,931 61,036
5 FED BLDG-PO-US CTHSE Benton IL 1959 38,514 35,557 29,044 28,831
5 EVERETT M. DIRKSEN Chicago IL 1964 1,465,484 1,213,656 869,266 52,274 787,841
5 MELVIN PRICE FED. BL East St Louis IL 1988 77,862 62,860 46,864 9,007 45,463
5 US COURTHOUSE Urbana IL 1994 51,353 45,595 34,186 1,569 33,970
5 E. ROSS ADAIR FEDERAL BLDG & US
COURTHOUSE
Fort Wayne IN 1932 130,915 104,156 62,911 50,156
5 BIRCH BAYH FED BLDG & US CTHSE Indianapolis IN 1905 527,335 362,830 215,929 13,679 155,915
5 CHARLES A HALLECK FEDERAL BLDG Lafayette IN 1932 65,054 45,471 22,582 12,500
5 LEE H HAMILTON F.B. & US CTHSE New Albany IN 1966 38,502 35,355 21,934 18,466
6 U S COURT HOUSE Wichita KS 1932 174,767 149,198 99,421 9,190 90,324
4 WILLIAM H. NATCHER FB-USCT Bowling Green KY 1913 33,405 28,034 17,428 15,477
4 PO-CT Lexington KY 1934 108,772 91,540 64,384 2,215 63,131
4 FB-CT London KY 1910 20,049 16,077 10,718 4,236
4 FEDERAL BUILDING Owensboro KY 1911 35,777 31,194 20,693 17,426
4 FB-CT Paducah KY 1938 57,220 48,028 30,389 27,903
7 ALEXANDRIA USPO/COURTHOUSE Alexandria LA 1933 48,409 41,751 25,984 21,065
7 BATON ROUGE FED BLDG/COURTHOUS Baton Rouge LA 1933 67,361 54,418 34,254 24,006
7 MONROE FEDERAL BLDG/COURTHOUSE Monroe LA 1934 49,059 40,939 25,481 17,261
7 JM WISDOM COURTHOUSE New Orleans LA 1915 249,478 181,106 110,181 35,342 109,974
7 H BOGGS FED BLDG/COURTHOUSE New Orleans LA 1976 706,400 597,356 464,440 53,635 320,254
7 LONG FEDERAL BLDG Baton Rouge LA 1994 186,809 149,638 111,417 10,233 105,134
7 JM SHAW COURTHOUSE Lafayette LA 1999 215,152 178,528 132,301 17,243 124,012
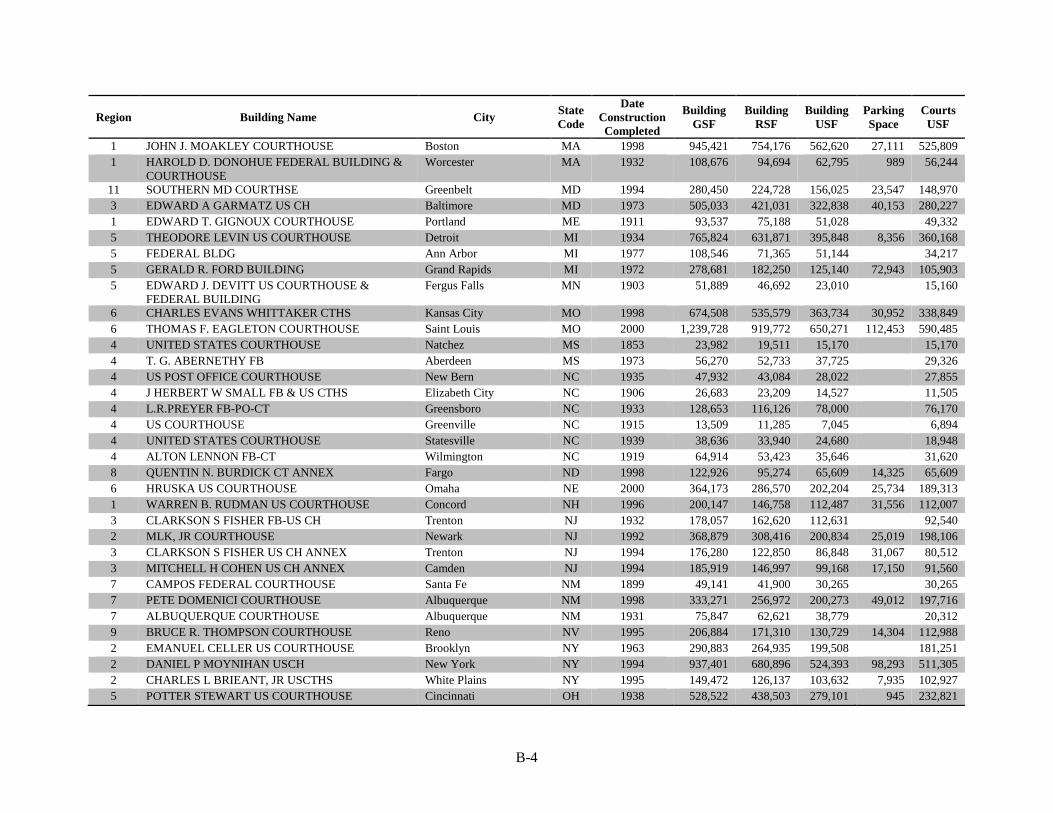
B-4
Region Building Name City State
Code
Date
Construction
Completed
Building
GSF
Building
RSF
Building
USF
Parking
Space
Courts
USF
1 JOHN J. MOAKLEY COURTHOUSE Boston MA 1998 945,421 754,176 562,620 27,111 525,809
1 HAROLD D. DONOHUE FEDERAL BUILDING &
COURTHOUSE
Worcester MA 1932 108,676 94,694 62,795 989 56,244
11 SOUTHERN MD COURTHSE Greenbelt MD 1994 280,450 224,728 156,025 23,547 148,970
3 EDWARD A GARMATZ US CH Baltimore MD 1973 505,033 421,031 322,838 40,153 280,227
1 EDWARD T. GIGNOUX COURTHOUSE Portland ME 1911 93,537 75,188 51,028 49,332
5 THEODORE LEVIN US COURTHOUSE Detroit MI 1934 765,824 631,871 395,848 8,356 360,168
5 FEDERAL BLDG Ann Arbor MI 1977 108,546 71,365 51,144 34,217
5 GERALD R. FORD BUILDING Grand Rapids MI 1972 278,681 182,250 125,140 72,943 105,903
5 EDWARD J. DEVITT US COURTHOUSE &
FEDERAL BUILDING
Fergus Falls MN 1903 51,889 46,692 23,010 15,160
6 CHARLES EVANS WHITTAKER CTHS Kansas City MO 1998 674,508 535,579 363,734 30,952 338,849
6 THOMAS F. EAGLETON COURTHOUSE Saint Louis MO 2000 1,239,728 919,772 650,271 112,453 590,485
4 UNITED STATES COURTHOUSE Natchez MS 1853 23,982 19,511 15,170 15,170
4 T. G. ABERNETHY FB Aberdeen MS 1973 56,270 52,733 37,725 29,326
4 US POST OFFICE COURTHOUSE New Bern NC 1935 47,932 43,084 28,022 27,855
4 J HERBERT W SMALL FB & US CTHS Elizabeth City NC 1906 26,683 23,209 14,527 11,505
4 L.R.PREYER FB-PO-CT Greensboro NC 1933 128,653 116,126 78,000 76,170
4 US COURTHOUSE Greenville NC 1915 13,509 11,285 7,045 6,894
4 UNITED STATES COURTHOUSE Statesville NC 1939 38,636 33,940 24,680 18,948
4 ALTON LENNON FB-CT Wilmington NC 1919 64,914 53,423 35,646 31,620
8 QUENTIN N. BURDICK CT ANNEX Fargo ND 1998 122,926 95,274 65,609 14,325 65,609
6 HRUSKA US COURTHOUSE Omaha NE 2000 364,173 286,570 202,204 25,734 189,313
1 WARREN B. RUDMAN US COURTHOUSE Concord NH 1996 200,147 146,758 112,487 31,556 112,007
3 CLARKSON S FISHER FB-US CH Trenton NJ 1932 178,057 162,620 112,631 92,540
2 MLK, JR COURTHOUSE Newark NJ 1992 368,879 308,416 200,834 25,019 198,106
3 CLARKSON S FISHER US CH ANNEX Trenton NJ 1994 176,280 122,850 86,848 31,067 80,512
3 MITCHELL H COHEN US CH ANNEX Camden NJ 1994 185,919 146,997 99,168 17,150 91,560
7 CAMPOS FEDERAL COURTHOUSE Santa Fe NM 1899 49,141 41,900 30,265 30,265
7 PETE DOMENICI COURTHOUSE Albuquerque NM 1998 333,271 256,972 200,273 49,012 197,716
7 ALBUQUERQUE COURTHOUSE Albuquerque NM 1931 75,847 62,621 38,779 20,312
9 BRUCE R. THOMPSON COURTHOUSE Reno NV 1995 206,884 171,310 130,729 14,304 112,988
2 EMANUEL CELLER US COURTHOUSE Brooklyn NY 1963 290,883 264,935 199,508 181,251
2 DANIEL P MOYNIHAN USCH New York NY 1994 937,401 680,896 524,393 98,293 511,305
2 CHARLES L BRIEANT, JR USCTHS White Plains NY 1995 149,472 126,137 103,632 7,935 102,927
5 POTTER STEWART US COURTHOUSE Cincinnati OH 1938 528,522 438,503 279,101 945 232,821
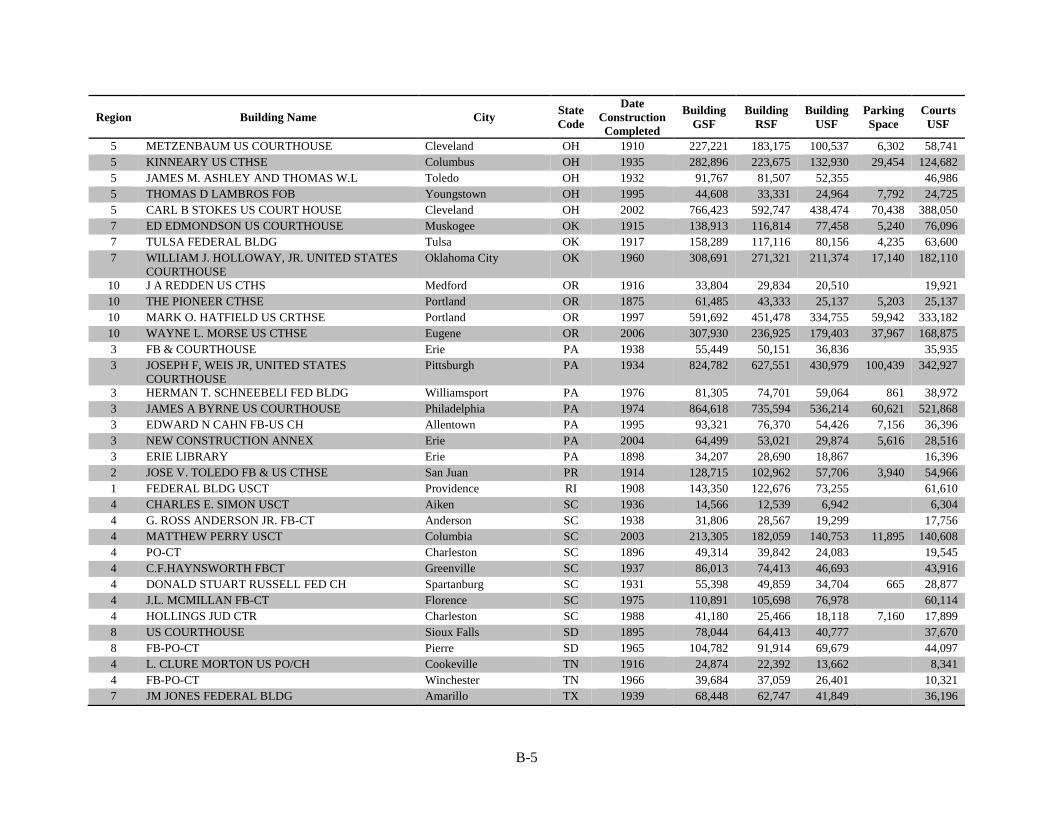
B-5
Region Building Name City State
Code
Date
Construction
Completed
Building
GSF
Building
RSF
Building
USF
Parking
Space
Courts
USF
5 METZENBAUM US COURTHOUSE Cleveland OH 1910 227,221 183,175 100,537 6,302 58,741
5 KINNEARY US CTHSE Columbus OH 1935 282,896 223,675 132,930 29,454 124,682
5 JAMES M. ASHLEY AND THOMAS W.L Toledo OH 1932 91,767 81,507 52,355 46,986
5 THOMAS D LAMBROS FOB Youngstown OH 1995 44,608 33,331 24,964 7,792 24,725
5 CARL B STOKES US COURT HOUSE Cleveland OH 2002 766,423 592,747 438,474 70,438 388,050
7 ED EDMONDSON US COURTHOUSE Muskogee OK 1915 138,913 116,814 77,458 5,240 76,096
7 TULSA FEDERAL BLDG Tulsa OK 1917 158,289 117,116 80,156 4,235 63,600
7 WILLIAM J. HOLLOWAY, JR. UNITED STATES
COURTHOUSE
Oklahoma City OK 1960 308,691 271,321 211,374 17,140 182,110
10 J A REDDEN US CTHS Medford OR 1916 33,804 29,834 20,510 19,921
10 THE PIONEER CTHSE Portland OR 1875 61,485 43,333 25,137 5,203 25,137
10 MARK O. HATFIELD US CRTHSE Portland OR 1997 591,692 451,478 334,755 59,942 333,182
10 WAYNE L. MORSE US CTHSE Eugene OR 2006 307,930 236,925 179,403 37,967 168,875
3 FB & COURTHOUSE Erie PA 1938 55,449 50,151 36,836 35,935
3 JOSEPH F, WEIS JR, UNITED STATES
COURTHOUSE
Pittsburgh PA 1934 824,782 627,551 430,979 100,439 342,927
3 HERMAN T. SCHNEEBELI FED BLDG Williamsport PA 1976 81,305 74,701 59,064 861 38,972
3 JAMES A BYRNE US COURTHOUSE Philadelphia PA 1974 864,618 735,594 536,214 60,621 521,868
3 EDWARD N CAHN FB-US CH Allentown PA 1995 93,321 76,370 54,426 7,156 36,396
3 NEW CONSTRUCTION ANNEX Erie PA 2004 64,499 53,021 29,874 5,616 28,516
3 ERIE LIBRARY Erie PA 1898 34,207 28,690 18,867 16,396
2 JOSE V. TOLEDO FB & US CTHSE San Juan PR 1914 128,715 102,962 57,706 3,940 54,966
1 FEDERAL BLDG USCT Providence RI 1908 143,350 122,676 73,255 61,610
4 CHARLES E. SIMON USCT Aiken SC 1936 14,566 12,539 6,942 6,304
4 G. ROSS ANDERSON JR. FB-CT Anderson SC 1938 31,806 28,567 19,299 17,756
4 MATTHEW PERRY USCT Columbia SC 2003 213,305 182,059 140,753 11,895 140,608
4 PO-CT Charleston SC 1896 49,314 39,842 24,083 19,545
4 C.F.HAYNSWORTH FBCT Greenville SC 1937 86,013 74,413 46,693 43,916
4 DONALD STUART RUSSELL FED CH Spartanburg SC 1931 55,398 49,859 34,704 665 28,877
4 J.L. MCMILLAN FB-CT Florence SC 1975 110,891 105,698 76,978 60,114
4 HOLLINGS JUD CTR Charleston SC 1988 41,180 25,466 18,118 7,160 17,899
8 US COURTHOUSE Sioux Falls SD 1895 78,044 64,413 40,777 37,670
8 FB-PO-CT Pierre SD 1965 104,782 91,914 69,679 44,097
4 L. CLURE MORTON US PO/CH Cookeville TN 1916 24,874 22,392 13,662 8,341
4 FB-PO-CT Winchester TN 1966 39,684 37,059 26,401 10,321
7 JM JONES FEDERAL BLDG Amarillo TX 1939 68,448 62,747 41,849 36,196
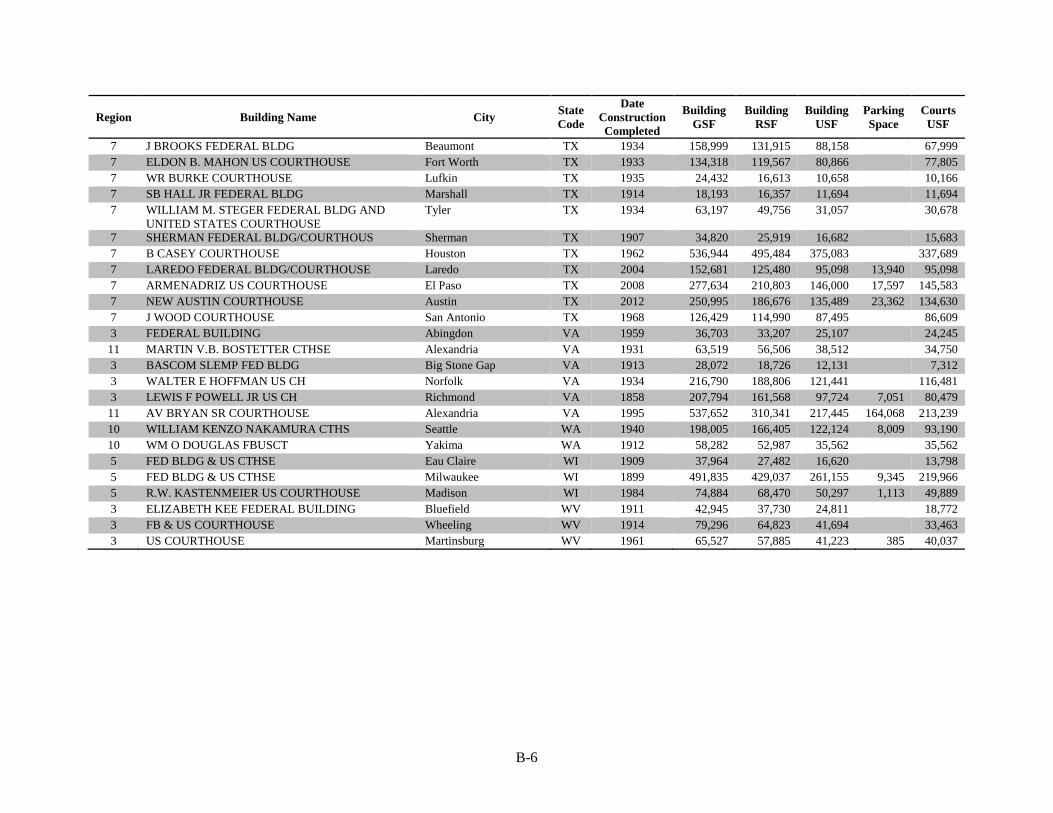
B-6
Region Building Name City State
Code
Date
Construction
Completed
Building
GSF
Building
RSF
Building
USF
Parking
Space
Courts
USF
7 J BROOKS FEDERAL BLDG Beaumont TX 1934 158,999 131,915 88,158 67,999
7 ELDON B. MAHON US COURTHOUSE Fort Worth TX 1933 134,318 119,567 80,866 77,805
7 WR BURKE COURTHOUSE Lufkin TX 1935 24,432 16,613 10,658 10,166
7 SB HALL JR FEDERAL BLDG Marshall TX 1914 18,193 16,357 11,694 11,694
7 WILLIAM M. STEGER FEDERAL BLDG AND
UNITED STATES COURTHOUSE
Tyler TX 1934 63,197 49,756 31,057 30,678
7 SHERMAN FEDERAL BLDG/COURTHOUS Sherman TX 1907 34,820 25,919 16,682 15,683
7 B CASEY COURTHOUSE Houston TX 1962 536,944 495,484 375,083 337,689
7 LAREDO FEDERAL BLDG/COURTHOUSE Laredo TX 2004 152,681 125,480 95,098 13,940 95,098
7 ARMENADRIZ US COURTHOUSE El Paso TX 2008 277,634 210,803 146,000 17,597 145,583
7 NEW AUSTIN COURTHOUSE Austin TX 2012 250,995 186,676 135,489 23,362 134,630
7 J WOOD COURTHOUSE San Antonio TX 1968 126,429 114,990 87,495 86,609
3 FEDERAL BUILDING Abingdon VA 1959 36,703 33,207 25,107 24,245
11 MARTIN V.B. BOSTETTER CTHSE Alexandria VA 1931 63,519 56,506 38,512 34,750
3 BASCOM SLEMP FED BLDG Big Stone Gap VA 1913 28,072 18,726 12,131 7,312
3 WALTER E HOFFMAN US CH Norfolk VA 1934 216,790 188,806 121,441 116,481
3 LEWIS F POWELL JR US CH Richmond VA 1858 207,794 161,568 97,724 7,051 80,479
11 AV BRYAN SR COURTHOUSE Alexandria VA 1995 537,652 310,341 217,445 164,068 213,239
10 WILLIAM KENZO NAKAMURA CTHS Seattle WA 1940 198,005 166,405 122,124 8,009 93,190
10 WM O DOUGLAS FBUSCT Yakima WA 1912 58,282 52,987 35,562 35,562
5 FED BLDG & US CTHSE Eau Claire WI 1909 37,964 27,482 16,620 13,798
5 FED BLDG & US CTHSE Milwaukee WI 1899 491,835 429,037 261,155 9,345 219,966
5 R.W. KASTENMEIER US COURTHOUSE Madison WI 1984 74,884 68,470 50,297 1,113 49,889
3 ELIZABETH KEE FEDERAL BUILDING Bluefield WV 1911 42,945 37,730 24,811 18,772
3 FB & US COURTHOUSE Wheeling WV 1914 79,296 64,823 41,694 33,463
3 US COURTHOUSE Martinsburg WV 1961 65,527 57,885 41,223 385 40,037