Embed Size (px)
Citation preview

review
nature genetics supplement • volume 33 • march 2003 311
Proteomics: the first decade and beyondScott D. Patterson1,3 & Ruedi H. Aebersold2
doi:10.1038/ng1106
Proteomics is the systematic study of the many and diverse properties of proteins in a parallel manner with the
aim of providing detailed descriptions of the structure, function and control of biological systems in health and
disease. Advances in methods and technologies have catalyzed an expansion of the scope of biological studies
from the reductionist biochemical analysis of single proteins to proteome-wide measurements. Proteomics and
other complementary analysis methods are essential components of the emerging ‘systems biology’ approach
that seeks to comprehensively describe biological systems through integration of diverse types of data and, in
the future, to ultimately allow computational simulations of complex biological systems.
1Celera Genomics Corporation, 45 West Gude Drive, Rockville, Maryland 20850, USA. 2Institute for Systems Biology, 1441 North 34th Street, Seattle,Washington 98103, USA. 3Present address: Farmal Biomedicines, LLC, 129 North Hill Avenue, Suite #107, Pasadena, California 91106, USA.Correspondence should be addressed to S.D.P. (e-mail: [email protected])
Proteomics, like other ‘discovery science’ technologies (Box 1)1,such as genomic sequencing, microarray analysis and metaboliteprofiling, is the direct consequence of both the results obtainedfrom ambitious projects aimed at mapping and sequencing thecomplete genome of many species and the changes to our modelsthat are catalyzed by such projects. The essence of this emerging‘systems biology’ approach (Box 1) is that, for any given species,the space of possible biomolecules and their organization intopathways and processes is large but finite. In theory, therefore,the biological systems operating in a species can be describedcomprehensively if a sufficient density of observations on all ofthe elements that constitute the system can be obtained. Pro-teomics is a particularly rich source of biological informationbecause proteins are involved in almost all biological activitiesand they also have diverse properties, which collectively con-tribute greatly to our understanding of biological systems. Theseproperties are summarized in Fig. 1.
Genome sequencing, although technically complex, is concep-tually simple and has a defined end point: the conclusive deter-mination of the complete genome sequence of the species inquestion. Discovery science projects aimed at assaying the func-tion and control of biological systems are based on less well-defined technologies and are devoid of clear end points. Aninitial goal of proteomics was the rapid identification of all of theproteins expressed by a cell or tissue a goal that has yet to beachieved for any species. Current goals of proteomic research aremore varied and directed toward the systematic determination ofdiverse properties of proteins. These include sequence, quantity,state of modification, interactions with other proteins, activity,subcellular distribution and structure (Fig. 1).
Many different technologies have been and are still beingdeveloped to collect the information contained in the propertiesof proteins. Figure 2 summarizes the current state of these tech-nologies and how they relate to other discovery science tools.
Three characteristics of these proteomic technologies are imme-diately apparent: first, there is no single technology platform thatcan satisfy all of the desired proteomic measurements; second,the closer the measurement to protein function, the less maturethe technology; and third, there is no mature, ‘true’ proteomictechnology as yet.
In this review, we do not discuss the three-dimensional structuralanalysis of proteins (structural genomics), which is a large field inits own right2. Instead, we discuss three phases of the emergenceand maturation of proteomic concepts and technology. The firstspans the emergence from protein chemistry to proteomics as acoordinated platform for discovery science. The second is the cur-rent diversification of proteomic technologies and platforms, whichaim to capture the many properties of proteins. The third is a win-dow into the future, in which the variety of data obtained by pro-teomics and other discovery science technologies will be integratedand collectively interpreted to achieve a comprehensive under-standing of the workings of biological systems. We focus predomi-nantly on developments in proteomics in the past decade.
From protein chemistry to proteomicsProtein chemistry was a key element of the reductionist researchapproaches that were a mainstay of biology in the 1980s. Alsocalled ‘forward’, as in ‘forward genetics’, these approachesattempted to move from an observed phenotype or function tothe relevant genes and their products that caused that phenotype.Together with rapidly advancing methods in molecular biologysuch as gene cloning, sequencing and expression analysis, proteinchemistry provided the link between the observed activity orfunction of a biochemically isolated protein and the gene thatencoded it. A key objective was therefore the development ofever-more sensitive and reliable methods for protein sequencingto make ever-smaller amounts of purified protein accessible toidentification. The long-term goals of this type of research were
©20
03 N
atu
re P
ub
lish
ing
Gro
up
h
ttp
://w
ww
.nat
ure
.co
m/n
atu
reg
enet
ics
review
312 nature genetics supplement • volume 33 • march 2003
to reassemble in vitro the system under study from its isolatedcomponents and to test whether this reconstituted system wouldrecapitulate functions observed in vivo3.
The advent of large-scale sequencing projects and their results4
catalyzed the development of ‘reverse’ approaches, whichattempted to move from the gene sequence to function and phe-notype. Such approaches included the observation of clusters ofmRNA species showing coordinated expression patterns in dif-ferent cellular states, either by expression arrays or by serialanalysis of gene expression (SAGE)5,6. The idea of defining func-tionally relevant patterns of gene expression by comparative pat-tern analysis was also applied, and in fact pioneered, in theprotein science field through attempts to develop globalapproaches to the quantitative analysis of protein expression pat-terns generated by high-resolution two-dimensional gel elec-trophoresis or ‘2DE’ (Box 1)7,8.
Below, we describe the evolution of protein chemistry meth-ods and their adaptation from forward to reverse researchstrategies.
From isolated proteins to gene sequenceTechnological developments for analytical protein chemistry inthe 1980s and early 1990s were primarily directed at improvingthe sensitivity of techniques for identifying proteins separated bygels. Protein sequencing often provided the crucial link betweenthe activity of a purified protein and its amino acid sequence orthe sequence of the corresponding gene. Edman sequencing ofthe amino terminus of intact proteins or enzymatically digestedfragments was the most common approach to identify gel-sepa-rated proteins9,10. In the likely case that the sequence did notexist in the rather small sequence databases that existed then,degenerate oligonucleotide primers could be synthesized basedon segments of the determined sequences and the correspondinggene could be cloned using methods based on PCR11.
Although protein sequencing by Edman degradation wasmature, reliable and automated, it also had relatively poor sensitiv-ity and was slow. With the rapid increase in the size of sequencedatabases, which was fueled by systematic sequencing programs,the chance that a particular protein and/or gene sequence was
Box 1 • Glossary of experimental terms used in proteomics
2DE two-dimensional gel electrophoresis is the separation of proteins using two orthogonal parameters, isoelectricpoint (charge) and relative molecular mass, which are both usually determined on the basis of protein mobilityin a polyacrylamide gel matrix.
discovery science investigation of a biological system or process by enumerating the elements of a system irrespective of anyhypotheses on how the system might function.
DNA microarrays a high-throughput differential screen of mRNA expression using complementary cDNA or oligonucleotidelibraries that are printed in extremely high density on microchips; these microchips are probed with a mixtureof fluorescently tagged cDNAs that are produced from two different cell populations and analyzed with a laserconfocal scanner.
ESI the electrospray ionization process is achieved by spraying a solution (such as the effluent of a HPLC column)through a charged needle at atmospheric pressure towards the inlet of the mass spectrometer; the voltageapplied to the needle tip and a pressure differential result in the formation of ions for mass analysis and theirtransfer into the mass spectrometer.
ICAT isotope-coded affinity tag reagent comprising a chemical modifying group linked to an affinity group througha mass-encoded linker.
ion source mass spectrometer component designed to use the principles of an ionization method for generating ions(charged analytes) for mass analysis.
ionization process of adding charge onto an uncharged (neutral) analyte, in other words, the formation of an ion; eitherionization is conducted in a vacuum or ions formed at atmospheric pressure are transferred into the vacuumsystem of the mass spectrometer.
MALDI matrix-assisted laser desorption ionization is a process by which ion formation is promoted by short laser pulses;the sample is deposited on a sample plate into the source (which is held under vacuum) and then embedded in amatrix that promotes ionization; a laser fired at the sample that is co-crystallized with the matrix results in thedesorption of the analyte from the sample plate and its ionization.
mass analyzer mass spectrometer component that can measure the mass-to-charge ratio of charged molecules (ions); ion-trap,quadrupole and time of flight (TOF) analyzers are used most often.
mass spectrometry accurate mass measurement of charged analytes (ions); in the context of proteomics, analytes are usuallypeptides or less frequently protein ions; a mass spectrometer measures the mass-to-charge ratio of chargedspecies under vacuum and comprises, broadly, an ionization source and a mass analyzer.
MS spectra single-stage mass spectrometry spectra provide mass information on all ionizable components in a sample;these data are used, for example, for peptide mass fingerprinting.
MS/MS spectra MS/MS spectra are generated in instruments equipped with a mass filter that can select a peptide ion from amixture of peptide ions, a collision cell in which peptide ions are fragmented into a series of product ions(through collision of the selected precursor ion with a noble gas in a process referred to as CID), and a secondmass analyzer that records the fragment ion mass spectrum; the fragment ion spectra are referred to as eitherMS/MS spectra or CID spectra.
protein identification method to determine the sequence identity of a protein; two common mass spectrometry–based approachesused are peptide mass mapping and searching uninterpreted MS/MS spectra; in both methods, observed data are matched to theoretically derived peptide and/or fragment ion masses calculated from sequence databases.
systems biology study of a biological system by the systematic and quantitative analysis of all of the components thatconstitute the system.
yeast two-hybrid genetics-based method for identifying protein-protein interactions in vivo; a protein fused to the DNA-bindingdomain (the ‘bait’) and a (different) protein fused to the activation domain of a transcriptional activator (the‘prey’) are expressed in yeast cells; if an interaction between the bait and the prey occurs, transcription of areporter gene is induced and detected typically by a color reaction that indicates transactivation of thereporter gene.
©20
03 N
atu
re P
ub
lish
ing
Gro
up
h
ttp
://w
ww
.nat
ure
.co
m/n
atu
reg
enet
ics

review
nature genetics supplement • volume 33 • march 2003 313
already represented in asequence database, either intotal or in part, also increased.This greatly facilitated genecloning and sometimes thecomplete sequence of a gene ofinterest could be found by data-base searching, without the needfor further experimentation.Thus, the idea that protein sequences did not always have to bedetermined de novo began to take shape.
DNA sequencing rules the dayIn the early 1990s, mass DNA sequencing of cDNAs derived frompools of mRNA generated large numbers of expressed sequencetags (ESTs)12. These stretches of sequence provided an unprece-dented window into the transcripts present in particular types ofcell and tissue, and therefore a powerful tool for gene discovery4.Gene sequences (ESTs and others) also provided a resource thatcould greatly accelerate protein identification by correlatingexperimentally derived sequence segments with sequences indatabases. At the time, it was expected that eventually every geneof a species would be represented in sequence databases and itwould be possible to identify proteins and/or genes simply bylooking up the gene of interest using experimentally deriveddata.
Large-scale EST sequencing represented the first real approachto the systematic sequencing of expressed genes13. Although ESTsdid provide much useful data, they did not produce the depth ofanalysis that had been anticipated14. In part, this was due to thedynamic range of transcript numbers expressed in cells, whichcomplicated the detection of low-abundance species. This prob-lem could be alleviated partially through the use of normalizedlibraries15.
The ultimate normalized sequence libraries that is, the com-plete genomic sequences were established only a few years laterfor yeast16 and a decade later for human17,18. With such completelibraries on hand, the rapid identification of proteins was limitedonly by our capacity to extract sequence information from pro-teins and peptides, and to correlate this information with thesequence databases. ‘Mass spectrometry’ (Box 1) and databasesearch algorithms rapidly filled this gap.
Protein and peptide mass spectrometryFor years, mass spectrometry has been the analytical chemist’sworkhorse for analyzing small molecules. The high precision of
mass spectrometric measurements can distinguish closely relatedspecies, and tandem mass spectrometry or ‘MS/MS’ can providestructural information on molecular ions that can be isolatedand fragmented within the instrument (Box 1).
To measure the mass or, more specifically, the mass-to-chargeratio (m/z) of a molecule in a mass spectrometer, the analyte mustfirst be ionized and transferred into the high vacuum system of theinstrument. Peptides and proteins, like other large molecules,proved difficult to ionize under conditions that did not destroy themolecule. In the late 1980s, two methods were developed thatallowed the ‘ionization’ of peptides and proteins at high sensitivityand without excessive fragmentation. These breakthroughs wereelectrospray ionization (‘ESI’)19 and matrix-assisted laser desorp-tion ionization (‘MALDI’)20, which had closely followed the devel-opment of laser desorption21,22 (Box 1). The success of theseionization methods in analytical protein chemistry led to the devel-opment of commercial mass spectrometers equipped with robustESI or MALDI ‘ion source’ instruments, which rapidly penetratedthe protein chemistry community.
MALDI ion sources were most commonly coupled with time-of-flight (TOF) ‘mass analyzers’, whereas ESI was most often cou-pled with ion-trap or triple-quadrupole MS/MS spectrometers(Box 1). Although MALDI-TOF mass spectrometers can deter-mine the mass of a protein or peptide with a high degree of accu-racy, the intrinsic mass of a eukaryotic protein is not a uniquelyidentifying feature. It was quickly recognized, however, that themasses of the various peptides generated by fragmentation of anisolated protein with an enzyme of known cleavage specificitycould uniquely identify a protein.
In 1993, five independent reports were published thatdescribed the implementation of this insight in database searchalgorithms23–27. These algorithms, together with MALDI-TOFmass spectrometry peptide analysis, constituted a ‘protein iden-tification’ method that is now known as peptide mass mapping(or peptide mass fingerprinting). In this type of analysis, the col-lected ‘MS spectra’ (Box 1) are used to generate a list of prote-olytic (peptide) fragment masses, which are then matched to the
post-trmodifie
:Cl-K+:C
onx
ion/small molecule
protein X
protein Y
protein–ligandinteractions
oteinproomplexescomachines)(m
protein families(activity or structural)
esSecreted
membraneassociated
transmembrane
nuclear porecomplex
esribosom
lip
lip
DNA
Fig. 1 Representation of a eukaryoticcell. A section through a eukaryoticcell is shown, highlighting the diverseproperties of proteins. The systematicinvestigation of these properties con-stitutes the field of proteomics. Thesubcellular distribution, quantity,modification and interaction state,catalytic activity and structure areparticularly informative for describ-ing biological systems. Representativeexamples of protein properties areshown, including the subcellular dis-tribution of proteins to specific com-partments and organelles; theinteraction of proteins with DNA,other proteins or small molecules toform functional complexes (or‘machines’) with diverse functions;and protein modifications such as car-bohydrate (CHO), phosphate (PO4) orlipid (lip).
Katie
Ris
©20
03 N
atu
re P
ub
lish
ing
Gro
up
h
ttp
://w
ww
.nat
ure
.co
m/n
atu
reg
enet
ics

review
314 nature genetics supplement • volume 33 • march 2003
masses calculated from the same proteo-lytic digestion of eachentry in a sequence database, resulting in identification of thetarget protein. The success of this type of analysis is dependenton the specificity of the enzyme used (most frequently trypsin),the number of peptides identified from each protein species, andthe mass accuracy of the mass spectrometer28. Owing to itsincreasing sensitivity and ease of use, MALDI-TOF mass spec-trometry has become the method of choice for protein identifica-tion by peptide mass mapping and is commonly used foridentifying proteins separated by 2DE.
As discussed above, ESI ion sources were originally coupledmostly with triple-quadrupole or ion-trap instruments. Morerecently, hybrid-quadrupole TOF MS/MS spectrometers havebecome available and are also used frequently with ESI. In additionto measuring peptide mass, all of these instruments can isolate spe-cific ions from a mixture on the basis of their m/z ratio and frag-ment these ions in the gas phase within the instrument, allowingthe recording of MS/MS spectra. Because peptide ions fragment ina sequence-dependent manner, the MS/MS spectrum of a peptide,in principle, represents its amino acid sequence.
Algorithms that match MS/MS spectra to sequence data-bases29,30 have greatly facilitated mass spectrometric proteinidentification by this approach31. Because a peptide sequence,and thus the MS/MS spectrum of a peptide, can uniquely iden-tify a protein, the specificity of MS/MS-based protein identifica-tions is often much higher than that of peptide mass mapping.MS/MS spectra are also ideally suited to search translated ESTand other sequence databases containing incomplete sequences.ESI-MS/MS is popular because it can be combined easily withstandard peptide separation tools, such as chromatography, andbecause it is directly compatible with the solvents that are used tosolubilize peptides.
The method of nanospray-ESI, in which unseparated peptidemixtures were sprayed into the mass spectrometer at very lowflow rates and detected at sensitivities not previously achieved byESI-MS, was developed subsequently32,33. The very slow sampleconsumption afforded by the low flow rate provided the oppor-tunity to generate fragment ion spectra of several of the observedprecursor ions. This was achieved by the operator, who manuallyselected precursor ions. Subsequent developments in instrumentcontrol software facilitated computer-controlled ion selection,
such that MS/MS spectra could be generated from many peptideions in a given sample without the need for operator interven-tion, effectively automating the process. This was developedmostly for analyses in which mixtures of peptides were suppliedto the mass spectrometer from an online, capillary, high-pressureliquid chromatography (HPLC) system an approach referredto as LC-MS/MS.
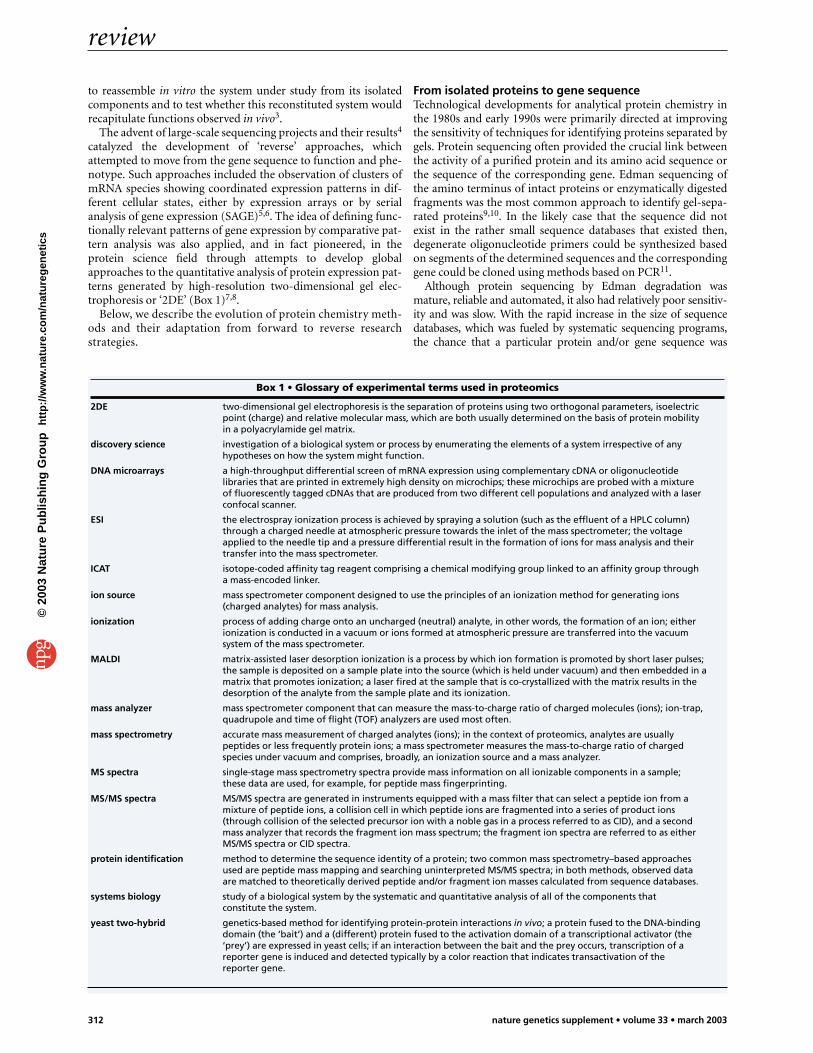
As summarized in Fig. 3, peptide and protein separation tech-nologies, advanced mass spectrometry and MS/MS instrumenta-tion and algorithms for searching mass spectrometric data againstsequence databases have been combined in different ways to createa set of technologies for protein and proteome analyses (Fig. 4).
The ‘proteome’ is bornLong before global differential analysis of mRNA expression waspossible, protein science relied on 2DE for generating repro-ducible protein arrays, displaying large numbers of separated fea-tures and indicating their quantities34–36. On the strength of such2DE protein profiles, in the 1970s and 1980s ideas were proposedto build protein databases (such as the human protein index37)and to apply reverse strategies based on subtractive patternanalysis38–40, similar to current popular strategies for analyzingdata obtained from gene expression microarrays. In fact, at thattime many of the principles now commonly used for the global,quantitative analysis of gene expression patterns, such as the useof clustering algorithms and multivariate statistics, were devel-oped in the context of 2DE7,8. These ideas were not substantiallyimplemented then, however, mainly because 2DE by itself is anessentially descriptive technique that does not indicate the iden-tity of the separated proteins and because the technique had beenplagued by reproducibility and other technical problems.
With the rapid advances in protein analytical technologies,fueled by the addition of mass spectrometry, sequence databasesand database search tools, in the early 1990s it became possiblefor protein chemists to identify and to examine the expression ofmany, if not all, of the proteins resolvable by 2DE, and the possi-bility for large-scale protein studies seemed attainable41. It was inthis context that in 1994, at the first 2DE meeting in Siena, Italy,the term ‘proteome’ was coined42. The proteome was defined asthe protein complement of the genome, and the process of study-ing the proteome became known as ‘proteomics’.
technology
emerging
prototype
mature
genomicDNA
mRNA proteinproducts
functionalprotein
biologicalsystem
activity profiling
protein linkage maps (catalog)
sequencing
structural determination
protein linkage maps (dynamic)
quantitative protein profiling
post-translational modificationanalysis: inferred activity
expression profilingsubcellular localization
data integration
system simulation
Fig. 2 The current status of proteomic technologies. The different data typically collected in proteomic research and the available technologies are listed. The rel-ative maturity of the proteomic technologies and other key discovery science tools is apparent from the position of the respective technology on the graph.
Katie
Ris
©20
03 N
atu
re P
ub
lish
ing
Gro
up
h
ttp
://w
ww
.nat
ure
.co
m/n
atu
reg
enet
ics
review
nature genetics supplement • volume 33 • march 2003 315
In comparison to its nucleic acid–based counterpart, genomics,the experimental complexity of proteomics is far greater. The tech-nology is also not as mature and, owing to the lack of amplificationschemes akin to PCR, only proteins isolated from a natural sourcecan be analyzed. Proteomic analyses are therefore generally limitedby substrate. The complexities of the proteome arise because mostproteins seem to be processed and modified in complex ways andcan be the products of differential splicing; in addition, proteinabundance spans a range estimated at five to six orders of magni-tude for yeast cells43 and more than ten orders of magnitude forhuman blood serum for example, from interleukin-6 at ∼ 2 pg/ml(ref. 44) to albumin at 50 mg/ml (ref. 45). Thus, the relatively lownumber of human genes predicted from the genome sequence17,18
has the potential to generate a proteome of enormous and as yetundetermined complexity.
It became rapidly apparent that a proteomic technology basedstrictly on 2DE was technically complex, labor- and thereforecost-intensive, and fundamentally limited. The increased use ofMALDI-MS and ESI-MS/MS in the identification of 2DE-sepa-rated proteins showed that the incidence of comigrating proteinseven in this, the highest resolving protein method known, wasmore prevalent than had been originally thought46. Becausequantification in 2DE relies on the assumption that one proteinis present in each spot, comigration compromises such analyses.It was also observed that with conventional protein stainingmethods only a relatively small subset of a cellular proteome wasapparent when unfractionated cell lysates were separated by2DE46,47. Thus, despite the maturity and unmatched perfor-mance of 2DE for separating intricate patterns of differentiallymodified and processed proteins48, and despite the continuingevolution of 2DE separation49–52 and detection technology53,alternative methods for large-scale protein expression analysisbegan to be investigated more vigorously.
Hunt and co-workers54 laid the groundwork for a gel-indepen-dent approach to proteomics by demonstrating the ability of LC-MS/MS systems to handle extremely complex peptide mixtures.Antigen-presenting lymphocytes continually digest proteins andpresent some of the resulting peptides bound to major histocom-patibility complex (MHC) proteins for immune surveillance. Huntand co-workers54 used immunoprecipitation to isolate the peptide-MHC complexes, extracted the antigenic peptides and subjectedthe complex peptide mixtures to successive LC-MS/MS analyses.They also used a specific cytotoxic T cell response as a bioassay toconfirm the presence of antigenic peptides in each fraction and cor-
related this functional data with the mass spectrometric data,thereby identifying the sequence of the antigenic peptides55–57. Thisapproach clearly established LC-MS/MS as a powerful tool for ana-lyzing complex peptide mixtures, and the application of thismethod to the analysis of peptide mixtures generated by the prote-olysis of complex protein samples was a considerable step towardgel-independent proteomic technologies58.
Gel-independent quantitative profiling of the proteomeThe combination of LC-MS/MS and sequence database search-ing has been widely adopted for the analysis of complex peptidemixtures generated from the proteolysis of samples containingseveral proteins. This approach is often referred to as ‘shotgun’proteomics59,60 and has the ability to catalog hundreds, or eventhousands, of components contained in samples isolated fromvery different sources. Specific examples include the identifica-tion of proteins in the periplasmic space of bacteria61, yeast ribo-somal complexes62, murine nuclear interchromatin granuleclusters (nuclear speckles)63, murine mitochondrial solubleintermembrane proteins64, human urinary proteins65, yeastTFIID-associated proteins66, proteasomal proteins67, humanmicrosomal proteins68, human membrane proteins69 and yeastnuclear pore proteins70 pre-fractionated by SDS polyacrylamidegel electrophoresis, and proteins from yeast lysates71.
Such studies have also highlighted the limitations of shotgunproteomics, including the difficulty of detecting and analyzing bycollision-induced dissociation (CID) mass spectrometry all ofthe peptides in a sample, the qualitative nature of data-depen-dent experiments, and the challenge of processing the tens ofthousands of CID spectra generated in a typical experimen-t one of the many informatics challenges that still faces scien-tists in this field. On average, a protein digested with trypsin willgenerate 30–50 different peptides. A tryptic digest of the pro-teome of a typical human cell will therefore generate a peptidemixture containing at least hundreds of thousands of peptides.Even the most advanced LC-MS/MS systems cannot resolve andanalyze such complexity in a reasonable amount of time.
To use LC-MS/MS for the analysis of most proteomes, there-fore, a form of complexity reduction (fractionation) is required.Two approaches have been developed to tackle this problem. Thefirst approach is the selective enrichment of a subset of peptidesfrom a complex mixture. This has been mostly achieved byspecifically targeting peptides that contain a distinguishing fea-ture, such as chemically reactive sulfhydryl groups (cysteine
extract enrich
quantify(2DE)
digest
digest
separate
massspectrometry
identify
massspectrometry
quantify
Fig. 3 Quantitative protein analysis from the cell to the identified protein. The two most common processes for quantitative proteome analysis are shown. In thefirst (top), 2DE is used to separate and to quantify proteins, and selected proteins are then isolated and identified by mass spectrometry. In the second (bottom),LC-MS/MS is used to analyze enzyme digests of unseparated protein mixtures, and accurate quantification is achieved by labeling the peptides with stable iso-tope. Both processes are compatible with protein fractionation or separation methods, such as subcellular fractionation, protein complex isolation and elec-trophoresis and chromatography, thereby providing additional biological context to the protein samples being analyzed.
Katie
Ris
©20
03 N
atu
re P
ub
lish
ing
Gro
up
h
ttp
://w
ww
.nat
ure
.co
m/n
atu
reg
enet
ics
review
316 nature genetics supplement • volume 33 • march 2003
residues)59,72 or residues that have been modified post-transla-tionally with phosphate73,74 or carbohydrate75,76. Ideally, suchstrategies would select precisely one idiotypic peptide per pro-tein. Although this has not been realized, substantial reductionsin sample complexity have been achieved. But the trade-off is theloss of those proteins that do not contain the selected feature.
The second approach relies on extended upstream fractiona-tion of the complex peptide mixtures, with the aim of increas-ing the potential of the mass spectrometer to detect and tosequence all of the components of the sample. This has beenimplemented by using two or three orthogonal peptide separa-tion methods in sequence, the most successful of which haveinvolved cation exchange and capillary reverse-phase chro-matography68,71,77. Although both approaches either bythemselves or in combination have produced evidence thatproteome cataloguing using such shotgun proteomic strategiesis feasible71,78,79, a complete map of the proteome of anyspecies has yet to be produced by any method.
For proteomic studies applying a forward (function tosequence) approach, determination of the sequence of the targetproteins is usually a defined end point, because detailed func-tional analyses of the isolated species precede sequence analysis.For studies that apply reverse (sequence to function) approaches,knowing the sequence of the proteins in a sample is necessary butnot sufficient. Reverse approaches, which are used in many pro-teomic studies, typically involve quantitative comparison of theprotein profiles expressed by cells or tissues in different states.
The most valuable information on the system being studied isobtained from those proteins that are expressed differentially in amatrix of proteins of unchanged expression; therefore, pro-teomic technologies detecting differences in protein profiles needto be quantitative. Unfortunately, peptides analyzed in a massspectrometer will produce different specific signal intensitiesdepending on their chemical composition, on the matrix inwhich they are present and on other poorly understood variables.Thus, the intensity of a peptide ion signal does not accuratelyreflect the amount of peptide in a sample; in other words, massspectrometry is inherently not a quantitative technique. How-ever, two peptides of identical chemical structure that differ in
mass because they differ in isotopic composition are expected,according to stable isotope dilution theory80, to generate identi-cal specific signals in a mass spectrometer. To turn shotgun pro-teomics into a quantitative protein profiling method, therefore,stable isotope dilution has been combined with the complexityreduction techniques described above.
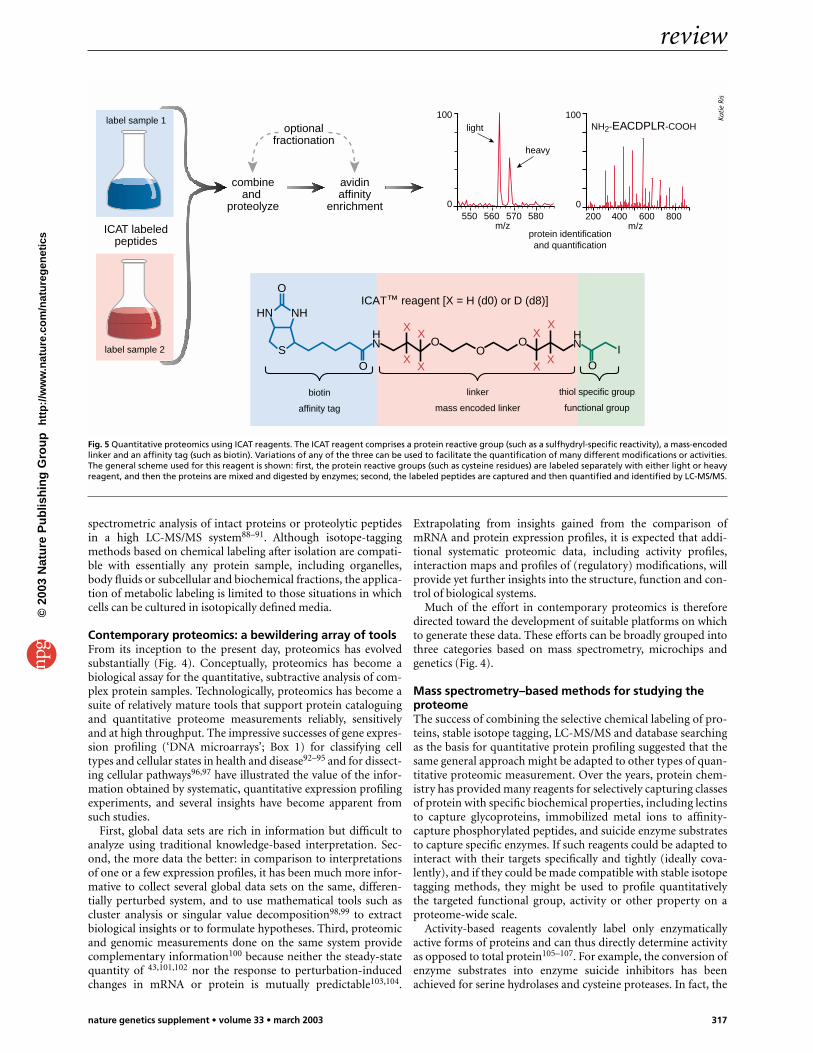
The first such approach was based on a class of reagents termedisotope-coded affinity tags or ‘ICAT’ (Box 1), LC-MS/MS andsequence database searching81. The reagents consist of an alkylat-ing group (iodoacetic acid) that covalently attaches the reagent toreduced cysteine residues, a polyether mass-encoded linker con-taining either eight hydrogens (d0) or eight deuteriums (d8) thatrepresents the isotope dilution and a biotin affinity tag throughwhich tagged peptides are selectively isolated. For quantitativeprotoemics, the ICAT reagent approach, or similar techniques,now provides an alternative method to the subtractive 2DE-based approaches discussed above.
As shown in Fig. 5, the ICAT reagent approach involves label-ing the cysteine residues in one sample with d0-ICAT reagent andthe cysteine residues in a second sample with the d8-ICATreagent. The samples are then combined. After optional proteinenrichment and enzymatic digestion of the combined samples,the biotinylated ICAT-labeled peptides are enriched by means ofavidin affinity chromatography and analyzed by LC-MS/MS.Each cysteinyl peptide appears as a pair of signals differing by themass differential encoded in the mass tag. The ratio of these sig-nal intensities precisely indicates the ratio of abundance of theprotein from which the peptide originates, and the MS/MS spec-trum of either isotopic form of the peptide allows the protein tobe identified. Thus, in a single, automated operation this methodidentifies the proteins present in two related samples and deter-mines the ratio of relative abundance.
Variations of this approach have been described. For example,alternative labeling chemistries have been explored82,83; stableisotope labeling has been achieved by a solid-phase isotope tagtransfer method84; 16O or 18O has been incorporated from H2
16Oor H2
18O, respectively, at the carboxy terminus of peptides dur-ing proteolytic cleavage by trypsin85–87; and stable-isotope meta-bolic protein labeling has been attempted before mass
1975 1990 1994 2002
mass spectrometrycomplex mixture analysis
LC-MS(/MS)
chip-based approaches
time
nucleotide sequencingESTs/genome scale
algorithms
genetic approaches
1996
proteomics2D gel electrophoresis
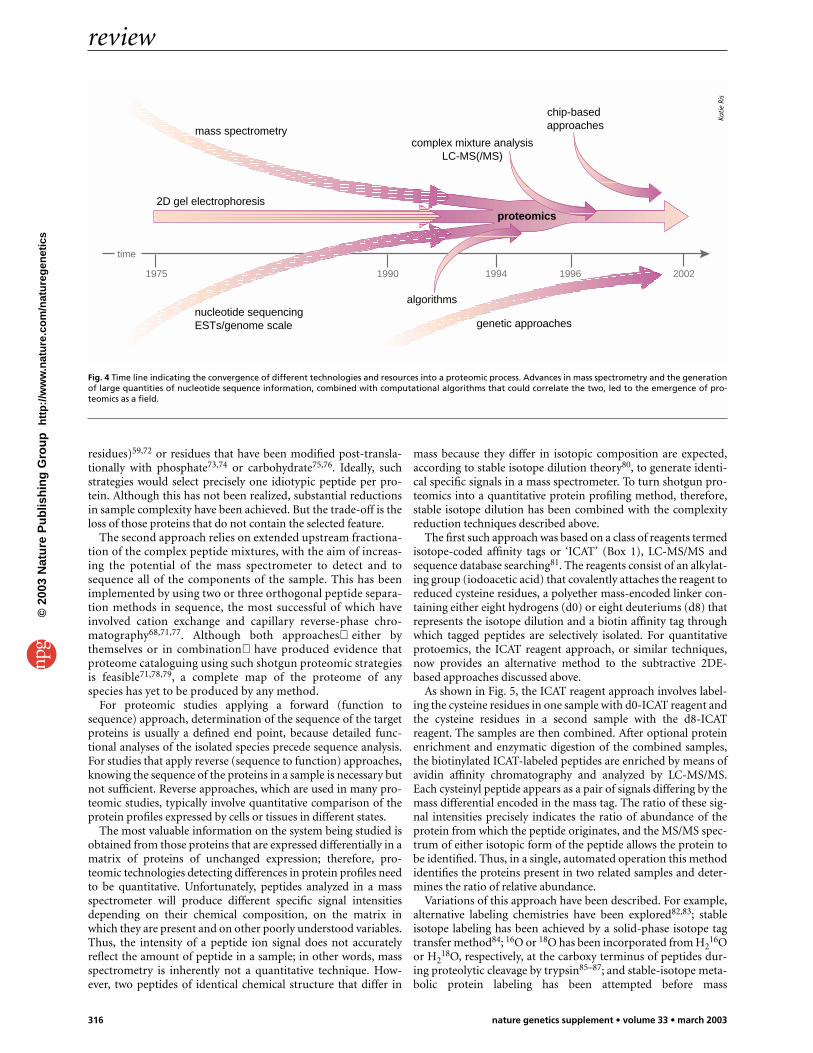
Fig. 4 Time line indicating the convergence of different technologies and resources into a proteomic process. Advances in mass spectrometry and the generationof large quantities of nucleotide sequence information, combined with computational algorithms that could correlate the two, led to the emergence of pro-teomics as a field.
Katie
Ris
©20
03 N
atu
re P
ub
lish
ing
Gro
up
h
ttp
://w
ww
.nat
ure
.co
m/n
atu
reg
enet
ics
review
nature genetics supplement • volume 33 • march 2003 317
spectrometric analysis of intact proteins or proteolytic peptidesin a high LC-MS/MS system88–91. Although isotope-taggingmethods based on chemical labeling after isolation are compati-ble with essentially any protein sample, including organelles,body fluids or subcellular and biochemical fractions, the applica-tion of metabolic labeling is limited to those situations in whichcells can be cultured in isotopically defined media.
Contemporary proteomics: a bewildering array of toolsFrom its inception to the present day, proteomics has evolvedsubstantially (Fig. 4). Conceptually, proteomics has become abiological assay for the quantitative, subtractive analysis of com-plex protein samples. Technologically, proteomics has become asuite of relatively mature tools that support protein cataloguingand quantitative proteome measurements reliably, sensitivelyand at high throughput. The impressive successes of gene expres-sion profiling (‘DNA microarrays’; Box 1) for classifying celltypes and cellular states in health and disease92–95 and for dissect-ing cellular pathways96,97 have illustrated the value of the infor-mation obtained by systematic, quantitative expression profilingexperiments, and several insights have become apparent fromsuch studies.
First, global data sets are rich in information but difficult toanalyze using traditional knowledge-based interpretation. Sec-ond, the more data the better: in comparison to interpretationsof one or a few expression profiles, it has been much more infor-mative to collect several global data sets on the same, differen-tially perturbed system, and to use mathematical tools such ascluster analysis or singular value decomposition98,99 to extractbiological insights or to formulate hypotheses. Third, proteomicand genomic measurements done on the same system providecomplementary information100 because neither the steady-statequantity of 43,101,102 nor the response to perturbation-inducedchanges in mRNA or protein is mutually predictable103,104.
Extrapolating from insights gained from the comparison ofmRNA and protein expression profiles, it is expected that addi-tional systematic proteomic data, including activity profiles,interaction maps and profiles of (regulatory) modifications, willprovide yet further insights into the structure, function and con-trol of biological systems.
Much of the effort in contemporary proteomics is thereforedirected toward the development of suitable platforms on whichto generate these data. These efforts can be broadly grouped intothree categories based on mass spectrometry, microchips andgenetics (Fig. 4).
Mass spectrometry–based methods for studying theproteomeThe success of combining the selective chemical labeling of pro-teins, stable isotope tagging, LC-MS/MS and database searchingas the basis for quantitative protein profiling suggested that thesame general approach might be adapted to other types of quan-titative proteomic measurement. Over the years, protein chem-istry has provided many reagents for selectively capturing classesof protein with specific biochemical properties, including lectinsto capture glycoproteins, immobilized metal ions to affinity-capture phosphorylated peptides, and suicide enzyme substratesto capture specific enzymes. If such reagents could be adapted tointeract with their targets specifically and tightly (ideally cova-lently), and if they could be made compatible with stable isotopetagging methods, they might be used to profile quantitativelythe targeted functional group, activity or other property on aproteome-wide scale.
Activity-based reagents covalently label only enzymaticallyactive forms of proteins and can thus directly determine activityas opposed to total protein105–107. For example, the conversion ofenzyme substrates into enzyme suicide inhibitors has beenachieved for serine hydrolases and cysteine proteases. In fact, the
label sample 1
ICAT labeledpeptides
label sample 2
combineand
proteolyze
optionalfractionation
avidinaffinity
enrichment
100
0200 400 600 800
protein identificationand quantification
100
0550 560 570 580
m/z m/z
NH2-EACDPLR-COOH
heavy
light
O OX X
NH
OO
OI
NHHN
S
O
NH
X
X
X XX
X
ICAT™ reagent [X = H (d0) or D (d8)]
biotin
affinity tag
linker
mass encoded linker
thiol specific group
functional group
Fig. 5 Quantitative proteomics using ICAT reagents. The ICAT reagent comprises a protein reactive group (such as a sulfhydryl-specific reactivity), a mass-encodedlinker and an affinity tag (such as biotin). Variations of any of the three can be used to facilitate the quantification of many different modifications or activities.The general scheme used for this reagent is shown: first, the protein reactive groups (such as cysteine residues) are labeled separately with either light or heavyreagent, and then the proteins are mixed and digested by enzymes; second, the labeled peptides are captured and then quantified and identified by LC-MS/MS.
Katie
Ris
©20
03 N
atu
re P
ub
lish
ing
Gro
up
h
ttp
://w
ww
.nat
ure
.co
m/n
atu
reg
enet
ics

review
318 nature genetics supplement • volume 33 • march 2003
study of proteases and their substrates and inhibitors in anorganism has been called “degradomics”108, and several studieson the cysteine and serine protease families have provided ‘proofof principle’ for the idea. These enzymes form covalently boundacyl intermediates during their catalytic cycle. This property canbe used to introduce tagged chemical probes by means of a struc-ture that mimics a general inhibitor and captures the active formof the proteases covalently. Fluorescently tagged probes107,109–111
or biotinylated probes112,113 have been used successfully, and iso-tope-tagged versions of these reagents are being developed.
Although the range of enzyme families to which this strategyhas been applied so far is limited, additional enzyme familiessuch as glycosidases also seem amenable to activity profiling114.In addition, drug screening projects that have been abortedbecause of poor compound specificity provide a rich source ofpotential leads for the development of class-specific reagents. Forexample, methods for capturing ATP-binding proteins have beendeveloped to enrich a range of proteins, including proteinkinases, with the potential for subsequent (activity) profiling ofthe enriched proteins by quantitative proteomic strategies115.
When enzyme activities cannot be measured directly, they maybe inferred from the analysis of converted substrates. This has beenachieved by the quantitative measurement of substrate conversionusing isotope-tagged substrates and mass spectrometry116, or bytrapping enzyme substrates on chemically or genetically alteredenzymes and then analyzing the isolated enzyme-substrate conju-gates by mass spectrometry. For example, chemically modifiedtrypsin117 has been used to identify incompletely processed neu-ropeptides118,119, and protein tyrosine phosphatases in which theinvariant catalytic amino acid aspartic acid is mutated to alaninehave been used as ‘substrate traps’, allowing the identification oftheir physiological substrates120,121.
Selective reagents or chemical reactions have been used toextract phosphorylated peptides from complex mixtures. Immo-bilized metal affinity chromatography73,122,123 has been usedsuccessfully to enrich phosphopeptides from relatively simplemixtures, but it lacks the specificity to be effective with more-complex peptide samples. To increase the specificity of metalaffinity chromatography for phosphopeptides, Ficarro et al.74
eliminated interactions between the resin and carboxyl groups bycapping the carboxyl groups with methyl ester groups. Thisallowed them to extract phosphopeptides selectively from thetryptic digest of a yeast lysate. Subsequent LC-MS/MS analysis ofthe selected peptides indicated the activation state of some yeastkinases from their phosphorylation state information that isnot accessible by most conventional proteomic approaches. Twocovalent chemistries, one based on β-elimination reactions124,125
and one based on the formation of phosphoramidates126, havebeen developed with the same objective. Although none of thesemethods is currently capable of quantitative phosphoproteinprofiling on a proteome-wide scale, these early studies representa path to such a technology.
Mass spectrometry–based proteomics is also rapidly becomingthe method of choice for analyzing functional proteincomplexes62,66,70,127,128. By providing a means to identify multi-ple members of complexes, this approach complements the viewrecently emphasized by Hartwell et al.129 that a cell is a collectionof interconnected modules (Fig. 1) that is, groups of proteinswith many network interconnections that act synergistically toexecute a particular cellular function.
Indeed, two large-scale ‘protein complex’ studies recently usedaffinity-tagged bait proteins expressed in yeast cells to isolate thebait protein together with its associated proteins130,131. The com-position of the isolated complexes was analyzed by gel elec-trophoresis and mass spectrometry, and thousands of protein
interactions many previously unknown were identified. Butthe poor overlap between the two data sets when the same baitproteins were used, and between either data set and resultsobtained by a genetic yeast two-hybrid screen (see below)132,suggests that the conditions and parameters for such experi-ments need further optimization and standardization.
In an alternative approach using ICAT reagents to label thecomponents of a target protein complex and a suitable controlisolate before quantitative LC-MS/MS analysis, specific compo-nents of the complex could be distinguished from nonspecificallyassociated proteins and changes in the composition of proteincomplexes isolated from cells at different states could beobserved readily133.
In the near future, it can be expected that quantitative pro-teomic technologies will mature to become the obvious choicefor systematically determining the important, diverse propertiesof proteins, including their activity and state of modification,and the composition and dynamics of their functional modules.
Chip-based methods for studying the proteomeComplementary DNA or oligonucleotide microarrays haveproved invaluable for analyzing transcript levels in several bio-logical systems5,134,135, and technological improvements con-tinue to increase their utility136,137. Array-based profilingtechniques are conceptually simple. A probe that is specific for aparticular analyte is placed at a defined position in a two-dimen-sional array, and the interaction of the probe with its target mol-ecule is detected. Signals indicate that interactions have occurred,their intensity and position on the array are recorded, and thusthe probed molecules and their quantity can be identified.
It therefore seemed obvious to apply similar principles to pro-teomic analyses in particular to protein expression profiling bygenerating ordered arrays of specific protein-binding mod-ules138–140. Such modules have included phage library–selectedscFv antibodies141, minibodies142,143, cyclic peptides144, reagentsresulting from the scaffold engineering of various proteins145–147,aptamers148, antibodies149 and antibody mimics150. In practice,however, the translation of array-based profiling from nucleic acidsto proteins has faced many difficulties151.
First, unlike cDNAs, proteins usually need to be captured intheir native conformation. This restricts the range of conditionsthat can be applied to maintain solubility, to optimize interac-tions and to remove nonspecific contaminants. Second, becauseat present proteins cannot be amplified before analysis, detectionmethods must be very sensitive. Third, proteins have no inherentproperties that make them measurable at high sensitivity, and theattachment of a detectable tag is prone to interfere with a pro-tein’s interactions. Fourth, the interactions between proteins andtheir binding reagents are less specific and of lower and morevariable affinity than those between Watson-Crick base-pairednucleic acids. This increases the potential for crossreactivity andcomplicates quantification, because substantial differences in thedissociation constants for each protein-protein interaction mustbe taken into account.
The challenge of obtaining antibodies of sufficient specificity tomake protein expression arrays possible was recently demonstratedin studies in which monoclonal antibodies that were probed againstnumerous expressed proteins showed a considerable propensity tocrossreact with proteins other than the intended target pro-tein152,153. In spite of advances such as the development of high-sensitivity detection methods154 and chip surface engineering155, itis therefore unsurprising that the most successful protein microar-rays for measuring an analyte in a complex protein mixture use rel-atively simple arrays of well-characterized antibodies138, mostnotably those directed towards cytokines154.
©20
03 N
atu
re P
ub
lish
ing
Gro
up
h
ttp
://w
ww
.nat
ure
.co
m/n
atu
reg
enet
ics

review
nature genetics supplement • volume 33 • march 2003 319
At present, the use of ‘protein chips’ has been more success-ful for systematically measuring or inferring functional prop-erties of proteins. Direct functional measurements include theactivities of diverse enzymes156 such as protein kinases157,158,protein-DNA interactions159,160, profiles of reaction antibod-ies (autoantibodies) in blood serum and other clinicalsamples152, and the interactions of proteins with small mole-cules161. Using cDNA arrays assayed with probes generatedfrom mRNAs extracted from membrane-associatedpolysomes, Diehn et al.162 could infer the identity of secretedand membrane-associated proteins. Similarly, in a techniquethat they call ‘translation state array analysis’, Morris and co-workers163 have profiled polysome-associated mRNAs usingconventional cDNA array technology to distinguish activelytranslated from non-translated mRNAs. As the chemistry ofprotein attachment continues to improve, the size of the arraysdecreases164; and, as different types of array are developed,additional uses for this technology will undoubtedly emerge.
Genetic methods for studying the proteomeGenetic methods for interrogating the proteome are generallybased on recombinant DNA techniques that introduce differenttags into all or selected proteins expressed by a cell. These tagscan be used to observe directly or to infer specific properties ofthe tagged proteins.
The strengths of genetic methods are their ability to targetpotentially every protein, to use selection for inferring function,to assay the protein in a cellular environment and to engineer cellstrains with specific properties, as well as the ease of assayautomation165. The weaknesses of genetic methods are that tag-ging itself can potentially interfere with the observed function andthat the range of species amenable to rigorous genetic engineeringis limited. This means that most observations particularly thoseon mammalian proteins are made in a heterologous environ-ment and that most readouts, with the exception of certain fluo-rescence measurements, are indirect.
The prototypical genetic proteomic assay is the ‘yeast two-hybrid system’ (Box 1), which was initially developed fordetecting protein-protein interactions166 and has beenreviewed recently167. This method has been used for large-scale protein interaction screens in, for example, bacterio-phage168, vaccinia169, yeast170–172, Helicobacter pylori173 andCaenorhabditis elegans174,175. The relative merits of the system-atic protein interaction maps generated by two-hybrid assayand those generated by mass spectrometry130,131, together withthe matter of which one, if any, best represents the true spaceof protein interactions in a cell, is an important and currentlyunresolved issue133.
This type of method has also been extended to facilitate thedetermination of protein-mRNA interactions176 and for sensingprotein-ligand binding177. Related approaches in which proteinsare expressed as fusions of green fluorescent protein or one of itsvariants178,179 are proving invaluable for probing several func-tional properties of proteins by direct in vivo observation180.Although such observations have been made mostly during spe-cific research projects, an initial compendium of the subcellularlocalization of the yeast proteome181 clearly shows the potentialof this approach as a proteomic assay.
A window to the futureThe scope of proteomic investigations has considerably broad-ened in the past few years. Whereas initial efforts were focusedon determining the identity and quantity of proteins using anarrow selection of methods, many emerging technologiesnow attempt to measure systematically all of the biologically
important properties of proteins. Although few, if any, of thesemethods have reached the status of validated proteomic tools,the rapid pace at which they are developing suggests that therich and varied sources of information contained in the pro-teome will become increasingly accessible. The main chal-lenges of the future will be the validation, visualization,integration and interpretation, in a biological context, of thevast amounts of diverse data generated by the application ofproteomic and genomic discovery science tools.
In 1996, the first complete genomic sequence of a eukaryoticspecies, Saccharomyces cerevisiae, was published16. The earlyavailability of this resource, the richness of knowledge alreadyacquired through decades of hypothesis-driven research and theease with which it could be experimentally manipulated madeyeast the model organism in which to test and to validate most ofthe technologies and approaches discussed above. Because inmany respects the analysis of mammalian cells is more complexand technically challenging, yeast can be viewed as a window intothe future of genomics-based and proteomics-based biologicalresearch. What insights might this view provide?
First, there will be a convergence of discovery science andhypothesis-driven research. The beginning of such a convergenceis already apparent in information resources such as the yeastprotein database182 and the Saccharomyces GenomeDatabase183, in which systematically collected data and theresults from hypothesis-driven research published in the scien-tific literature have been combined into highly useful resourcesfor experimental biologists. In addition, a recent study hasshown the value of this union of data as an experimental strategyto gain insights into the physiology of a cell100. In this study, bothgenomic and proteomic data were collected from yeast cells inwhich all of the known components of the galactose inductionpathway had been perturbed systematically. The different datawere integrated into a mathematical model consistent with theavailable information. This model was then used to predict pre-viously unknown interactions within the pathway and betweenthe galactose induction pathway and other cellular processes.Some of these predictions were then verified experimentally100.
Second, systems biology approaches will detect connectionsbetween broad cellular functions and pathways that were neitherapparent nor predictable despite decades of biochemical andgenetic analysis of the biological system in question. This hasbeen validated broadly by numerous mRNA expression studies,and also by studies based on quantitative protein profiling (refs.184, 185). The rich and diverse information represented in largeproteomic data sets is expected to accelerate our understandingof the interdependence of cellular processes.
Third, our ability to collect large proteomic data sets alreadyoutstrips our ability to validate, to interpret and to integrate suchdata for the purpose of creating biological knowledge. Therefore,software tools will be developed to help manage, interpret, inte-grate and understand proteomic data. The lack of suitable soft-ware tools currently limits essentially all areas of proteomic dataanalysis, from database searching using MS/MS spectra to theassembly of large data sets containing different types of data inrelational databases (Fig. 6). To derive value from the data thatgoes beyond an initial scan for ‘interesting observations’ and tomake data portable and comparable, it will be necessary todevelop algorithms that assign a score to each data point thatestimates the probability that the observation is correct. Just asthe assignment of quality scores to each base in DNA sequencingusing the algorithm Phred186,187 was essential for the success ofgenome sequencing programs, it can be expected that probabil-ity-based scores calculated for proteomic data188 will have a sim-ilar impact on proteomics.
©20
03 N
atu
re P
ub
lish
ing
Gro
up
h
ttp
://w
ww
.nat
ure
.co
m/n
atu
reg
enet
ics

review
320 nature genetics supplement • volume 33 • march 2003
It may seem that these trends might be realized with incremen-tal improvements of current proteomic technologies, and thismay be largely true for unicellular organisms. But multicellularorganisms contain levels of organization, such as the arrange-ment of cells in tissues, and carry out processes, such as memoryand immunity, for which there are no counterparts in yeast orother unicellular organisms. The transition from the applicationof proteomic strategies in unicellular organisms to their applica-tion in higher eukaryotes is therefore much more complex thanone could estimate from a simple comparison of the numbers ofgenes in the respective genomes.
Some of these complexities, in particular the organization ofcells into tissues and to some extent the topology of the proteinscontained in them, are being investigated by an innovativeemerging technique called imaging mass spectrometry189,190.Although at present this technique does not afford the sensitivityand resolution to study biological processes, it is immediatelyuseful for generating diagnostic patterns. Despite these advancesand substantial increases in the sensitivity, resolution and massaccuracy of new types of mass spectrometer such as linear iontraps191, MALDI-TOF-TOF192 and FT-ICR-MS79,193, proteomic-s especially when applied to higher eukaryotic species willremain limited by technology for the foreseeable future.
We see four main challenges to be addressed in order for pro-teomics to have a substantial impact on eukaryotic biology withinthe systems biology model. The first challenge is the enormouscomplexity of the proteome. For some proteins, in excess of 1,000variants (splice and translation isoforms, differentially modifiedand processed species) have been described194. The detection, andparticularly the molecular analysis of this complexity, remains anunmatched task. The second challenge is the need for a generaltechnology for the targeted manipulation of gene expression ineukaryotic cells. An approach that has proved successful for the sys-tematic analysis of biological systems relies on iterative cycles of tar-geted perturbations of the system under study and the systematicanalysis of the consequences of each perturbation100. Althoughrecent advances in using RNA interference in higher eukaryoticcells open up exciting possibilities, the general targeted manipula-tion of biological systems in these species remains unsolved. Thethird challenge is the limited throughput of today’s proteomic plat-forms: iterative, systematic measurements on differentially per-turbed systems demand a sample throughput that is not matchedby current proteomic platforms. The fourth challenge is the lack ofa general technique for the absolute quantification of proteins. Theability to quantify proteins absolutely, thereby eliminating the needfor a reference sample, would have far-reaching implications forproteomics from the determination of the stoichiometry of pro-tein complexes to the design of clinical studies aimed at discoveringdiagnostic markers.
Fortunately, proteomics will have an impact on clinical andbiological research well before these challenges are met. Weexpect that precise clinical diagnosis based on highly discrimi-nating patterns of proteins in easily accessible samples, particu-larly body fluids, may be the area in which proteomics will makeits first significant contribution195,196. In the short term, pro-teomics also can be expected to provide partial data sets of suffi-cient quality, density and information content to provide thebasis for generating sophisticated mathematical models of bio-logical processes that will be able to simulate system propertiessuch as adaptation or robustness197,198, which may not be appar-ent from the analysis of isolated elements of a system.
In its first decade, the field of proteomics has grown rapidly toencompass numerous advanced technologies that strive to pro-vide the molecular data necessary for a comprehensive under-standing of biological processes. Although much ground hasbeen covered, continued advances in methods, instrumentationand computational analysis will be needed to get closer to theworkings of biology through the analysis of these systems.
AcknowledgmentsWe would like to thank L. Feltz for administrative assistance and J. Watts forreview of the manuscript.
1. Aebersold, R., Hood, L.E. & Watts, J.D. Equipping scientists for the new biology.Nat. Biotechnol. 18, 359 (2000).
2. Thornton, J. Structural genomics takes off. Trends Biochem. Sci. 26, 88–99 (2001).3. Aebersold, R. & Patterson, S.D. Current problems and technical solutions in
protein biochemistry. In PROTEINS: Analysis & Design (ed. Angeletti, R.H.) 3–120(Academic, San Diego, 1998).
4. Adams, M.D. et al. Initial assessment of human gene diversity and expressionpatterns based upon 83 million nucleotides of cDNA sequence. Nature 377,3–174 (1995).
5. Schena, M., Shalon, D., Davis, R.W. & Brown, P.O. Quantitative monitoring ofgene expression patterns with a complementary DNA microarray. Science 270,467–470 (1995).
6. Velculescu, V.E., Zhang, L., Vogelstein, B. & Kinzler, K.W. Serial analysis of geneexpression. Science 270, 484–487 (1995).
7. Anderson, N.L., Hofmann, J.P., Gemmell, A. & Taylor, J. Global approaches toquantitative analysis of gene-expression patterns observed by use of two-dimensional gel electrophoresis. Clin. Chem. 30, 2031–2036 (1984).
8. Tarroux, P., Vincens, P. & Rabilloud, T. HERMeS: A second generation approach tothe automatic analysis of two-dimensional electrophoresis gels. Part V: Dataanalysis. Electrophoresis 8, 187–199 (1987).
9. Aebersold, R.H., Leavitt, J., Saavedra, R.A., Hood, L.E. & Kent, S.B. Internal aminoacid sequence analysis of proteins separated by one- or two-dimensional gelelectrophoresis after in situ protease digestion on nitrocellulose. Proc. Natl.Acad. Sci. 84, 6970–6974 (1987).
10. Vandekerckhove, J., Bauw, G., Puype, M., Van Damme, J. & Van Montagu, M.Protein-blotting on polybrene-coated glass-fiber sheets. Eur. J. Biochem. 152,9–19 (1985).
11. Tempst, P., Link, A.J., Riviere, L.R., Fleming, M. & Elicone, C. Internal sequenceanalysis of proteins separated on polyacrylamide gels at the submicrogram level:improved methods, applications and gene cloning strategies. Electrophoresis 11,537–553 (1990).
12. Adams, M.D. et al. Complementary DNA sequencing: expressed sequence tagsand human genome project. Science 252, 1651–1656 (1991).
13. Adams, M.D., Kerlavage, A.R., Fields, C. & Venter, J.C. 3,400 new expressedsequence tags identify diversity of transcripts in human brain. Nat. Genet. 4,256–267 (1993).
sampleinformation
fractionationdata
LC-MS/MSdata
collection
sequencedatabasesearching
quantification datavalidation
data• storage• mining• interpretation
sample generationand/or clinical data
LIMS, samplehandling information
optimized instrumentcontrol protocols
second generationsearch algorithms
automated proteinquantification tools
probability-basedscoring
relational database
• access• dissemination
Fig. 6 Quantitative proteomics and informatics. Brief descriptions of the informatics requirements for each of the processes of biological analysis are listed. Han-dling these data requires significant computational infrastructure if it is to be carried out repeatedly on a large scale. Many of the algorithms used in the processare still not mature.
Katie
Ris
©20
03 N
atu
re P
ub
lish
ing
Gro
up
h
ttp
://w
ww
.nat
ure
.co
m/n
atu
reg
enet
ics
review
nature genetics supplement • volume 33 • march 2003 321
14. Zhang, L. et al. Gene expression profiles in normal and cancer cells. Science 276,1268–1272 (1997).
15. Bonaldo, M.F., Lennon, G. & Soares, M.B. Normalization and subtraction: twoapproaches to facilitate gene discovery. Genome Res. 6, 791–806 (1996).
16. Goffeau, A. et al. Life with 6000 genes. Science 274, 563–567 (1996).17. Venter, J.C. et al. The sequence of the human genome. Science 291, 1304–1351
(2001).18. Lander, E.S. et al. Initial sequencing and analysis of the human genome. Nature
409, 860–921 (2001).19. Fenn, J.B., Mann, M., Meng, C.K., Wong, S.F. & Whitehouse, C.M. Electrospray
ionization for mass spectrometry of large biomolecules. Science 246, 64–71(1989).
20. Karas, M. & Hillenkamp, F. Laser desorption ionization of proteins withmolecular masses exceeding 10000 daltons. Anal. Chem. 60, 2299–2301 (1988).
21. Tanaka, K., Ido, Y., Akita, S., Yoshida, Y. & Yoshida, T. Detection of high massmolecules by laser desorption time-of-flight mass spectrometry. In Proc. 2ndJapan-China Joint Symp. Mass Spectrom. (eds. Matsuda, H. & Xiao-tian, L.)185–188 (Osaka, Japan, 1987).
22. Tanaka, K. et al. Protein and polymer analyses up to m/z 100,000 by laserionization TOF-MS. Rapid Commun. Mass Spectrom. 2, 151–153 (1988).
23. Henzel, W.J. et al. Identifying proteins from two-dimensional gels by molecularmass searching of peptide fragments in protein sequence databases. Proc. Natl.Acad. Sci. USA 90, 5011–5015 (1993).
24. Mann, M., Hojrup, P. & Roepstorff, P. Use of mass spectrometric molecularweight information to identify proteins in sequence databases. Biol. MassSpectrom. 22, 338–345 (1993).
25. Pappin, D.J.C., Hojrup, P. & Bleasby, A.J. Rapid identification of proteins bypeptide-mass fingerprinting. Curr. Biol. 3, 327–332 (1993).
26. James, P., Quadroni, M., Carafoli, E. & Gonnet, G. Protein identification by massprofile fingerprinting. Biochem. Biophys. Res. Commun. 195, 58–64 (1993).
27. Yates, J.R., III, Speicher, S., Griffin, P.R. & Hunkapiller, T. Peptide mass maps: ahighly informative approach to protein identification. Anal. Biochem. 214,397–408 (1993).
28. Patterson, S.D. & Aebersold, R. Mass spectrometric approaches for theidentification of gel-separated proteins. Electrophoresis 16, 1791–1814 (1995).
29. Eng, J.K., McCormack, A.L. & Yates, J.R., III. An approach to correlate tandemmass spectral data pf peptides with amino acid sequences in a protein database.J. Am. Soc. Mass Spectrom. 5, 976–989 (1994).
30. Mann, M. Sequence database searching by mass spectrometric data. InMicrocharacterization of Proteins (eds. Kellner, R., Lottspeich, F. & Meyer, H.E.)223–245 (VCH, Weinheim, 1994).
31. Gras, R. & Muller, M. Computational aspects of protein identification by massspectrometry. Curr. Opin. Mol. Ther. 3, 526–532 (2001).
32. Wilm, M.S. & Mann, M. Electrospray and Taylor-Cone theory, Dole’s beam ofmacromolecules at last? Int. J. Mass Spectrom. Ion Proc. 136, 167–180 (1994).
33. Wilm, M. et al. Femtomole sequencing of proteins from polyacrylamide gels bynano-electrospray mass-spectrometry. Nature 379, 466–469 (1996).
34. Scheele, G.A. Two-dimensional gel analysis of soluble proteins. Characterizationof guinea pig exocrine pancreatic proteins. J. Biol. Chem. 250, 5375–5385 (1975).
35. Klose, J. Protein mapping by combined isoelectric focusing and electrophoresisof mouse tissues: a novel approach to testing for induced point mutations inmammals. Humangenetik 26, 231–243 (1975).
36. O’Farrell, P.H. High resolution two-dimensional gel electrophoresis of proteins.J. Biol. Chem. 250, 4007–4021 (1975).
37. Anderson, N.G. & Anderson, L. The human protein index. Clin Chem. 28, 739–748(1982).
38. Garrels, J.I. The QUEST system for quantitative analysis of two-dimensional gels.J. Biol. Chem. 264, 5269–5282 (1989).
39. Garrels, J.I. & Franza, B.R. Jr. Transformation-sensitive and growth-relatedchanges of protein synthesis in REF52 cells. A two-dimensional gel analysis ofSV40-, adenovirus-, and Kirsten murine sarcoma virus–transformed rat cellsusing the REF52 protein database. J. Biol. Chem. 264, 5299–5312 (1989).
40. Garrels, J.I. & Franza, B.R., Jr. The REF52 protein database. Methods of databaseconstruction and analysis using the QUEST system and characterizations ofprotein patterns from proliferating and quiescent REF52 cells. J. Biol. Chem. 264,5283–5298 (1989).
41. Anderson, N.L., Matheson, A.D. & Steiner, S. Proteomics: applications in basicand applied biology. Curr. Opin. Biotechnol. 11, 408–412 (2000).
42. Wilkins, M.R. et al. Progress with proteome projects: why all proteins expressedby a genome should be identified and how to do it. Biotech. Gen. Eng. Rev. 13,19–50 (1995).
43. Gygi, S.P., Rochon, Y., Franza, B.R. & Aebersold, R. Correlation between proteinand mRNA abundance in yeast. Mol. Cell. Biol. 19, 1720–1730 (1999).
44. Lai, R. et al. Prognostic value of plasma interleukin-6 levels in patients withchronic lymphocytic leukemia. Cancer 95, 1071–1075 (2002).
45. Ritchie, R.F., Palomaki, G.E., Neveux, L.M. & Navolotskaia, O. Referencedistributions for the negative acute-phase proteins, albumin, transferrin, andtransthyretin: a comparison of a large cohort to the world’s literature. J. Clin.Lab. Anal. 13, 280–286 (1999).
46. Gygi, S.P., Corthals, G.L., Zhang, Y., Rochon, Y. & Aebersold, R. Evaluation of two-dimensional gel electrophoresis-based proteome analysis technology. Proc. Natl.Acad. Sci. USA 97, 9390–9395 (2000).
47. Corthals, G.L., Wasinger, V.C., Hochstrasser, D.F. & Sanchez, J.C. The dynamicrange of protein expression: a challenge for proteomic research. Electrophoresis21, 1104–1115 (2000).
48. Gauss, C., Kalkum, M., Lowe, M., Lehrach, H. & Klose, J. Analysis of the mouseproteome. I. Brain proteins: separation by two-dimensional electrophoresis andidentification by mass spectrometry and genetic variation. Electrophoresis 20,575–600 (1999).
49. Rabilloud, T. Two-dimensional gel electrophoresis in proteomics: old, oldfashioned, but it still climbs up the mountains. Proteomics 2, 3–10 (2002).
50. Herbert, B. Advances in protein solubilisation for two-dimensionalelectrophoresis. Electrophoresis 20, 660–663 (1999).
51. Gorg, A. et al. The current state of two-dimensional electrophoresis withimmobilized pH gradients. Electrophoresis 21, 1037–1053 (2000).
52. Unlu, M., Morgan, M.E. & Minden, J.S. Difference gel electrophoresis: a single
gel method for detecting changes in protein extracts. Electrophoresis 18,2071–2077 (1997).
53. Rabilloud, T., Strub, J.M., Luche, S., van Dorsselaer, A. & Lunardi, J. A comparisonbetween Sypro Ruby and ruthenium II tris (bathophenanthroline disulfonate) asfluorescent stains for protein detection in gels. Proteomics 1, 699–704 (2001).
54. Appella, E., Padlan, E.A. & Hunt, D.F. Analysis of the structure of naturallyprocessed peptides bound by class I and class II major histocompatibility complexmolecules. EXS 73, 105–119 (1995).
55. Hunt, D.F. et al. Characterization of peptides bound to the class I MHC moleculeHLA-A2.1 by mass spectrometry. Science 255, 1261–1263 (1992).
56. Henderson, R.A. et al. HLA-A2.1-associated peptides from a mutant cell line: asecond pathway of antigen presentation. Science 255, 1264–1266 (1992).
57. Hunt, D.F. et al. Peptides presented to the immune system by the murine class IImajor histocompatibility complex molecule I-Ad. Science 256, 1817–1820 (1992).
58. Yates, J.R., III, McCormack, A.L., Schieltz, D., Carmack, E. & Link, A. Direct analysisof protein mixtures by tandem mass spectrometry. J. Prot. Chem. 16, 495–497(1997).
59. Spahr, C.S. et al. Simplification of complex peptide mixtures for proteomicanalysis: reversible biotinylation of cysteinyl peptides. Electrophoresis 21,1635–1650 (2000).
60. Wolters, D.A., Washburn, M.P. & Yates, J.R. III. An automated multidimensionalprotein identification technology for shotgun proteomics. Anal. Chem. 73,5683–5690 (2001).
61. Link, A.J., Carmack, E. & Yates, J.R. III. A strategy for the identification ofproteins localized to subcellular spaces: Application to E-coli periplasmicproteins. Int. J. Mass Spectrom. Ion Proc. 160, 303–316 (1997).
62. Link, A.J. et al. Direct analysis of protein complexes using mass spectrometry.Nat. Biotechnol. 17, 676–682 (1999).
63. Mintz, P.J., Patterson, S.D., Neuwald, A.F., Spahr, C.S. & Spector, D.L. Purificationand biochemical characterization of interchromatin granule clusters. EMBO J.18, 4308–4320 (1999).
64. Patterson, S.D. et al. Mass spectrometric identification of proteins released frommitochondria undergoing permeability transition. Cell Death Diff. 7, 137–144(2000).
65. Spahr, C.S. et al. Towards defining the urinary proteome using liquidchromatography-tandem mass spectrometry I. Profiling an unfractionatedtryptic digest. Proteomics 1, 93–107 (2001).
66. Sanders, S.L., Jennings, J., Canutescu, A., Link, A.J. & Weil, P.A. Proteomics of theeukaryotic transcription machinery: identification of proteins associated withcomponents of yeast TFIID by multidimensional mass spectrometry. Mol. Cell.Biol. 22, 4723–4738 (2002).
67. Verma, R. et al. Proteasomal proteomics: identification of nucleotide-sensitiveproteasome-interacting proteins by mass spectrometric analysis of affinity-purified proteasomes. Mol. Biol. Cell 11, 3425–3439 (2000).
68. Han, D.K., Eng, J., Zhou, H. & Aebersold, R. Quantitative profiling ofdifferentiation-induced microsomal proteins using isotope-coded affinity tagsand mass spectrometry. Nat. Biotechnol. 19, 946–951 (2001).
69. Simpson, R.J. et al. Proteomic analysis of the human colon carcinoma cell line(LIM 1215): Development of a membrane protein database. Electrophoresis 21,1707–1732 (2000).
70. Rout, M.P. et al. The yeast nuclear pore complex: composition, architecture, andtransport mechanism. J. Cell Biol. 148, 635–651 (2000).
71. Washburn, M.P., Wolters, D. & Yates, J.R.r. Large-scale analysis of the yeastproteome by multidimensional protein identification technology. Nat.Biotechnol. 19, 242–247 (2001).
72. Patterson, S.D. Using MS fragment-ion data to identify proteins from largesequence databases. In Proteomics, Integrating Protein-based Tools andApplications for Drug Discovery (ed. Savage, L.M.) 127–135 (InternationalBusiness Communications, Southborough, 1998).
73. Nuwaysir, L.M. & Stults, J.T. Electrospray ionization mass spectrometry ofphosphopeptides isolated by on-line immobilized metal-ion affinitychromatography. J. Am. Soc. Mass Spectrom. 4, 662–669 (1993).
74. Ficarro, S.B. et al. Phosphoproteome analysis by mass spectrometry and itsapplication to Saccharomyces cerevisiae. Nat. Biotechnol. 20, 301–305 (2002).
75. Hayes, B.K., Greis, K.D. & Hart, G.W. Specific isolation of O-Linked N-acetylglucosamine glycopeptides from complex mixtures. Anal. Biochem. 228,115–122 (1995).
76. Greis, K.D. et al. Selective detection and site-analysis of O-GlcNAc-modifiedglycopeptides by β-elimination and tandem electrospray mass spectrometry.Anal. Biochem. 234, 38–49 (1996).
77. Davis, M.T. et al. Automated LC-LC-MS-MS platform using binary ion-exchangeand gradient reversed-phase chromatography for improved proteomic analyses.J. Chromatogr. B 752, 281–291 (2001).
78. Gygi, S.P., Rist, B., Griffin, T.J., Eng, J. & Aebersold, R. Proteome analysis of low-abundance proteins using multidimensional chromatography and isotope-coded affinity tags. J. Proteome Res. 1, 47–54 (2002).
79. Smith, R.D. et al. An accurate mass tag strategy for quantitative and high-throughput proteome measurements. Proteomics 2, 513–523 (2002).
80. De Leenheer, A.P. & Thienpont, L.M. Application of isotope dilution-massspectrometry in clinical chemistry, pharmacokinetics, and toxicology. MassSpectrom. Rev. 11, 249–307 (1992).
81. Gygi, S.P. et al. Quantitative analysis of complex protein mixtures using isotope-coded affinity tags. Nat. Biotechnol. 17, 994–999 (1999).
82. Munchbach, M., Quadroni, M., Miotto, G. & James, P. Quantitation andfacilitated de novo sequencing of proteins by isotopic N-terminal labeling ofpeptides with a fragmentation-directing moiety. Anal. Chem. 72, 4047–4057(2000).
83. Cagney, G. & Emili, A. De novo peptide sequencing and quantitative profiling ofcomplex protein mixtures using mass-coded abundance tagging. Nat.Biotechnol. 20, 163–170 (2002).
84. Zhou, H., Ranish, J.A., Watts, J.D. & Aebersold, R. Quantitative proteomeanalysis by solid-phase isotope tagging and mass spectrometry. Nat. Biotechnol.20, 512–515 (2002).
85. Mirgorodskaya, O.A. et al. Quantitation of peptides and proteins by matrix-assisted laser desorption/ionization mass spectrometry using 18O-labeledinternal standards. Rapid Commun. Mass Spectrom. 14, 1226–1232 (2000).
©20
03 N
atu
re P
ub
lish
ing
Gro
up
h
ttp
://w
ww
.nat
ure
.co
m/n
atu
reg
enet
ics

review
322 nature genetics supplement • volume 33 • march 2003
86. Yao, X., Freas, A., Ramirez, J., Demirev, P.A. & Fenselau, C. Proteolytic 18Olabeling for comparative proteomics: model studies with two serotypes ofadenovirus. Anal. Chem. 73, 2836–2842 (2001).
87. Uttenweiler-Joseph, S., Neubauer, G., Christoforidis, S., Zerial, M. & Wilm, M.Automated de novo sequencing of proteins using the differential scanningtechnique. Proteomics 1, 668–682 (2001).
88. Oda, Y., Huang, K., Cross, F.R., Cowburn, D. & Chait, B.T. Accurate quantitation ofprotein expression and site-specific phosphorylation. Proc. Natl. Acad. Sci. USA96, 6591–6596 (1999).
89. Conrads, T.P. et al. Quantitative analysis of bacterial and mammalian proteomesusing a combination of cysteine affinity tags and 15N-metabolic labeling. Anal.Chem. 73, 2132–2139 (2001).
90. Smith, R.D. et al. Rapid quantitative measurements of proteomes by Fouriertransform ion cyclotron resonance mass spectrometry. Electrophoresis 22,1652–1668 (2001).
91. Washburn, M.P., Ulaszek, R., Deciu, C., Schieltz, D.M. & Yates, J.R. III. Analysis ofquantitative proteomic data generated via multidimensional proteinidentification technology. Anal. Chem. 74, 1650–1657 (2002).
92. Siebert, R., Rosenwald, A., Staudt, L.M. & Morris, S.W. Molecular features of B-cell lymphoma. Curr. Opin. Oncol. 13, 316–324 (2001).
93. Bangur, C.S. et al. Identification of genes over-expressed in small cell lungcarcinoma using suppression subtractive hybridization and cDNA microarrayexpression analysis. Oncogene 21, 3814–3825 (2002).
94. van’t Veer, L.J. et al. Gene expression profiling predicts clinical outcome ofbreast cancer. Nature 415, 530–536 (2002).
95. Spellman, P.T. et al. Comprehensive identification of cell cycle-regulated genesof the yeast Saccharomyces cerevisiae by microarray hybridization. Mol. Biol.Cell 9, 3273–3297 (1998).
96. Hughes, T.R. et al. Functional discovery via a compendium of expression profiles.Cell 102, 109–126 (2000).
97. Roberts, C.J. et al. Signaling and circuitry of multiple MAPK pathways revealedby a matrix of global gene expression profiles. Science 287, 873–880 (2000).
98. Eisen, M.B., Spellman, P.T., Brown, P.O. & Botstein, D. Cluster analysis and displayof genome-wide expression patterns. Proc. Natl. Acad. Sci. USA 95, 14863–14868(1998).
99. Alter, O., Brown, P.O. & Botstein, D. Singular value decomposition for genome-wide expression data processing and modeling. Proc. Natl. Acad. Sci. USA 97,10101–10106 (2000).
100. Ideker, T. et al. Integrated genomic and proteomic analyses of a systematicallyperturbed metabolic network. Science 292, 929–934 (2001).
101. Anderson, L. & Seilhamer, J. A comparison of selected mRNA and proteinabundances in human liver. Electrophoresis 18, 533–537 (1997).
102. Futcher, B., Latter, G.I., Monardo, P., McLaughlin, C.S. & Garrels, J.I. A sampling ofthe yeast proteome. Mol. Cell. Biol. 19, 7357–7368 (1999).
103. Betts, J.C., Lukey, P.T., Robb, L.C., McAdam, R.A. & Duncan, K. Evaluation of anutrient starvation model of Mycobacterium tuberculosis persistence by geneand protein expression profiling. Mol. Microbiol. 43, 717–731 (2002).
104. Griffin, T.J. et al. Complementary profiling of gene expression at thetranscriptome and proteome levels in Saccharomyces cerevisiae. Mol. Cell.Proteomics 1, 323–333 (2002).
105. Adam, G.C., Cravatt, B.F. & Sorensen, E.J. Profiling the specific reactivity of theproteome with non-directed activity-based probes. Chem. Biol. 8, 81–95 (2001).
106. Adam, G.C., Sorensen, E.J. & Cravatt, B.F. Proteomic profiling of mechanisticallydistinct enzyme classes using a common chemotype. Nat. Biotechnol. 20,805–809 (2002).
107. Greenbaum, D., Medzihradszky, K.F., Burlingame, A. & Bogyo, M. Epoxideelectrophiles as activity-dependent cysteine protease profiling and discoverytools. Chem. Biol. 7, 569–581 (2000).
108. Lopez-Otin, C. & Overall, C.M. Protease degradomics: a new challenge forproteomics. Nat. Rev. Mol. Cell Biol. 3, 509–519 (2002).
109. Bogyo, M., Shin, S., McMaster, J.S. & Ploegh, H.L. Substrate binding andsequence preference of the proteasome revealed by active-site-directed affinityprobes. Chem. Biol. 5, 307–320 (1998).
110. Cravatt, B.F. & Sorensen, E.J. Chemical strategies for the global analysis ofprotein function. Curr. Opin. Chem. Biol. 4, 663–668 (2000).
111. Greenbaum, D. et al. Chemical approaches for functionally probing theproteome. Mol. Cell. Proteomics 1, 60–68 (2002).
112. Kidd, D., Liu, Y. & Cravatt, B.F. Profiling serine hydrolase activities in complexproteomes. Biochemistry 40, 4005–4015 (2001).
113. Liu, Y., Patricelli, M.P. & Cravatt, B.F. Activity-based protein profiling: the serinehydrolases. Proc. Natl. Acad. Sci. USA 96, 14694–14699 (1999).
114. Withers, S.G. & Aebersold, R. Approaches to labeling and identification ofactive-site residues in glycosidases. Protein Sci. 4, 361–372 (1995).
115. Haystead, C.M., Gregory, P., Sturgill, T.W. & Haystead, T.A. γ-Phosphate-linkedATP-sepharose for the affinity purification of protein kinases. Rapid purificationto homogeneity of skeletal muscle mitogen-activated protein kinase kinase. Eur.J. Biochem. 214, 459–467 (1993).
116. Turecek, F. Mass spectrometry in coupling with affinity capture-release andisotope-coded affinity tags for quantitative protein analysis. J. Mass Spectrom.37, 1–14 (2002).
117. Kumazaki, T., Terasawa, K. & Ishii, S. Affinity chromatography on immobilizedanhydrotrypsin: general utility for selective isolation of C-terminal peptidesfrom protease digests of proteins. J. Biochem. 102, 1539–1546 (1987).
118. Fricker, L.D. et al. Identification and characterization of proSAAS, a granin-likeneuroendocrine peptide precursor that inhibits prohormone processing. J.Neurosci. 20, 639–648 (2000).
119. Bures, E.J. et al. Identification of incompletely processed potentialcarboxypeptidase E substrates from CpEfat/CpEfat mice. Proteomics 1, 79–92(2001).
120. Flint, A.J., Tiganis, T., Barford, D. & Tonks, N.K. Development of ‘substrate-trapping’ mutants to identify physiological substrates of protein tyrosinephosphatases. Proc. Natl. Acad. Sci. USA 94, 1680–1685 (1997).
121. Zhang, S.H., Liu, J., Kobayashi, R. & Tonks, N.K. Identification of the cell cycleregulator VCP (p97/CDC48) as a substrate of the band 4.1-related protein-tyrosine phosphatase PTPH1. J. Biol. Chem. 274, 17806–17812 (1999).
122. Belew, M. & Porath, J. Immobilized metal ion affinity chromatography. Effect ofsolute structure, ligand density and salt concentration on the retention of
peptides. J. Chromatogr. 516, 333–354 (1990).123. Posewitz, M.C. & Tempst, P. Immobilized gallium(III) affinity chromatography of
phosphopeptides. Anal. Chem. 71, 2883–2892 (1999).124. Oda, Y., Nagasu, T. & Chait, B.T. Enrichment analysis of phosphorylated proteins
as a tool for probing the phosphoproteome. Nat. Biotechnol. 19, 379–382(2001).
125. Goshe, M.B. et al. Phosphoprotein isotope-coded affinity tag approach forisolating and quantitating phosphopeptides in proteome-wide analyses. Anal.Chem. 73, 2578–2586 (2001).
126. Zhou, H., Watts, J.D. & Aebersold, R. A systematic approach to the analysis ofprotein phosphorylation. Nat. Biotechnol. 19, 375–378 (2001).
127. Pandey, A. & Mann, M. Proteomics to study genes and genomes. Nature 405,837–846 (2000).
128. Deshaies, R.J. et al. Charting the protein complexome in yeast by massspectrometry. Mol. Cell. Proteomics 1, 3–10 (2002).
129. Hartwell, L.H., Hopfield, J.J., Leibler, S. & Murray, A.W. From molecular tomodular cell biology. Nature 402, C47–C52 (1999).
130. Gavin, A.C. et al. Functional organization of the yeast proteome by systematicanalysis of protein complexes. Nature 415, 141–147 (2002).
131. Ho, Y. et al. Systematic identification of protein complexes in Saccharomycescerevisiae by mass spectrometry. Nature 415, 180–183 (2002).
132. von Mering, C. et al. Comparative assessment of large-scale data sets of protein-protein interactions. Nature 417, 399–403 (2002).
133. Ranish, J.A. et al. The study of macromolecular complexes by quantitativeproteomics. Nat. Genet. (in the press).
134. Pease, A.C. et al. Light-generated oligonucleotide arrays for rapid DNAsequence analysis. Proc. Natl. Acad. Sci. USA 91, 5022–5026 (1994).
135. Hughes, T.R. et al. Expression profiling using microarrays fabricated by an ink-jetoligonucleotide synthesizer. Nat. Biotechnol. 19, 342–347 (2001).
136. van Berkum, N.L. & Holstege, F.C. DNA microarrays: raising the profile. Curr.Opin. Biotechnol. 12, 48–52 (2001).
137. Nadon, R. & Shoemaker, J. Statistical issues with microarrays: processing andanalysis. Trends Genet. 18, 265–271 (2002).
138. Haab, B.B., Dunham, M.J. & Brown, P.O. Protein microarrays for highly paralleldetection and quantitation of specific proteins and antibodies in complexsolutions. Genome Biol. 2, RESEARCH0004 (2001).
139. Jenkins, R.E. & Pennington, S.R. Arrays for protein expression profiling: towardsa viable alternative to two-dimensional gel electrophoresis? Proteomics 1, 13–29(2001).
140. Zhou, H., Roy, S., Schulman, H. & Natan, M.J. Solution and chip arrays in proteinprofiling. Trends Biotechnol. 19, S34–S39 (2001).
141. McCafferty, J., Griffiths, A.D., Winter, G. & Chiswell, D.J. Phage antibodies:filamentous phage displaying antibody variable domains. Nature 348, 552–554(1990).
142. Tramontano, A. et al. The making of the minibody: an engineered β-protein forthe display of conformationally constrained peptides. J. Mol. Recognit. 7, 9–24(1994).
143. Martin, F. et al. Coupling protein design and in vitro selection strategies:improving specificity and affinity of a designed β-protein IL-6 antagonist. J. Mol.Biol. 255, 86–97 (1996).
144. Koivunen, E., Wang, B. & Ruoslahti, E. Phage libraries displaying cyclic peptideswith different ring sizes: ligand specificities of the RGD-directed integrins.Biotechnology 13, 265–270 (1995).
145. McConnell, S.J. & Hoess, R.H. Tendamistat as a scaffold for conformationallyconstrained phage peptide libraries. J. Mol. Biol. 250, 460–470 (1995).
146. Nord, K., Nilsson, J., Nilsson, B., Uhlen, M. & Nygren, P.A. A combinatorial libraryof an α-helical bacterial receptor domain. Protein Eng. 8, 601–608 (1995).
147. Choo, Y. & Klug, A. Designing DNA-binding proteins on the surface offilamentous phage. Curr. Opin. Biotechnol. 6, 431–436 (1995).
148. Brody, E.N. et al. The use of aptamers in large arrays for molecular diagnostics.Mol. Diagn. 4, 381–388 (1999).
149. Holt, L.J., Enever, C., de Wildt, R.M. & Tomlinson, I.M. The use of recombinantantibodies in proteomics. Curr. Opin. Biotechnol. 11, 445–449 (2000).
150. Eklund, M., Axelsson, L., Uhlen, M. & Nygren, P.A. Anti-idiotypic protein domainsselected from protein A-based affibody libraries. Proteins 48, 454–462 (2002).
151. Mitchell, P. A perspective on protein microarrays. Nat. Biotechnol. 20, 225–229(2002).
152. Cahill, D.J. Protein and antibody arrays and their medical applications. J.Immunol. Methods 250, 81–91 (2001).
153. Walter, G., Bussow, K., Cahill, D., Lueking, A. & Lehrach, H. Protein arrays forgene expression and molecular interaction screening. Curr. Opin. Microbiol. 3,298–302 (2000).
154. Schweitzer, B. et al. Multiplexed protein profiling on microarrays by rolling-circle amplification. Nat. Biotechnol. 20, 359–365 (2002).
155. Houseman, B.T. & Mrksich, M. Towards quantitative assays with peptide chips: asurface engineering approach. Trends Biotechnol. 20, 279–281 (2002).
156. Martzen, M.R. et al. A biochemical genomics approach for identifying genes bythe activity of their products. Science 286, 1153–1155 (1999).
157. Houseman, B.T., Huh, J.H., Kron, S.J. & Mrksich, M. Peptide chips for thequantitative evaluation of protein kinase activity. Nat. Biotechnol. 20, 270–274(2002).
158. Zhu, H. et al. Analysis of yeast protein kinases using protein chips. Nat. Genet.26, 283–289 (2000).
159. Ren, B. et al. Genome-wide location and function of DNA binding proteins.Science 290, 2306–2309 (2000).
160. Krylov, A.S., Zasedateleva, O.A., Prokopenko, D.V., Rouviere-Yaniv, J. &Mirzabekov, A.D. Massive parallel analysis of the binding specificity of histone-like protein HU to single- and double-stranded DNA with genericoligodeoxyribonucleotide microchips. Nucleic Acids Res. 29, 2654–2660 (2001).
161. MacBeath, G. & Schreiber, S.L. Printing proteins as microarrays for high-throughput function determination. Science 289, 1760–1763 (2000).
162. Diehn, M., Eisen, M.B., Botstein, D. & Brown, P.O. Large-scale identification ofsecreted and membrane-associated gene products using DNA microarrays. Nat.Genet. 25, 58–62 (2000).
163. Zong, Q., Schummer, M., Hood, L. & Morris, D.R. Messenger RNA translationstate: the second dimension of high-throughput expression screening. Proc.Natl. Acad. Sci. USA 96, 10632–10636 (1999).
©20
03 N
atu
re P
ub
lish
ing
Gro
up
h
ttp
://w
ww
.nat
ure
.co
m/n
atu
reg
enet
ics

review
nature genetics supplement • volume 33 • march 2003 323
164. Lee, K.B., Park, S.J., Mirkin, C.A., Smith, J.C. & Mrksich, M. Protein nanoarraysgenerated by dip-pen nanolithography. Science 295, 1702–1705 (2002).
165. Winzeler, E.A. et al. Functional characterization of the S. cerevisiae genome bygene deletion and parallel analysis. Science 285, 901–906 (1999).
166. Fields, S. & Song, O. A novel genetic system to detect protein-proteininteractions. Nature 340, 245–246 (1989).
167. Tucker, C.L., Gera, J.F. & Uetz, P. Towards an understanding of complex proteinnetworks. Trends Cell Biol. 11, 102–106 (2001).
168. Bartel, P.L., Roecklein, J.A., SenGupta, D. & Fields, S. A protein linkage map ofEscherichia coli bacteriophage T7. Nat. Genet. 12, 72–77 (1996).
169. McCraith, S., Holtzman, T., Moss, B. & Fields, S. Genome-wide analysis of vacciniavirus protein-protein interactions. Proc. Natl. Acad. Sci. USA 97, 4879–4884(2000).
170. Uetz, P. et al. A comprehensive analysis of protein-protein interactions inSaccharomyces cerevisiae. Nature 403, 623–627 (2000).
171. Ito, T. et al. Toward a protein-protein interaction map of the budding yeast: Acomprehensive system to examine two-hybrid interactions in all possiblecombinations between the yeast proteins. Proc. Natl. Acad. Sci. USA 97,1143–1147 (2000).
172. Ito, T. et al. A comprehensive two-hybrid analysis to explore the yeast proteininteractome. Proc. Natl. Acad. Sci. USA 98, 4569–4574 (2001).
173. Rain, J.C. et al. The protein-protein interaction map of Helicobacter pylori.Nature 409, 211–215 (2001).
174. Walhout, A.J. et al. Protein interaction mapping in C. elegans using proteinsinvolved in vulval development. Science 287, 116–122 (2000).
175. Davy, A. et al. A protein-protein interaction map of the Caenorhabditis elegans26S proteasome. EMBO Rep. 2, 821–828 (2001).
176. Zhang, B., Kraemer, B., SenGupta, D., Fields, S. & Wickens, M. Yeast three-hybridsystem to detect and analyze RNA-protein interactions. Methods Enzymol. 318,399–419 (2000).
177. Tucker, C.L. & Fields, S. A yeast sensor of ligand binding. Nat. Biotechnol. 19,1042–1046 (2001).
178. Heim, R., Prasher, D.C. & Tsien, R.Y. Wavelength mutations and posttranslationalautoxidation of green fluorescent protein. Proc. Natl. Acad. Sci. USA 91,12501–12504 (1994).
179. Tsien, R.Y. The green fluorescent protein. Annu. Rev. Biochem. 67, 509–544(1998).
180. Tsien, R.Y. & Miyawaki, A. Seeing the machinery of live cells. Science 280,1954–1955 (1998).
181. Kumar, A. et al. Subcellular localization of the yeast proteome. Genes Dev. 16,707–719 (2002).
182. Garrels, J.I. YPD a database for the proteins of Saccharomyces cerevisiae.
Nucleic Acids Res. 24, 46–49 (1996).183. Cherry, J.M. et al. SGD: Saccharomyces Genome Database. Nucleic Acids Res. 26,
73–79 (1998).184. Shiio, Y. et al. Quantitative proteomic analysis of Myc oncoprotein function.
EMBO J. 21, 5088–5096 (2002).185. Guina, T. et al. Quantitative proteomic analysis of Pseudomonas aeruginosa
indicates synthesis of quinolone signal in adaptation to cystic fibrosis airways.Proc. Natl. Acad. Sci. USA (in the press).
186. Ewing, B., Hillier, L., Wendl, M.C. & Green, P. Base-calling of automatedsequencer traces using phred. I. Accuracy assessment. Genome Res. 8, 175–185(1998).
187. Ewing, B. & Green, P. Base-calling of automated sequencer traces using phred. II.Error probabilities. Genome Res. 8, 186–194 (1998).
188. Keller, A. et al. Experimental protein mixture for validating tandem massspectral analysis. Omics 6, 207–212 (2002).
189. Caprioli, R.M., Farmer, T.B. & Gile, J. Molecular imaging of biological samples:localization of peptides and proteins using MALDI-TOF MS. Anal. Chem. 69,4751–4760 (1997).
190. Stoeckli, M., Chaurand, P., Hallahan, D.E. & Caprioli, R.M. Imaging massspectrometry: a new technology for the analysis of protein expression inmammalian tissues. Nat. Med. 7, 493–496 (2001).
191. Collings, B.A., Sudakov, M. & Londry, F.A. Resonance shifts in the excitation ofthe n = 0, K = 1 to 6 quadrupolar resonances for ions confined in a linear iontrap. J. Am. Soc. Mass Spectrom. 13, 577–586 (2002).
192. Medzihradszky, K.F. et al. The characteristics of peptide collision-induceddissociation using a high-performance MALDI-TOF/TOF tandem massspectrometer. Anal. Chem. 72, 552–558 (2000).
193. Marshall, A.G., Hendrickson, C.L. & Jackson, G.S. Fourier transform ion cyclotronresonance mass spectrometry: a primer. Mass Spectrom. Rev. 17, 1–35 (1998).
194. Ullrich, B., Ushkaryov, Y.A. & Sudhof, T.C. Cartography of neurexins: more than1000 isoforms generated by alternative splicing and expressed in distinct subsetsof neurons. Neuron 14, 497–507 (1995).
195. Petricoin, E.F. et al. Use of proteomic patterns in serum to identify ovariancancer. Lancet 359, 572–577 (2002).
196. Adam, B.L. et al. Serum protein fingerprinting coupled with a pattern-matchingalgorithm distinguishes prostate cancer from benign prostate hyperplasia andhealthy men. Cancer Res. 62, 3609–3614 (2002).
197. Alon, U., Surette, M.G., Barkai, N. & Leibler, S. Robustness in bacterialchemotaxis. Nature 397, 168–171 (1999).
198. Guet, C.C., Elowitz, M.B., Hsing, W. & Leibler, S. Combinatorial synthesis ofgenetic networks. Science 296, 1466–1470 (2002).
©20
03 N
atu
re P
ub
lish
ing
Gro
up
h
ttp
://w
ww
.nat
ure
.co
m/n
atu
reg
enet
ics