Embed Size (px)
Citation preview
Resource
Proteomics of a fuzzy organelle:interphase chromatinGeorg Kustatscher1,†, Nadia H�egarat2,†, Karen L H Wills1, Cristina Furlan1, Jimi-Carlo Bukowski-Wills1,
Helfrid Hochegger2,* & Juri Rappsilber1,3,**
Abstract
Chromatin proteins mediate replication, regulate expression, andensure integrity of the genome. So far, a comprehensive inventoryof interphase chromatin has not been determined. This is largelydue to its heterogeneous and dynamic composition, which makesconclusive biochemical purification difficult, if not impossible. As afuzzy organelle, it defies classical organellar proteomics and cannotbe described by a single and ultimate list of protein components.Instead, we propose a new approach that provides a quantitativeassessment of a protein’s probability to function in chromatin.We integrate chromatin composition over a range of differentbiochemical and biological conditions. This resulted in interphasechromatin probabilities for 7635 human proteins, including 1840previously uncharacterized proteins. We demonstrate the powerof our large-scale data-driven annotation during the analysisof cyclin-dependent kinase (CDK) regulation in chromatin. Quanti-tative protein ontologies may provide a general alternative tolist-based investigations of organelles and complement GeneOntology.
Keywords Cdk regulation; chromatin; machine learning; organelle;
proteomics
Subject Categories Cell Cycle; Chromatin, Epigenetics, Genomics &
Functional Genomics; Post-translational Modifications, Proteolysis &
Proteomics
DOI 10.1002/embj.201387614 | Received 6 December 2013 | Revised 12 January
2014 | Accepted 14 January 2014 | Published online 17 February 2014
EMBO Journal (2014) 33, 648–664
Introduction
Some of the first achievements of proteomics were to define the pro-
tein composition of organelles following isolation or quantitative
enrichment (Mootha et al, 2003; Schirmer et al, 2003). A second
generation of strategies has studied subcellular compartments based
on co-fractionation with marker proteins on density gradients
(Andersen et al, 2003; Dunkley et al, 2004; Foster et al, 2006).
Defining organelles in this way critically depends on biochemical
procedures and inherently introduces a series of purification arti-
facts. We have recently circumvented some of these by an approach
called Multiclassifier Combinatorial Proteomics (MCCP; Ohta et al,
2010). A common feature of these investigations is that they attempt
to completely separate genuine components from contaminants
through biochemical and/or bioinformatics approaches. Crucially,
the underlying assumption is that definite component lists can accu-
rately describe complex biological structures. In light of the dynamic
nature of organelles, an alternative concept may be needed.
Through examination of human interphase chromatin, we develop
an approach to capture the dynamic composition of biological struc-
tures, rather than enforcing static binary protein annotation.
Our analysis of interphase chromatin followed a three-stage
process. (i) We developed a new protocol to biochemically isolate
chromatin-enriched fractions. (ii) We employed MCCP (Ohta et al,
2010) with a refinement to encapsulate different degrees of functional
involvement of proteins in chromatin. (iii) We then derived for each
protein its probability of having a general chromatin-based function.
The final result is a quantitative protein ontology term “interphase
chromatin” that complements manually curated Gene Ontology (GO;
Ashburner et al, 2000) and network-extracted ontology (NeXO;
Dutkowski et al, 2013). We then apply this method to analyze changes
in chromatin mediated by Cdk1 and Cdk2 cyclin-dependent kinase
(CDK) activities in S-phase, and identify novel cell cycle-regulated
chromatin proteins that play a role in S-phase entry and progression.
Results and Discussion
A new chromatin enrichment procedure
As a first step, we optimized the proteomic coverage of human inter-
phase chromatin, that is, the DNA/histone fiber and all proteins
associating with it. For this, we developed a new procedure, which
we call chromatin enrichment for proteomics (ChEP). We fix
1 Wellcome Trust Centre for Cell Biology, University of Edinburgh, Edinburgh, UK2 Genome Damage and Stability Centre, University of Sussex, Brighton, UK3 Department of Biotechnology, Technische Universit€at Berlin, Berlin, Germany
*Corresponding author. Tel: +44 1273 877510; Fax: +44 1273 678121; E-mail: [email protected]**Corresponding author. Tel: +44 131 651 7056; E-mail: [email protected]†These authors contributed equally to this work.
The EMBO Journal Vol 33 | No 6 | 2014 ª 2014 The Authors.This is an open access article under the terms of the Creative Commons Attribution License,which permits use, distribution and reproduction in any medium, provided the original work is properly cited.
648
Published online: February 16, 2014
proteins in chromatin by in vivo formaldehyde cross-linking and
remove non-covalently associated proteins by washing under
extremely stringent conditions (Fig 1 and Materials and Methods).
These initial conditions relate to standard chromatin immunoprecip-
itation (ChIP) experiments (Solomon et al, 1988) and were also
employed as starting point of a recent proteomic analysis of telo-
meres (D�ejardin & Kingston, 2009). However, our approach then
uses simple centrifugation to collect whole chromatin for subse-
quent mass spectrometric analysis of the associated cross-linked
proteins. This should allow quantitative analyses of processes that
affect chromatin globally.
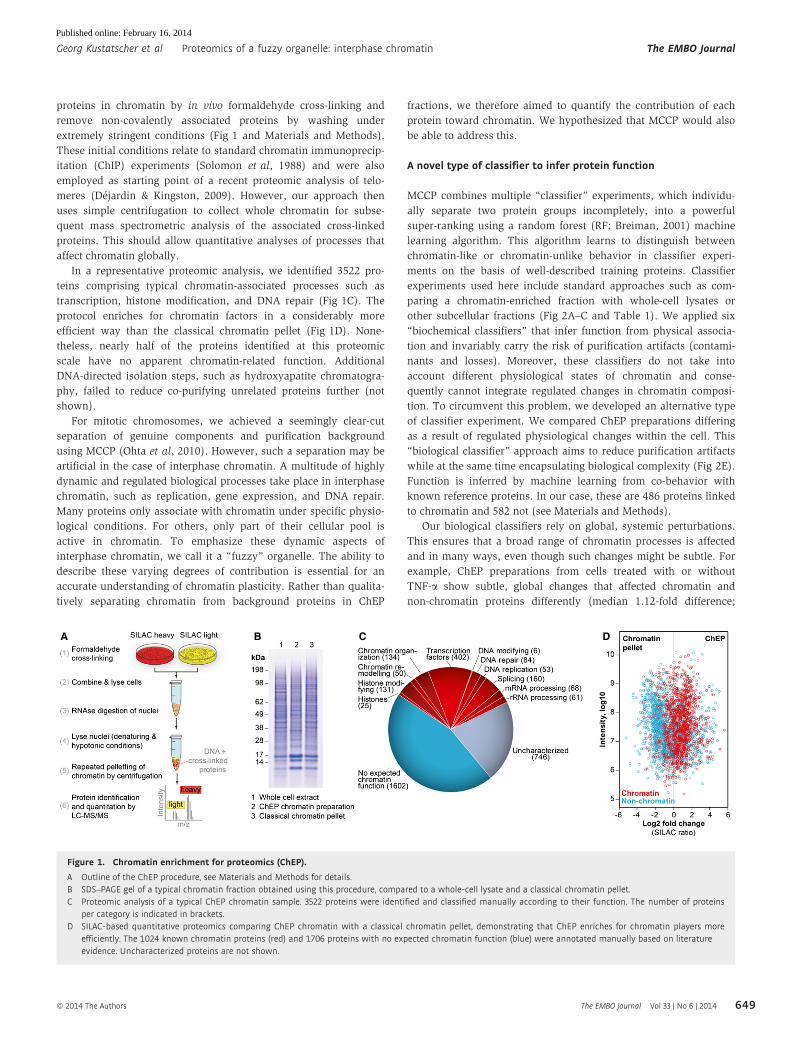
In a representative proteomic analysis, we identified 3522 pro-
teins comprising typical chromatin-associated processes such as
transcription, histone modification, and DNA repair (Fig 1C). The
protocol enriches for chromatin factors in a considerably more
efficient way than the classical chromatin pellet (Fig 1D). None-
theless, nearly half of the proteins identified at this proteomic
scale have no apparent chromatin-related function. Additional
DNA-directed isolation steps, such as hydroxyapatite chromatogra-
phy, failed to reduce co-purifying unrelated proteins further (not
shown).
For mitotic chromosomes, we achieved a seemingly clear-cut
separation of genuine components and purification background
using MCCP (Ohta et al, 2010). However, such a separation may be
artificial in the case of interphase chromatin. A multitude of highly
dynamic and regulated biological processes take place in interphase
chromatin, such as replication, gene expression, and DNA repair.
Many proteins only associate with chromatin under specific physio-
logical conditions. For others, only part of their cellular pool is
active in chromatin. To emphasize these dynamic aspects of
interphase chromatin, we call it a “fuzzy” organelle. The ability to
describe these varying degrees of contribution is essential for an
accurate understanding of chromatin plasticity. Rather than qualita-
tively separating chromatin from background proteins in ChEP
fractions, we therefore aimed to quantify the contribution of each
protein toward chromatin. We hypothesized that MCCP would also
be able to address this.
A novel type of classifier to infer protein function
MCCP combines multiple “classifier” experiments, which individu-
ally separate two protein groups incompletely, into a powerful
super-ranking using a random forest (RF; Breiman, 2001) machine
learning algorithm. This algorithm learns to distinguish between
chromatin-like or chromatin-unlike behavior in classifier experi-
ments on the basis of well-described training proteins. Classifier
experiments used here include standard approaches such as com-
paring a chromatin-enriched fraction with whole-cell lysates or
other subcellular fractions (Fig 2A–C and Table 1). We applied six
“biochemical classifiers” that infer function from physical associa-
tion and invariably carry the risk of purification artifacts (contami-
nants and losses). Moreover, these classifiers do not take into
account different physiological states of chromatin and conse-
quently cannot integrate regulated changes in chromatin composi-
tion. To circumvent this problem, we developed an alternative type
of classifier experiment. We compared ChEP preparations differing
as a result of regulated physiological changes within the cell. This
“biological classifier” approach aims to reduce purification artifacts
while at the same time encapsulating biological complexity (Fig 2E).
Function is inferred by machine learning from co-behavior with
known reference proteins. In our case, these are 486 proteins linked
to chromatin and 582 not (see Materials and Methods).
Our biological classifiers rely on global, systemic perturbations.
This ensures that a broad range of chromatin processes is affected
and in many ways, even though such changes might be subtle. For
example, ChEP preparations from cells treated with or without
TNF-a show subtle, global changes that affected chromatin and
non-chromatin proteins differently (median 1.12-fold difference;
A B C D
Figure 1. Chromatin enrichment for proteomics (ChEP).
A Outline of the ChEP procedure, see Materials and Methods for details.B SDS–PAGE gel of a typical chromatin fraction obtained using this procedure, compared to a whole-cell lysate and a classical chromatin pellet.C Proteomic analysis of a typical ChEP chromatin sample. 3522 proteins were identified and classified manually according to their function. The number of proteins
per category is indicated in brackets.D SILAC-based quantitative proteomics comparing ChEP chromatin with a classical chromatin pellet, demonstrating that ChEP enriches for chromatin players more
efficiently. The 1024 known chromatin proteins (red) and 1706 proteins with no expected chromatin function (blue) were annotated manually based on literatureevidence. Uncharacterized proteins are not shown.
Georg Kustatscher et al Proteomics of a fuzzy organelle: interphase chromatin The EMBO Journal
ª 2014 The Authors The EMBO Journal Vol 33 | No 6 | 2014 649
Published online: February 16, 2014
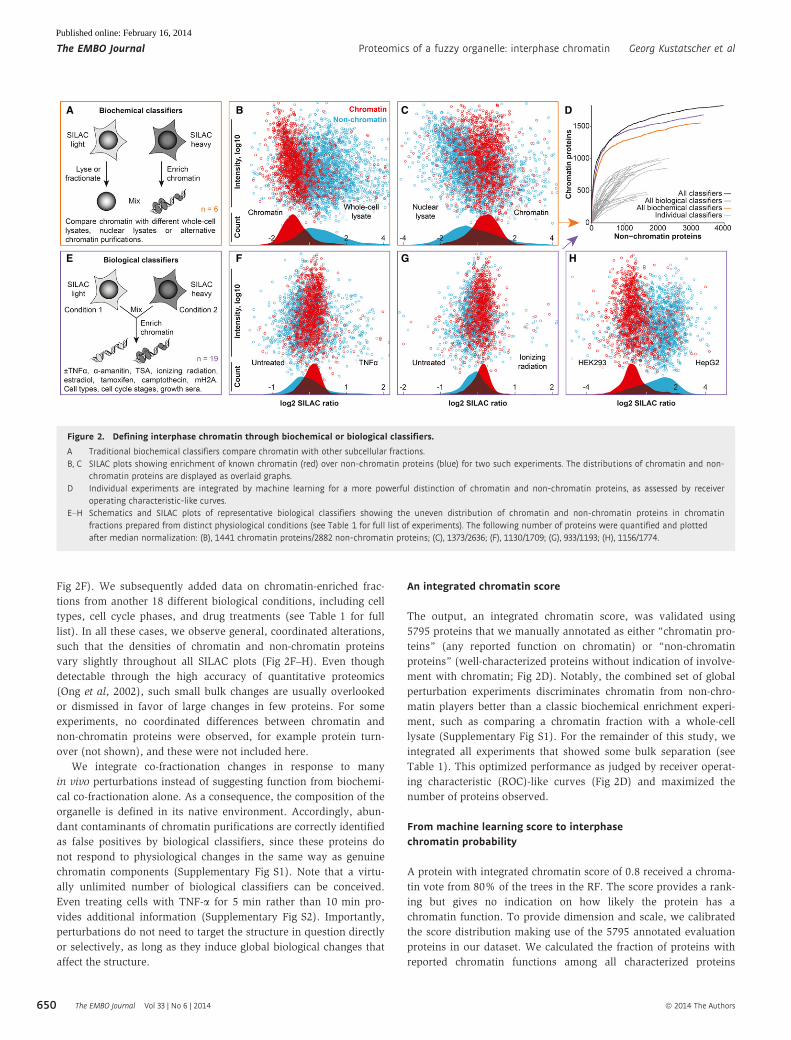
Fig 2F). We subsequently added data on chromatin-enriched frac-
tions from another 18 different biological conditions, including cell
types, cell cycle phases, and drug treatments (see Table 1 for full
list). In all these cases, we observe general, coordinated alterations,
such that the densities of chromatin and non-chromatin proteins
vary slightly throughout all SILAC plots (Fig 2F–H). Even though
detectable through the high accuracy of quantitative proteomics
(Ong et al, 2002), such small bulk changes are usually overlooked
or dismissed in favor of large changes in few proteins. For some
experiments, no coordinated differences between chromatin and
non-chromatin proteins were observed, for example protein turn-
over (not shown), and these were not included here.
We integrate co-fractionation changes in response to many
in vivo perturbations instead of suggesting function from biochemi-
cal co-fractionation alone. As a consequence, the composition of the
organelle is defined in its native environment. Accordingly, abun-
dant contaminants of chromatin purifications are correctly identified
as false positives by biological classifiers, since these proteins do
not respond to physiological changes in the same way as genuine
chromatin components (Supplementary Fig S1). Note that a virtu-
ally unlimited number of biological classifiers can be conceived.
Even treating cells with TNF-a for 5 min rather than 10 min pro-
vides additional information (Supplementary Fig S2). Importantly,
perturbations do not need to target the structure in question directly
or selectively, as long as they induce global biological changes that
affect the structure.
An integrated chromatin score
The output, an integrated chromatin score, was validated using
5795 proteins that we manually annotated as either “chromatin pro-
teins” (any reported function on chromatin) or “non-chromatin
proteins” (well-characterized proteins without indication of involve-
ment with chromatin; Fig 2D). Notably, the combined set of global
perturbation experiments discriminates chromatin from non-chro-
matin players better than a classic biochemical enrichment experi-
ment, such as comparing a chromatin fraction with a whole-cell
lysate (Supplementary Fig S1). For the remainder of this study, we
integrated all experiments that showed some bulk separation (see
Table 1). This optimized performance as judged by receiver operat-
ing characteristic (ROC)-like curves (Fig 2D) and maximized the
number of proteins observed.
From machine learning score to interphasechromatin probability
A protein with integrated chromatin score of 0.8 received a chroma-
tin vote from 80% of the trees in the RF. The score provides a rank-
ing but gives no indication on how likely the protein has a
chromatin function. To provide dimension and scale, we calibrated
the score distribution making use of the 5795 annotated evaluation
proteins in our dataset. We calculated the fraction of proteins with
reported chromatin functions among all characterized proteins
A B C D
E F G H
Figure 2. Defining interphase chromatin through biochemical or biological classifiers.
A Traditional biochemical classifiers compare chromatin with other subcellular fractions.B, C SILAC plots showing enrichment of known chromatin (red) over non-chromatin proteins (blue) for two such experiments. The distributions of chromatin and non-
chromatin proteins are displayed as overlaid graphs.D Individual experiments are integrated by machine learning for a more powerful distinction of chromatin and non-chromatin proteins, as assessed by receiver
operating characteristic-like curves.E–H Schematics and SILAC plots of representative biological classifiers showing the uneven distribution of chromatin and non-chromatin proteins in chromatin
fractions prepared from distinct physiological conditions (see Table 1 for full list of experiments). The following number of proteins were quantified and plottedafter median normalization: (B), 1441 chromatin proteins/2882 non-chromatin proteins; (C), 1373/2636; (F), 1130/1709; (G), 933/1193; (H), 1156/1774.
The EMBO Journal Proteomics of a fuzzy organelle: interphase chromatin Georg Kustatscher et al
The EMBO Journal Vol 33 | No 6 | 2014 ª 2014 The Authors650
Published online: February 16, 2014
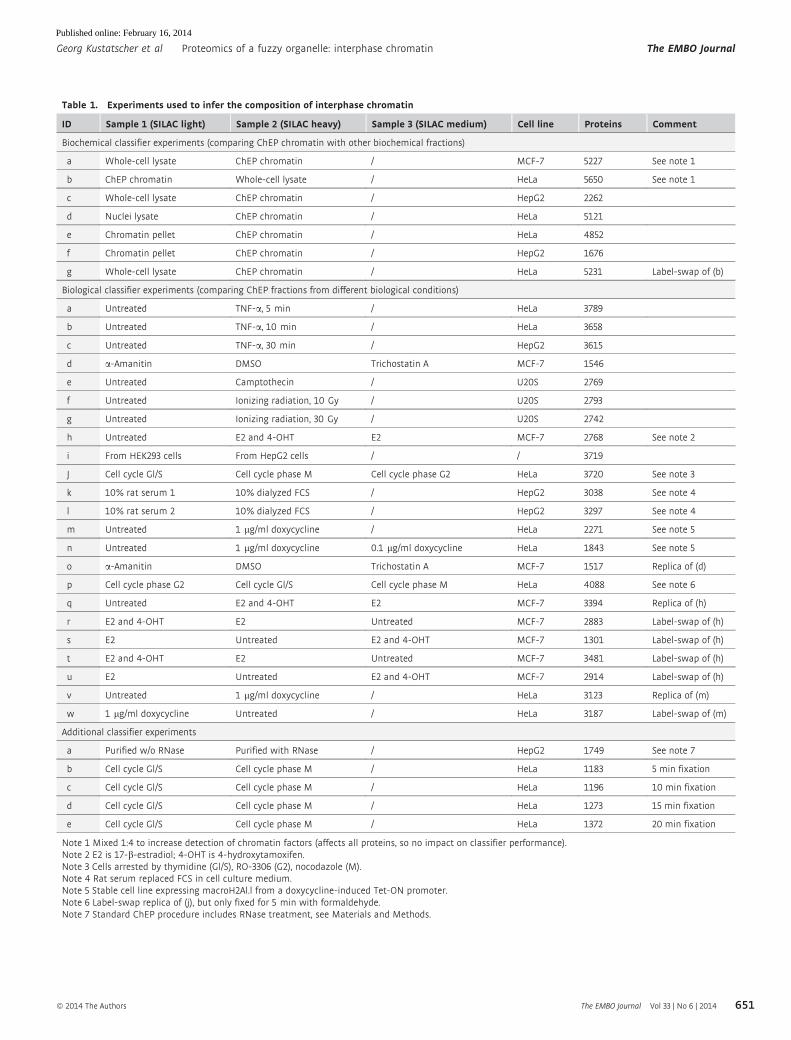
Table 1. Experiments used to infer the composition of interphase chromatin
ID Sample 1 (SILAC light) Sample 2 (SILAC heavy) Sample 3 (SILAC medium) Cell line Proteins Comment
Biochemical classifier experiments (comparing ChEP chromatin with other biochemical fractions)
a Whole-cell lysate ChEP chromatin / MCF-7 5227 See note 1
b ChEP chromatin Whole-cell lysate / HeLa 5650 See note 1
c Whole-cell lysate ChEP chromatin / HepG2 2262
d Nuclei lysate ChEP chromatin / HeLa 5121
e Chromatin pellet ChEP chromatin / HeLa 4852
f Chromatin pellet ChEP chromatin / HepG2 1676
g Whole-cell lysate ChEP chromatin / HeLa 5231 Label-swap of (b)
Biological classifier experiments (comparing ChEP fractions from different biological conditions)
a Untreated TNF-a, 5 min / HeLa 3789
b Untreated TNF-a, 10 min / HeLa 3658
c Untreated TNF-a, 30 min / HepG2 3615
d a-Amanitin DMSO Trichostatin A MCF-7 1546
e Untreated Camptothecin / U20S 2769
f Untreated Ionizing radiation, 10 Gy / U20S 2793
g Untreated Ionizing radiation, 30 Gy / U20S 2742
h Untreated E2 and 4-OHT E2 MCF-7 2768 See note 2
i From HEK293 cells From HepG2 cells / / 3719
J Cell cycle Gl/S Cell cycle phase M Cell cycle phase G2 HeLa 3720 See note 3
k 10% rat serum 1 10% dialyzed FCS / HepG2 3038 See note 4
l 10% rat serum 2 10% dialyzed FCS / HepG2 3297 See note 4
m Untreated 1 lg/ml doxycycline / HeLa 2271 See note 5
n Untreated 1 lg/ml doxycycline 0.1 lg/ml doxycycline HeLa 1843 See note 5
o a-Amanitin DMSO Trichostatin A MCF-7 1517 Replica of (d)
p Cell cycle phase G2 Cell cycle Gl/S Cell cycle phase M HeLa 4088 See note 6
q Untreated E2 and 4-OHT E2 MCF-7 3394 Replica of (h)
r E2 and 4-OHT E2 Untreated MCF-7 2883 Label-swap of (h)
s E2 Untreated E2 and 4-OHT MCF-7 1301 Label-swap of (h)
t E2 and 4-OHT E2 Untreated MCF-7 3481 Label-swap of (h)
u E2 Untreated E2 and 4-OHT MCF-7 2914 Label-swap of (h)
v Untreated 1 lg/ml doxycycline / HeLa 3123 Replica of (m)
w 1 lg/ml doxycycline Untreated / HeLa 3187 Label-swap of (m)
Additional classifier experiments
a Purified w/o RNase Purified with RNase / HepG2 1749 See note 7
b Cell cycle Gl/S Cell cycle phase M / HeLa 1183 5 min fixation
c Cell cycle Gl/S Cell cycle phase M / HeLa 1196 10 min fixation
d Cell cycle Gl/S Cell cycle phase M / HeLa 1273 15 min fixation
e Cell cycle Gl/S Cell cycle phase M / HeLa 1372 20 min fixation
Note 1 Mixed 1:4 to increase detection of chromatin factors (affects all proteins, so no impact on classifier performance).Note 2 E2 is 17-b-estradiol; 4-OHT is 4-hydroxytamoxifen.Note 3 Cells arrested by thymidine (Gl/S), RO-3306 (G2), nocodazole (M).Note 4 Rat serum replaced FCS in cell culture medium.Note 5 Stable cell line expressing macroH2Al.l from a doxycycline-induced Tet-ON promoter.Note 6 Label-swap replica of (j), but only fixed for 5 min with formaldehyde.Note 7 Standard ChEP procedure includes RNase treatment, see Materials and Methods.
Georg Kustatscher et al Proteomics of a fuzzy organelle: interphase chromatin The EMBO Journal
ª 2014 The Authors The EMBO Journal Vol 33 | No 6 | 2014 651
Published online: February 16, 2014
within score windows. We described the result as a sigmoid func-
tion (Fig 3A, see Materials and Methods for details). In this way, we
integrate knowledge on proteins with similar scores into the proba-
bility of any given protein to have a chromatin function. This trans-
lation is robust and reproducible (Supplementary Fig S3). A
calibrated score of 0.8 for instance means that eight of 10 reference
proteins with this value have a reported chromatin function, thus
providing a probability for the function of this protein. We refer to
this value as interphase chromatin probability (ICP; Fig 3B, Supple-
mentary Table 1). ICPs provide a general annotation on how similar
a protein behaves experimentally to archetypal chromatin proteins.
We provide ICPs for 7635 human proteins and protein isoforms,
including the 5795 evaluation proteins (1823 proteins with literature
evidence linking them to chromatin and 3972 non-chromatin pro-
teins) and 1840 previously uncharacterized proteins. Proteins were
classified as “uncharacterized” based on absence of literature but
also had low GO coverage and weak domain-based prediction (Sup-
plementary Fig S4). Of the 1840 uncharacterized proteins described
in this study, 576 have a chromatin probability >0.5, indicating that
hundreds of chromatin components are presently still uncharacter-
ized. The large number of novel chromatin proteins is in line with a
recent report that used alternative technology to test more than 100
proteins and found 42 previously unknown chromatin components
(van Bemmel et al, 2013). ICPs integrate large-scale data for quanti-
tative gene function prediction and can help systematically fill cur-
rent annotation gaps.
ICPs are consistent with the function of protein domains
To validate ICPs, we performed several tests based on literature
knowledge and bioinformatics and finally applied the method to elu-
cidate cell cycle regulation of chromatin. As a first validation step,
we investigated the correlation between ICPs and the presence of
protein domains that have been linked to interphase chromatin
(Supplementary Fig S5). As expected, proteins with canonical chro-
matin domains (e.g., chromo, bromo, JmjC) invariably have high
ICPs. Conditional and regulated chromatin proteins such as tran-
scription factors with sequence-specific DNA-binding domains
indeed cover a broad range of ICPs. Proteins with a Ras domain
have no reported chromatin involvement and receive low ICPs. This
suggests that ICPs can capture a dynamic range of involvement in
chromatin.
ICPs capture diverse biological behavior of proteins
We next investigated whether ICPs accurately reflect the biological
behavior of well-described proteins and their complexes. Typical
chromatin-associated protein complexes such as MCM2-7 and
FACT have consistently high ICPs for all their subunits (Fig 4A).
In contrast, subunits with multiple functions correctly have differ-
ent ICP values from core subunits. This includes the MLL histone
methyltransferase subunits Dpy-30L (Xu et al, 2009) and HCF2
(Johnson et al, 1999; Fig 4A) and multiple NuRD components
(Supplementary Fig S6). Different isoforms of NuRD subunits with
redundant function receive similar ICPs, indicating large accuracy
of ICP values. Ribosomes, commonly found contaminants in bio-
chemical purifications, have low ICP values (Fig 4B). This indi-
cates that ICPs successfully integrate biological rather than
biochemical behavior. ICPs also match the dynamic chromatin
association of the condensin complex (Fig 4A). In interphase, con-
densin I subunits diffuse into the cytoplasm (very low ICP) and
condensin II subunits remain nuclear with a low chromatin affinity
(Gerlich et al, 2006; medium ICP). Common condensin subunits
A
B
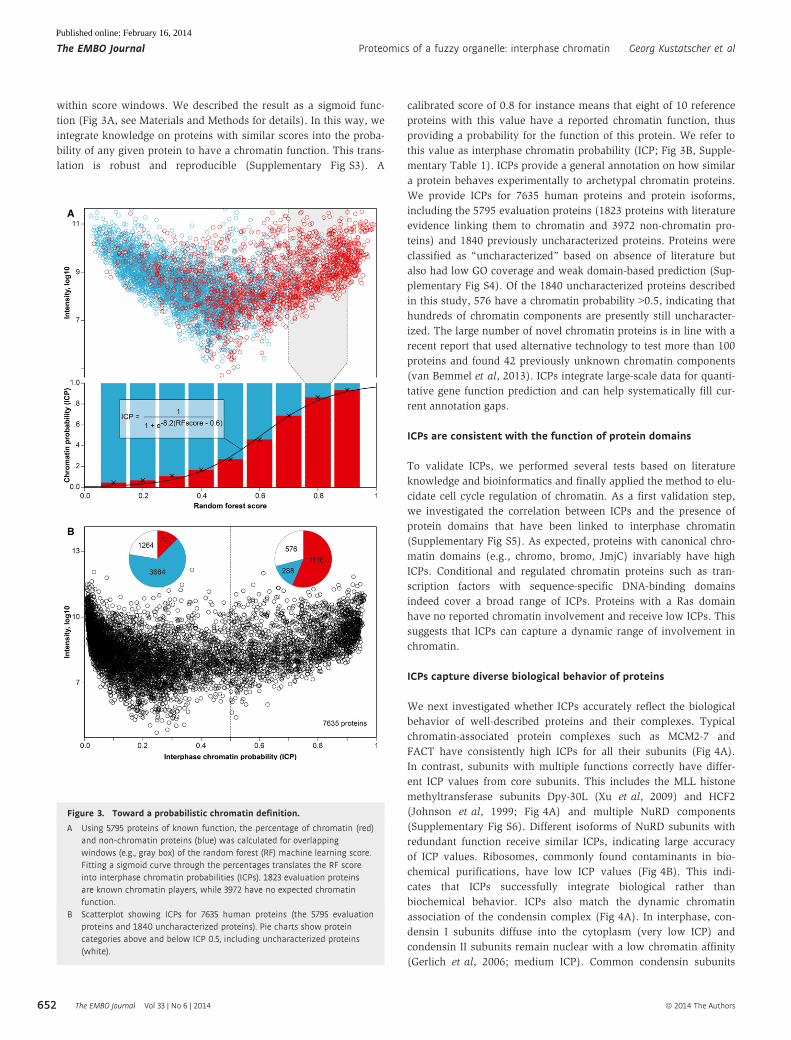
Figure 3. Toward a probabilistic chromatin definition.
A Using 5795 proteins of known function, the percentage of chromatin (red)and non-chromatin proteins (blue) was calculated for overlappingwindows (e.g., gray box) of the random forest (RF) machine learning score.Fitting a sigmoid curve through the percentages translates the RF scoreinto interphase chromatin probabilities (ICPs). 1823 evaluation proteinsare known chromatin players, while 3972 have no expected chromatinfunction.
B Scatterplot showing ICPs for 7635 human proteins (the 5795 evaluationproteins and 1840 uncharacterized proteins). Pie charts show proteincategories above and below ICP 0.5, including uncharacterized proteins(white).
The EMBO Journal Proteomics of a fuzzy organelle: interphase chromatin Georg Kustatscher et al
The EMBO Journal Vol 33 | No 6 | 2014 ª 2014 The Authors652
Published online: February 16, 2014
show an intermediate behavior. This is consistent with ICPs being
a parameter that describes the average behavior when multiple
pools are present. Similarly, Cdk1 has a low ICP (0.15) as its main
pool is bound to cytoplasmic cyclin B, while a minor fraction com-
petes with Cdk2 for nuclear cyclin A and E and acts on chromatin
(Santamar�ıa et al, 2007). Different from ribosomes, factors of ribo-
some biogenesis associate with pre-rRNA co-transcriptionally and
thus have some chromatin association. This is reflected in interme-
diate to high ICP values (Fig 4B). Interestingly, splicing factors
show a large spread from low to high ICP values. This distribution
is not random; all Sm and LSm proteins have low ICP values,
while SR-rich splicing factors, which can act co-transcriptionally
(Zhong et al, 2009), consistently have high ICP values (Fig 4C).
Similarly, ICPs allow distinguishing canonical from conditional
chromatin proteins. For example, SMAD and STAT transcription
factors are normally absent from chromatin due to their signal-
dependent nuclear localization and have consistently low ICPs
(Fig 4A). In conclusion, ICPs provide a quantitative annotation
that captures the subtle biological behavior of diverse proteins and
functions, rather than providing classical “all or nothing” scores to
distinguish between true and false positives.
ICPs as quantitative annotation of the multifunctional proteome
As a final test, we asked whether ICPs could identify predominantly
chromatin-based proteins among those 248 proteins in our dataset
that are both cytoplasmic and chromosomal according to the GO
database (Ashburner et al, 2000). ICPs can successfully reveal these
proteins’ main activities as shown by the examples in Fig 5. Looking
at the most extreme ICP values, 16 proteins with highest ICP are
well-described chromatin proteins, while 13 proteins with lowest
ICP have a main function elsewhere. Note that proteins with low
chromatin ICP are not indicating GO artifacts, for example septin
filaments interact with kinetochores during mitosis (Spiliotis et al,
2005; Zhu et al, 2008). This demonstrates that ICPs may help to
address one of the large problems of protein annotation. Protein
annotation databases are challenged by an increasing amount of
data on proteins leading to an accumulation of proteins with multi-
ple, apparently unrelated, annotations. For example, according to
GO, 40% of all human nuclear proteins are also found in the cyto-
plasm. Many of these proteins will be multifunctional. However,
increasingly sensitive analyses will decrease the value of protein
localization for function prediction, for example chromatin proteins
may be observed while they are translated in the cytoplasm. This
ultimately reduces the value of such annotations. Quantitative
protein ontologies, as suggested here, have the potential to solve
these issues by providing a probabilistic dimension to protein
annotations.
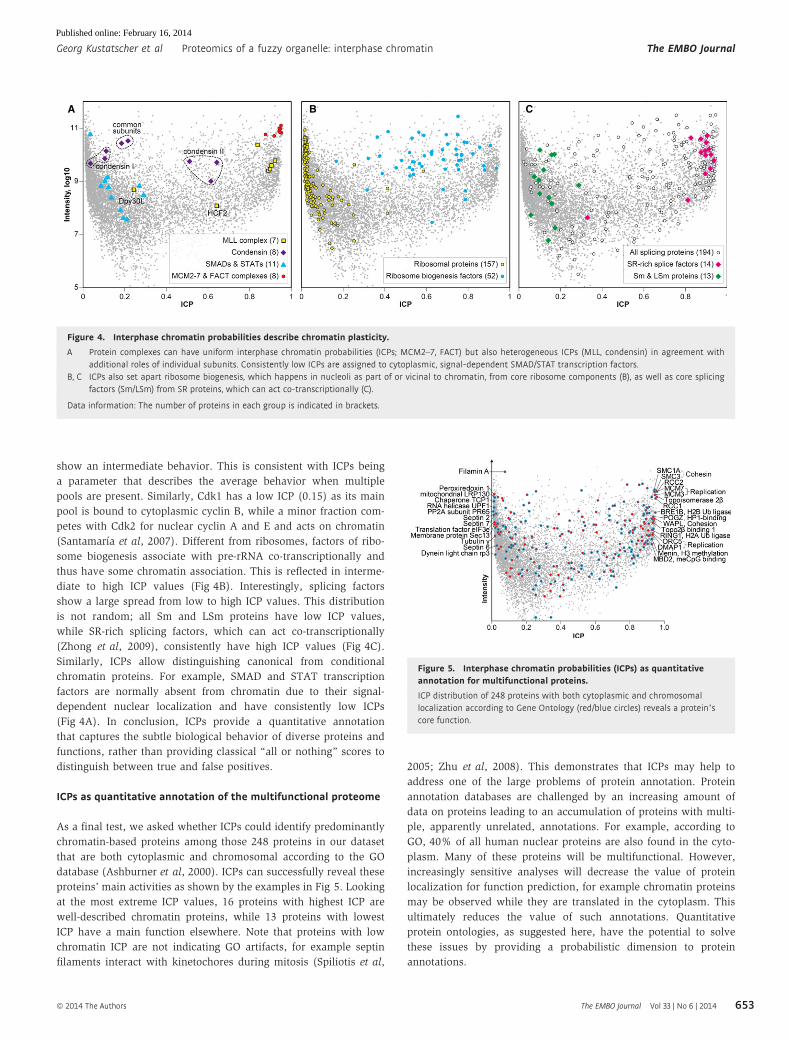
A B C
Figure 4. Interphase chromatin probabilities describe chromatin plasticity.
A Protein complexes can have uniform interphase chromatin probabilities (ICPs; MCM2–7, FACT) but also heterogeneous ICPs (MLL, condensin) in agreement withadditional roles of individual subunits. Consistently low ICPs are assigned to cytoplasmic, signal-dependent SMAD/STAT transcription factors.
B, C ICPs also set apart ribosome biogenesis, which happens in nucleoli as part of or vicinal to chromatin, from core ribosome components (B), as well as core splicingfactors (Sm/LSm) from SR proteins, which can act co-transcriptionally (C).
Data information: The number of proteins in each group is indicated in brackets.
Figure 5. Interphase chromatin probabilities (ICPs) as quantitativeannotation for multifunctional proteins.
ICP distribution of 248 proteins with both cytoplasmic and chromosomallocalization according to Gene Ontology (red/blue circles) reveals a protein’score function.
Georg Kustatscher et al Proteomics of a fuzzy organelle: interphase chromatin The EMBO Journal
ª 2014 The Authors The EMBO Journal Vol 33 | No 6 | 2014 653
Published online: February 16, 2014
ICPs as adjustable focus for Cdk-dependent chromatin regulation
ICPs could be used for guidance when looking for bona fide chro-
matin proteins. ICPs do not define specific chromatin functions of
individual proteins. Therefore, we envision ICPs as a form of
large-scale data-derived and quantitative GO term to allow focus-
ing other datasets onto chromatin function. We undertook two
studies to exemplify this. First, we analyzed changes in chromatin
composition driven by Cdk-dependent cell cycle progression
through S-phase (Fig 6A). Initiation and completion of DNA repli-
cation has a major impact on chromatin (Khoudoli et al, 2008),
but how core chromatin processes are cell cycle regulated in
somatic cells remains poorly understood. To address this question,
we conducted a quantitative proteomics study that took advantage
of an analogue-sensitive mutation in Cdk1 that we previously
established in wild-type (WT) and Cdk2-knockout chicken DT40
cells (Hochegger et al, 2007). This mutation allows the rapid and
highly specific inactivation of Cdk1 by the bulky ATP analogue
1NMPP1. Neither Cdk1 nor Cdk2 is required for S-phase progres-
sion, while inactivation of Cdk1 in Cdk2-knockout cells causes a
complete block of DNA replication initiation and S-phase progres-
sion. Accordingly, after 2 hours of 1NMPP1 treatment, we
observed an arrest in G1- and S-phase of the cell cycle only in
Cdk2-knockout cells, while Cdk2-expressing WT cells proceeded to
G2-phase (Fig 6A). Below, we will indicate the combination of
Cdk1 and Cdk2 as “Cdk.”
We compared ChEP chromatin obtained from cdk1as and
cdk1as/cdk2�/� cells 2 h after Cdk1 inactivation. Statistical analy-
sis of four independent experiments (including 2 label swaps)
identified 135 proteins that showed a significant change in SILAC
ratio among a total of 2402 proteins quantified in at least three
experiments (Supplementary Fig S7 and Supplementary Table 2).
Of these candidates, 114 had a human one-to-one ortholog (Sup-
plementary Tables 2 and 3). As expected, Orc1, but not other Orc
subunits, was strongly regulated by Cdk (M�endez et al, 2002) and
so was the cohesin complex. However, a large number of
cytoplasmic proteins were also affected by Cdk activity. This
hampered the selection of novel candidates that participate in
Cdk-regulated core chromatin processes based on SILAC ratios
alone. We therefore took advantage of ICPs to filter our dataset of
Cdk-regulated proteins according to their predicted functional
association with chromatin (Fig 6B and Supplementary Table 3).
We performed an in-depth protein network analysis using two dif-
ferent chromatin probabilities (Figs 6D and 7). A broad analysis
was performed with proteins of ICP at least 0.1, and a more strin-
gent filter was applied by using an ICP of 0.5. The low stringency
ICP 0.1 filter removed already 50 of the 114 candidate proteins,
most of which have no expected chromatin function (Fig 6C). This
provided a clearer view of a complex dataset that includes loosely
chromatin-associated processes such as NFjB and lymphocyte
BCR signaling, SMN complex, cytokinesis and kinetochore compo-
nents, as well as Cdk1 itself (Fig 7). The stringent filter provided
a network that closely focuses on core chromatin processes such
as chromatin modification, telomere maintenance, and nuclear
structural organization (Fig 6D). Both networks provide useful
insights into the cell cycle regulation of chromatin and reveal a
variety of novel proteins that appear to be regulated in a
Cdk-dependent manner.
ICPs pinpoint novel Cdk-regulated chromatin players
To demonstrate that we have indeed identified novel cell cycle-regu-
lated chromatin factors, we experimentally validated five novel can-
didates for cell cycle-regulated chromatin association. We chose
these candidates based on their combination of suggestive ICPs and
high SILAC ratios. One is a known chromatin protein, the myc tran-
scription regulator FUBP1 [ICP 0.62; reviewed in (Zhang & Chen,
2013)]. The PHF family protein PHF6 (ICP 0.93) is an uncharacter-
ized protein implicated in B€orjeson–Forssman–Lehmann syndrome
(Lower et al, 2002). Smek2 (ICP 0.65) is a regulatory subunit of PP4
with cytoplasmic and nuclear localization (Chowdhury et al, 2008).
Cdc20 is a regulatory subunit of the anaphase-promoting complex
(Yu, 2007) that has so far not been implicated to function on inter-
phase chromatin, but has a surprisingly high ICP (ICP 0.57) and
shows a strong Cdk-dependent change in the SILAC experiments.
We also included Cdk1 that has a low chromatin probability of 0.15,
but that still is likely to have some chromatin-associated functions
(Santamar�ıa et al, 2007). We confirmed Cdk-dependent chromatin
association of these proteins in human cells, before and after treat-
ment with the Cdk inhibitor roscovitine, by Triton extraction and
immunofluorescence. In each case, the candidate protein behaved
as predicted by the SILAC data, either enhancing or decreasing their
chromatin affinity after Cdk inhibition (Fig 8). In the case of PHF6,
we observed a sequestration of the protein in the nucleolus, and a
release onto the non-nucleolar chromatin after Cdk inhibition. In all
other cases, we observed a simple increase or decrease in chromatin
association following roscovitine treatment that corresponded with
the respective SILAC ratio in the proteomic dataset.
The observed Cdk-regulated chromatin association of these pro-
teins could point to a role in cell cycle progression. We tested this
hypothesis by analyzing the cell cycle profile following siRNA-medi-
ated depletion of Smek2, PHF6 and FUBP1 (Fig 9A). In all three
cases, we observed significant changes in the cell cycle profile after
72 hours of depletion of the candidates (Fig 9A). PHF6 knockdown
caused an increase in the G1 population, while Smek2 and FUBP1
depletion caused a significant change in the replicative proportion
of cells, suggesting functions for these proteins in S-phase progres-
sion (Fig 9B). Of these, the PP4 regulatory subunit Smek2 had the
most dramatic phenotypes, suggesting important novel roles in cell
cycle control. We then took advantage of the ICP resource to ana-
lyze a further set of five proteins with no known chromatin-asso-
ciated function that nevertheless showed ICP values > 0.5
(Fig 9D,E) and a Cdk-dependent change in the SILAC ChEP exper-
iments. The combination of high ICP and SILAC ratio could sug-
gest that some of these proteins play a role in interphase
progression. Indeed, we found significant cell cycle phenotypes
for two of these five genes after knockdown in RPE cells. Both
TMA16 and OGFOD1, both of which are largely uncharacterized
proteins with no known function in cell cycle progression and
chromatin biology (Saito et al, 2010; Wehner et al, 2010), show a
strong reduction in cells in S-phase after 72 hours of depletion,
suggesting the activation of cell cycle checkpoints in G1 and/or
G2 or a direct block in replication initiation.
Our approach to observe changes in chromatin association fol-
lowing Cdk inhibition does not allow us to distinguish between
direct Cdk-regulated targets and proteins that are indirectly affected
by changes in cell cycle progression. To test whether some of the
The EMBO Journal Proteomics of a fuzzy organelle: interphase chromatin Georg Kustatscher et al
The EMBO Journal Vol 33 | No 6 | 2014 ª 2014 The Authors654
Published online: February 16, 2014
A
D
B C
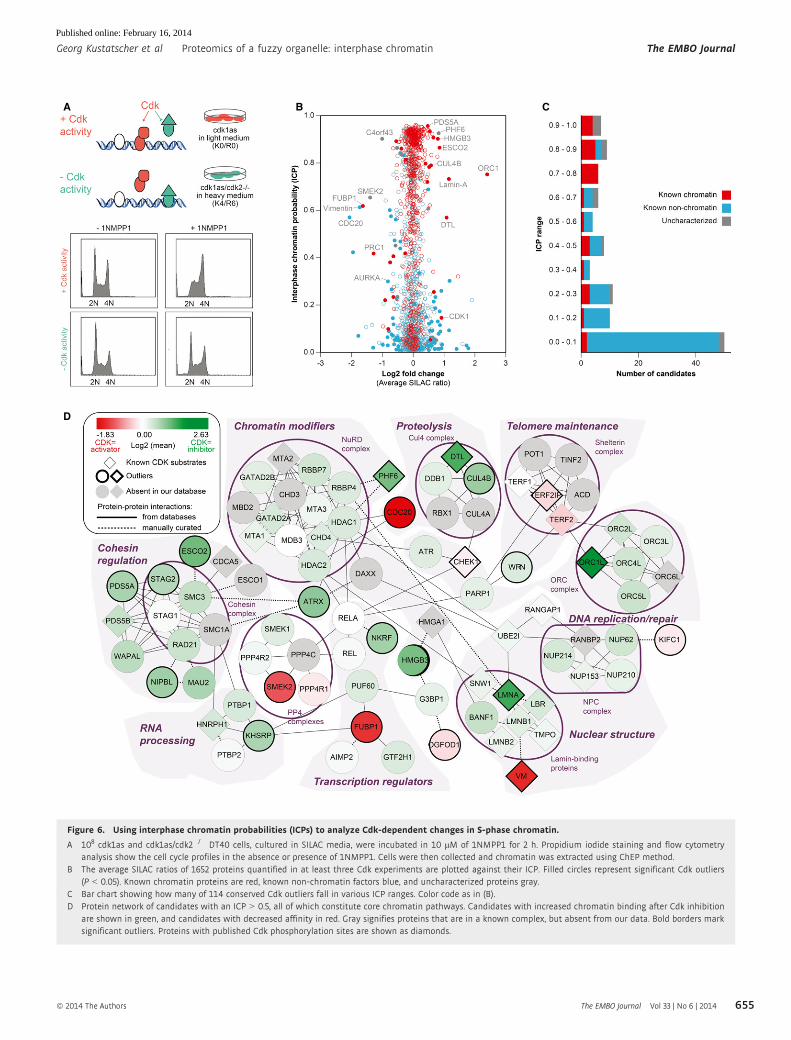
Figure 6. Using interphase chromatin probabilities (ICPs) to analyze Cdk-dependent changes in S-phase chromatin.
A 108 cdk1as and cdk1as/cdk2�/� DT40 cells, cultured in SILAC media, were incubated in 10 lM of 1NMPP1 for 2 h. Propidium iodide staining and flow cytometryanalysis show the cell cycle profiles in the absence or presence of 1NMPP1. Cells were then collected and chromatin was extracted using ChEP method.
B The average SILAC ratios of 1652 proteins quantified in at least three Cdk experiments are plotted against their ICP. Filled circles represent significant Cdk outliers(P < 0.05). Known chromatin proteins are red, known non-chromatin factors blue, and uncharacterized proteins gray.
C Bar chart showing how many of 114 conserved Cdk outliers fall in various ICP ranges. Color code as in (B).D Protein network of candidates with an ICP > 0.5, all of which constitute core chromatin pathways. Candidates with increased chromatin binding after Cdk inhibition
are shown in green, and candidates with decreased affinity in red. Gray signifies proteins that are in a known complex, but absent from our data. Bold borders marksignificant outliers. Proteins with published Cdk phosphorylation sites are shown as diamonds.
Georg Kustatscher et al Proteomics of a fuzzy organelle: interphase chromatin The EMBO Journal
ª 2014 The Authors The EMBO Journal Vol 33 | No 6 | 2014 655
Published online: February 16, 2014
candidate proteins that we identified in our SILAC screen are
directly targeted by Cdks, we generated recombinant bacterially
expressed proteins for PHF6, FUBP1, and Smek2 and subjected them
to in vitro kinase assays using recombinant Cdk2/cyclin A
complexes. PHF6 and Smek2 were readily phosphorylated in these
in vitro reactions (Fig 9F,G), while FUBP1 did not appear to be a
Cdk substrate (Fig 9H). We identified potential conserved Cdk phos-
phorylation sites in both PHF6 (S154 and S155) and Smek2 (S840)
that also were identified as phosphorylated residues in previous pro-
teomic screens (Hornbeck et al, 2012). Mutation of these serine
residues to alanine markedly reduced the Cdk-dependent phosphor-
ylation of these proteins, suggesting that these residues are directly
phosphorylated by Cdks (Fig 9F,G). We generated phospho-specific
antibodies to monitor the phosphorylation of Smek2 S840 phosphor-
ylation in cells. These antibodies were highly specific for S840 phos-
phorylation because they strongly cross-reacted with recombinant
WT Smek2, but not with the S840A mutant Smek2 after incubation
with ATP and Cdk2/cyclin A, as judged by immunoblotting (Fig 9I).
We then used this antibody to test the Cdk-dependent phosphoryla-
tion of Smek2 S840 in DT40 cells. We found that inhibition of Cdk1
in Cdk2-knockout cells, but not cells expressing Cdk2, caused a
rapid loss of signal in immunoblots probed with the phospho-
specific S840 Smek2 antibody (Fig 9J). These data suggest that
Smek2 is indeed a target of S-phase Cdk.
In summary, this proteomic screen in combination with ICP-
based filtering provides a validated resource of a large variety of
novel cell cycle-regulated chromatin-associated proteins. Our
approach led us to discover a novel functional interplay between
interphase Cdks and the chromatin association of a variety of novel
candidate proteins such as Cdk1 itself, the APC/C regulatory subunit
cdc20, the PP4 regulatory subunit Smek2, the helicase FUBP1, and
the PHD domain-containing zinc finger protein PHF6. We show
novel cell cycle phenotypes for the latter three candidates and find
that at least two of these proteins are direct targets of interphase
Cdks. We further used ICPs to highlight potential novel chromatin-
associated cell cycle regulators among five of the least characterized
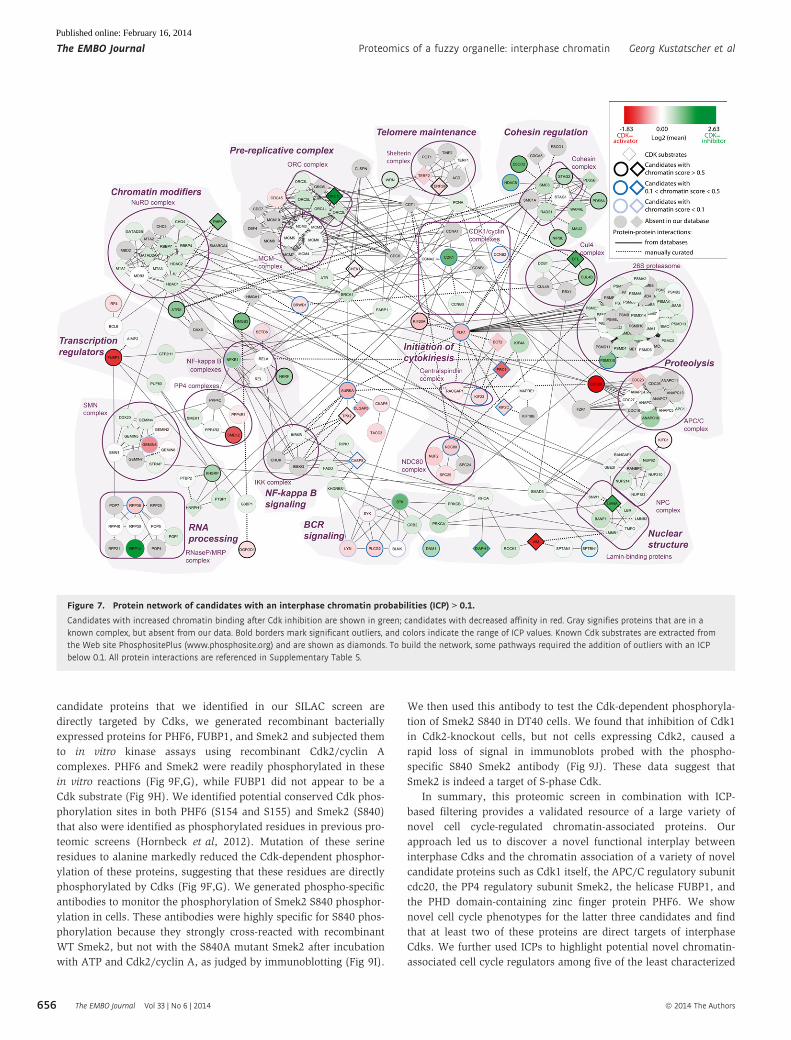
Figure 7. Protein network of candidates with an interphase chromatin probabilities (ICP) > 0.1.
Candidates with increased chromatin binding after Cdk inhibition are shown in green; candidates with decreased affinity in red. Gray signifies proteins that are in aknown complex, but absent from our data. Bold borders mark significant outliers, and colors indicate the range of ICP values. Known Cdk substrates are extracted fromthe Web site PhosphositePlus (www.phosphosite.org) and are shown as diamonds. To build the network, some pathways required the addition of outliers with an ICPbelow 0.1. All protein interactions are referenced in Supplementary Table 5.
The EMBO Journal Proteomics of a fuzzy organelle: interphase chromatin Georg Kustatscher et al
The EMBO Journal Vol 33 | No 6 | 2014 ª 2014 The Authors656
Published online: February 16, 2014
proteins in the SILAC candidate list. This approach is validated by
the discovery of novel cell cycle phenotypes following siRNA-medi-
ated depletion of two out of these five candidates, namely TMA16
and OGFOD1. Further studies are necessary to elucidate the exact
impact of this regulatory network on S-phase progression.
In a parallel study, we compared newly replicated chromatin
with post-replicative chromatin using quantitative proteomics
(Alabert et al, 2014). As expected, replication factors were
strongly enriched in new chromatin. However, among the other
candidates, we identified many non-canonical chromatin proteins,
as was the case for our Cdk study. Again, ICPs provided an
additional dimension that allowed us to focus on canonical
chromatin proteins. When cloning three candidates with high
ICPs and four with low ICPs, we found that all seven proteins
behaved as expected and ultimately characterized a novel
replication factor.
Conclusion
Subcellular structures in general and not just interphase chromatin
are highly interactive and dynamic and cannot fully be described as
static, isolated features. Instead of providing a simple binary cut-off
approach, we provide a means to filter datasets in a biologically
meaningful manner that catches the dynamic nature of many pro-
cesses. Our new concept has the potential to describe the plasticity
A
E
B C D
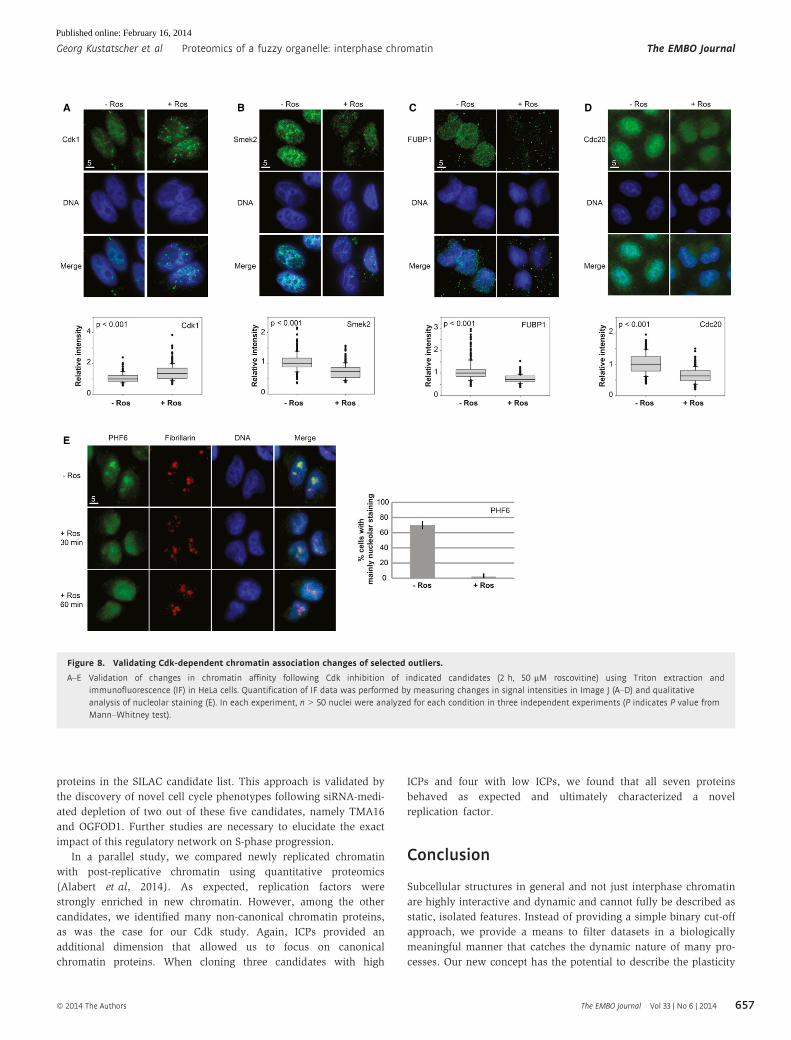
Figure 8. Validating Cdk-dependent chromatin association changes of selected outliers.
A–E Validation of changes in chromatin affinity following Cdk inhibition of indicated candidates (2 h, 50 lM roscovitine) using Triton extraction andimmunofluorescence (IF) in HeLa cells. Quantification of IF data was performed by measuring changes in signal intensities in Image J (A–D) and qualitativeanalysis of nucleolar staining (E). In each experiment, n > 50 nuclei were analyzed for each condition in three independent experiments (P indicates P value fromMann–Whitney test).
Georg Kustatscher et al Proteomics of a fuzzy organelle: interphase chromatin The EMBO Journal
ª 2014 The Authors The EMBO Journal Vol 33 | No 6 | 2014 657
Published online: February 16, 2014
A
D E
H I
J
F
G
B C
The EMBO Journal Proteomics of a fuzzy organelle: interphase chromatin Georg Kustatscher et al
The EMBO Journal Vol 33 | No 6 | 2014 ª 2014 The Authors658
Published online: February 16, 2014
of many biological structures by overcoming a number of limita-
tions in current proteomic approaches. First, biological classifiers
bypass the need for stringent biochemical purification and raise
organelle definition from physical association to biological co-
behavior. Next, the integration of many such classifiers into a prob-
abilistic output reflects the dynamic composition of organelles.
Probabilities could be valuable additions to public protein databas-
es, essentially complementing manual, qualitative annotations with
large-scale data-driven and quantitative information. In principle,
these could be automatically updated from incoming large-scale
experimental evidence. The resource of 7635 ICPs provided here
can immediately focus candidate lists on archetypal chromatin func-
tions and boost our understanding of chromatin-based processes as
our biological validation demonstrates. We envisage that our
approach can be applied to any organelle, compartment, or other
complex biological structure.
Materials and Methods
Cell culture, SILAC labeling, and treatments
Human cell lines were grown in DMEM-based medium free of argi-
nine and lysine (custom-made by AthenaES, Baltimore, MD, USA).
The medium was supplemented with 10% dialyzed fetal bovine
serum (Invitrogen), 0.2 mM arginine, and 0.79 mM lysine. For SI-
LAC labeling (Ong et al, 2002) of human cells, medium was supple-
mented with unlabeled amino acids (light label), with arginine:HCl,
13C6 (Cambridge Isotope Laboratories), and lysine:HCl, 4,4,5,5-d4
(Sigma) for the medium label, or with arginine:HCl 13C6, 15N4 and
lysine:HCl, 13C6, 15N2 (Sigma) for the heavy label. For biological
classifiers, cells were treated as described in Table 1. HeLa,
HEK293, and HepG2 cells were kind gifts from E. Schirmer,
I. Stancheva, and A. Ladurner, respectively. HeLa Tet-On cells
expressing a Flag- and HA-tagged version of macroH2A have been
described (Timinszky et al, 2009). Cdk1as and cdk1as/cdk2�/�
DT40 cells were cultured for six cell cycles in SILAC RPMI 1640
medium (Thermo Fisher Scientific, Bremen, Germany) containing
10% dialyzed fetal bovine serum (F0392; Sigma), 2 mM L-gluta-
mine, 0.1% b-mercaptoethanol, 100 U/ml penicillin, and 0.1 mg/ml
streptomycin. In light conditions, the media were supplemented
with 30 lg/ml L-arginine (Sigma) and 100 lg/ml L-lysine (Sigma)
and in heavy conditions with 30 lg/ml L-arginine:HCl (U-13C6) and
100 lg/ml L-lysine:2HCl (4,4,5,5-D4) (Cambridge Isotope Laborato-
ries). These cells were incubated at 39°C in a humidified cell culture
chamber with 5% CO2. 108 cells were treated with 10 lM of
1NMPP1 (gift from Dr. Hans Streicher, University of Sussex) for 2 h.
All cell lines were tested for full label incorporation and lack of
arginine to proline conversion. We routinely test our cell lines for
mycoplasma contamination.
Chromatin enrichment for proteomics (ChEP)
Typically, two 150-cm2 petri dishes of human cells were grown in
SILAC light and heavy medium, respectively. 108 DT40 cells were
used per experimental condition. Cells were washed with PBS, then
cross-linked in vivo with 1% formaldehyde in PBS for 10 min at
37°C, as for chromatin immunoprecipitation experiments (Solomon
et al, 1988). Cross-linking was stopped by the addition of glycine to
a final concentration of 0.25 M and incubation for 5 min at room
temperature (RT). Cells were rinsed with PBS, scraped off, and har-
vested by centrifugation in 50 ml PBS (5 min, 423 g). The pellets
were resuspended in 1 ml ice-cold cell lysis buffer (25 mM Tris, pH
7.4, 0.1% Triton X-100, 85 mM KCl; Roche protease inhibitors) and
transferred to 2-ml test tubes. They were homogenized by carefully
pipetting up and down with a 200-ll pipette tip. Lysed cells/nuclei
were pelleted in a bench-top centrifuge at 2300 g for 5 min at 4°C.
The supernatants (cytoplasm) were transferred to new tubes, and
relative protein concentrations of light and heavy SILAC samples
were estimated by Bradford assay. The nuclei pellets were resus-
pended in 500 ll cell lysis buffer containing 200 lg/ml RNase A
and incubated for 15 min at 37°C. Equal amounts of nuclei from
light and heavy SILAC samples were then pooled as estimated on
the basis of cytoplasmic extract quantitation. Nuclei were collected
by centrifugation at 2300 g for 10 min at 4°C. They were then resus-
pended in 500 ll of SDS buffer (50 mM Tris, pH 7.4, 10 mM EDTA,
4% SDS; Roche protease inhibitors) using hydrophobic pipette tips
and incubated for 10 min at RT. Next, 1.5 ml of urea buffer (10 mM
Tris, pH 7.4, 1 mM EDTA, 8 M urea) was added and mixed by
inverting the tube multiple times. Centrifugation in a table-top cen-
trifuge at full speed for 30 min (25°C) yielded a transparent, gel-like
pellet. Using hydrophobic pipette tips, the pellet was resuspended
again in 500 ll SDS buffer, mixed with 1.5 ml of urea buffer, and
centrifuged for 25 min at full speed (25°C). The pellet was washed
once more in 2 ml of SDS buffer. Finally, the pellet was covered
with 0.5 ml of storage buffer (10 mM Tris, pH 7.4, 1 mM EDTA,
25 mM NaCl, 10% glycerol; Roche protease inhibitors) and soni-
cated in ice water to solubilize chromatin completely. After a final
centrifugation step (30 min, full speed, 4°C), the amount of solubi-
lized chromatin in the supernatant was quantified by Bradford
assay. Formaldehyde cross-links were reversed by incubation with
SDS–PAGE loading buffer for 30 min at 98°C.
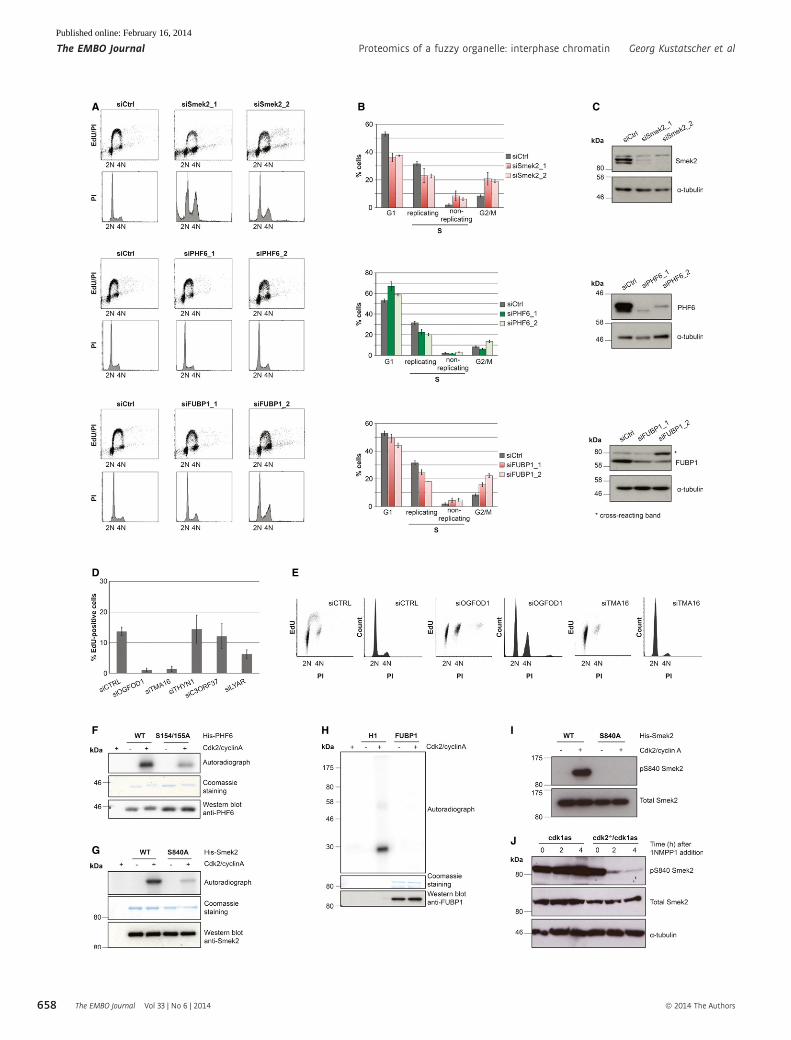
Figure 9. Cell cycle changes following depletion of candidate proteins and Cdk-dependent phosphorylation of Smek2 and PHF6.
A Propidium iodide (PI)/EdU staining and FACS analysis of HeLa cell lines after 72 hours of depletion with indicated siRNAs.B Quantification of FACS cell cycle analysis in (A) showing the mean value and standard deviation of three independent experiments.C Verification of siRNA depletion of PHF6, FUBP1, and Smek2 by immunoblotting.D Quantification of the EdU incorporating fraction of RPE cells following 72 hours of depletion with siRNA pools against the uncharacterized proteins with high
interphase chromatin probability (ICP) values (THYN1, ICP = 0.91; TMA16, ICP = 0.9; OGFOD1, ICP = 0.86; C3ORF37, ICP = 0.83; LYAR, ICP = 0.61).E FACS/PI histograms and EdU incorporation dot blots of cells 72 h after transfection with control, TMA16, and OGFOD1 siRNAs.F–H In vitro kinase assays with purified PHF6, Smek2, and FUBP1 and the indicated Smek2 and PHF6 mutant proteins.I Immunoblotting of recombinant WT and S840A Smek2 before and after incubation with ATP and Cdk2/cyclinA.J Immunoblotting of extracts of cdk1as and cdk2�/�/cdk1as DT40 cells at indicated time points following 1NMPP1 addition.
◀
Georg Kustatscher et al Proteomics of a fuzzy organelle: interphase chromatin The EMBO Journal
ª 2014 The Authors The EMBO Journal Vol 33 | No 6 | 2014 659
Published online: February 16, 2014
Preparation of other biochemical fractions
To prepare a nuclear lysate, cells were lysed using 0.1% Triton X-
100, nuclei were isolated by centrifugation through a 30% sucrose
cushion and homogenized using 1% SDS. A classic “chromatin
pellet” used as biochemical classifier by comparing it with our
improved method was prepared as described (Shiio et al, 2003).
Mass spectrometry and data processing
Protein mixtures were digested in-gel with trypsin (Shevchenko
et al, 2006), and peptides were fractionated by strong cation-
exchange chromatography (2.1 × 200 mm polysulfoethyl A column;
PolyLC, USA). Depending on the scale of the experiment, different
gradients from buffer A (5 mM KH2PO4, 10% acetonitrile, pH 3.0)
to 70% buffer B (1 M KCl in buffer A) were used. Peptide fractions
were desalted on C18 StageTips (Rappsilber et al, 2003) and ana-
lyzed by LC-MS/MS on an LTQ-Orbitrap or LTQ-Orbitrap Velos
(Thermo Fisher Scientific) as described (Ohta et al, 2010; Vagnarelli
et al, 2011; Samejima et al, 2012). Mass spectra were processed
using MaxQuant 1.3.0.5 (Cox & Mann, 2008; Cox et al, 2011) using
default settings, except that ratio count was set to 1, minimum pep-
tide length was set to 6, and only unique peptides were used for
quantitation. Data were searched against the Homo sapiens com-
plete proteome subset of the Uniprot database (UniProt Consortium,
2012), with canonical and isoform sequences downloaded on
13.07.2012. Chicken data were processed using the same MaxQuant
conditions except considering unique and razor peptides for quanti-
tation. They were searched against the Gallus gallus subset of Uni-
prot (complete proteome including unreviewed entries) downloaded
on 25.09.2012. Statistically significant outliers were determined
based on “Significance B” provided by the software Perseus 1.3.0.4
(www.perseus-framework.org), which takes protein intensities into
consideration.
Proteomics data deposition
The mass spectrometry proteomics data have been deposited to the
ProteomeXchange Consortium (http://proteomecentral.proteomex
change.org) via the PRIDE partner repository (Vizca�ıno et al, 2013)
with the dataset identifiers PXD000492 (Cdk experiments) and
PXD000493 (ICP classifier experiments).
Multiclassifier chromatin proteomics (machine learning)
Log2 SILAC ratios and intensities of 7635 human proteins detected
in some or all of our experiments (Supplementary Table 4) were
combined using machine learning, essentially as described (Ohta
et al, 2010). Here, the WEKA 3.6 implementation of RF (Breiman,
2001; Frank et al, 2004; Hall et al, 2009) was used via the KNIME
2.6.2 data analysis platform (Berthold et al, 2008). For this, the
Weka data mining integration (version 2.6.1.0034734) was installed
as a KNIME extension. First, a subset of 1068 proteins was manu-
ally defined as training proteins based on literature searches and
Uniprot annotations. Training proteins fall in two classes, having
either a reported function on chromatin (chromatin class) or a well-
characterized function elsewhere in the cell and no indication for a
chromatin-based activity (non-chromatin class). The RF algorithm
is trained on these proteins and then ranks all 7635 proteins using a
score from 0 to 1 depending on how similar they behave to the
chromatin or the non-chromatin class. Optimal classification was
achieved using RFs of 500 decision trees with unlimited tree depth
and four random features. Under these conditions, 99.6% of
training proteins were correctly classified (out-of-bag error 0.099).
Training proteins were then cross-validated 100-fold using KNIME’s
X-partitioner node with stratified sampling. We manually annotated
a further 4727 proteins into non-chromatin and chromatin classes,
the latter including functional subcategories (“Lab internal cate-
gory” in Supplementary Table 1). These proteins, together with the
cross-validated 1068 training proteins, constitute our 5795 “evalua-
tion proteins,” which we used to test RF performance based on
ROC curves, yielding an area under the curve of 0.86 (please note
that this is different from the ROC-like curves in Fig 2D, which
show absolute protein numbers rather than true/false positive rates,
thus illustrating that combining experiments also increases the
number of proteins for which data are available). We provide our
machine learning workflow as a supplementary KNIME archive file.
Application of this workflow reproduces non-cross-validated RF
scores (Supplementary Table 1) directly from Supplementary
Table 4.
Translation of RF scores into interphase chromatinprobabilities (ICPs)
Integration of experiments by MCCP provides a machine learning
score for all 7635 proteins (Supplementary Table 1), including the
5795 evaluation proteins and 1840 uncharacterized proteins. This
score basically ranks the proteins according to how much their
behavior resembles that of chromatin training proteins in the dif-
ferent experiments. The RF score has no meaning on its own, that
is, outside the context of this study. To “translate” it into probabil-
ities for chromatin function, we looked at the 5795 evaluation pro-
teins that can be classified as chromatin or non-chromatin. We
first calculated the percentage of chromatin proteins within nine
overlapping ranges of RF score (0–0.2, 0.1–0.3, …) as shown by
the bar chart in Fig 3A (the gray box corresponds to the RF score
window 0.7–0.9). A sigmoid curve was then fitted through these
percentage values, using SigmaPlot [Systat Software, USA) and the
formula ICP = 1/(1 + exp(�a*RFscore + b)], where a and b are
the parameters to be fitted. The fitted curve (adjusted R2 = 0.99,
Fig 3A) was used to translate the RF score of all 7635 proteins in
our dataset into an ICP. The number and size of RF score windows
was shown to have very little impact on the final ICP values (Sup-
plementary Fig S3). We therefore chose the simplest of the tested
scenarios.
Gene ontology analysis
Annotations for GO terms chromosome (GO:0005694) and cyto-
plasm (GO:0005737) were downloaded from the GO (Ashburner
et al, 2000) database using QuickGO (Binns et al, 2009). Only quali-
fiers contributes to, colocalizes with and none were considered. For
the analysis of uncharacterized proteins, the human GO associations
file was downloaded from www.geneontology.org and processed
using KNIME, considering the same qualifiers and only experimen-
tal evidence codes.
The EMBO Journal Proteomics of a fuzzy organelle: interphase chromatin Georg Kustatscher et al
The EMBO Journal Vol 33 | No 6 | 2014 ª 2014 The Authors660
Published online: February 16, 2014
Domain analysis
Information about protein domains was retrieved by querying Pfam
(Punta et al, 2012) with the sequences of all 7635 proteins in this
study. “Gathering threshold” was selected as cut-off; PfamB
domains were not included.
Identification of human–chicken orthologs
Orthologs were identified by querying ENSEMBL (Flicek et al, 2013)
using the BioMart (Kasprzyk, 2011) data mining tool. We retrieved
all chicken orthologs with homology type “one2one” from the
Homo sapiens genes (GRCh37.p8) dataset of the Ensembl Genes 68
database. One-to-one orthologs that could not be unambiguously
matched in this way were assigned manually based on sequence
analysis. For this, the chicken protein sequence was compared to
human protein sequence databases using the BLASTP tool (http://
blast.ncbi.nlm.nih.gov). A human ortholog was assigned if the
query sequence covered at least 50% of the human protein
sequence and shared at least 50% identity.
Protein interaction map
The interactome was built from human protein–protein interaction
(PPI) databases. All reproducible Cdk-dependent outliers with an
ICP above 0.1 were considered to build a PPI map using the soft-
ware Cytoscape 2.8.3 (Smoot et al, 2011). Human PPIs from
databases were retrieved using the plugin MiMI (Gao et al, 2009).
Small-scale studies were considered and in vivo interactions or PPIs
from direct complexes were displayed. The PPI map was comple-
mented using data obtained from STRING (Franceschini et al, 2013)
using experimental data and 0.4 confidence as parameters. Some
PPIs were curated manually, and references are listed in Supplemen-
tary Table 5. Only outliers with protein interactions were shown in
the protein interaction map and outliers with an ICP below 0.1 were
added if they were shown to be a part of the indicated pathways.
CDK substrates were downloaded from the database Phosphosite-
Plus (Hornbeck et al, 2012; www.phosphosite.org).
Immunofluorescence
To analyze Cdk regulation of FUBP1, PHF6, and Cdk1, asynchro-
nous HeLa cells were treated for 2 h with 50 lM of roscovitine
(Sigma). Cells were then treated with Triton X-100 according to the
following conditions: PHF6, 0.1% Triton X-100 for 2 min; FUBP1,
0.1% for 1 min; Cdk1 0.2% for 1 min. Next, cells were fixed with
3.7% formaldehyde (Sigma) in PBS for 10 min. Cdc20-GFP HeLa
BAC cells [gift from Tony Hyman (Poser et al, 2008)] and wild-type
HeLa cells (to analyze Smek2) were synchronized in S-phase by
adding 2 mM thymidine for 16–18 h, then released for 1 h before
treatment with 50 lM roscovitine for 2 h. Next, S-phase cells were
treated with 0.5% (Cdc20) or 0.2% (Smek2) Triton X-100 for 1 min,
then fixed with 3.7% formaldehyde in PBS for 10 min. Cells were
permeabilized in PBS–0.1% NP-40 for 10 min. Cells were then
blocked in 3% BSA for 30 min and probed with primary antibodies
for 1 h. Slides were rinsed in PBS and probed with Alexa Fluor sec-
ondary antibodies (Invitrogen) for 1 h. Slides were then rinsed in
PBS, and coverslips were mounted using ProLong Gold mounting
solution containing DAPI (Life Technologies). Smek2 and PHF6 rab-
bit polyclonal antibodies were purchased from Sigma, GFP rabbit
polyclonal serum (to detect Cdc20-GFP) from Life Technologies, and
FUBP1 rabbit polyclonal and fibrillarin and Cdk1 mouse monoclonal
antibodies from Abcam.
Images were acquired on a microscope (DeltaVision) equipped
with a UPLS Apochromat NA 1.40, 100× oil immersion objective
(Olympus), standard filter sets (excitation 360/40, 490/20, and 555/
28; emission 457/50, 528/38, and 617/40), and a camera (Cool-
SNAP HQ2; Photometrics). Images were obtained in softWoRx
software (version 3.7.1) and exported as Photoshop (Adobe) files.
For quantitative data, DeltaVision files were imported into Ima-
geJ. In the DAPI channel, the nucleus was highlighted by adjusting
the threshold and the obtained regions of interest were reported to
the FITC channel to measure the mean gray value. Data were then
exported to Sigma Plot 12.0 (Systat Software), and after background
subtraction, relative intensities were determined as a ratio relative
to intensities measured in control cells and a box plot displayed the
results.
Flow cytometry
To deplete Smek2, PHF6, or FUBP1, HeLa cells were transfected
with 10 nM of siRNA using Lipofectamine RNAimax (Invitrogen)
for 72 h. RPE cells were transfected with siRNA pool (10 nM of each
siRNA) targeted to OGFOD1, TMA16, C3ORF37, LYAR, and THYN1
for 72 h. Knockdown experiments were carried out with the follow-
ing siRNA sequences:
5′-GCAUGAUAAAGCUCAAAUATT-3′ (s38848; Ambion. siPHF6_1)
and
5′-CGCAUUUCUUGAGACUUAATT-3′ (SI00143248; Qiagen, siPHF6_2)
for PHF6;
5′-GGAUUACAGGAGACCCAUATT-3′ (s16966; Ambion, siFUBP1_1)
and
5′-CAUACAACCCUGCACCUUATT-3′ (SI04263147; Qiagen, siFUBP1_2)
for FUBP1;
5′-CCAUCUAUAUUGCGUAGUATT-3′ (s32915, Ambion, siSmek2_1)
and
5′-AGAAGCUCAGCAGAGUGAUTT-3′ (Qiagen, siSmek2_2) for
Smek2;
On-targetplus SmartPool (L-021197-01; Thermo Scientific
Dharmacon) for OGFOD1;
5′-GAGCAGAUUGAGUUACAUATT-3′ (s230546; Ambion),
5′-CCAUCCAUAUAGUAGAAAATT-3′ (s230547; Ambion) and
5′-GUGAACUAAUUGAAAGGUATT-3′ (s230545; Ambion) for
TMA16;
5′-CUUCAUCUAUUUUCCUCAATT-3′ (s32441; Ambion),
5′-CUGUCGUAGUGAUACCGUATT-3′ (s32442; Ambion) and
5′-UCGACUUGGUGGUCAAAAATT-3′ (s32443; Ambion) for
C3ORF37;
5′-GCAUAAGUGAAGAUCAGAATT-3′ (s31155; Ambion),
5′-CAUUGACUGCGGUAAAGAUTT-3′ (s31156; Ambion) and
5′-CAGUCAAUAAGGAACAGGATT-3′ (s31157; Ambion) for
LYAR;
On-targetplus SmartPool (L-020704-02; Thermo Scientific
Dharmacon) for THYN1.
AllStars Negative control from Qiagen (Cat.1027281) was used as
a negative control. Smek2 polyclonal rabbit antibody (Abcam) was
Georg Kustatscher et al Proteomics of a fuzzy organelle: interphase chromatin The EMBO Journal
ª 2014 The Authors The EMBO Journal Vol 33 | No 6 | 2014 661
Published online: February 16, 2014

used to check siRNA efficiency by western blot, and FUBP1 and
PHF6 antibodies were the same used in immunofluorescence experi-
ments. a-Tubulin was used as loading control and detected with
a-tubulin mouse monoclonal antibody from Abcam. To analyze rep-
licating cells, 10 lM of EdU was added to the media for 1 h, and
then the cells were collected and fixed with 70% ethanol. Cells were
centrifuged at 380 g for 5 min, rinsed twice with PBS containing 3%
BSA (BSA/PBS), and EdU-labeled DNA was stained according to the
manufacturer’s protocol (Click-iT EdU Alexa Fluor 647 Imaging kit;
Invitrogen). The cells were then washed twice with PBS/BSA and
resuspended in BSA/PBS solution containing 150 lg/ml RNase A
and 5 lg/ml propidium iodide (PI). Cells were then analyzed for
DNA content using a flow cytometer (FACSCanto; BD) and FACSDi-
va software (BD) to plot PI area versus cell counts and EdU staining
intensity versus PI staining. The different cell cycle phases were
gated using FACSDiva software, and measurements were exported
to Microsoft Excel.
Kinase assay
PHF6, FUBP1, and Smek2 cDNAs were obtained from mRNA iso-
lated from HeLa cells by RT–PCR (SuperScript III One-Step RT-
PCR system; Life Technologies) and cloned into a His-tag Gate-
way bacterial expression vector (a gift from Dr. Stephan Geley,
University of Innsbruck, Austria). Cdk sites were modified using
GeneArt site-directed mutagenesis kit (Life Technologies). Recom-
binant proteins were expressed in Rosetta bacteria, then purified
with Ni-NTA beads (Qiagen) following the manufacturer’s instruc-
tions. Next, purified recombinant proteins were incubated with
Cdk2/cyclin A (a gift from Dr. Julian Gannon, CRUK Clare Hall,
UK) for 20 min at 37°C in kinase buffer (50 mM MOPS pH 7.5,
5 mM MgCl2, 0.4 mM EDTA, 0.4 mM EGTA, 25 lM ATP, and
0.003 MBq c-32P-ATP). The reaction was stopped by adding
the SDS-PAGE loading buffer and was analyzed by western blot
and autoradiography. Polyclonal rabbit phospho-S840 Smek2
antibody was generated by Eurogentec, Belgium.
Supplementary information for this article is available online:
http://emboj.embopress.org
AcknowledgementsWe thank Claus Sørensen for DNA damage samples, Flavia de Lima Alves and
Lauri Peil for assistance with mass spectrometric analyses Ina Poser and
Anthony Hyman for sharing the Cdc20 BAC cell line, Eric Schirmer for critical
reading of the manuscript, and the PRIDE team for help with data deposition.
The Wellcome Trust generously supported this work through a Senior
Research Fellowship to JR (084229), two Wellcome Trust Centre Core Grants
(077707, 092076), and an instrument grant (091020). GK was supported by a
FEBS Long-Term fellowship. NH and HH were supported by a CRUK senior
research fellowship (C28206/A14499).
Author contributionsGK and JR conceived the ICP analysis and biological classifiers. GK conducted
informatics analyses using data acquired and manually annotated by GK, CF,
and KLHW, all of this with input from JCBW. NH, GK, JR, and HH designed and
conducted the CDK proteomics experiments. NH and HH designed follow-up
experiments that were conducted by NH. HH and JR supervised research. GK,
NH, HH, and JR wrote the manuscript with input from all authors.
Conflict of interestThe authors declare that they have no conflict of interest.
References
Alabert C, Bukowski-Wills JC, Lee SB, Kustatscher G, Nakamura K, de Lima
Alves F, Menard P, Mejlvang J, Rappsilber J, Groth A (2014) Nascent
chromatin capture proteomics determines chromatin dynamics during
DNA replication and identifies unknown fork components. Nat Cell Biol.
DOI: 10.1038/ncb2918
Andersen JS, Wilkinson CJ, Mayor T, Mortensen P, Nigg EA, Mann M (2003)
Proteomic characterization of the human centrosome by protein
correlation profiling. Nature 426: 570 – 574
Ashburner M, Ball CA, Blake JA, Botstein D, Butler H, Cherry JM, Davis AP,
Dolinski K, Dwight SS, Eppig JT, Harris MA, Hill DP, Issel-Tarver L, Kasarskis
A, Lewis S, Matese JC, Richardson JE, Ringwald M, Rubin GM, Sherlock G
(2000) Gene ontology: tool for the unification of biology. The Gene
Ontology Consortium. Nat Genet 25: 25 – 29
van Bemmel JG, Filion GJ, Rosado A, Talhout W, de Haas M, van Welsem T,
van Leeuwen F, van Steensel B (2013) A network model of the molecular
organization of chromatin in Drosophila. Mol Cell 49: 759 – 771
Berthold MR, Cebron N, Dill F, Gabriel TR, K€otter T, Meinl T, Ohl P, Sieb C,
Thiel K, Wiswedel B (2008) KNIME: the Konstanz information miner. In
Data Analysis, Machine Learning and Applications. Studies in Classification,
Data Analysis, and Knowledge Organization, Preisach C, Burkhardt H,
Schmidt-Thieme L, Reinhold Decker R (eds), Vol. V, pp 319 – 326. Berlin,
Heidelberg: Springer.
Binns D, Dimmer E, Huntley R, Barrell D, O’Donovan C, Apweiler R (2009)
QuickGO: a web-based tool for gene ontology searching. Bioinformatics 25:
3045 – 3046
Breiman L (2001) Random forests. Mach Learn 45: 5 – 32
Chowdhury D, Xu X, Zhong X, Ahmed F, Zhong J, Liao J, Dykxhoorn DM,
Weinstock DM, Pfeifer GP, Lieberman J (2008) A PP4-phosphatase complex
dephosphorylates gamma-H2AX generated during DNA replication. Mol
Cell 31: 33 – 46
Cox J, Mann M (2008) MaxQuant enables high peptide identification rates,
individualized p.p.b.-range mass accuracies and proteome-wide protein
quantification. Nat Biotechnol 26: 1367 – 1372
Cox J, Neuhauser N, Michalski A, Scheltema RA, Olsen JV, Mann M (2011)
Andromeda: a peptide search engine integrated into the MaxQuant
environment. J Proteome Res 10: 1794 – 1805
D�ejardin J, Kingston RE (2009) Purification of proteins associated with
specific genomic Loci. Cell 136: 175 – 186
Dunkley TP, Watson R, Griffin JL, Dupree P, Lilley KS (2004) Localization of
organelle proteins by isotope tagging (LOPIT). Mol Cell Proteomics 3:
1128 – 1134
Dutkowski J, Kramer M, Surma MA, Balakrishnan R, Cherry JM, Krogan NJ,
Ideker T (2013) A gene ontology inferred from molecular networks. Nat
Biotechnol 31: 38 – 45
Flicek P, Ahmed I, Amode MR, Barrell D, Beal K, Brent S, Carvalho-Silva D,
Clapham P, Coates G, Fairley S, Fitzgerald S, Gil L, Garc�ıa-Gir�on C,
Gordon L, Hourlier T, Hunt S, Juettemann T, K€ah€ari AK, Keenan S,
Komorowska M et al (2013) Ensembl 2013. Nucleic Acids Res 41:
D48 –D55
Foster LJ, de Hoog CL, Zhang Y, Xie X, Mootha VK, Mann M (2006) A
mammalian organelle map by protein correlation profiling. Cell 125:
187 – 199
The EMBO Journal Proteomics of a fuzzy organelle: interphase chromatin Georg Kustatscher et al
The EMBO Journal Vol 33 | No 6 | 2014 ª 2014 The Authors662
Published online: February 16, 2014
Franceschini A, Szklarczyk D, Frankild S, Kuhn M, Simonovic M, Roth A, Lin J,
Minguez P, Bork P, von Mering C, Jensen LJ (2013) STRING v9.1:
protein-protein interaction networks, with increased coverage and
integration. Nucleic Acids Res 41: D808 –D815
Frank E, Hall M, Trigg L, Holmes G, Witten IH (2004) Data mining in
bioinformatics using Weka. Bioinformatics 20: 2479 – 2481
Gao J, Ade AS, Tarcea VG, Weymouth TE, Mirel BR, Jagadish HV, States DJ
(2009) Integrating and annotating the interactome using the MiMI plugin
for cytoscape. Bioinformatics 25: 137 – 138
Gerlich D, Hirota T, Koch B, Peters JM, Ellenberg J (2006) Condensin I
stabilizes chromosomes mechanically through a dynamic interaction in
live cells. Curr Biol 16: 333 – 344
Hall M, Frank E, Holmes G, Pfahringer B, Reutemann P, Witten IH (2009) The
WEKA data mining software: an update. SIGKDD Explor 11: 10 – 18
Hochegger H, Dejsuphong D, Sonoda E, Saberi A, Rajendra E, Kirk J, Hunt
T, Takeda S (2007) An essential role for Cdk1 in S phase control is
revealed via chemical genetics in vertebrate cells. J Cell Biol 178:
257 – 268
Hornbeck PV, Kornhauser JM, Tkachev S, Zhang B, Skrzypek E, Murray B,
Latham V, Sullivan M (2012) PhosphoSitePlus: a comprehensive resource
for investigating the structure and function of experimentally determined
post-translational modifications in man and mouse. Nucleic Acids Res 40:
D261 –D270
Johnson KM, Mahajan SS, Wilson AC (1999) Herpes simplex virus
transactivator VP16 discriminates between HCF-1 and a novel family
member, HCF-2. J Virol 73: 3930 – 3940
Kasprzyk A (2011) BioMart: driving a paradigm change in biological data
management. Database (Oxford) 2011: bar049
Khoudoli GA, Gillespie PJ, Stewart G, Andersen JS, Swedlow JR, Blow JJ (2008)
Temporal profiling of the chromatin proteome reveals system-wide
responses to replication inhibition. Curr Biol 18: 838 – 843
Lower KM, Turner G, Kerr BA, Mathews KD, Shaw MA, Gedeon AK, Schelley
S, Hoyme HE, White SM, Delatycki MB, Lampe AK, Clayton-Smith J,
Stewart H, van Ravenswaay CM, de Vries BB, Cox B, Grompe M,
Ross S, Thomas P, Mulley JC et al (2002) Mutations in PHF6 are
associated with B€orjeson-Forssman-Lehmann syndrome. Nat Genet 32:
661 – 665
M�endez J, Zou-Yang XH, Kim SY, Hidaka M, Tansey WP, Stillman B (2002)
Human origin recognition complex large subunit is degraded by
ubiquitin-mediated proteolysis after initiation of DNA replication. Mol Cell
9: 481 – 491
Mootha VK, Bunkenborg J, Olsen JV, Hjerrild M, Wisniewski JR, Stahl E, Bolouri
MS, Ray HN, Sihag S, Kamal M, Patterson N, Lander ES, Mann M (2003)
Integrated analysis of protein composition, tissue diversity, and gene
regulation in mouse mitochondria. Cell 115: 629 – 640
Ohta S, Bukowski-Wills JC, Sanchez-Pulido L, Alves Fde L, Wood L, Chen ZA,
Platani M, Fischer L, Hudson DF, Ponting CP, Fukagawa T, Earnshaw WC,
Rappsilber J (2010) The protein composition of mitotic chromosomes
determined using multiclassifier combinatorial proteomics. Cell 142:
810 – 821
Ong SE, Blagoev B, Kratchmarova I, Kristensen DB, Steen H, Pandey A, Mann
M (2002) Stable isotope labeling by amino acids in cell culture, SILAC, as
a simple and accurate approach to expression proteomics. Mol Cell
Proteomics 1: 376 – 386
Poser I, Sarov M, Hutchins JR, H�erich�e JK, Toyoda Y, Pozniakovsky A, Weigl
D, Nitzsche A, Hegemann B, Bird AW, Pelletier L, Kittler R, Hua S,
Naumann R, Augsburg M, Sykora MM, Hofemeister H, Zhang Y, Nasmyth
K, White KP et al (2008) BAC TransgeneOmics: a high-throughput
method for exploration of protein function in mammals. Nat Methods 5:
409 –415
Punta M, Coggill PC, Eberhardt RY, Mistry J, Tate J, Boursnell C, Pang N,
Forslund K, Ceric G, Clements J, Heger A, Holm L, Sonnhammer EL, Eddy
SR, Bateman A, Finn RD (2012) The Pfam protein families database.
Nucleic Acids Res 40: D290 –D301
Rappsilber J, Ishihama Y, Mann M (2003) Stop and go extraction tips for
matrix-assisted laser desorption/ionization, nanoelectrospray, and LC/MS
sample pretreatment in proteomics. Anal Chem 75: 663 – 670
Saito K, Adachi N, Koyama H, Matsushita M (2010) OGFOD1, a member of
the 2-oxoglutarate and iron dependent dioxygenase family, functions in
ischemic signaling. FEBS Lett 584: 3340 – 3347
Samejima K, Samejima I, Vagnarelli P, Ogawa H, Vargiu G, Kelly DA, de Lima
Alves F, Kerr A, Green LC, Hudson DF, Ohta S, Cooke CA, Farr CJ, Rappsilber
J, Earnshaw WC (2012) Mitotic chromosomes are compacted laterally by
KIF4 and condensin and axially by topoisomerase IIalpha. J Cell Biol 199:
755 – 770
Santamar�ıa D, Barri�ere C, Cerqueira A, Hunt S, Tardy C, Newton K, C�aceres JF,
Dubus P, Malumbres M, Barbacid M (2007) Cdk1 is sufficient to drive the
mammalian cell cycle. Nature 448: 811 – 815
Schirmer EC, Florens L, Guan T, Yates JR III, Gerace L (2003) Nuclear
membrane proteins with potential disease links found by subtractive
proteomics. Science 301: 1380 – 1382
Shevchenko A, Tomas H, Havlis J, Olsen JV, Mann M (2006) In-gel digestion
for mass spectrometric characterization of proteins and proteomes. Nat
Protoc 1: 2856 – 2860
Shiio Y, Eisenman RN, Yi EC, Donohoe S, Goodlett DR, Aebersold R (2003)
Quantitative proteomic analysis of chromatin-associated factors. J Am Soc
Mass Spectrom 14: 696 – 703
Smoot ME, Ono K, Ruscheinski J, Wang PL, Ideker T (2011) Cytoscape 2.8:
new features for data integration and network visualization.
Bioinformatics 27: 431 – 432
Solomon MJ, Larsen PL, Varshavsky A (1988) Mapping protein-DNA
interactions in vivo with formaldehyde: evidence that histone H4 is
retained on a highly transcribed gene. Cell 53: 937 – 947
Spiliotis ET, Kinoshita M, Nelson WJ (2005) A mitotic septin scaffold required
for Mammalian chromosome congression and segregation. Science 307:
1781 – 1785
Timinszky G, Till S, Hassa PO, Hothorn M, Kustatscher G, Nijmeijer B,
Colombelli J, Altmeyer M, Stelzer EH, Scheffzek K, Hottiger MO, Ladurner
AG (2009) A macrodomain-containing histone rearranges
chromatin upon sensing PARP1 activation. Nat Struct Mol Biol 16:
923 – 929
UniProt Consortium (2012) Reorganizing the protein space at
the Universal Protein Resource (UniProt). Nucleic Acids Res 40:
D71 –D75
Vagnarelli P, Ribeiro S, Sennels L, Sanchez-Pulido L, de Lima Alves F, Verheyen
T, Kelly DA, Ponting CP, Rappsilber J, Earnshaw WC (2011) Repo-Man
coordinates chromosomal reorganization with nuclear envelope
reassembly during mitotic exit. Dev Cell 21: 328 – 342
Vizca�ıno JA, Cot�e RG, Csordas A, Dianes JA, Fabregat A, Foster JM, Griss J, Alpi
E, Birim M, Contell J, O’Kelly G, Schoenegger A, Ovelleiro D, P�erez-Riverol Y,
Reisinger F, R�ıos D, Wang R, Hermjakob H (2013) The PRoteomics
IDEntifications (PRIDE) database and associated tools: status in 2013.
Nucleic Acids Res 41: D1063 –D1069
Wehner KA, Sch€utz S, Sarnow P (2010) OGFOD1, a novel modulator of
eukaryotic translation initiation factor 2alpha phosphorylation and the
cellular response to stress. Mol Cell Biol 30: 2006 – 2016
Georg Kustatscher et al Proteomics of a fuzzy organelle: interphase chromatin The EMBO Journal
ª 2014 The Authors The EMBO Journal Vol 33 | No 6 | 2014 663
Published online: February 16, 2014
Xu Z, Gong Q, Xia B, Groves B, Zimmermann M, Mugler C, Mu D, Matsumoto
B, Seaman M, Ma D (2009) A role of histone H3 lysine 4 methyltransferase
components in endosomal trafficking. J Cell Biol 186: 343 – 353
Yu H (2007) Cdc20: a WD40 activator for a cell cycle degradation machine.
Mol Cell 27: 3 – 16
Zhang J, Chen QM (2013) Far upstream element binding protein 1: a commander
of transcription, translation and beyond. Oncogene 32: 2907 – 2916
Zhong XY, Wang P, Han J, Rosenfeld MG, Fu XD (2009) SR proteins in vertical
integration of gene expression from transcription to RNA processing to
translation. Mol Cell 35: 1 – 10
Zhu M, Wang F, Yan F, Yao PY, Du J, Gao X, Wang X, Wu Q, Ward T, Li J,
Kioko S, Hu R, Xie W, Ding X, Yao X (2008) Septin 7 interacts with
centromere-associated protein E and is required for its kinetochore
localization. J Biol Chem 283: 18916 – 18925
The EMBO Journal Proteomics of a fuzzy organelle: interphase chromatin Georg Kustatscher et al
The EMBO Journal Vol 33 | No 6 | 2014 ª 2014 The Authors664
Published online: February 16, 2014