Embed Size (px)
Citation preview
proteinsSTRUCTURE O FUNCTION O BIOINFORMATICS
Molecular dynamics simulation ofconformational heterogeneity intransportin 1Xia Wang,1,2 Xue Xu,1,2 Shanna Zhu,3 Zhengtao Xiao,1,2 Zhi Ma,1,2 Yan Li,4
and Yonghua Wang1,2*1 Center of Bioinformatics, Northwest A&F University, Yangling, Shaanxi 712100, People’s Republic of China
2 College of Life Sciences, Northwest A&F University, Yangling, Shaanxi 712100, People’s Republic of China
3 College of Information Engineering, Northwest A&F University, Yangling, Shaanxi 712100, People’s Republic of China
4Department of Materials Science and Chemical Engineering, Dalian University of Technology, Dalian,
Liaoning 116023, People’s Republic of China
INTRODUCTION
Trafficking of macromolecular cargoes including proteins andRNAs between the nucleus and cytoplasm plays key roles in manycellular processes, such as gene expression, signal transduction, andcell-cycle progression. Such nucleocytoplasmic transport occursthrough the nuclear pore complex (NPC), which is mostly mediatedby members of karyopherin-b (kapb; also known as Importins andExportins) family with cognate nuclear localization signals (NLSs) ornuclear export signals (NESs) (reviewed in Refs. 1–3). Interestingly,in the nuclear import system, it is noted that RanGTP, a small Rasfamily GTPase regulating the directionality of transport throughits nucleotide state,4 competitively binds to the kapbs with thesubstrates (‘‘cargoes’’) and thus leads to substrate binding in thecytoplasm and RanGTP-mediated release in the nucleus.3 This com-petitive binding occurs in several transport pathways throughout thecellular processes, and one of the best characterized pathway involvesimport of proteins with a ‘‘classical" NLS (cNLS), characterized byone or two clusters of basic residues, by the Kap-a/b1 heterodimer.5
Other than the classical transport pathway, more than 20 mRNA
processing proteins (including hnRNPs A1, D, F, M, HuR, DDX3,
Y-box binding protein 1, and TAP) have been reported to bind
directly to transportin 1 (also known as karyopherin-b2) (hereafter
designated Trn1) through cognate proline-tyrosine NLSs (PY-NLSs),
rather than utilize an adaptor (Kapa) that forms the bridge between
most cNLS motifs and Kapb1.6–8 As a typical transport receptor of
Additional Supporting Information may be found in the online version of this article.
Abbreviations: DCCM, dynamic cross-correlation matrix; kapb, karyopherin-b; MD, molecular
dynamics; NLS, nuclear localization signal; NPC, nuclear pore complex; PCA, principal component
analysis; Rg, radius of gyration; RMSD, root-mean-square deviation; RMSF, root-mean-square
fluctuation; Trn1, transportin 1.
Grant sponsor: Northwest A&F University; Grant sponsor: National Natural Science Foundation of
China; Grant number: 10801025; The research is supported by high-performance computing plat-
form of Northwest A & F University.
Xia Wang and Xue Xu contributed equally to this work.
*Correspondence to: Yonghua Wang, Center of Bioinformatics, Northwest A&F University, Yangling,
Shaanxi 712100, People’s Republic of China. E-mail: [email protected].
Received 7 April 2011; Revised 23 August 2011; Accepted 4 September 2011
Published online 14 September 2011 in Wiley Online Library (wileyonlinelibrary.com).
DOI: 10.1002/prot.23193
ABSTRACT
Transportin 1 (Trn1), as a typical transport
receptor of the karyopherin-b family, mediates
numerous RNA binding proteins into the
nucleus by recognizing proline-tyrosine nuclear
localization signals (PY-NLSs). Such process is
regulated by RanGTP through its nucleotide
cycle, which is associated with ligand dissocia-
tion. Yet a proper description including dynamic
properties of Trn1 and its response on ligand/
Ran binding has not been accessible so far.
Here, we use molecular dynamics simulations to
probe the conformational dynamics of the apo-
Trn1 and Trn1 in complex with ligand and Ran.
The results reveal a strikingly intrinsic flexibil-
ity and conformational heterogeneity of Trn1,
identified as generally segmental architecture.
The segments rotate relative to each other about
a flexible hinge and thereby force Trn1 to adopt
a conformation compatible with the binding of
Ran or substrates. Such binding significantly
suppresses the flexibility and conformational
heterogeneity of Trn1 and results in a disorder-
to-order transition of HR8 loop, which facili-
tates this loop to allosterically communicate
with the C-terminal arch of Trn1. These results
give insights into the disassembly and recycling
of the Trn1, which has important implications
for the regulation of the nuclear transport cycle
and for the ligand selectivity.
Proteins 2012; 80:382–397.VVC 2011 Wiley Periodicals, Inc.
Key words: transportin 1; molecular dynamics;
conformational heterogeneity; intrinsically
disordered region.
382 PROTEINS VVC 2011 WILEY PERIODICALS, INC.
Kapb family, Trn1 has limited sequence identity (24%)
to Kapb19 and possesses a superhelical structure10,11
created by the helical stacking of 20 HEAT (Huntington,
Elongation factor 3, A subunit of protein phosphatase
2A, and the lipid kinase Tor1 proteins where such types
of helical repeats were first found12) repeats (HR1–
HR20) (Fig. 1). In addition, crystal structure comparison
of apo-Trn1 with Trn1 in complex with substrates or
Ran�GppNHp (GppNHp is a nonhydrolysable GTP) sug-
gests the substantial flexibility of this karyopherin series
and its large conformational changes upon ligand bind-
ing,10,11,13 indicating an induced-fit mechanism involv-
ing Trn1 and its substrates in which the changes in heli-
coidal pitch can be tremendous. However, despite the
determined crystal structures of Trn, it is still poorly
understood the precisely dynamics properties of this
transporter receptor after ligand/Ran binding due to the
lack of sizable globular hydrophobic cores.14 And more
importantly, since this question is dynamic in nature, it
is impossible to determine only from a visual inspection
of the limited number of crystal or NMR structures.
Thus, special attention is still required for the superheli-
cal pitches and regions of structural changes of this
transporter receptor.10,11,13
It has been shown that Trn1 contains an insertion that
is much longer than that of any other Kapbs in HEAT
repeat 8 (HR8).2 This long insertion termed ‘‘acidic’’
loop (HR8 loop, residues 311–373) plays a fundamental
role in substrate dissociation since the Trn1 with a
cleaved or truncated acidic loop is unable to undergo
Ran-mediated substrate dissociation.15 However, up to
date, no crystal structure of the HR8 loop is available for
the apo- or NLS-bound Trn1 either, thus the detailed
molecular mechanism of the HR8 loop remains unclear.
Moreover, functional dynamics of this loop in Trn1 sys-
tem is not easy to probe experimentally, because it is sen-
sitive to proteolytic degradation in substrate-bound
Trn1.10,15,16
Fortunately, a variety of theoretical techniques have
unique benefits for solving these problems, particularly
for molecular dynamics (MD) simulations, a useful tool
for understanding the dynamic behavior of proteins at
different timescales, from fast internal motions to slow
conformational changes.17–19 Thus, in this work, we
performed MD simulations to investigate the dynamics
properties of Trn1 in the nuclear transport pathway, and
meanwhile, probe the role of HR8 loop in the displace-
ment of substrate.
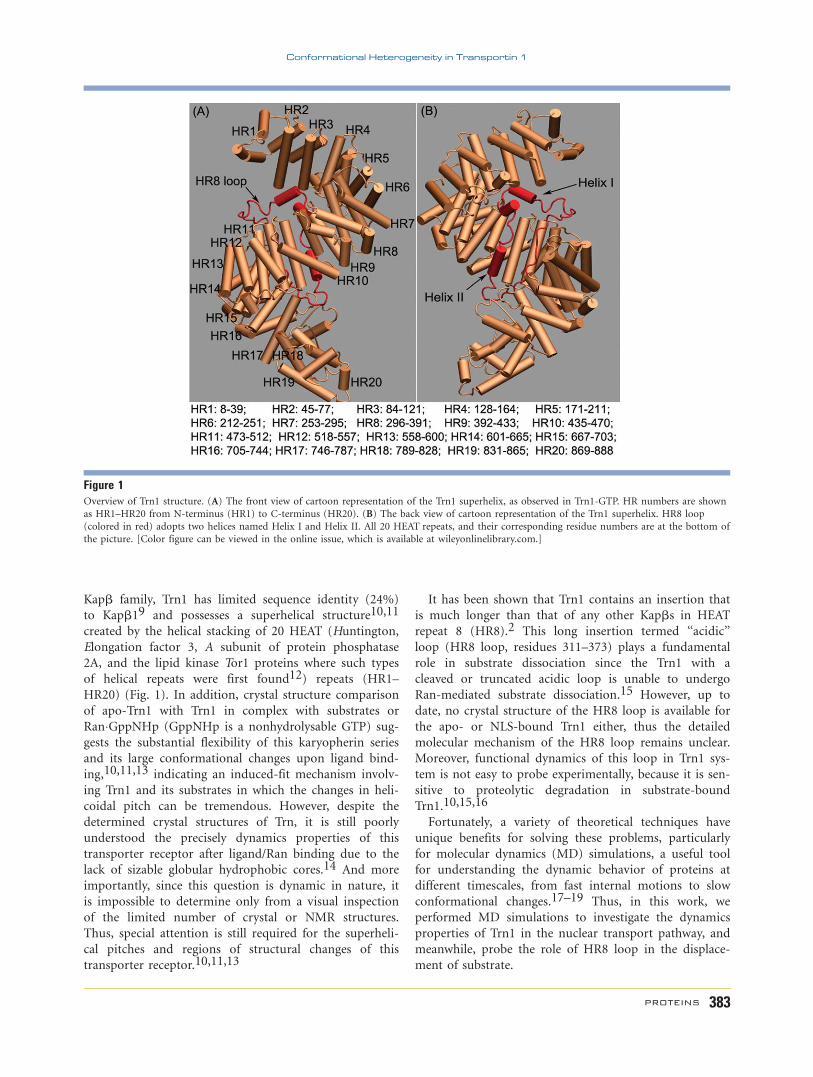
Figure 1Overview of Trn1 structure. (A) The front view of cartoon representation of the Trn1 superhelix, as observed in Trn1-GTP. HR numbers are shown
as HR1–HR20 from N-terminus (HR1) to C-terminus (HR20). (B) The back view of cartoon representation of the Trn1 superhelix. HR8 loop
(colored in red) adopts two helices named Helix I and Helix II. All 20 HEAT repeats, and their corresponding residue numbers are at the bottom of
the picture. [Color figure can be viewed in the online issue, which is available at wileyonlinelibrary.com.]
Conformational Heterogeneity in Transportin 1
PROTEINS 383
RESULTS
Overview of the structures
To better describe the results from MD simulations, a
brief introduction about Trn1 and its binding partner
structure is presented. Trn1 is a superhelical S-like mole-
cule constructed by helical stacking of the 20 HEAT
repeats (HR1–HR20) (Fig. 1). Each HR consists of two
antiparallel helices, A and B, which is located at the
respective convex and concave surfaces of the superhelical
molecule. All helices are connected by short loops or
small helices except for HR8A and HR8B, which are con-
nected by a long HR8 loop. The Trn1 superhelix is
formed by two overlapping arches, that is, N- and C-ter-
minal arches, which are composed of HR1–HR13 and
HR8–HR20, respectively.11 In Trn1-M9 complex, M9 is
an unstructured peptide with 27 residues (residues 263–
289) in length, and it binds in extended conformation to
line the concave surface of the C-terminal arch of
Trn1. In the Trn1-GTP complex, RanGTP binds in the
N-terminal arch. Ran in Trn1-GTP/GDP contains 190
(residues 8–197) of total 216 residues. The differences
between the starting (crystal) structures are 0.21 nm for
apo-Trn1 and Trn1-M9, 0.71 nm for apo-Trn1 and Trn1-
GTP, as well as 0.61 nm for Trn1-GTP and Trn1-M9,
respectively.
Dynamics and stability of the overall proteinstructures
First, we examine the root-mean-square deviations
(RMSDs) of each system (apo-Trn1, Trn1 complexed
with NLS (Trn1-M9), Trn1 with RanGTP (Trn1-GTP),
and Trn1 with RanGDP (Trn1-GDP) to determine the
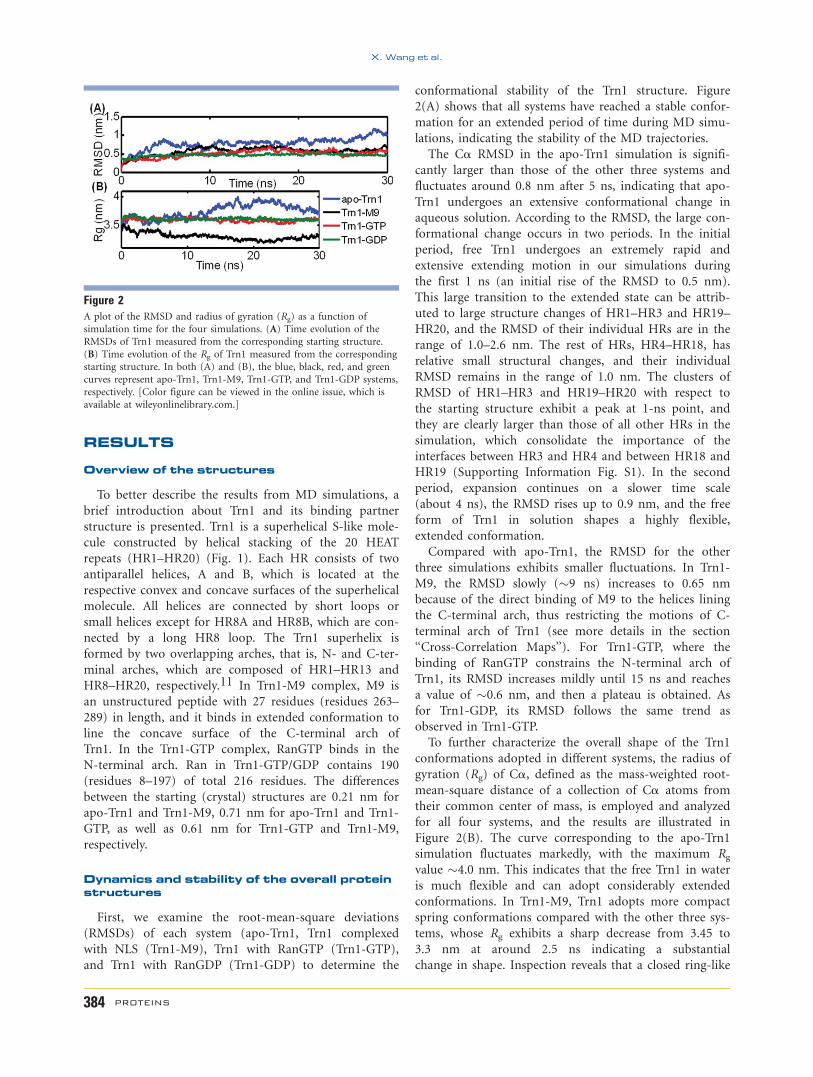
conformational stability of the Trn1 structure. Figure
2(A) shows that all systems have reached a stable confor-
mation for an extended period of time during MD simu-
lations, indicating the stability of the MD trajectories.
The Ca RMSD in the apo-Trn1 simulation is signifi-
cantly larger than those of the other three systems and
fluctuates around 0.8 nm after 5 ns, indicating that apo-
Trn1 undergoes an extensive conformational change in
aqueous solution. According to the RMSD, the large con-
formational change occurs in two periods. In the initial
period, free Trn1 undergoes an extremely rapid and
extensive extending motion in our simulations during
the first 1 ns (an initial rise of the RMSD to 0.5 nm).
This large transition to the extended state can be attrib-
uted to large structure changes of HR1–HR3 and HR19–
HR20, and the RMSD of their individual HRs are in the
range of 1.0–2.6 nm. The rest of HRs, HR4–HR18, has
relative small structural changes, and their individual
RMSD remains in the range of 1.0 nm. The clusters of
RMSD of HR1–HR3 and HR19–HR20 with respect to
the starting structure exhibit a peak at 1-ns point, and
they are clearly larger than those of all other HRs in the
simulation, which consolidate the importance of the
interfaces between HR3 and HR4 and between HR18 and
HR19 (Supporting Information Fig. S1). In the second
period, expansion continues on a slower time scale
(about 4 ns), the RMSD rises up to 0.9 nm, and the free
form of Trn1 in solution shapes a highly flexible,
extended conformation.
Compared with apo-Trn1, the RMSD for the other
three simulations exhibits smaller fluctuations. In Trn1-
M9, the RMSD slowly (�9 ns) increases to 0.65 nm
because of the direct binding of M9 to the helices lining
the C-terminal arch, thus restricting the motions of C-
terminal arch of Trn1 (see more details in the section
‘‘Cross-Correlation Maps’’). For Trn1-GTP, where the
binding of RanGTP constrains the N-terminal arch of
Trn1, its RMSD increases mildly until 15 ns and reaches
a value of �0.6 nm, and then a plateau is obtained. As
for Trn1-GDP, its RMSD follows the same trend as
observed in Trn1-GTP.
To further characterize the overall shape of the Trn1
conformations adopted in different systems, the radius of
gyration (Rg) of Ca, defined as the mass-weighted root-
mean-square distance of a collection of Ca atoms from
their common center of mass, is employed and analyzed
for all four systems, and the results are illustrated in
Figure 2(B). The curve corresponding to the apo-Trn1
simulation fluctuates markedly, with the maximum Rg
value �4.0 nm. This indicates that the free Trn1 in water
is much flexible and can adopt considerably extended
conformations. In Trn1-M9, Trn1 adopts more compact
spring conformations compared with the other three sys-
tems, whose Rg exhibits a sharp decrease from 3.45 to
3.3 nm at around 2.5 ns indicating a substantial
change in shape. Inspection reveals that a closed ring-like
Figure 2A plot of the RMSD and radius of gyration (Rg) as a function of
simulation time for the four simulations. (A) Time evolution of the
RMSDs of Trn1 measured from the corresponding starting structure.
(B) Time evolution of the Rg of Trn1 measured from the corresponding
starting structure. In both (A) and (B), the blue, black, red, and green
curves represent apo-Trn1, Trn1-M9, Trn1-GTP, and Trn1-GDP systems,
respectively. [Color figure can be viewed in the online issue, which is
available at wileyonlinelibrary.com.]
X. Wang et al.
384 PROTEINS
conformation is formed by its N-terminal arch, indicat-
ing that the compact geometry is spontaneously adopted
by Trn1 after binding of M9 within a few nanoseconds.
Around 18 ns, Rg further decreases to 3.22 nm. In Trn1-
GTP and Trn1-GDP simulations, the Rg curves show
similar trends and maintain a value of about 3.6 nm, in
conjunction with Rg of Trn1-M9, and one can conclude
that the binding of M9 or Ran rigidifies the Trn1 to
maintain a compact conformation—as will be discussed
later—while the absence of the M9 or Ran allows the
Trn1 to adopt a more conformational relaxation.
Intrinsic and M9/Ran-induced flexibility
To provide more comprehensive information on the
convergence of the dynamical properties of the system,
we evaluate the root-mean-square fluctuation (RMSF) of
Ca atoms for each system, with respect to their time-
averaged positions (Fig. 3). To guarantee our calculated
parameters to reflect the intrinsic properties, the analysis
of MD trajectories has been performed by discarding the
first 15 ns.
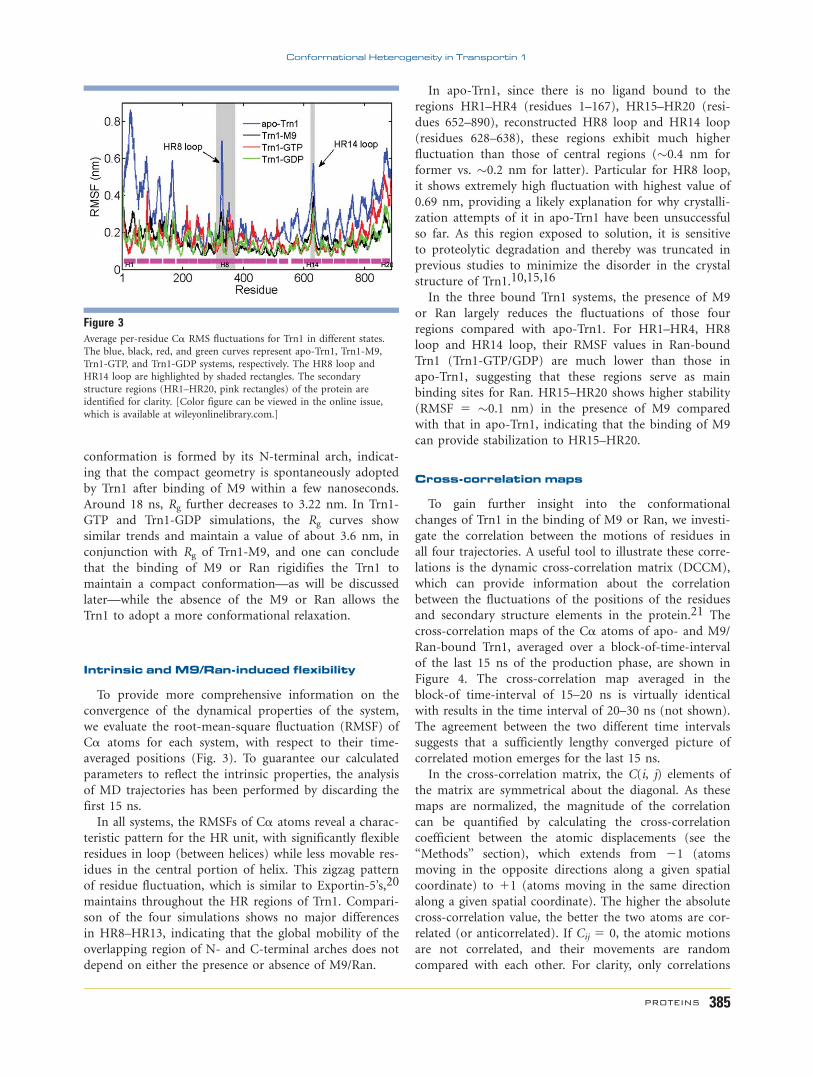
In all systems, the RMSFs of Ca atoms reveal a charac-
teristic pattern for the HR unit, with significantly flexible
residues in loop (between helices) while less movable res-
idues in the central portion of helix. This zigzag pattern
of residue fluctuation, which is similar to Exportin-5’s,20
maintains throughout the HR regions of Trn1. Compari-
son of the four simulations shows no major differences
in HR8–HR13, indicating that the global mobility of the
overlapping region of N- and C-terminal arches does not
depend on either the presence or absence of M9/Ran.
In apo-Trn1, since there is no ligand bound to the
regions HR1–HR4 (residues 1–167), HR15–HR20 (resi-
dues 652–890), reconstructed HR8 loop and HR14 loop
(residues 628–638), these regions exhibit much higher
fluctuation than those of central regions (�0.4 nm for
former vs. �0.2 nm for latter). Particular for HR8 loop,
it shows extremely high fluctuation with highest value of
0.69 nm, providing a likely explanation for why crystalli-
zation attempts of it in apo-Trn1 have been unsuccessful
so far. As this region exposed to solution, it is sensitive
to proteolytic degradation and thereby was truncated in
previous studies to minimize the disorder in the crystal
structure of Trn1.10,15,16
In the three bound Trn1 systems, the presence of M9
or Ran largely reduces the fluctuations of those four
regions compared with apo-Trn1. For HR1–HR4, HR8
loop and HR14 loop, their RMSF values in Ran-bound
Trn1 (Trn1-GTP/GDP) are much lower than those in
apo-Trn1, suggesting that these regions serve as main
binding sites for Ran. HR15–HR20 shows higher stability
(RMSF 5 �0.1 nm) in the presence of M9 compared
with that in apo-Trn1, indicating that the binding of M9
can provide stabilization to HR15–HR20.
Cross-correlation maps
To gain further insight into the conformational
changes of Trn1 in the binding of M9 or Ran, we investi-
gate the correlation between the motions of residues in
all four trajectories. A useful tool to illustrate these corre-
lations is the dynamic cross-correlation matrix (DCCM),
which can provide information about the correlation
between the fluctuations of the positions of the residues
and secondary structure elements in the protein.21 The
cross-correlation maps of the Ca atoms of apo- and M9/
Ran-bound Trn1, averaged over a block-of-time-interval
of the last 15 ns of the production phase, are shown in
Figure 4. The cross-correlation map averaged in the
block-of time-interval of 15–20 ns is virtually identical
with results in the time interval of 20–30 ns (not shown).
The agreement between the two different time intervals
suggests that a sufficiently lengthy converged picture of
correlated motion emerges for the last 15 ns.
In the cross-correlation matrix, the C(i, j) elements of
the matrix are symmetrical about the diagonal. As these
maps are normalized, the magnitude of the correlation
can be quantified by calculating the cross-correlation
coefficient between the atomic displacements (see the
‘‘Methods’’ section), which extends from 21 (atoms
moving in the opposite directions along a given spatial
coordinate) to 11 (atoms moving in the same direction
along a given spatial coordinate). The higher the absolute
cross-correlation value, the better the two atoms are cor-
related (or anticorrelated). If Cij 5 0, the atomic motions
are not correlated, and their movements are random
compared with each other. For clarity, only correlations
Figure 3Average per-residue Ca RMS fluctuations for Trn1 in different states.
The blue, black, red, and green curves represent apo-Trn1, Trn1-M9,
Trn1-GTP, and Trn1-GDP systems, respectively. The HR8 loop and
HR14 loop are highlighted by shaded rectangles. The secondary
structure regions (HR1–HR20, pink rectangles) of the protein are
identified for clarity. [Color figure can be viewed in the online issue,
which is available at wileyonlinelibrary.com.]
Conformational Heterogeneity in Transportin 1
PROTEINS 385
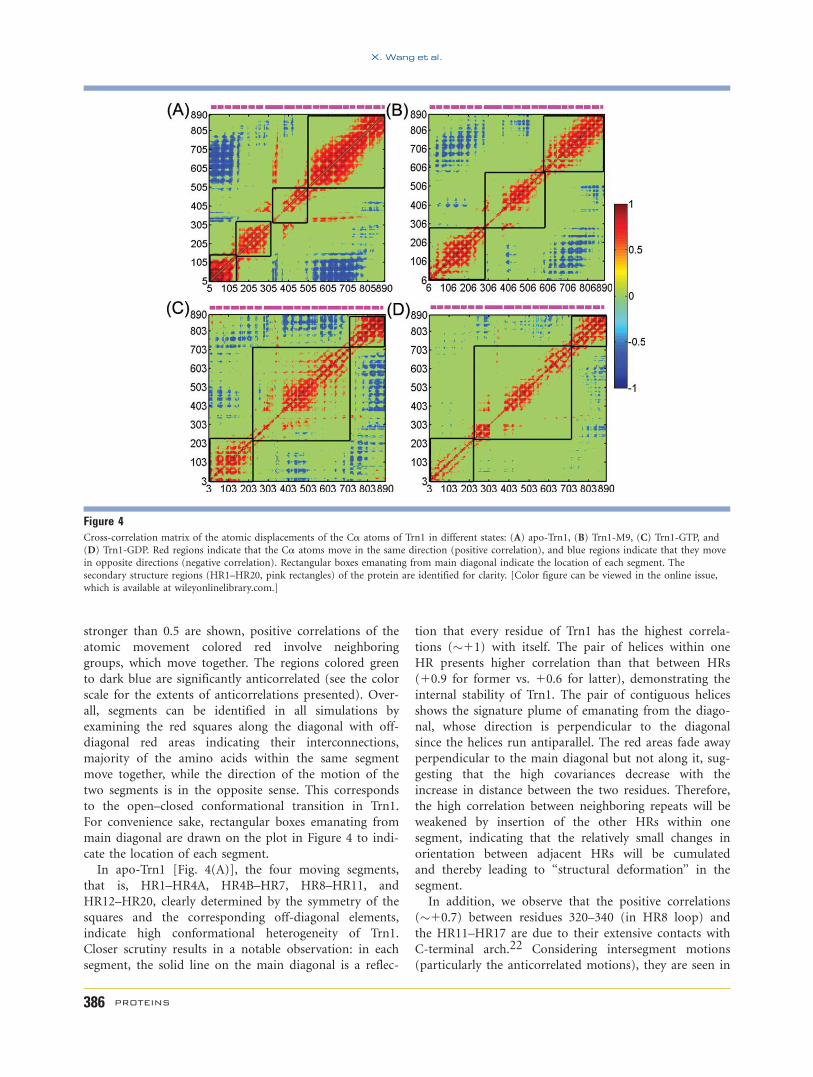
stronger than 0.5 are shown, positive correlations of the
atomic movement colored red involve neighboring
groups, which move together. The regions colored green
to dark blue are significantly anticorrelated (see the color
scale for the extents of anticorrelations presented). Over-
all, segments can be identified in all simulations by
examining the red squares along the diagonal with off-
diagonal red areas indicating their interconnections,
majority of the amino acids within the same segment
move together, while the direction of the motion of the
two segments is in the opposite sense. This corresponds
to the open–closed conformational transition in Trn1.
For convenience sake, rectangular boxes emanating from
main diagonal are drawn on the plot in Figure 4 to indi-
cate the location of each segment.
In apo-Trn1 [Fig. 4(A)], the four moving segments,
that is, HR1–HR4A, HR4B–HR7, HR8–HR11, and
HR12–HR20, clearly determined by the symmetry of the
squares and the corresponding off-diagonal elements,
indicate high conformational heterogeneity of Trn1.
Closer scrutiny results in a notable observation: in each
segment, the solid line on the main diagonal is a reflec-
tion that every residue of Trn1 has the highest correla-
tions (�11) with itself. The pair of helices within one
HR presents higher correlation than that between HRs
(10.9 for former vs. 10.6 for latter), demonstrating the
internal stability of Trn1. The pair of contiguous helices
shows the signature plume of emanating from the diago-
nal, whose direction is perpendicular to the diagonal
since the helices run antiparallel. The red areas fade away
perpendicular to the main diagonal but not along it, sug-
gesting that the high covariances decrease with the
increase in distance between the two residues. Therefore,
the high correlation between neighboring repeats will be
weakened by insertion of the other HRs within one
segment, indicating that the relatively small changes in
orientation between adjacent HRs will be cumulated
and thereby leading to ‘‘structural deformation’’ in the
segment.
In addition, we observe that the positive correlations
(�10.7) between residues 320–340 (in HR8 loop) and
the HR11–HR17 are due to their extensive contacts with
C-terminal arch.22 Considering intersegment motions
(particularly the anticorrelated motions), they are seen in
Figure 4Cross-correlation matrix of the atomic displacements of the Ca atoms of Trn1 in different states: (A) apo-Trn1, (B) Trn1-M9, (C) Trn1-GTP, and
(D) Trn1-GDP. Red regions indicate that the Ca atoms move in the same direction (positive correlation), and blue regions indicate that they move
in opposite directions (negative correlation). Rectangular boxes emanating from main diagonal indicate the location of each segment. The
secondary structure regions (HR1–HR20, pink rectangles) of the protein are identified for clarity. [Color figure can be viewed in the online issue,
which is available at wileyonlinelibrary.com.]
X. Wang et al.
386 PROTEINS
signature plumes that appear off-diagonal as they occur
in noncontiguous residues. HR1–HR4A is anticorrelated
with the HR8 (�20.67) and HR12–HR17 (�20.85).
HR18–HR20 shows anticorrelation with HR4B–HR7
(�20.51) and HR9–HR11 (�20.64). Hence, HR3–HR4,
HR7–HR8 in the N terminus and HR11–HR12 in the C
terminus form dynamic ‘‘hotspots,’’ and these four main
hinge motions dominate the conformational relaxation of
the free Trn1. This finding is supported by the observa-
tion by Cansizoglu and Chook (2007).13 Combined, all
these results suggest that the large conformational change
of Trn1 accounts for not only large rigid body motion of
segments but also deformation of their components
(HEAT repeats). Probably, as such, Trn1 as a spring mol-
ecule distorts itself to store the energy.
Compared with the map of apo-Trn1 simulation, the
conformational transition occurs in Trn1-M9 [Fig. 4(B)].
As evidenced by the red plumes on the surface, move-
ments with high positive correlation extended, as a result,
only three segments can be clearly distinguished in the
structure of Trn1. For N-terminal arch, the hinge-bend-
ing motion of HR1–HR4A and HR4B–HR7 is vanished
in Trn1-M9, and both regions emerge into a larger seg-
ment that moves together. In addition, the positive corre-
lation between HR8 loop and HR11–HR17 is also disap-
peared (�10.27). For C-terminal arch, HR8–HR20 is
clearly divided into two segments (HR8–HR13 and
HR14–HR20, respectively) when M9 binds to Trn1
through hydrogen bonds and salt bridges at binding sites
A (HR8–HR13) and B (HR14–HR20). Since the motions
of these three segments in Trn1-M9 are anticorrelated to
one another as evidenced by Figure 4(B), the HR7–HR8
in the N terminus and HR13–HR14 in the C terminus
form dynamic ‘‘hotspots,’’ implying that they might be
functionally relevant. Overall, the presence of M9 rigidi-
fies the structure of Trn1, leading to a more structured
intrasegment and intersegment motions pattern of Trn1.
Naturally, such less flexibility can be explained by the
idea that the energy stored by distorting the Trn1 may be
counteracted by the substantial binding energies involved
in complex formation and may thereby enable assembly
and disassembly of their complexes with relatively small
energy changes.2
In Trn1-GTP [Fig. 4(C)], the binding of a RanGTP
mostly modifies the Trn1 behavior and hence results in
three clear segments (HR1–HR7, HR8–HR15, and HR16–
HR20), which are different from those in both apo- and
M9-bound Trn1 systems. These three segments present
anticorrelated motions with one another, corresponding to
arch-close/open motion of Trn1, which is relevant with the
functionally binding of RanGTP. It is noted that the posi-
tive correlation between HR8 loop and HR11–HR17 reoc-
curs (�10.84), indicating HR8 loop has extensive interac-
tion with HR11–HR17 in Trn1-GTP.
Compared with Trn1-GTP, a significant and global
decrease in the intensity of correlation values happens
with conversion of GTP into GDP [Fig. 4(D)]. Indeed,
correlation peaks are generally decreased in Trn1-GDP
(�0.15) compared with those in Trn1-GTP. This suggests
a communication pathway where Ran influences the con-
formational transition of Trn1 and perturbation of GTP
hydrolysis has effect on the contacts between Ran and
Trn1.
Principal component analysis andmotions of Trn1
In the earlier section, we present the analysis of the
N 3 N covariance matrix, where N is the number of Caatoms considered in the model, and the elements are the
average vectorial inner products of the atomic fluctua-
tions. The normalization of this matrix to unity gives the
DCCM, which indicates whether two atoms move in the
same or opposite senses. To further investigate the effects
of ligand on the global dynamics of the Trn1, we analyze
the principal modes of motion through principal compo-
nent analysis (PCA) of the trajectory data. PCA based on
diagonalizing the 3N 3 3N covariance matrix of Carte-
sian displacements drastically reduces the high dimen-
sionality of a simulation trajectory to a few orthogonal
vectors which account for most of the observed variance
in the atomic fluctuations. In such way, the protein dy-
namics can be understood by examining only the
motions along the principal components, and the identi-
fication of the dominant motions probably can be
observed during a simulation by visual inspection. In this
work, the protein configurations from last 15 ns of each
simulation trajectory have been subjected to PCA to clus-
ter the conformational spaces and examine the four MD
trajectories at equal intervals (10 ps) and should repre-
sent all major conformational spacing. The proportion of
variance versus the eigenvalue rank clearly shows the rel-
ative importance of the different motions. The first three
eigenvectors from the PCA totally capture 80.5%, 65.2%,
74.6%, and 59.4% of the overall structural fluctuations of
the Trn1 during the apo-Trn1, Trn1-M9, Trn1-GTP, and
Trn1-GDP simulations, respectively, and thus represent
large-scale collective motions, with subsequent eigenvec-
tors capturing significantly smaller fluctuations. It indi-
cates that the conformational fluctuations represented by
the first three PCA modes can be used to provide a
reasonable representation of a conformational change
that is expected to be functionally relevant. Thus,
we have restricted further analyses to the first three
dominant motions.
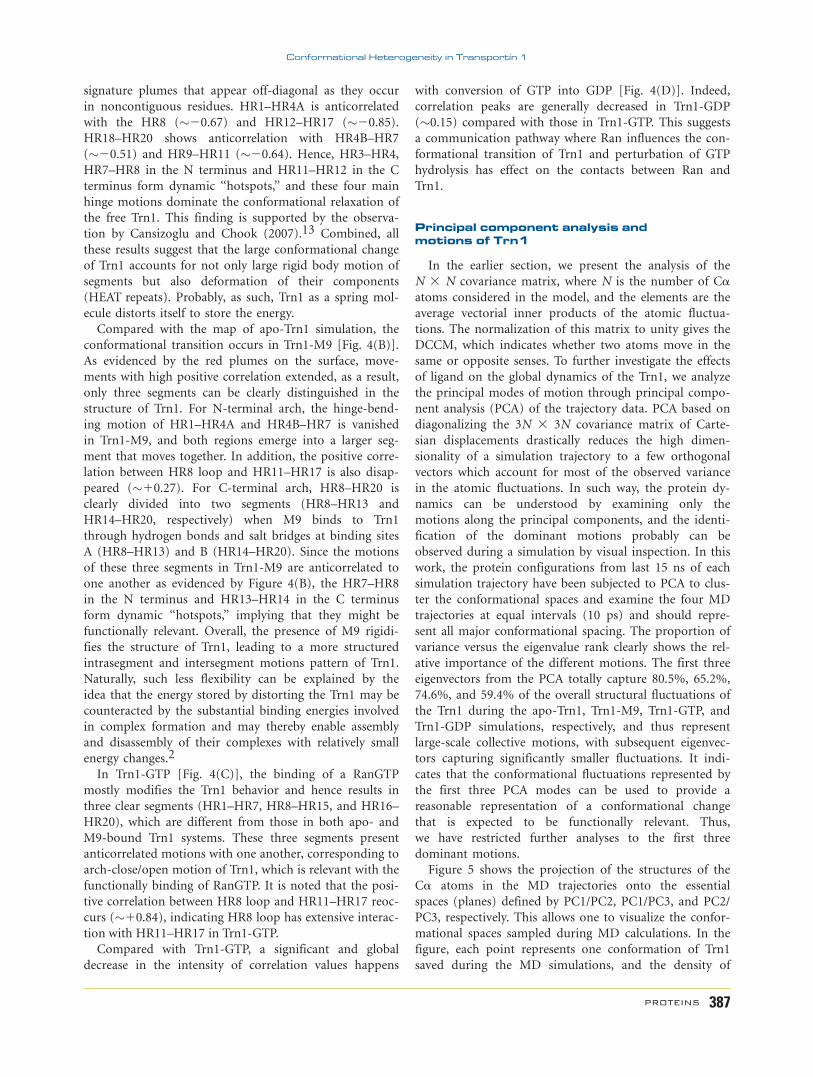
Figure 5 shows the projection of the structures of the
Ca atoms in the MD trajectories onto the essential
spaces (planes) defined by PC1/PC2, PC1/PC3, and PC2/
PC3, respectively. This allows one to visualize the confor-
mational spaces sampled during MD calculations. In the
figure, each point represents one conformation of Trn1
saved during the MD simulations, and the density of
Conformational Heterogeneity in Transportin 1
PROTEINS 387
points is an indication of the population of conforma-
tions sampled in the MD trajectory. All four trajectories
projected onto the PC1 and PC2 have two well-defined
clusters, which can be viewed as a passage from one
energy minimum to another. These results indicate that
all four systems sample two distinct minima during the
MD trajectory. In addition, the size of each cluster in
Figure 5 appears to indicate that both systems undergo
large conformational changes.
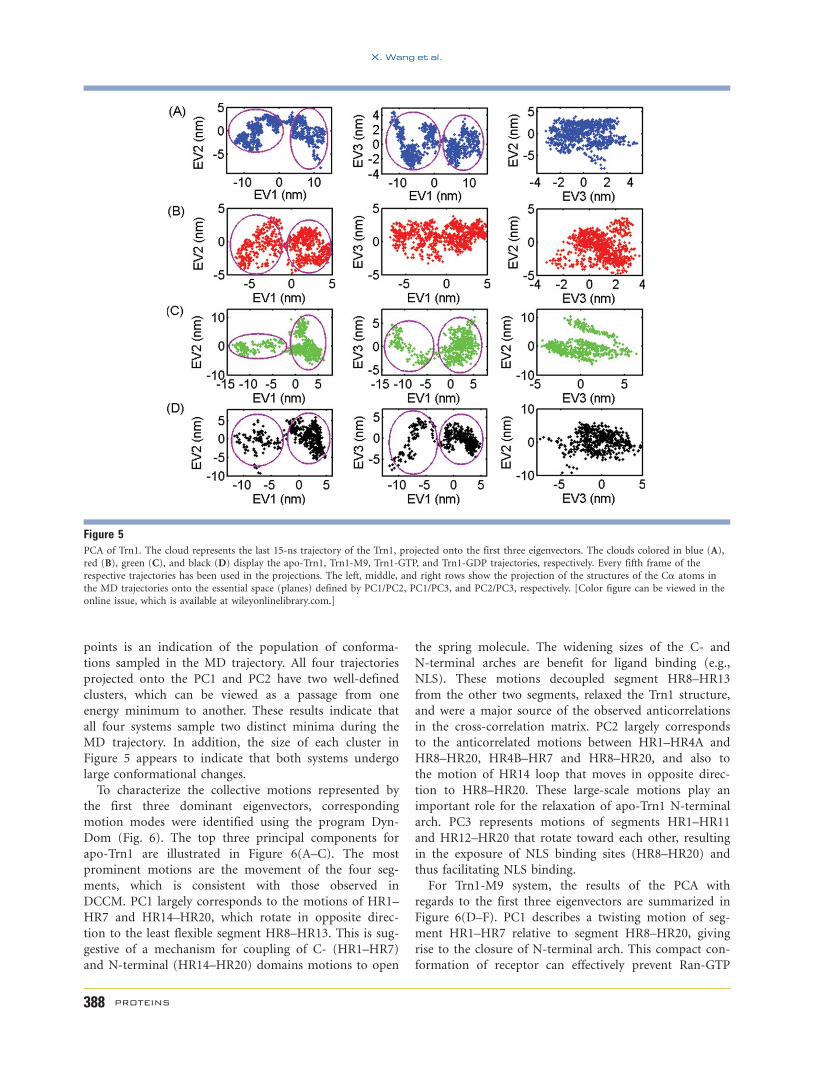
To characterize the collective motions represented by
the first three dominant eigenvectors, corresponding
motion modes were identified using the program Dyn-
Dom (Fig. 6). The top three principal components for
apo-Trn1 are illustrated in Figure 6(A–C). The most
prominent motions are the movement of the four seg-
ments, which is consistent with those observed in
DCCM. PC1 largely corresponds to the motions of HR1–
HR7 and HR14–HR20, which rotate in opposite direc-
tion to the least flexible segment HR8–HR13. This is sug-
gestive of a mechanism for coupling of C- (HR1–HR7)
and N-terminal (HR14–HR20) domains motions to open
the spring molecule. The widening sizes of the C- and
N-terminal arches are benefit for ligand binding (e.g.,
NLS). These motions decoupled segment HR8–HR13
from the other two segments, relaxed the Trn1 structure,
and were a major source of the observed anticorrelations
in the cross-correlation matrix. PC2 largely corresponds
to the anticorrelated motions between HR1–HR4A and
HR8–HR20, HR4B–HR7 and HR8–HR20, and also to
the motion of HR14 loop that moves in opposite direc-
tion to HR8–HR20. These large-scale motions play an
important role for the relaxation of apo-Trn1 N-terminal
arch. PC3 represents motions of segments HR1–HR11
and HR12–HR20 that rotate toward each other, resulting
in the exposure of NLS binding sites (HR8–HR20) and
thus facilitating NLS binding.
For Trn1-M9 system, the results of the PCA with
regards to the first three eigenvectors are summarized in
Figure 6(D–F). PC1 describes a twisting motion of seg-
ment HR1–HR7 relative to segment HR8–HR20, giving
rise to the closure of N-terminal arch. This compact con-
formation of receptor can effectively prevent Ran-GTP
Figure 5PCA of Trn1. The cloud represents the last 15-ns trajectory of the Trn1, projected onto the first three eigenvectors. The clouds colored in blue (A),
red (B), green (C), and black (D) display the apo-Trn1, Trn1-M9, Trn1-GTP, and Trn1-GDP trajectories, respectively. Every fifth frame of the
respective trajectories has been used in the projections. The left, middle, and right rows show the projection of the structures of the Ca atoms in
the MD trajectories onto the essential space (planes) defined by PC1/PC2, PC1/PC3, and PC2/PC3, respectively. [Color figure can be viewed in the
online issue, which is available at wileyonlinelibrary.com.]
X. Wang et al.
388 PROTEINS
from binding to Trn1. This is consistent with the cross-
correlation and Rg analyses. PC2 and PC3 describe the
hinge bending and rotary motions of HR1–HR13 relative
to HR14–HR20, as seen in the cross-correlation analysis.
This result directly links to an induced fit interaction
between Trn1 and M9, which binds to Trn1 through
both binding sites A and B.
The top three principal components for Trn1-GTP are
illustrated in Figure 6(G–I). The motions observed in
PC1 and PC2 are responsible to the hinge bending and
rotary motions of HR1–HR15 relative to HR16–HR20,
respectively, leading to the closure of the C-terminal
arch. This result is consistent with the cross-correlation
analysis, suggesting that the occupation of the binding
sites by RanGTP does not only stabilize the N-terminal
arch of Trn1 but also result in higher fluctuation of
C-terminal region of Trn1 (Fig. 3). PC3 is not only re-
sponsible to the highly anticorrelated motions between
HR1–HR15 and HR16–HR20 but also to HR16–HR20,
which moves toward the residues 345–368 in HR8 loop.
Taken together, these movements make distal portion of
HR8 loop (residue 345–360) extensively interact with site
B in Trn1, leading to release of the M9 from site B
through spatial conflict.
The top three principal components for Trn1-GDP are
illustrated in Figure 6(J–L). The dominance of all top
three PCs is responsible to bending and rotary motions
of HR1–HR13 and HR14–HR20, indicating that Trn1 in
complex with RanGDP has smaller fixed segment (HR1–
HR13) compared with that (HR1–HR15) in Trn1-GTP
system, suggesting the decreased binding affinity for Trn1
to Ran upon the hydrolysis of GTP. Hence, the intensity
of correlation movements in Trn1 decreased significantly
and globally; this is also consistent with cross-correlation
analysis. It is noted that, in Trn1-GDP, RanGDP can also
steer HR8 loop toward C-terminal arch, thus the bending
and rotary motions of HR14–HR20 relative to HR1–
HR13 still make C-terminal arch easy to communicate
with HR8 loop.
Allosteric communication in the Trn1
Previous study15 has suggested a mechanism for HR8
loop-mediated substrate dissociation. According to the
available crystal structures of Trn1, the HR8 loop exists
as multimers in Trn1-GTP form while not in solution in
the apo-Trn1 and Trn1-M9 structures. Thus, how the
structural conformation of Trn1 is transmitted by HR8
loop remains elusive. To understand the biological func-
tion of the whole HR8 loop in the Trn1 mediated trans-
port pathway, DSSP program is employed to examine the
consequences of these fluctuations on the secondary
structure of HR8 loop.23
Figure 7 shows the overall secondary structure pattern
of HR8 loop in the four systems, revealing the conforma-
tional changes of residues in this loop over time. The
overall structure of HR8 loop resembles the denatured
states of ordered region, best delineated as an ensemble
of rapidly interconverting alternative structures, which
nevertheless, are their native, functional states.24 Resi-
dues 343–357 in the HR8 loop adopt a coil conformation
in four trajectories, while residues 311–342 and residues
358–373 form a-helix in Trn1-GTP and Trn1-GDP; such
folding behavior of HR8 (loop/helix) is probably relevant
Figure 6Principal components of Trn1 dynamics in apo-Trn1 [the first panel,
(A), (B), and (C)], Trn1-M9 [the second panel, (D), (E), and (F)],
Trn1-GTP [the third panel, (G), (H), and (I)], and Trn1-GDP [the last
panel, (J), (K), and (L)] systems and correspondence of the modes.
Arrows represent the axes of motion. The colors of the arrow shaft and
head correspond to the color of the static and dynamic domains,
respectively. The left column represents PC1, the middle is PC2, and the
right is PC3. [Color figure can be viewed in the online issue, which is
available at wileyonlinelibrary.com.]
Conformational Heterogeneity in Transportin 1
PROTEINS 389
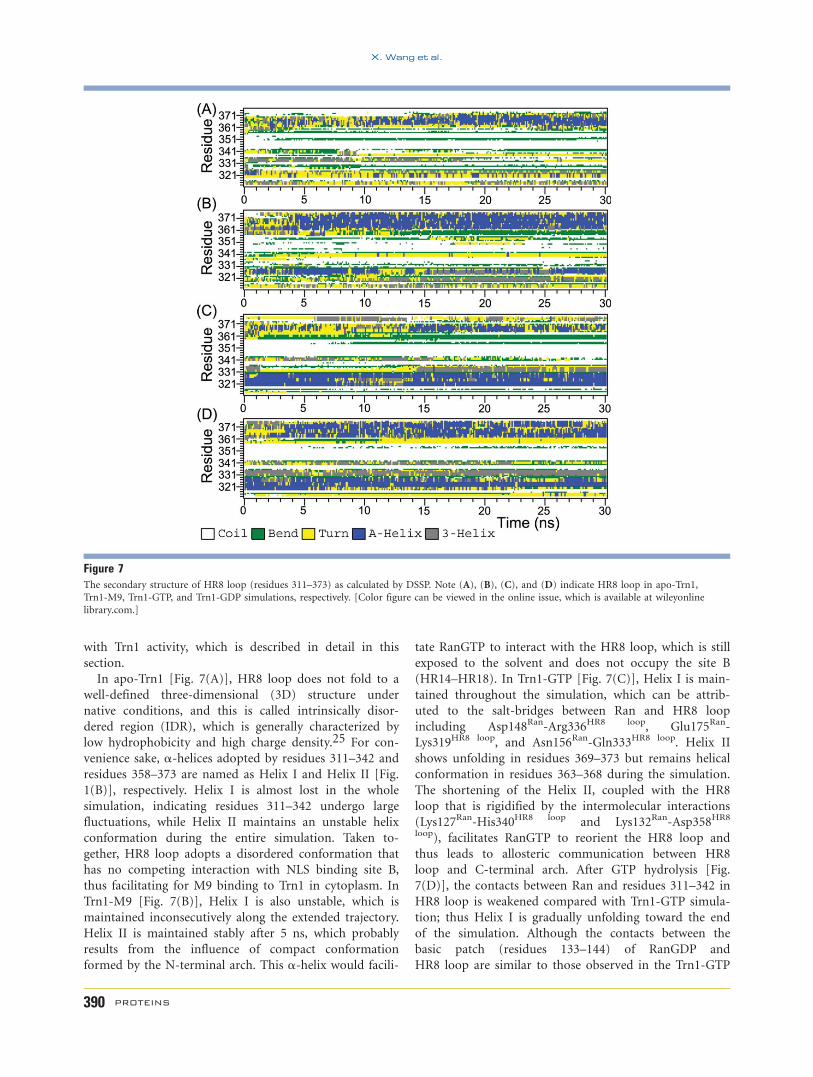
with Trn1 activity, which is described in detail in this
section.
In apo-Trn1 [Fig. 7(A)], HR8 loop does not fold to a
well-defined three-dimensional (3D) structure under
native conditions, and this is called intrinsically disor-
dered region (IDR), which is generally characterized by
low hydrophobicity and high charge density.25 For con-
venience sake, a-helices adopted by residues 311–342 and
residues 358–373 are named as Helix I and Helix II [Fig.
1(B)], respectively. Helix I is almost lost in the whole
simulation, indicating residues 311–342 undergo large
fluctuations, while Helix II maintains an unstable helix
conformation during the entire simulation. Taken to-
gether, HR8 loop adopts a disordered conformation that
has no competing interaction with NLS binding site B,
thus facilitating for M9 binding to Trn1 in cytoplasm. In
Trn1-M9 [Fig. 7(B)], Helix I is also unstable, which is
maintained inconsecutively along the extended trajectory.
Helix II is maintained stably after 5 ns, which probably
results from the influence of compact conformation
formed by the N-terminal arch. This a-helix would facili-
tate RanGTP to interact with the HR8 loop, which is still
exposed to the solvent and does not occupy the site B
(HR14–HR18). In Trn1-GTP [Fig. 7(C)], Helix I is main-
tained throughout the simulation, which can be attrib-
uted to the salt-bridges between Ran and HR8 loop
including Asp148Ran-Arg336HR8 loop, Glu175Ran-
Lys319HR8 loop, and Asn156Ran-Gln333HR8 loop. Helix II
shows unfolding in residues 369–373 but remains helical
conformation in residues 363–368 during the simulation.
The shortening of the Helix II, coupled with the HR8
loop that is rigidified by the intermolecular interactions
(Lys127Ran-His340HR8 loop and Lys132Ran-Asp358HR8
loop), facilitates RanGTP to reorient the HR8 loop and
thus leads to allosteric communication between HR8
loop and C-terminal arch. After GTP hydrolysis [Fig.
7(D)], the contacts between Ran and residues 311–342 in
HR8 loop is weakened compared with Trn1-GTP simula-
tion; thus Helix I is gradually unfolding toward the end
of the simulation. Although the contacts between the
basic patch (residues 133–144) of RanGDP and
HR8 loop are similar to those observed in the Trn1-GTP
Figure 7The secondary structure of HR8 loop (residues 311–373) as calculated by DSSP. Note (A), (B), (C), and (D) indicate HR8 loop in apo-Trn1,
Trn1-M9, Trn1-GTP, and Trn1-GDP simulations, respectively. [Color figure can be viewed in the online issue, which is available at wileyonline
library.com.]
X. Wang et al.
390 PROTEINS
complex, Helix II shows a longer and more stable helical
conformation than that in Trn1-GTP system, which is
probably attributed to the hydrolysis of GTP that reduces
the long-range electrostatic effects of the basic interface
of Ran. Nevertheless, the RanGDP still interacts with
HR8 loop and steers its distal portion toward site B
through the extended Helix II.
Hydrogen bonds analyses betweenTrn1 and NLS
It is known that Trn1 first binds to their transport
substrates (‘‘cargoes’’) through NLSs and then transport
them through the NPC. Because of the lack of sequence
similarity among NLSs of many transport substrates, this
raises the question how NLSs with different sequences
achieve general biological function. To address this, the
H-bonds interactions between M9 and Trn1, which play
key roles in structure and function of proteins such as
protein–ligand recognition, are analyzed.
Here, the geometry criterion of H-bonds is 3.5 A for
H-acceptor distance and 1208 for the donor-H-acceptor
angle. The details of H-bonds that present in more than
6 ns along the trajectory are described as following.
The H-bonding interactions between M9 and Trn1
throughout the Trn1-M9 system are shown in Table I
and Supporting Information Table S1. M9 binds in an
extended conformation to line the concave surface of the
C-terminal arch of Trn1 and forms an extensive network
of polar and hydrophobic interactions with sites A and B
of Trn1. Its peptide direction is antiparallel to that of the
Trn1 superhelix. Tracking M9 from N to C terminus, we
find Gly264 main-chain nitrogen atom forms an H-bond
with Asp837Trn1 lasting more than 24 ns, and Asn272
main-chain also H-bonds with Glu769Trn1, indicating
that the mutation to alanine residue in position 264 or
272 of M9 probably do not interrupt the H-bond and
thus result in significant reduction of binding affinity for
M9. On the contrary, Ser271 side-chain oxygen atom
forms H-bonds with Arg805Trn1 for 6 ns and with
Glu769Trn1 for 20 ns, suggesting the importance of
Ser271 in M9 binding.
In the central region of M9, the Gly274 main-chain
oxygen atom is involved in the H-bonds with side-chain
nitrogen atom from Asn770Trn1 (�12 ns) and with
Asn726Trn1 (�20 ns), while its main-chain nitrogen atom
prefers to link with side-chain oxygen atom of
Asn770Trn1 (�18 ns). As a consequence, Gly274Ala muta-
tion of M9 would result in a steric clash to Asn770Trn1
and Asn726Trn1 and break the H-bonds aforementioned.
This is quite different from the proposal that significantly
low affinity of M9 with Gly274Ala mutation is resulted
from the steric clash between the side chain of Ala in
position 274 of M9 and Trp730 in Trn1.10 For residue
Met276, it forms an H-bond with Asn727Trn1 (�24 ns)
through main-chain nitrogen atom, and therefore
Gly274Ala mutation of M9 would not interrupt the H-
bond, thus attenuate the binding affinity of M9. Taken
together, these results at least partly explain the muta-
tional studies that Gly274Ala not Met276Ala remarkably
decreased the binding affinity of M9 for Trn1.10
Further toward the C-terminus, the side-chain nitro-
gen atom from Lys277 forms H-bonds with Glu593Trn1
(15 ns) and Asp651Trn1 (15 ns), respectively, which are
not observed in crystal structure.10 The side-chain
nitrogen atom of Arg284 forms an H-bond with the
side-chain oxygen atom of Glu512Trn1 (�27 ns), Ser285
H-bonds with Ser507Trn1 about 19.5 ns, Pro288 binds to
a large hydrophobic swath including residues Ala380,
Ala381, Leu419, Ile457, and Trp460 of Trn1, and Tyr289
forms an H-bond to Asp384Trn1 about 20 ns. Hence,
these residues are also important for M9 binding. It is
noted that the motions of Arg284, Ser285, and Pro288
are positively correlated with that of Tyr289 (correlation
coefficients > 0.5), indicating that the former three resi-
dues are functionally cooperating with Tyr289. This at
least partly explains why the triple mutants10 Arg284/
Pro288/Tyr289 decrease the binding affinity of M9 for
Trn1 significantly. Overall, M9 interacts strongly with
both sites A and B, which is dissimilar to TAP NLS that
interacts weakly with site B or JKTBP NLS that has no
interaction with site B at all.11 Disruption of the interac-
tion between M9 and site B would severely decrease the
binding affinity of M9 to Trn1 and thus affect the disso-
ciation of M9 from Trn1.
Table IRepresentative H-Bonded Contacts Between Trn1 and M9a
Donor Acceptor Occupancyb (%)
Arg284-side-NH Glu509Trn1-side-OE 88.6Gly264-main-N Asp837Trn1-side-OD 84.75Met276-main-N Asn727Trn1-side-OD 84.28Asn727Trn1-side-ND2 Met276-main-O 81.82Asn272-main-N Glu769Trn1-side-OE 79.66Gln685Trn1-side-NE2 Met276-main-O 72.42Asn726Trn1-side-ND2 Gly274-main-O 67.49Ser271-side-OG Glu769Trn1-side-OE 67.49Tyr289-side-OH Asp384Trn1-side-OD 65.49Ser285-main-N Ser502Trn1-side-OG 63.64Arg284-side-NH Glu509Trn1-side-CD 63.02Gly274-main-N Asn770Trn1-side-OD 59.94Asn272-side-ND2 Glu769Trn1-side-OE 54.85Asn272-main-N Glu769Trn1-side-CD 48.69Arg284-side-NE Asp543Trn1-side-OD 47.77Lys277-side-NZ Asp646Trn1-side-OD 47.15Ser285-side-OG Glu498Trn1-side-OE 39.29Asn770Trn1-side-ND2 Gly274-main-O 38.37Phe273-main-N Glu769Trn1-side-OE 34.21Arg802Trn1-side-NH Asn265-main-O 33.44Lys277-side-NZ Glu588Trn1-side-OE 32.05Gln269-main-N Asn803Trn1-side-OD 28.35Ser502Trn1-side-OG Ser285-side-OG 26.96Tyr266-side-OH Asp837Trn1-main-O 22.65Arg805Trn1-main-N Ser271-side-OG 20.8
aThe percentage of simulation snapshots (saved every 10 ps) in which the H-bond
was present are listed.bThe occupancy of H-bonds formed between Trn1 and M9 larger than 20% is listed.
Conformational Heterogeneity in Transportin 1
PROTEINS 391
GTP hydrolysis undermines the bindingaffinity of Ran to Trn1
It has been reported that the affinity of Trn1 to
RanGTP (about 1 nM) was 10,000-fold higher than that
to RanGDP, implying that the hydrolysis of GTP shifts
the conformation of Ran in disfavor of the binding of
Trn.26 This raises the question of what conformational
changes of Ran undergo after GTP hydrolysis, thus
decreasing its interaction with Trn1. To address this, we
made a comparison between the Trn1-GTP and Trn1-
GDP systems during last 15 ns. Superposition of Ran
proteins from Trn1-GTP and Trn1-GDP shows that Trn1-
Ran interfaces undergo conformational changes, particu-
larly in the switch I (residues 30–47) and the switch II
(residues 65–80) (Supporting Information Fig. S2).
1. Switch I
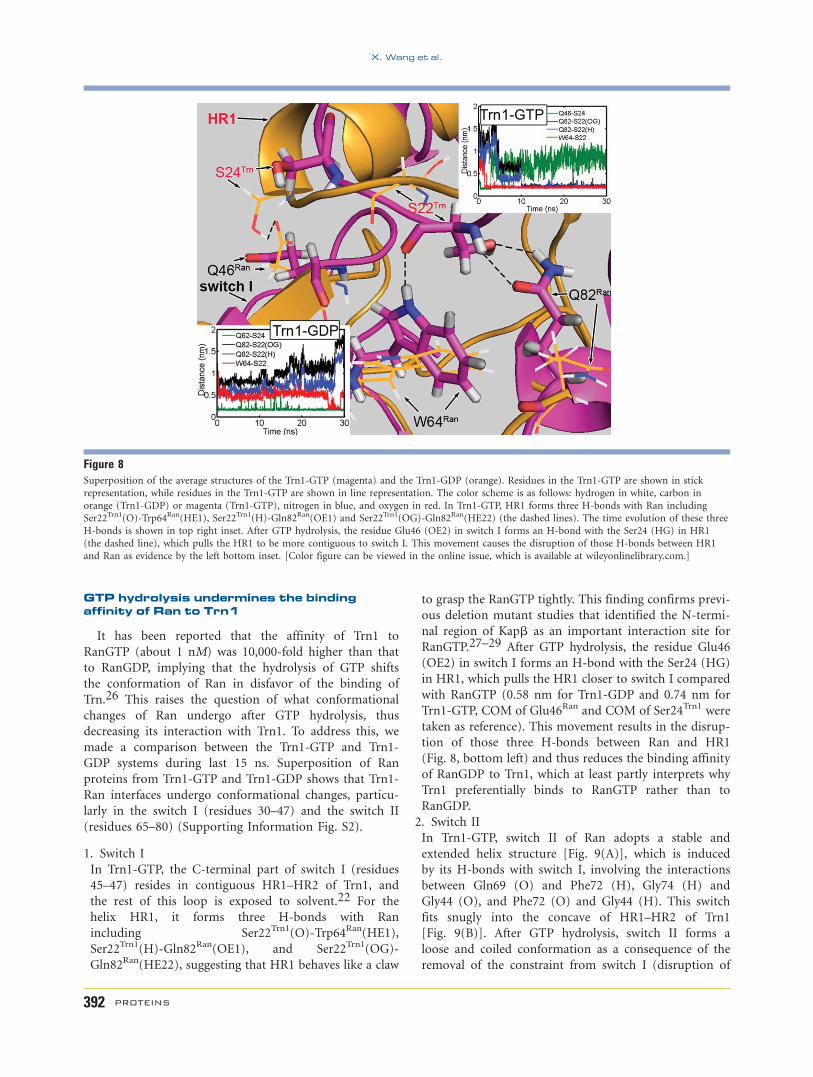
In Trn1-GTP, the C-terminal part of switch I (residues
45–47) resides in contiguous HR1–HR2 of Trn1, and
the rest of this loop is exposed to solvent.22 For the
helix HR1, it forms three H-bonds with Ran
including Ser22Trn1(O)-Trp64Ran(HE1),
Ser22Trn1(H)-Gln82Ran(OE1), and Ser22Trn1(OG)-
Gln82Ran(HE22), suggesting that HR1 behaves like a claw
to grasp the RanGTP tightly. This finding confirms previ-
ous deletion mutant studies that identified the N-termi-
nal region of Kapb as an important interaction site for
RanGTP.27–29 After GTP hydrolysis, the residue Glu46
(OE2) in switch I forms an H-bond with the Ser24 (HG)
in HR1, which pulls the HR1 closer to switch I compared
with RanGTP (0.58 nm for Trn1-GDP and 0.74 nm for
Trn1-GTP, COM of Glu46Ran and COM of Ser24Trn1 were
taken as reference). This movement results in the disrup-
tion of those three H-bonds between Ran and HR1
(Fig. 8, bottom left) and thus reduces the binding affinity
of RanGDP to Trn1, which at least partly interprets why
Trn1 preferentially binds to RanGTP rather than to
RanGDP.
2. Switch II
In Trn1-GTP, switch II of Ran adopts a stable and
extended helix structure [Fig. 9(A)], which is induced
by its H-bonds with switch I, involving the interactions
between Gln69 (O) and Phe72 (H), Gly74 (H) and
Gly44 (O), and Phe72 (O) and Gly44 (H). This switch
fits snugly into the concave of HR1–HR2 of Trn1
[Fig. 9(B)]. After GTP hydrolysis, switch II forms a
loose and coiled conformation as a consequence of the
removal of the constraint from switch I (disruption of
Figure 8Superposition of the average structures of the Trn1-GTP (magenta) and the Trn1-GDP (orange). Residues in the Trn1-GTP are shown in stick
representation, while residues in the Trn1-GTP are shown in line representation. The color scheme is as follows: hydrogen in white, carbon in
orange (Trn1-GDP) or magenta (Trn1-GTP), nitrogen in blue, and oxygen in red. In Trn1-GTP, HR1 forms three H-bonds with Ran includingSer22Trn1(O)-Trp64Ran(HE1), Ser22Trn1(H)-Gln82Ran(OE1) and Ser22Trn1(OG)-Gln82Ran(HE22) (the dashed lines). The time evolution of these three
H-bonds is shown in top right inset. After GTP hydrolysis, the residue Glu46 (OE2) in switch I forms an H-bond with the Ser24 (HG) in HR1
(the dashed line), which pulls the HR1 to be more contiguous to switch I. This movement causes the disruption of those H-bonds between HR1
and Ran as evidence by the left bottom inset. [Color figure can be viewed in the online issue, which is available at wileyonlinelibrary.com.]
X. Wang et al.
392 PROTEINS
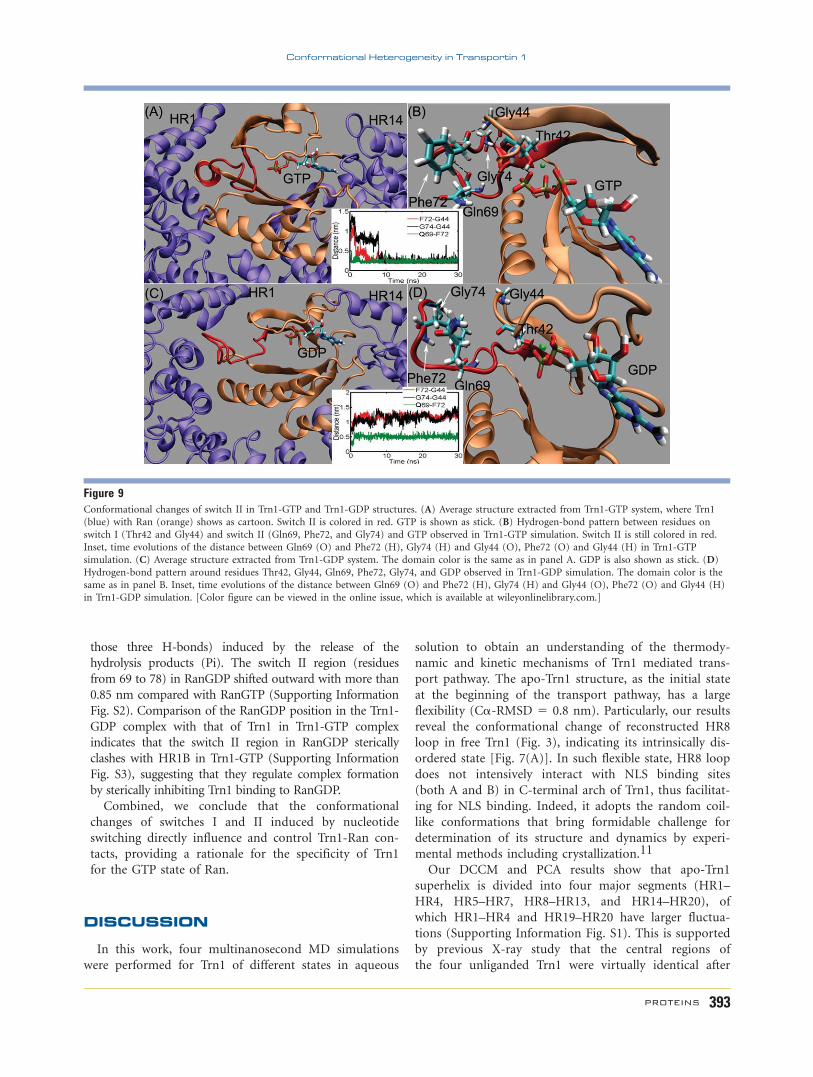
those three H-bonds) induced by the release of the
hydrolysis products (Pi). The switch II region (residues
from 69 to 78) in RanGDP shifted outward with more than
0.85 nm compared with RanGTP (Supporting Information
Fig. S2). Comparison of the RanGDP position in the Trn1-
GDP complex with that of Trn1 in Trn1-GTP complex
indicates that the switch II region in RanGDP sterically
clashes with HR1B in Trn1-GTP (Supporting Information
Fig. S3), suggesting that they regulate complex formation
by sterically inhibiting Trn1 binding to RanGDP.
Combined, we conclude that the conformational
changes of switches I and II induced by nucleotide
switching directly influence and control Trn1-Ran con-
tacts, providing a rationale for the specificity of Trn1
for the GTP state of Ran.
DISCUSSION
In this work, four multinanosecond MD simulations
were performed for Trn1 of different states in aqueous
solution to obtain an understanding of the thermody-
namic and kinetic mechanisms of Trn1 mediated trans-
port pathway. The apo-Trn1 structure, as the initial state
at the beginning of the transport pathway, has a large
flexibility (Ca-RMSD 5 0.8 nm). Particularly, our results
reveal the conformational change of reconstructed HR8
loop in free Trn1 (Fig. 3), indicating its intrinsically dis-
ordered state [Fig. 7(A)]. In such flexible state, HR8 loop
does not intensively interact with NLS binding sites
(both A and B) in C-terminal arch of Trn1, thus facilitat-
ing for NLS binding. Indeed, it adopts the random coil-
like conformations that bring formidable challenge for
determination of its structure and dynamics by experi-
mental methods including crystallization.11
Our DCCM and PCA results show that apo-Trn1
superhelix is divided into four major segments (HR1–
HR4, HR5–HR7, HR8–HR13, and HR14–HR20), of
which HR1–HR4 and HR19–HR20 have larger fluctua-
tions (Supporting Information Fig. S1). This is supported
by previous X-ray study that the central regions of
the four unliganded Trn1 were virtually identical after
Figure 9Conformational changes of switch II in Trn1-GTP and Trn1-GDP structures. (A) Average structure extracted from Trn1-GTP system, where Trn1
(blue) with Ran (orange) shows as cartoon. Switch II is colored in red. GTP is shown as stick. (B) Hydrogen-bond pattern between residues on
switch I (Thr42 and Gly44) and switch II (Gln69, Phe72, and Gly74) and GTP observed in Trn1-GTP simulation. Switch II is still colored in red.
Inset, time evolutions of the distance between Gln69 (O) and Phe72 (H), Gly74 (H) and Gly44 (O), Phe72 (O) and Gly44 (H) in Trn1-GTP
simulation. (C) Average structure extracted from Trn1-GDP system. The domain color is the same as in panel A. GDP is also shown as stick. (D)
Hydrogen-bond pattern around residues Thr42, Gly44, Gln69, Phe72, Gly74, and GDP observed in Trn1-GDP simulation. The domain color is thesame as in panel B. Inset, time evolutions of the distance between Gln69 (O) and Phe72 (H), Gly74 (H) and Gly44 (O), Phe72 (O) and Gly44 (H)
in Trn1-GDP simulation. [Color figure can be viewed in the online issue, which is available at wileyonlinelibrary.com.]
Conformational Heterogeneity in Transportin 1
PROTEINS 393
exclusion of terminal repeats HR1–HR4 and HR14–
HR20,15 which indicates the robustness of our results.
Actually, based on the domain motion analyses using
DynDom and DCCM, we draw a quantitative picture of
the underlying dynamic mechanism of Trn1.
As shown in Figure 10(A) (right), the hinge bending
motion between HR1–HR4 and HR8–HR20, coupling
with the rotation of HR1–HR7 and HR14–HR20, drives
the open/closed motions of apo-Trn1, which increase or
decrease the size of N- and C-terminal arches. Interest-
ingly, the apo-Trn1 system shows a preference for the
open conformation [Fig. 2(B)], with ligand binding sites
fully exposed to the solvent. Since the domain open/clo-
sure is generally believed to facilitate the substrate bind-
ing, we suggest that the flexibility and conformational
heterogeneity of Trn1 is relevant to its rapid recognition
and sequestration for the NLS in cytoplasm compart-
ment, which is in agreement with the high affinity of
NLS with Trn111 [Fig. 10(A), middle].
Upon the binding of M9 (NLS), the flexibility and
conformational heterogeneity of Trn1, especially for its
C-terminal arch, are significantly suppressed compared
with the apo-Trn1 system. For the Trn1 movement at the
C-terminal, HR1–HR13 in this receptor undergoes hinge
bending and rotary motions relative to HR14–HR20 as
evidenced by the PC2 [Fig. 6(E)] and the PC3 [Fig.
6(F)]. The HR13–HR14 serves as a pivot of the rotation,
probably facilitating the binding of C-terminal RX2–5PY
motif of M9 with Trn1 at site A. This binding then leads
to an induced-fit interaction between the hydrophobic
motif (273Phe-Gly-Pro-Met276) of M9 and the site B of
Trn1. The flexibility of HR19–HR20 of Trn1 in site B
enhances the conformational changes of the N-terminus
of M9 with an increased RMSF value of 0.1 nm, finally
facilitating the release of M9 from site B. While for the
motions of Trn1 at the N-terminal, the bending motion
between HR1–HR7 and HR8–HR13 makes the N-termi-
nal arch of this receptor swiftly convert into a compact
state to seal off most of its binding sites for RanGTP
[Fig. 10(A), left]. Interestingly, after removal of M9, the
conformation of Trn1 becomes unstable again and under-
goes a rapid and extensive opening motion (Supporting
Information Fig. S4), as shown by the increased Rg of Cafrom 3.22 to 3.6 nm within �10 ns. The final open con-
formation is comparable with the crystal structure of
apo-Trn1 (Rg of Ca of the apo-Trn1 crystal structure is
3.5 nm), confirming that the conformational change of
Trn1 in Trn1-M9 is induced by the binding of M9.
After the M9 binding, Trn1 passes through NPCs to
the nucleus, where the partial opening of the N-terminal
region in Trn1-M9 structure would help initial binding
of the RanGTP switches I and II to the HR1–HR2 sec-
tion. Then, the opening and closing motions of C-termi-
nal arch in Trn1 [Fig. 4(B)] empower the basic patch of
Ran to approach the HR8 loop. Upon RanGTP binding,
this loop changes its conformation and adopts a partly
unfolded a-helix conformation (Helix II), aiding
RanGTP to reorient this loop conveniently [Fig. 7(C)].
Meanwhile, the HR17–HR20 of Trn1 moves toward the
residues 345–368 in HR8 loop [Fig. 6(I)]. The combined
movement thus promotes the competitively binding
of HR8 loop with M9 at site B and finally leads to the
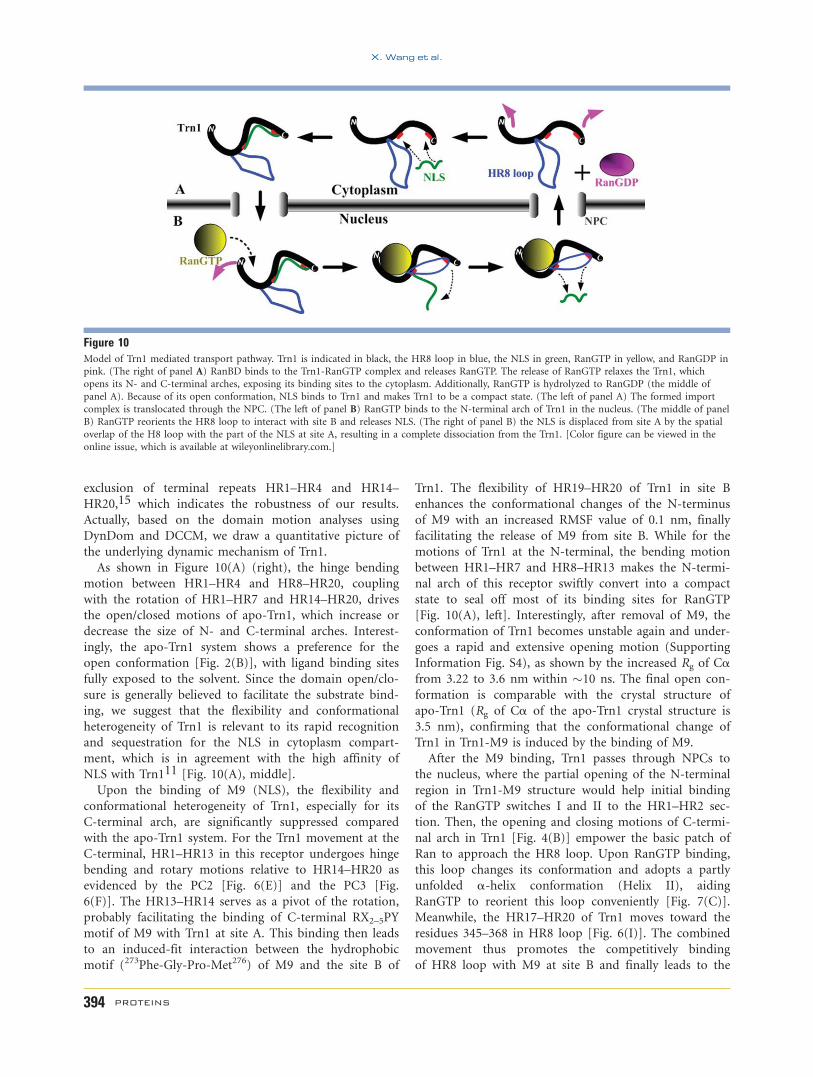
Figure 10Model of Trn1 mediated transport pathway. Trn1 is indicated in black, the HR8 loop in blue, the NLS in green, RanGTP in yellow, and RanGDP inpink. (The right of panel A) RanBD binds to the Trn1-RanGTP complex and releases RanGTP. The release of RanGTP relaxes the Trn1, which
opens its N- and C-terminal arches, exposing its binding sites to the cytoplasm. Additionally, RanGTP is hydrolyzed to RanGDP (the middle of
panel A). Because of its open conformation, NLS binds to Trn1 and makes Trn1 to be a compact state. (The left of panel A) The formed import
complex is translocated through the NPC. (The left of panel B) RanGTP binds to the N-terminal arch of Trn1 in the nucleus. (The middle of panel
B) RanGTP reorients the HR8 loop to interact with site B and releases NLS. (The right of panel B) the NLS is displaced from site A by the spatial
overlap of the H8 loop with the part of the NLS at site A, resulting in a complete dissociation from the Trn1. [Color figure can be viewed in the
online issue, which is available at wileyonlinelibrary.com.]
X. Wang et al.
394 PROTEINS
dissociation of M9 [Fig. 10(B), middle]. This finding
extends and adds atomic details to the proposed Ran-
mediated substrate dissociation mechanism for Trn1
involved its HR8 loop which interacts with both Ran and
the substrate binding sites of Trn1[Fig. 10(B), right].22
After the release of M9, Trn1 complexed with RanGTP
is recycled to the cytoplasm.2 In this complex, switch II
adopts a helical conformation induced by the key H-
bonding interactions between switches II and I, which
can interact effectively with HR1–HR2 (a primary bind-
ing site for Ran). However, GTP hydrolysis activated by
RanGAP abolishes the constraint from switch I, allowing
switch II region to adopt a disordered conformation.
This conformational change of the switches I and II is
sufficient to alter the interaction between Trn1 and Ran,
resulting in that Trn1 has much weaker affinity
(�4 orders of magnitude) for RanGDP than for RanGTP.
Despite the weak binding affinity of RanGDP with
Trn1, the high cytoplasmic concentrations of RanGDP
(1.3–1.5 lM)30,31 would allow it rebind to Trn1, unless
sequestered by high affinity ligands (such as NLS-con-
taining cargo). Notably, the RanGDP still interacts with
HR8 loop and steers its distal portion toward site B in
Trn1-GDP, and this may prevent the binding of mole-
cules that would otherwise interact nonspecifically and
be targeted to the nucleus, thereby enhancing the speci-
ficity in the transport cycle.
CONCLUSIONS
By extended MD simulations, we have investigated the
structure and dynamics of the free and NLS/Ran-bound
Trn1 in this study, revealing dynamics of conformational
heterogeneity of Trn1 in both nuclear and cytosolic
states. Our main findings are summarized as follows.
1. According to DCCM and PCA, the conformational
heterogeneity of Trn1 has been identified as generally
segmental architecture, and the segmented transition
occurs in different states of Trn1. Nevertheless, the
segments rotate relative to each other about a flexible
hinge and thereby force Trn1 to adopt a conformation
compatible with the binding of Ran or substrates.
Then the flexibility and conformational heterogeneity
of Trn1 is suppressed significantly by the binding of
substrates or Ran.
2. HR8 loop is an IDR whose conformation depends on
different cargoes’ binding. Particularly, Helix I and II
adopted by HR8 loop undergo disorder-to-structure
transition in different states of Trn1, facilitating
RanGTP to reorient the HR8 loop and thus to make
it allosterically communicate with C-terminal arch.
3. Although M9 interacts strongly with both sites A and
B, the high flexibility of N-terminus of M9 and
HR19–HR20 of Trn1 would facilitate for the release of
M9 at site B, which controls overall binding affinity
for Trn1.
4. The conformational changes of switches I and II of
Ran induced by GTP hydrolysis directly influence and
control Trn1-Ran contacts, explaining why Trn1 pref-
erentially binds to RanGTP rather than to RanGDP.
Overall, our study provides an in-depth analysis of the
nuclear export pathway mediated by Trn1, especially on
the coordination of interactions and the dynamics of
conformational heterogeneity that underlies the process.
This will be important for full understanding of the regu-
lation of the nuclear transport mechanisms.
MATERIALS AND METHODS
Model preparation
Four systems are of interest: apo-Trn1, Trn1-M9, Trn1-
GTP, and Trn1-GDP. For apo-Trn1, Trn1-M9, and Trn1-
GTP, atomic coordinates were obtained from PDB Data
Bank [PDB codes 2Z5J (3.40-A resolution), 2H4M (3.05-
A resolution), and 1QBK (3.00-A resolution), respec-
tively]. To prepare the Trn1-GTP complex that includes
the single magnesium ion, all selenomethionine residues
were replaced with methionine residues by changing the
selenium atom to a sulfur atom. The nonhydrolysable
GTP analogue, GppNHp, was mutated to GTP by replac-
ing nitrogen atom with a phosphorus atom. The short
missing loop sections (residues 167–169, 353–357), as
well as missing side chains, were modeled and optimized
by using the Biopolymer module in Sybyl version 6.9
(Tripos Associates, St. Louis, MO). For the simulation of
Trn1-GDP, the structure was obtained by replacing GTP
with GDP, while magnesium ion remained. For Trn1-M9,
the engineered GGSGGSG HR8 loop linker in original
PDB (2H4M) was deleted. As mentioned in introduction,
there are merely the X-ray crystal structures of apo-Trn1
or Trn1-M9 complexes with more than 18 missing resi-
dues at HR8 loop available currently, although an X-ray
crystal structure of a Trn1-GTP complex with only five
missing residues (353 to 357) in HR8 loop has been
reported. Therefore, missing main chains at HR8 loop of
the apo- and M9-bound Trn1 were complemented using
the same region of the Trn1-GTP complex, but this con-
structed region does not interact with HR14–HR20
directly. The other missing residues (residues 37–43, 78,
79 in M9-bound Trn1) were also reconstructed by using
Sybyl. The protonation states of the titratable groups of
Trn1 in four systems were checked by using Whatif.32
Molecular dynamics simulations
All MD simulations were performed with the GRO-
MACS 4.0.4 package33 using amber03 force field34
and the TIP3P water model.35 For each system, the
Conformational Heterogeneity in Transportin 1
PROTEINS 395
minimum distance between the protein and the box walls
was set to 15 A so that the protein does not directly
interact with its own periodic image. The systems were
solvated, and Na1 and Cl2 counterions were added to
achieve a 150 mM concentration.
To relieve possible steric clashes and overlaps of side
chains prior to MD runs, all four systems first underwent
5000 steps of steepest descent and 10,000 steps of conju-
gate gradient minimizations. Then the solvent molecules
in the minimized models were heated up to 300 K and
equilibrated 200 ps with the positional restraints on the
protein heavy atoms. The MD simulation was then con-
tinued for 30 ns, where the coordinates were saved every
10 ps for analyses.
MD simulations were carried out with no constraint at
constant temperature of 300 K using Berendsen thermo-
stat36 and at a constant pressure of 1 atm with a 2.0-fs
time step. Pressure and temperature coupling constants
were 0.5 and 0.1 ps, respectively. The values of the iso-
thermal compressibility were set to 4.5 3 1025 bar21 for
water simulations. All bond lengths including hydrogen
atoms were constrained by the LINCS algorithm.37 The
nonbonded interaction pair-list was updated every 10 fs.
The simulations used periodic boundary conditions and
the particle mesh Ewald (PME) method38 to calculate
the long-range electrostatic interactions. Van der Waals
and coulomb interactions were truncated at 1.4 and 1.0
nm, respectively.
Cross-correlation analysis
The DCCM Cij was calculated to analyze the collective
motions of the Trn1. The cross-correlation coefficient Cij,
between atoms i and j, is a measure of the correlated nature
of their atomic fluctuations and computed as follows:
Cij ¼ Dri3Drj� �. ffiffiffiffiffiffiffiffiffiffiffiffiffiffiffiffiffiffiffiffiffiffiffiffiffiffi
hDr2i i3hDr2j iq
ð1Þ
where Dri and Drj correspond to the atomic displacement
vectors for atoms i and j, respectively, and the angle brack-
ets indicate time averages. The elements C(i, j) can be col-
lected in matrix form and displayed as a 3D dynamical
cross-correlation map.39
Principal component analysis
PCA was carried out on the last 15-ns trajectory to
identify the most significant fluctuation modes of the
proteins. Thus, we can monitor the concerted motions of
the atoms of the molecule in a few dimensions, making
it easier to visualize and investigate these motions. PCA
is a linear transformation applied to the fluctuations
in the Cartesian coordinates, represented as a positional
covariance matrix C, whose elements are defined as
Cij ¼ h xi � hxiið Þih xj � hxji� �iði; j ¼ 1; 2; 3; . . . ; 3NÞ; ð2Þ
where xi and xj are the Cartesian coordinates for the ith
and jth Ca atom, respectively. N is the number of the
Ca atoms considered, and the angle brackets represent
the time average over all the configurations obtained in
the simulation. The eigenvectors of the covariance ma-
trix, mk, obtained to solve mTk Cmk ¼ kk , diagonalization of
C provides a group of 3N orthogonal eigenvectors, mk, ascolumns of matrix C, along which the fluctuations
observed in the simulation are uncoupled with respect to
each other (i.e., Cij 5 0 if i = j) and thus can be ana-
lyzed separately. The eigenvalue for a mode denotes the
relative contribution that this mode has made to motion
within the trajectory.40 The hinge axes of the domain
rotation were calculated by the program DynDom.41
ACKNOWLEDGMENTS
The authors are grateful to Prof. Ling Yang for access
of Sybyl software.
REFERENCES
1. Weis K. Regulating access to the genome: nucleocytoplasmic trans-
port throughout the cell cycle. Cell 2003;112:441-451.
2. Conti E, Muller CW, Stewart M. Karyopherin flexibility in nucleo-
cytoplasmic transport. Curr Opin Struct Biol 2006;16:237–244.
3. Chook YM, Blobel G. Karyopherins and nuclear import. Curr Opin
Struct Biol 2001;11:703–715.
4. Quimby BB, Dasso M. The small GTPase Ran: interpreting the
signs. Curr Opin Cell Biol 2003;15:338–344.
5. Conti E, Uy M, Leighton L, Blobel G, Kuriyan J. Crystallographic
analysis of the recognition of a nuclear localization signal by the
nuclear import factor karyopherin alpha. Cell 1998;94:193–204.
6. Guttinger S, Muhlhausser P, Koller-Eichhorn R, Brennecke J, Kutay
U. Transportin2 functions as importin and mediates nuclear import
of HuR. Proc Natl Acad Sci U S A 2004;101:2918–2923.
7. Rebane A, Aab A, Steitz JA. Transportins 1 and 2 are redundant nu-
clear import factors for hnRNP A1 and HuR. RNA 2004;10:590–
599.
8. Suzuki M, Iijima M, Nishimura A, Tomozoe Y, Kamei D, Yamada
M. Two separate regions essential for nuclear import of the hnRNP
D nucleocytoplasmic shuttling sequence. FEBS J 2005;272:3975–
3987.
9. Siomi H, Dreyfuss G. A nuclear localization domain in the hnRNP
A1 protein. J Cell Biol 1995;129:551–560.
10. Lee BJ, Cansizoglu AE, Suel KE, Louis TH, Zhang Z, Chook YM. Rules
for nuclear localization sequence recognition by karyopherinb2. Cell2006;126:543–558.
11. Imasaki T, Shimizu T, Hashimoto H, Hidaka Y, Kose S, Imamoto
N, Yamada M, Sato M. Structural basis for substrate recognition
and dissociation by human transportin 1. Mol Cell 2007;28:57–67.
12. Andrade MA, Bork P. HEAT repeats in the Huntington’s disease
protein. Nat Genet 1995;11:115–116.
13. Cansizoglu AE, Chook YM. Conformational heterogeneity of
karyopherinb2 is segmental. Structure 2007;15:1431–1441.
14. Sotomayor M, Schulten K. Single molecule experiments in vitro and
in silico. Science 2007;316:1144–1148.
15. Chook YM, Jung A, Rosen MK, Blobel G. Uncoupling Kapb2 sub-
strate dissociation and Ran binding. Biochemistry 2002;41:6955–
6966.
16. Cansizoglu AE, Lee BJ, Zhang ZC, Fontoura BM, Chook YM.
Structure-based design of a pathway-specific nuclear import inhibi-
tor. Nat Struct Mol Biol 2007;14:452–454.
X. Wang et al.
396 PROTEINS
17. Wang Y, Li Y, Ma Z, Yang W, Ai C. Mechanism of microRNA-target
interaction: molecular dynamics simulations and thermodynamics
analysis. PLoS Comput Biol 2010;6:e1000866.
18. Xu X, Yang W, Wang X, Li Y, Wang Y, Ai C. Dynamic communica-
tion between androgen and coactivator: mutually induced confor-
mational perturbations in androgen receptor ligand-binding do-
main. Proteins 2011;79:1154–1171.
19. Xu X, Wang X, Xiao Z, Li Y, Wang Y. Two TPX2-dependent
switches control the activity of Aurora A. PLoS One 2011;6:e16757.
20. Wang X, Xu X, Ma Z, Huo Y, Xiao Z, Li Y, Wang Y. Dynamic
mechanisms for pre-miRNA binding and export by Exportin-5.
RNA 2011;17:1511–1528.
21. Li L, Uversky VN, Dunker AK, Meroueh SO. A computational
investigation of allostery in the catabolite activator protein. J Am
Chem Soc 2007;129:15668–15676.
22. Chook Y, Blobel G. Structure of the nuclear transport complex kar-
yopherin-beta2-Ran�GppNHp. Nature 1999;399:230–237.
23. Kabsch W, Sander C. Dictionary of protein secondary structure:
pattern-recognition of hydrogen-bonded and geometrical features.
Biopolymers 1983;22:2577–2637.
24. Sickmeier M, Hamilton JA, LeGall T, Vacic V, Cortese MS, Tantos
A, Szabo B, Tompa P, Chen J, Uversky VN, Obradovic Z, Dunker
AK. DisProt: the database of disordered proteins. Nucleic Acids Res
2007;35:786–793.
25. Uversky VN. Natively unfolded proteins: a point where biology
waits for physics. Protein Sci 2002;11:739–756.
26. Macara IG. Transport into and out of the nucleus. Microbiol Mol
Biol Rev 2001;65:570–594.
27. Kutay U, Izaurralde E, Bischoff FR, Mattaj IW, Gorlich D. Domi-
nant-negative mutants of important-beta block multiple pathways
of import and export through the nuclear pore complex. EMBO J
1997;16:1153–1163.
28. Kose S, Imamoto N, Tachibana T, Shimamoto T, Yoneda Y. Ran-
unassisted nuclear migration of a 97-kD component of nuclear
pore-targeting complex. J Cell Biol 1997;139:841–849.
29. Chi NC, Adam EJH, Adam SA. Different binding domains for Ran-
GTP and Ran-GDP/RanBP1 on nuclear import factor p 9 7. J Biol
Chem 1997;272:6818–6822.
30. Chaillan-Huntington C, Braslavsky CV, Kuhlmann J, Stewart M.
Dissecting the interactions between NTF2, RanGDP, and the nucle-
oporin XFXFG repeats. J Biol Chem 2000;275:5874–5879.
31. Gorlich D, Seewald MJ, Ribbeck K. Characterization of Ran-
driven cargo transport and the RanGTPase system by kinetic
measurements and computer simulation. EMBO J 2003;22:1088–
1100.
32. Vriend G. WHAT IF: a molecular modeling and drug design pro-
gram. J Mol Graph 1990;8:52–56.
33. Hess B, Kutzner C, Van Der Spoel D, Lindahl E. GROMACS 4:
algorithms for highly efficient, load-balanced, and scalable molecu-
lar simulation. J Chem Theory Comput 2008;4:435–447.
34. Duan Y, Wu C, Chowdhury S, Lee MC, Xiong G, Zhang W, Yang
R, Cieplak P, Luo R, Lee T, Caldwell J, Wang J, Kollman P. A point-
charge force field for molecular mechanics simulations of proteins
based on condensed-phase quantum mechanical calculations.
J Comp Chem 2003;24:1999–2012.
35. Jorgensen WL, Chandrasekhar J, Madura JD, Impey RW, Klein ML.
Comparison of simple potential functions for simulating liquid
water. J Chem Phys 1983;79:79926–79935.
36. Berendsen HJC, Postma JPM, DiNola A, Haak JR. Molecular dy-
namics with coupling to an external bath. J Chem Phys 1984;81:
3684–3690.
37. Hess B, Bekker H, Berendsen HJC, Fraaije JGEM. LINCS: a linear
constraint solver for molecular simulations. J Comput Chem
1997;18:1463–1472.
38. Darden T, York D, Pedersen L. Particle mesh Ewald: an N�log(N)method for Ewald sums in large systems. J Chem Phys 1993;98:
10089–10092.
39. Swaminathan S, Harte WE, Jr, Beveridge DL. Investigation of domain
structure in proteins via molecular dynamics simulation: application
to HIV-1 protease dimer. J Am Chem Soc 1991;113:2717–2721.
40. Sherer EC, Harris SA, Soliva R, Orozco M, Laughton CA. Molecular
dynamics studies of DNA A-tract structure and flexibility. J Am
Chem Soc 1999;121:5981–5991.
41. Hayward S, Berendsen HJ. Systematic analysis of domain motions
in proteins from conformational change: new results on citrate
synthase and T4 lysozyme. Proteins 1998;30:144–154.
Conformational Heterogeneity in Transportin 1
PROTEINS 397


![Rotational Ligand Dynamics in Mn[N(CN) 2 ] 2 .pyrazine](https://img.pdfslide.us/doc/110x75/56815d96550346895dcbb50b/rotational-ligand-dynamics-in-mnncn-2-2-pyrazine.jpg)