Embed Size (px)
Citation preview
Neurocomputiag 6 (1994) 443-454 443 Elsevier
NEUCOM 246
Proteinotopic feature maps
Juan J. Merelo a, , , Miguel A. Andrade b, Alberto Prieto a and Federico Mor~in b
a Dept. de Electr6nica y Tecnologia de Computadores, Facultad de Ciencias, Universidad de Granada,
18071 Granada, Spain b Dept. de Bioquimica y Biologia Molecular I, Facultad de Quimicas, Universidad Complutense, 28040
Madrid, Spain
Received 17 February 1992 Revised 12 February 1993
Abstract
In this paper a system based on Kohonen's SOM (Self-Organizing Map) for protein classification according to Circular Dichroism (CD) spectra is described. As a result, proteins with different secondary structures are clearly separated through a completely unsupervised training process. The algorithm is able to extract features from a high-dimensional vector (CD spectra) and map it to a 2-dimensional network. A new measure, called distortion, has been introduced to test SOM performance. Distortion can be used to fine tune and optimize some of the parameters of the SOM algorithm.
Keywords. Neural network applications; self-organizing maps; classification procedures; circular dichro- ism; protein structure.
1. Introduction
Vector Quantization (VQ) algorithms are widely used for pattern recognition and classifi- cation tasks. A VQ algorithm clusters input samples around a predetermined set of vectors called codebook or dictionary. A classical, and very simple, VQ algorithm is k-means, currently used in pattern recognition tasks [20]. On the other hand, Self-Organizing Maps (SOM) [16], also known as Self Organizing Feature Maps or Feature Maps, are algorithms that achieve VQ through a neural network mechanism.
Kohonen and co-workers [10, 12-18] state that an unsupervised self-organization process gives way to a map (from input space to a lower-dimensional space) from which features implicit in the input patterns can be extracted. This has been proved for phonemes, and applied to speech recognition [13, 14, 17, 19], as well as many other applications. In general the number of features corresponds to the dimension of the Kohonen map. However, it will be shown that this feature map is also achieved from a vector set with more implicit features than feature map dimensions (3 and 2 respectively, in the case presented here).
* Corresponding author. Tel: 34 58 243162, f~x: 34 58 243230, email: [email protected]
0925--2312/94/$07.00 (~) 1994 - Elsevier Science B.V. All rights reserved
444 J.J. Merelo et al.
In the application presented in this paper the SOM algorithm is implemented for the classification of proteins from circular dichroism (CD) spectra data. This algorithm is used on a set of proteins with a known secondary structure to obtain a reference feature-map. The main objective of this map is to infer and compute structural data of unknown proteins from its CD spectra, as has been published elsewhere [1].
The failure of the classical statistical methods (based on linear regression) for the analysis of protein structures suggests the use of non-linear methods such as neural networks algorithms that are able to learn from examples and to generalize from the learned data. Then, the analysis of protein structures by means of ANNs (Artificial Neural Networks) has been the objective of various researchers [2-6, 8, 11, 25]. Several of them have based their work on the use of aminoacid sequences, either to obtain the structure of one part of the protein [25, 11], not the whole structure, or to classify proteins and infer some properties from their classification [2].
Backpropagation methods have been shown useful to obtain mapping between sequence and secondary structures [25, 8, 11] or to recognize other protein characteristics. Recently B t h m et al. [3] have used backpropagation learning from CD spectra of proteins in dissolution for secondary structure prediction purposes improving the previous results in the calculation of the structure. Nevertheless, this kind of network could not have a generalization capability in the calculation of other proteins since the number of connections in the network exceeded by far the advisable empirical ratio examples/connections for this kind of network [26].
Since in the problem a small number of examples (proteins) is available and there is a great amount of information for every example (data spectra values) an unsupervised learning algorithm, such as the SOM, seems to be more appropriate. Ferran et al. [5, 6] have used this algorithm to classify protein sequences belonging to the same animal species, starting from frequencies of pairs of amino-acids (input vectors of 20 × 20 elements).
There are still other applications of neural networks to molecular biology, as is shown in Brunak et al. [4], where ANNs are used to find optimal places for mRNA splicing.
The new approach presented here (and anticipated in [22, 23]) differs from those above cited with respect to its objectives or to the manner of approaching the problem. In fact, the aim here is to obtain a classification of proteins, in general, and based upon Circular Dichroism spectra data. In this way the input vectors dimension is low (32 elements) and thus the network architecture is less complex, programming is simplified and computation time is reduced in comparison to other classification. Note also the efficiency of the proposed method (Sections 3.2 and 4) since the extracted features are strongly correlated, and the interest from the biochemical point of view of the classifications obtained that permit us to automatically calculate the secondary structure for unknown proteins [1].
The rest of this paper is composed of three sections. In Section 2 a brief summary is presented of the nature of the problem presented by classification. Section 3 is dedicated to describing proteinotopic maps. Finally a discussion of the results obtained is included in Section 4.
2. Protein structure and CD spectra
Far Ultra-Violet CD spectra have often been used as a method for the study of protein conformation (for a review see [27]), due to the observation that proteins with different secondary structures would produce different CD spectra in the UV region of 0 to 250 nanometres.
Pr oteinotopic .feature maps 445
The problem of computing the secondary structure of proteins from CD spectra has tradi- tionally been solved [17] by calculating the CD spectra corresponding to hypothetical proteins with 'pure' a, /5 and random structures (estimated either from model polypeptides or from proteins of known structure) and assuming that the experimental spectrum of an unknown protein can be decomposed as a linear combination of those a,/3 and random spectra. Then, the factors that best fit the experimental spectrum are taken as the percentages of secondary structures [21]. These methods face two main problems. First, the validity and calculation of the sets of reference spectra, and second, the determination of the function that relates the CD spectrum with the percentages of secondary structures. A consequence of these problems is the erroneous determination of protein parameters and one frequently finds very different fitting parameters for proteins with similar CD spectra.
Some other methods based on both linear and non-linear multilayer perceptrons have been tested by us. In this case, 3 output neurons were used, which should give the secondary structure percentages for unknown proteins. Due to the small set of samples, valid results were not obtained, because the MLP was unable to generalize.
Statistical methods, based on principal component analysis, were also tested. From the analysis of the 24-vector sample, there were observed to be 2 principal components that explained 95% of the variance. This is consistent with the number of secondary structure percentages (three percentages, with sum equal to 1), but it is quite difficult (or, at least, not straightforward) to fit the coefficients with respect to the found principal component to the actual value of the secondary structure percentage.
The procedure here proposed consists of considering CD spectra n-dimensional vectors, which are then fed into the input layer of the SOM network to produce a proteinotopic map. In this way, using the properties of SOM, CD spectra can be classified, extracting hidden common features. CD means an amount of information (and thus, of computation) greatly inferior to that used in other approaches to protein classification [5, 6].
As our object is to classify in an unsupervised fashion the input set, all the available proteins with known secondary structures are used to compute the map. The same map can be used to compute secondary structure percentages for new proteins, as has been published elsewhere [1].
3. Proteinotopic maps
This section describes the structure of the network employed (Section 3.1) and analyses the set of training samples (Section 3.2).
3.1 Network structure
The SOM framework [18] needs to be adapted to this particular problem. The inputs to SOM algorithm are n-component vectors, which represent CD spectra obtained from proteins in solution. The output (or Kohonen layer) was composed of d × d neurons. In this case, n = 36, and d = 13 or 20. The latter depends on the computer used for training the network.
The input data are very scarce, and, in addition, the number of samples (24, as will be later seen) is less than the number of neurons (169 or 400), so the vector quantization achieved should be accurate.
4 4 6 J.J. Merelo et al.
As in other VQ algorithms, distance from input vectors to its cluster centre (the weight vector of the winning neuron, which is in the output layer) is computed (similar to the J parameter used in classical VQ algorithms, as seen in [20]). The sum of all these distances has been called distortion. Distortion can be defined in two ways, depending on the amount of training samples and the number of neurons.
• CaseA: Number of neurons > number of training samples In this case distortion is calculated as:
n 8
O = I l e i - j,k( i)ll 2 , (1) i=1
where ns is the number of training samples, and l~j,k(£i) represents the weight vector corresponding to the winning neuron (with coordinates j , k), or, in VQ terms, the cluster centre, for the sample vector £i. Please note that this definition of distortion is peculiar to our case, although it can also be applied to other cases, as some applications shown in [16]. In this case, SOM is still a clustering algorithm, but it works clustering weight (or reference) vectors around inputs. When the number of neurons is higher than the number of samples, after a sufficient number of pre-established iterations, distortion falls to 0. Only winning neurons affect D, as can be seen in Eq. (1).
Case B: Number of neurons < number of training samples An alternative measure, D*, can be used, which takes into account the contribution from the whole network, i.e.
d d
j = l k=l II i( k) - l Jkll 2 , (2)
where £i(l~j,k) is the input sample with minimum distance to the weight vector 1~5, k. However, the above D* measure of distortion is more general and applicable to any number of neurons and samples.
The following results were obtained only for case A, because the number of protein samples is less than the number of neurons.
The D* parameter is somewhat different to the d distortion defined as the LMS error achieved when each x is classified as l, Vj,k. However, D* can be considered as a lower boundary for J.
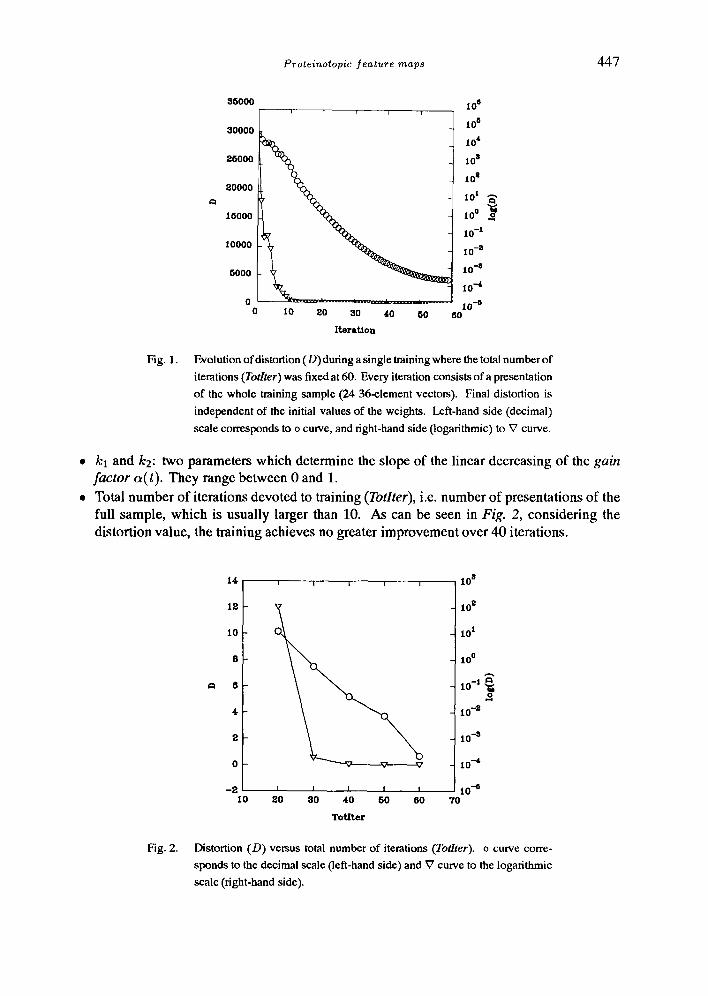
If a good vector quantization is to be achieved, distortion must decrease with time (i.e. with further iterations). This actually happens in SOM algorithms, as can be seen in Fig. 1, and this proves that SOM is a good VQ algorithm, despite its a priori termination condition. It must be taken into account that the SOM algorithms end when the last iteration terminates, and not as a function of the distortion value, as happens, for instance, in k-means.
In case A, i.e. when the number of neurons (d × d) is larger than the number of input samples (ns), distortion is computed using Eq. (1). In this case distortion is used to fine-tune SOM parameters, i.e. the smaller the distortion the better the VQ. According to Kohonen et al. [5], the parameters used in the SOM algorithm are (if d remains fixed):
Proteinotopic feature maps 447
3500t
30000
25000
20000
15000
10000
5000
0 0
I 0 n , i i i i
106
104
l 0 n
10 m
l° t ,~
10 ° o
10-1
10 -s
10 -8
_ 10.-4
± lO-a 10 20 30 40 50 60
Iteration
Fig. 1. Evolution of distortion (D) during a single training where the total number of
iterations (Totlter) was fixed at 60. Every iteration consists of a presentation
of the whole training sample (24 36-element vectors). Final distortion is
independent of the initial values of the weights. Left-hand side (decimal)
scale corresponds to o curve, and right-hand side (logarithmic) to ~7 curve.
kt and k2: two parameters which determine the slope of the linear decreasing of the gain factor (~(t). They range between 0 and 1.
Total number of iterations devoted to training (Totlter), i.e. number of presentations of the full sample, which is usually larger than 10. As can be seen in Fig. 2, considering the distortion value, the training achieves no greater improvement over 40 iterations.
Fig. 2.
14,
10
8
6
4
2
0
- 2 lO
I
I
2 0 I I I
3 0 4 0 5 0 60
TotIter
I 0 n
102
l0 t
100
10 -t ,~ o
10 -s
10 -s
10 -4
10--6 70
Distortion (D) versus total number of iterations (Totlter). o curve corre-
sponds to the decimal scale (left-hand side) and V curve to the logarithmic
scale (right-hand side).
448 d.J. Merelo et al.
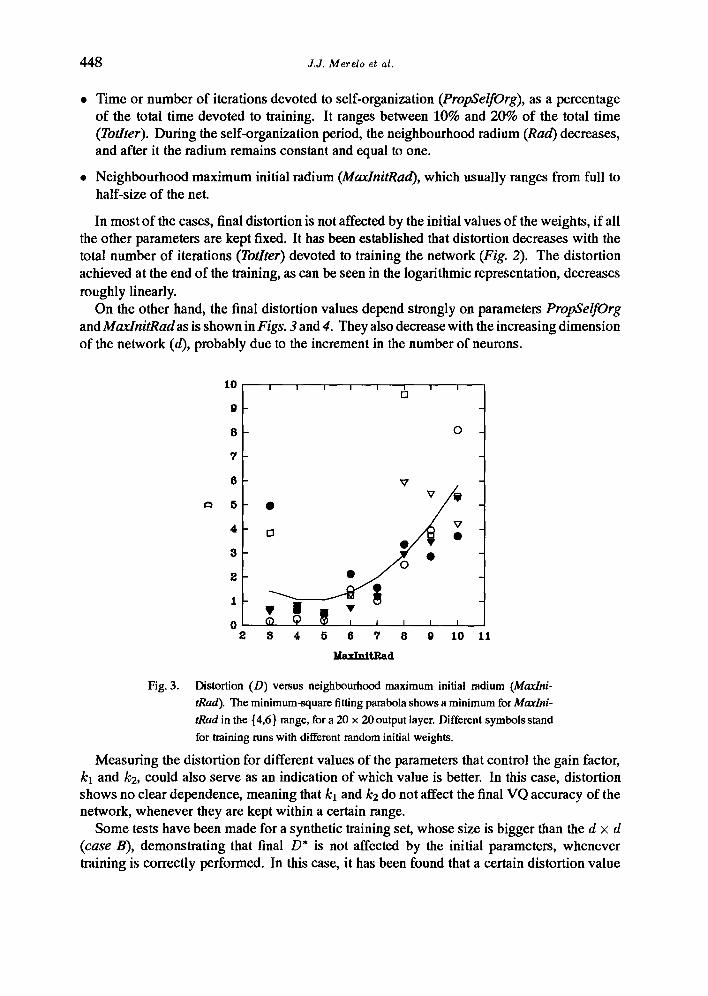
• Time or number of iterations devoted to self-organization (PropSelfOrg), as a percentage of the total time devoted to training. It ranges between 10% and 20% of the total time (Totlter). During the self-organization period, the neighbourhood radium (Rad) decreases, and after it the radium remains constant and equal to one.
• Neighbourhood maximum initial radium (MaxlnitRad), which usually ranges from full to half-size of the net.
In most of the cases, final distortion is not affected by the initial values of the weights, if all the other parameters are kept fixed. It has been established that distortion decreases with the total number of iterations (Totlter) devoted to training the network (Fig. 2). The distortion achieved at the end of the training, as can be seen in the logarithmic representation, decreases roughly linearly.
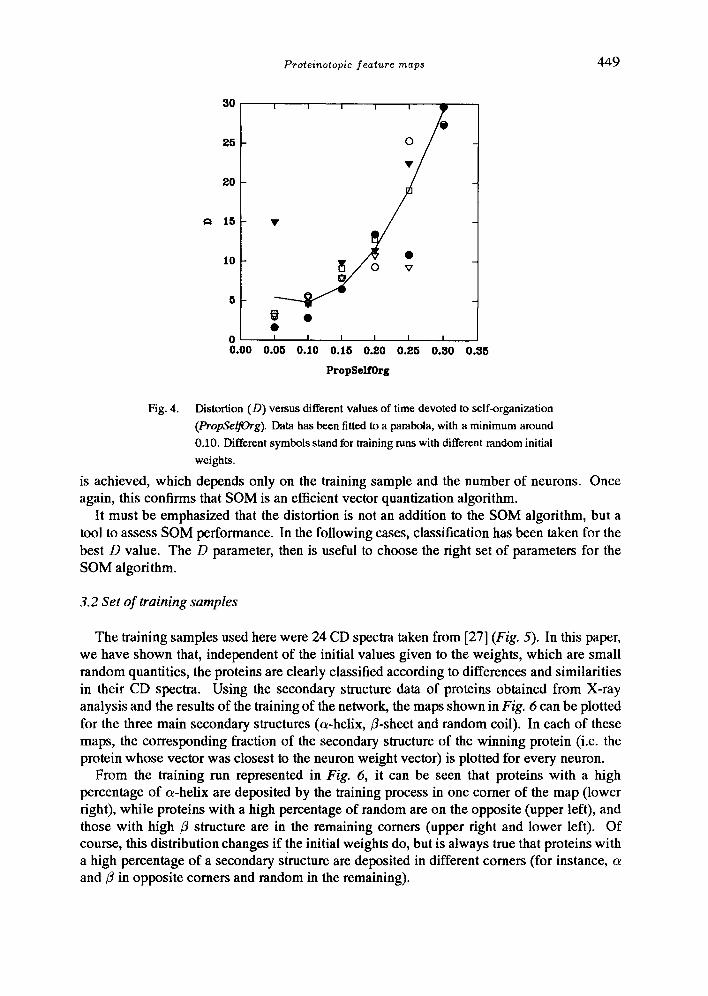
On the other hand, the final distortion values depend strongly on parameters PropSelfOrg and MaxlnitRad as is shown in Figs. 3 and 4. They also decrease with the increasing dimension of the network (d), probably due to the increment in the number of neurons.
1o
9
8
7
6
5
4
8
1
o 2
! I I I I [ .~ I !
0
v
I I I I I
8 4 5 6 7 8 9 10
yATTnIt, Rad
11
Fig. 3. Distortion (D) versus neighbourhood maximum initial radium (Maxlni- tRad). The minimum-square fitting parabola shows a minimum for Maxlni- tRad in the {4,6} range, for a 20 × 20 output layer. Different symbols stand for training runs with different random initial weights.
Measuring the distortion for different values of the parameters that control the gain factor, kl and k2, could also serve as an indication of which value is better. In this case, distortion shows no clear dependence, meaning that kl and k2 do not affect the final VQ accuracy of the network, whenever they are kept within a certain range.
Some tests have been made for a synthetic training set, whose size is bigger than the d × d (case B), demonstrating that final D* is not affected by the initial parameters, whenever training is correctly performed. In this case, it has been found that a certain distortion value
Proteinotopic feature maps 449
SO
85
80
15
10
5
0 0.00 0.35
I I
I ! I I I I
0.05 0.10 0.15 0.20 0.25 0.80
PropSelfOrg
Fig. 4. Distortion (D) versus different values of time devoted to self-organization
(PropSelfOrg). Data has been fitted to a parabola, with a minimum around
0.10. Different symbols stand for training runs with different random initial
weights.
is achieved, which depends only on the training sample and the number of neurons. Once again, this confirms that SOM is an efficient vector quantization algorithm.
It must be emphasized that the distortion is not an addition to the SOM algorithm, but a tool to assess SOM performance. In the following cases, classification has been taken for the best D value. The D parameter, then is useful to choose the right set of parameters for the SOM algorithm.
3.2 Set of training samples
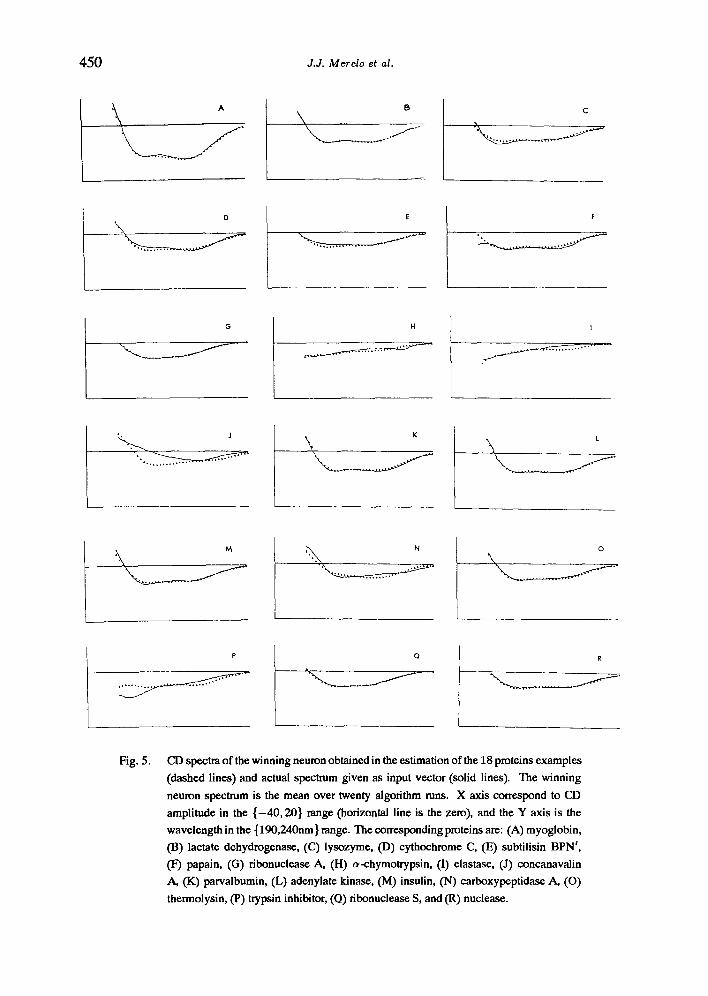
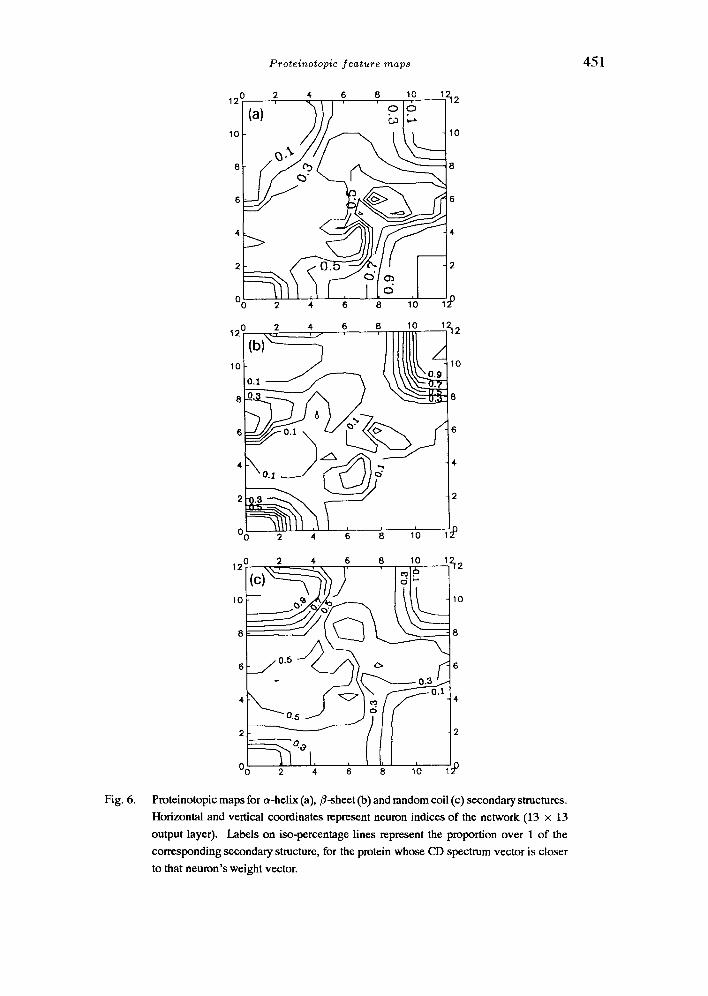
The training samples used here were 24 CD spectra taken from [27] (Fig. 5). In this paper, we have shown that, independent of the initial values given to the weights, which are small random quantities, the proteins are clearly classified according to differences and similarities in their CD spectra. Using the secondary structure data of proteins obtained from X-ray analysis and the results of the training of the network, the maps shown in Fig. 6 can be plotted for the three main secondary structures (a-helix, H-sheet and random coil). In each of these maps, the corresponding fraction of the secondary structure of the winning protein (i.e. the protein whose vector was closest to the neuron weight vector) is plotted for every neuron.
From the training run represented in Fig. 6, it can be seen that proteins with a high percentage of c~-helix are deposited by the training process in one comer of the map (lower right), while proteins with a high percentage of random are on the opposite (upper left), and those with high /~ structure are in the remaining comers (upper right and lower left). Of course, this distribution changes if the initial weights do, but is always true that proteins with a high percentage of a secondary structure are deposited in different comers (for instance, and fl in opposite comers and random in the remaining).
450 d.d. Merelo et al.
B C
D E F
G H I
<.....--
L
M N O \
O
',,,,..._.__..f:1-- R
Fig. 5. CD spectra of the winning neuron obtained in the estimation of the 18 proteins examples (dashed lines) and actual spectrum given as input vector (solid lines). The winning neuron spectrum is the mean over twenty algorithm runs. X axis correspond to CD amplitude in the { -40 , 20} range (horizontal line is the zero), and the Y axis is the wavelength in the { 190,240nm } range. The corresponding proteins are: (A) myoglobin, (13) lactate dehydrogenase, ((2) lysozyme, (D) cythochrome C, (E) subtilisin BPN', (I 7) papain, (G) ribonuclease A, (H) ~-chymotrypsin, (I) elastase, (J) concanavalin A, (K) parvaibumin, (L) adenylate kinase, (M) insulin, (N) earboxypeptidase A, (O) thermolysin, (P) trypsin inhibitor, (O) ribonuclease S, and (R) nuclease.
Proteinotoplc feature maps 451
Fig. 6.
12'
10
8
6
4
2 4 6 8 10 12, 2
a ' ' ' o o
/ / L_._5 '°
12o (b).X.~. 4,... 6, 8 lo 12,2
,2 0 ~ ,,~ ,~,~,~ 2,2 , (c) " - - ~ - , ) 14~" o
,- - ~ ~ 0 - s 0 . ~ ,
I: ,
Proteinotopic maps for a-helix (a), fl-sheet (b) and random coil (c) secondary structures.
Horizontal and vertical coordinates represent neuron indices of the network (13 x 13
output layer). Labels on iso-percentage lines represent the proportion over 1 of the
corresponding secondary structure, for the protein whose CD spectrum vector is closer
to that neuron's weight vector.
452 J.J. Merelo et al.
It proved to be important to include CD spectra from polypeptides and proteins with high a-helix, t-sheet, or random structure, as these mark the boundaries of the map. They are usually mapped to the corners of the map, and the other proteins clustering the neurons be- tween them. This can be interpreted as an interpolation among the samples performed by the algorithm.
4. Discussion
In this paper, in order to classify proteins according to their secondary structure, from circular dichroism data, we have used a 2-dimensional SOM net, and distortion (D) as a new parameter to assess SOM performance. Distortion can be used to optimize SOM efficiency. Furthermore, an increment of distortion can be used instead of a preset number of iterations as a termination condition for algorithms, as in classical VQ algorithms. Other possible applications of distortion values are:
• Debugging SOM programs. An increasing D means the program is not working properly. This use is general, subject to the condition that the samples are always presented in the same order, and the whole sample presented several times.
• Checking out D during training can be a tool for testing network convergence. • Distortion can be used as a fitness measure, to optimize SOM by means of genetic algo-
rithms.
Final distortion depends more on the SOM parameters (except ki and k2) than on initial weight values, for the same number of iterations. Thus, parameters can be fine-tuned to achieve an accurate VQ.
Since the algorithm needs fewer neurons (and connections) than multilayer perceptrons or other neural architectures, SOM has many advantages over those. We can point out two of them: programming is simple, and simulation results can be rapidly obtained. As an example, learning times are almost inappreciable in a workstation (Sun SPARCstation 1 +) and only a few seconds in a PC (20-MHz i386 with i387 mathematical co-processor). Besides, SOM allows much smaller training sets without jeopardizing generalization.
Kohonen [18] states that in the case of phonemes or vowels, two features are to be extracted (corresponding to the 2 main formants), and, to do this, a 2-dimensional map must be used, implying that the number of features corresponds to the number of dimensions. Nevertheless, it has been proved that SOM algorithms extract features inherent in pattern data, even if they are more than two. In this case, the number of features to be extracted (three) and the number of dimensions of SOM network (two) are not the same. We have used the minimal number of dimensions needed to extract features.
In the case of number of neurons greater than number of samples (case A), it was not always suitable for generalization to achieve an exact VQ (i.e. D = 0). A distortion equal to zero would mean that some neuron weight vectors were equal to the training samples, but the network would give wrong response to new inputs. Of course, this problem does not arise in the usual case number of neurons less than number of samples.
The inclusion of extreme data, whose corresponding features were maxima or minima, as training samples has yielded a good result, as they are usually mapped to the boundaries of the feature map, and cluster all samples with smaller feature values inside them.
Proteinotopie .feature maps 453
The secondary structure percentages for unknown proteins can be inferred and computed from the quantization and feature mapping achieved by SOM.
References
[1] M.A. Andrade, P. Chac6n, J.J. Merelo and E Morfin, Evaluation of secondary structure proteins fi'om UV circular dichroism spectra using an unsupervised learning neural network, Protein Engineering (in press).
[2] M. Blazek, P. Pancoska and T.A. Keiderling, Backpropagation neural network analysis of circular dichroism spectra of globular proteins, Neurocomputing 3 (1991) 247-257.
[3] G. B6hm, R. Muhr and R. Jaenicke, Quantitative analysis of protein for UV circular dichroism specra by neural networks, Protein Engineering 5 (3) (1992) 191-195.
[4] S. Brunak and J. Engelbrecht, Prediction of human mRNA donor and acceptor sites from the DNA sequence, J. Molecular Biol. 220 (1991) 49-65.
[5] E.A. Ferrfin, P. Ferrara, Unsupervised clustering of proteins, in: T. Kohonen, K. M~ikisara, O. Simula and J. Kangas, eds.,ArtificialNeuralNetworks (North-Holland, Amsterdam, 1991) II-1341, II-1344.
[6] E.A. Ferrfin, B. Pflugfelder and P. Ferrara, Large scale application of neural networks to protein classification, in: I. Aleksander and J. Taylor, eds.,Artificial NeuralNetworks 2 (1992) 1521-1524.
[7] R.J. Fessendenand L. Gyorayi, Identifying fountional groups in IR spectra using an artificial neural network, J. Chem. Soc. Perkins Trans. 2 11 (1991) 1755-1762.
[8] Holbrook, R., S.M. Muskal and S.H. Kim, Predicting surfaces exposure of amino acids from protein, Protein Engineering 3 (8) (1990) 659--055.
[9] H. Hoiley and M. Karplus, Proc. Nat. Acad. Sci. USA 86 (1989) 152-156.
[10] J. Kangas, T. Kohonen, J. Laaksonen, O. Simula and O. Vent~, Variants of self-organizing maps, IEEE Trans. NeuralNetworks 1 (1) (1990) 32-99.
[11] D.G. Kneller, EE. Cohen and R. Langridge, Improvements in protein secondary structure prediction by an enhanced neural network, J. Molecular Biol. 214(1990) 171-182.
[12] T. Kohonen, G. Barna and R. Chrisley, Statistical pattern recognition with neural networks: Benchmarking studies, Proc. IEEE lnternat. Conf. on Neural Networks, ICNN-88 ( 1988 ) 61-68.
[13] T. Kohonen, The 'neural ' phonetic typewriter, IEEE Comput. 21 (3) (Mar. 1988) 11-22.
[14] T. Kohonen, K. Miikisara and T. Saram~iki, Phonotopic map: Insightful representation of phonological features for speech recognition, IEEE 7th Conf. on Pattern Recognition, Montreal, Canada (1984) 182-185.
[15] T. Kohonen, Statistical pattern recognition revisited, in: R. Eckmiller, ed., Advanced Neural Computers (1989) 137.
[16] T. Kohonen, The Self-Organizing Map, Proc. IEEE 78 (9) (1990) 1464-1480.
[17] T. Kohonen, Speech recognition based on topology- preserving neural maps, in: Igor Aleksander, ed., Neural Computing Architectures: The Design of Brain-Like Machines (North Oxford Academic, 1989) 27-40.
[18] T. Kohonen, Self-organized formation of topologically correct feature maps, Biol. Cybernet. 43 (1982) 59-69.
[19] R.P. Lippman, Pattern classification using neural networks, IEEE Commun. Mag. 27 (11) (Nov. 1989) 47-64.
[20] J. Makhoul, S. Roucos and H. Gish, Vector quantization in speech coding, Proc. IEEE 73 (11) (1985) 1551-1587.
[21] L. Men6ndez-Arias, J. G6mez-Guti6rrez, M. Garcfa-Fernfindez, A. Garcfa Tejedor and E Moran, A BA- SIC microcomputer program to calculate the secondary structure of proteins from their circular dichroism spectrum, CABIOS 4 (4) (1988) 479-482.
[22] J.J. Merelo, M.A. Andrade, C. Urefia, A. Prieto and E Mor~in, Application of vector quantization algorithms to protein classification and secondary structure computation, in: A. Prieto, cal.,Artificial NeuralNetworks, Lecture Notes in Computer Science 540 (Springer-Verlag, Berlin, 1991) 415-421.
[23] J 3. Merelo, M.A. Andrade, A. Prieto and E Morfin, Protein classification through a feature map, 4th Internat. Workshop on Neural Networks & Their Applications (NeuroNimes '91) (Nov. 4-8, 1991) 765-768.
454 J.J. Merelo et al.
[24] S.M. Muskal, S.R. Holbrook and S.H. Kim, Prediction of the disulfide-bou, state of cysteine in proteins, Protein Engineering 3 (8) (1990) 667-672.
[25] N. Qian and T.J. Sejnowski, Predicting the secondary structure of globular proteins using neural network models, J. Molecular Biol. 202 (1988) 865.--884.
[26] D.E. Rumelhart and J.L. McClelland, ParallelDistributedProcessing(MIT Press, Cambridge, MA, 1988).
[27] J.T. Yang, C.-S.C. Wu and H.M. Martinez, Calculation of protein conformation from circular dichroism, Methods in Enzymology 130 (1986) 208-269.
Juan J. Merelo. Lecturer. On graduating in Physics (majoring in Theoretical Physics) in 1988, he joined our Department. He spent one month at the RISC-Linz (Research Institute for Symbolic Computing) (Austria), in 1989; another month at the Medical Statistical Laboratory of the University Paris V, as a guest of Prof. Marie Cottreil, in 1991, and 3 months at the Brain Simulation Lab of the University of Southem California, as guest of Prof. Alfredo Weitzenfeld and Michael Arbib. His main interests in research are in neural networks, genetic algorithms and artificial life.
Miguel A. Andrade is Ph.D. student at the Department of Biochemistry at the Univer- sidad Complutense de Madrid (Spain). He got his B.Sc. in 1989 in the same Dept. He has spent a 3-months training period at the University of Bochum (Germany). His Ph.D. thesis is related to models of development of the visual system based on dynamic link neural networks.
Alberto Prieto received a B.Sc. degree in Electronic Physics in 1968 fi'om the Com- plutense University (Madrid) and the Ph.D. degree from the University of Granada, Spain, in 1976. From 1969 to 1970 he was at the 'Centro de Investigaciones Trcnicas de Guipuzcoa' and at the 'E.T.S.I. lndustriales' of San Sebasti~in. From 1971 to 1984 he was Director of the Computer Centre, and from 1985 to 1990 Dean of the Computer Science and Technology studies of the Univ. of Granada. He is currently a Full Professor in the 'Dept. of Electronica y Tecnologia de Computadores' at the Univ. of Granada. His research interests are in the areas of artificial neural networks, multiple-valued circuits, microprocessor-based systems, and VLSI design and testing. Dr. Preto is nominated member of the IFIP WG 10.6 (Neural Computer Systems). He is a member of INNS, AEIA, AFCET, IEEE and ACM.
Frederico M o ~ n is Associate Professor at the Department of Biochemistry at the Universidad Complutense de Madrid (Spain). He is a member of the Biophysics Group currently involved in research related with Theoretical Biology. Dr. Morfin received his Ph.D. in 1982 by the Universidad Complutense de Madrid. He made postdoctoral studies and research work in the University Libre de Bruxelles (Belgium), the University of Southern California (Los Angeles, California, USA), and the University of California at Irvine (USA). He has experience in the study of dynamical systems and self organization of neural networks.