Embed Size (px)
Citation preview

™
Mass Spec Results Analysis Tool—MSRAT bioinformatics software
™M RATbioinformatic oftware
Introducing■ INSTANT DISCOVERYFind biomarkers hidden in your data at the click of the mouse
■ INSTANT ANALYSISPowerful comparative analysis with virtual 3D and differential heat maps
■ INSTANT CONFIDENCEData fi lters, replicate analysis and peptide coverage maps insures robust, reliable conclusions
The Power of Proteomics Unleashed

Import Search Results File Discover Biomarkers
M RAT Workflow
Protein Viewer
MW
M RAT Bioinformatics oftware
The full biological impact of Mass Spec based proteomics is often obscured in the very large data sets that are generated. This means that the full meaning of a given experiment cannot be appreciated without significant bioinformatics and statistical processing effecting both the quality and pace of discovery. MSRAT™ bioinformatics software empowers the proteomics researcher by eliminating these barriers:
■ Highlight data trends instantly with visualization tools ■ Enhance discovery power with real-time interactive data query ■ Enable easy, label-free comparisons of quantitative differences
between samples■ Facilitate deeper analysis to find post-translational
modifications, when pI data from the digital ProteomeChip™ is used.
■ Find biomarkers like a pro with interactive graphing, heat maps and Venn diagrams
■ Combine replicates to improve the quality of your biomarker calls
www.proteinforest.com
Instant Analysis, Discovery and Confidence
Discover what you have been missing…
MSRAT™ bioinformatics software enables
the proteomic researcher to focus on
the biological significance of their data
immediately. Simply load your search
data (~3 – 4 minutes), assign experimental
information and explore the biological
results.
The advanced visualization, sorting, filtering
and analysis provide incredible discovery
power! It is now possible to interactively
query your data in real-time at the click of
the mouse. This not only gets the most out
of your current data but speeds you towards
your next discovery.
Additional power for discovery is achieved
when isoelectric point (pI) data, highlighting
post-translational modifications, is added
from proteins or peptides that have been
separated using the digital ProteomeChip™
platform.
The MSRAT software and digital Proteome-
Chip system will allow you to ‘see important
results that you were missing before’.
Download a free demo today and see for yourself!

Discover Biomarkers Report Findings
3D Differential Map
pI
Getting to your results requires considerable effort and bioinformatics expertise before even knowing that your experiment worked, not to mention finding important information buried in the data. Further experiments can be delayed by weeks and months while the data is being analyzed. MSRAT™ bioinformatics software will get you from ‘click to conclusion’ using your mouse. With one mouse click you can:
■ Exclude protein ID’s made with fewer than 2, 3 or 4 unique peptides
■ Exclude redundant proteins■ Exclude Keratin■ Export data to MS Excel or XML ■ Calculate differential scores■ Determine peptide coverage■ Sort any column of data ■ Process replicates
You will instantly find potential biomarkers between samples using the 3D differential map tool. This tool uses protein ID, MW and pI data to generate a map that instantly reveals the most differential proteins. The size of the circle is proportional to the magnitude of the differential score. The color of the circle, red or blue, indicates the up or down expression of a protein. Simply click on a circle to reveal detailed protein information.
experience MSrAT™ for yourSelf wiTh A free deMo AT
www.proTeinforeST.coM
617.926.4778www.proteinforest.com
Your Next Discovery is a Mouse-Click Away
Finding Biomarkers in Your Data has Never Been This Easy
Discover what you have been missing…
Discover biomarkers in your data with the 3D Differential Map
Underexpressed
Overexpressed
MW
pI
Protein Forest, Inc.Ledgemont Center
128 Spring St.Lexington, MA 02421
617.926.4778
www.proteinforest.com
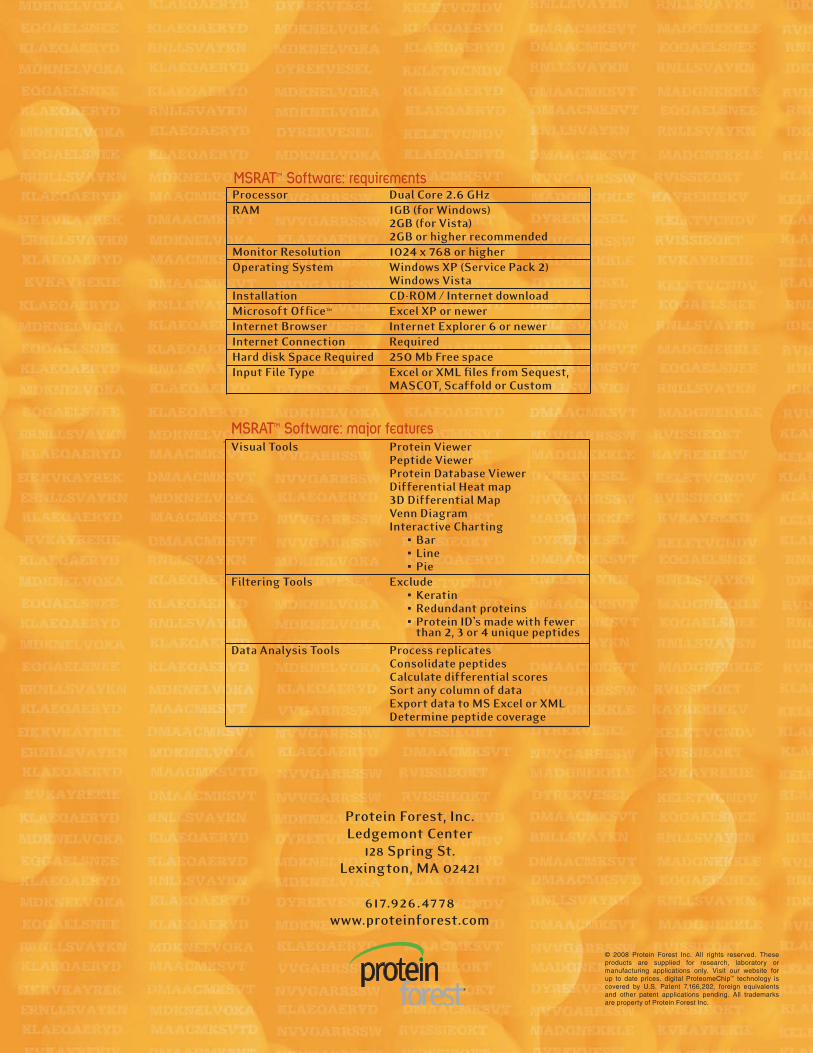
MSRAT™ Software: requirementsProcessor Dual Core 2.6 GHzRAM 1GB (for Windows) 2GB (for Vista) 2GB or higher recommendedMonitor Resolution 1024 x 768 or higherOperating System Windows XP (Service Pack 2) Windows VistaInstallation CD-ROM / Internet downloadMicrosoft Office™ Excel XP or newerInternet Browser Internet Explorer 6 or newerInternet Connection RequiredHard disk Space Required 250 Mb Free spaceInput File Type Excel or XML files from Sequest, MASCOT, Scaffold or Custom
© 2008 Protein Forest Inc. All rights reserved. These products are supplied for research, laboratory or manufacturing applications only. Visit our website for up to date prices. digital ProteomeChip™ technology is covered by U.S. Patent 7,166,202, foreign equivalents and other patent applications pending. All trademarks are property of Protein Forest Inc.
Visual Tools Protein Viewer Peptide Viewer Protein Database Viewer Differential Heat map 3D Differential Map Venn Diagram Interactive Charting ■ Bar ■ Line ■ PieFiltering Tools Exclude ■ Keratin ■ Redundant proteins ■ Protein ID’s made with fewer than 2, 3 or 4 unique peptides
Data Analysis Tools Process replicates Consolidate peptides Calculate differential scores Sort any column of data Export data to MS Excel or XML Determine peptide coverage
MSRAT™ Software: major features


![D11 prototype specification[1]](https://img.pdfslide.us/doc/110x75/555aaf9ad8b42ad0538b4f62/d11-prototype-specification1.jpg)