Embed Size (px)
DESCRIPTION
artikel
Citation preview

RESEARCH ARTICLE
Protein microarrays on hybrid polymeric thin films
prepared by self-assembly of polyelectrolytes for
multiple-protein immunoassays
Xichun Zhou* and Jizhong Zhou
Genomics Group, Environmental Sciences Division, Oak Ridge National Laboratory, Oak Ridge, TN, USA
We report here the development and characterization of protein microarrays fabricated onnanoengineered 3-D polyelectrolyte thin films (PET) deposited on glass slide by consecutiveadsorption of polyelectrolytes via self-assembly technique. Antibodies or antigens were immobi-lized in the PET-coated glass slides by electrostatic adsorption and entrapment of porous struc-ture of the 3-D polymer film and thus establishing a platform for parallel analysis. Both antigenand antibody microarrays were fabricated on the PET-coated slides, and direct and indirectimmunoassays on protein microarrays for multiple-analyte detection were demonstrated.Microarrays produced on these PET-coated slides have consistent spot morphology and provideperformance features needed for proteomic analysis. The protein microarrays on the PET filmsprovide LOD as low as 6 pg/mL and dynamic ranges up to three orders of magnitude, which arewider than the protein microarrays fabricated on aldehyde and poly-L-lysine functionalizedslides. The PET films constructed by self-assembly technique in aqueous solution is greenchemistry based, cost-effective method to generate 3-D thin film coatings on glass surface, andthe coated slide is well suited for immobilizing many types of biological molecules so that a widevariety of microarray formats can be developed on this type of slide.
Received: March 6, 2005Revised: July 11, 2005
Accepted: July 25, 2005
Keywords:
Immunodetection / Protein immobilization / Protein microarray / Protein–proteininteraction / Surface coatings
Proteomics 2006, 6, 1415–1426 1415
1 Introduction
Protein microarrays which have burgeoned with the rapidadvances in high-throughput screening, nanotechnology,and bioinformatics are becoming an important tool in pro-teomics, drug discovery, and disease diagnosis. Applications
of protein microarrays include the studies of enzymatic ac-tivities [1, 2], protein expression profiling [3–5], and interac-tions of protein–protein, protein–DNA, and protein–ligand[6–10]. Currently, most of the protein microarray to date areconstructed by adapting the fabrication method analogous tothe existing DNA microarray technology. However, there areseveral additional challenges with protein-based microarraysbecause, in general, proteins are more sensitive to their sur-rounding environment than nucleic acids.
Any strategy to construct protein microarrays requirestwo steps: (i) deposition of proteins in parallel format on asubstrate surface and (ii) immobilization of the arrayed cap-ture probes on the substrate surface. Covalent coupling,physical adsorption, and specific affinity interaction are the
Correspondence: Dr. Jizhong Zhou, Environmental SciencesDivision, Oak Ridge National Laboratory, P.O. Box 2008, OakRidge, TN 37831, USAE-mail: [email protected]: 11-865-5768646
Abbreviations: APTS, 3-aminopropyltriethoxysilane; PAAH,poly(allylamine hydrochloride); PET, polyelectrolyte thin films;PLL, poly-l-lysine; PVS, poly(vinylsulfonic acid, sodium salt);SEM, scanning electron microscopy
* Current address: School of Genome Science and Technology, Uni-versity of Tennessee, Knoxville, TN 37996–0830, USA
DOI 10.1002/pmic.200500138
© 2006 WILEY-VCH Verlag GmbH & Co. KGaA, Weinheim www.proteomics-journal.com

1416 X. Zhou and J. Zhou Proteomics 2006, 6, 1415–1426
proposed methods to immobilize proteins in array format.Although covalent linkage to an activated surface is generallythe most stable method of immobilizing protein on micro-array [1, 11–18], covalent coupling typically involves multi-ple-step surface chemistry treatments to obtain the activatedsubstrates for subsequent protein immobilization, andextensive processing protocols have to be followed by afterprotein microarray fabrication. One of the more popularapproaches is the slide surface functionalized with aldehydegroups. These aldehyde groups readily form aldimine(Schiff-base) bonds with primary amines in protein probes,which can be further stabilized by reduction. However, cova-lent coupling often results in some of the immobilized pro-teins to lose activity due to the direct chemical modificationof the binding site and steric hindrance or strain from mul-tiple attachment sites.
Protein microarray can be also fabricated onto a slidesurface through a specific affinity interaction, where proteinprobes are fused with a high-affinity tag at their amino orcarboxyl terminus for the attachment to the chip surface viathis tag [19–24]. Using this method, immobilized proteinprobes are more likely to remain in their native conforma-tion, while the analytes have easier access to the active sitesof proteins. Besides biotin–avidin affinity interaction [19],fusion proteins containing a His tag were arrayed onto anickel-coated glass slide [20]. Other affinity methods such asglutathione/GST and phosphonate/serine esterase cutinaseligand/protein tags were also reported [23]. However, themodification of protein probes with affinity tag and themodification of slide substrate with protein A or streptavidinrequire a peculiar time-consuming process, and in general,an increase in the quantity of reagents.
The most straightforward way to immobilize proteins ona surface is adsorption through noncovalent interactions (i.e.,hydrophobic interactions, electrostatic interactions, andentrapment in porous structures). Glass surface coated with athin NC membrane or poly-L-lysine (PLL) such that proteinscan be passively adsorbed to the modified surface throughnonspecific interactions have been reported [25–28].Recently, Lee et al. [28] reported fabrication of protein micro-arrays on a calixcrown-5-modified slide where the proteinprobes were bound to the crown moiety via host–guest inter-actions and hydrophobic interactions between the hydro-phobic residues of a protein and methoxy groups of the cali-crown-5 derivatives. The attached proteins lay on the surfacein random orientation. However, it has been reported that thepassive adsorption of proteins onto the PLL slides oftenresults in protein denaturization because of the hydrophobicnature of many glass surfaces (the unfully coverage of PLL-monolayers on glass surface), nonuniform orientation ofmolecules, and unstable bonding (leakage). For the thickfilm-coated slide, such as NC, the noise level is usually higherbecause of the nonspecific adsorption/absorption and theauto-fluorescence of the materials. However, its simplicity offabricating protein microarray on slide by noncovalent inter-actions sometimes compensates for these disadvantages.
In addition to the chemistry used to immobilize pro-teins, the binding capacity of protein probes on slides sur-face is also critical for the performance of a proteinmicroarray since the protein samples are often very limitedin supply and (unlike nucleic acid) cannot be amplified. Inthe use of aldehyde- and PLL-functionalized slides, theamount of immobilized protein/peptide is limited to a 2-Dsurface area, causing a low sensitivity and a low S/N level.Polymer-based 3-D films, such as activated agarose film[29], hydrogel polymer [30], sol-NC film [31], plasma-poly-merized film [32], and protein-gel chip were reported veryrecently to improve binding capacity and thus the sensitiv-ity [33, 34]. In addition to the sophisticated processes ofcreating such 3-D matrixes which often include photo-lithography or photopolymerization process, the major dis-advantage of these reported 3-D protein microarrays is thatthe 3-D coatings often have lower reproducibility and ahigher background signal caused by auto-fluorescence ofthe polymer materials.
Thus, there is great demand for new slide surface whichprovides reliable attachment of protein probes for variousfunctional analyses. Ideally, proteins should be immobilizedon a slide such that their native format and their folded con-formations are preserved. Recently, there is a growing inter-est in developing pretreated surfaces by creation of nano-structures on protein-compatible surfaces via the polymer-coated substrate such as NC membranes or sol–gel methodsto minimize the denaturation of immobilized proteins inprotein microarrays [22, 34–36]. We now report a simpleprocedure to coat glass slides with polymeric thin films byself-assembly of polyelectrolyte multilayered thin films as aplatform for fabrication of protein microarrays. Due to theamphiphilicity nature of polyelectrolyte, protein probes areimmobilized in semiwet environment by the combination ofstrong electrostatic adsorption, hydrophobic adsorption, andentrapment of the porous structure, which keep proteinprobes in an active form. Furthermore, the multilayeredpolyelectrolyte thin films (PET) provide 3-D structures wherehigh binding capacity can be achieved and the direct contactof protein with hydrophobic glass surface was avoided. Inaddition to this, PET film is chemically stable, and its adhe-sion to substrates is strong, which is critical in obtaining areproducible immunoassay performance. We also demon-strated the fabrication of antigen and antibody microarrayson the PET-coated glass slides as well as the direct and indi-rect immunoassays on the protein microarrays for multiple-analyte detection.
2 Materials and methods
2.1 Reagents
Amine-reactive Alexa Fluor 488 succinimidyl esters andAlexa Fluor 488-labeled proteins of fibrinogen from humanplasma (FIB, pI 5.5), avidin (pI 10.5) were purchased from
© 2006 WILEY-VCH Verlag GmbH & Co. KGaA, Weinheim www.proteomics-journal.com
Proteomics 2006, 6, 1415–1426 Protein Arrays 1417
Molecular Probes (Eugene, USA). Unlabeled proteins ofHSA (HSA, pI 4.6), myoglobin (MGB, pI 7.0), lysozyme(LSZ, pI 11.1), a-fetoprotein (AFP), human IgG, and goatIgG, as well as Cy3-labeled streptavidin, Cy3-labeled poly-clonal antibodies against AFP, goat IgG, and Cy3-labeledmonoclonal antibodies against HSA, human IgG, fibro-nectin, and avidin were purchased from Sigma-Aldrich.Recombinant human cytokine TNF-a and IL-2, IL-6, mono-clonal antibodies against cytokine TNF-a, IL-2, and IL-6,and biotinylated detection antibodies (biotinylated anti-TNF-a, anti-IL-2, and anti-IL-6) were obtained from R&D Sys-tems (Minneapolis, MN). These reagents were chosen torepresent a broad class of capture molecules, includingmonoclonal antibodies, polyclonal antibodies, and nonanti-body proteins. Microscope glass slides (7662661 mm),glass cover slips, biotin-anti-goat IgG, and 56 Denhardt’ssolution (containing 1 mg/mL each of Ficoll, PVP, andBSA); 3-aminopropyltriethoxysilane (APTS), as well asanionic poly(vinylsulfonic acid, sodium salt) solution (PVS)(25%), and cationic poly(allylamine hydrochloride) (PAAH,Mn 50 000–65 000) were also purchased from Sigma-Aldrich. All the chemicals of commercial origin were usedwithout further purification. Aldehyde-modified slides(SuperAldehyde) were purchased from TeleChem Interna-tional (Sunnyvale, CA) and PLL-coated slides were pur-chased from Cell Associates (Houston, TX).
2.2 Protein labeling
Proteins of HSA and MGB were labeled with Alexa Fluor®
488 dye by using the following protocol. Protein solutions at0.5 mg/mL 0.1 M pH 8.3 sodium carbonate buffer andamine-reactive Alexa Fluor 488 succinimidyl esters at 10 mg/mL in 50% DMSO were prepared before labeling. Equal vol-ume of the protein and dye solutions were mixed thoroughlyby repeated pipetting. The reactions were allowed to sit in thedark for 1 h at room temperature mixing approximately every10 min, and then quenched by the addition of one-tenth vol-ume of 1 M pH 8 Tris-base. The reaction solutions werebrought to 0.5 mL with PBS and purified with Sephadex G-50gel filtration column (Amersham Biosceience) where thefirst band passing through the column contained the labeledprotein.
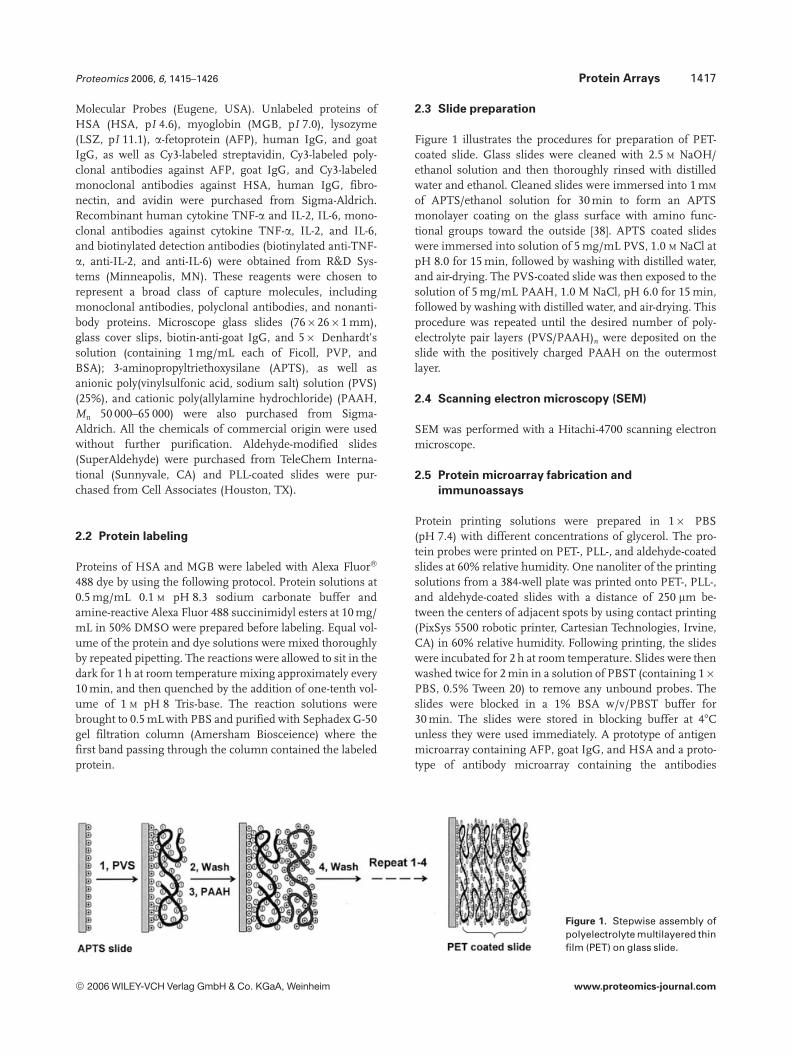
2.3 Slide preparation
Figure 1 illustrates the procedures for preparation of PET-coated slide. Glass slides were cleaned with 2.5 M NaOH/ethanol solution and then thoroughly rinsed with distilledwater and ethanol. Cleaned slides were immersed into 1 mM
of APTS/ethanol solution for 30 min to form an APTSmonolayer coating on the glass surface with amino func-tional groups toward the outside [38]. APTS coated slideswere immersed into solution of 5 mg/mL PVS, 1.0 M NaCl atpH 8.0 for 15 min, followed by washing with distilled water,and air-drying. The PVS-coated slide was then exposed to thesolution of 5 mg/mL PAAH, 1.0 M NaCl, pH 6.0 for 15 min,followed by washing with distilled water, and air-drying. Thisprocedure was repeated until the desired number of poly-electrolyte pair layers (PVS/PAAH)n were deposited on theslide with the positively charged PAAH on the outermostlayer.
2.4 Scanning electron microscopy (SEM)
SEM was performed with a Hitachi-4700 scanning electronmicroscope.
2.5 Protein microarray fabrication and
immunoassays
Protein printing solutions were prepared in 16 PBS(pH 7.4) with different concentrations of glycerol. The pro-tein probes were printed on PET-, PLL-, and aldehyde-coatedslides at 60% relative humidity. One nanoliter of the printingsolutions from a 384-well plate was printed onto PET-, PLL-,and aldehyde-coated slides with a distance of 250 mm be-tween the centers of adjacent spots by using contact printing(PixSys 5500 robotic printer, Cartesian Technologies, Irvine,CA) in 60% relative humidity. Following printing, the slideswere incubated for 2 h at room temperature. Slides were thenwashed twice for 2 min in a solution of PBST (containing 16PBS, 0.5% Tween 20) to remove any unbound probes. Theslides were blocked in a 1% BSA w/v/PBST buffer for30 min. The slides were stored in blocking buffer at 47Cunless they were used immediately. A prototype of antigenmicroarray containing AFP, goat IgG, and HSA and a proto-type of antibody microarray containing the antibodies
Figure 1. Stepwise assembly ofpolyelectrolyte multilayered thinfilm (PET) on glass slide.
© 2006 WILEY-VCH Verlag GmbH & Co. KGaA, Weinheim www.proteomics-journal.com

1418 X. Zhou and J. Zhou Proteomics 2006, 6, 1415–1426
against human IgG, fibronectin, HAS, avidin, and IL-2 werefabricated for direct immunoassay, where anti-IL-2 antibodywas used as negative control. Another antibody microarraycontaining antibodies against cytokine TNF-a, IL-2, and IL-6,as well as anti-goat IgG (a negative control) and biotinylatedanti-goat IgG (a positive control) was fabricated for sandwichimmunoassay.
Direct immunoassays were carried out by applying 15 mLof a Cy3-labeled cognate protein solution in a PBST buffer tothe slide surface. The slides were then sealed in a humidifiedchamber for 2 h at room temperature. The microarrays weredipped briefly in PBST to remove the protein solution andthe cover slip, followed by washing with PBST buffer for10 min, and twice with 0.16 PBS for 2 min.
For sandwich immunoassays, slides arrayed with cyto-kine antibodies TNF-a, IL-2, and IL-6, as well as anti-goatantibody (a negative control) and biotinylated anti-goat IgG(a positive control) were incubated with individual or a mix ofcytokine TNF-a, IL-2, and IL-6 in PBST buffer for 2 h. Nineconcentrations of each cytokine (100 ng/mL to 0.25 pg/mL atfive-fold serial dilution) were tested to generate a dose–re-sponse curve. After the slides were washed three times inPBST for 5 min each, a 5 mg/mL mixture of detection anti-bodies (biotinylated anti-TNF-a, anti-IL-2, and anti-IL-6) wasapplied to the slides and the slides were incubated for 1 h atroom temperature. Slides were washed twice in PBST bufferfor 8 min each, and then incubated with 100 ng/mL of Cy3-labeled streptavidin for 1 h. Slides were again washed threetimes in PBST buffer for 5 min each, followed by washingtwice in 0.16 PBS for 2 min to remove the detergent.
2.6 Imaging and data analysis
Microarrays were scanned at 488 nm (Alexa 488 channel) and530 nm (Cy3 channel) using a scanning laser confocal fluo-rescence microscope (ScanArray 5000 System, Packed Bio-chip Technologies) at 10-mm resolution. For all microarrayexperiments, the laser power was 80% and the PMTgain was65%. The images were analyzed by quantifying the pixel den-sity (intensity) of each spot using ImaGene 3.0 (Biodiscovery,Los Angeles, CA). The mean signal intensity of each spot wasused for data analysis. All the fluorescent intensities in thescanned images were processed as background-correctedmean fluorescence intensities of the pixels within the spot.Statistical analysis was performed with SigmaPlot 5.0 (JandelScientific, San Rafael, CA) or with Microsoft Excel®.
3 Results
3.1 Effect of structural properties of PET film on
immobilization of arrayed protein probes
To optimize the film thickness for the construction of proteinmicroarrays, we spotted the Cy3-labeled streptavidin probeonto glass slides that were coated with PET films at different
thicknesses. The fluorescent intensity of immobilized strep-tavidin was analyzed after extensive rinsing with a washingbuffer. Figure 2 represents the adsorption isotherms ofstreptavidin interacting with the polyelectrolyte multilayers(PAAH–PVS)n–PAAH, the outer layer of which being con-structed by the cationic PAAH polyelectrolyte. The amountof streptavidin that immobilized the (PAAH–PVS)n–PAAHfilm increased initially with an increase in the number ofbilayers and reached a plateau when the bilayer number (n)was about 9. This correlates with an increase in the numberof binding sites (the negative vinylsulfonic groups and theporous network) on the PET film. The spot size changedslightly when the number of bilayers was lower than nine butincreased rapidly when the film thickness was greater thanten bilayers (Fig. 2B). This increase suggests protein surfacediffusion. Thus, the optimized PET film thickness wasobtained with nine bilayers of PVS/PAAH. The SEM micro-graph in Fig. 3 shows that the thickness of the coated film isabout 70 nm. Glass slides coated with nine bilayers of PVS/PAAH were therefore used for further study. Spots size with1 nL of protein solution on the (PVS/PAAH)9 is about165 6 0.8 mm of 1600 spots from ten slides.
Figure 2. Effect of the thickness of a multilayered polyelectrolytethin (PET) film on binding capacity (A) and spot size (B). A 25 mg/mL Cy3-labeled streptavidin sample was spotted onto glassslides coated with different thicknesses of PET film (presentedhere as the numbers of bilayers). After washing with a solution ofPBST buffer, the microarray was scanned and analyzed. Data arefor 36 replicates. (A) Mean fluorescent intensity 6 SD and (B) di-ameter of spot size 6 SD.
Figure 3. SEM micrograph of PET coating on glass slides.
© 2006 WILEY-VCH Verlag GmbH & Co. KGaA, Weinheim www.proteomics-journal.com

Proteomics 2006, 6, 1415–1426 Protein Arrays 1419
3.2 Effect of pI of protein probes
The advantage of a protein microarray is that multiple pro-teins can be affixed on one slide surface for simultaneousparallel analysis. The protein probes are immobilized in theporous entrapments of the PET film mainly by the electro-static interaction between the film and the protein mole-cules. Therefore, it is important to confirm that thisapproach is generally applicable to immobilizing proteinswith a wide range of pIs. We selected five Alexa Fluor 488-labeled proteins that have a wide range of pIs (from 4.3 to11.1) and spotted them onto a PET film whose outer filmwas the positively charged PAAH polyelectrolyte. Under thespotting buffer and the washing buffer (pH 7.4 for both),HSA (pI 4.6), FIB from human plasma (pI 5.5), and MGB(pI 7.0) were negatively charged whereas avidin (AV,pI 10.5) and lysozyme (LSZ, pI 11.1) were positivelycharged. Figure 4A shows the scan image of the microarrayafter washing with the PBST buffer. It clearly shows thatthese proteins were strongly affixed on polyelectrolyte mul-tilayers whatever the sign of the charge of the protein. Thisresult becomes even clearer in Fig. 4B, where the S/Ns of(FP - FG)/FG are plotted against the protein concentrationand pIs. FP and FG represent the fluorescent intensity ofproteins labeled with Alexa Fluor 488 spotted on PET filmand the background noise of the glass surface after wash-ing, respectively. At protein concentrations higher than25 mg/mL, a positively charged protein can also give satu-rated adsorption (full coverage) on PET film, as the nega-tively charged proteins did. Only small differences wereobserved for the binding of protein probes at spotting con-centrations lower than 12.5 mg/mL, where the binding ofthe negatively charged proteins is slightly larger than that ofthe positively charged proteins on the positively chargedPAAH surface of the PET film.
3.3 Effect of ionic strength on protein immobilization
Since the protein probes are affixed on the PET coatingmainly by electrostatic interaction, the ionic strength in thebuffers used for washing and immunoassay may affect theaffinity of proteins on the PET film. To investigate the stabil-ity of the spotted protein adsorption, we carried out experi-ments by washing the spotted protein microarray for 10-minintervals with a PBS buffer (pH 7.4) having different ionicstrengths (total Na1 concentration). The fluorescent inten-sities before and after rinsing were recorded (Fig. 5). Lessthan 10% of the initially adsorbed proteins are desorbableafter continuously washing with a buffer solution of similarionic strength as the one employed for the protein layerbuildup, whatever be the sign of the charge of the proteinmolecules. This result indicated that washing with a buffersolution of similar ionic strength as the one employed for theprotein printing does not significantly modify the structureof the adsorbed protein layers. The adsorbed proteins thusappear to interact very strongly with the terminating poly-electrolyte layer. Although about 25% of the proteins immo-bilized on the PET film were released, when the proteinmicroarrays were washed with a buffer solution of higherionic strength (e.g., 2 M NaCl), the immobilized proteins werestrongly attached on the PET film when washed with buffersolution containing less than 0.5 M NaCl. This concentrationis within the range of physiological conditions for immu-noassay.
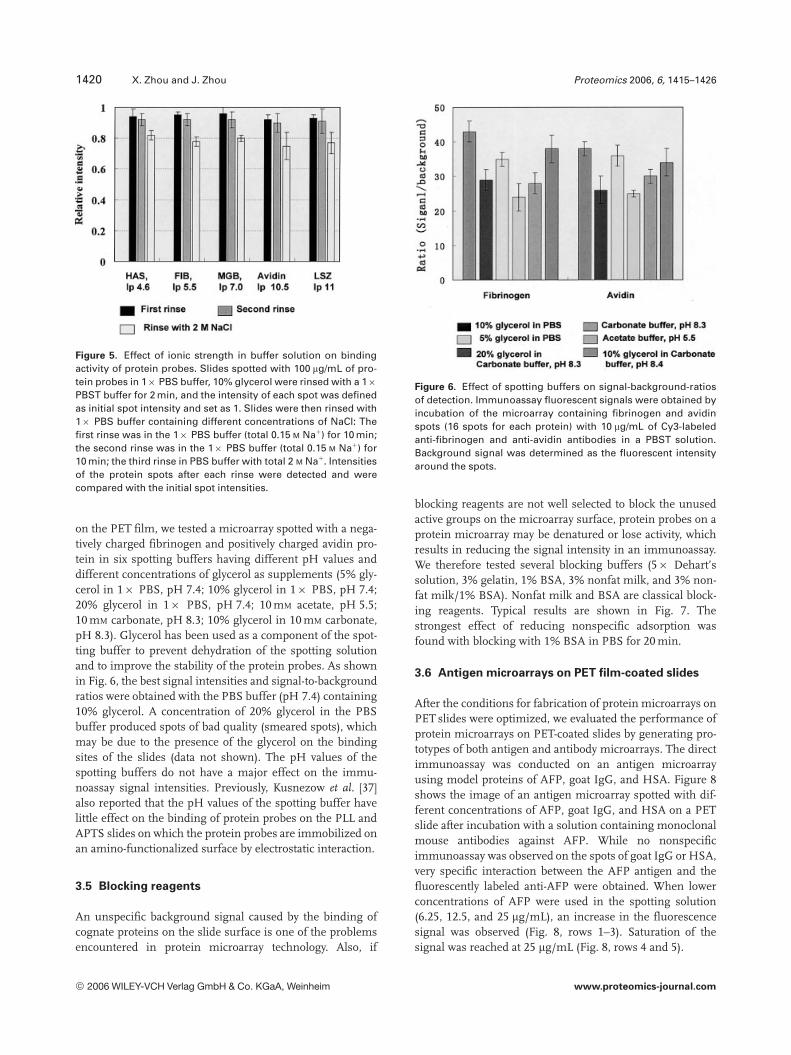
3.4 Spotting buffers
The characteristics of the spotting buffer can affect the sta-bility of protein probes, protein-binding capacity of a slidesurface, and quality of the spots produced. To optimize thespotting buffers used for the protein microarrays fabricated
Figure 4. Relationships between thebinding of protein probes onto PET sur-face and the pI of the protein probes andconcentration of spotting solution. (A)Rainbow displays of scanning image ofAlexa Fluor 488-labeled proteins spottedon PET slide after washing with PBSTbuffer; (B) relation of immobilized pro-teins to their pI and concentration ofspotting solution.
© 2006 WILEY-VCH Verlag GmbH & Co. KGaA, Weinheim www.proteomics-journal.com
1420 X. Zhou and J. Zhou Proteomics 2006, 6, 1415–1426
Figure 5. Effect of ionic strength in buffer solution on bindingactivity of protein probes. Slides spotted with 100 mg/mL of pro-tein probes in 16 PBS buffer, 10% glycerol were rinsed with a 16PBST buffer for 2 min, and the intensity of each spot was definedas initial spot intensity and set as 1. Slides were then rinsed with16 PBS buffer containing different concentrations of NaCl: Thefirst rinse was in the 16 PBS buffer (total 0.15 M Na1) for 10 min;the second rinse was in the 16 PBS buffer (total 0.15 M Na1) for10 min; the third rinse in PBS buffer with total 2 M Na1. Intensitiesof the protein spots after each rinse were detected and werecompared with the initial spot intensities.
on the PET film, we tested a microarray spotted with a nega-tively charged fibrinogen and positively charged avidin pro-tein in six spotting buffers having different pH values anddifferent concentrations of glycerol as supplements (5% gly-cerol in 16 PBS, pH 7.4; 10% glycerol in 16 PBS, pH 7.4;20% glycerol in 16 PBS, pH 7.4; 10 mM acetate, pH 5.5;10 mM carbonate, pH 8.3; 10% glycerol in 10 mM carbonate,pH 8.3). Glycerol has been used as a component of the spot-ting buffer to prevent dehydration of the spotting solutionand to improve the stability of the protein probes. As shownin Fig. 6, the best signal intensities and signal-to-backgroundratios were obtained with the PBS buffer (pH 7.4) containing10% glycerol. A concentration of 20% glycerol in the PBSbuffer produced spots of bad quality (smeared spots), whichmay be due to the presence of the glycerol on the bindingsites of the slides (data not shown). The pH values of thespotting buffers do not have a major effect on the immu-noassay signal intensities. Previously, Kusnezow et al. [37]also reported that the pH values of the spotting buffer havelittle effect on the binding of protein probes on the PLL andAPTS slides on which the protein probes are immobilized onan amino-functionalized surface by electrostatic interaction.
3.5 Blocking reagents
An unspecific background signal caused by the binding ofcognate proteins on the slide surface is one of the problemsencountered in protein microarray technology. Also, if
Figure 6. Effect of spotting buffers on signal-background-ratiosof detection. Immunoassay fluorescent signals were obtained byincubation of the microarray containing fibrinogen and avidinspots (16 spots for each protein) with 10 mg/mL of Cy3-labeledanti-fibrinogen and anti-avidin antibodies in a PBST solution.Background signal was determined as the fluorescent intensityaround the spots.
blocking reagents are not well selected to block the unusedactive groups on the microarray surface, protein probes on aprotein microarray may be denatured or lose activity, whichresults in reducing the signal intensity in an immunoassay.We therefore tested several blocking buffers (56 Dehart’ssolution, 3% gelatin, 1% BSA, 3% nonfat milk, and 3% non-fat milk/1% BSA). Nonfat milk and BSA are classical block-ing reagents. Typical results are shown in Fig. 7. Thestrongest effect of reducing nonspecific adsorption wasfound with blocking with 1% BSA in PBS for 20 min.
3.6 Antigen microarrays on PET film-coated slides
After the conditions for fabrication of protein microarrays onPET slides were optimized, we evaluated the performance ofprotein microarrays on PET-coated slides by generating pro-totypes of both antigen and antibody microarrays. The directimmunoassay was conducted on an antigen microarrayusing model proteins of AFP, goat IgG, and HSA. Figure 8shows the image of an antigen microarray spotted with dif-ferent concentrations of AFP, goat IgG, and HSA on a PETslide after incubation with a solution containing monoclonalmouse antibodies against AFP. While no nonspecificimmunoassay was observed on the spots of goat IgG or HSA,very specific interaction between the AFP antigen and thefluorescently labeled anti-AFP were obtained. When lowerconcentrations of AFP were used in the spotting solution(6.25, 12.5, and 25 mg/mL), an increase in the fluorescencesignal was observed (Fig. 8, rows 1–3). Saturation of thesignal was reached at 25 mg/mL (Fig. 8, rows 4 and 5).
© 2006 WILEY-VCH Verlag GmbH & Co. KGaA, Weinheim www.proteomics-journal.com

Proteomics 2006, 6, 1415–1426 Protein Arrays 1421
Figure 7. Effect of blocking reagents on the microarray perfor-mance. Protein microarrays containing fibrinogen and avidinspots (16 spots for each protein) were blocked with one of theblocking reagents before immunoassay. Immunoassay fluores-cent signals were obtained by incubation of the microarray with10 mg/mL of Cy3-labeled anti-fibrinogen and anti-avidin anti-bodies in a PBST solution. Background signal was determined tobe the fluorescent intensity around the spots.
Figure 8. Antigen microarray on PET films. Protein antigens of a-fetoprotein (AFP), goat IgG, and HSA at five concentrations werespotted in a 563 array format with three replicates and was sub-sequently incubated with the Cy3-labeled anti-AFP antibody.Signal intensity of the bound antibody correlates with the con-centration of AFP protein immobilized on the PET slide.
3.7 Antibody microarrays on PET film-coated slides
The multiple-analyte capacity of the PET slides was testedand demonstrated for parallel determination of four inde-pendent antigen analytes. A prototype of antibody micro-array was tested by arraying antibodies against human IgG,fibronectin, HSA, avidin, and IL-2 on the PET slides. Theanti-IL-2 antibody was used as negative control. To investi-gate the performance of the antibody microarray format, itwas of interest to first determine the array response for thedetection of individual or mixed analytes. Figure 9 shows arepresentative response obtained when a direct immu-
noassay was performed on the antibody microarray for thedetection of a single analyte. The image shows the resultingfluorescence pattern that was generated when a solutioncontaining different combinations of corresponding Cy3-labeled antigens were incubated on the antibody microarray.All four kinds of capture antibody spots simultaneouslybound their specific target antigen, and no nonspecificadsorption on anti-IL-2 spot was observed. This finding sug-gests that the detection arrays do not have nonspecific cross-reactivity and that multianalyte immunoassays can beachieved on the PET slide with good selectivity.
3.8 Sandwich immunoassay on antibody microarrays
fabricated on PET slides
Sandwich immunoassays in protein microarrays take ad-vantage of the proven utility of ELISA. In the sandwich assay,proteins captured on an antibody microarray are detected bya cocktail of labeled detection antibodies. Each antibody ismatched to one of the spotted antibodies. Thus, sandwichimmunoassays are widely used for the detection of proteinsfound in very low concentrations, such as cytokines, growthfactors, or hormones from biological specimens.
To investigate the performance of sandwich immu-noassays by protein microarrays on PET slides, we generatedan antibody microarray containing antibodies against cyto-kine TNF-a, IL-2, and IL-6, as well as anti-goat IgG (a nega-tive control) and biotinylated anti-goat IgG (a positive con-trol). Detection of the spotted primary antibodies was per-formed by incubation of the microarray with differentantigen targets followed by incubation with biotinylated sec-ondary antibodies and Cy3-labeled streptavidin. Scanningthe biochip at a wavelength of 534 nm revealed specificbinding of the antigen targets on immobilized antibodyprobes (Fig. 10A). The fluorescence resulting from thenegative control was minimal (,7% of the fluorescenceintensity obtained on primary protein spots), indicating asmall degree of nonspecific binding of the Cy3-streptavidinon the immobilized capture antibody. The binding may bedue to the multiple steps of incubation applied. The averagefluorescence resulting from negative-control spots wasdefined as a background signal in the sandwich immu-noassay and was subtracted from all fluorescent values pres-ent in the array for further data analysis.
To investigate the dynamic range of the sandwich assayperformed on PET supports and to determine the detectionlimit, we performed several quantitative studies. For com-parison, the same protein microarrays were also fabricatedon the PLL and aldehyde slides, and an immunoassay wasconducted under identical conditions with the microarrayson a PET slide. The microarrays were incubated with differ-ent concentrations of analytes (100 ng/mL–0.256 pg/mL atfive-fold serial dilution) according to the protocol describedin Section 2. The mean fluorescence intensity, plus or minusthe SD at each analyte concentration, was subtracted fromthe fluorescence from negative-control spots to yield the
© 2006 WILEY-VCH Verlag GmbH & Co. KGaA, Weinheim www.proteomics-journal.com

1422 X. Zhou and J. Zhou Proteomics 2006, 6, 1415–1426
Figure 9. Multianalyte direct-immunoassay on an antibody microarray. A PET slide was immobilized with anti-bodies against fibronectin, human IgG, avidin, HSA, and IL-2, whereas anti-IL-2 was used as control. After block-ing, the protein microarrays were incubated individually with solutions of different combinations of correspond-ing Cy3-labeled antigen cognates at 100 ng/mL: (a) mixed human IgG, fibronectin, HSA, and avidin; (b) mixed hu-man IgG and HSA; (c) mixed fibronectin and avidin; (d) human-IgG; (e) fibronectin; and (f) avidin. From panel (a) to(e), all binding occurred only at the specific capture antibody sites.
background-corrected fluorescence values, which were sub-sequently plotted to generate dose–response curves. Figure10Ba–c shows the typical dose–response curves of TNF-a onPET, aldehyde, and PLL slides, respectively. The data resultedin sigmoid curves having a linear range (the concentrationrange that gave the best fit to the linear equation y = mx 1 b)from 6.4 pg/mL to 20 ng/mL on the PET slide (R2 = 0.97) andfrom approximately 32.5 pg/mL to 4 ng/mL on aldehyde(R2 = 0.98) and PLL slides (R2 = 0.96), respectively. At con-centrations above 20 ng/mL, the dose–response curve beganto plateau on the PET slide. The calculated LOD (the con-centration corresponding to three SDs) was determined to be,3 pg/mL on the PET slide. The intraslide variation in fluo-rescence, determined as the CV among the 18 spots at eachconcentration ranged from 3% at 100 ng/mL to 7.8% at6.4 pg/mL. Table 1 summarizes the properties of the immu-noassays for the three types of slides. Clearly, the PET slideprovided a higher sensitivity and a wider dynamic range thanthat of the PLL or aldehyde-functionalized slides.
4 Discussion
The buildup of polyelectrolyte films by the alternatingadsorption of cationic and anionic polyelectrolyte layers con-stitutes a novel and promising technique to modify surfacesin a controlled way [40]. Multilayered polyelectrolytes can beeasily engineered on a solid substrate to form uniformly thinfilms with multiple internal pores that have charged sur-
Table 1. Performance of sandwich immunoassay with proteinmicroarray fabricated on PET, aldehyde, and PLL slidesa)
Slide PET Aldehyde PLL
Linear range, pg/mL
TNF-a 6.4–20 000 32–4000 32–4000IL-2 6.4–20 000 32–4000 32–4000IL-6 6.4–4 000 32–4000 32–4000
LOD, pg/mL
TNF-a 3 25 15IL-2 6 30 28IL-6 4 25 23R2
TNF-a 0.97 0.98 0.96IL-2 0.96 0.95 0.93IL-6 0.97 0.97 0.93
a) R2 is the regression square value of data that gave the best fitto the linear equation y = mx 1 b.
faces. The structure has been confirmed by atomic force mi-croscopy studies [38–45]. Previous studies [39, 43] showedthat proteins embedded in or adsorbed on a polyelectrolytemultilayer retain their reactivity with respect to their anti-gens. Ladam [44, 45] investigated the adsorption of HSA onpolyelectrolyte multilayers and found that proteins stronglyaffixed on both negatively and positively charged polyelec-
© 2006 WILEY-VCH Verlag GmbH & Co. KGaA, Weinheim www.proteomics-journal.com

Proteomics 2006, 6, 1415–1426 Protein Arrays 1423
Figure 10. Sandwich immu-noassay of antibody micro-arrays fabricated on PET slides.(A) Scanning images of anti-body microarrays exposed to390 pg/mL of (a) mixture of TNF-a, IL-2, and IL-6, (b) TNF-a, (c) IL-2, and (d) IL-6; (B) dose–re-sponse curve of cytokine TNF-adetected on (a) PET slide, (b)aldehyde slide, and (c) PLL slide.Data shown representmeans 6 SD of 54 replicatesfrom three slides.
trolyte multilayers. However, to the authors’ knowledge, nostudy of the application of polyelectrolyte multilayers as ageneral platform for protein microarrays has been reportedup to now. This study represents a first step in this direction.Indeed, the fact that the PET thin film can be easily engi-neered on a glass substrate to form uniformly thin films of10–100 nm thickness makes PET a good candidate as a gen-eral platform for biomolecular microarray fabrication. SEMmicrographs showed that the coated PET film is uniformwith a film thickness of about 70 nm (Fig. 3). The nature ofthe PET film allows the use of many types of spotting tech-nologies to deposit the desired biological molecules. The lowinherent fluorescence of the PET film can support a variety ofdetection strategies compatible with multiplexed analysis
and high-throughput screening. More importantly, thehydrophilic matrix of the PET film can be better than planarsurfaces at retaining native protein structures.
In protein microarray technology, high-quality substrateswith reproducible surface properties and optimized surfacechemistries are required to immobilize the capture proteinshomogeneously and in a functional conformation. By ana-lyzing the fluorescent intensities retained on the PET slidesafter extensive washing, we demonstrated that proteinprobes with a wide range of pIs were all stably immobilizedon the PET-coated slide without chemical conjugation(Fig. 4). The fact that positively charged proteins still adsorbstrongly onto a positively charged PAAH-terminated filmcan be explained by the following three facts: (1) Proteins
© 2006 WILEY-VCH Verlag GmbH & Co. KGaA, Weinheim www.proteomics-journal.com

1424 X. Zhou and J. Zhou Proteomics 2006, 6, 1415–1426
attach to their surface domains in the presence of both posi-tive and negative surface excess charges. (2) On a PAAH-ter-minating multilayered PET film, some negatively chargedPVS chains can emerge at the outer surface and are thus alsoable to interact with the proteins because both the polyelec-trolyte chains of PVS and PAAH are flexible. Proteins adsor-bed by interactions with underlying PVS chains eventuallyare also possibly caused by the interdigitation of neighboringlayers [44, 45]. (3) Protein adsorption saturation occurred at ahigh spotting concentration. This implies that the large cov-erage observed, even when proteins adsorb on polyelectrolytefilms of same surface charge, must be due to protein diffu-sion along the film. The existence of such surface diffusion isindeed confirmed by recent diffusion studies of albumin onthe polyelectrolyte multilayers [45]. More than 90% of theinitially adsorbed proteins were retained stably on PET aftercontinuously washing with a buffer solution of similar ionicstrength as the one employed for the protein layer buildup(Fig. 5). This finding indicates that the washing with a buffersolution of similar ionic strength as the one employed forprotein printing does not significantly modify the structureof the adsorbed protein layers. This result also implies thatprotein microarrays fabricated on PET slides can undergoincubation and washing procedures as required in immu-noassay.
Figure 6 indicates that the pH value of the spotting bufferdoes not have a major effect on the immunoassay signalintensities. Previously, Kusnezow et al. [37] had also reportedthat the pH of the spotting buffer had little effect on thebinding of protein probes on the PLL and APTS slides, wherethe protein probes are immobilized on an amino-functiona-lized surface by electrostatic interaction.
Unlike the biosensors on PET film, where only one typeof biomolecular probe was immobilized, the microarraycontains multiple probes. To achieve specific signals fromthe multiple probes in protein microarrays, the unspecificsignals from the nonspecific adsorption of slide surface(antigen binding in the absence of antibody) and the non-specific reactivity of the protein probes with target sampleshave to be blocked. In this paper, we found that the use ofclassic blocking reagents of 1% BSA in PBS for 20 min canstrongly block nonspecific adsorption of the slide surface(Fig. 7). To avoid nonspecific reactivity of the protein probeswith target samples is one of the most severe challenges inprotein microarray technology. It has been reported that highconcentrations of capture antibody lead to nonspecific cross-reactivity [49]. Although we have not observed the cross-reactivity of protein probes with the protein concentrationsin the spotting buffer in this investigation, optimization ofcapture protein concentration is suggested for other proteinprobes.
The capture proteins can be immobilized onto the PETslides at random orientations by the combination of strongelectrostatic adsorption, hydrophobic adsorption, andentrapment of the porous structure, which do not result inconformational changes and thus without loss of binding
activity of the protein probes. Random orientation of proteinimmobilization avoids steric hindrance of oriented proteinsand the occlusion of binding to specific epitopes. Althoughsome data suggest advantages in oriented protein immobili-zations [46], others showed no significant differences be-tween the oriented and nonoriented immobilization of pro-tein function [47]. Due to the amphiphilic nature of poly-electrolyte, protein probes are immobilized on PET film insemiwet environment which keep protein probes in an activeform.
The sandwich assay format is an array analog of thewidely applied ELISA technique. The unlabeled target pro-tein of interest is bound first by the immobilized captureantibody, and then a biotinylated detection antibody binds tothe captured target protein, forming a capture/target/detec-tion protein “sandwich.” The target is then detected indi-rectly by measuring the intensity of the streptavidin-con-jugated label bound to the detection antibody. The obviousdisadvantages of the sandwich method are the multiplesteps, including several washings/incubations, and the needfor detection antibodies. In addition to the simplicity ofhandling the PET slides, the sandwich immunoassay on aPET slide also showed high sensitivity and a wider dynamicrange than the microarray fabricated with PLL and aldehydeslide (see Fig. 10). The LOD was shown to be as low as1–10 pg/mL of the analyte protein. Assays performed onthree independent slides demonstrated an average variationof 7.0% in the fluorescence values at each concentration tes-ted (data not shown). The LOD on a protein microarraydepends on the slide surface chemistry, the affinity constantof the antibody–antigen pair, and the detection system.Direct comparison of the LOD from reported literaturewould be difficult. MacBeath has shown the LOD of FKBP 12to be approximately 150 pg/mL on aldehyde glass [7], whileWagner has reported an LOD of 200 fg/mL for IL-10 on theZymomix microarray system [48]. Recently, Li [49] hasreported detection of cytokine at levels as low as 10 pg/mLusing a protein microarray fabricated on an NC-coated slide.Lin [3] reported a sensitivity of LOD down to pg/mL forcytokine detection with protein microarrays on hydrogelfilm-coated slides. The sensitivity and dynamic ranges ofimmunoassays on protein microarrays fabricated on PETsurface are comparable to these reported ELISA methodsand could be found to have potential application in clinicaldetection [50, 51]. With the same antibody–antigen pair, thePET slide provided higher sensitivity and a wider dynamicrange than monolayer-functionalized aldehyde or PLL slides.The higher sensitivity and wider dynamic range of the PETslide are most likely due to the combination of the higherprobe binding capacity of the PET film due to its 3-D natureand the higher level of probe accessibility of the PET film.Unlike the thick polymer-film-coated slides, such as the NC-coated slides, on which the proteins were retained mainly byhydrophobic adsorption, the PET film’s affinity for spottedprotein probes results from a combination of electrostaticadsorption, hydrophobic adsorption, and retention in the
© 2006 WILEY-VCH Verlag GmbH & Co. KGaA, Weinheim www.proteomics-journal.com
Proteomics 2006, 6, 1415–1426 Protein Arrays 1425
pores. The PET film also has a lower fluorescence back-ground than the thick NC film. Moreover, the binding ca-pacity and bioassay sensitivity of the protein microarrays onPET can be further increased by using dendrimeric polymers[52, 53], such as polyamidoamine starburst polymers, asstarting materials for preparing PET slides.
In summary, we have demonstrated the use of PET filmsas a highly stable generic platform for the fabrication of pro-tein microarrays via spontaneous one-step direct immobili-zation of the protein biomolecules. This provides a newmethod for the fabrication of protein microarrays. Micro-arrays on PET-coated slides have a uniform spot morphologyand provide the performance features needed for developingassays for genomic and proteomics analysis. The PETimmobilization chemistry presented here combines the sev-eral advantages of a 2-D monolayer coating with those of a3-D thick polymer coating. First, the preparation of PET filmsis simple and easy to handle. The PET film can be depositedon a solid substrate using a layer-by-layer self-assembly tech-nique. No chemical synthesis steps or handling of toxic cou-pling reagents are required in preparing the coating film.Second, the noncovalent adsorption of capture proteins onPET film minimizes the denaturation of the biological func-tion of the proteins. The PETslides do not require any specialhandling or storage precautions. This feature provides theconvenience for the individual laboratory researchers to con-duct microarray studies for multiple projects. Third, com-pared with conventional aldehyde or PLL slides, the PET filmhas higher sensitivity and wider dynamic range.
We thank Walter Koncinski for editorial assistance. This re-search was supported by The United States Department of Energy(DOE) under the Natural and Accelerated Bioremediation Re-search, Microbial Genome Program, and Genomics:GTL Pro-grams of the Office of Biological and Environmental Research(OBER), Office of Science, as well as by the funding provided byOBER to J.Z.Z. for his Presidential Early Career Award for Sci-entists and Engineers from The President of the United States ofAmerica. Oak Ridge National Laboratory is managed by UT-Battelle LLC for DOE under Contract DE-AC05–00OR22725.
5 References
[1] Houseman, B. T., Huh, J. H., Kron, S. J., Mrksich, M., Nat.Biotechnol. 2002, 20, 270–274.
[2] Zhu, H., Klemic, J. F., Chang, S., Bertone, P., Casamayor, A. etal., Nat. Genet. 2000, 26, 283–289.
[3] Lin, Y., Huang, R. C., Chen, L. P., Lisoukov, H., Lu, Z. H. et al.,Proteomics 2003, 3, 1750–1757.
[4] Knezevic, V., Leethanakul, C., Bichsel, V. E., Worth, J. M.,Prabhu, V. V. et al., Proteomics 2001, 1, 1271–1278.
[5] Madoz-Gurpide, J., Wang, H., Misek, D. E., Brichory, F.,Hanash, S. M., Proteomics 2001, 1, 1279–1287.
[6] de Wildt, R. M., Mundy, C. R., Gorick, B. D., Tomlinson, I. M.,Nat. Biotechnol. 2000, 18, 989–994.
[7] MacBeath, G., Schreiber, S. L., Science 2000, 289, 1760–1763.
[8] Sasakura, Y., Kanda, K., Yoshimura-Suzuki, T., Matsui, T.,Fukuzono, S. et al., Anal. Chem. 2004, 76, 6521–6527.
[9] Liu, X. S., Brutlag, D. L., Liu, J. S., Nat. Biotechnol. 2002,20(8), 835–839.
[10] Kurdistani, S. K., Grunstein, M., Methods 2003, 31, 90–95.
[11] Afanassiev, V., Hanemann, V., Wölfl, S., Nucleic Acids Res.2000, 28, e66.
[12] Cass, T., Liger, F. S., Immobilized Biomolecules in Analysis:A Practical Approach, Oxford University Press, New York1998.
[13] Seong, S. Y., Choi, C. Y., Proteomics 2003, 3, 2176–2189.
[14] Charles, P. T., Taitt, C. R., Goldman, E. R., Rangasammy, J. G.,Stenger, D. A., Langmuir 2004, 20, 270–272.
[15] MacBeath, G., Koehler, A. N., Schreiber, S. L., J. Am. Chem.Soc. 1999, 121, 7967–7968.
[16] Cretich, M., Pirri, G., Damin, F., Solinas, I., Chiari, M., Anal.Biochem. 2004, 332, 67–74.
[17] Ruiz-Taylor, L. A., Martin, T. L., Zaugg, F. G., Witte, K., Inder-muhle, P. et al., Proc. Natl. Acad. Sci. USA 2001, 98, 852–857.
[18] Sapsford, K. E., Liron, Z., Shubin, Y. S., Ligler, F. S., Anal.Chem. 2001, 73, 5518–5524.
[19] Dontha, N., Nowall, W. B., Kuhr, W. G., Anal. Chem. 1997, 69,2619–2625.
[20] Zhu, H., Bilgin, M., Bangham, R., Hall, D., Casamayor, A. etal., Science 2001, 293, 2101–2105.
[21] Templin, M. F., Stoll, D., Schrenk, M., Traub, P. C., Vohringer,C. F. et al., Trends Biotechnol. 2002, 20, 160–166.
[22] Zhu, H., Klemic, J. F., Chang, S., Bertone, P., Casamayor, A. etal., Nat. Genet. 2000, 26, 283–289.
[23] Hodneland, C. D., Lee, Y. S., Min, D. H., Mrksich, M., Proc.Natl. Acad. Sci. USA 2002, 99, 5048–5052.
[24] Joos, T. O., Schrenk, M., Hopfl, P., Kroger, K., Chowdhury, U.et al., Electrophoresis 2000, 21, 2641–2650.
[25] Ge, H., Nucleic Acids Res. 2000, 28, e3.
[26] Brizzolara, R. A., Biosens. Bioelectron. 2000, 15, 63–68.
[27] Brian, B. H., Maitreya, J. D., Patrick, O. B., Genome Biol.2001, research0004.1–0004.13.
[28] Lee, Y., Lee, E. K., Cho, Y. W., Matsui, T., Kang, I. C. et al.,Proteomics 2003, 3, 2289–2304.
[29] Kodadek, T., Chem. Biol. 2001, 8, 105–115.
[30] Guschin, D., Yershov, G., Zaslavsky, A., Gemmell, A., Shick,V. et al., Anal. Biochem. 1997, 250, 203–211.
[31] Stillman, B. A., Tonkinson, J. L., BioTechnique 2000, 29, 630–635.
[32] Kojima, K., Hiratsuka, A., Suzuki, H., Yano, K., Ikebukuro, K.et al., Anal. Chem. 2003, 75, 1116–1122.
[33] Rupcich, N., Goldstein, A., Brennan, J. D., Chem. Mater.2003, 15, 1803–1811.
[34] Kiyonaka, S., Sada, K., Yoshimura, I., Shinkai, S., Kato, N.,Nat. Mater. 2004, 3, 58–64.
[35] Blawas, A. S., Reichert, W. M., Biomaterials 1998, 19, 595–609.
[36] Gole, A., Sastry, M., Biotechnol. Bioeng. 2001, 74, 172–178.
© 2006 WILEY-VCH Verlag GmbH & Co. KGaA, Weinheim www.proteomics-journal.com

1426 X. Zhou and J. Zhou Proteomics 2006, 6, 1415–1426
[37] Kusnezow, W., Jacob, A., Walijew, A., Diehl, F., Hoheisel, J.D., Proteomics 2003, 3, 254–264.
[38] Zhou, X. C., Wu, L. Y., Zhou, J. Z., Langmuir 2004, 20, 8877–8885.
[39] Lvov, Y., Ariga, K., Ichinose, I., Kunitake, T., J. Am. Chem.Soc. 1995, 117, 6117–6123.
[40] Decher, G., Science 1997, 277, 1232–1237.
[41] Zhou, X. C., Huang, L. Q., Li, S. F. Y., Biosens. Bioelectron.2001, 16, 85–95.
[42] McAloney, R. A., Sinyor, M., Dudnik, V., Goh, M. C., Lang-muir 2001, 17, 6655–6663.
[43] Caruso, F., Niikura, K., Furlong, D. N., Okahata, Y., Langmuir1997, 13, 3427–3433.
[44] Ladam, G., Gergely, C., Senger, B., Decher, G., Voegel, J.-C.et al., Biomacromolecules 2000, 1, 674–687.
[45] Ladam, G., Schaaf, P., Cuisinier, F. J. G., Decher, G., Voegel,J.-C., Langmuir 2001, 17, 878–882.
[46] Turkova, J., J. Chromatogr. B 2000, 29, 630–635.
[47] Wilchek, M., Miron, T., J. Biochem. Biophys. Methods 2003,55, 67–70.
[48] Wagner, P., Protein Microarray Technology, IBC Micro-technology Series, March 21–21, San Diego, USA.
[49] Li, Y., Reichert, W. M., Langmuir 2003, 19, 1557–1566.
[50] Huang, R. P., Huang, R. C., Fan, Y., Lin, Y., Anal. Biochem.2001, 294, 55–62.
[51] Li, Y., Nath, N., Reichert, W. M., Anal. Chem. 2003, 75, 5274–5281.
[52] Hong, M.-Y., Yoon, H. C., Kim, H.-S., Langmuir 2003, 19, 416–421.
[53] Benters, R., Niemeyer, C. M., Drutschmann, D., Blohm, D.,Wöhrle, D., Nucleic Acids Res. 2002, 30, e10.
© 2006 WILEY-VCH Verlag GmbH & Co. KGaA, Weinheim www.proteomics-journal.com