Embed Size (px)
Citation preview
Spectroscopy 17 (2003) 1–15 1IOS Press
Protein identification and profiling with massspectrometry
Andrew Meyersa, Sunia Traugera, William Webba, Nichole Reisdorpha, Cindy Wranika,Eric Petersb and Gary Siuzdaka,∗
aThe Scripps Research Institute, Center for Mass Spectrometry and Department of Molecular Biology,La Jolla, CA 92037, USAb Genomics Institute of the Novartis Research Foundation, La Jolla, CA 92037, USA
1. Overview of the utility of protein ID
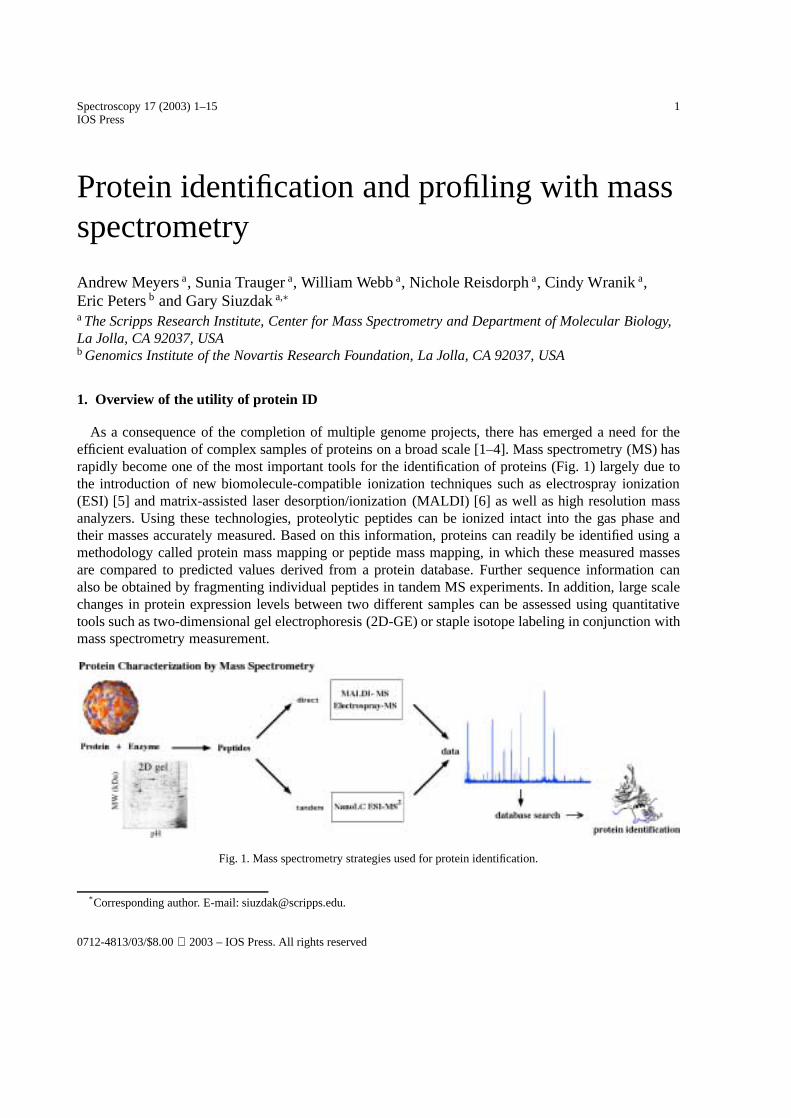
As a consequence of the completion of multiple genome projects, there has emerged a need for theefficient evaluation of complex samples of proteins on a broad scale [1–4]. Mass spectrometry (MS) hasrapidly become one of the most important tools for the identification of proteins (Fig. 1) largely due tothe introduction of new biomolecule-compatible ionization techniques such as electrospray ionization(ESI) [5] and matrix-assisted laser desorption/ionization (MALDI) [6] as well as high resolution massanalyzers. Using these technologies, proteolytic peptides can be ionized intact into the gas phase andtheir masses accurately measured. Based on this information, proteins can readily be identified using amethodology called protein mass mapping or peptide mass mapping, in which these measured massesare compared to predicted values derived from a protein database. Further sequence information canalso be obtained by fragmenting individual peptides in tandem MS experiments. In addition, large scalechanges in protein expression levels between two different samples can be assessed using quantitativetools such as two-dimensional gel electrophoresis (2D-GE) or staple isotope labeling in conjunction withmass spectrometry measurement.
Fig. 1. Mass spectrometry strategies used for protein identification.
* Corresponding author. E-mail: [email protected].
0712-4813/03/$8.00 2003 – IOS Press. All rights reserved
2 A. Meyers et al. / Protein identification and profiling with mass spectrometry
Table 1
Protease specificity. Proteolysis experiments can use any of a number of enzymes to perform digestion. The cleavage specificityof some of the different enzymes is denoted by a slash (/) before or after the amino acid responsible for specificity. Combinationsof proteases can be used to reduce specificity and to mimic other proteases. For example Lys-C and clostripain together arespecific for the same sites as trypsin
Protease Amino acid specificity ExceptionsTrypsin X-Lys/-Y Does not cleave if Y= Pro
X-Arg/-YEndoproteinase Lys-C X-Lys/-Y Does not cleave if Y= ProClostripain X-Arg/-YEndoproteinase Asp-N X-Asp/-Y Does not cleave if Y= Ser
X-cysteic acid bondsCNBr X-Met/-Y Does not cleave if Y= Ser, Thr, or CysGlu-C (V8 Protease (E)) X-Glu/-Y Does not cleave if X= Pro
X-Asp/-YPepsin X-Phe/-Y Does not cleave if Y= Val, Ala, Gly
X-Leu/-YX-Glu/-Y
Endoproteinase Arg C X-Arg/-Y Does not cleave if Y= ProThermolysin X-/Phe-Y Does not cleave if X= Pro
X-/Ile-YX-/Leu-YX-/Ala-YX-/Val-YX-/Met-Y
Chymotrypsin X-Phe/-Y Does not cleave if Y= Met, Ile, Ser, Thr, Val, His, Glu, AspX-Tyr/-YX-Trp/-YX-Leu/-Y
Formic acid X-/Asp-Y
1.1. Identification by peptide mass mapping
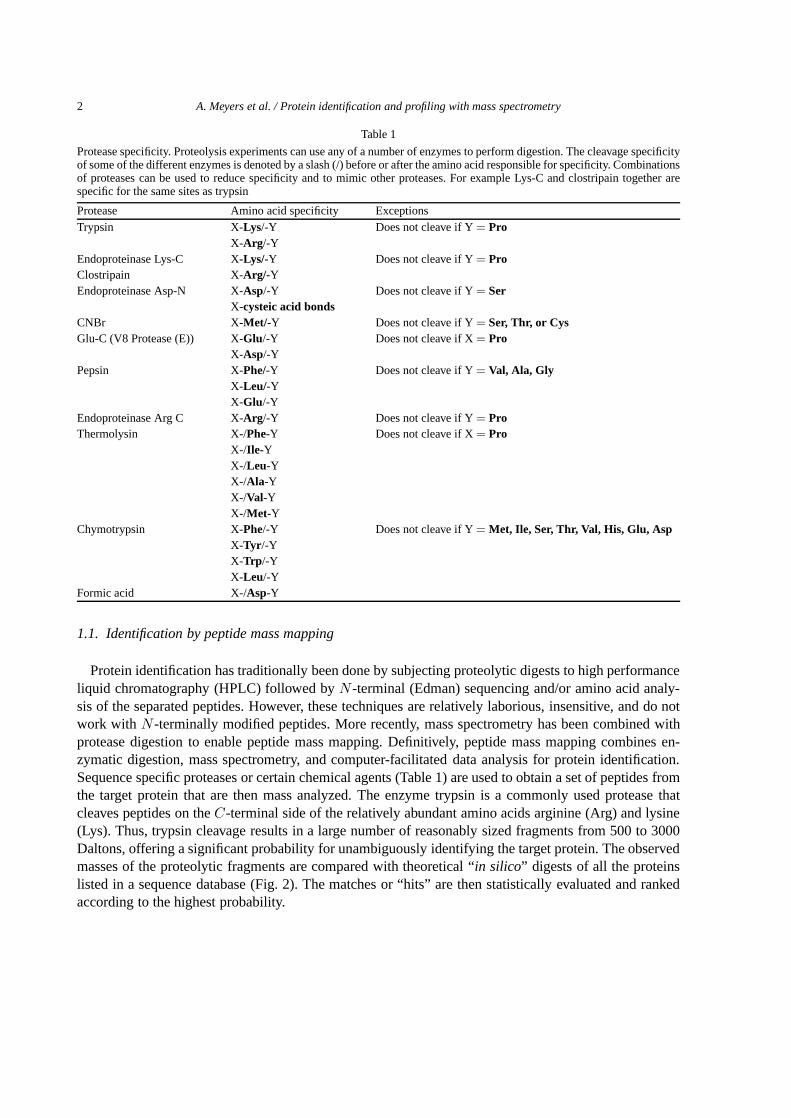
Protein identification has traditionally been done by subjecting proteolytic digests to high performanceliquid chromatography (HPLC) followed byN -terminal (Edman) sequencing and/or amino acid analy-sis of the separated peptides. However, these techniques are relatively laborious, insensitive, and do notwork with N -terminally modified peptides. More recently, mass spectrometry has been combined withprotease digestion to enable peptide mass mapping. Definitively, peptide mass mapping combines en-zymatic digestion, mass spectrometry, and computer-facilitated data analysis for protein identification.Sequence specific proteases or certain chemical agents (Table 1) are used to obtain a set of peptides fromthe target protein that are then mass analyzed. The enzyme trypsin is a commonly used protease thatcleaves peptides on theC-terminal side of the relatively abundant amino acids arginine (Arg) and lysine(Lys). Thus, trypsin cleavage results in a large number of reasonably sized fragments from 500 to 3000Daltons, offering a significant probability for unambiguously identifying the target protein. The observedmasses of the proteolytic fragments are compared with theoretical “in silico” digests of all the proteinslisted in a sequence database (Fig. 2). The matches or “hits” are then statistically evaluated and rankedaccording to the highest probability.
A. Meyers et al. / Protein identification and profiling with mass spectrometry 3
Fig. 2. Protein identification through the comparison of tryptic peptides of an unknown protein to the theoretical digest ofknown proteins. The identification can be made to be more reliable when constraints are added such as the source and size ofthe protein, as well as when high accuracy data and tandem mass measurements are used.
Clearly, the success of this strategy is predicated on the existence of the correct protein sequence withinthe database searched. However, the quality and content of such databases are continually improving asa result of genomic sequencing of entire organisms, and the likelihood for obtaining matches is nowreasonably high. While exact matches are readily identified, proteins that exhibit significant homologyto the sample are also often identified with lower statistical significance. This ability to identify proteinsthat share homology with poorly characterized sample species makes protein mass mapping a valuabletool in the study of protein structure and function.
Upon submitting a query to a search program, a theoretical digest of all the proteins in the database isperformed according to the conditions entered by the researcher. Variables that can be controlled includetaxonomic category, digestion conditions employed, the allowable number of missed cleavages, proteinpI and mass ranges, possible post translational modifications (PTMs), and peptide mass measurementtolerance. A list of theoretical peptide masses is created for each protein in the database according tothe defined constraints, and these values are then compared to the measured masses. Each measuredpeptide generates a set of candidate proteins that would produce a peptide with the same mass underthe digestion conditions specified. The proteins in these sets are then ranked and scored based on howclosely they match the entire set of experimental data.
This method of identification relies on the ability of mass spectrometry to measure the masses ofthe peptides with reasonable accuracy, with typical values ranging from roughly 5 to 50 ppm (5 ppm=±0.005 Daltons for a 1,000 Daltons peptide). The experimentally measured masses are then compared toall the theoretically predicted peptide digests from a database containing possibly hundreds of thousandsof proteins to identify the best possible matches. Various databases (Table 2) are available on the Web,and can be used in conjunction with such computer search programs such as Profound (developed atRockefeller University), ProteinProspector (University of California, San Francisco) and Mascot (Matrix
4 A. Meyers et al. / Protein identification and profiling with mass spectrometry
Table 2
Two of the protein databases available on the Internet
NCBInr A non-redundant database compiled by the National Center for Biotech-nology Information (NCBI) by combining most of the public domaindatabases (Expressed Sequence Tags (EST’s) not included).
Swiss Prot A curated protein sequence database which strives to provide a highlevel of annotations, such as the description of the function of a pro-tein, its domain’s structure, post-translational modifications, variants,etc. This database offers a minimal level of redundancy and high levelof integration with other databases.
Science, Limited). One obvious limitation of this methodology is that two peptides having differentamino acid sequences can still have the same exact mass. In practice, matching 5–8 different trypticpeptides is usually sufficient to unambiguously identify a protein with an average molecular weight of50 kDa, while a greater number of matches may be required to identify a protein of higher molecularweight. It is important to note that the term protein identification as used here does not imply that theprotein is completely characterized in terms of its entire sequence as well as all its PTMs. Rather, thisterm typically refers to matching the sample to the base amino acid sequence as translated from theencoding gene.
In theory, accurate mass measurements of the undigested sample could also be used for protein iden-tification. In practice however, the identification of a protein based solely on its intact masses is nearlyimpossible due to the stringent sample purity required, the need for extremely accurate mass measure-ments, and most importantly, the unpredictable variability introduced by numerous possible PTMs.
1.2. Identification using tandem mass spectrometry
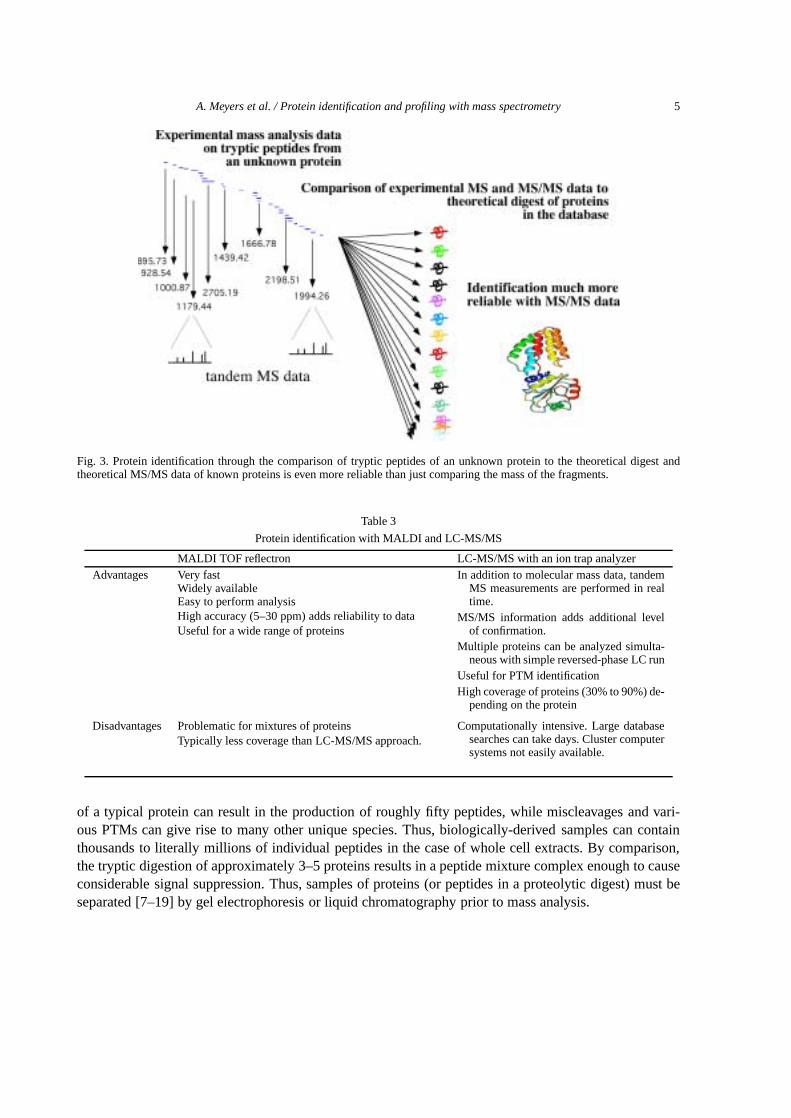
A more specific database searching method involves the use of partial sequence information derivedfrom MS/MS data (Fig. 3). As discussed later, tandem mass spectrometry experiments yield fragmenta-tion patterns for individual peptides. Manual interpretation of a tandem MS experiment can often be quitedifficult due to the number of different fragmentations that can occur, not all of which yield structurallyuseful information. However, in analogy to peptide mapping experiments, the experimentally obtainedfragmentation patterns can be compared to theoretically generated MS/MS fragmentation patterns forthe various proteolytic peptides arising from each protein contained in the searched database. Statisticalevaluation of the results and scoring algorithms using search engines such as Sequest (ThermoFinniganCorp.) and MASCOT (Matrix Science, Limited) facilitate the identification of the best match. The partialsequence information contained in tandem MS experiments is much more specific than simply using themass of a peptide, since two peptides with identical amino acid contents but different sequences willexhibit different fragmentation patterns.
2. Prior to mass analysis: separation
2.1. The requirement for sample separation
Although these methodologies have greatly enhanced the ability to perform efficient protein identifi-cations, they cannot directly be used to identify all the proteins present in a typical biological sample dueto the significant signal suppression caused by complex mixtures in mass spectrometry. Tryptic digestion
A. Meyers et al. / Protein identification and profiling with mass spectrometry 5
Fig. 3. Protein identification through the comparison of tryptic peptides of an unknown protein to the theoretical digest andtheoretical MS/MS data of known proteins is even more reliable than just comparing the mass of the fragments.
Table 3
Protein identification with MALDI and LC-MS/MS
MALDI TOF reflectron LC-MS/MS with an ion trap analyzerAdvantages Very fast In addition to molecular mass data, tandem
MS measurements are performed in realtime.
Widely available
MS/MS information adds additional levelof confirmation.
Easy to perform analysis
Multiple proteins can be analyzed simulta-neous with simple reversed-phase LC run
High accuracy (5–30 ppm) adds reliability to data
Useful for PTM identification
Useful for a wide range of proteins
High coverage of proteins (30% to 90%) de-pending on the protein
Disadvantages Problematic for mixtures of proteins Computationally intensive. Large databasesearches can take days. Cluster computersystems not easily available.
Typically less coverage than LC-MS/MS approach.
of a typical protein can result in the production of roughly fifty peptides, while miscleavages and vari-ous PTMs can give rise to many other unique species. Thus, biologically-derived samples can containthousands to literally millions of individual peptides in the case of whole cell extracts. By comparison,the tryptic digestion of approximately 3–5 proteins results in a peptide mixture complex enough to causeconsiderable signal suppression. Thus, samples of proteins (or peptides in a proteolytic digest) must beseparated [7–19] by gel electrophoresis or liquid chromatography prior to mass analysis.
6 A. Meyers et al. / Protein identification and profiling with mass spectrometry
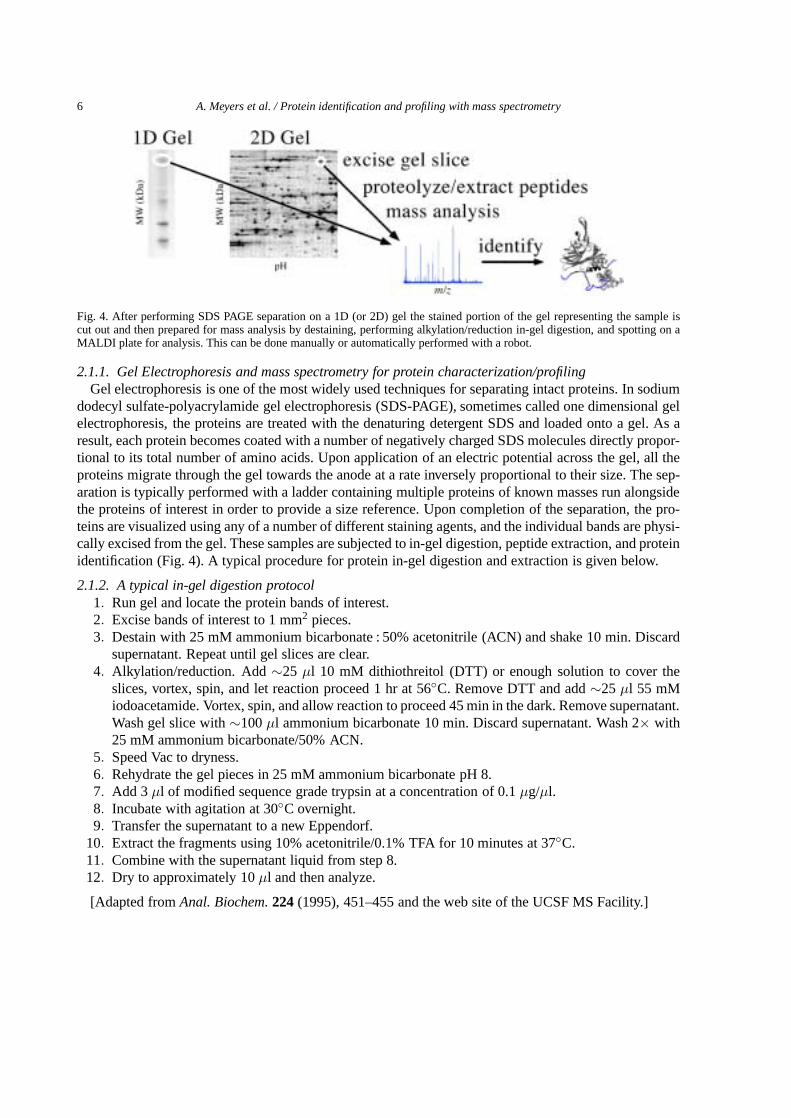
Fig. 4. After performing SDS PAGE separation on a 1D (or 2D) gel the stained portion of the gel representing the sample iscut out and then prepared for mass analysis by destaining, performing alkylation/reduction in-gel digestion, and spotting on aMALDI plate for analysis. This can be done manually or automatically performed with a robot.
2.1.1. Gel Electrophoresis and mass spectrometry for protein characterization/profilingGel electrophoresis is one of the most widely used techniques for separating intact proteins. In sodium
dodecyl sulfate-polyacrylamide gel electrophoresis (SDS-PAGE), sometimes called one dimensional gelelectrophoresis, the proteins are treated with the denaturing detergent SDS and loaded onto a gel. As aresult, each protein becomes coated with a number of negatively charged SDS molecules directly propor-tional to its total number of amino acids. Upon application of an electric potential across the gel, all theproteins migrate through the gel towards the anode at a rate inversely proportional to their size. The sep-aration is typically performed with a ladder containing multiple proteins of known masses run alongsidethe proteins of interest in order to provide a size reference. Upon completion of the separation, the pro-teins are visualized using any of a number of different staining agents, and the individual bands are physi-cally excised from the gel. These samples are subjected to in-gel digestion, peptide extraction, and proteinidentification (Fig. 4). A typical procedure for protein in-gel digestion and extraction is given below.
2.1.2. A typical in-gel digestion protocol1. Run gel and locate the protein bands of interest.2. Excise bands of interest to 1 mm2 pieces.3. Destain with 25 mM ammonium bicarbonate : 50% acetonitrile (ACN) and shake 10 min. Discard
supernatant. Repeat until gel slices are clear.4. Alkylation/reduction. Add∼25 µl 10 mM dithiothreitol (DTT) or enough solution to cover the
slices, vortex, spin, and let reaction proceed 1 hr at 56◦C. Remove DTT and add∼25 µl 55 mMiodoacetamide. Vortex, spin, and allow reaction to proceed 45 min in the dark. Remove supernatant.Wash gel slice with∼100µl ammonium bicarbonate 10 min. Discard supernatant. Wash 2× with25 mM ammonium bicarbonate/50% ACN.
5. Speed Vac to dryness.6. Rehydrate the gel pieces in 25 mM ammonium bicarbonate pH 8.7. Add 3µl of modified sequence grade trypsin at a concentration of 0.1µg/µl.8. Incubate with agitation at 30◦C overnight.9. Transfer the supernatant to a new Eppendorf.
10. Extract the fragments using 10% acetonitrile/0.1% TFA for 10 minutes at 37◦C.11. Combine with the supernatant liquid from step 8.12. Dry to approximately 10µl and then analyze.
[Adapted fromAnal. Biochem. 224 (1995), 451–455 and the web site of the UCSF MS Facility.]
A. Meyers et al. / Protein identification and profiling with mass spectrometry 7
Table 4
Protein profiling with gel electrophoresis and LC/MS
2D Gels with mass spectrometry ID 2D LC-MS/MSAdvantages Widely available and becoming more
reproducible.Good dynamic range especially for
low expression level proteins.(Codon Adaptation Index, CAI,of 0–0.2) very difficult for 2D gels tolook below<CAI = 0.2
Software available for differential ex-pression as well as quantifying differ-ences (±20% at best).
Good for a wide range of proteins withdifferent hydrophobicities
Easy visualization of up/down regula-tion demonstrated for highly com-plex mixtures MS/MS experiments performed auto-
matically for reliable identification.
Disadvantages Problematic for proteins with extremesof PI and MW. Difficult for hy-drophobic proteins.
Computationally intensive. Databasesearches can take days. Cluster com-puter systems not easily available.
Sample handling extensive for MSanalysis (stain/destain and extrac-tion), multiple steps required andtime consuming. Can be minimizedwith use of robots.
Multi-dimensional protein identifica-tion technology (MudPIT) has thepotential of coupling to quantitativeapproaches. Currently limited appli-cation shown for differential pro-tein expression (relative quantitation)with 2D LC/MS/MS for highly com-plex mixtures.
Overlapping proteins possibleLimited dynamic range
The combination of SDS-PAGE electrophoresis with an isoelectric focusing step also enables the sep-aration of protein of similar mass. In two dimensional gel electrophoresis (2D-GE), proteins are firstseparated according to their isoelectric points by electrophoresis through a solution or gel containing animmobilized pH gradient, with each protein migrating to a position in the pH gradient corresponding toits isoelectric point. Once the isoelectric focusing step is complete, a secondary gel electrophoresis sim-ilar to SDS-PAGE is performed in an orthogonal direction to also separate the proteins by size. Like 1Dgels, 2D gel spots can be cut out, enzymatically digested, and mass analyzed for protein identification.Using this technique, thousand of proteins can simultaneously be separated and identified. Additionally,this technique can help facilitate the analysis of certain PTMs. For example, differently phosphorylatedforms of the same base protein may appear as a series of bands of roughly identical mass but differentisoelectric points.
In addition to enabling the identification of thousand of different proteins, 2D-GE can also be usedto assess large scale changes in protein expression levels between two different samples (i.e., healthyversus diseased samples). These protein profiling experiments (Fig. 5) rely on the fact that the chemicalsused to visualize the separated protein bands produce responses roughly proportional to the total levelof protein in the band. The experiments are typically performed by running 2D-GE on each of the twosamples separately and comparing the resulting patterns. Proteins bands that appear in only one gel orthat differ significantly in their intensity are excised and identified. Alternatively, the two samples can betreated with different visualization agents (i.e., two dyes with significantly different fluorescent emissionspectra), combined, and run on the same gel.
Although historically difficult, the reproducibility of 2D-GE has improved with the availability of highquality pre-cast gels, immobilized pH gradients strips (IPG), sophisticated pattern recognition software,and laboratory automation. However, considerable limitations remain, including operational difficultyin handling certain classes of proteins, the co-migration of multiple proteins to the same position, and

8 A. Meyers et al. / Protein identification and profiling with mass spectrometry
Fig. 5. Protein profiling can be performed by comparing the 2D gel from two different cell lines. The protein spot of interest isexcised from the gel and an in-gel proteolysis of the protein is performed.
potential unwanted chemical modifications. An even greater potential shortcoming of the classic 2D-GE technique is its inability to accommodate the extreme range of protein expression levels inherentin complex living organisms due to sample loading restrictions imposed by the gel-based separationtechnology employed. Thus, 2D-GE separations often result in only the most abundant proteins beingvisualized and characterized. This limitation is of particular concern in that most interesting classes ofregulatory proteins are often expressed at low copy numbers per cell.
2.2. High throughput protein ID with MALDI-MS
The ability to profile changes in the expression levels of thousands of proteins would be rela-tively meaningless without the ability to rapidly identify species of interest. To this end, automatedliquid handling robots have been developed that perform all the sample preparation steps for pep-tide mapping experiments, including gel destaining, alkylation/reduction, in gel digestion, peptide ex-traction, and MALDI target plating. The benefits of such automation include less contamination dur-ing sample preparation, increased reproducibility, rapid protocol development, and the ability to pre-pare hundreds of proteins in the course of one day. Whereas manual preparation would require afull week to perform two-hundred analyses, a robotics station can complete the task in a matter ofhours.
Mass spectral data acquisition systems have similarly been automated to acquire spectra, process theraw data, and perform database searches for numerous samples. Commercial MALDI-TOF systems arecurrently available that can perform 5,000 peptide mapping experiments in just twelve hours. Thesesystems are able to perform automated calibrations, vary laser energies, and adjust laser firing loca-tion to maximize signal, with the entire data acquisition process requiring approximately 30 seconds orless. Similarly, automated data processing systems can recognize suitable signals, identify monoisotopicpeaks, and submit summary peak list directly to a search engine.
Such high throughput proteomics systems enable researchers to investigate multiple unknown samplesat once, whereas once it was too time consuming and costly to perform such analyses. Additionally, theflexibility of automated acquisition and data analysis software allows researchers to rapidly reacquireand/or reanalyze entire batches of samples with minimal user effort. Automated systems are howeverlimited in that they are only as good as the programming given to them. For example, the detectionand accurate mass assignment of species exhibiting low signal to noise ratios is often problematic. Suchissues have led to a great deal of developmental work on post-acquisition data processing. Improvements

A. Meyers et al. / Protein identification and profiling with mass spectrometry 9
in these processes have enabled high throughput automated systems to achieve identification “hit” ratesequal to or above those obtained manually.
2.3. Separation with liquid chromatography
2.3.1. Protein identification with liquid chromatography-tandem mass spectrometryAn alternative approach to gel electrophoresis techniques involves the use of analytical separation
methods such as high performance liquid chromatography (HPLC). Although the rest of this chapterfocuses specifically on liquid chromatographic techniques, it is important to note that the same advan-tages also apply to other separation methods such as capillary electrophoresis. Although fast and ofteneffective for the identification of individual proteins, peptide mapping methods usually fail when dealingwith more complex mixtures due to significant signal suppression as the sample becomes more complex.By contrast, LC-based methodologies fractionate the peptide mixtures before MS analysis, thus decreas-ing signal suppression and improving the analysis of any given peptide. More importantly, additionalinformation can also be obtained on individual peptides by performing tandem MS experiments.
Whereas gel electrophoresis techniques separate intact proteins, liquid chromatography can be per-formed on both intact proteins as well as proteolytic peptides. However, the actual protein identificationanalysis is almost always performed using digested samples due to the reasons discussed earlier. One ofthe most popular means of performing peptide LC-MS/MS involves the direct coupling of the separationsystem to an ion trap mass spectrometer through an electrospray ionization interface. Other mass analyz-ers suitable for these experiments include triple quadrupoles, quadrupole time-of-flights, and quadrupoleion traps. However, ion traps remain the most popular because of their ease of use, relatively low cost,and rapid scanning capability that enables tandem mass measurements to be performed in real time. Forexample, the ion trap first performs MS measurements on all the intact peptide ions. Then, in a secondscan, it performs a MS/MS experiment on a particular peptide ions detected in the first. This series ofalternating scans can rapidly be repeated, with different ions selected for each tandem MS experiment.In this manner, single peptides from a complex mixtures can individually be addressed and analyzed.
Tandem MS experiments provide structural information for a given peptide by physically fragmentingit. This process is initiated by converting some of the kinetic energy of the peptide ion into vibrationalenergy, and is experimentally achieved by inducing the selected ion, usually an (M+ H)+ or (M +nH)n+ ion, into physical collisions with neutral Ar, Xe, or He atoms. The resulting fragment ions arethen monitored by MS. Fortunately, a large percentage of the fragment ions produced in this processresult from cleavages along the linear backbone of the peptide, and can be separated into two majorclasses. One class retains the charge on the N-terminal fragment, and the ions types are designated asan, bn, or cn depending on the exact site of cleavage. The second class of fragment ions retains thecharge on the C-terminal fragment, and are similarly designated as xn, yn, and zn type ions. Of thesespecies, the most frequently observed fragments are the b- and y-type ions that result from cleavageof the bond between the carbonyl carbon and the amide nitrogen (the amide bond). The differences inmasses between the members of either the b- or y-ion series corresponds to the amino acid sequence ofthe fragmented peptide.
The additional sequence information provided by tandem MS experiments can be extremely powerful,sometimes enabling a definitive protein identification to be made on the basis of a single peptide. Ob-viously though, tandem MS spectra of multiple peptides that arise from the digestion of a given proteinprovides greater opportunity for obtaining a definitive identification. Generally, sequence informationcan be obtained for peptides with molecular masses up to 2500 Daltons. Larger peptides can reveal atleast partial sequence information that often suffices to solve a particular problem.

10 A. Meyers et al. / Protein identification and profiling with mass spectrometry
Although powerful, tandem mass spectrometry has certain limitations with respect to its ability toobtain complete sequence information. For example, it is not possible to distinguish between leucine andisoleucine as they have the exact same mass. Similarly, lysine and glutamine can only be distinguishedusing high mass accuracy tandem analyzers, as they differ in mass by only 0.036 Daltons. Generally,complete ion series (y or b type) are usually not observed. However, the combination of the two seriesoften provides more useful information and possibly the entire sequence. In addition, some amino acidsas well as certain PTMs bias the fragmentation towards certain cleavages, dramatically decreasing theamount of sequence information obtained. Although chemical labeling techniques can partly compensatefor these phenomena, it is important to note that not every peptide yields useful tandem MS spectra, thusfurther emphasizing the usefulness of attempting tandem MS spectra for multiple peptides arising froma given protein.
2.4. Protein identification with multi-dimensional liquid chromatography-tandem mass spectrometry(LC-MS/MS)
LC-MS/MS methodologies for protein identification have been extended to mixtures of even greatercomplexity by performing multi-dimensional chromatographic separations before MS analysis (Fig. 6).As its name suggests, extremely complex tryptic digests are first separated into a number of fractionsusing one mode of chromatography, and each of these fractions is then further separated using a dif-ferent chromatographic method [14,15]. In theory, any combination of operationally compatible chro-
Fig. 6. The proteolytic peptides separated by liquid chromatography and 2D liquid chromatography are ionized using electro-spray ionization and then subjected to tandem mass spectrometry (MS/MS) experiments. The data from the 1D experimentscan analyze up to 200 proteins simultaneously while the 2D experiments are capable of handling thousands of proteins.
A. Meyers et al. / Protein identification and profiling with mass spectrometry 11
matographic methods possessing sufficiently orthogonal modes of separation can be utilized, and severaldifferent combination have been described in the literature. However, the overwhelming number of stud-ies to date have combined strong cation exchange (SCX) and reversed-phase (RP) chromatographies.More recently, further improvements have been realized by having both chromatographic beds in a sin-gle capillary column and directly coupling this column to an ion trap mass spectrometer. A step gradientof salt concentrations is used to elute different peptide fractions from the SCX resin onto the RP mater-ial, after which RP chromatography is performed without affecting the other peptides still bound to theSCX resin. The resulting nano-RP LC column effluent is directly electrosprayed into the mass spectrom-eter, making this method not only amenable to automation but also very sensitive. Using this “MuDPIT”methodology (Multi-Dimensional Protein Identification Technology), thousands of unique proteins havebeen identified from a whole cell lysate in a single 2D LC-MS/MS experiment. Additionally, recent stud-ies have also indicated that this technique possess a greater dynamic range than that obtained using 2Dgel electrophoresis, enabling the detection of lower abundance proteins. However, one limitation slowingthis methodology’s wide scale implementation is the massive computing power required to effectivelycompare and evaluate the statistical significance of similarities between the huge number of tandem MSspectra experimentally generated and the predicted fragmentation patterns of peptides resulting from thein silico digestion of all the entries in a given protein database.
2.5. Protein profiling with LC-MS/MS
Protein profiling studies can also be performed using multi-dimensional LC-MS/MS in conjunctionwith stable isotope labeling methodologies [16–18]. Specifically, two samples to be compared are indi-vidually labeled with different forms of a stable isotopic pair, and their tryptic digests are then combinedbefore the final LC-MS analysis. This should result in every peptide existing as a pair of isotopicallylabeled species that are identical in all respects except for their masses. Thus, each isotopically labeledpeptide effectively serves as its partner’s internal standard, and the ratio of the relative heights of twoisotopically labeled species provides quantitative data as to any differential change that occurred in theexpression of the protein from which the peptide arose.
One approach towards differential labeling involves growing cells in isotopically enriched media. Forexample, one set of cells would be cultured in media that contained14N as the only source of nitrogenatoms, while the comparative case would be grown in media that only contained15N. Although effectivein incorporating different stable isotopes into the two samples, the determination of which two peptidescomprise an isotopically labeled pair is severely complicated by the fact that each pair exhibits a differentmass difference depending on the number of isotopic atoms incorporated. “Inverse labeling” methodolo-gies have recently been introduced that cleverly address this issue at the cost of doubling the number ofexperiments that need to be performed. Ultimately though, this technique is limited in that it obviouslycannot systemically be applied to higher organisms.
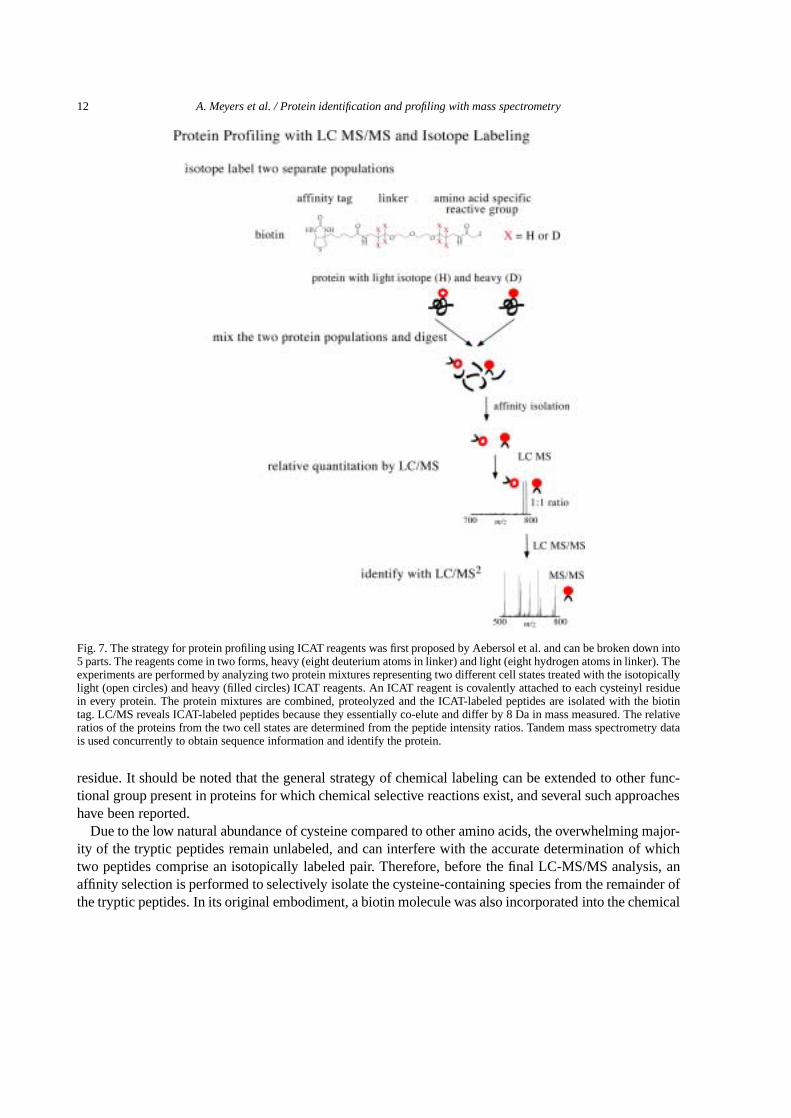
Alternatively, the recently introduced methodology of isotope-coded affinity tags (ICAT) (Fig. 7) pro-vides a more generally applicable approach based on thein vitro chemical labeling of protein samples.Specifically, ICAT utilizes the high specificity of the reaction between thiol groups and haloacetyls suchas iodoacetamide to chemical label cysteine residues in proteins with isotopically light or heavy versionsof a molecule that differ only by the existence of eight hydrogen or deuterium atoms, respectively. Thelabeled proteins samples are then combined and simultaneously digested, resulting in every cysteine-containing peptide existing as an isotopically labeled pair differing in mass by eight Daltons per cysteine
12 A. Meyers et al. / Protein identification and profiling with mass spectrometry
Fig. 7. The strategy for protein profiling using ICAT reagents was first proposed by Aebersol et al. and can be broken down into5 parts. The reagents come in two forms, heavy (eight deuterium atoms in linker) and light (eight hydrogen atoms in linker). Theexperiments are performed by analyzing two protein mixtures representing two different cell states treated with the isotopicallylight (open circles) and heavy (filled circles) ICAT reagents. An ICAT reagent is covalently attached to each cysteinyl residuein every protein. The protein mixtures are combined, proteolyzed and the ICAT-labeled peptides are isolated with the biotintag. LC/MS reveals ICAT-labeled peptides because they essentially co-elute and differ by 8 Da in mass measured. The relativeratios of the proteins from the two cell states are determined from the peptide intensity ratios. Tandem mass spectrometry datais used concurrently to obtain sequence information and identify the protein.
residue. It should be noted that the general strategy of chemical labeling can be extended to other func-tional group present in proteins for which chemical selective reactions exist, and several such approacheshave been reported.
Due to the low natural abundance of cysteine compared to other amino acids, the overwhelming major-ity of the tryptic peptides remain unlabeled, and can interfere with the accurate determination of whichtwo peptides comprise an isotopically labeled pair. Therefore, before the final LC-MS/MS analysis, anaffinity selection is performed to selectively isolate the cysteine-containing species from the remainder ofthe tryptic peptides. In its original embodiment, a biotin molecule was also incorporated into the chemical
A. Meyers et al. / Protein identification and profiling with mass spectrometry 13
label and used in conjunction with a monomeric avidin column to affinity purify the cysteine-containingpeptides. Alternatively, a solid phase capture and release strategy has more recently been described.Although these solutions enable the accurate identification of isotopically labeled peptide pairs, they ob-viously preclude the analysis of proteins that do not contain cysteines and also greatly reduce the numberof opportunities to effect LC-MS/MS identification of the proteins that do contain cysteine residues.
2.6. LC-MALDI MS/MS: A potentially powerful paradigm
Although still relatively early in their development, these multi-dimensional LC-MS/MS-based ap-proaches exhibit tremendous potential for the improved high-throughput identification and profiling ofproteins from complex mixtures. However, the operational parameters of the ESI coupling methods over-whelmingly employed to date in their implementation also impose several limitations. Specifically, theseparation system and mass spectrometer employed are coupled directly in real time, enabling tandemMS experiments to be performed on only a relatively small fraction of the species simultaneously elutingfrom the LC column. As a result, the list of proteins identified using this technology has been shownto vary significantly between repeat analyses of the same sample. More importantly, current instrumentcontrol and data analysis software is not sophisticated enough to allow real time data-dependent process-ing during the course of a chromatographic separation except when employing simple selection criteriasuch as peak intensity. This necessitates that upon the completion of a separation and subsequent analysisof the resulting data, the same sample must often be rerun to focus on those species that exhibited thedesired selection criteria but were not randomly subjected to tandem MS.
In light of these considerations, several groups have begun to explore MALDI-based LC-MS/MSstrategies that involve the creation of a “permanent record” of the multidimensional separation by de-positing the effluents of the final separation columns directly onto MALDI target plates (Fig. 8) [19].De-coupling the separation step from the mass spectrometer in this manner enables more thoroughanalyses of samples to be performed due to the removal of artificially imposed time restrictions. Theresulting plates can also be reanalyzed as required without the need to repeat the separation step, thusdecreasing sample requirements while focusing system resources only on the acquisition of tandem MSspectra of species of interest. Although more difficult to effectively implement than ESI-based methods,the commercial introduction of mass analyzers such as the MALDI-QTOF promise to further speed thedevelopment of MALDI-based LC-MS/MS platforms.
2.7. Protein identifications using extremely accurate mass measurements
Further improvements in mass analyzer performance should also enable new approaches for the effec-tive identification of proteins [19,20]. For example, Fourier transform ion cyclotron resonance (FT-ICR)mass spectrometers can measure the masses of proteins and/or peptides with mass accuracies of 1 ppmor better. When combined with chemical labeling techniques to determine the number of specific aminoacids contained in a given species, these extremely high mass accuracy can be used to unequivocallyidentify a protein from a single peptide without performing tandem MS. Although intriguing, this tech-nique requires significant further development in order to demonstrate its general applicability.
3. Conclusion
Both MALDI and LC-MS/MS are playing important roles in protein identification and protein profil-ing. MALDI offers many advantages in terms of speed and ease of use for protein identification whereas

14 A. Meyers et al. / Protein identification and profiling with mass spectrometry
Fig. 8. An example of HPLC MALDI-MS. (Top) FourµHPLC columns performing parallel deposition on 384 microtiter plateformat for analysis by MALDI. (Middle & bottom) Three-dimensional plot of the reversed-phaseµHPLC–MALDI FT-ICR MSanalysis of a tryptic digest of yeast proteins.
LC-MS/MS offers a more reliable protein ID as well as a greater potential for post-translational modifi-cation identification. MALDI is also finding utility in its application to traditional protein profiling withgels and protein profiling while LC-MS/MS appears to be a tool of the future with respect to quantitativeanalysis with isotope labelling. Finally, LC-MS/MS capabilities are not only limited to electrospray, withnew approaches coupling LC to MALDI offer the potential of rapid analysis and highly accurate massmeasurements. LC/MALDI also can provide a platform that offers re-analysis of samples.
References
[1] A. Pandey and M. Mann, Proteomics to study genes and genomes,Nature 405 (2000), 837–846.[2] S. Broder and J.C. Venter, Sequencing the entire genomes of free-living organisms: the foundation of pharmacology in the
new millennium,Annual Rev. Pharmacol. Toxicol. 40 (2000), 97–132.[3] J.R. Yates, 3rd, Mass spectrometry: From genomics to proteomics,Trends in Genetics 16 (2000), 5–8.[4] R. Aebersold and D.R. Goodlett, Mass spectrometry in proteomics,Chem. Rev. 101 (2001), 269–295.[5] J.B. Fenn, M. Mann, C.K. Meng, S.F. Wong and C.M. Whitehouse, Electrospray ionization for mass spectrometry of large
biomolecules,Science 246 (1989), 64–71.[6] M. Karas and F. Hillenkamp, Laser desorption ionization of proteins with molecular masses exceeding 10,000 Daltons,
Anal. Chem. 60 (1988), 2299–2301.[7] T. Voss and P. Haberl, Observations on the reproducibility and matching efficiency of two-dimensional electrophoresis
gels: consequences for comprehensive data analysis,Electrophoresis 21 (2000), 3345–3350.[8] S.D. Patterson and R. Aebersold, Mass spectrometric approaches for the identification of gel-separated proteins,Elec-
trophoresis 16 (1995), 1791–1814.[9] S.P. Gygi, G.L. Corthals, Y. Zhang, Y. Rochon and R. Aebersold, Evaluation of two-dimensional gel electrophoresis-based
proteome analysis technology,Proc. Natl. Acad. Sci. USA 97 (2000), 9390–9395.

A. Meyers et al. / Protein identification and profiling with mass spectrometry 15
[10] J. Peng and S.P. Gygi, Proteomics: the move to mixtures,J. Mass Spectrometry 36 (2001), 1083–1091.[11] G.L. Corthals, V.C. Wasinger, D.F. Hochstrasser and J.C. Sanchez, The dynamic range of protein expression: a challenge
for proteomic research,Electrophoresis 21 (2000), 1104–1115.[12] D.B. Wall et al., Isoelectric focusing nonporous RP HPLC: a two-dimensional liquid-phase separation method for mapping
of cellular proteins with identification using MALDI-TOF mass spectrometry,Anal. Chem. 72 (2000), 1099–1111.[13] S.E. Martin, J. Shabanowitz, D.F. Hunt and J.A. Marto, Subfemtomole MS and MS/MS peptide sequence analysis using
nano-HPLC micro-ESI fourier transform ion cyclotron resonance mass spectrometry,Anal. Chem. 72 (2000), 4266–4274.[14] M.P. Washburn, R. Ulaszek, C. Deciu, D.M. Schieltz and J.R. Yates 3rd, Analysis of quantitative proteomic data generated
via multidimensional protein identification technology,Anal. Chem. 74 (2002), 1650–1657.[15] D.A. Wolters, M.P. Washburn and J.R. Yates 3rd, An automated multidimensional protein identification technology for
shotgun proteomics,Anal. Chem. 73(23) (2001), 5683–5690.[16] S.P. Gygi et al., Quantitative analysis of complex protein mixtures using isotope-coded affinity tags,Nature Biotechnology
17 (1999), 994–999.[17] S. Wang and F.E. Regnier, Proteomics based on selecting and quantifying cysteine containing peptides by covalent chro-
matography,Journal of Chromatography A 924 (2001), 345–357.[18] E.C. Peters, D.M. Horn, D.C. Tully and A. Brock, A novel multifunctional labeling reagent for enhanced protein charac-
terization with mass spectrometry,Rapid. Commun. Mass Spectrom. 15 (2001), 2387–2392.[19] E.C. Peters, A. Brock, D.M. Horn, Q.T. Phung, C. Ericson, A.R. Salomon, S.B. Ficarro and L.M. Brill, An automated
LC-MALDI FT-ICR MS platform for high-throughput proteomics,LCGC Europe (July 2002), 2–7.[20] S.E. Martin, J. Shabanowitz, D.F. Hunt and J.A. Marto, Subfemtomole MS and MS/MS peptide sequence analysis using
nano-HPLC micro-ESI fourier transform ion cyclotron resonance mass spectrometry,Anal. Chem. 72 (2000), 4266–4274.

Submit your manuscripts athttp://www.hindawi.com
Hindawi Publishing Corporationhttp://www.hindawi.com Volume 2014
Inorganic ChemistryInternational Journal of
Hindawi Publishing Corporation http://www.hindawi.com Volume 2014
International Journal ofPhotoenergy
Hindawi Publishing Corporationhttp://www.hindawi.com Volume 2014
Carbohydrate Chemistry
International Journal of
Hindawi Publishing Corporationhttp://www.hindawi.com Volume 2014
Journal of
Chemistry
Hindawi Publishing Corporationhttp://www.hindawi.com Volume 2014
Advances in
Physical Chemistry
Hindawi Publishing Corporationhttp://www.hindawi.com
Analytical Methods in Chemistry
Journal of
Volume 2014
Bioinorganic Chemistry and ApplicationsHindawi Publishing Corporationhttp://www.hindawi.com Volume 2014
SpectroscopyInternational Journal of
Hindawi Publishing Corporationhttp://www.hindawi.com Volume 2014
The Scientific World JournalHindawi Publishing Corporation http://www.hindawi.com Volume 2014
Medicinal ChemistryInternational Journal of
Hindawi Publishing Corporationhttp://www.hindawi.com Volume 2014
Chromatography Research International
Hindawi Publishing Corporationhttp://www.hindawi.com Volume 2014
Applied ChemistryJournal of
Hindawi Publishing Corporationhttp://www.hindawi.com Volume 2014
Hindawi Publishing Corporationhttp://www.hindawi.com Volume 2014
Theoretical ChemistryJournal of
Hindawi Publishing Corporationhttp://www.hindawi.com Volume 2014
Journal of
Spectroscopy
Analytical ChemistryInternational Journal of
Hindawi Publishing Corporationhttp://www.hindawi.com Volume 2014
Journal of
Hindawi Publishing Corporationhttp://www.hindawi.com Volume 2014
Quantum Chemistry
Hindawi Publishing Corporationhttp://www.hindawi.com Volume 2014
Organic Chemistry International
ElectrochemistryInternational Journal of
Hindawi Publishing Corporation http://www.hindawi.com Volume 2014
Hindawi Publishing Corporationhttp://www.hindawi.com Volume 2014
CatalystsJournal of

![Identification and Characterization of Maize oury4 …Identification and Characterization of Maizefloury4 as a Novel Semidominant Opaque Mutant That Disrupts Protein Body Assembly1[W][OPEN]](https://img.pdfslide.us/doc/110x75/5e4a4e7897d31144b35737e6/identiication-and-characterization-of-maize-oury4-identiication-and-characterization.jpg)


![TRANSCRIPTOMIC ANALYSIS OF MALE INFERTILITY€¦ · transcriptomic profiling of male factor infertility and the identification of the potential diagnosis biomarkers [6]. Despite](https://img.pdfslide.us/doc/110x75/5ed7651988ad9966ea656ea3/transcriptomic-analysis-of-male-infertility-transcriptomic-proiling-of-male-factor.jpg)